Embed Size (px)
DESCRIPTION
Results of a 2013 collaboration with the North American Council for Freight Efficiency on a survey-based study aimed understanding how the market for efficiency technologies has evolved and identifying opportunities for capturing additional efficiencies.
Citation preview
www.theicct.org
FEBRUARY 2014WHITE PAPER
BEIJING | BERLIN | BRUSSELS | SAN FRANCISCO | WASHINGTON
Costs and Adoption Rates of Fuel-Saving Technologies for Trailers in the North American On-Road Freight SectorBen Sharpe (ICCT) and Mike Roeth (North American Council for Freight Efficiency)
ACKNOWLEDGEMENTSThis work is funded by the ClimateWorks Foundation and Energy Foundation. The authors are very grateful for all of the companies that were generous enough to take the time out to participate in the interviews for this project. In addition, we are very grate-ful for the excellent reviews of the California Air Resources Board, the Environmental Protection Agency, and Wabash National Corporation. Previous and ongoing collabora-tions with Nigel Clark and Tom Cackette are acknowledged as well. In addition, the contributions of Drew Kodjak, Fanta Kamakaté, Nic Lutsey, Rachel Muncrief, and Oscar Delgado of the ICCT were incredibly valuable.
© 2014 International Council on Clean Transportation
1225 I Street NW Suite 900 Washington DC 20005
+1 202 534 1600 • www.theicct.org • [email protected]
i
TABLE OF CONTENTS
Executive Summary ................................................................................................................... ii
1 Introduction .............................................................................................................................1
2 Methodology .......................................................................................................................... 3
3 Costs and Adoption Rates of Trailer Technologies ..........................................................5
3.1 Aerodynamic technologies ........................................................................................................... 5
3.1.1 Side skirts .................................................................................................................................. 5
3.1.2 Underbody devices .............................................................................................................. 8
3.1.3 Boat tails ................................................................................................................................... 9
3.1.4 Gap reducers ..........................................................................................................................11
3.2 Rolling resistance technologies .................................................................................................11
3.2.1 Low rolling resistance tires ...............................................................................................12
3.2.2 Tire pressure systems ........................................................................................................12
4 Conclusions and Future Work ........................................................................................... 14
References .................................................................................................................................17
ii
ICCT WHITE PAPER
EXECUTIVE SUMMARYFrom August through December 2013, the International Council on Clean Transportation (ICCT) and the North American Council for Freight Efficiency (NACFE) collaborated on a study to better understand the costs and current adoption rates of fuel-saving tech-nologies for trailers in the North American on-road freight sector. By capturing a diverse cross-section of expert opinions from the trucking industry, the project’s primary objec-tive is deepening the understanding of how the market for trailer efficiency technologies has evolved in recent years as well as challenges and opportunities going forward. These insights can have important implications as policymakers in North America consider policy options for increasing the efficiency of trailers.
Data for this project were collected using telephone interviews of a number of stake-holders throughout the on-road trucking industry. The specific interviewees that were chosen play important roles in their respective companies in the decisionmaking process about technologies for tractors and trailers. NACFE led the interviews and engaged not only end users (i.e., trucking fleets), but also stakeholders such as manufacturers of trailers, aerodynamic technologies, and tires. The end users included large and medium for-hire and private trucking fleets that operate roughly between 250 and 10,000 trac-tors and 500 and 30,000 trailers. In all, the study team conducted telephone interviews with 22 companies.
This study is narrowly focused on costs and adoption rates for aerodynamic and tire technologies for trailers. A more comprehensive investigation of trailer technologies, market conditions, and policy options can be found in a ICCT report from July 2013 (Sharpe, Clark, and Lowell 2013). In addition, a companion ICCT white paper that is scheduled for publication in early 2014 further investigates testing and certification options for trailers in the context of ways for best integrating trailers into the second phase of greenhouse gas (GHG) regulations for heavy-duty vehicles in the U.S. and Canada (Sharpe 2014).
Over the course of the interviews, some common themes emerged across all of the stakeholder groups. The following are the primary findings from the study:
1. Costs of trailer side skirts have decreased substantially over the past 3 to 5 years. Current costs for trailer aerodynamic technologies—particularly side skirts—have decreased significantly in recent years, due to far more market entrants driving cost competition and much higher deployment volumes reducing cost per unit. From the interview responses, we estimate that prices for side skirts have dropped roughly 70% compared to estimates that were compiled as part of the 2010 National Academy of Sciences study that investigated fuel efficiency technologies for com-mercial vehicles. A consensus position from the interviewees was that California’s tractor-trailer GHG regulation has been the primary driver for the rapid uptake and cost reductions of technologies but that an increasing number of fleets are adopting these aerodynamic devices because of attractive economics as well as improve-ments in the reliability and durability of products.
2. Among aerodynamic technologies, side skirts have had the largest rate of adop-tion, while the uptake of underbody, rear-end, and gap reduction devices has been more limited. Interview responses and sales data show that side skirts are the dominant trailer aerodynamic technology, with boat tails and underbody devices
iii
COSTS AND ADOPTION RATES OF FUEL-SAVING TECHNOLOGIES
making up a much smaller percentage of the market. Our study team estimates that approximately 40% of new box trailers are sold with side skirts. Uptake of both underbody and rear-end devices is estimated to be roughly 3% of new box trailer sales, while sales of gap reducers have been fairly negligible and primarily limited to fleets that pair their trailers with day cabs.
3. There is widespread utilization of conventional-size low rolling resistance tires, but adoption of wide base tires has been slower. Data gathered for this study suggest that approximately half of all tractor and trailer tires sold are low rolling resistance (i.e., SmartWay-verified) tires. These low rolling resistance duals have seen much larger adoption that wide base single tires. Responses from tire manufacturers and trucking fleets put the current uptake of wide base single tires at around 10% of new trailer sales. Though the interviewees contended that wide base single tires have improved significantly since earlier generations, maintenance issues—and perceptions of maintenance issues—for these tires and wheels continue as one of the primary barriers to adoption.
4. Roughly one-quarter of all trailers on the road in the U.S. have at least one aero-dynamic technology (e.g., side skirts, underbody device, or boat tail). Feedback from trailer and component manufacturers gives evidence of a robust market for aerodynamic technologies for both new and used trailers. The responses from these industry experts suggest that about one-quarter of all trailers operating in the U.S. have at least one aerodynamic enhancement.
5. There are further improvements and efficiency gains that stand to be achieved in trailer aerodynamics and tire technologies. In the interviews, all of the component suppliers of aerodynamic and tire technologies spoke of their technology develop-ment activities and next generation products that will offer enhanced quality and fuel savings. One of the aerodynamic device manufacturers asserted that its third generation product, which will be released commercially in the next year, would offer roughly an additional 40% reduction in aerodynamic drag over the second generation product and nearly a 100% improvement over the first generation product. This and other anecdotes provide evidence that important innovations
continue to materialize in trailer efficiency technology.
These findings provide evidence that the market for trailer fuel-saving technologies has matured considerably in recent years. We have seen the success of the early voluntary efforts from the U.S. Environmental Protection Agency’s SmartWay program and the California tractor-trailer GHG regulation drive trailer technology development, technol-ogy cost reductions, and increasing adoption of trailer technology. As the quality and economics of trailer technologies continue to steadily improve, we expect market forces to drive steady increases in adoption across trucking fleets and owner-operators. In ad-dition, a regulation for trailers at the federal level will certainly complement California’s regulatory efforts and help to accelerate the uptake of these known cost-effective tech-nologies and also promote additional investment in the development and deployment of new generations of technologies for increasing the fuel efficiency of tractor-trailers.
1
ICCT WHITE PAPER
1 INTRODUCTIONUntil recently, worldwide efforts to reduce energy consumption through improved vehicle efficiency have been focused primarily on light-duty vehicles, but as pas-senger vehicles become significantly more fuel efficient in the coming years, the relative importance of the heavy-duty sector will continue to grow. In North America and many places around the world, tractor-trailers are responsible for the majority of fuel consumption and greenhouse gas (GHG) emissions from the commercial vehicle sector (Façanha, Blumberg, and Miller 2012). The potential impact of widespread adoption of efficiency technologies in tractor-trailers is significant. Many efficiency technologies are commercially available to reduce the aerodynamic and rolling resis-tance drag of trailers, and the market for many of these technologies has changed dramatically since their introduction in the mid-to-late 2000s.
The rapidly changing landscape of trailer fuel-saving technologies can be attributed to a number of factors, but, arguably, the most profound impact has come from the Environmental Protection Agency’s (EPA) voluntary SmartWay program as well as the California Air Resources Board’s (CARB) tractor-trailer GHG regulation, which is based heavily on the SmartWay technology verification program.
Since its inception in February 2004, the SmartWay Transport Partnership has aimed to create market-based incentives that challenge freight shipping and logistics companies to improve the environmental performance of their operations. One of the earliest and most influential elements of the SmartWay program has been its focus on technologies for reducing fuel use and emissions from tractor-trailers. Through the program, equipment and vehicle configurations that are tested and verified to have fuel consumption profiles at or below a given value are granted SmartWay designation.
As part of its efforts to reduce GHG emissions from heavy-duty vehicles, CARB lever-aged the SmartWay program to create a regulation that aims to increase the efficien-cy of long-haul tractor-trailers operating in California. This regulation, which was first adopted in late 2008 and formally finalized in 2009, is the first in-use GHG regulation for tractor-trailers in the world. There are mandatory tractor and trailer equipment specification provisions for any trucking fleet that operates tractor-trailers in Califor-nia. The regulation requires the use of aerodynamic tractors and trailers that are also equipped with low rolling resistance (LRR) tires. The tractors and trailers subject to this regulation must either use U.S. EPA SmartWay-verified tractors and trailers or be retrofitted with SmartWay-verified technologies. The regulation is phasing in over this decade and will be fully implemented by 2020. Together, the SmartWay program and California’s tractor-trailer GHG regulation have promoted the sale of thousands of fuel-saving products, which has driven down the unit costs for these technologies.
The scope of this paper is intentionally limited to the costs and level of adoption of aerodynamic and tire technologies for trailers. For a broader analysis of trailer technologies, market conditions, and policy considerations, interested readers can reference this paper’s companion ICCT report (Sharpe, Clark, and Lowell 2013).
The paper begins by describing the methodology that was used to gather and analyze data for this project. The subsequent section first summarizes the findings with regard to costs and adoption rates of aerodynamic devices and then turns to technologies that reduce the rolling resistance drag in tires. Following the sum-

2
COSTS AND ADOPTION RATES OF FUEL-SAVING TECHNOLOGIES
mary of the results from the responses to interviews of trucking fleets and trailer technology suppliers conducted by the study’s authors, the final conclusion section synthesizes the key findings from the project and also presents some opportunities for future work to further investigate the market for trailer efficiency technologies.
3
ICCT WHITE PAPER
2 METHODOLOGYTelephone interviews were used to collect data on purchase prices, maintenance impacts, adoption rates, as well as any other information about experiences with trailer technologies. The interviews were typically between 30 and 60 minutes and were com-pleted between August 28 and December 16. Generally, one or two company representa-tives were present for the call, and Mike Roeth of the North American Council for Freight Efficiency (NACFE) asked the questions and documented answers. The interviewees for this study were either high-level managers or executives and were chosen based on their comprehensive knowledge of their company’s business as well as the trucking industry as a whole.
The breakdown of the various stakeholder groups that were included in this study is shown in Table 1. Of the 22 companies interviewed, half were trucking fleets. These 11 trucking fleets include both for-hire and private fleets and are fairly diverse in terms of equipment ownership, geographic domain, and operating characteristics. The three trailer original equipment manufacturers (OEMs) that participated are in the top five of trailer sales, collectively representing over 40% of the market (R. L. Polk & Co. 2012). Six total aerodynamic component companies were interviewed: four side skirt manu-facturers, an underbody (or “undertray”) device supplier, and a trailer rear-end device (i.e., “boat tail”) manufacturer. Finally, two industry-leading tire manufacturers were interviewed as well.
Table 1: Description of the stakeholder groups for the project interviews
Stakeholder GroupNumber of Interviews Description
Trucking fleets 11Medium and large for-hire and private fleets that operate between roughly 250 and 10,000 tractors and 500 and 30,000 trailers
Trailer manufacturers 3 Market leaders for many trailer types: dry, refrigerated, tanker, flatbed
Side skirt manufacturers 4Three independent side skirt manufacturers as well as one trailer original equipment manufacturer that also makes side skirts
Underbody device manufacturers 1 Industry-leading supplier of underbody devices
Boat tail manufacturers 1 Industry-leading supplier of boat tails
Tire and wheel manufacturers 2
Major tire manufacturers that supply both dual-size and wide base single tires and wheels for tractors and trailers
TOTAL 22
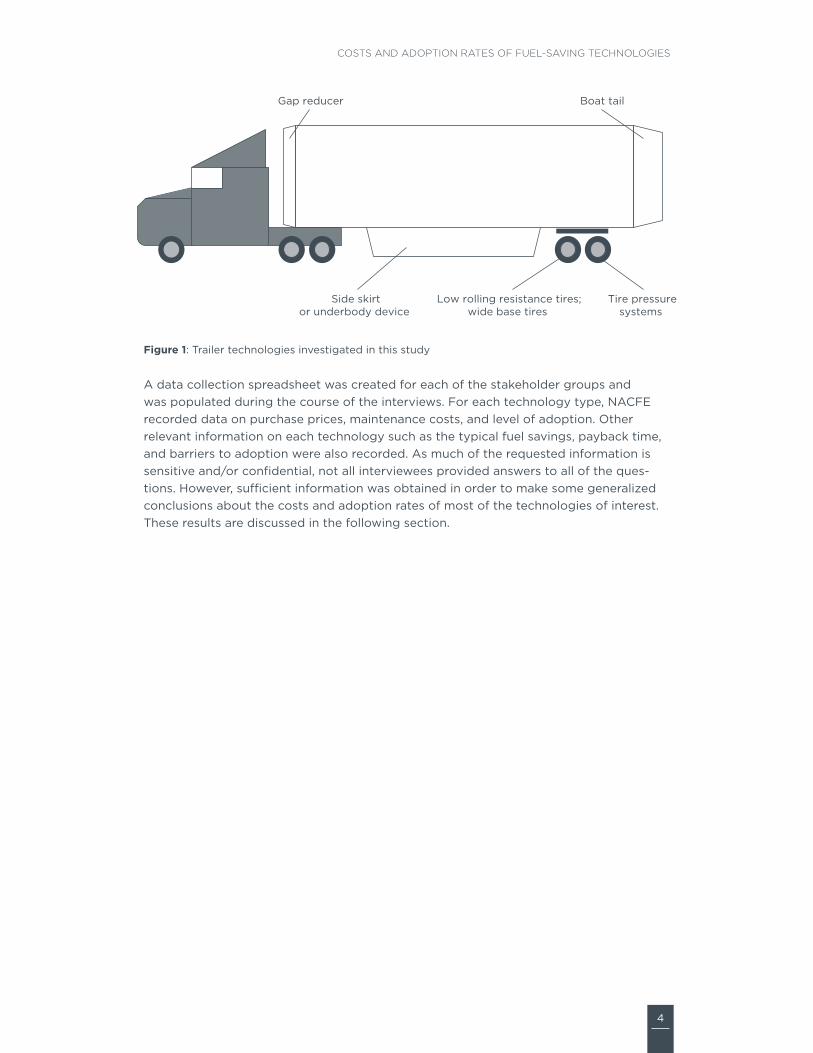
The types of trailer technologies investigated in this study are shown in Figure 1. This includes four aerodynamic technologies: gap reducers, side skirts, underbody devices, and boat tails. Technologies for improving tire performance include low rolling resistance duals, wide base single (WBS) tires, and tire pressure management systems. Though the focus of this study was on aerodynamic and tire technologies, lightweighting is an important technology for increasing the efficiency of trailers, and exploring the costs and current adoption of lightweight features is an area for future research.
4
COSTS AND ADOPTION RATES OF FUEL-SAVING TECHNOLOGIES
Gap reducer
Side skirtor underbody device
Boat tail
Low rolling resistance tires;wide base tires
Tire pressuresystems
Figure 1: Trailer technologies investigated in this study
A data collection spreadsheet was created for each of the stakeholder groups and was populated during the course of the interviews. For each technology type, NACFE recorded data on purchase prices, maintenance costs, and level of adoption. Other relevant information on each technology such as the typical fuel savings, payback time, and barriers to adoption were also recorded. As much of the requested information is sensitive and/or confidential, not all interviewees provided answers to all of the ques-tions. However, sufficient information was obtained in order to make some generalized conclusions about the costs and adoption rates of most of the technologies of interest. These results are discussed in the following section.
5
ICCT WHITE PAPER
3 COSTS AND ADOPTION RATES OF TRAILER TECHNOLOGIES
3.1 AERODYNAMIC TECHNOLOGIESFor tractor-trailers traveling at highway speeds, aerodynamic drag is generally respon-sible for the largest portion of energy losses, after accounting for losses in the engine. According to estimates in the 21st Century Truck Partnership Roadmap, the energy con-sumption breakdown for the engine, aerodynamics, tires, and drivetrain and auxiliaries are 60%, 21%, 13%, and 6% respectively (U.S. Department of Energy [21st Century Truck Partnership] 2006). As a general rule of thumb, at constant highway speeds (roughly 65 mph) and zero grade, a percentage point reduction in aerodynamic drag and rolling resistance yields roughly a half-percent and a third of a percent reduction, respectively, in overall fuel consumption.
Looking at the tractor-trailer, there are four primary areas where aerodynamic drag occurs: 1) the front of the tractor, 2) the gap between the tractor and the trailer, 3) the side and underbody of the trailer, and 4) the rear end of the trailer. Figure 1 illustrates that trailer technologies can be applied to the tractor-trailer gap, the side/underbody, and the rear end of the trailer. The following four sections summarize the interviewees’ responses regarding side skirts, underbody devices, boat tails, and gap reducers.
3.1.1 Side skirtsFrom the interview responses, there was overall consensus that side skirts are the most widely used aerodynamic enhancement for trailers. Another key point from the conver-sations with fleets was that the reliability and durability of side skirts has much improved since their introduction in the mid-2000s. Compared to boat tails and underbody devices, side skirts have the longest commercial history and continue as the preferred trailer aerodynamic technology for the majority of trucking fleets.
One of the messages that was echoed the most across the stakeholder groups was that California’s mandatory in-use technology adoption regulation and the U.S. EPA’s Smart-Way program have been the biggest catalysts for accelerated uptake of trailer fuel-saving technologies. Of the two of these programs, interviewees stated that California’s tractor-trailer GHG regulation has had the most critical influence on fleets’ decisions to adopt trailer technologies.
California’s regulation affects owners of 53-foot or longer box-type trailers, including both dry van and refrigerated van trailers (also known as “reefers”) as well as the owners of the heavy-duty tractors that pull these trailers within California. The owners of these types of equipment are responsible for replacing or retrofitting their affected vehicles and trailers with compliant aerodynamic technologies and LRR tires. All tractor and trailer owners, regardless of where the equipment is registered, must comply with the regulation when operating in California.
The requirements of the trailer program are based on the model year and the type of equipment. There are unique provisions and compliance deadlines based on whether the trailer is a refrigerated or a dry van as well as the trailer’s model year. The aerodynamic requirements for trailers are given in terms of a percentage fuel consumption reduction: 4% or 5%. The percentage refers to the SmartWay designation for the verified fuel-savings level of a given piece of equipment. For dry van trailers requiring 5% fuel savings, users
6
COSTS AND ADOPTION RATES OF FUEL-SAVING TECHNOLOGIES
can combine a 1% verified device with a 4% verified device or opt for a 5% verified device. Operators of refrigerated trailers are only required to install an aerodynamic device that is verified to the 4% level. There are phasing options based on model year, equipment type (i.e., dry or refrigerated trailer), and fleet size.1 Overall, by 2020, all of the affected trailers that operate in California must be outfitted with LRR tires and aerodynamic technologies verified at the 4% fuel savings level for reefers and 5% for dry vans.
The SmartWay program—which is the technical backbone of the CARB regulation—has also provided market pull for trailer efficiency technologies. Some shippers are requiring that trucking fleets under contract to them must meet certain requirements that are linked to aspects of the SmartWay program. For example, a shipper might specify that all fleets operate SmartWay-verified tractors and trailers or be in the top quintile in terms of grams CO2 per ton-mile. Increasingly, these types of equipment and/or perfor-mance requirements are being written into contracts between shippers and carriers and have provided additional impetus for fleets to adopt improved aerodynamic and tire technologies for their tractors and trailers.
As a result of the SmartWay program, California’s regulation, and the improved quality and economics of the technologies, aerodynamic devices have seen rapid uptake over the past 5 years, and side skirts represent the large majority of trailer aerodynamic technologies in use. One trailer OEM that makes side skirts said that nearly three-quarters of its box trailers sold in one quarter in the last year had skirts. For this same trailer OEM, on average, roughly half of all trailers sold are equipped with skirts. After asking all of the trailer OEMs and side skirt manufacturers what percentage of new box trailers are sold with skirts, the study team estimates that approximately 40% of box trailers are. Moreover, all of the interviewees said that the retrofit market makes up a significant portion of total market for side skirts, and one of the respondents noted that roughly half of skirts sales are to the in-use market. Altogether, responses from the trailer OEMs and skirt manufacturers suggest that between 20% and 25% of the entire U.S. box trailer in-use fleet have side skirts, an underbody device, or a boat tail, and when CARB’s tractor-trailer GHG regulation is fully phased in by 2020, this percentage will rise to roughly 33%.
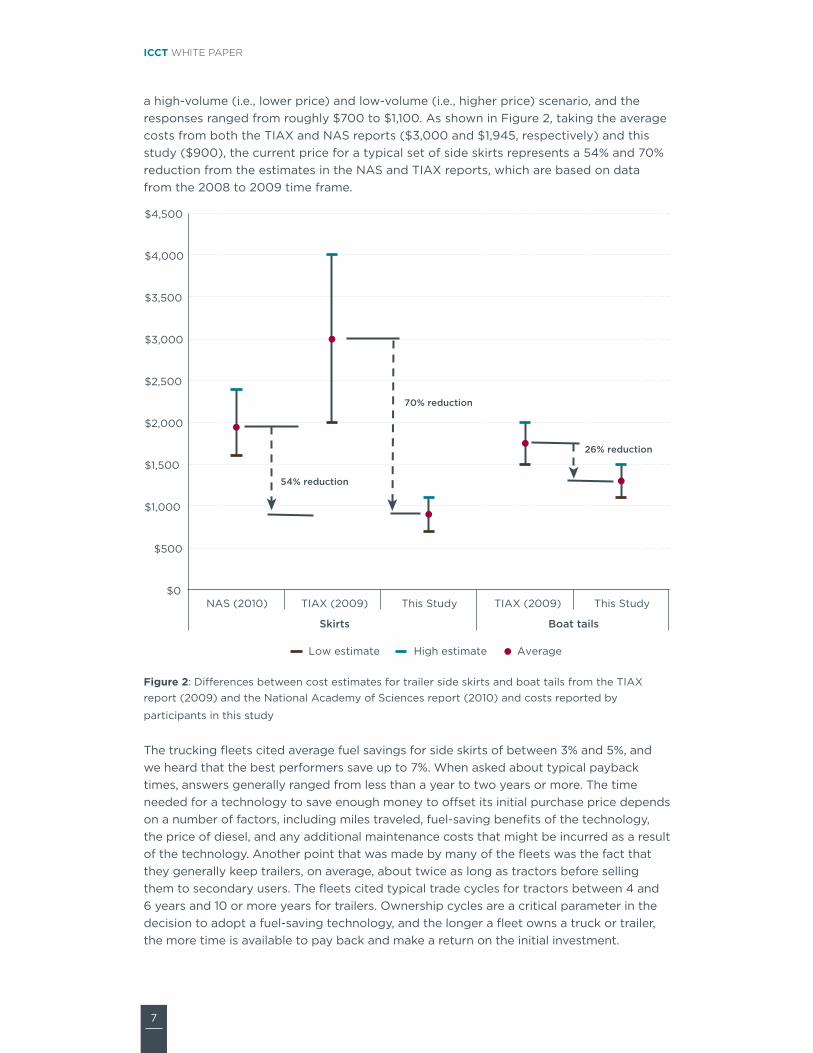
As a result of the large-scale adoption of side skirts, capital costs for this technology have dropped fairly substantially in recent years. Looking at estimates from the 2008 to 2010 time frame compared to the ranges of purchase prices provided in the interview responses for this study, it seems clear that prices of trailer aerodynamic technologies have decreased significantly—especially for side skirts. A TIAX report (November 2009) and a National Academy of Sciences (NAS) report (March 2010) both thoroughly explored technologies for increasing the efficiency of medium- and heavy-duty vehicles in the U.S. (Kromer, Bockholt, and Jackson 2009; Committee to Assess Fuel Economy Technologies for Medium- and Heavy-Duty Vehicles 2010). Much of the analysis from the TIAX study was used by the NAS committee to develop estimates for cost and technol-ogy efficacy. In their assessment of trailer technologies, TIAX and the NAS committee estimated a cost range for full-length (i.e., 7 to 9 m) side skirts at $2,000 to $4,000 and $1,600 to $2,400, respectively. During the interviews, all of the stakeholder groups were asked to give their best estimate of the price of skirts, including installation, in both
1 Fleets that operate 20 or fewer trailers can opt for the “small fleet” provisions that give them a later starting year for the phase-in period, with 100% compliance required by 2017. Large fleets are required to be 100% compliant by 2016.
7
ICCT WHITE PAPER
a high-volume (i.e., lower price) and low-volume (i.e., higher price) scenario, and the responses ranged from roughly $700 to $1,100. As shown in Figure 2, taking the average costs from both the TIAX and NAS reports ($3,000 and $1,945, respectively) and this study ($900), the current price for a typical set of side skirts represents a 54% and 70% reduction from the estimates in the NAS and TIAX reports, which are based on data from the 2008 to 2009 time frame.
$0
$500
$1,000
$1,500
$2,000
$2,500
$3,000
$3,500
$4,000
$4,500
NAS (2010) TIAX (2009) This Study TIAX (2009) This Study
Skirts Boat tails
26% reduction
70% reduction
54% reduction
AverageHigh estimateLow estimate
Figure 2: Differences between cost estimates for trailer side skirts and boat tails from the TIAX report (2009) and the National Academy of Sciences report (2010) and costs reported by
participants in this study
The trucking fleets cited average fuel savings for side skirts of between 3% and 5%, and we heard that the best performers save up to 7%. When asked about typical payback times, answers generally ranged from less than a year to two years or more. The time needed for a technology to save enough money to offset its initial purchase price depends on a number of factors, including miles traveled, fuel-saving benefits of the technology, the price of diesel, and any additional maintenance costs that might be incurred as a result of the technology. Another point that was made by many of the fleets was the fact that they generally keep trailers, on average, about twice as long as tractors before selling them to secondary users. The fleets cited typical trade cycles for tractors between 4 and 6 years and 10 or more years for trailers. Ownership cycles are a critical parameter in the decision to adopt a fuel-saving technology, and the longer a fleet owns a truck or trailer, the more time is available to pay back and make a return on the initial investment.
8
COSTS AND ADOPTION RATES OF FUEL-SAVING TECHNOLOGIES
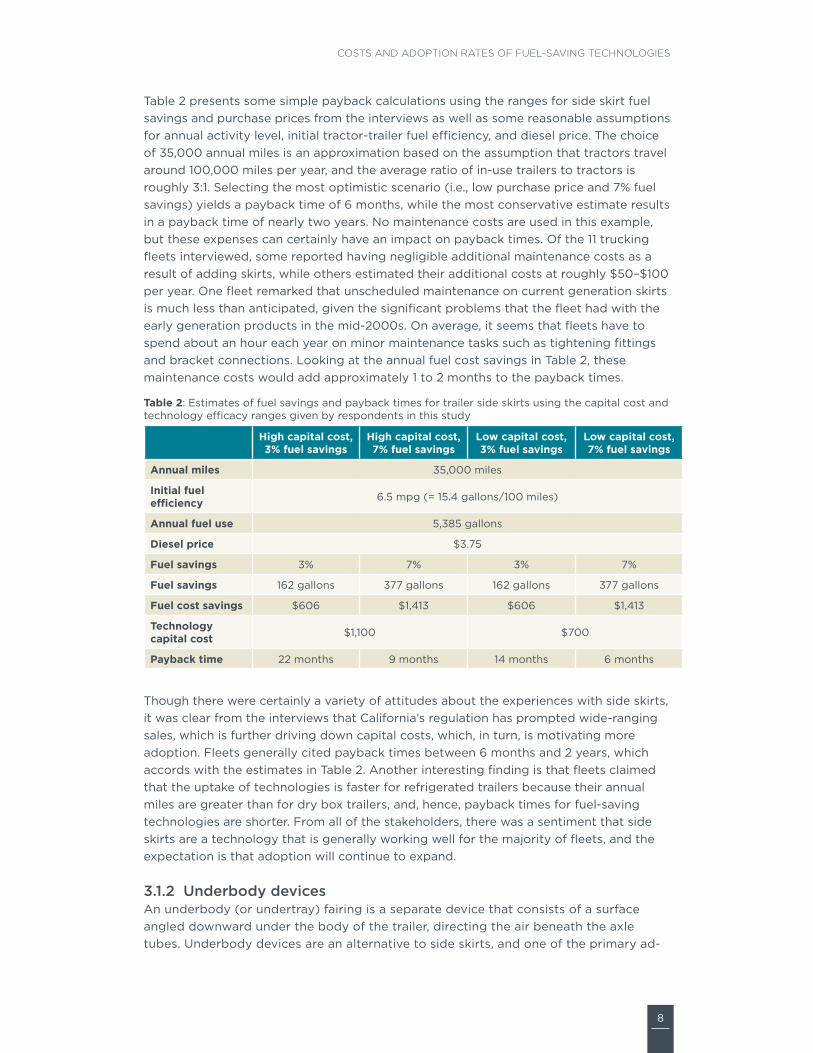
Table 2 presents some simple payback calculations using the ranges for side skirt fuel savings and purchase prices from the interviews as well as some reasonable assumptions for annual activity level, initial tractor-trailer fuel efficiency, and diesel price. The choice of 35,000 annual miles is an approximation based on the assumption that tractors travel around 100,000 miles per year, and the average ratio of in-use trailers to tractors is roughly 3:1. Selecting the most optimistic scenario (i.e., low purchase price and 7% fuel savings) yields a payback time of 6 months, while the most conservative estimate results in a payback time of nearly two years. No maintenance costs are used in this example, but these expenses can certainly have an impact on payback times. Of the 11 trucking fleets interviewed, some reported having negligible additional maintenance costs as a result of adding skirts, while others estimated their additional costs at roughly $50–$100 per year. One fleet remarked that unscheduled maintenance on current generation skirts is much less than anticipated, given the significant problems that the fleet had with the early generation products in the mid-2000s. On average, it seems that fleets have to spend about an hour each year on minor maintenance tasks such as tightening fittings and bracket connections. Looking at the annual fuel cost savings in Table 2, these maintenance costs would add approximately 1 to 2 months to the payback times.
Table 2: Estimates of fuel savings and payback times for trailer side skirts using the capital cost and technology efficacy ranges given by respondents in this study
High capital cost, 3% fuel savings
High capital cost, 7% fuel savings
Low capital cost, 3% fuel savings
Low capital cost, 7% fuel savings
Annual miles 35,000 miles
Initial fuel efficiency 6.5 mpg (= 15.4 gallons/100 miles)
Annual fuel use 5,385 gallons
Diesel price $3.75
Fuel savings 3% 7% 3% 7%
Fuel savings 162 gallons 377 gallons 162 gallons 377 gallons
Fuel cost savings $606 $1,413 $606 $1,413
Technology capital cost $1,100 $700
Payback time 22 months 9 months 14 months 6 months
Though there were certainly a variety of attitudes about the experiences with side skirts, it was clear from the interviews that California’s regulation has prompted wide-ranging sales, which is further driving down capital costs, which, in turn, is motivating more adoption. Fleets generally cited payback times between 6 months and 2 years, which accords with the estimates in Table 2. Another interesting finding is that fleets claimed that the uptake of technologies is faster for refrigerated trailers because their annual miles are greater than for dry box trailers, and, hence, payback times for fuel-saving technologies are shorter. From all of the stakeholders, there was a sentiment that side skirts are a technology that is generally working well for the majority of fleets, and the expectation is that adoption will continue to expand.
3.1.2 Underbody devicesAn underbody (or undertray) fairing is a separate device that consists of a surface angled downward under the body of the trailer, directing the air beneath the axle tubes. Underbody devices are an alternative to side skirts, and one of the primary ad-
9
ICCT WHITE PAPER
vantages is that this technology does not impede a driver or technician’s access to the side and underbody of the trailer for inspection and maintenance. Moreover, fleets also mentioned that while side skirts can limit the breakover angle and can be damaged on humps or railroad tracks, underbody devices are generally more durable, and none of the fleets that use these systems reported any additional maintenance expenses.
This technology has had much less time in the market than side skirts; as a result, uptake is more limited, and there are far fewer companies in the space. However, according to the interview with the manufacturer that represents the vast majority of sales of underbody devices, there have been over 30,000 units sold to date, and roughly 3% of new trailers sold are equipped with this technology.
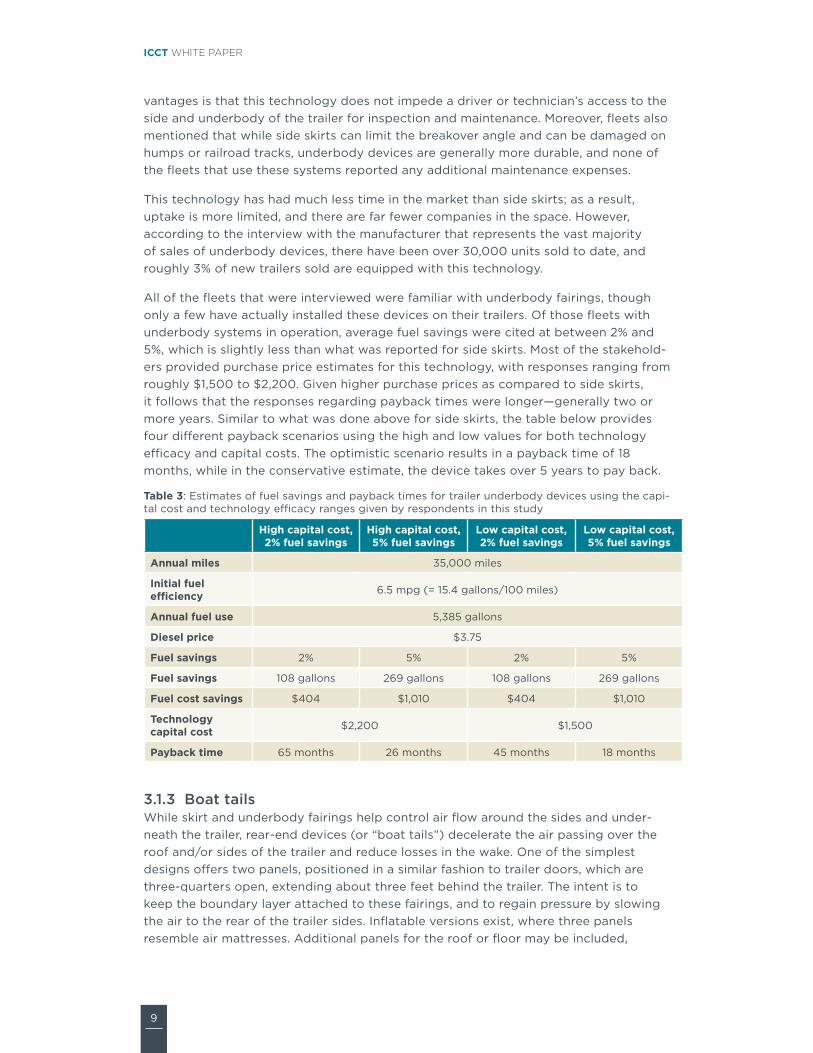
All of the fleets that were interviewed were familiar with underbody fairings, though only a few have actually installed these devices on their trailers. Of those fleets with underbody systems in operation, average fuel savings were cited at between 2% and 5%, which is slightly less than what was reported for side skirts. Most of the stakehold-ers provided purchase price estimates for this technology, with responses ranging from roughly $1,500 to $2,200. Given higher purchase prices as compared to side skirts, it follows that the responses regarding payback times were longer—generally two or more years. Similar to what was done above for side skirts, the table below provides four different payback scenarios using the high and low values for both technology efficacy and capital costs. The optimistic scenario results in a payback time of 18 months, while in the conservative estimate, the device takes over 5 years to pay back.
Table 3: Estimates of fuel savings and payback times for trailer underbody devices using the capi-tal cost and technology efficacy ranges given by respondents in this study
High capital cost, 2% fuel savings
High capital cost, 5% fuel savings
Low capital cost, 2% fuel savings
Low capital cost, 5% fuel savings
Annual miles 35,000 miles
Initial fuel efficiency 6.5 mpg (= 15.4 gallons/100 miles)
Annual fuel use 5,385 gallons
Diesel price $3.75
Fuel savings 2% 5% 2% 5%
Fuel savings 108 gallons 269 gallons 108 gallons 269 gallons
Fuel cost savings $404 $1,010 $404 $1,010
Technology capital cost $2,200 $1,500
Payback time 65 months 26 months 45 months 18 months
3.1.3 Boat tailsWhile skirt and underbody fairings help control air flow around the sides and under-neath the trailer, rear-end devices (or “boat tails”) decelerate the air passing over the roof and/or sides of the trailer and reduce losses in the wake. One of the simplest designs offers two panels, positioned in a similar fashion to trailer doors, which are three-quarters open, extending about three feet behind the trailer. The intent is to keep the boundary layer attached to these fairings, and to regain pressure by slowing the air to the rear of the trailer sides. Inflatable versions exist, where three panels resemble air mattresses. Additional panels for the roof or floor may be included,
10
COSTS AND ADOPTION RATES OF FUEL-SAVING TECHNOLOGIES
leading to a rectangular funnel shape when all four panels are deployed. Several total rear enclosure designs exist, all being “bubbles” or distorted hemispheres. All seek to reduce the trailer tail diameter over three or four feet to the aft of the trailer doors. Trailer tail devices, depending on their design, may limit the ability of a truck to back into a narrow space up to a dock, or may cause additional effort or time to be spent in opening the trailer rear for the dock. Another drawback is that typically these devices must be deployed manually by the drivers, which many of the fleets reported as being a barrier to increased adoption since it seems that the majority of fleets prefer passive technologies such as skirts, underbody devices, or gap reducers that generally do not require driver intervention.
As with underbody devices, sales of rear-end fairings have been much less than those of side skirts. The study team interviewed the market-leading boat tail supplier and learned that roughly 20,000 units have been sold to date. This interviewee did not have data available to estimate the number of new trailers sold with his company’s products (or rear-end devices from other companies) but did provide annual sales figures for 2010–2013. The manufacturer of underbody devices also provided annual sales figures, and since total sales of boat tails and underbody devices were similar in 2012 and 2013 (roughly 10,000–15,000 units per year), we estimate that the proportion of new box trailers sold with rear-end devices is also around 3%.
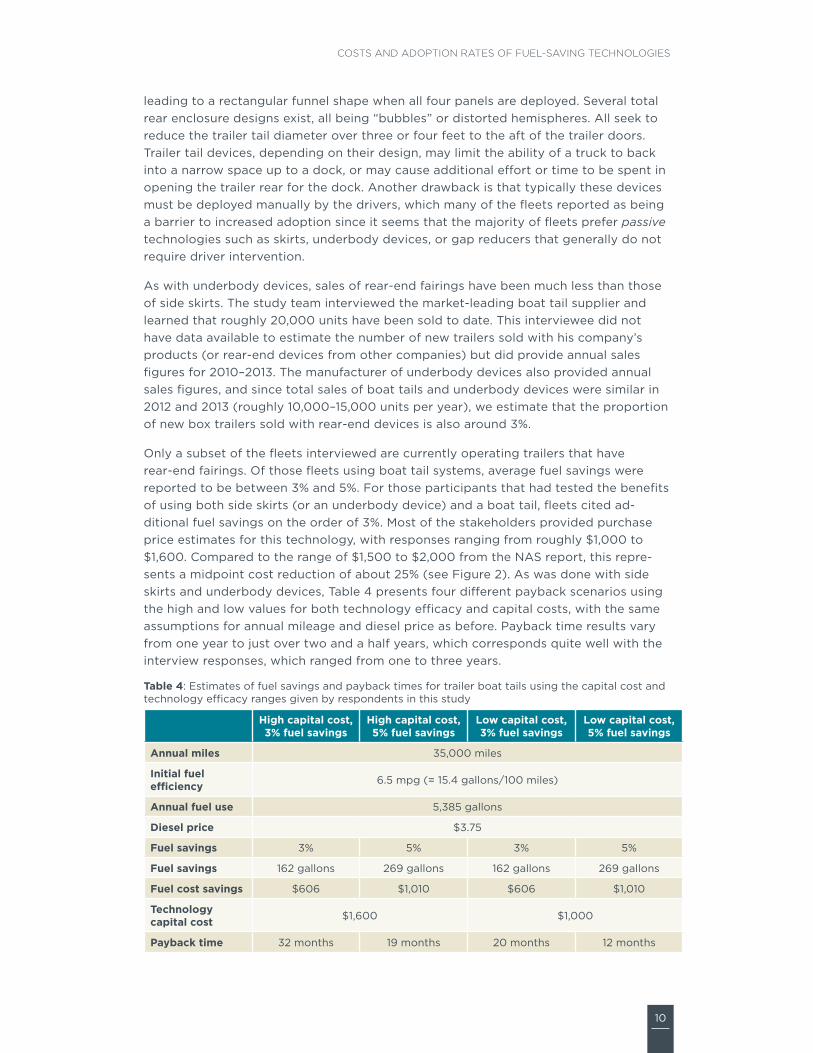
Only a subset of the fleets interviewed are currently operating trailers that have rear-end fairings. Of those fleets using boat tail systems, average fuel savings were reported to be between 3% and 5%. For those participants that had tested the benefits of using both side skirts (or an underbody device) and a boat tail, fleets cited ad-ditional fuel savings on the order of 3%. Most of the stakeholders provided purchase price estimates for this technology, with responses ranging from roughly $1,000 to $1,600. Compared to the range of $1,500 to $2,000 from the NAS report, this repre-sents a midpoint cost reduction of about 25% (see Figure 2). As was done with side skirts and underbody devices, Table 4 presents four different payback scenarios using the high and low values for both technology efficacy and capital costs, with the same assumptions for annual mileage and diesel price as before. Payback time results vary from one year to just over two and a half years, which corresponds quite well with the interview responses, which ranged from one to three years.
Table 4: Estimates of fuel savings and payback times for trailer boat tails using the capital cost and technology efficacy ranges given by respondents in this study
High capital cost, 3% fuel savings
High capital cost, 5% fuel savings
Low capital cost, 3% fuel savings
Low capital cost, 5% fuel savings
Annual miles 35,000 miles
Initial fuel efficiency 6.5 mpg (= 15.4 gallons/100 miles)
Annual fuel use 5,385 gallons
Diesel price $3.75
Fuel savings 3% 5% 3% 5%
Fuel savings 162 gallons 269 gallons 162 gallons 269 gallons
Fuel cost savings $606 $1,010 $606 $1,010
Technology capital cost $1,600 $1,000
Payback time 32 months 19 months 20 months 12 months
11
ICCT WHITE PAPER
3.1.4 Gap reducersA trailer gap fairing is a rounded protrusion at the leading edge of the trailer, which may serve to offset losses associated with flow disruptions and pressure differentials in the gap between the tractor and the trailer. Of the trailer aerodynamic technologies currently available, it was clear from the interviews that gap reducers have had the least frequent adoption. Two key themes emerged in the conversations about this technology: 1) the elongation of tractor roof and side extenders has limited the effectiveness of gap reducers mounted to trailers and 2) most of the fleets installing gap reducers are using them in combination with tractors that have day cabs, which often have larger tractor-trailer gaps and thus increased opportunity to reap the benefits. An additional deterrent to adoption is the fact that fleets cannot comply with the California tractor-trailer regulation by using gap reducers alone since none of these devices have been verified by the SmartWay program to provide 4% or more in fuel savings. Also, for fleets that operate reefer trailers, the transport refrigeration units are situated in an identical location and serve as de facto gap reducers.
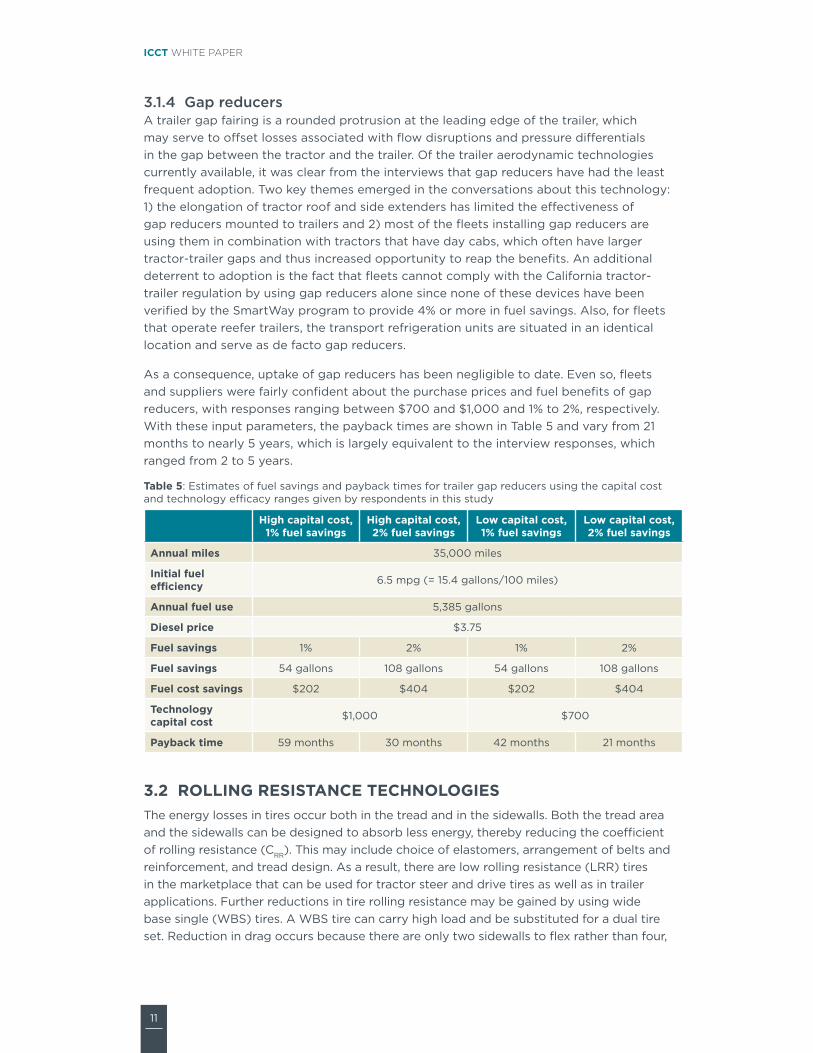
As a consequence, uptake of gap reducers has been negligible to date. Even so, fleets and suppliers were fairly confident about the purchase prices and fuel benefits of gap reducers, with responses ranging between $700 and $1,000 and 1% to 2%, respectively. With these input parameters, the payback times are shown in Table 5 and vary from 21 months to nearly 5 years, which is largely equivalent to the interview responses, which ranged from 2 to 5 years.
Table 5: Estimates of fuel savings and payback times for trailer gap reducers using the capital cost and technology efficacy ranges given by respondents in this study
High capital cost, 1% fuel savings
High capital cost, 2% fuel savings
Low capital cost, 1% fuel savings
Low capital cost, 2% fuel savings
Annual miles 35,000 miles
Initial fuel efficiency 6.5 mpg (= 15.4 gallons/100 miles)
Annual fuel use 5,385 gallons
Diesel price $3.75
Fuel savings 1% 2% 1% 2%
Fuel savings 54 gallons 108 gallons 54 gallons 108 gallons
Fuel cost savings $202 $404 $202 $404
Technology capital cost $1,000 $700
Payback time 59 months 30 months 42 months 21 months
3.2 ROLLING RESISTANCE TECHNOLOGIESThe energy losses in tires occur both in the tread and in the sidewalls. Both the tread area and the sidewalls can be designed to absorb less energy, thereby reducing the coefficient of rolling resistance (CRR). This may include choice of elastomers, arrangement of belts and reinforcement, and tread design. As a result, there are low rolling resistance (LRR) tires in the marketplace that can be used for tractor steer and drive tires as well as in trailer applications. Further reductions in tire rolling resistance may be gained by using wide base single (WBS) tires. A WBS tire can carry high load and be substituted for a dual tire set. Reduction in drag occurs because there are only two sidewalls to flex rather than four,
12
COSTS AND ADOPTION RATES OF FUEL-SAVING TECHNOLOGIES
and the energy associated with deformation is reduced. In addition, the rotational inertia is reduced by use of a WBS tire and wheel, leading to reduced energy loss to friction braking in highly transient operations.
In addition to improved tire designs, automatic tire inflation and air pressure monitoring systems can also lower the rolling resistance by helping drivers operate their tires at optimum pressure. Rolling resistance is strongly related to the air pressure in the tire, increasing steadily as tire pressure decreases beyond the manufacturer’s recommended inflation pressure. According to Goodyear, the approximate relationship is that every 10 psi underinflation results in 1% poorer fuel economy (Goodyear Tire & Rubber Company 2013).
The following two sections summarize the interviewees’ responses regarding LRR tires and tire pressure systems.
3.2.1 Low rolling resistance tiresFrom all of the stakeholder interviews—and particularly those with the trucking fleets—it was evident that LRR tires and retreads are widely accepted for a number of trailer types and hauling applications. Data provided by the two tire manufactur-ers demonstrate that roughly half of all tires sold to the tractor-trailer industry are SmartWay-verified LRR tires. The interviewees from the tire companies were unsure as to the exact percentage of SmartWay-verified tires sold for trailers, so this is an area for additional research.
Compared to aerodynamic technologies, interviewees seemed less confident in their claims about the fuel savings and payback times of LRR tires. Fleets asserted that one of the problems with tire comparisons is there are many variables that must be isolated or eliminated so that they do not taint the results. For example, factors like inflation levels and tire alignment need to be comparable between the sets of tests with and without the LRR tires in order to minimize the skewing of the results. Another complication with evaluating tires is that many of the fleets claimed that tire life is reduced in LRR tires. Often, there are competing forces at work: the LRR tires can save fuel, but tire replacement will often need to happen more quickly. The fleets also said that the use of WBS tires can further complicate the evaluation since maintenance events for tires and wheels can be much different than when using a standard dual-tire configuration. Due to these and other factors, it was evident from the interviews that determining the extent to which LRR and WBS tires save fleets fuel and money is more challenging than is the case for trailer aerodynamic technologies. Despite these mea-surement challenges, most of the respondents reported that LRR duals and WBS tires for trailers generally provide 1–3% and 2–4% fuel savings, respectively. However, due to the somewhat wide variation in responses as to the impacts of LRR and WBS tires on tire replacement, the authors have elected to forgo assigning a range of payback times for LRR dual or WBS tires.
3.2.2 Tire pressure systemsInflation is a pivotal factor in determining the rolling resistance of tires. For trailers, there are two types of tire pressure management systems: tire pressure monitoring systems and automatic tire inflation systems. While tire pressure monitoring systems simply report inflation information and do not add air to an underinflated tire, these systems provide the most extensive and flexible reporting of actual tire conditions to the driver and are able to warn users about all the types of air losses that may be occurring. On the other hand, an automatic tire inflation system can restore air to tires (with different
13
ICCT WHITE PAPER
systems capable of handling different levels of underinflation), but such systems usually do not report the actual inflation pressure in any given tire.
Both the fleets and tire manufacturers emphasized that trucking companies are increasingly interested in installing tire pressure management systems—not only for the improved fuel efficiency but, perhaps more important, to improve safety and increase tire life. Based on interviews from the three trailer OEMs, we estimate that monitoring systems are currently being installed on one-tenth of new box trailers, while automatic inflation systems are roughly three times as popular and installed on nearly a third of new trailers.
The two systems are similar in terms of the cost and benefits cited in the interviews, with purchase and installation costs ranging from roughly $700 to $1,000 and fuel savings on the order of 1% for both systems. As with LRR and WBS tires, there was a wide range of responses as to the effect of tire pressure systems on maintenance costs and tire life. However, all of the fleet interviewees that were asked about tire pressure systems reported payback times between one and two years. Many fleets contended that the automatic inflation systems are preferred over the monitoring systems because the inflation systems are passive and do not require intervention from the driver. A common sentiment expressed during the interviews for this project as well as in interviews for previous NACFE studies was that some fleets with high driver turnover (e.g., for-hire trucking fleets) have a strong preference for fuel-saving technologies that do not require driver response or training (Friesner et al. 2013; Liechty et al. 2013).
14
COSTS AND ADOPTION RATES OF FUEL-SAVING TECHNOLOGIES
4 CONCLUSIONS AND FUTURE WORKThe primary objective of this study was to better understand the current costs and adoption rates of a number of fuel-saving technologies for commercial trailers. By interviewing a variety of trucking fleets and equipment manufacturers, the study team was able to amass a diverse cross-section of data points on technology costs and level of uptake as well as opinions about technology efficacy and barriers to wider adoption. Though we cannot draw any statistically significant conclusions about trailer technology costs or sales rates from our somewhat limited survey of industry, the interviews with 22 companies have allowed us to build up the knowledge base in this area and outline places for future work.
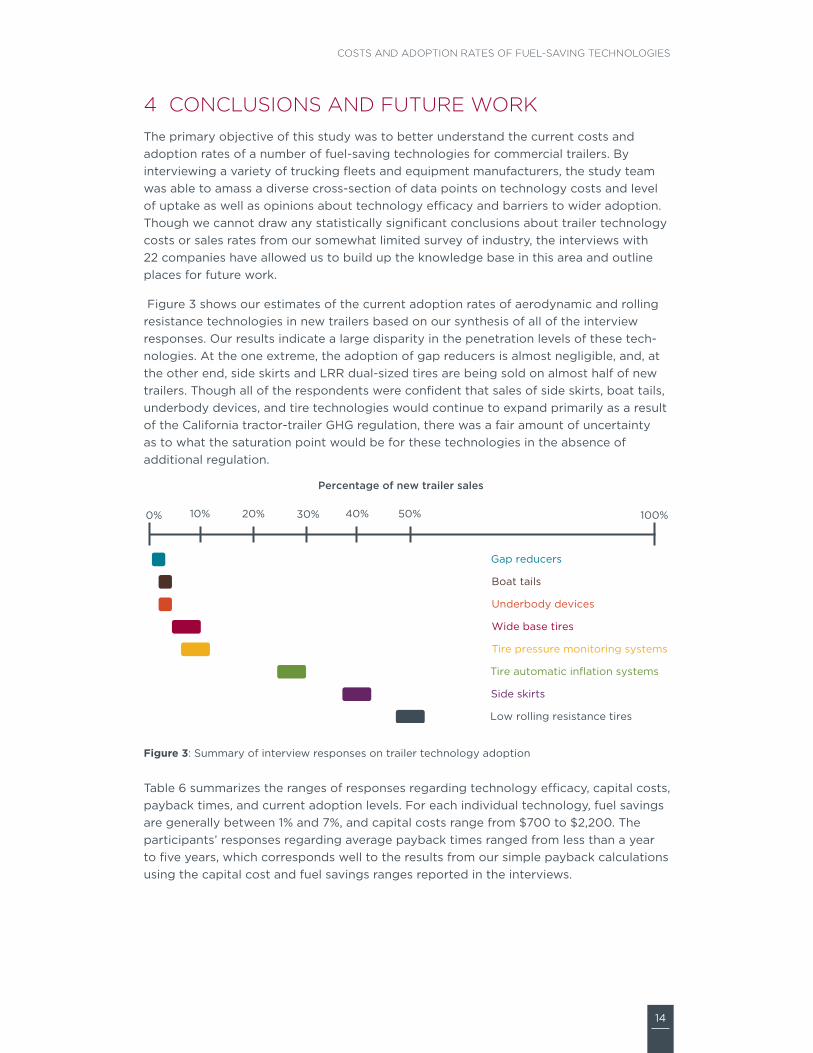
Figure 3 shows our estimates of the current adoption rates of aerodynamic and rolling resistance technologies in new trailers based on our synthesis of all of the interview responses. Our results indicate a large disparity in the penetration levels of these tech-nologies. At the one extreme, the adoption of gap reducers is almost negligible, and, at the other end, side skirts and LRR dual-sized tires are being sold on almost half of new trailers. Though all of the respondents were confident that sales of side skirts, boat tails, underbody devices, and tire technologies would continue to expand primarily as a result of the California tractor-trailer GHG regulation, there was a fair amount of uncertainty as to what the saturation point would be for these technologies in the absence of additional regulation.
0% 100%
Gap reducers
Boat tails
Underbody devices
Wide base tires
Tire pressure monitoring systems
Tire automatic inflation systems
Side skirts
Low rolling resistance tires
10% 20% 30% 40% 50%
Percentage of new trailer sales
Figure 3: Summary of interview responses on trailer technology adoption
Table 6 summarizes the ranges of responses regarding technology efficacy, capital costs, payback times, and current adoption levels. For each individual technology, fuel savings are generally between 1% and 7%, and capital costs range from $700 to $2,200. The participants’ responses regarding average payback times ranged from less than a year to five years, which corresponds well to the results from our simple payback calculations using the capital cost and fuel savings ranges reported in the interviews.

15
ICCT WHITE PAPER
Table 6: Summary of interview responses on trailer technology costs and level of adoption
TechnologyFuel
Savings
Cost to End User Typical Payback
Time
Adoption in New
Trailer SalesHigh Low
Side skirts – average 3%$1,100 $700
1–2 years40%
Side skirts – best 7% < 1 year
Boat tails – average 3%$1,600 $1,000
2–3 years3%
Boat tails – best 5% 1–2 years
Gap reducers 1%–2% $1,000 $700 2–5 years Minimal
Underbody devices 2%–5% $2,200 $1,500 2–5 years 3%
Low rolling resistance dual-sized tires 1%–3% Data on costs and payback
time inconclusive 50%
Wide base single tires 2%–4% Data on costs and payback time inconclusive 10%
Tire pressure monitoring systems 1% $1,000 $750 1-2 years 10%
Automatic tire inflation systems 1% $1,000 $700 1-2 years 30%
The following are the key findings from the study:
1. Costs of trailer side skirts have decreased substantially over the past 3 to 5 years. Current costs for trailer aerodynamic technologies—particularly side skirts—have decreased significantly in recent years, due to far more market entrants driving cost competition and much higher deployment volumes reduc-ing cost per unit. From the interview responses, we estimate that costs for side skirts have dropped roughly 70% compared to cost estimates that were compiled as part of the 2010 National Academy of Sciences study that investigated fuel efficiency technologies for commercial vehicles. A consensus position from the interviewees was that California’s tractor-trailer GHG regulation has been the primary driver for the rapid uptake and cost reductions of technologies but that an increasing number of fleets are adopting these aerodynamic devices because of attractive economics as well as improvements in the reliability and durability of products.
2. Among aerodynamic technologies, side skirts have had the largest rate of adop-tion, while the uptake of underbody, rear-end, and gap reduction devices has been more limited. Interview responses and sales data show that side skirts are the dominant trailer aerodynamic technology, with boat tails and underbody devices making up a much smaller percentage of the market. Our study team estimates that approximately 40% of new box trailers are sold with side skirts. Uptake of both underbody and rear-end devices is estimated to be roughly 3% of new box trailer sales, while sales of gap reducers have been fairly negligible and primarily limited to fleets that pair their trailers with day cabs.
3. There is widespread utilization of dual-size low rolling resistance tires, but adop-tion of wide base tires has been slower. Data gathered for this study suggest that approximately half of all tractor and trailer tires sold are low rolling resistance (i.e., SmartWay-verified) dual-size tires. These low rolling resistance duals have seen much broader adoption than wide base single tires. Responses from tire manufac-
16
COSTS AND ADOPTION RATES OF FUEL-SAVING TECHNOLOGIES
turers and trucking fleets put the current uptake of wide base single tires at around 10% of new trailer sales. Though the interviewees contended that wide base single tires have improved significantly since earlier generations, maintenance issues—and perceptions of maintenance issues—for these tires and wheels continue to be one of the primary barriers to adoption.
4. Roughly one-quarter of all trailers on the road in the U.S. have at least one aero-dynamic technology (e.g., side skirts, underbody device, or boat tail). Feedback from trailer and component manufacturers gives evidence of a robust market for aerodynamic technologies for both new and used trailers. The responses from these industry experts suggest that about one-quarter of all trailers operating in the U.S. have at least one aerodynamic enhancement.
5. There are further improvements and efficiency gains that stand to be achieved in trailer aerodynamics and tire technologies. In the interviews, all of the component suppliers of aerodynamic and tire technologies spoke of their technology develop-ment activities and next generation products that will offer enhanced quality and fuel savings. One of the aerodynamic device manufacturers asserted that its third generation product, which will be released commercially in the next year, would offer roughly an additional 40% reduction in aerodynamic drag over the second generation product and nearly a 100% improvement over the first generation product. This and other anecdotes provide evidence that important innovations continue to materialize in trailer efficiency technology.
These findings help illustrate that there are a number of cost-effective efficiency tech-nologies for trailers and that the market has changed fairly significantly in recent years. Perhaps the biggest catalyst for widespread adoption of trailer technologies has been California’s innovative in-use tractor-trailer GHG regulation, which is based heavily on the U.S. EPA’s SmartWay technology verification program. As technology deployment has accelerated, purchase costs have decreased, which continues to spawn further adoption.
The ICCT is engaged in a number of ongoing projects to analyze the trailer market, tech-nologies, and policy options. In a companion piece to this paper that is also scheduled for publishing in early 2014, we provide recommendations for ways to integrate trailers into the Phase 2 fuel efficiency and GHG regulation for heavy-duty vehicles.
This project was done in collaboration with the North American Council for Freight Effi-ciency and will provide data that assist the EPA and the National Highway Traffic Safety Administration in their evaluation of policy measures for trailers. As regulators in the U.S. and Canada consider policy measures for trailers, they can use data and information from this report to help inform estimates of the costs and benefits of any regulatory ac-tion for trailers. Moreover, this study suggests that there are sizable additional efficiency gains that can be achieved in trailer fuel-saving technologies, and regulation can play a critical role in accelerating the development and deployment of these new innovations and next generation products. Finally, this study has aided in highlighting knowledge gaps and areas for further research. Some of these areas for future work include a more comprehensive look at weight reduction technologies as well as fuel-saving technology costs and applicability for non–box trailers.
17
ICCT WHITE PAPER
REFERENCESCommittee to Assess Fuel Economy Technologies for Medium- and Heavy-Duty Vehicles,
National Research Council (2010). Technologies and Approaches to Reducing the Fuel Consumption of Medium- and Heavy-Duty Vehicles. Washington, D.C.: National Academies Press.
Façanha, C., K. Blumberg, and J. Miller (2012). Global Transportation Energy and Climate Roadmap: The Impact of Transportation Policies and Their Potential to Reduce Oil Consumption and Greenhouse Gas Emissions. International Council on Clean Transpor-tation. November.
Friesner, J., et al. (2013). “2013 Fleet Fuel Efficiency Benchmark Study.” North American Council for Freight Efficiency. Fort Wayne, Ind. March 10.
Goodyear Tire & Rubber Company (2013). “Factors Affecting Truck Fuel Economy.” Retrieved February 18, 2013, from http://www.goodyeartrucktires.com/resources/factors-fuel-economy.aspx.
Kromer, M., W. Bockholt, and M. Jackson (2009). Assessment of Fuel Economy Technolo-gies for Medium- and Heavy- Duty Vehicles. Prepared by TIAX LLC for the National Academy of Sciences. November 19.
Liechty, J., et al. (2013). “Tire Pressure Systems: Report of a Study Conducted by the North American Council for Freight Efficiency on the Confidence of Adopting Tire Pressure Systems.” North American Council for Freight Efficiency. Fort Wayne, Ind. August 15.
R. L. Polk & Co. (2012). “New Commercial Trailer Registrations from January 2003 through December 2011 for Trailers Longer than 24 Feet.” Southfield, Mich.
Sharpe, B. (2014). “Recommendations for Regulatory Design, Testing, and Certification for Integrating Trailers into the Phase 2 U.S. Heavy-Duty Vehicle Fuel Efficiency and Green-house Gas Regulation” (in publication). International Council on Clean Transportation.
Sharpe, B., N. Clark, and D. Lowell (2013). Trailer Technologies for Increased Heavy-Duty Vehicle Efficiency: Technical, Market, and Policy Considerations. International Council on Clean Transportation. June.
U.S. Department of Energy, Office of Energy Efficiency and Renewable Energy (21st Century Truck Partnership) (2006). Roadmap and Technical White Papers: Safely and Cost-Effectively Move Larger Volumes of Freight and Greater Numbers of Passengers. 21CTP-0003. December.