Embed Size (px)
Citation preview
BACKGROUND PAPER 3
Costing Summary of Ten South African Case Studies
Tony Mays and Neil Butcher
South African Institute for Distance Education (SAIDE)
1. THE REPORT
Hülsmann (2000:10 in Ramanujam, 2001:29) identifies the following three Critical Success Factors for the efficient and effective provision of distance education: • a clear policy; • an appropriate institutional culture; • the consideration of costs. Reporting on the costing of distance education provision in developing countries, Perraton (2002) notes that while the primary motivation for the move towards distance education was often economic, the limited reliable data available, suggests that from a cost perspective the economic advantages of distance education have proved equivocal. It is often the case that distance education provision proves more cost effective in terms of costs per student in comparison with traditional face-to-face contact institutions, but this is sometimes achieved at the expense of under-investment in course design and learner support (LS) strategies. In such cases, student pass rate is then sometimes so low, that the cost per successful student may actually be higher than in a more traditional setting. Perraton observes that teacher education is the one area in which case study research suggests that there is an unequivocal case for distance provision being potentially both cost effective and cost efficient. Perhaps the best generalization that can be made about the methods of distance education in relation to cost-effectiveness is that they provide tools for designing and building high quality systems for facilitating learning that are sensitive to the specific needs of students. Their cost-efficiency and effectiveness depend primarily on the number of students who can be recruited to each of their courses and the quality of their teaching materials and student support systems. Other factors have a bearing (for example, whether fees are set at levels that discourage recruitment and retention, and whether courses are designed from scratch or bought ‘off the shelf’) but these are the fundamental conditions for success. Distance education institutions that have been able, satisfactorily, to fulfil these conditions have been able to demonstrate higher levels of cost-efficiency and cost-effectiveness than comparable conventional institutions, the Open University UK being one such example. However, the data is extremely limited with regard to developing countries (South Africa in particular) and often does not offer insight into the economics of mixed mode institutions offering distance education courses. The current research process was therefore designed to try to fill this gap. Realizing that at programme and course level we would often be working with academics with limited
1
or no financial background, it was necessary to design questionnaires and processes that would be meaningful and accessible to all concerned and at the same time offer an opportunity for promoting useful reflection on practice.
1.1 THE COSTING MODEL
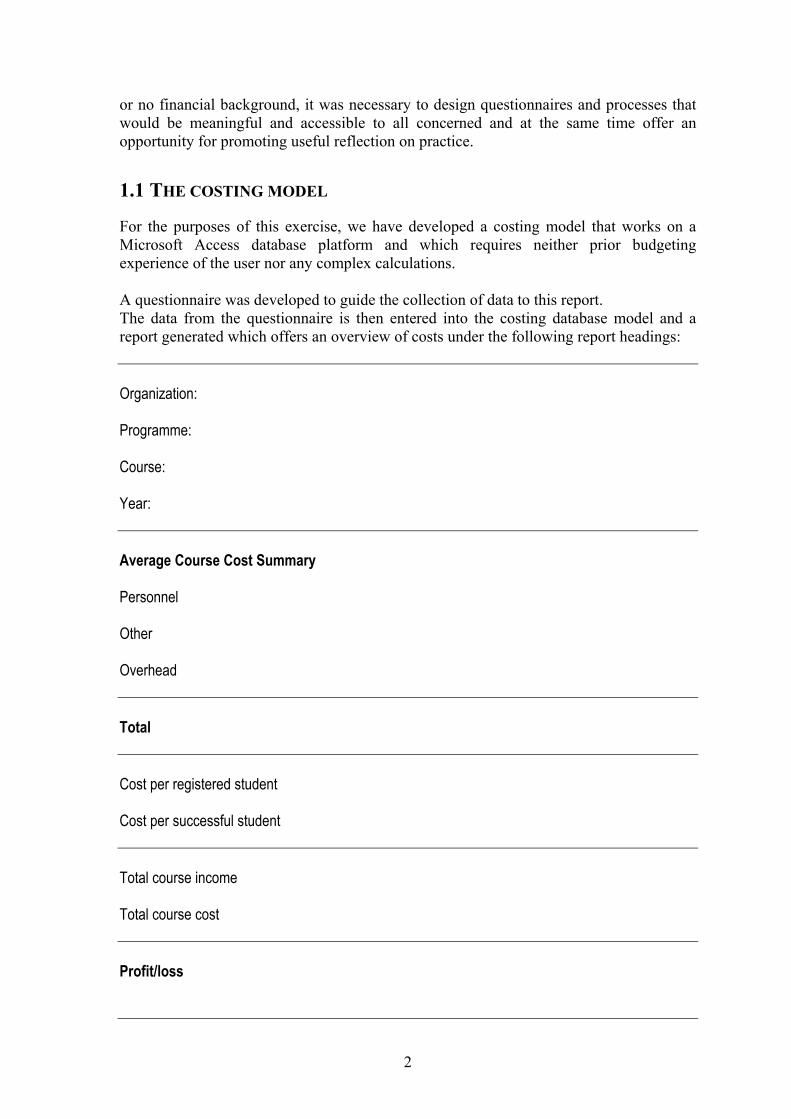
For the purposes of this exercise, we have developed a costing model that works on a Microsoft Access database platform and which requires neither prior budgeting experience of the user nor any complex calculations. A questionnaire was developed to guide the collection of data to this report. The data from the questionnaire is then entered into the costing database model and a report generated which offers an overview of costs under the following report headings: Organization: Programme: Course: Year: Average Course Cost Summary Personnel Other Overhead Total Cost per registered student Cost per successful student Total course income Total course cost Profit/loss
2
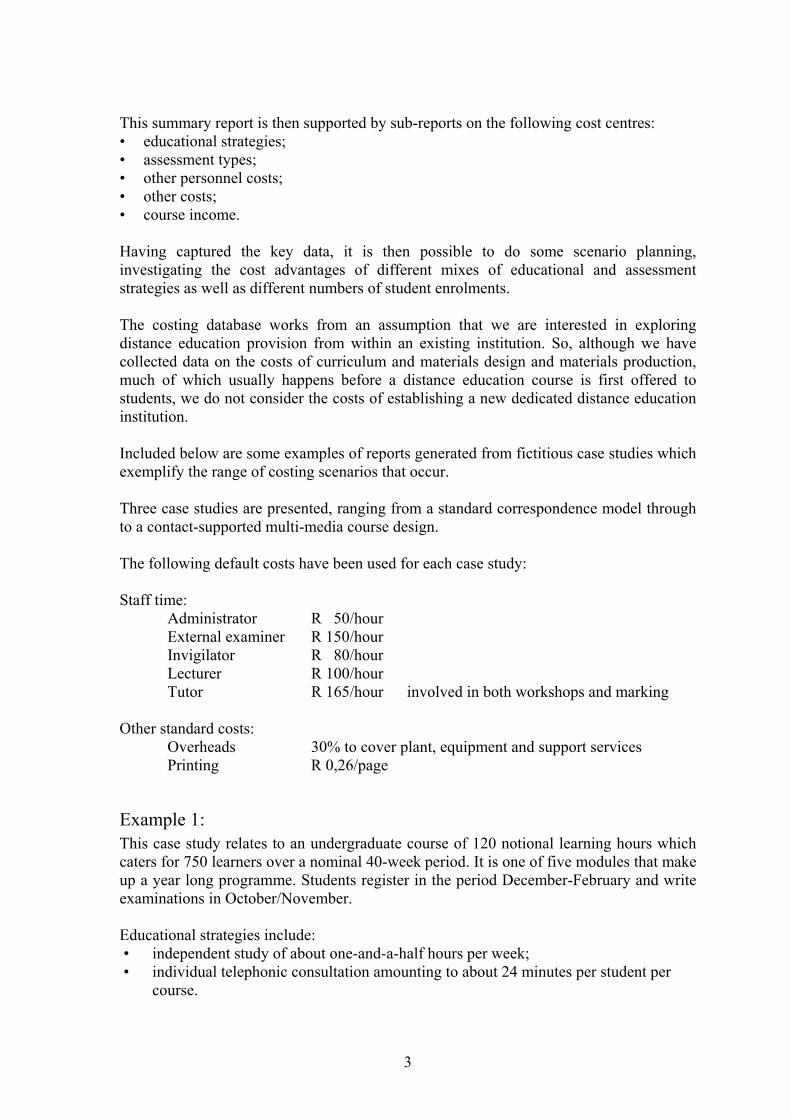
This summary report is then supported by sub-reports on the following cost centres: • educational strategies; • assessment types; • other personnel costs; • other costs; • course income. Having captured the key data, it is then possible to do some scenario planning, investigating the cost advantages of different mixes of educational and assessment strategies as well as different numbers of student enrolments. The costing database works from an assumption that we are interested in exploring distance education provision from within an existing institution. So, although we have collected data on the costs of curriculum and materials design and materials production, much of which usually happens before a distance education course is first offered to students, we do not consider the costs of establishing a new dedicated distance education institution. Included below are some examples of reports generated from fictitious case studies which exemplify the range of costing scenarios that occur. Three case studies are presented, ranging from a standard correspondence model through to a contact-supported multi-media course design. The following default costs have been used for each case study: Staff time: Administrator R 50/hour External examiner R 150/hour Invigilator R 80/hour Lecturer R 100/hour Tutor R 165/hour involved in both workshops and marking Other standard costs: Overheads 30% to cover plant, equipment and support services Printing R 0,26/page
Example 1: This case study relates to an undergraduate course of 120 notional learning hours which caters for 750 learners over a nominal 40-week period. It is one of five modules that make up a year long programme. Students register in the period December-February and write examinations in October/November. Educational strategies include: • independent study of about one-and-a-half hours per week; • individual telephonic consultation amounting to about 24 minutes per student per
course.
3
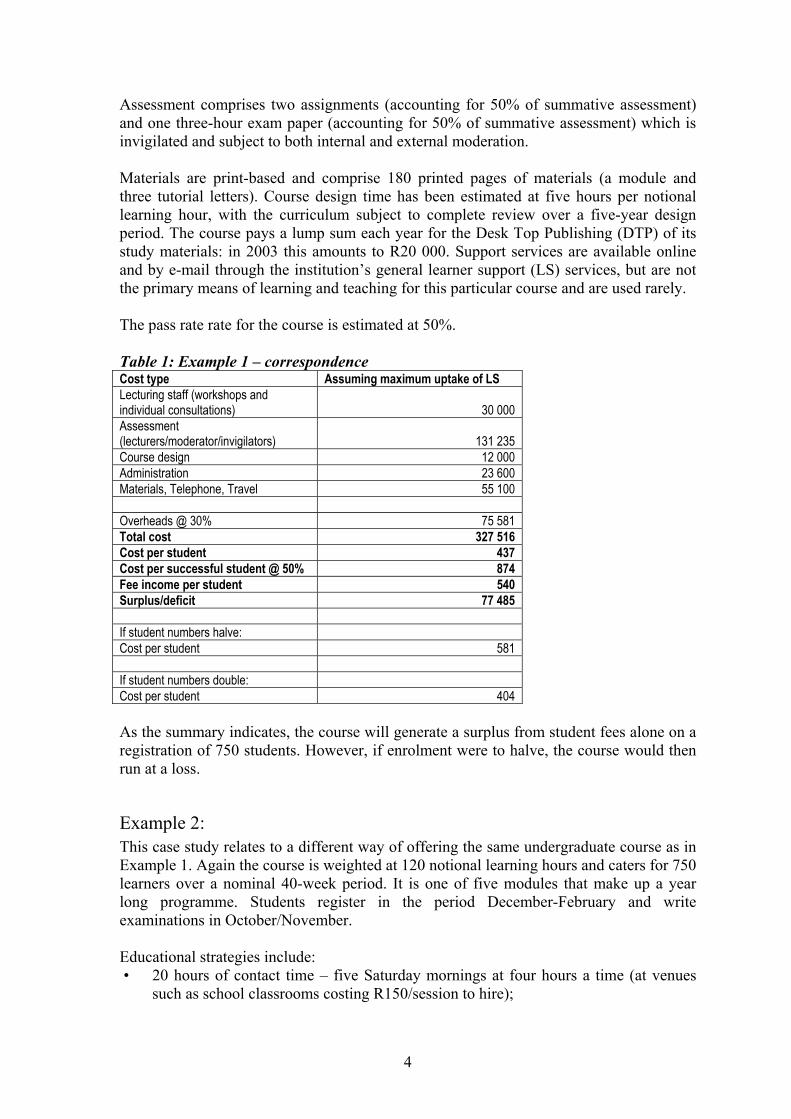
Assessment comprises two assignments (accounting for 50% of summative assessment) and one three-hour exam paper (accounting for 50% of summative assessment) which is invigilated and subject to both internal and external moderation. Materials are print-based and comprise 180 printed pages of materials (a module and three tutorial letters). Course design time has been estimated at five hours per notional learning hour, with the curriculum subject to complete review over a five-year design period. The course pays a lump sum each year for the Desk Top Publishing (DTP) of its study materials: in 2003 this amounts to R20 000. Support services are available online and by e-mail through the institution’s general learner support (LS) services, but are not the primary means of learning and teaching for this particular course and are used rarely. The pass rate rate for the course is estimated at 50%. Table 1: Example 1 – correspondence Cost type Assuming maximum uptake of LS Lecturing staff (workshops and individual consultations)
30 000
Assessment (lecturers/moderator/invigilators)
131 235
Course design 12 000 Administration 23 600 Materials, Telephone, Travel 55 100 Overheads @ 30% 75 581 Total cost 327 516 Cost per student 437 Cost per successful student @ 50% 874 Fee income per student 540 Surplus/deficit 77 485 If student numbers halve: Cost per student 581 If student numbers double: Cost per student 404 As the summary indicates, the course will generate a surplus from student fees alone on a registration of 750 students. However, if enrolment were to halve, the course would then run at a loss.
Example 2: This case study relates to a different way of offering the same undergraduate course as in Example 1. Again the course is weighted at 120 notional learning hours and caters for 750 learners over a nominal 40-week period. It is one of five modules that make up a year long programme. Students register in the period December-February and write examinations in October/November. Educational strategies include: • 20 hours of contact time – five Saturday mornings at four hours a time (at venues
such as school classrooms costing R150/session to hire);
4
• independent study of about one hour per week (reduced because of the contact time added into the course delivery);
• individual telephonic consultation amounting to about 15 hours of lecturer time per course (considerably reduced from Case Study 1 because students are now more likely to raise questions with their contact tutors).
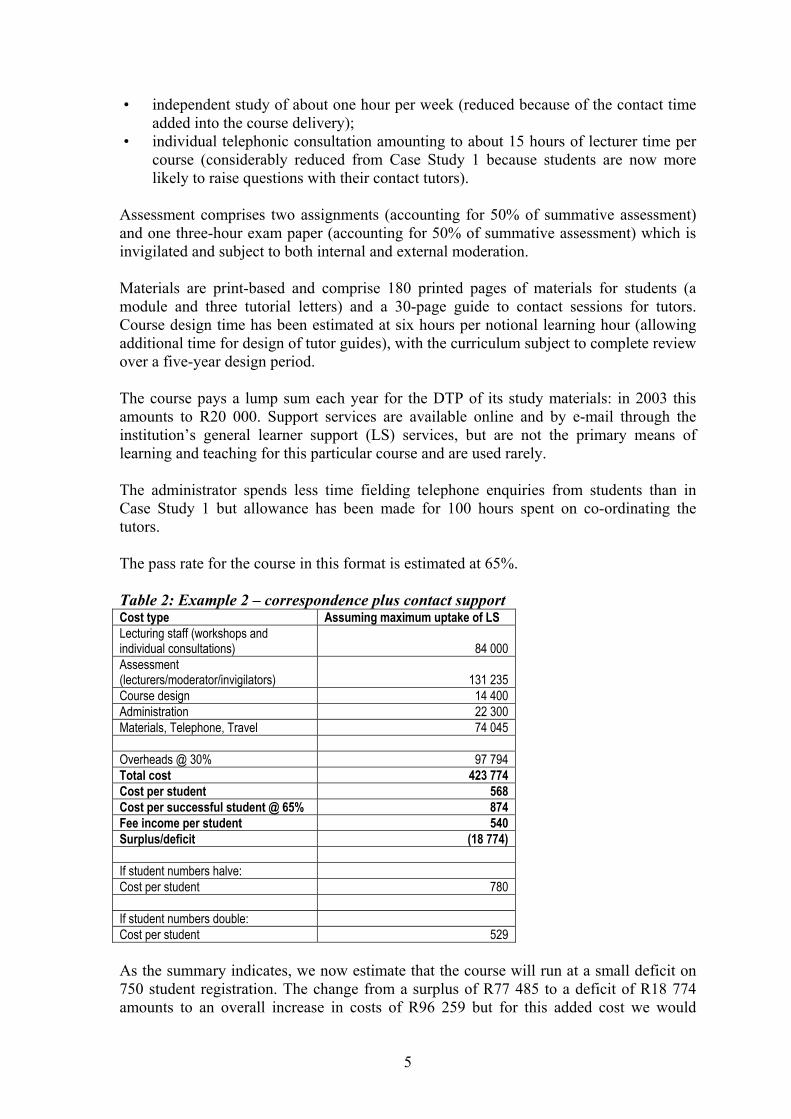
Assessment comprises two assignments (accounting for 50% of summative assessment) and one three-hour exam paper (accounting for 50% of summative assessment) which is invigilated and subject to both internal and external moderation. Materials are print-based and comprise 180 printed pages of materials for students (a module and three tutorial letters) and a 30-page guide to contact sessions for tutors. Course design time has been estimated at six hours per notional learning hour (allowing additional time for design of tutor guides), with the curriculum subject to complete review over a five-year design period. The course pays a lump sum each year for the DTP of its study materials: in 2003 this amounts to R20 000. Support services are available online and by e-mail through the institution’s general learner support (LS) services, but are not the primary means of learning and teaching for this particular course and are used rarely. The administrator spends less time fielding telephone enquiries from students than in Case Study 1 but allowance has been made for 100 hours spent on co-ordinating the tutors. The pass rate for the course in this format is estimated at 65%. Table 2: Example 2 – correspondence plus contact support Cost type Assuming maximum uptake of LS Lecturing staff (workshops and individual consultations)
84 000
Assessment (lecturers/moderator/invigilators)
131 235
Course design 14 400 Administration 22 300 Materials, Telephone, Travel 74 045 Overheads @ 30% 97 794 Total cost 423 774 Cost per student 568 Cost per successful student @ 65% 874 Fee income per student 540 Surplus/deficit (18 774) If student numbers halve: Cost per student 780 If student numbers double: Cost per student 529 As the summary indicates, we now estimate that the course will run at a small deficit on 750 student registration. The change from a surplus of R77 485 to a deficit of R18 774 amounts to an overall increase in costs of R96 259 but for this added cost we would
5
expect to see an additional 112 students successfully graduate from the course. In addition, we would expect the quality of passes to improve generally, on the understanding that the target learners entering the course are unlikely to be well-prepared for independent study. Any reduction in student numbers will see the deficit increasing. Conversely, if student numbers could be increased to 1 500, the course could benefit from economies of scale and again generate a small surplus (of R16 428).
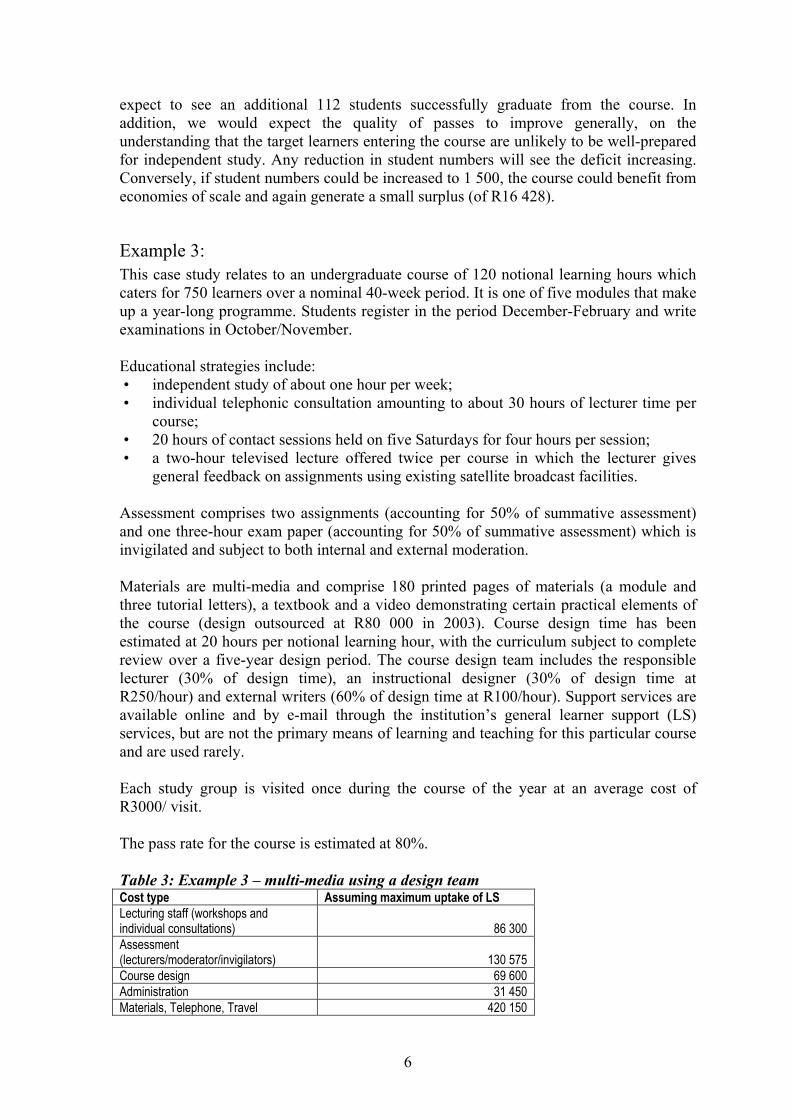
Example 3: This case study relates to an undergraduate course of 120 notional learning hours which caters for 750 learners over a nominal 40-week period. It is one of five modules that make up a year-long programme. Students register in the period December-February and write examinations in October/November. Educational strategies include: • independent study of about one hour per week; • individual telephonic consultation amounting to about 30 hours of lecturer time per
course; • 20 hours of contact sessions held on five Saturdays for four hours per session; • a two-hour televised lecture offered twice per course in which the lecturer gives
general feedback on assignments using existing satellite broadcast facilities. Assessment comprises two assignments (accounting for 50% of summative assessment) and one three-hour exam paper (accounting for 50% of summative assessment) which is invigilated and subject to both internal and external moderation. Materials are multi-media and comprise 180 printed pages of materials (a module and three tutorial letters), a textbook and a video demonstrating certain practical elements of the course (design outsourced at R80 000 in 2003). Course design time has been estimated at 20 hours per notional learning hour, with the curriculum subject to complete review over a five-year design period. The course design team includes the responsible lecturer (30% of design time), an instructional designer (30% of design time at R250/hour) and external writers (60% of design time at R100/hour). Support services are available online and by e-mail through the institution’s general learner support (LS) services, but are not the primary means of learning and teaching for this particular course and are used rarely. Each study group is visited once during the course of the year at an average cost of R3000/ visit. The pass rate for the course is estimated at 80%. Table 3: Example 3 – multi-media using a design team Cost type Assuming maximum uptake of LS Lecturing staff (workshops and individual consultations)
86 300
Assessment (lecturers/moderator/invigilators)
130 575
Course design 69 600 Administration 31 450 Materials, Telephone, Travel 420 150
6
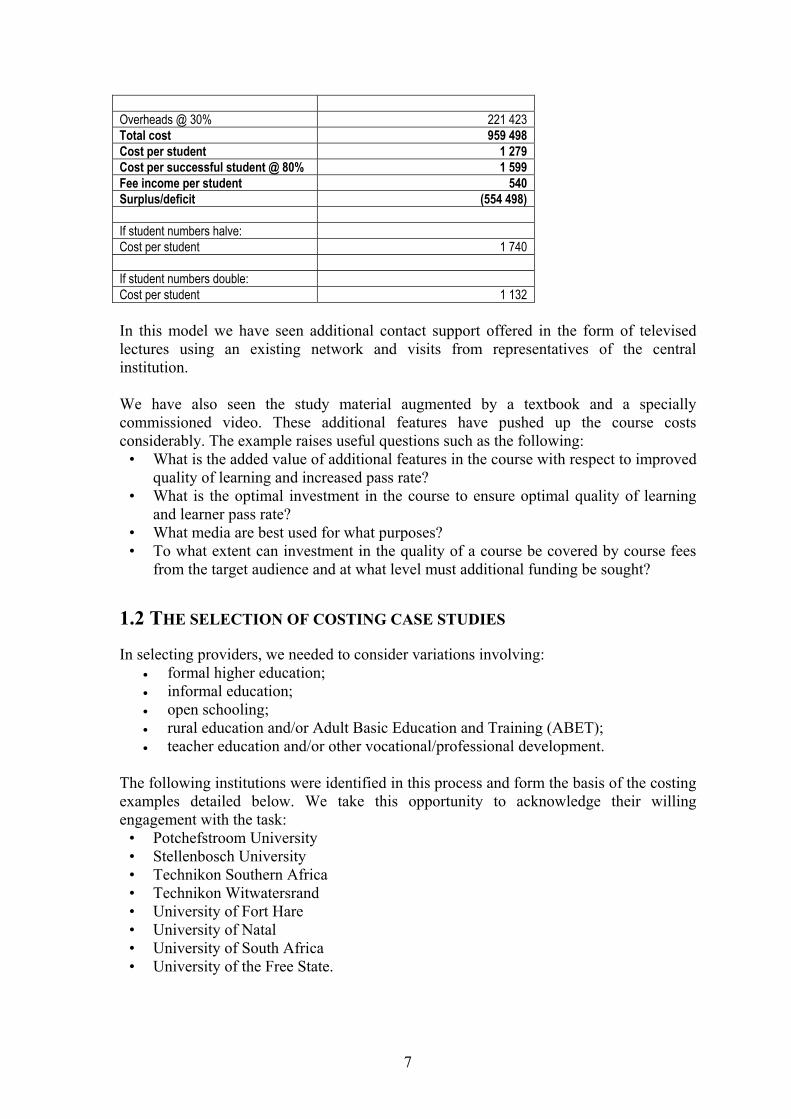
Overheads @ 30% 221 423 Total cost 959 498 Cost per student 1 279 Cost per successful student @ 80% 1 599 Fee income per student 540 Surplus/deficit (554 498) If student numbers halve: Cost per student 1 740 If student numbers double: Cost per student 1 132 In this model we have seen additional contact support offered in the form of televised lectures using an existing network and visits from representatives of the central institution. We have also seen the study material augmented by a textbook and a specially commissioned video. These additional features have pushed up the course costs considerably. The example raises useful questions such as the following:
• What is the added value of additional features in the course with respect to improved quality of learning and increased pass rate?
• What is the optimal investment in the course to ensure optimal quality of learning and learner pass rate?
• What media are best used for what purposes? • To what extent can investment in the quality of a course be covered by course fees
from the target audience and at what level must additional funding be sought?
1.2 THE SELECTION OF COSTING CASE STUDIES
In selecting providers, we needed to consider variations involving: • formal higher education; • informal education; • open schooling; • rural education and/or Adult Basic Education and Training (ABET); • teacher education and/or other vocational/professional development.
The following institutions were identified in this process and form the basis of the costing examples detailed below. We take this opportunity to acknowledge their willing engagement with the task:
• Potchefstroom University • Stellenbosch University • Technikon Southern Africa • Technikon Witwatersrand • University of Fort Hare • University of Natal • University of South Africa • University of the Free State.
7
Given the potential sensitivity of the data provided, we have chosen not to identify particular course data with particular institutions. Instead, we have identified the institutions with whom we have worked in alphabetical order, whilst we will discuss each of the case studies numerically on the basis of the degree of learner support (LS) and the level of curriculum design involved. The case studies will thus be discussed approximately on a continuum from largely print-based, correspondence provision through to courses that have invested heavily in curriculum and materials design and provide extensive learner support (LS) using multiple media. Collecting the data involved a process of gathering preliminary information, often requiring making initial assumptions in the absence of the necessary verifiable data, and using the costing model to generate an initial report. Having generated a first report, it has usually then been necessary to revisit some of the initial assumptions and/or gather more information to refine the data. We have then used the model to ascertain the impact of the following: 1. student numbers halve in a period where fixed costs of , for example, full-time staff
cannot be adjusted; 2. student numbers increase within the tolerance of existing fixed resources.
1.3 CORE ASSUMPTIONS
Unless the data provided has indicated otherwise, we have made the following core assumptions:
• Academic staff at higher education institutions devote 20% of their time to pure research (although one often encounters the argument that in a distance education and open learning environment, academics find their research time used up by teaching and course writing, one contends that it is both possible and necessary to budget to do both things).
• An academic year comprises 170 attributable days of eight hours. For example, 365 days – 104 weekend days – 6 days on which the whole institution is closed for year end – 10 days of public holidays – 30 days leave – 45 days of research leave = 170 days = 1 360 hours. If a course requires more than 1 360 hours of academic staff time for one or more activities this is an indication that more than one staff member will be needed.
• For every one hour of academic staff time, we assume one hour of administrative time, unless the empirical data tells us otherwise.
• Overhead costs can be estimated at 30%, unless the empirical data tells us otherwise. Overhead costs are assumed to cover plant and maintenance, senior management and support services such as finance, human resources and library. We have attempted to gather information on specific course level costs, for example, renting offices specifically to run a course or travelling to quality assure contact sessions at the level of “other course costs”.
8
2. FINDINGS
2.1 GENERAL FINDINGS
Gathering the necessary data for this costing exercise proved quite difficult. Many of the course and programme co-ordinators with whom we engaged lacked basic information regarding the costing of their courses. In some institutions, academic staff members are not required to submit a budget with a new curriculum proposal. All budgeting and costing is handled separately by the Finance Department. Where staff are required to submit budgets, they must often do so with very little guidance and support. Very few course or programme co-ordinators were able to supply us with historical cost reporting for their particular courses. This means much planning and budgeting has to take place in a vacuum, and where budgets are submitted they are often simply accepted and no follow-up reporting is provided. With regard to personnel, different institutions use different terms to describe similar job functions, and very often salaries are regarded as confidential information. In such cases we have usually been able to identify the salary range at a particular level and have then taken an average of this range. Some of the staff members with whom we engaged had never considered their own time in terms of the cost to the course, assuming that as full-time employees they are simply part of the overheads of the institution. In addition, most of the staff with whom we engaged work on multiple courses and do not keep timesheets: this meant that having estimated how much time it would take to complete a particular task, they were often not able to see whether the resulting calculation, for example, time spent on course design, was realistic or not. Throughput figures are often not readily available and where they are available, there is often an enormous difference between course pass rate and programme throughput. In one instance, we encountered a course where pass rate at the course level averaged between 50-60% but throughput at the associated programme or qualification level was less than 1% within the minimum time and as low as 5,4% within three times the minimum time. In many instances, programme and course co-ordinators had not thought about how enrolment might be expected to grow or decrease in subsequent years. Most of the courses that formed part of this research, offer some form of contact support strategy. The most common strategies are individual consultations in person or by telephone (and to a much lesser extent by e-mail), face-to-face contact sessions/ workshops and satellite television broadcasts. What made costing difficult here was that it was not always clear how many students had access to and took advantage of the support that was offered. Several of the courses that were considered offer contact workshops, for example, but these workshops were sometimes not offered in multiple de-centralized venues. As a consequence, only a small percentage of students then had access to and made use of the support that was offered. In costing this form of provision, therefore, we wished to explore the possible implications
9
of opening access and offering this form of support to all the students on the course in contrast to what seemed to be the actual present case. A similar problem existed with individual consultations. Course personnel were often extremely vague with regard to how much time they spent in individual consultation with students, whether in person, or more indirectly by telephone and e-mail. Very often a course will be managed from a centralized venue and so students must then travel to that venue or make a long distance telephone call in order to seek advice (in general, e-mail was not commonly used by the students engaged on the courses that we investigated). The costs involved in accessing support then become a barrier to such access and the take-up is low. However, course personnel would often estimate that they would spend a certain amount of time with each student, even though when extrapolated to all the students on the course, the amount of time spent on individual consultation was clearly unrealistic. What we tried to do in this instance, was have course personnel reflect on the total amount of time they spent each week on individual consultation and then divide this by the number of students on the programme. Creating this ratio would then allow us to extrapolate the effects of increased or decreased student enrolments in terms of personnel time and costs. Where decentralized contact support is offered, courses will often employ external tutors. In most cases tutors are paid only for the time actually spent in contact sessions or for the actual number of scripts marked; they are not usually paid for their preparation time. The costs associated with assessment are broken down into marking, moderation and invigilation. Again, for the purposes of scenario planning we attempt to ascertain the assessment time (and cost) per student. For contact support, assessment and independent study we tried also to capture data on the estimated student time spent on these activities, which builds cumulatively to the total notional learning hours of the course. There was often initially a large discrepancy between the notional credits attached to a course and the actual learning time generated from a consideration of the various learning activities with which the students’ engaged. Apart from being interested in whether the workload for students seemed reasonable, determining the notional learning hours for a particular course is useful in providing insight into the actual course design time per student hour, for which some international benchmarks exist. In many of the courses we looked at, the course design time was less than one hour of design for one hour of student study, which is considerably below international benchmarks. In one or two cases, where course personnel were not sure about the time that had been spent on the course design process, using a notional ratio of ten hours per notional learning hour generated results that were clearly out of line with the actual costs incurred by the programme, even when extrapolated over a three to five year design cycle. Printed materials play an important role in all the programmes we considered, and in the absence of actual costs from most programmes, we have assumed a print cost of R0,26/page. Although many, but not all, programme or course co-ordinators were able to tell us what the student fee was for the course for which they were responsible, none were able to give us the actual government subsidy.
10
In the absence of useful feedback, many programme and course co-ordinators seem to operate on the basis that because their programmes have not been closed down, they must be operating in a financially sound way! As noted earlier, many (though not all) of the programme and course co-ordinators with whom we engaged were operating largely in a vacuum with regard to the actual income and expenditure for the courses for which they were responsible. In most cases, at course level, co-ordinators felt that they had to operate within the income generated by student fees and any additional funding they could generate themselves while government subsidies did not find themselves down to the course level but were “lost” somewhere in central financial administration. At the course level, co-ordinators were generally content with an assumption of a 30% contribution to overheads, but were often unable to give details of the kind of fixed and variable “other” costs associated with a particular course; that is costs that the institution incurs that it would not incur if that particular course were not offered. Generally our sense was that many programme and course co-ordinators still need to be empowered with planning and budgeting tools and expertise; that there needs to be a concerted effort by institutions towards activity and course-based costing; that regular reporting on the financial health of a course or programme is currently not a common phenomenon and that academic staff need to keep better records of how they utilise their time. In general, programme and course personnel with whom we engaged did not “enjoy” the exercise. However, many subsequently observed that difficult as it was, engaging with the kinds of questions that emerged gave them new insights into what they were doing.
2.2 SPECIFIC FINDINGS
In each case study below, we offer a broad description of the programme together with a summary of the key costing information. In two cases, where student access to support seems more to do with course design decisions to limit the number of contact venues rather than student decisions not to take up decentralized learner support (LS), we have briefly explored the impact of redesigning to aim for maximum uptake and contrasted this with the current reality.
2.2.1 Case Study One This case study relates to an undergraduate course of approximately 120 notional learning hours which currently caters for 16 139 learners. Educational strategies include: • independent study; • individual consultation; • 6-12 hours of optional tutorial contact sessions, attended by about 12% of learners.
While there are about 13 centres around the country, only four are used in this programme (some students have registered with other institutions offering contact support for students taking distance courses, and so get additional contact support but at the expense of additional fees for this second institution’s support);
11
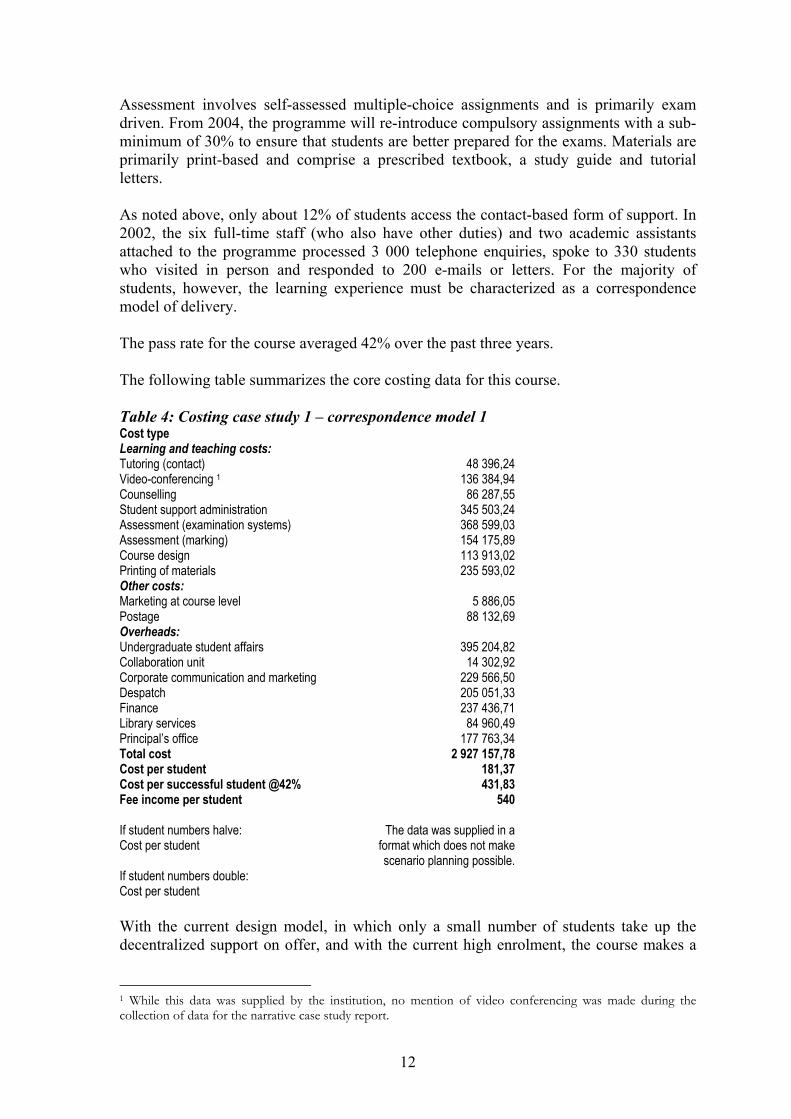
Assessment involves self-assessed multiple-choice assignments and is primarily exam driven. From 2004, the programme will re-introduce compulsory assignments with a sub-minimum of 30% to ensure that students are better prepared for the exams. Materials are primarily print-based and comprise a prescribed textbook, a study guide and tutorial letters. As noted above, only about 12% of students access the contact-based form of support. In 2002, the six full-time staff (who also have other duties) and two academic assistants attached to the programme processed 3 000 telephone enquiries, spoke to 330 students who visited in person and responded to 200 e-mails or letters. For the majority of students, however, the learning experience must be characterized as a correspondence model of delivery. The pass rate for the course averaged 42% over the past three years. The following table summarizes the core costing data for this course. Table 4: Costing case study 1 – correspondence model 1 Cost type Learning and teaching costs: Tutoring (contact) 48 396,24 Video-conferencing 1 136 384,94 Counselling 86 287,55 Student support administration 345 503,24 Assessment (examination systems) 368 599,03 Assessment (marking) 154 175,89 Course design 113 913,02 Printing of materials 235 593,02 Other costs: Marketing at course level 5 886,05 Postage 88 132,69 Overheads: Undergraduate student affairs 395 204,82 Collaboration unit 14 302,92 Corporate communication and marketing 229 566,50 Despatch 205 051,33 Finance 237 436,71 Library services 84 960,49 Principal’s office 177 763,34 Total cost 2 927 157,78 Cost per student 181,37 Cost per successful student @42% 431,83 Fee income per student 540 If student numbers halve: Cost per student If student numbers double: Cost per student
The data was supplied in a format which does not make scenario planning possible.
With the current design model, in which only a small number of students take up the decentralized support on offer, and with the current high enrolment, the course makes a
1 While this data was supplied by the institution, no mention of video conferencing was made during the collection of data for the narrative case study report.
12
large surplus on student fees alone. It is argued by the provider that it is necessary to have such courses in order to cross subsidize other smaller, but equally important courses.
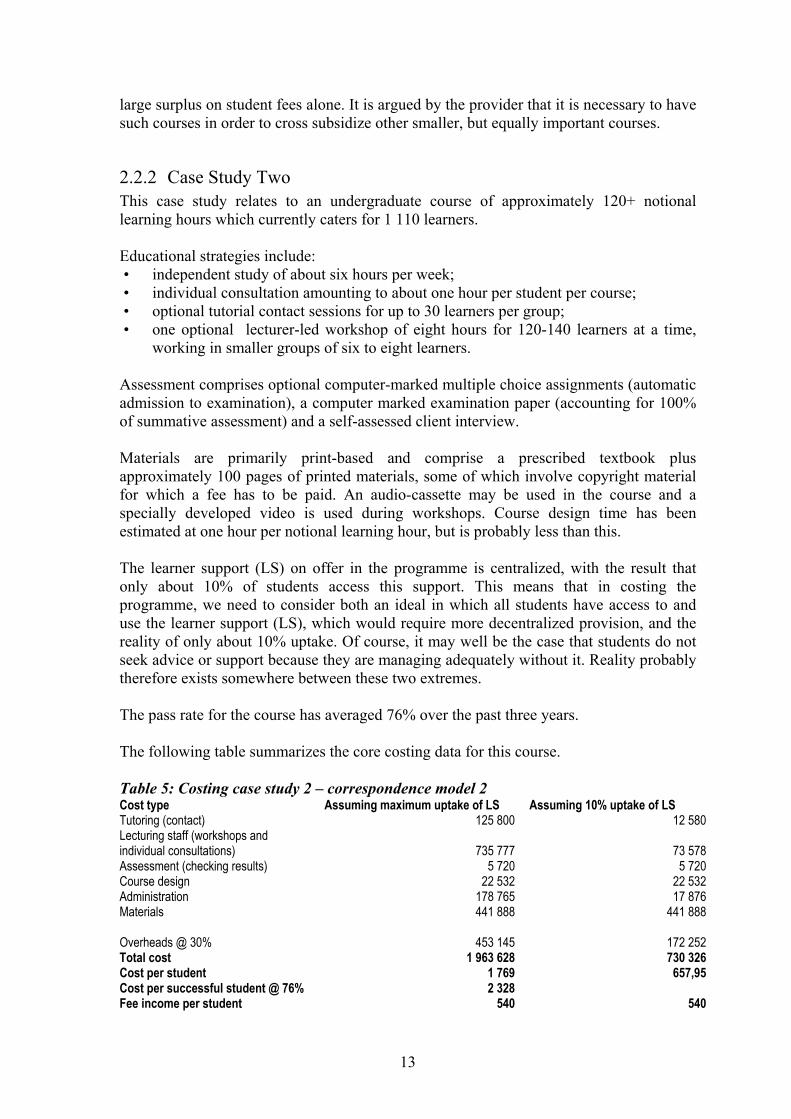
2.2.2 Case Study Two This case study relates to an undergraduate course of approximately 120+ notional learning hours which currently caters for 1 110 learners. Educational strategies include: • independent study of about six hours per week; • individual consultation amounting to about one hour per student per course; • optional tutorial contact sessions for up to 30 learners per group; • one optional lecturer-led workshop of eight hours for 120-140 learners at a time,
working in smaller groups of six to eight learners. Assessment comprises optional computer-marked multiple choice assignments (automatic admission to examination), a computer marked examination paper (accounting for 100% of summative assessment) and a self-assessed client interview. Materials are primarily print-based and comprise a prescribed textbook plus approximately 100 pages of printed materials, some of which involve copyright material for which a fee has to be paid. An audio-cassette may be used in the course and a specially developed video is used during workshops. Course design time has been estimated at one hour per notional learning hour, but is probably less than this. The learner support (LS) on offer in the programme is centralized, with the result that only about 10% of students access this support. This means that in costing the programme, we need to consider both an ideal in which all students have access to and use the learner support (LS), which would require more decentralized provision, and the reality of only about 10% uptake. Of course, it may well be the case that students do not seek advice or support because they are managing adequately without it. Reality probably therefore exists somewhere between these two extremes. The pass rate for the course has averaged 76% over the past three years. The following table summarizes the core costing data for this course. Table 5: Costing case study 2 – correspondence model 2 Cost type Assuming maximum uptake of LS Assuming 10% uptake of LS Tutoring (contact) 125 800 12 580 Lecturing staff (workshops and individual consultations)
735 777
73 578
Assessment (checking results) 5 720 5 720 Course design 22 532 22 532 Administration 178 765 17 876 Materials 441 888 441 888 Overheads @ 30% 453 145 172 252 Total cost 1 963 628 730 326 Cost per student 1 769 657,95 Cost per successful student @ 76% 2 328 Fee income per student 540 540
13
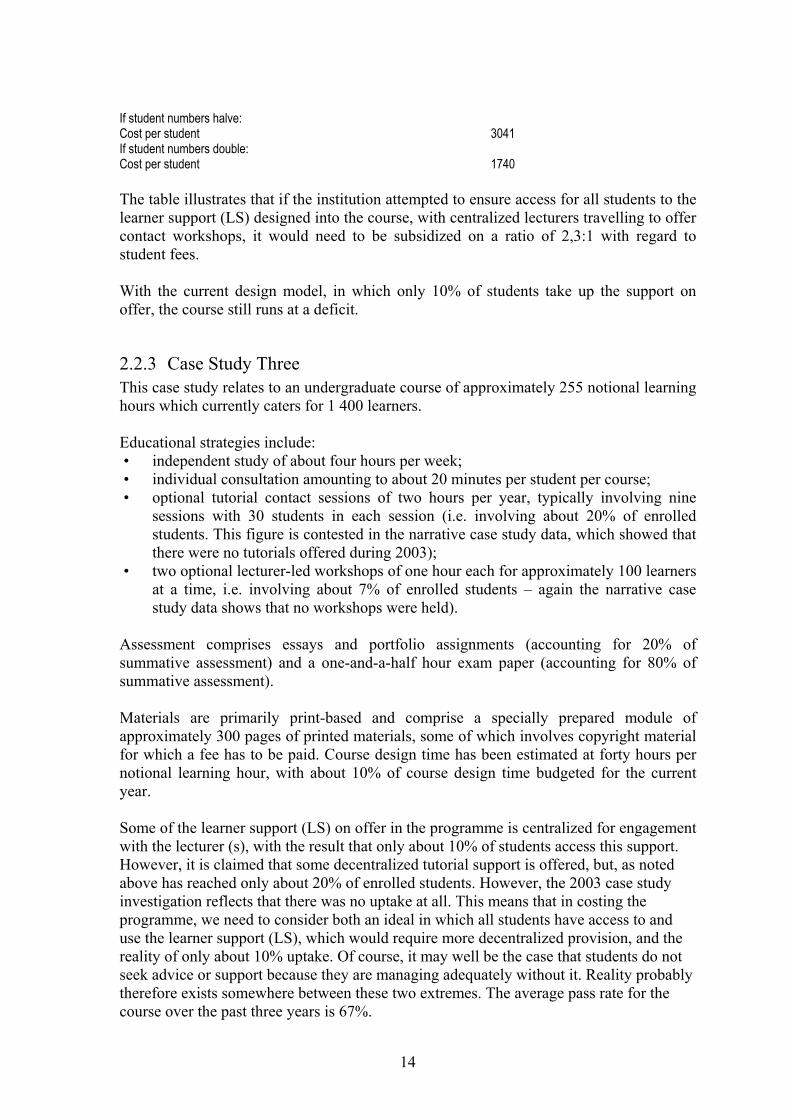
If student numbers halve: Cost per student 3041 If student numbers double: Cost per student 1740 The table illustrates that if the institution attempted to ensure access for all students to the learner support (LS) designed into the course, with centralized lecturers travelling to offer contact workshops, it would need to be subsidized on a ratio of 2,3:1 with regard to student fees. With the current design model, in which only 10% of students take up the support on offer, the course still runs at a deficit.
2.2.3 Case Study Three This case study relates to an undergraduate course of approximately 255 notional learning hours which currently caters for 1 400 learners. Educational strategies include: • independent study of about four hours per week; • individual consultation amounting to about 20 minutes per student per course; • optional tutorial contact sessions of two hours per year, typically involving nine
sessions with 30 students in each session (i.e. involving about 20% of enrolled students. This figure is contested in the narrative case study data, which showed that there were no tutorials offered during 2003);
• two optional lecturer-led workshops of one hour each for approximately 100 learners at a time, i.e. involving about 7% of enrolled students – again the narrative case study data shows that no workshops were held).
Assessment comprises essays and portfolio assignments (accounting for 20% of summative assessment) and a one-and-a-half hour exam paper (accounting for 80% of summative assessment). Materials are primarily print-based and comprise a specially prepared module of approximately 300 pages of printed materials, some of which involves copyright material for which a fee has to be paid. Course design time has been estimated at forty hours per notional learning hour, with about 10% of course design time budgeted for the current year. Some of the learner support (LS) on offer in the programme is centralized for engagement with the lecturer (s), with the result that only about 10% of students access this support. However, it is claimed that some decentralized tutorial support is offered, but, as noted above has reached only about 20% of enrolled students. However, the 2003 case study investigation reflects that there was no uptake at all. This means that in costing the programme, we need to consider both an ideal in which all students have access to and use the learner support (LS), which would require more decentralized provision, and the reality of only about 10% uptake. Of course, it may well be the case that students do not seek advice or support because they are managing adequately without it. Reality probably therefore exists somewhere between these two extremes. The average pass rate for the course over the past three years is 67%.
14
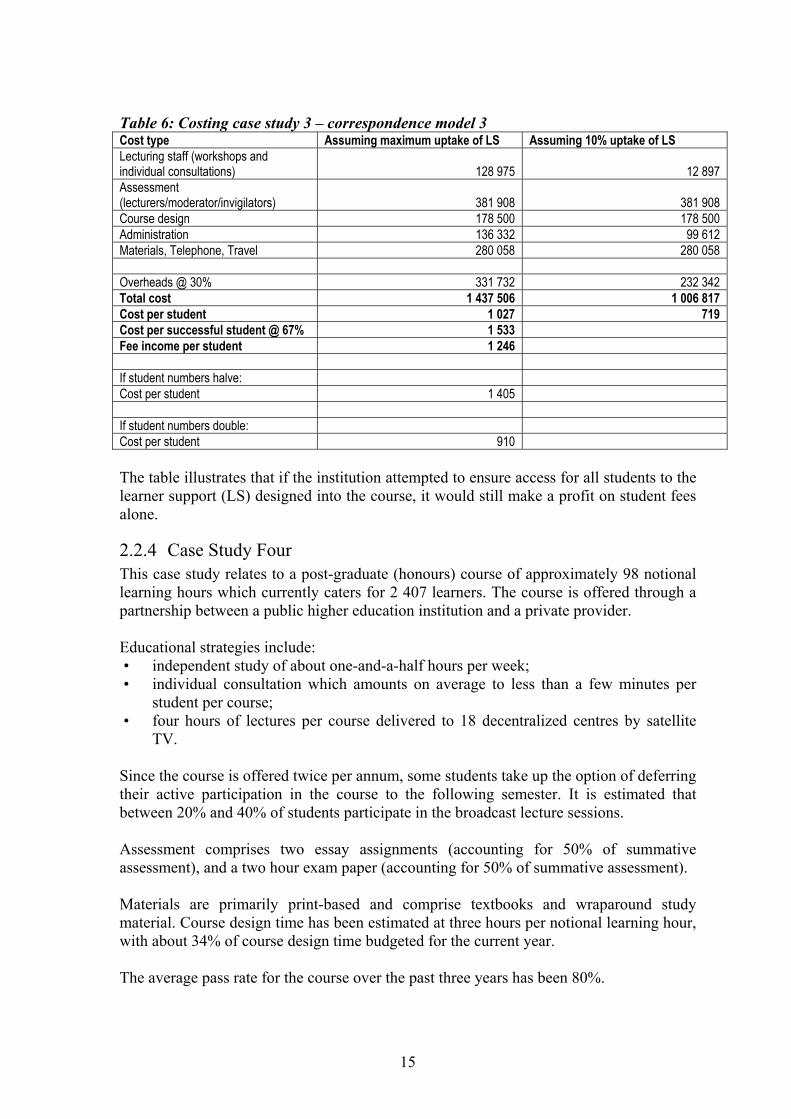
Table 6: Costing case study 3 – correspondence model 3 Cost type Assuming maximum uptake of LS Assuming 10% uptake of LS Lecturing staff (workshops and individual consultations)
128 975
12 897
Assessment (lecturers/moderator/invigilators)
381 908
381 908
Course design 178 500 178 500 Administration 136 332 99 612 Materials, Telephone, Travel 280 058 280 058 Overheads @ 30% 331 732 232 342 Total cost 1 437 506 1 006 817 Cost per student 1 027 719 Cost per successful student @ 67% 1 533 Fee income per student 1 246 If student numbers halve: Cost per student 1 405 If student numbers double: Cost per student 910 The table illustrates that if the institution attempted to ensure access for all students to the learner support (LS) designed into the course, it would still make a profit on student fees alone.
2.2.4 Case Study Four This case study relates to a post-graduate (honours) course of approximately 98 notional learning hours which currently caters for 2 407 learners. The course is offered through a partnership between a public higher education institution and a private provider. Educational strategies include: • independent study of about one-and-a-half hours per week; • individual consultation which amounts on average to less than a few minutes per
student per course; • four hours of lectures per course delivered to 18 decentralized centres by satellite
TV.
Since the course is offered twice per annum, some students take up the option of deferring their active participation in the course to the following semester. It is estimated that between 20% and 40% of students participate in the broadcast lecture sessions. Assessment comprises two essay assignments (accounting for 50% of summative assessment), and a two hour exam paper (accounting for 50% of summative assessment). Materials are primarily print-based and comprise textbooks and wraparound study material. Course design time has been estimated at three hours per notional learning hour, with about 34% of course design time budgeted for the current year. The average pass rate for the course over the past three years has been 80%.
15
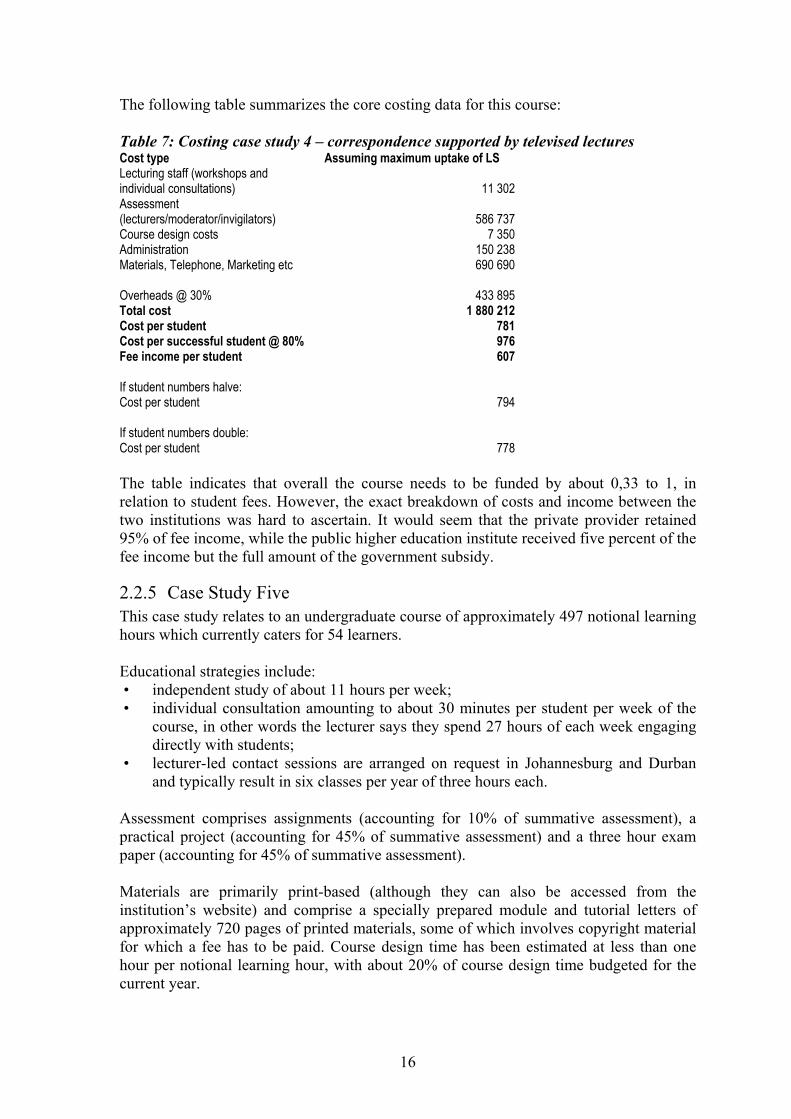
The following table summarizes the core costing data for this course: Table 7: Costing case study 4 – correspondence supported by televised lectures Cost type Assuming maximum uptake of LS Lecturing staff (workshops and individual consultations)
11 302
Assessment (lecturers/moderator/invigilators)
586 737
Course design costs 7 350 Administration 150 238 Materials, Telephone, Marketing etc 690 690 Overheads @ 30% 433 895 Total cost 1 880 212 Cost per student 781 Cost per successful student @ 80% 976 Fee income per student 607 If student numbers halve: Cost per student 794 If student numbers double: Cost per student 778 The table indicates that overall the course needs to be funded by about 0,33 to 1, in relation to student fees. However, the exact breakdown of costs and income between the two institutions was hard to ascertain. It would seem that the private provider retained 95% of fee income, while the public higher education institute received five percent of the fee income but the full amount of the government subsidy.
2.2.5 Case Study Five This case study relates to an undergraduate course of approximately 497 notional learning hours which currently caters for 54 learners. Educational strategies include: • independent study of about 11 hours per week; • individual consultation amounting to about 30 minutes per student per week of the
course, in other words the lecturer says they spend 27 hours of each week engaging directly with students;
• lecturer-led contact sessions are arranged on request in Johannesburg and Durban and typically result in six classes per year of three hours each.
Assessment comprises assignments (accounting for 10% of summative assessment), a practical project (accounting for 45% of summative assessment) and a three hour exam paper (accounting for 45% of summative assessment). Materials are primarily print-based (although they can also be accessed from the institution’s website) and comprise a specially prepared module and tutorial letters of approximately 720 pages of printed materials, some of which involves copyright material for which a fee has to be paid. Course design time has been estimated at less than one hour per notional learning hour, with about 20% of course design time budgeted for the current year.
16
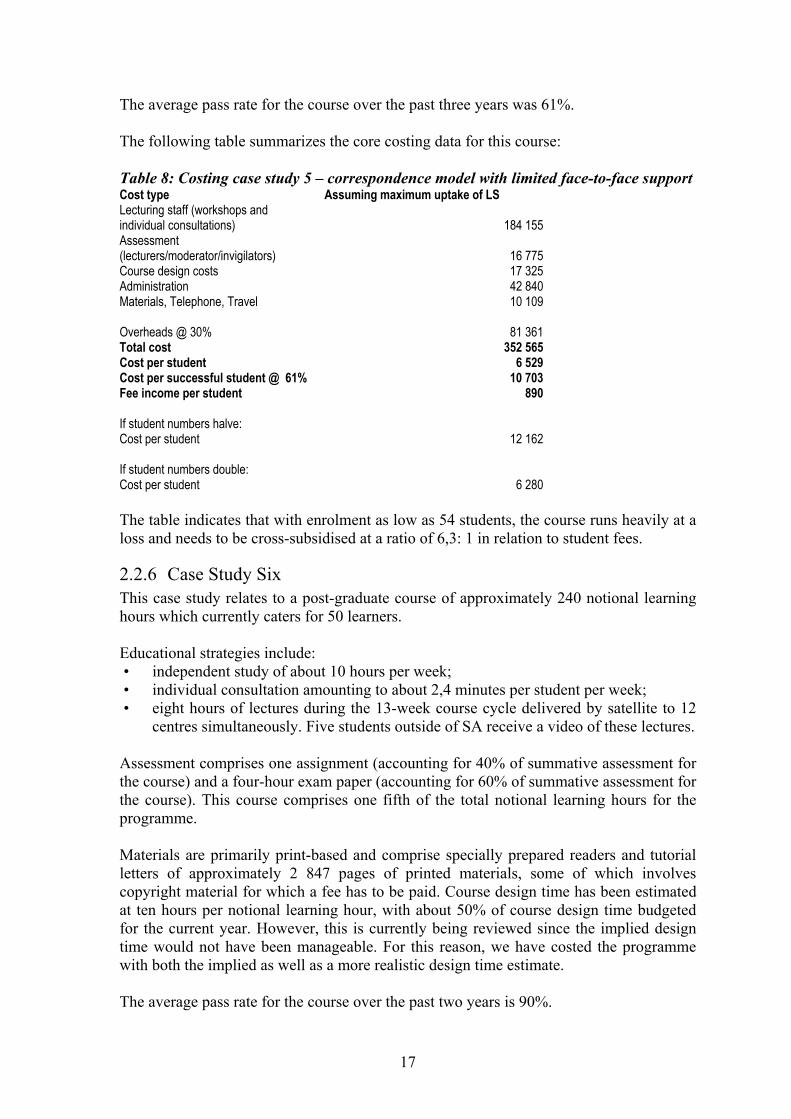
The average pass rate for the course over the past three years was 61%. The following table summarizes the core costing data for this course: Table 8: Costing case study 5 – correspondence model with limited face-to-face support Cost type Assuming maximum uptake of LS Lecturing staff (workshops and individual consultations)
184 155
Assessment (lecturers/moderator/invigilators)
16 775
Course design costs 17 325 Administration 42 840 Materials, Telephone, Travel 10 109 Overheads @ 30% 81 361 Total cost 352 565 Cost per student 6 529 Cost per successful student @ 61% 10 703 Fee income per student 890 If student numbers halve: Cost per student 12 162 If student numbers double: Cost per student 6 280 The table indicates that with enrolment as low as 54 students, the course runs heavily at a loss and needs to be cross-subsidised at a ratio of 6,3: 1 in relation to student fees.
2.2.6 Case Study Six This case study relates to a post-graduate course of approximately 240 notional learning hours which currently caters for 50 learners. Educational strategies include: • independent study of about 10 hours per week; • individual consultation amounting to about 2,4 minutes per student per week; • eight hours of lectures during the 13-week course cycle delivered by satellite to 12
centres simultaneously. Five students outside of SA receive a video of these lectures. Assessment comprises one assignment (accounting for 40% of summative assessment for the course) and a four-hour exam paper (accounting for 60% of summative assessment for the course). This course comprises one fifth of the total notional learning hours for the programme. Materials are primarily print-based and comprise specially prepared readers and tutorial letters of approximately 2 847 pages of printed materials, some of which involves copyright material for which a fee has to be paid. Course design time has been estimated at ten hours per notional learning hour, with about 50% of course design time budgeted for the current year. However, this is currently being reviewed since the implied design time would not have been manageable. For this reason, we have costed the programme with both the implied as well as a more realistic design time estimate. The average pass rate for the course over the past two years is 90%.
17
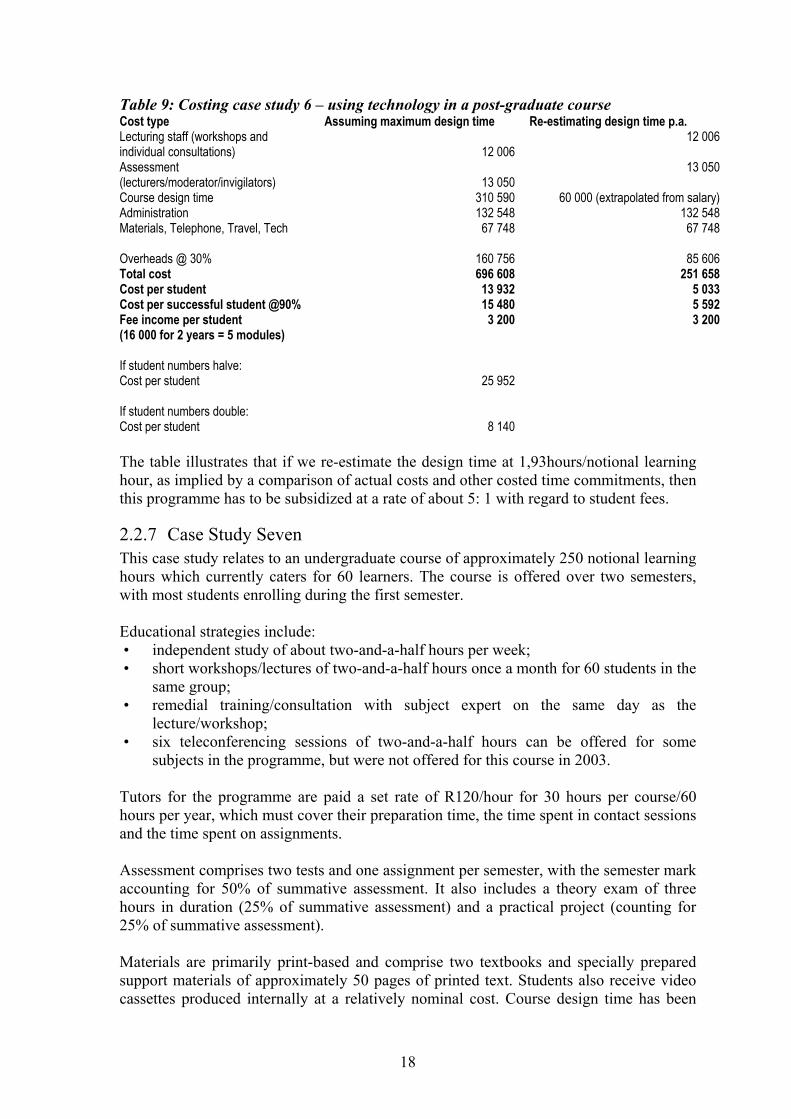
Table 9: Costing case study 6 – using technology in a post-graduate course Cost type Assuming maximum design time Re-estimating design time p.a. Lecturing staff (workshops and individual consultations)
12 006
12 006
Assessment (lecturers/moderator/invigilators)
13 050
13 050
Course design time 310 590 60 000 (extrapolated from salary) Administration 132 548 132 548 Materials, Telephone, Travel, Tech 67 748 67 748 Overheads @ 30% 160 756 85 606 Total cost 696 608 251 658 Cost per student 13 932 5 033 Cost per successful student @90% 15 480 5 592 Fee income per student 3 200 3 200 (16 000 for 2 years = 5 modules) If student numbers halve: Cost per student 25 952 If student numbers double: Cost per student 8 140 The table illustrates that if we re-estimate the design time at 1,93hours/notional learning hour, as implied by a comparison of actual costs and other costed time commitments, then this programme has to be subsidized at a rate of about 5: 1 with regard to student fees.
2.2.7 Case Study Seven This case study relates to an undergraduate course of approximately 250 notional learning hours which currently caters for 60 learners. The course is offered over two semesters, with most students enrolling during the first semester. Educational strategies include: • independent study of about two-and-a-half hours per week; • short workshops/lectures of two-and-a-half hours once a month for 60 students in the
same group; • remedial training/consultation with subject expert on the same day as the
lecture/workshop; • six teleconferencing sessions of two-and-a-half hours can be offered for some
subjects in the programme, but were not offered for this course in 2003.
Tutors for the programme are paid a set rate of R120/hour for 30 hours per course/60 hours per year, which must cover their preparation time, the time spent in contact sessions and the time spent on assignments. Assessment comprises two tests and one assignment per semester, with the semester mark accounting for 50% of summative assessment. It also includes a theory exam of three hours in duration (25% of summative assessment) and a practical project (counting for 25% of summative assessment). Materials are primarily print-based and comprise two textbooks and specially prepared support materials of approximately 50 pages of printed text. Students also receive video cassettes produced internally at a relatively nominal cost. Course design time has been
18
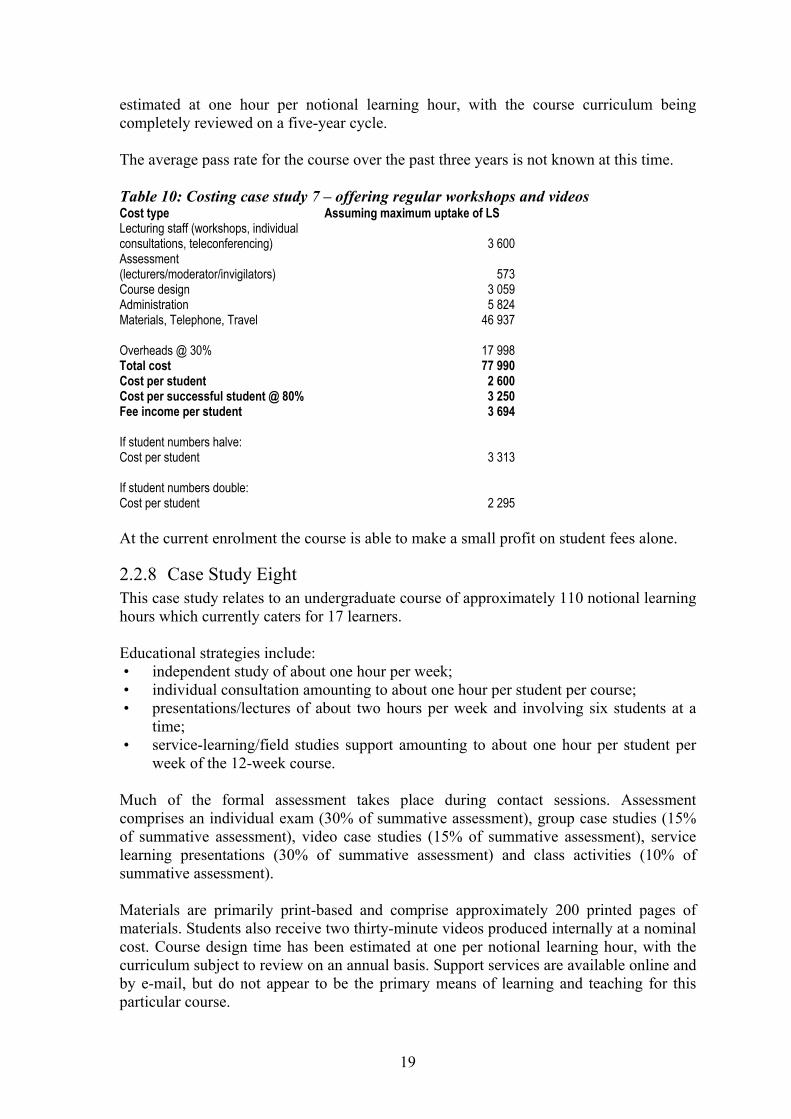
estimated at one hour per notional learning hour, with the course curriculum being completely reviewed on a five-year cycle. The average pass rate for the course over the past three years is not known at this time. Table 10: Costing case study 7 – offering regular workshops and videos Cost type Assuming maximum uptake of LS Lecturing staff (workshops, individual consultations, teleconferencing)
3 600
Assessment (lecturers/moderator/invigilators)
573
Course design 3 059 Administration 5 824 Materials, Telephone, Travel 46 937 Overheads @ 30% 17 998 Total cost 77 990 Cost per student 2 600 Cost per successful student @ 80% 3 250 Fee income per student 3 694 If student numbers halve: Cost per student 3 313 If student numbers double: Cost per student 2 295 At the current enrolment the course is able to make a small profit on student fees alone.
2.2.8 Case Study Eight This case study relates to an undergraduate course of approximately 110 notional learning hours which currently caters for 17 learners. Educational strategies include: • independent study of about one hour per week; • individual consultation amounting to about one hour per student per course; • presentations/lectures of about two hours per week and involving six students at a
time; • service-learning/field studies support amounting to about one hour per student per
week of the 12-week course. Much of the formal assessment takes place during contact sessions. Assessment comprises an individual exam (30% of summative assessment), group case studies (15% of summative assessment), video case studies (15% of summative assessment), service learning presentations (30% of summative assessment) and class activities (10% of summative assessment). Materials are primarily print-based and comprise approximately 200 printed pages of materials. Students also receive two thirty-minute videos produced internally at a nominal cost. Course design time has been estimated at one per notional learning hour, with the curriculum subject to review on an annual basis. Support services are available online and by e-mail, but do not appear to be the primary means of learning and teaching for this particular course.
19
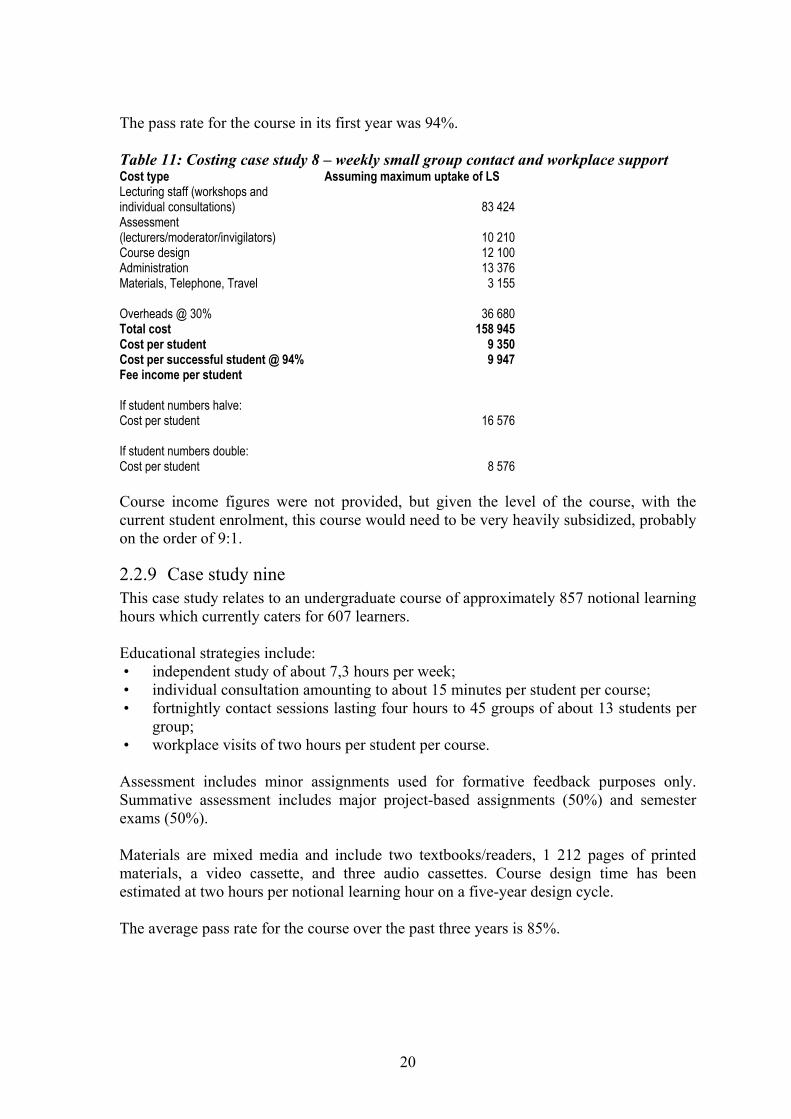
The pass rate for the course in its first year was 94%. Table 11: Costing case study 8 – weekly small group contact and workplace support Cost type Assuming maximum uptake of LS Lecturing staff (workshops and individual consultations)
83 424
Assessment (lecturers/moderator/invigilators)
10 210
Course design 12 100 Administration 13 376 Materials, Telephone, Travel 3 155 Overheads @ 30% 36 680 Total cost 158 945 Cost per student 9 350 Cost per successful student @ 94% 9 947 Fee income per student If student numbers halve: Cost per student 16 576 If student numbers double: Cost per student 8 576 Course income figures were not provided, but given the level of the course, with the current student enrolment, this course would need to be very heavily subsidized, probably on the order of 9:1.
2.2.9 Case study nine This case study relates to an undergraduate course of approximately 857 notional learning hours which currently caters for 607 learners. Educational strategies include: • independent study of about 7,3 hours per week; • individual consultation amounting to about 15 minutes per student per course; • fortnightly contact sessions lasting four hours to 45 groups of about 13 students per
group; • workplace visits of two hours per student per course. Assessment includes minor assignments used for formative feedback purposes only. Summative assessment includes major project-based assignments (50%) and semester exams (50%). Materials are mixed media and include two textbooks/readers, 1 212 pages of printed materials, a video cassette, and three audio cassettes. Course design time has been estimated at two hours per notional learning hour on a five-year design cycle. The average pass rate for the course over the past three years is 85%.
20
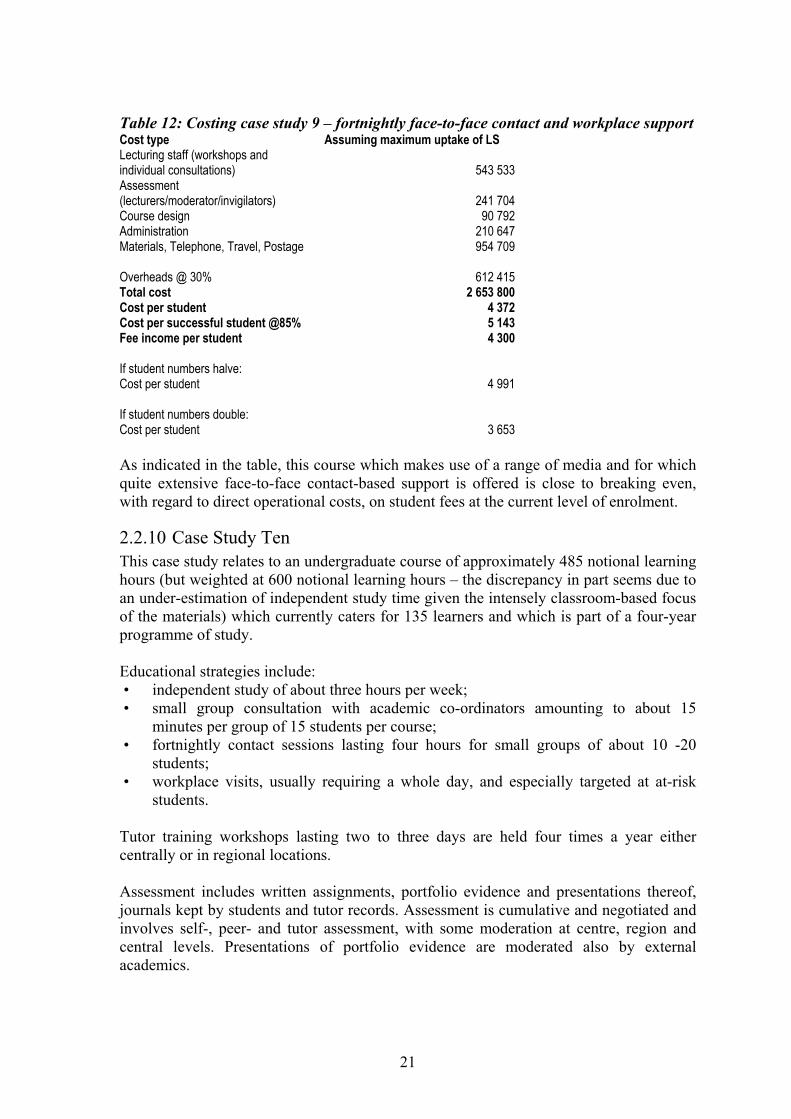
Table 12: Costing case study 9 – fortnightly face-to-face contact and workplace support Cost type Assuming maximum uptake of LS Lecturing staff (workshops and individual consultations)
543 533
Assessment (lecturers/moderator/invigilators)
241 704
Course design 90 792 Administration 210 647 Materials, Telephone, Travel, Postage 954 709 Overheads @ 30% 612 415 Total cost 2 653 800 Cost per student 4 372 Cost per successful student @85% 5 143 Fee income per student 4 300 If student numbers halve: Cost per student 4 991 If student numbers double: Cost per student 3 653 As indicated in the table, this course which makes use of a range of media and for which quite extensive face-to-face contact-based support is offered is close to breaking even, with regard to direct operational costs, on student fees at the current level of enrolment.
2.2.10 Case Study Ten This case study relates to an undergraduate course of approximately 485 notional learning hours (but weighted at 600 notional learning hours – the discrepancy in part seems due to an under-estimation of independent study time given the intensely classroom-based focus of the materials) which currently caters for 135 learners and which is part of a four-year programme of study. Educational strategies include: • independent study of about three hours per week; • small group consultation with academic co-ordinators amounting to about 15
minutes per group of 15 students per course; • fortnightly contact sessions lasting four hours for small groups of about 10 -20
students; • workplace visits, usually requiring a whole day, and especially targeted at at-risk
students. Tutor training workshops lasting two to three days are held four times a year either centrally or in regional locations. Assessment includes written assignments, portfolio evidence and presentations thereof, journals kept by students and tutor records. Assessment is cumulative and negotiated and involves self-, peer- and tutor assessment, with some moderation at centre, region and central levels. Presentations of portfolio evidence are moderated also by external academics.
21
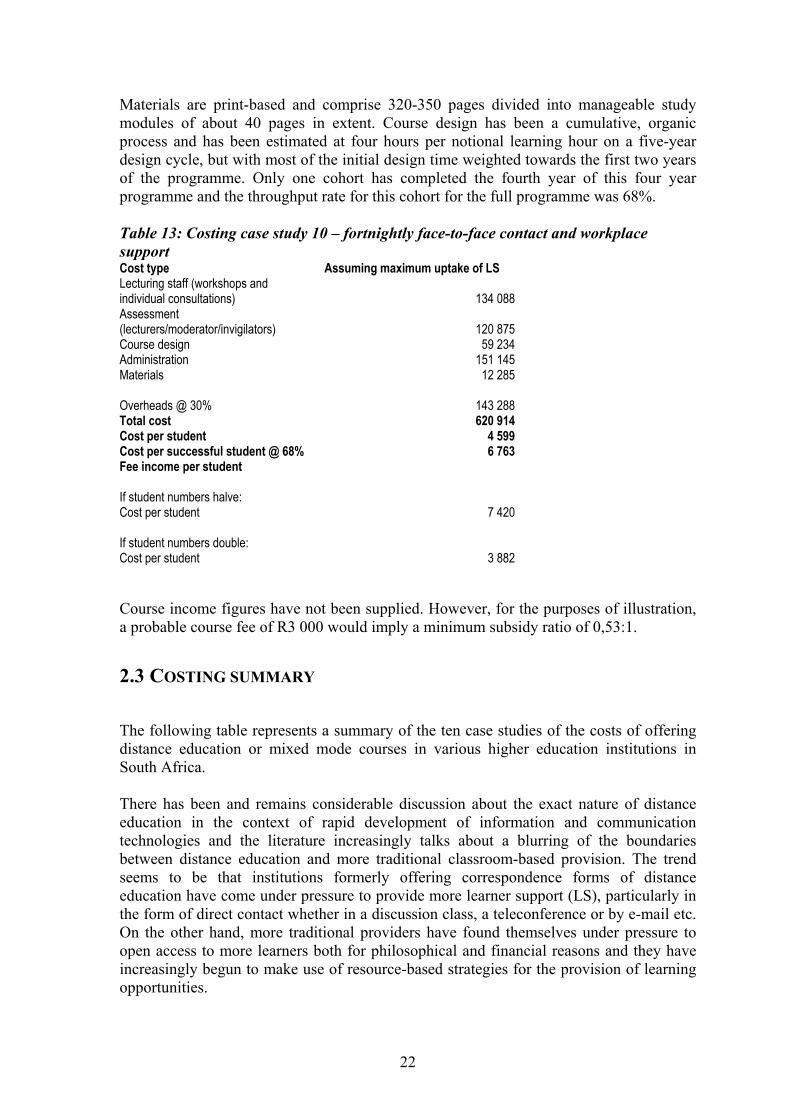
Materials are print-based and comprise 320-350 pages divided into manageable study modules of about 40 pages in extent. Course design has been a cumulative, organic process and has been estimated at four hours per notional learning hour on a five-year design cycle, but with most of the initial design time weighted towards the first two years of the programme. Only one cohort has completed the fourth year of this four year programme and the throughput rate for this cohort for the full programme was 68%. Table 13: Costing case study 10 – fortnightly face-to-face contact and workplace support Cost type Assuming maximum uptake of LS Lecturing staff (workshops and individual consultations)
134 088
Assessment (lecturers/moderator/invigilators)
120 875
Course design 59 234 Administration 151 145 Materials 12 285 Overheads @ 30% 143 288 Total cost 620 914 Cost per student 4 599 Cost per successful student @ 68% 6 763 Fee income per student If student numbers halve: Cost per student 7 420 If student numbers double: Cost per student 3 882 Course income figures have not been supplied. However, for the purposes of illustration, a probable course fee of R3 000 would imply a minimum subsidy ratio of 0,53:1.
2.3 COSTING SUMMARY
The following table represents a summary of the ten case studies of the costs of offering distance education or mixed mode courses in various higher education institutions in South Africa. There has been and remains considerable discussion about the exact nature of distance education in the context of rapid development of information and communication technologies and the literature increasingly talks about a blurring of the boundaries between distance education and more traditional classroom-based provision. The trend seems to be that institutions formerly offering correspondence forms of distance education have come under pressure to provide more learner support (LS), particularly in the form of direct contact whether in a discussion class, a teleconference or by e-mail etc. On the other hand, more traditional providers have found themselves under pressure to open access to more learners both for philosophical and financial reasons and they have increasingly begun to make use of resource-based strategies for the provision of learning opportunities.
22
The Council on Higher Education (CHE) study seemed both to confirm the blurring of boundaries but at the same time to affirm that there are still extremes of practice. In organizing the summary of case studies in the following table, we have chosen to emphasize this trend and to explore the consequences for costing. Thus at the left of the table we have clustered those courses which offer a print-based correspondence experience for most students (but not all). At the opposite end of the spectrum we have clustered courses for which traditional face-to-face interaction forms a key and integral aspect of the course for all learners registered. The courses in the middle of the table represent examples of mixed mode delivery with an increasing emphasis on the importance of direct face-to-face engagement as we move from left to right. For each case study we summarize the following information:
• Level of course, i.e. whether an undergraduate (U/G) or post graduate (P/G) programme.
• The notional learning hours (NLH) associated with the course, i.e. how much time the average student is expected to spend in various forms of engagement with the course including participation in educational strategies such as contact classes, teleconferences and e-mail discussions, time spent in independent study of course materials, time spent in individual consultation with course staff members (usually by telephone) and time spent preparing for and completing assessment requirements. As a guideline, the National Qualifications Framework in South Africa assumes a full year programme to comprise 120 credits or 1 200 notional learning hours.
• Increasingly, therefore we see courses modularized at 12 credits/120 NLH per module. We have included in brackets an estimate of what we or the programme managers expected the NLH to amount to. As can be seen, in many cases, we will need to go back to institutions to re-examine assumptions about student learning time, a useful educational by-product of the costing exercise.
• The third row details the current enrolment on the course in terms of actual student numbers (not full-time equivalents [FTEs]).
• The fourth row summarizes the nature of the contact support offered by the programme as this appears to be a distinguishing characteristic with respect to the blurring of boundaries between distance and more traditional forms of education provision.
• The fifth row summarizes the nature of the assessment used by the programme as we believe that the assessment practice very often is a prime indicator of the de facto curriculum and intent.
• In the sixth row we have tried to deduce from the data made available the ratio of course design time per student study hour.
• The seventh row summarizes the nature of the core materials, which remains largely print-based in the twelve case study institutions with Information and Communications Technologies (ICTs) usually being used as support mechanisms rather than for core learning experiences.
• The eighth row details the current course fee, although in some cases we still do not have this data and we have needed to make an estimate* (very often fees are for a whole programme rather than an individual course).
• The ninth row then details the cost per student (for Case Studies 2 and 3 we include two scenarios based on providing the contact-based support offered in the programme to all learners in a decentralized way or the current reality in which only about 10% of learners have access to the contact-based support; in case study 6, we
23
again have two scenarios based on an initial estimate of ten hours design time per student learning hour and the reality based on actual salaries paid which suggests a much lower ratio).
• The tenth row then explores the difference between the fees paid by students and the actual costs of offering the course to illustrate the extent to which it is/is not necessary to subsidize the course, whether internally from another programme or externally through a funding grant from government or another source. In South Africa in 2003, for example, the subsidy for distance education courses offered at universities varies between R6 000 and R8 200 averaging R7 100 per full-time equivalent student at a university and R5 700 per full-time equivalent student at a Technikon. This means that for a typical 120 credit module offered by a higher education institution, which represents 0,1 of a FTE student, the corresponding government subsidies will amount to R710 and R570 respectively. The Confederation of Open Learning Institutions of South Africa (COLISA) undertook its own internal investigation of course costing during the time in which the research for this report was being undertaken. They concluded that if courses and course materials were designed using team approaches and including expertise from multiple areas, and if learner support (LS) services received more investment of resources to encourage greater direct interaction between lecturers and students to at least 10% of notional learning time (the Unisa NPDE programme was cited as an example), then the probable average subsidy ratio that would be required would be 75% of the subsidy offered to traditional contact-based institutions. In a parallel process, it seems likely from preliminary discussions on the issue that the South African University Vice-Chancellors Association (SAUVCA) will formally recommend that due to the collapsing boundaries between distance and contact-based provision, subsidy funding in South Africa should move towards parity over a phase-in period of perhaps ten years. The South African Ministry of Education will consider these various inputs and will probably announce new subsidy funding guidelines early in 2004.
• The eleventh row then takes into account the pass rate rates for the past three years where possible in order to obtain an estimate of the cost per successful student.
• Rows 12 and 13 then engage in some scenario planning to explore the ways in which changes in student enrolment can impact on costs.
24
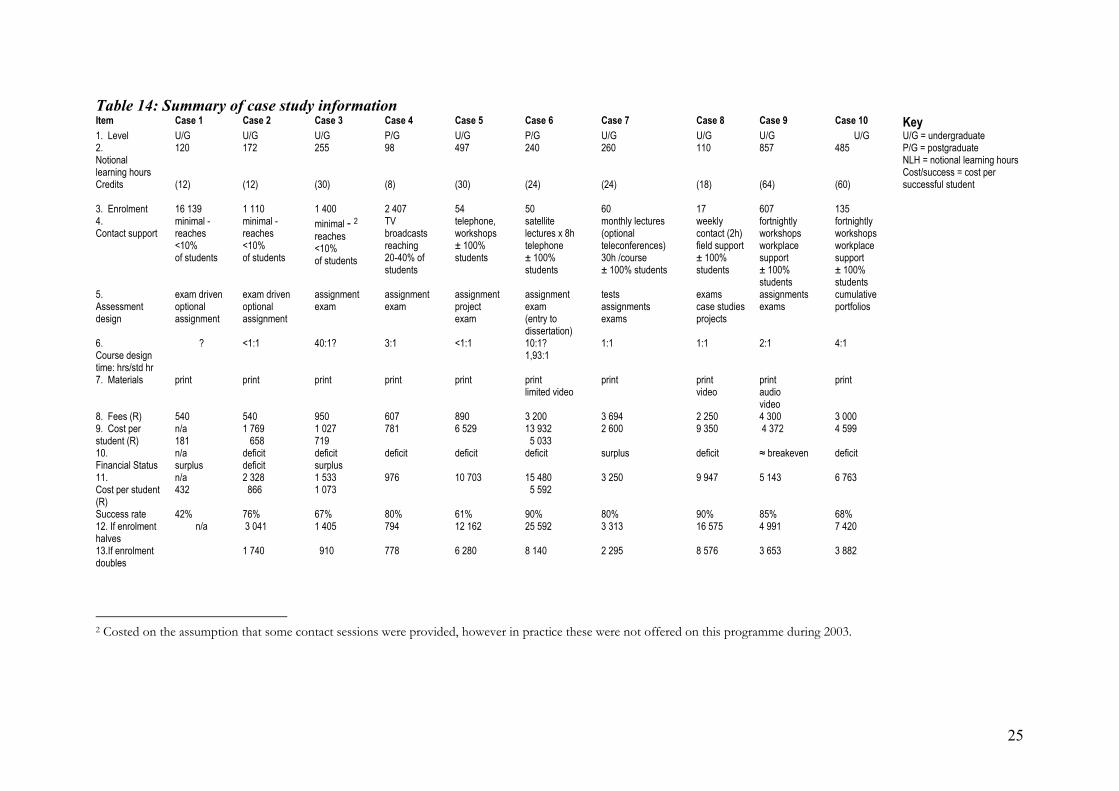
Table 14: Summary of case study information Item Case 1 Case 2 Case 3 Case 4 Case 5 Case 6 Case 7 Case 8 Case 9 Case 10 Key 1. Level U/G U/G U/G P/G
U/G P/G U/G U/G U/G U/G2. Notional learning hours Credits
120 (12)
172 (12)
255 (30)
98 (8)
497 (30)
240 (24)
260 (24)
110 (18)
857 (64)
485 (60)
3. Enrolment 16 139 1 110 1 400 2 407 54 50 60 17 607 135 4. Contact support
minimal - reaches <10% of students
minimal - reaches <10% of students
minimal - 2reaches <10% of students
TV broadcasts reaching 20-40% of students
telephone, workshops ± 100% students
satellite lectures x 8h telephone ± 100% students
monthly lectures (optional teleconferences) 30h /course ± 100% students
weekly contact (2h) field support ± 100% students
fortnightly workshops workplace support ± 100% students
fortnightly workshops workplace support ± 100% students
5. Assessment design
exam driven optional assignment
exam driven optional assignment
assignment exam
assignment exam
assignment project exam
assignment exam (entry to dissertation)
tests assignments exams
exams case studies projects
assignments exams
cumulative portfolios
6. Course design time: hrs/std hr
? <1:1 40:1? 3:1 <1:1 10:1?1,93:1
1:1 1:1 2:1 4:1
7. Materials print print print print
print printlimited video
print video
print audio video
8. Fees (R) 540 540 950 607 890 3 200 3 694 2 250 4 300 3 000 9. Cost per student (R)
n/a 181
1 769 658
1 027 719
781 6 529 13 932 5 033
2 600 9 350 4 372 4 599
10. Financial Status
n/a surplus
deficit deficit
deficit surplus
deficit deficit deficit surplus deficit ≈ breakeven deficit
11. Cost per student (R) Success rate
n/a 432 42%
2 328 866 76%
1 533 1 073 67%
976 80%
10 703 61%
15 480 5 592 90%
3 250 80%
9 947 90%
5 143 85%
6 763 68%
12. If enrolment halves
3 041 1 405 794 12 162 25 592 3 313 16 575 4 991 7 420
13.If enrolment doubles
n/a
1 740 910 778 6 280 8 140 2 295 8 576 3 653 3 882
U/G = undergraduate P/G = postgraduate NLH = notional learning hours Cost/success = cost per successful student
2 Costed on the assumption that some contact sessions were provided, however in practice these were not offered on this programme during 2003.
25

3. OBSERVATIONS
Reading Table 14 from left to right, we are not surprised to see that in courses with limited individualized learner support (LS), costs per student are not very sensitive to small changes in student numbers once we reach about 1 000 learners, because by this time economies of scale have already been reached with the print materials. However, programmes with very large numbers, 10 000+, do enjoy considerably increased economies of scale. In the middle of the table, we see courses with relatively low student numbers. Here even when we double student numbers, enrolment is still too low to achieve significant economies in terms of course and materials design processes. At the extreme right of the table we see the way in which increased student support of a face-to-face contact nature, which is variable with student numbers, limits the impact of economies of scale from course and materials design processes. However, it would seem possible that with enrolment at around 500 to 600 learners, even courses which offer significant contact-based learner support (LS), begin to see costs per student declining to the level where they might reasonably be expected to be covered by student fees. In practice, institutions will likely offer a range of such courses with the more profitable cross-subsidizing the less profitable. This raises questions about the extent to which such cross-subsidization should be governed by policy frameworks and the extent to which a proportion of “profit” from a particular course should be re-invested in curriculum revision and learner support (LS) for that particular course. More specifically, the data collected and the research process followed suggests the following conclusions can be drawn: – Distance education is not necessarily a cheap alternative to more traditional contact-
based provision: six of the ten courses run at a deficit on student fees.
• It would appear that correspondence type courses with limited learner support (LS) and limited recurring investment in course and materials design (Case Studies 1, 2, 3 and 4) should be able to cover operational costs from student fees alone. Case Study 1, with a very large enrolment indicates a surplus of R5 787 929 on student fees alone. With a probable subsidy of R710/student, the total surplus for this course amounts to some R17 million. This raises interesting questions about the ongoing investment in the course (i.e. how much of the surplus is directed back into improving the course), and the extent to which a surplus should be used to cross-subsidize other courses or passed on the student in the form of reduced student fees. It is interesting to note that the very high enrolment for Case Study 1 was an exception and that most courses had an enrolment considerably lower and therefore benefited to a much lesser extent from economies of scale.
• It would appear that postgraduate courses (Case Study 6) are probably rightly
funded on a parity basis with traditional institutions. However, it is possible to offer post-graduate courses that are quite cost efficient (Case Study 4).
• It would appear that distance education courses with fewer than 100 learners (Case
Studies 5, 6, 7, 8) are too small to benefit from distance education economies of scale even if their students numbers doubled.
27
• It would appear that some nominally traditional contact-based courses (Case Study 7) may not offer substantially more direct face-to-face support (as a percentage of notional learning time) than nominally distance education courses (such as Case Studies 9 and 10).
• It would appear that distance education course offering regular face-to-face contact
can be operationally sustainable on reasonable fees when enrolments reach about 500 learners and local tutors are engaged to provide the contact support (compare Case Studies 9 and 10 which have similar models of delivery).
• It would appear that distance education courses with 1 000+ learners do not enjoy
significantly greater economies of scale with small enrolment increases but are sensitive to declines in enrolment to below 1 000 (Case Studies 2 and 3). However, considerable economies of scale are achieved with very large numbers (Case Study 1).
• Managers at the level of courses and programmes generally need more support in the
financial management of their courses from the time of planning and budgeting through to reporting over the projected life span of the course/programme.
28
4. BIBLIOGRAPHY AND USEFUL REFERENCES
• Association for the Development of Education in Africa (ADEA). (2002) Open and
Distance Learning in sub-Saharan Africa: A Literature Survey on Policy and Practice. Mauritius and France: ADEA Working Group on Distance Education and Open Learning.
• Butcher, N. and Roberts, N. (2001) Costs, Effectiveness, Efficiency: A Guide for
Sound Investment. Unpublished discussion document. Johannesburg: SAIDE. • Daniel, J.S. (1995) Open Universities and the Knowledge Media: New Opportunities:
New Threats, Conference Paper delivered at IXth annual conference of the Asian Association of Open Universities, 3-5 December 1995, Taipei.
• Dhanarajan, G. (ed.) (1994) Economics of Distance Education: Recent Experience
Hong Kong: OLI Press. • Horlock, J.H. (1984) ‘The Open University after 15 years’. Proceedings of the
Manchester Statistical Society. • Hülsmann, T. (2000) The Cost of Open Learning: a Handbook. Oldenburg:
Bibliotheks-und Informationssystem der Universität Oldenburg. • Kinyanjui, P.E. (2000) Future Trends in Open and Distance Education. Huria –
Journal of the Open University of Tanzania, 3(1): 1 – 10. • Manjulika, S. and Venugopal Reddy, V. (1996) Distance Education in India: A Model
for Developing Countries. New Delhi: Vikas. • Perraton, H. (1994) Comparative Cost of Distance Teaching in Higher Education:
Scale and Quality. In G. Dhanarajan. op. cit. p.21 • Perraton, H. (2000) Open and Distance Learning in the Developing World. London:
Routledge. • Ramanujam, P.R. (2001) Distance Open Learning in the Developing Asian Countries:
Problems and Possible Solutions. ZIFF Papiere 117. Hagen: Zentrales Institut für Fernstudienforschung.
• Rumble, G. (1997) The Costs and Economics of Open and Distance Learning.
London: Kogan Page. • Swift, D.F. and Dhanarajan, G. (1992) Cost-Effective Distance Education: A Hong
Kong Strategy, Hong Kong. • Swift, D. (1996) A Conceptual Analysis of the Costs of Distance Education. SAIDE
Concept Paper, Unpublished. Johannesburg: SAIDE.
29
• Taylor, J.C. and White, V.J. (1991) The Evaluation of Cost Effectiveness of Multi-
Media Mixed-Mode Teaching and Learning, Canberra: Australian Government Publishing Service.
• UNESCO. (2000) The Dakar Framework for Action – Education for All: meeting out
Collective Commitments. Report from the World Education Forum held in Dakar, Senegal, 26 – 28 April, 2000.
• United Kingdom. Department of Education and Science. (1981) Average Recurrent
Unit Costs of the Open University and Conventional Universities. Confidential and Restricted Paper.
30