Embed Size (px)
Citation preview

Cost/Benefit Analysis of Electronic License Plates
Final Report 637 Prepared by:
Andrew Eberline 1069 N. Poinciana Rd. Gilbert, AZ 85234
June 2008 Prepared for:
Arizona Department of Transportation 206 South 17th Avenue Phoenix, Arizona 85007 in cooperation with U.S. Department of Transportation Federal Highway Administration

The contents of the report reflect the views of the authors who are responsible for the facts and the accuracy of the data presented herein. The contents do not necessarily reflect the official views or policies of the Arizona Department of Transportation or the Federal Highway Administration. This report does not constitute a standard, specification, or regulation. Trade or manufacturers’ names that may appear herein are cited only because they are considered essential to the objectives of the report. The U.S. Government and the State of Arizona do not endorse products or manufacturers.

Technical Report Documentation Page 1. Report No.
FHWA-AZ-08-637
2. Government Accession No.
3. Recipient’s Catalog No.
5. Report Date
June 2008 4. Title and Subtitle
Cost/Benefit Analysis of Electronic License Plates 6. Performing Organization Code
7. Authors
Andrew Eberline 8. Performing Organization Report No.
10. Work Unit No.
9. Performing Organization Name and Address Andrew Eberline 1069 N. Poinciana Rd. Gilbert, AZ 85234
11. Contract or Grant No. SPR-PL-1-(67) 637
13.Type of Report & Period Covered
FINAL
12. Sponsoring Agency Name and Address Arizona Department of Transportation 206 S. 17th Avenue Phoenix, Arizona 85007 Project Manager: John Semmens
14. Sponsoring Agency Code
15. Supplementary Notes Prepared in cooperation with the U.S. Department of Transportation, Federal Highway Administration 16. Abstract
The objective of this report is to determine whether electronic vehicle recognition systems (EVR) or automatic license plate recognition systems (ALPR) would be beneficial to the Arizona Department of Transportation (AzDOT). EVR uses radio frequency identification technology tags (RFID) that would be placed on all registered vehicles so that RFID readers could read vehicles’ plate numbers as they pass using the radio frequency signal emitted by the RFID tag. ALPR technology uses cameras and alphanumerical recognition software to read license plates as they pass.
The literature review looks into the previous applications of both ALPR and EVR. Departments of Transportation (DOTs), tolling authorities and law enforcement all have used various applications of this advanced electronic technology. Based on the literature review and the benefits section (Chapter 3), the potential benefits of an ALPR / EVR system are:
1. The ability for AzDOT to potentially monitor traffic flow more accurately, 2. The ability to better enforce license and registration compliance, 3. The ability to better enforce auto insurance compliance, 4. The ability to implement a toll, or congestion charge, 5. The ability to aid law enforcement in finding suspected criminals.
Chapter 4 determines the potential costs of an ALPR or EVR system and then compares the costs with the total
quantifiable benefits using two case studies. In the first case study, an ALPR system was set up on all major valley freeways, and in the second case study, an EVR system was set up on all major valley freeways. The ALPR case study concluded that such an ALPR system could be set up for about $10 million dollars and it could generate up to $400 million dollars in direct benefit per year and up to $1.3 trillion in benefits to highway users per year. The EVR case study concluded that such an EVR system could be set up for about $50 million, and it could generate up to $407 million in direct benefit per year and up to $1.33 trillion in benefits to highway users per year. A direct benefit profits the state directly with cash, while benefits to highway users helps society as a whole but the state receives no revenue.
Chapter 5 looked into the legality of a potential ALPR or EVR system. This chapter concluded that AzDOT has the authority to implement an ALPR / EVR system in Arizona. However this section also concluded that AzDOT should seek legislative support to increase public support.
This report concludes that at the present ALPR should be further researched and/or implemented by the State of Arizona. The reasons for this recommendation are because of: ALPR’s previous applications, ALPR’s lower up front cost, ALPR’s ability to read out-of-state plates, ALPR’s potential lower degree of public opposition, and the possibility that ALPR would have to back up an EVR system. All in all, these technologies are changing at a rapid rate and a change in any of these variables that generated this recommendation could change this recommendation.
17. Key Words Automatic vehicle identification, electronic license plate, radio frequency identification, technology, tolls, cost/benefit
18. Distribution statement Document is available to the U.S. public through the National Technical Information Service, Springfield, Virginia, 22161
19. Security Classification
Unclassified
20. Security Classification
Unclassified
21. No. of Pages
91
22. Price
23. Registrant’s Seal

SI* (MODERN METRIC) CONVERSION FACTORS APPROXIMATE CONVERSIONS TO SI UNITS APPROXIMATE CONVERSIONS FROM SI UNITS
Symbol When You Know Multiply By To Find Symbol Symbol When You Know Multiply By To Find Symbol LENGTH LENGTH
in inches 25.4 millimeters mm mm millimeters 0.039 inches in
ft feet 0.305 meters m m meters 3.28 feet ft yd yards 0.914 meters m m meters 1.09 yards yd mi miles 1.61 kilometers km km kilometers 0.621 miles mi AREA AREA
in2 square inches 645.2 square millimeters mm2
mm2 square millimeters 0.0016 square inches in2
ft2 square feet 0.093 square meters m2
m2 square meters 10.764 square feet ft2
yd2 square yards 0.836 square meters m2 m2 square meters 1.195 square yards yd2
ac acres 0.405 hectares ha ha hectares 2.47 acres ac mi2 square miles 2.59 square kilometers km2
km2 square kilometers 0.386 square miles mi2
VOLUME VOLUME fl oz fluid ounces 29.57 milliliters mL mL milliliters 0.034 fluid ounces fl oz gal gallons 3.785 liters L L liters 0.264 gallons gal ft3
cubic feet 0.028 cubic meters m3 m3
cubic meters 35.315 cubic feet ft3
yd3 cubic yards 0.765 cubic meters m3 m3
cubic meters 1.308 cubic yards yd3
NOTE: Volumes greater than 1000L shall be shown in m3. MASS MASS
oz ounces 28.35 grams g g grams 0.035 ounces oz lb pounds 0.454 kilograms kg kg kilograms 2.205 pounds lb T short tons (2000lb) 0.907 megagrams
(or “metric ton”) mg
(or “t”) mg
(or “t”) megagrams
(or “metric ton”) 1.102 short tons (2000lb) T
TEMPERATURE (exact) TEMPERATURE (exact) ºF Fahrenheit
temperature 5(F-32)/9
or (F-32)/1.8 Celsius temperature ºC ºC Celsius temperature 1.8C + 32 Fahrenheit
temperature ºF
ILLUMINATION ILLUMINATION fc foot-candles 10.76 lux lx lx lux 0.0929 foot-candles fc fl foot-Lamberts 3.426 candela/m2 cd/m2 cd/m2 candela/m2 0.2919 foot-Lamberts fl FORCE AND PRESSURE OR STRESS FORCE AND PRESSURE OR STRESS
lbf poundforce 4.45 newtons N N newtons 0.225 poundforce lbf lbf/in2 poundforce per
square inch 6.89 kilopascals kPa kPa kilopascals 0.145 poundforce per
square inch lbf/in2
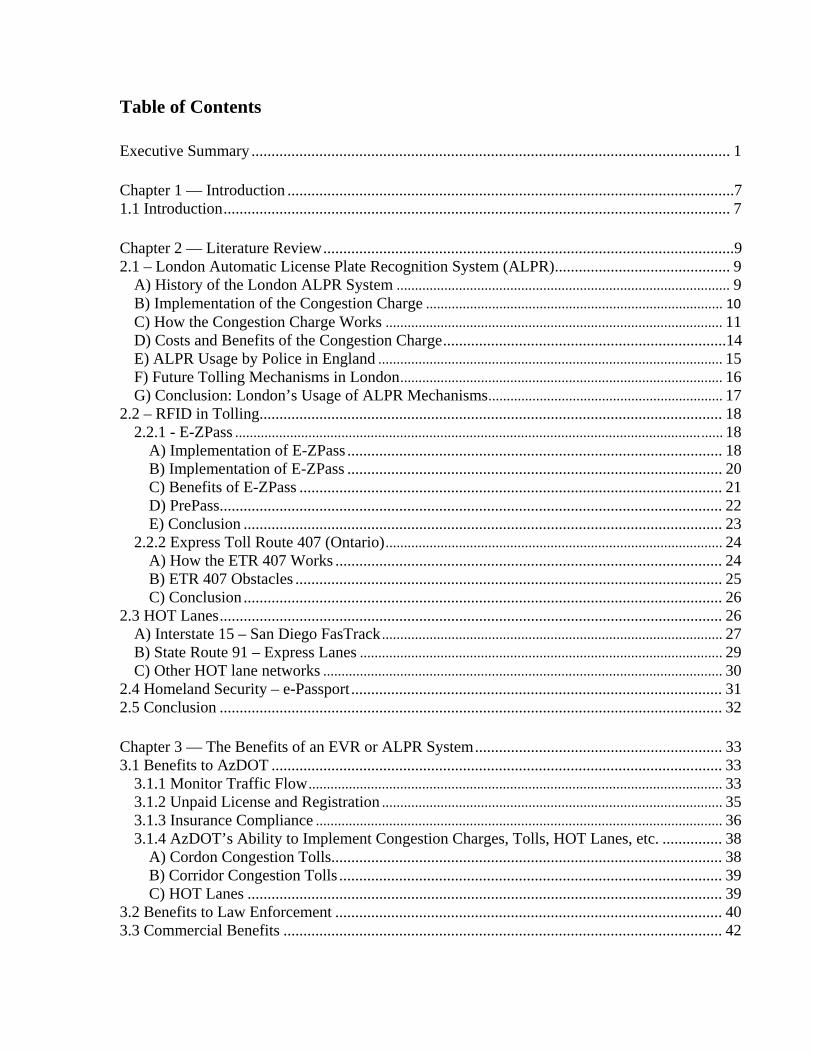
Table of Contents Executive Summary ........................................................................................................................ 1 Chapter 1 — Introduction ................................................................................................................7 1.1 Introduction............................................................................................................................... 7 Chapter 2 — Literature Review.......................................................................................................9 2.1 – London Automatic License Plate Recognition System (ALPR)............................................ 9
A) History of the London ALPR System ........................................................................................... 9 B) Implementation of the Congestion Charge ................................................................................. 10 C) How the Congestion Charge Works ............................................................................................ 11 D) Costs and Benefits of the Congestion Charge.......................................................................14 E) ALPR Usage by Police in England .............................................................................................. 15 F) Future Tolling Mechanisms in London........................................................................................ 16 G) Conclusion: London’s Usage of ALPR Mechanisms................................................................ 17
2.2 – RFID in Tolling.................................................................................................................... 18 2.2.1 - E-ZPass ..................................................................................................................................... 18
A) Implementation of E-ZPass .............................................................................................. 18 B) Implementation of E-ZPass .............................................................................................. 20 C) Benefits of E-ZPass .......................................................................................................... 21 D) PrePass.............................................................................................................................. 22 E) Conclusion ........................................................................................................................ 23
2.2.2 Express Toll Route 407 (Ontario)............................................................................................ 24 A) How the ETR 407 Works ................................................................................................. 24 B) ETR 407 Obstacles ........................................................................................................... 25 C) Conclusion ........................................................................................................................ 26
2.3 HOT Lanes.............................................................................................................................. 26 A) Interstate 15 – San Diego FasTrack ............................................................................................. 27 B) State Route 91 – Express Lanes ................................................................................................... 29 C) Other HOT lane networks ............................................................................................................. 30
2.4 Homeland Security – e-Passport............................................................................................. 31 2.5 Conclusion .............................................................................................................................. 32 Chapter 3 — The Benefits of an EVR or ALPR System.............................................................. 33 3.1 Benefits to AzDOT ................................................................................................................. 33
3.1.1 Monitor Traffic Flow................................................................................................................. 33 3.1.2 Unpaid License and Registration ............................................................................................. 35 3.1.3 Insurance Compliance ............................................................................................................... 36 3.1.4 AzDOT’s Ability to Implement Congestion Charges, Tolls, HOT Lanes, etc. ............... 38
A) Cordon Congestion Tolls.................................................................................................. 38 B) Corridor Congestion Tolls ................................................................................................ 39 C) HOT Lanes ....................................................................................................................... 39
3.2 Benefits to Law Enforcement ................................................................................................. 40 3.3 Commercial Benefits .............................................................................................................. 42
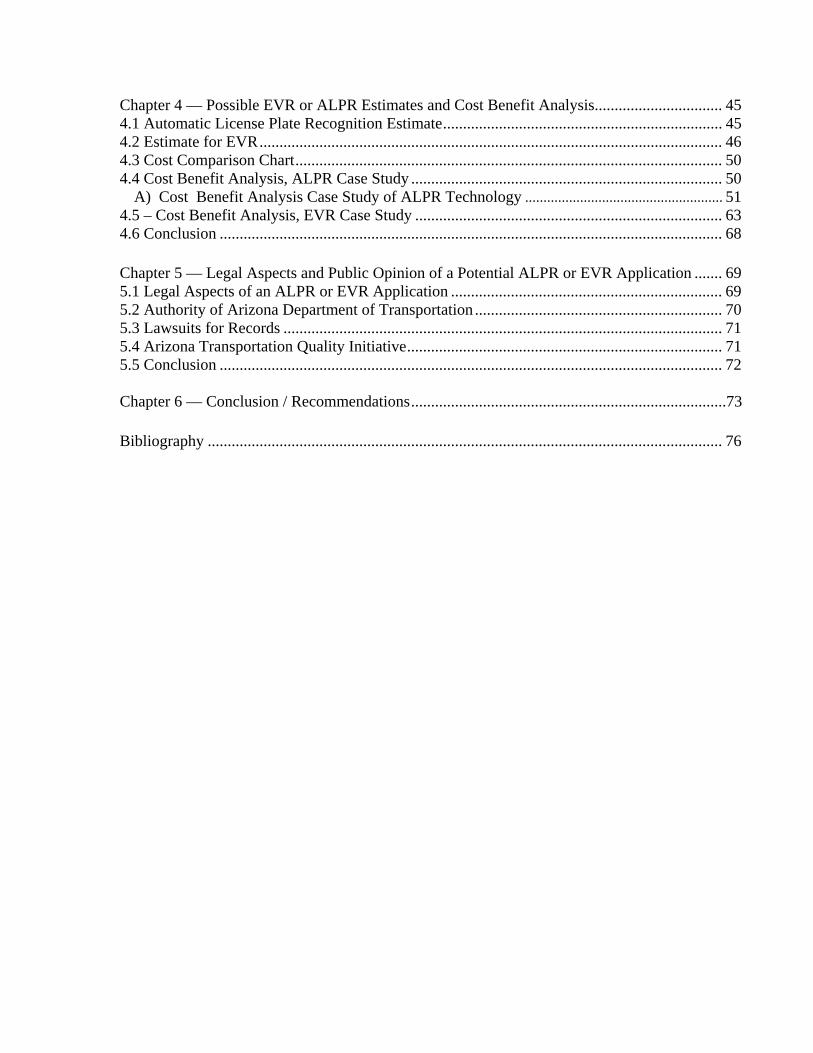
Chapter 4 — Possible EVR or ALPR Estimates and Cost Benefit Analysis................................ 45 4.1 Automatic License Plate Recognition Estimate...................................................................... 45 4.2 Estimate for EVR.................................................................................................................... 46 4.3 Cost Comparison Chart........................................................................................................... 50 4.4 Cost Benefit Analysis, ALPR Case Study .............................................................................. 50
A) Cost Benefit Analysis Case Study of ALPR Technology ...................................................... 51 4.5 – Cost Benefit Analysis, EVR Case Study ............................................................................. 63 4.6 Conclusion .............................................................................................................................. 68 Chapter 5 — Legal Aspects and Public Opinion of a Potential ALPR or EVR Application ....... 69 5.1 Legal Aspects of an ALPR or EVR Application .................................................................... 69 5.2 Authority of Arizona Department of Transportation .............................................................. 70 5.3 Lawsuits for Records .............................................................................................................. 71 5.4 Arizona Transportation Quality Initiative............................................................................... 71 5.5 Conclusion .............................................................................................................................. 72 Chapter 6 — Conclusion / Recommendations...............................................................................73 Bibliography ................................................................................................................................. 76
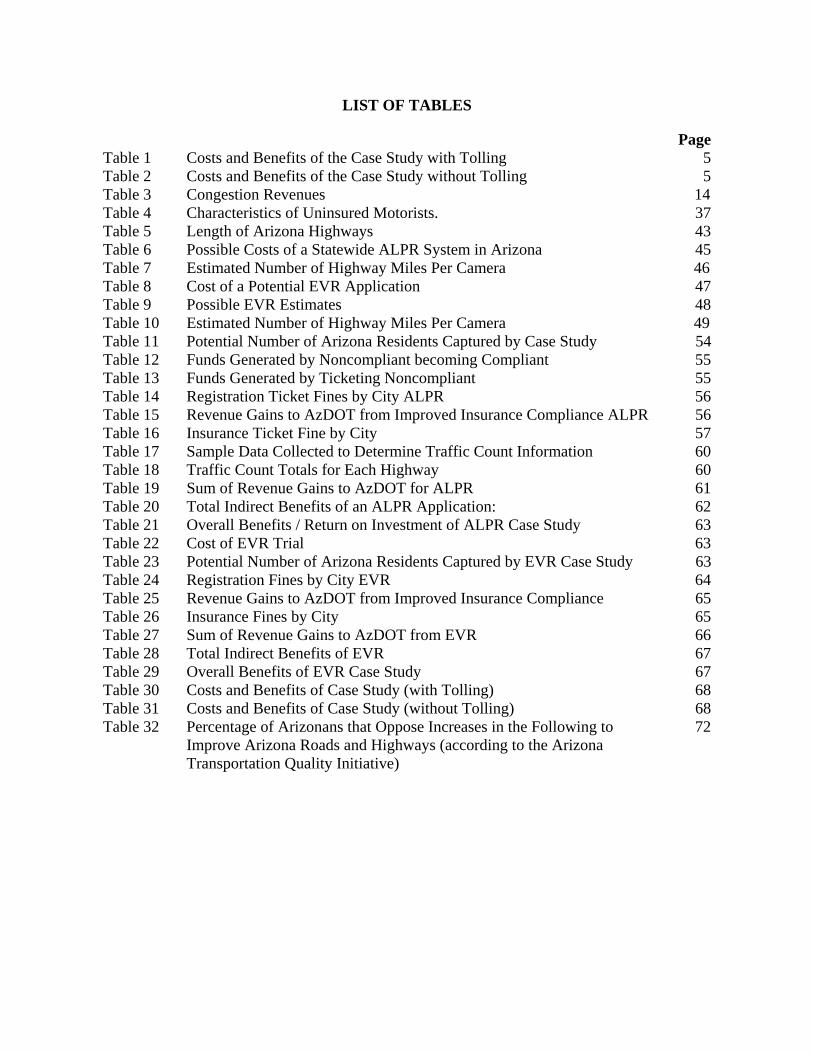
LIST OF TABLES
PageTable 1 Costs and Benefits of the Case Study with Tolling 5Table 2 Costs and Benefits of the Case Study without Tolling 5Table 3 Congestion Revenues 14Table 4 Characteristics of Uninsured Motorists. 37Table 5 Length of Arizona Highways 43Table 6 Possible Costs of a Statewide ALPR System in Arizona 45Table 7 Estimated Number of Highway Miles Per Camera 46Table 8 Cost of a Potential EVR Application 47Table 9 Possible EVR Estimates 48Table 10 Estimated Number of Highway Miles Per Camera 49Table 11 Potential Number of Arizona Residents Captured by Case Study 54Table 12 Funds Generated by Noncompliant becoming Compliant 55Table 13 Funds Generated by Ticketing Noncompliant 55Table 14 Registration Ticket Fines by City ALPR 56Table 15 Revenue Gains to AzDOT from Improved Insurance Compliance ALPR 56Table 16 Insurance Ticket Fine by City 57Table 17 Sample Data Collected to Determine Traffic Count Information 60Table 18 Traffic Count Totals for Each Highway 60Table 19 Sum of Revenue Gains to AzDOT for ALPR 61Table 20 Total Indirect Benefits of an ALPR Application: 62Table 21 Overall Benefits / Return on Investment of ALPR Case Study 63Table 22 Cost of EVR Trial 63Table 23 Potential Number of Arizona Residents Captured by EVR Case Study 63Table 24 Registration Fines by City EVR 64Table 25 Revenue Gains to AzDOT from Improved Insurance Compliance 65Table 26 Insurance Fines by City 65Table 27 Sum of Revenue Gains to AzDOT from EVR 66Table 28 Total Indirect Benefits of EVR 67Table 29 Overall Benefits of EVR Case Study 67Table 30 Costs and Benefits of Case Study (with Tolling) 68Table 31 Costs and Benefits of Case Study (without Tolling) 68Table 32 Percentage of Arizonans that Oppose Increases in the Following to
Improve Arizona Roads and Highways (according to the Arizona Transportation Quality Initiative)
72

LIST OF FIGURES
PageFigure 1 Cost vs Number of EVR/ALPR Systems 4Figure 2 London's "Inner-Ring" 11Figure 3 Western Expansion of the Congestion Charge 11Figure 4 Congestion Charge CCTV Cameras 12Figure 5 A Mobile Enforcement Vehicle 12Figure 6 Symbol Designating the Congestion Charging Zone 13Figure 7 How London's Congestion Charge Works 14Figure 8 An ALPR System Monitors the Roads of Manchester, England 15Figure 9 Canyoning and the Multi-path Reflection Errors in GPS systems 17Figure 10 The Logo for E-ZPass 18Figure 11 States in which E-ZPass is Acceptable Form of Payment 19Figure 12 Pennsylvania-issued E-ZPass 20Figure 13 How the E-ZPass Works 20Figure 14 E-ZPass Lane in Delaware 21Figure 15 How PrePass Works in Conjunction with a WIM System 22Figure 16 Example of a PrePass / E-ZPass System Figure 17 How a Vehicle that does not have a Transponder is Photographed 24
22
Figure 18 Tracking a Motorcycle that Is Maneuvering Evasively between Gantries 24Figure 19 ETR 407's Laser Curtain is Vital 25Figure 20 Interstate 15 FasTrak Location 27Figure 21 Example of an RFID Passport 31Figure 22 Police Cruiser with a Mounted ELPR System 41Figure 23 Components of an ELPR System. 41Figure 24 Valley Freeway System 44Figure 25 Placement of RFID Readers in an EVR Application. 47Figure 26 Cost Comparison Chart 50Figure 27 Arizonans’ Hourly Income 59

Glossary of Acronyms
3M Minnesota Mining & Manufacturing AADT Average Annual Daily Traffic ACIC Arizona Crime Information Center ALPR Automatic License Plate Recognition AMBER America’s Missing: Broadcasting Emergency Response ANPR Automatic Number Plate Recognition AzDOT Arizona Department Of Transportation BMP Beginning Mile Post BOT Build, Operate, and Transfer CAD Canadian Dollars CCTV Closed Circuit Television CNN Cable News Network CPTC California Private Transportation Company DOT Department of Transportation DPS Department of Public Safety DSRC Dedicated Short Range Communication DVLA Driver and Vehicle Licensing Agency ELPR Electronic License Plate Reader ETR Express Toll Route EVR Electronic Vehicle Registration FBI Federal Bureau of Investigation GPS Global Positioning System HOT High Occupancy Free, Others Toll HOV High Occupancy Vehicle IAG Interagency Group ID Identification III Insurance Information Institute IRC Insurance Research Council MOT Ministry of Transportation MVD Motor Vehicle Division NCIC National Crime Information Center OCTA Orange County Transit Authority PD Police Department RFID Radio Frequency Identification ROI Return on Investment SANDAG San Diego Association of Governments TTI Texas Transportation Institute TxDOT Texas Department of Transportation U.K. United Kingdom USD United States Dollars VOC Volatile Organic Compound


1
Executive Summary
Electronic technology such as automatic license plate recognition systems (ALPR) and electronic vehicle registration systems (EVR) have increasingly been used by departments of transportation (DOTs), tolling authorities, and law enforcement to find innovative ways to achieve their unique objectives. This project was commissioned to see if these advanced electronic systems might be beneficial to the Arizona Department of Transportation (AzDOT). This report will primarily focus on ALPR technology and EVR technology as a means to benefit AzDOT. Possible benefits that these technologies could offer AzDOT are: the ability to better enforce registration laws, the ability to better enforce insurance laws, the ability to implement tolls, the ability to acquire more accurate traffic count data, and the ability to aid law enforcement by screening for vehicles associated with crimes.
Literature Review — The Technologies
ALPR
Chapter 2 reviews the literature on ALPR and EVR technologies. ALPR technology utilizes cameras and alphanumerical recognition software to read license plates as they pass.
This technology has been used by Transport for London in implementing the congestion charge. In London, there is a network of cameras that surround what is the most congested part of London, called the charging zone. As vehicles enter the charging zone they pass by ALPR cameras that read the license plates. The London congestion charge is a flat fee of £10.00 (or approximately $20) that road users entering the charging zone must pay daily. No matter how many times the camera systems recognize a particular vehicle each day, each vehicle is only charged once per day. It is each person’s responsibility to either pre-pay the congestion charge, pay the charge the day of entering the charging zone, or pay the day after entering the charging zone. Those that need to pay the congestion charge can do so either online, by text message, by phone, or via collection machines set up within the charging zone. If a road user enters the charging area but does not pay the charge, they are subject to fines up to £100 by mail (approximately $200 in USD). Vehicles of residents that reside in the charging zone receive a 90 percent discount on the charge, while taxis, ambulances, and the disabled are exempt from the congestion charge. One hundred percent of the profits from the congestion charge go towards improving public transportation. According to Transport for London, the annual net income (the annual costs minus the annual expenses) of the congestion charge since 2003 is as follows1:
• 2003: (£58.3 million) (or a loss of $116.6 million USD) • 2004: £45.3 million ($90.6 million USD) • 2005: £96.4 million ($192.8 million USD) • 2006: £106.3 million ($212.6 million USD) • Net Operating Total of £189.7 million ($379.4 million USD)
1 Transport for London. Transport for London Homepage. 28 May 2007 <http://www.cclondon.com/>.

2
ALPR technology has also been used for law enforcement purposes by police in Arizona, in other states in the United States, and in other countries. As a police cruiser equipped with ALPR drives around, the mounted ALPR cameras are constantly reading license plates and then checking the license plate numbers against both the NCIC database (National Crime Information Center) and the ACIC database (Arizona Crime Information Center). These databases contain information about persons wanted by police. If it turns out that the vehicle is listed in the database either for being stolen or for being associated with a person who is suspected of a crime, the computer inside the police car will alert the officer. The $25,000 - $50,000 ALPR systems in squad cars have proven to be effective, and thus the Arizona Department of Public Safety, Phoenix police, Mesa police, Chandler police, Tempe police, and Tucson police all have purchased ALPR systems for squad cars. In fact the Arizona Department of Public Safety has just purchased 20 additional ALPR systems. Note that the ALPR technology used inside squad cars is sometimes referred to as ELPR (electronic license plate readers). ALPR technology and ELPR technology are really one and the same.
ALPR technology was also utilized in a separate effort by law enforcement in the United Kingdom. Law enforcement in the U.K. ran a one-year field test of using ALPR technology in random locations. The test produced some staggering results. In the test, 28 million plates were read by the system. Of that 1.1 million plates came up in at least one of the crime or traffic databases (3.9 percent of the total number of plates read were recognized in one or more databases). Of the 1.1 million flagged, 181,543 vehicles were stopped. This led to 13,499 arrests (7.5 percent of the total stopped), of which 2,263 were for theft or burglary, 3,324 were for driving offenses, 1,107 were for drug offenses, and 1,386 were for automobile-related crime. More than 1,152 stolen vehicles worth £7.5 million were recovered ($15 million USD), £380,000 of illegal drugs were confiscated ($760,000 USD), and £640,000 worth of stolen goods were recovered ($1,280,000 USD). Also 50,910 tickets were given out for minor offenses such as failure to pay for the mandatory Vehicle Excise Duty.2
EVR Technology
EVR technology utilizes radio frequency identification (RFID). RFID tags and RFID readers are the two main components of RFID technology. RFID tags emit a radio frequency that can be read by an RFID reader. RFID technology has become very prevalent as a means of payment for tolls in the United States3, giving easy access to HOT (High Occupancy Toll) lanes. Perhaps E-ZPass is the most well known RFID application in the United States. E-ZPass is a voluntary program that allows toll users to set up a pre-paid account to pay tolls. When an E-ZPass user uses a toll that accepts E-ZPass they enter a special lane. After entering the lane, the user pulls up to an E-ZPass reader. The reader identifies the vehicle and corresponding E-ZPass account, and then the
2 PA Consulting Group. "Driving Crime Down - Official Report for the Home Office." October 2004. Police Home Office Website (UK). (Accessed 4 June 2007) <http://police.homeoffice.gov.uk/news-and-publications/publication/operational-policing/Driving_Crime_Down_-_Denyin1.pdf?view=Binary>. 3 High Occupancy Toll lanes or HOT lanes are similar to HOV lanes, except single-occupancy vehicles can pay a toll to drive in a HOT lane, whereas HOV lanes require all users to be driving with two or more people in a vehicle.
3
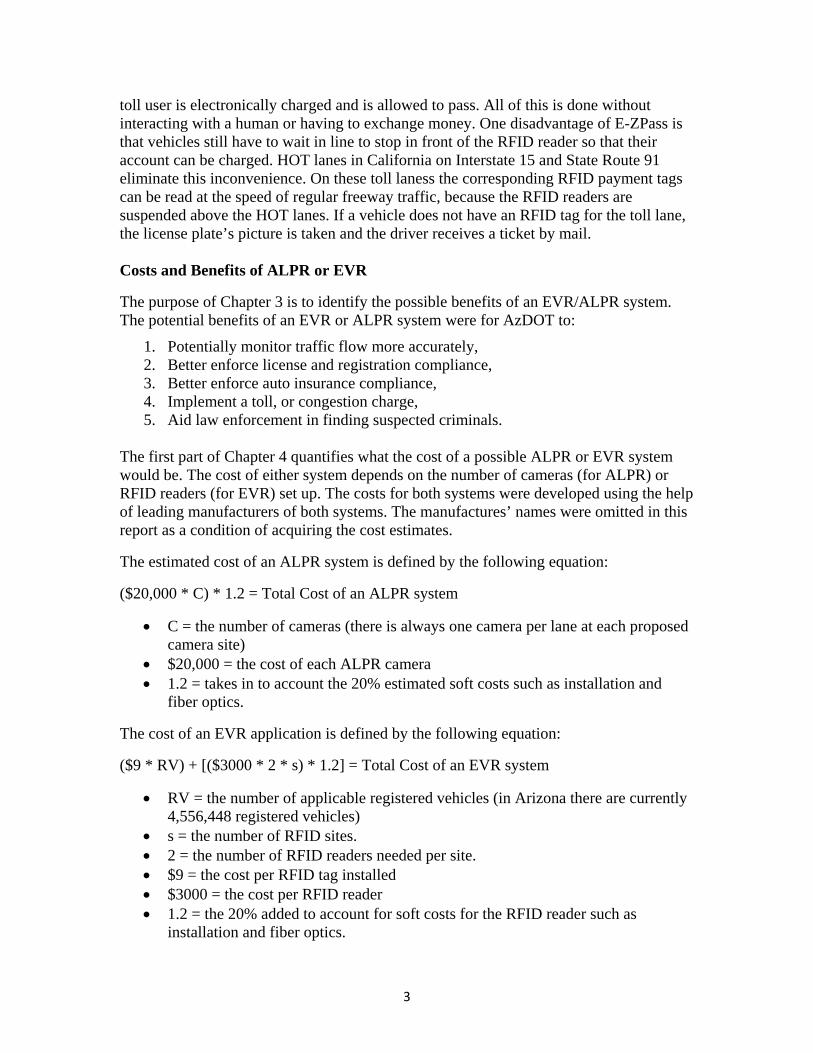
toll user is electronically charged and is allowed to pass. All of this is done without interacting with a human or having to exchange money. One disadvantage of E-ZPass is that vehicles still have to wait in line to stop in front of the RFID reader so that their account can be charged. HOT lanes in California on Interstate 15 and State Route 91 eliminate this inconvenience. On these toll laness the corresponding RFID payment tags can be read at the speed of regular freeway traffic, because the RFID readers are suspended above the HOT lanes. If a vehicle does not have an RFID tag for the toll lane, the license plate’s picture is taken and the driver receives a ticket by mail. Costs and Benefits of ALPR or EVR
The purpose of Chapter 3 is to identify the possible benefits of an EVR/ALPR system. The potential benefits of an EVR or ALPR system were for AzDOT to:
1. Potentially monitor traffic flow more accurately, 2. Better enforce license and registration compliance, 3. Better enforce auto insurance compliance, 4. Implement a toll, or congestion charge, 5. Aid law enforcement in finding suspected criminals.
The first part of Chapter 4 quantifies what the cost of a possible ALPR or EVR system would be. The cost of either system depends on the number of cameras (for ALPR) or RFID readers (for EVR) set up. The costs for both systems were developed using the help of leading manufacturers of both systems. The manufactures’ names were omitted in this report as a condition of acquiring the cost estimates.
The estimated cost of an ALPR system is defined by the following equation:
($20,000 * C) * 1.2 = Total Cost of an ALPR system
• C = the number of cameras (there is always one camera per lane at each proposed camera site)
• $20,000 = the cost of each ALPR camera • 1.2 = takes in to account the 20% estimated soft costs such as installation and
fiber optics.
The cost of an EVR application is defined by the following equation:
($9 * RV) + [($3000 * 2 * s) * 1.2] = Total Cost of an EVR system
• RV = the number of applicable registered vehicles (in Arizona there are currently 4,556,448 registered vehicles)
• s = the number of RFID sites. • 2 = the number of RFID readers needed per site. • $9 = the cost per RFID tag installed • $3000 = the cost per RFID reader • 1.2 = the 20% added to account for soft costs for the RFID reader such as
installation and fiber optics.
4
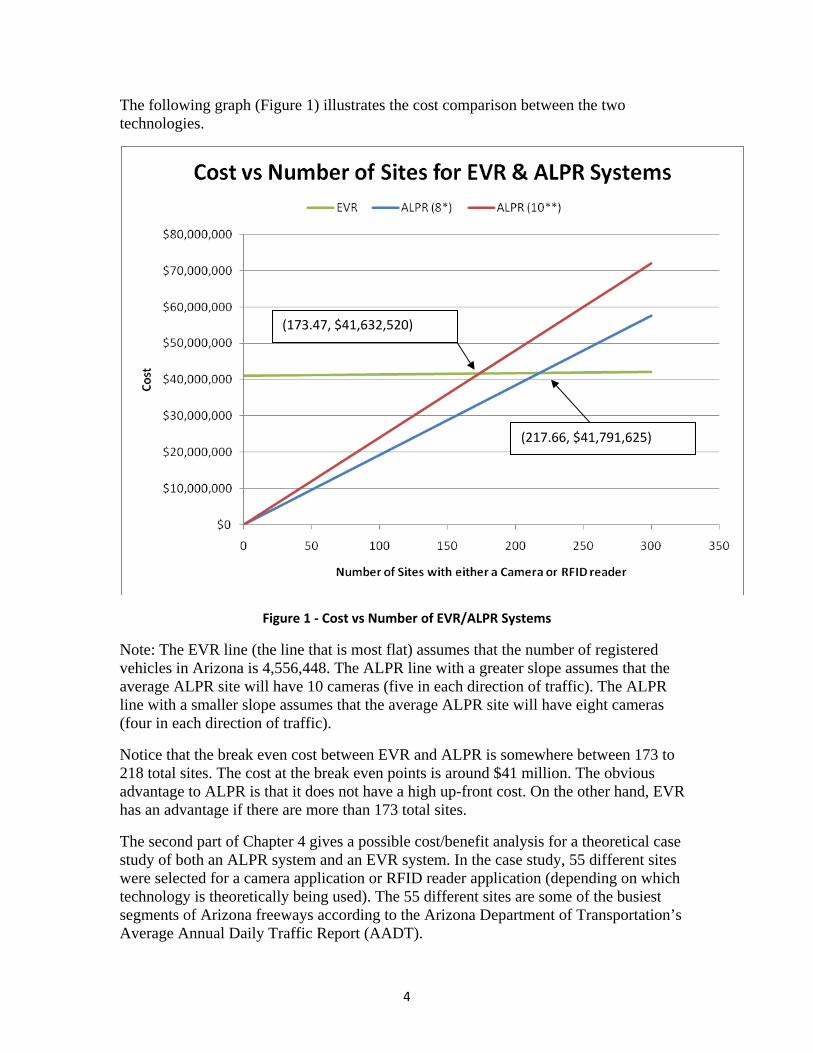
The following graph (Figure 1) illustrates the cost comparison between the two technologies.
Figure 1 ‐ Cost vs Number of EVR/ALPR Systems
Note: The EVR line (the line that is most flat) assumes that the number of registered vehicles in Arizona is 4,556,448. The ALPR line with a greater slope assumes that the average ALPR site will have 10 cameras (five in each direction of traffic). The ALPR line with a smaller slope assumes that the average ALPR site will have eight cameras (four in each direction of traffic).
Notice that the break even cost between EVR and ALPR is somewhere between 173 to 218 total sites. The cost at the break even points is around $41 million. The obvious advantage to ALPR is that it does not have a high up-front cost. On the other hand, EVR has an advantage if there are more than 173 total sites.
The second part of Chapter 4 gives a possible cost/benefit analysis for a theoretical case study of both an ALPR system and an EVR system. In the case study, 55 different sites were selected for a camera application or RFID reader application (depending on which technology is theoretically being used). The 55 different sites are some of the busiest segments of Arizona freeways according to the Arizona Department of Transportation’s Average Annual Daily Traffic Report (AADT).
(217.66, $41,791,625)
(173.47, $41,632,520)

5
For the ALPR case study a total of 416 cameras were proposed for the 55 sites. Each site has one camera for each lane of traffic. The total cost for this proposed ALPR system is $9,984,000 according to the cost formulas. For the EVR case study two RFID readers were used for each site for a grand total of 110 readers. The total cost of the proposed EVR case study is $49,605,638. The next step of the case study was to quantify the benefits so that they can be compared to the costs. The quantifiable benefits that could be measured in the case study were:
1. The potential to levy road usage tolls, or HOT lane tolls, 2. The ability to better ensure registration compliance, 3. The ability to better ensure insurance compliance, 4. The ability to locate stolen vehicles.
Based on these quantifiable benefits, the case study could be conducted. Two types of benefits were measured: revenue gains to AzDOT and benefits to highway users. Revenue gains to AzDOT are benefits that would mean direct income for the State of Arizona such as income from registration or insurance compliance tickets. An indirect benefit would benefit society but would not provide extra income to the state directly. For instance, reducing the number of uninsured drivers reduces the number of uninsured accidents, thus reducing the cost of uninsured accidents to society. The benefit data is split up into two tables; Table 1 lists the total benefits including tolling, and Table 2 lists the total benefits without tolling. All of the benefits listed in the table are reported in dollars per year. The cost reported is the total installation cost.
Table 1 ‐ Costs and Benefits of the Case Study with Tolling
ALPR EVR Cost $9,984,000 $49,605,638 Direct Benefit $399,876,493 $407,468,842 ROI of Direct Benefit 4005% 821% Indirect Benefit $1,302,627,417 $1,335,923,513 Total Benefit $1,702,503,910 $1,743,392,355
Table 2 ‐ Costs and Benefits of the Case Study without Tolling
ALPR EVR Cost $9,984,000 $49,605,638 Direct Benefit $158,547,613 $166,139,962 ROI of Direct Benefit 1588% 335% Indirect Benefit $695,307,417 $728,603,513 Total Benefit $853,855,030 $894,743,475
Legality of an ALPR or EVR System
Chapter 5 investigates the legality of a potential ALPR system or EVR system. The chapter finds that AzDOT does have the authority to implement such a system. However

6
the chapter concludes that AzDOT should seek public approval through the legislature in order to implement such a system.
Conclusion:
ALPR technology was recommended as the technology of choice to accomplish the previously stated goals for AzDOT in the present. ALPR was chosen for the following reasons:
a) ALPR’s Previous Applications – ALPR has been used successfully in London for the congestion charge.
b) The Low Cost of an ALPR Trial vs the High Up-Front Cost of EVR – With ALPR a trial run can be conducted at a low cost. EVR’s high up-front cost makes such a trial not possible.
c) ALPR’s Ability to Read Virtually Any State’s License Plate – ALPR technology can assist Arizona in recovering lost revenue due to Arizona residents using out-of-state plates. EVR would not be able to read out-of-state plates unless the state that issued the plate also required an RFID device be placed in the vehicle. Currently no states utilize EVR technology as a means of enforcing vehicle registration.
d) The Possibility that EVR Technology Will Require ALPR Technology – It’s possible that EVR technology would require a camera system similar to ALPR in order to be effective. This is because it is conceivable that an Arizona resident could tamper with a required RFID tag and disable it.
e) The Potentially Lower Degree of Public Opposition to ALPR – ALPR might be perceived by the public as less intrusive. Thus there might be less overall opposition to ALPR vs EVR.
Both ALPR technology and EVR technology are rapidly progressing in effectiveness and affordability. A change in the technology’s effectiveness, the technology’s affordability, or U.S. policy regarding an RFID standard could change the variables that generated the recommendation for ALPR technology. This report is simply suggesting that, based on the information available today, it appears that ALPR technology should be further researched and implemented, more so than EVR technology.

7
Chapter 1 Introduction
1.1 Introduction Today an increasing number of entities, including departments of transportation (DOTs), tolling agencies, and law enforcement agencies, are looking to advanced electronic technology to meet their increased needs. For instance, DOTs in the United States and abroad have used electronic technology in toll lanes and HOT lanes, while law enforcement agencies have used plate recognition cameras to enforce the law. For the purposes of this study, two types of such electronic plate systems’ costs and benefits will be studied in order to determine their effectiveness if implemented by the Arizona Department of Transportation (AzDOT). The first technology is automatic license plate recognition systems (or ALPR). ALPR is also referred to in Europe as ANPR or automatic number plate recognition systems. For this report, the technology will always be called ALPR. The second technology that will be looked at is radio frequency identification technology or RFID. For the purposes of this study RFID technology will be referred to as EVR or electronic vehicle registration.
Automatic License Plate Recognition Technology (ALPR)
ALPR technology uses a camera along with alphanumerical recognition software to actually read license plates. The cameras use infrared technology so that license plates can be read regardless of the time of day or the weather conditions. This technology has been used by Transport for London in implementing a congestion charge (or toll), it has been used in police cruisers to scan for vehicles associated with warrants, and it has been used to assess tolls at freeway speeds in Ontario, Canada. These examples along with others will be further investigated in the literature review (Chapter 2).
Electronic Vehicle Registration Technology (EVR)
EVR technology uses RFID technology to function. For EVR to work an RFID tag would need to be placed on all registered vehicles. The RFID tag would transmit a given vehicle’s license plate number (its identity). Then an RFID reader at the side of a road or highway could collect and record passing vehicles’ identities (or license plate numbers) transmitted by the vehicles’ RFID tags. The RFID tag would most likely need to be installed on the windshield of a vehicle to work optimally. EVR is currently in the process of being implemented on the island of Bermuda. This will be the first countrywide implementation of an EVR system. Despite this being the first true EVR system, RFID has been used in many tolling applications in the United States and abroad. The most common use of RFID technology in the United States is E-ZPass. An E-ZPass is an RFID tag that is accepted as a method of payment at many toll roads on the east coast of the United States. Acquiring an E-ZPass is totally optional, but is generally a more convenient method of paying tolls for the frequent toll user. Several HOT lanes in California, along with tolls in Canada, also use RFID technology to bill or charge road users. These examples will be further examined in the literature review (Chapter 2).

8
Goals of Research
The purpose of this research is to determine if an electronic license plate system could be useful in meeting some of the needs of AzDOT.
The initial goals of an ALPR system or EVR system are to provide AzDOT with the ability to:
1. Potentially monitor traffic flow more accurately, 2. Better enforce license and registration compliance, 3. Better enforce auto insurance compliance, 4. Implement a toll, or congestion charge, 5. Aid law enforcement in finding suspected criminals.
In order to determine if these goals can be met, this report extensively reviews other applications of ALPR or EVR in the Literature Review (Chapter 2). Then in Chapter 3 the benefits of an Arizona ALPR or EVR system are researched. Chapter 4 determines the potential costs of an ALPR or EVR system in Arizona and analyzes the potential costs vs. the potential benefits. Chapter 5 focuses on the legal aspects of an ALPR or EVR system, while Chapter 6 makes a recommendation on whether an ALPR or EVR system would be beneficial for Arizona.

9
Chapter 2 Literature Review
Today there are no true EVR applications currently in use. Therefore, information on actual EVR applications currently in use is non-existent. However, there is only one country, the island of Bermuda, that is planning a nationwide EVR system to be put into place by July 2008. The 21-square mile island, which has 63,000 residents and 47,000 registered vehicles, will issue windshield sticker tags to residents and businesses. The EVR mechanism would be based on a tamper-resistant eGO sticker placed on a vehicle’s windshield. 3M and Transcore were contracted to create the system that will identify vehicles. After identifying the vehicle, the computer system will validate registration, issue violations, and identify criminal vehicles. The EVR technology’s main purpose would be to automate compliance monitoring and support traffic management initiatives. These were all the details that have been made public so far; however, this is likely to change in the near future.
There has been a wide application of RFID in tolling mechanisms. London’s use of ALPR and the testing of other tolling mechanisms are perhaps the most cutting-edge examples of electronic tolling in use. On the East Coast of the United States, the usage of E-ZPass shows RFID technology’s ability to charge motorists electronically while offering flexibility to motorists traveling across state lines. At the same time, Ontario has combined the benefits of London’s ALPR system with the benefits of the U.S. E-ZPass to create the first open-road tolling mechanism. High Occupancy vehicles free, others Toll (HOT) Lanes throughout the United States have also created an open tolling format for charging road users. These uses of electronic means for tracking transportation are worth looking at when researching the effectiveness of electronic license plate options. Another important issue that needs to be looked at is privacy. Several potential privacy concerns have arisen as a result of using RFID. These subjects will be the basis of the literature review.
2.1 – London Automatic License Plate Recognition System (ALPR) ALPR is a competing technology that is different from RFID. However, similar goals can be achieved with either system. The largest scale use of ALPR is in London. London is far ahead of most of the world in using technology in innovative tolling techniques. London officials are also looking to further upgrade the present ALPR system to an RFID system. Looking even further down the road, Transport for London intends to upgrade to a Global Positioning System (GPS). This makes London a prime example for studying the effectiveness of electronic tolling mechanisms.
A) History of the London ALPR System The first ever ALPR system was installed in London in 1979 at the entrance to the Dartford Tunnel, which is east of London. Its purpose was to detect stolen vehicles and other vehicles of interest and notify police. The first ALPR system was far less

10
sophisticated and far less accurate than the ALPR systems of today, but it’s worth noting that the people of London are more accustomed to the appearance of ALPR systems and camera systems throughout the city. Nothing major came of this first experiment until much later.
In the early 1990s, the United Kingdom was trying to solve two problems. The first was the worsening congestion in cities such as London. The second was the way taxes were collected for roads. Much like the United States, the United Kingdom and European Union charge a fuel tax in order to help with the building of future roads and the maintenance of existing roads. One problem with this tax is that it is not indexed for inflation, and when the tax is increased, it is met with taxpayer resistance. One way the U.K. attempted to deal with the problem of the fuel tax was by creating a Fuel Duty Escalator.4 The goal of the Fuel Duty Escalator was to increase the fuel tax ahead of inflation. The annual increase of gas taxation was introduced in 1993 at a rate of 3 percent ahead of inflation. This rate was later upped to 5 percent, until in 2000 the Fuel Duty Escalator Tax was done away with due to widespread protest throughout the U.K.
In the mid-1990’s London sought to solve its own congestion problems ahead of any countrywide solution. The Government of London sought to weigh the benefits and costs of a congestion charging program. In July 1995, the London Congestion Research Programme’s report was released by the Government Office for London. This research found that a congestion charge for London would be favorable in terms of a reduction in traffic congestion. However, the research report found that “whilst electronic technologies are already available which have many of the necessary features, no system exists at present which would operate in London's traffic conditions or would be acceptably unobtrusive,” according to a Department of Transport summary.5 The report also pointed out that there would be great administrative challenges in any electronic system and that the system would have to gain the support of the people of London to be successful. In 1999, in part because of technological advances and the advice of the London Congestion Research Programme, Parliament passed the Greater London Authority Act of 1999 which gave the next Mayor of London the power to impose a congestion charge.
B) Implementation of the Congestion Charge The newly elected mayor in 2000, Mayor Ken Livingstone, published a proposed Transport Strategy that included a congestion charge in January 2001. Input both from the public and from Transport for London led to a final Transport Strategy, which was published on January 18, 2002. As a result of this Transport Strategy, London became one of the first municipalities worldwide to use ALPR on a large scale when it implemented a congestion charge to the busiest part of the city. The congestion charge was introduced in central London on February 17, 2003. The original area affected by the congestion charge is demonstrated in Figure 2. The congestion charge was extended in
4 Bayliss, David. "Road User Charging and Taxation." Proceedings of the Institution of Civil Engineers. Thomas Telford, 2006. 147-152. 5 Department of Transport. City Congestion Charging in London. 29 June 2007 <http://www.dft.gov.uk/pgr/regional/policy/archive/urbanandlocaltransportcompen3715?page=6>.

11
2007 to include parts of west London (demonstrated by Figure 3). The total size of the charging zone is 40 square kilometers (about 15.5 square miles).
Figure 2 - London's "Inner-Ring" is shown by the red shaded area on the map. This was the first area
affected by London's congestion charge in 2004.
Figure 3 - Western Expansion of the Congestion Charge. The left side of the shaded figure demonstrates the western expansion of the congestion charge. This map is provided by Transport for London, www.tfl.gov.uk.
C) How the Congestion Charge Works The congestion charge was initially £5.00 per day (or approximately $10, but it was increased to £8.00 per day (or $16) on July 4, 2005. Since then, it has been announced by the mayor that in 2008 the charge will be increased again to £10.00. The charge is

12
applicable to most vehicles entering the congestion charging zone between 7:00 AM and 6:00 PM, Monday through Friday (except on holidays). Exemptions to the congestion charge are granted to the disabled, motor-cycles, and alternative fuel vehicles. Furthermore, residents that live within the congestion charging zone are granted a 90 percent discount when they register their vehicles with Transport for London.6
Vehicles entering the congestion zone are monitored by Closed Circuit Television (CCTV) cameras positioned around entry points of the congestion zone. Stationary CCTV cameras and mobile CCTV cameras are positioned within the charging zone as well. When the congestion charge began, about 700 cameras were situated in and around the charging zone. This breaks down to 150 static camera sites (see Figure 4) around the charging zone, 52 static camera sites within the charging zone, and 10 mobile cameras (see Figure 5) within the zone (more than one camera is located at any camera site).7 Unfortunately, more up-to-date information on the camera breakdown within the expanded congestion charging zone is not available.
According to a news article by the BBC before the technology went into effect, the cameras are calibrated to be pointing toward the middle of a traffic lane toward the front number plate, and they take four still, black and white photographs per second. Infra-red reflectors are flashed while the photograph is being taken to help pick out the number plates.8 The number plates in the U.K. for the most part are reflective so they are picked up relatively well by the cameras. The reason the cameras take photographs of the front plate is because in the U.K. they are centrally located on all vehicles, whereas back plates can be on either side or in the center of the vehicle. After the photographs have been taken, they are sent to a central computer system that identifies the plates using the ALPR recognition system. The system is not completely foolproof; in reality it only recognizes the plate 70 to 80 percent of the time.9 There are several reasons the ALPR system might not be able to identify a vehicle plate. First, a road user may be tailgating the car ahead and thus his/her front number plate is not visible. Second, it might also be the case that there may be a commercial truck in
6 Transport for London. Transport for London Homepage. 28 May 2007 <http://www.cclondon.com/>. 7 "Congestion Charging: In London." BBC News. (Accessed 4 June 2007.) <http://news.bbc.co.uk/2/shared/spl/hi/uk/03/congestion_charge/exemptions_guide/html/works.stm>. 8 Symonds, Tom. "Preparing for Congestion." BBC News. 5 June 2007 <http://news.bbc.co.uk/1/hi/uk/2748319.stm>. 9 Evans, Jeremy and Dan Firth. "Transport for London, Congestion Charging Technology Trials, Stage 1 Results." 12th World Congress on Intelligent Transport Systems. San Francisco: ITS America, 2005.
Figure 4 ‐ Congestion Charge CCTV cameras near Vauxhall Bridge. Photo provided by Transport for London.
Figure 5 ‐ A mobile enforcement vehicle is used to photograph number plates within the London congestion charging zone. Photo provided by Transport for London.

13
front of a compact car and thus the compact car’s front number plate is out of sight of the camera. Third, the ALPR system might pick up other text on a vehicle, like a bumper sticker or an advertisement for a service truck. Some road users purposely put bumper stickers that look like number plates to fool the ALPR system. Sometimes this works, sometimes it doesn’t, because photographs such as these may be flagged and identified manually by a human. Fourth, the ALPR system may miss a car’s number plate because the driver is changing lanes as the photograph is being taken. Fifth, a number plate may be simply dirty and thus unrecognizable to the ALPR system. Lastly, drivers may apply films over their number plate to try to obscure the appearance of their number plate despite the fact that this practice is illegal.10 Despite all of the factors that might make a number plate unreadable, the congestion charge is still effective since the charge is only assessed once to any given vehicle per day. Thus, a vehicle only needs to be photographed and recognized once for the system to be effective.
After a vehicle has entered the charging zone (see Figure 6), it is up to the driver to pay the charge; no bill will be sent to the driver. The driver has a variety of options to pay the charge. If the driver is paying on the day that he/she entered the congestion charging zone payment can be sent online, via text message, via a designated pay station (there are several throughout London, at retail stores and gas stations), or via telephone. The driver also has the option to pay the charge the following day by calling the call center or by paying online. There is a £2 surcharge for paying the day after (currently, this amounts to a total charge of £10 for entering the congestion charging zone).
By midnight of the day after a given charging date, all of the recognized number plates are consolidated to get rid of duplicates. Payments are matched with the recognized plates and are exempted from any ticket. Normally exempted vehicles (taxis, vehicles of the handicapped, buses, etc) are also removed from the pool that will receive tickets. For the remaining vehicles, tickets are issued via the Driver and Vehicle Licensing Agency (DVLA) records. Payments for vehicles that were not recognized by ALPR on the day of the congestion charge are not refunded or credited to a vehicle’s future days. Therefore if a road user always pays the congestion charge, the road user never really knows if their vehicle was photographed and recognized by the system. To deter drivers from not paying the charge, heavy penalties are in place for non-payment. Vehicles that should have paid but did not do so are issued a Penalty Charge Notice of £100 (approximately $200). Prompt payment within 14 days leads to a reduction in the charge to £50. Failure to pay the charge after 28 days results in the penalty being increased to £150. Further non-payment of the charge can lead to further legal action and the possibility of the vehicle being immobilized.11 It is worth noting that to enforce payment, foreign number plates are difficult to impossible. This is because foreign countries have very little
10 "Congestion Charging: In London." BBC News. 4 June 2007 <http://news.bbc.co.uk/2/shared/spl/hi/uk/03/congestion_charge/exemptions_guide/html/works.stm>. 11 Transport for London. Transport for London Homepage. 28 May 2007 <http://www.cclondon.com/>.
Figure 6 ‐ Symbol designating the congestion charging zone in London. Photo provided by Transport for London.
14
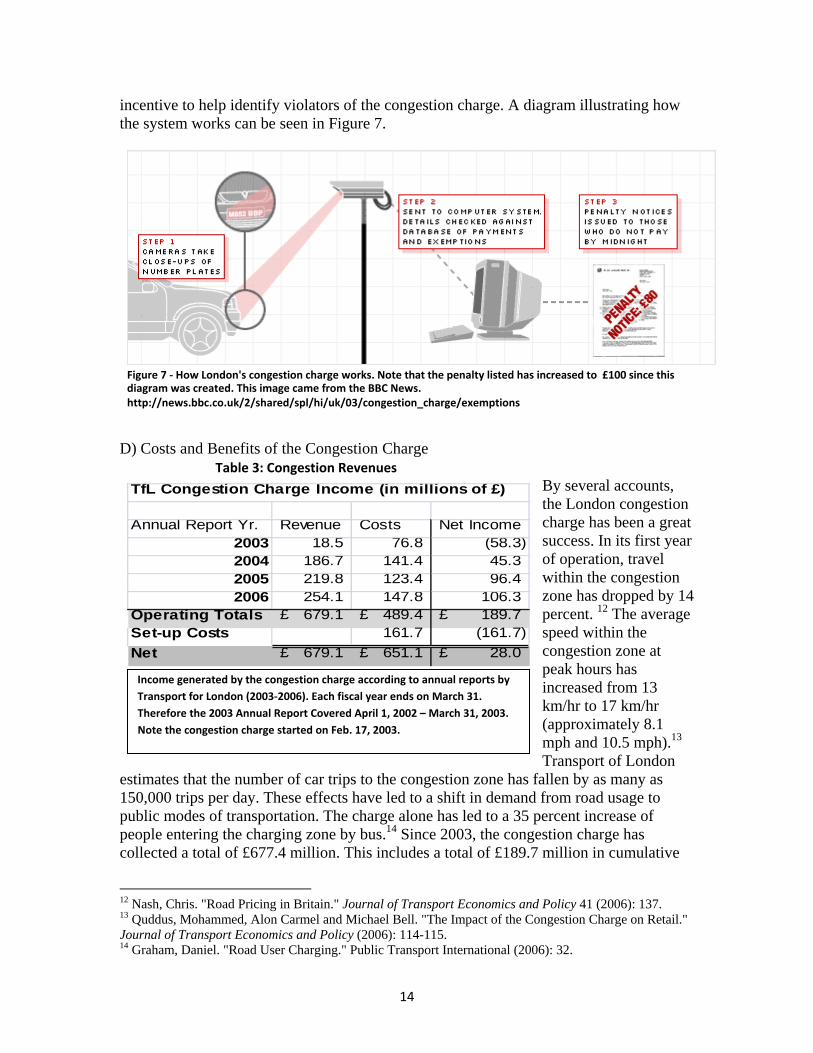
incentive to help identify violators of the congestion charge. A diagram illustrating how the system works can be seen in Figure 7.
D) Costs and Benefits of the Congestion Charge Table 3: Congestion Revenues
By several accounts, the London congestion charge has been a great success. In its first year of operation, travel within the congestion zone has dropped by 14 percent. 12 The average speed within the congestion zone at peak hours has increased from 13 km/hr to 17 km/hr (approximately 8.1 mph and 10.5 mph).13 Transport of London
estimates that the number of car trips to the congestion zone has fallen by as many as 150,000 trips per day. These effects have led to a shift in demand from road usage to public modes of transportation. The charge alone has led to a 35 percent increase of people entering the charging zone by bus.14 Since 2003, the congestion charge has collected a total of £677.4 million. This includes a total of £189.7 million in cumulative
12 Nash, Chris. "Road Pricing in Britain." Journal of Transport Economics and Policy 41 (2006): 137. 13 Quddus, Mohammed, Alon Carmel and Michael Bell. "The Impact of the Congestion Charge on Retail." Journal of Transport Economics and Policy (2006): 114-115. 14 Graham, Daniel. "Road User Charging." Public Transport International (2006): 32.
Figure 7 ‐ How London's congestion charge works. Note that the penalty listed has increased to £100 since this diagram was created. This image came from the BBC News. http://news.bbc.co.uk/2/shared/spl/hi/uk/03/congestion_charge/exemptions
TfL Congestion Charge Income (in millions of £)
Annual Report Yr. Revenue Costs Net Income2003 18.5 76.8 (58.3) 2004 186.7 141.4 45.3 2005 219.8 123.4 96.4 2006 254.1 147.8 106.3
Operating Totals 679.1£ 489.4£ 189.7£ Set-up Costs 161.7 (161.7) Net 679.1£ 651.1£ 28.0£
Income generated by the congestion charge according to annual reports by Transport for London (2003‐2006). Each fiscal year ends on March 31. Therefore the 2003 Annual Report Covered April 1, 2002 – March 31, 2003. Note the congestion charge started on Feb. 17, 2003.

15
operating income that just covers the £161.7 million set-up costs of the congestion charge system.15 By law, all of the surplus pounds generated by the congestion charge’s operating income must be reinvested into London’s transport system. Transport 2000 estimates that 29,000 additional bus passengers are entering the zone on the 560 additional bus runs offered as a result of the additional funding from congestion charging.12 The extra funding has also helped pay for hybrid buses, resulting in a 31 percent drop in carbon dioxide emissions by buses.12
As far as other pollutants are concerned, Transport for London says that there has been a 13percent reduction in nitrogen oxide, a 15 percent reduction in particulate matter, and a 16 percent reduction of carbon emissions since the congestion charge was put into effect.12 This is in large part due to the public seeking alternative modes of transportation. Whether it’s riding a bike, taking a bus, or using the subway, alternative modes of transportation lead to much lower emissions. This in turn decreases the negative externalities imposed on those that live within the charging zone. A less publicized side effect of the congestion charge is the effect it has had on general safety. According to Transport for London, the £42 million supplementary investment on safety (provided by the congestion charge), has resulted in a 40 percent decrease in serious injuries or fatalities, and a 40 to70 percent reduction in private vehicle crashes. The £42 million have been used to increase the number of cameras, increase traffic calming measures and increase the number of safety campaigns throughout the city.
Although many feared the congestion charge would hurt retailers, in fact it has not significantly hurt the majority of retailers. A recent study in the Journal of Transport Economics and Policy found that retailers as a whole were not significantly affected by the congestion charge in the long term. The study found that in most cases any downturn in business had more to do with cyclical economic factors than the congestion charge.16
E) ALPR Usage by Police in England ALPR is also used by police forces in the United Kingdom for crime enforcement (see Figure 8). However, crime enforcement is not linked directly to the congestion-charge ALPR cameras. Police operations are run on separate cameras throughout the United Kingdom. These crime cameras’ only job is to crosscheck recognized number plates with the Driver and Vehicle Licensing Agency (DVLA) database, the Police National Computer and the intelligence 15 "Congestion Charge." 2007. BBC News. 4 June 2007 <http://www.bbc.co.uk/london/content/articles/2006/11/21/congestion_update_feature.shtml>. 16 Quddus, Mohammed, Alon Carmel and Michael Bell. "The Impact of the Congestion Charge on Retail." Journal of Transport Economics and Policy (2007): Vol. 41, pp. 114-115.
Figure 8 ‐ An ALPR system monitors the roads of Manchester, England, checking motorists identity compared to three databases. Photo courtesy of MSNBC. http://www.msnbc.msn.com/id/15221111/

16
computer system. Crime-scanning ALPR cameras have been highly praised by police forces throughout the U.K., have produced staggering numbers of arrests and have recovered millions of pounds in stolen property. For instance, throughout the U.K, 23 police forces evaluated the use of ALPR in a one-year field test. In the test, 28 million plates were recognized, of which 1.1 million plates came up in one of the databases (3.9 percent of the total number of plates read were recognized in one database or more). Of the 1.1 million flagged, 181,543 vehicles were stopped. This led to 13,499 arrests (7.5 percent of the total stopped), of which 2,263 were for theft or burglary, 3,324 were for driving offenses, 1,107 were for drug offenses, and 1,386 were for auto crime. More than 1,152 stolen vehicles worth £7.5 million were recovered, £380,000 of illegal drugs were confiscated, and £640,000 worth of stolen goods were recovered. Also 50,910 tickets were given out for charges stemming mainly from failure to pay for the Vehicle Excise Duty, insurance coverage, or MOT (Ministry of Transportation) taxes.17 Although the usage of ALPR by police has been highly successful in locating serious crime offenders, the public is very critical of its usage to hand out citations for minor offenses. Thus, ALPR usage by police is still a very controversial and contested issue in England.
F) Future Tolling Mechanisms in London Despite the overall success of the ALPR initiated congestion charge and police scanning, there are problems with relying only on ALPR technology. First, the evidential integrity of digital photography can be questionable. It is well known that images can be digitally manipulated and thus they may not satisfy the evidential requirements of the courts. Second, an ALPR system generates high volumes of data that need to be retained, which in the end costs money. Last, the cost of telecommunications and fiber optics for an extensive ALPR are very expensive to initially construct and maintain for a long term. These problems have led Transport for London to test various other technologies such as RFID technology (also known as “tag and beacon” technology), infra-red Dedicated Short Range Communication (DSRC), satellite positioning, and digital mobile telephony.18 Of these technologies Transport for London is hoping to implement the tag and beacon or RFID technology by 2009. Transport for London also hopes to implement a satellite GPS by 2014.19 A tag and beacon system would give road users the option to carry a credit card-sized RFID transmitter in the car that would act as a debit card for tolling and congestion charging purposes. When a road user would enter the congestion charging zone, he/she would pass under the RFID receiver and his/her account would be debited. If the road user did not have an RFID transmitter, the ALPR system would still be able to photograph the road user’s number plate and the road user could pay the congestion charge the same way it is presently paid. The advantages of having the RFID receiver would be that it would be less likely that a driver would be charged a penalty for forgetting to pay the congestion charge. Also a driver carrying a RFID transmitter would 17 PA Consulting Group. "Driving Crime Down - Official Report for the Home Office." October 2004. Police Home Office Website (UK). <http://police.homeoffice.gov.uk/news-and-publications/publication/operational-policing/Driving_Crime_Down_-_Denyin1.pdf?view=Binary>. (Accessed 4 June 2007. 18 Evans, Jeremy and Dan Firth. "Transport for London, Congestion Charging Technology Trials, Stage 1 Results." 12th World Congress on Intelligent Transport Systems. San Francisco: ITS America, 2005. 19 Webster, Ben. "Electronic Tags for Cars as Congestion Charge Spreads Out." 22 February 2006. Times Online. <http://www.timesonline.co.uk/tol/news/article733481.ece>. (Accessed 5 June 2007.)

17
be able to take advantage of variable congestion charging rates that Transport for London is looking at implementing (as opposed to paying a flat charge). For instance, the driver might get a discount for entering the charging zone after 10 AM as opposed to 8 AM. Another major advantage to the tag and beacon system is that it is reputed to have a 99.55 percent accuracy rate in tests performed by Transport for London.20 Further into the future, London, along with the U.K. in general and many other European countries, are looking to GPS satellite tolling as a standard. This would allow any given government to charge road users by the mile for their travels. Although GPS is readily available today, the technology is not accurate enough according to tests run by Transport for London. However, it is estimated that it will be ready by 2014. One problem cited in the tests is “canyoning.”(See Figure 9.) Canyoning is when a large building or other obstructions prevent a clear path between a GPS receiver and a satellite. The cause of canyoning is the relatively few satellites currently available to accurately determine a GPS receiver’s position. Another problem is that GPS has a tendency to reflect signals off of tall buildings. One weakness of current GPS technology is its inability to pinpoint the exact position of a moving object. When GPS was tested by Transport for London, the average location error was 9.7 meters (about 32 feet). Also in the tests, the GPS only had a confidence level of 75 percent when a vehicle was given a 14-meter buffer zone; the GPS had a 90 percent confidence level if the buffer zone was 28 meters; and finally, the GPS had a confidence level of 99 percent if the buffer zone was 57 meters. This means if today a GPS receiver were positioned exactly on the congestion charging border, it is probable that 1 percent of cars would be mistakenly considered to be within the congestion charging zone when really they were 57 meters or more away from it. The current buffer zone that would be necessary is too large, but inevitably the technology will get better in the future as more satellites are launched and the GPS transmitters become more accurate. G) Conclusion: London’s Usage of ALPR Mechanisms In retrospect ALPR has been a good choice for London in the times it was implemented. Many today are criticizing London’s expansion of the ALPR congestion charging system into western London when the system may be replaced by tag and beacon technology in less than two years. However, Transport for London argues that the cameras will still be 20 Evens, Jeremy and Dan Firth. "Transport for London, Congestion Charging Technology Trials, Stage 1 Results." 12th World Congress on Intelligent Transport Systems. San Francisco: ITS America, 2005.
Figure 9 ‐ This figure demonstrates canyoning and the multi‐path reflection errors in GPS systems. Image courtesy of “Transport for London, Congestion Charging Technology Trials, Stage 1 Results” final report.

18
needed to back up the future tag and beacon technology. Therefore, in its point of view, the money to finance west London’s ALPR system is not being wasted.21 Many have also criticized London’s congestion charge because although it is accepted by the people who live inside London, it is really paid by the people who live outside of London. Thus, the majority who pay the charge have no political voice in whether the charge should exist in the first place. No matter how you view the congestion charge, the charge has generated a large surplus in just a little time, and the money is being used for improving the current public transportation system. The charge has also reduced London’s original problem of congestion in the heart of London. It has helped road users realize the negative externalities they impose by driving during the charging period and thus has increased patronage to public transportation. Also ALPR has helped police locate large numbers of serious crime offenders in little time.
2.2 – RFID in Tolling
2.2.1 - E-ZPass The largest usage of highway RFID technology in the United States is undoubtedly E-ZPass (see Figure 10). E-ZPass is a tolling mechanism used mostly on the northeast coast of the United States. The E-ZPass itself is an RFID transponder that emits a radio frequency identifying a given road user. When a road user drives through a tolled location, the road user is charged for the toll electronically. Just like that the road user is through the tolled location, without as much as a stop to pay the toll.
A) Implementation of E-ZPass Prior to the wide usage of E-ZPass, separate electronic tolling programs were being used throughout the United States. For instance, Massachusetts had Fast Lane/MassPass, Virginia had Smart Tag, Illinois had I-Pass, Maine had TransPass, Maryland had M-Tag, and New York has had E-ZPass. All of these states clearly saw the benefits that could arise from an electronic RFID tolling method. However, the problem with all of the states having different passes was that if a given road user traveled between states, he/she would need a separate pass for each state. This would be quite a burden to frequent interstate drivers considering how close these states are to each other. Not to mention, it would make quite a spectacle to have four or five different passes attached to one car windshield.
Luckily for those drivers, northeastern states collectively sought a standard tolling mechanism. In 1990 the Interagency Group (IAG) was formed by seven independent northeastern tolling agencies. It was their goal to come up with the electronic tolling standard. In the mid-1990’s that standard became a reality throughout the northeastern U.S.22 Many states did not change the name of their pass despite it becoming E-ZPass compatible. Massachusetts for instance calls their pass Fast Lane, but really the pass is an
21 "C-charge plans 'will waste £166m'." 21 June 2006. BBC News. <http://news.bbc.co.uk/1/hi/england/london/5098642.stm>. (Accessed 7 June 2007.) 22 Inter Agency Group. Inter Agency Group - E-ZPass. 2005. 1 June 2007 <http://www.e-zpass.info/index5.htm>.
Figure 10 ‐ The logo for E‐ZPass. It designates E‐ZPass lanes across the northeastern United States.

19
E-ZPass and is compatible with any other E-ZPass charging toll. The merging of the majority of northeastern states to one pass has led more than 14 million motorists to acquire an E-ZPass. Today, 60 percent of all U.S. tolls are paid by some form of electronic collection.23 As of 2007, states that use E-ZPass include New Jersey, Delaware, Maryland, Maine, New Hampshire, New York, Pennsylvania, West Virginia, Massachusetts, and Illinois (see Figure 11). Both Ohio and Indiana are planning on providing E-ZPass as a form of toll payment in the near future.24
Figure 11 - States in which E-ZPass is an acceptable form of payment. Note that both Indiana and Ohio will have E-ZPass in the near future. Photo provided by the Pennsylvania Turnpike - http://www.paturnpike.com/ezpass/pdf/IAG_E-ZPASS_M
Registration for E-ZPass varies by state. Generally one would register for an EZ-Pass in his/her own state. In most states the E-ZPass account is a debit account that must be preloaded by the user; in other states commercial accounts are credit accounts and the road user is billed at the end of the month. For instance in Pennsylvania, companies that spend $1000 or more per month on E-ZPass expenses may register for a commercial
23 Samuel, Peter. "Technologies Will Work in Parallel." World Highways. (2005): 54-55. 24 E-ZPass New York Service Center. E-ZPass Information. 1 June 2007 <http://www.e-zpassny.com/static/info/index.shtml>.

20
credit account (see Figure 12). Individuals in Pennsylvania, regardless of how much they spend on E-ZPass, must preload their E-ZPass account. Most states require that a minimum deposit be made to an E-ZPass account and that some form of administrative/equipment fee be paid on a periodic basis. In Pennsylvania, a $25 deposit must be placed on a new E-ZPass account (this is the money used to pay tolls), and then a $3 non-refundable annual charge must be paid by the user. No interest is paid on account balances or deposits; paper statements are available for a fee. Pennsylvania E-ZPass card holders can view their account breakdown online. Pennsylvania E-ZPass holders have two options for reloading their card:They can do it manually every time their account balance falls below $15, or they can do it automatically by registering a credit card to replenish the E-ZPass.25 All other states maintain and replenish E-Z Pass accounts similarly.
B) Implementation of E-ZPass So how does E-ZPass work? As Figure 13 illustrates, first a vehicle with an E-ZPass mounted in the upper left hand corner of the vehicle pulls up to one of the specially marked E-ZPass tolling lanes. The E-ZPass tag is a Mark IV active RFID tag that is activated by an antenna above the vehicle on the tolling structure. As the vehicle approaches the E-ZPass booth, the vehicle must proceed at a low speed of 5 mph. An RFID receiver reads the RF signal emitted by the E-ZPass. Then the vehicle is allowed to proceed through the toll location. After the vehicle is recognized, the driver’s account is charged electronically. For enforcement purposes, some booths have traffic gates that open after the E-ZPass is recognized, others have cameras that photograph vehicles that don’t have a recognizable E-ZPass on board. Vehicles that don’t have an E-ZPass on board are issued a ticket. Vehicles that aren’t recognized but that do have an E-ZPass account in good standing are generally charged an administrative fee for the cost of someone manually charging their 25 Pennsylvania Turnpike Commission. PA Turnpike E-ZPass Agreement. 4 June 2007 <http://www.paturnpike.com/ezpass/personalterms.htm>.
Figure 13 ‐ This diagram shows how the E‐ZPass works. This image courtesy of www.howstuffworks.com.
Figure 12 ‐ A Pennsylvania‐issued EZ‐Pass. Photo courtesy of Pennsylvania Turnpike Commission. http://www.paturnpike.com/ezpass/visual.htm

21
E-ZPass account using a photographed license plate.26 It is important to note that again the rules vary slightly by transit authority.
C) Benefits of E-ZPass The greatest benefit E-ZPass brings to road users is convenience and customer satisfaction. E-ZPass is simple to install, simple to maintain, and simple to use. E-ZPass members receive discounts at many tolls for their low maintenance trip through the toll booths. For example, in New York users of the Metropolitan Transit Authority (MTA) bridges and tunnels receive a $.50 to a $1 discount at all tolling sites. Also many transit authorities offer road users even larger discounts if they purchase a pre-paid monthly or yearly commuter plan. This is convenient for commuters that use the same toll road on a frequent basis. Transit authorities also offer discounts to residents that live near a toll road. Another advantage of E-ZPass is that E-ZPass lanes move much quicker as users are able to drive slowly through them instead of having to stop and pay. For added convenience, those traveling to JFK, LaGuardia, Newark Liberty, or Albany airports can use E-ZPass as a form of payment for parking. It’s easy to see that for the commuter or casual toll road user, the time savings and monetary savings far outweigh the cost of any administrative charges of E-ZPass. Making this obvious are the 14 million transponders that road users have requested and use. However, it’s not just road users that benefit from E-ZPass, it’s also the transit authorities and the local governments that benefit.
Transit authorities and the surrounding community greatly benefit from E-ZPass. Transit authorities are easily able to collect over $1.3 million annually with E-ZPass. 27 E-ZPass also allows transit authorities to charge variable tolls very easily. This allows the transit authorities to give incentives to different vehicles or to commuters who drive at different times. For instance, hybrid cars in New York can apply for a 10 percent discount off of the E-ZPass toll. Also, several of the tunnels and bridges that lead to New York City offer a $1 discount for drivers that enter the toll road during an off-peak time of the day. Many toll roads charge a different toll depending on the number of axles a vehicle has. With the help of sensor strips in the tolling lane E-ZPass can quickly charge the road user the correct amount. Without E-ZPass it would take a toll operator time to identify these factors and thus the lane would become less efficient. Another major benefit E-ZPass brings to the surrounding community besides less road congestion
26 Pennsylvania Turnpike Commission. PA Turnpike E-ZPass Agreement. 4 June 2007 <http://www.paturnpike.com/ezpass/personalterms.htm>. 27 Inter Agency Group. Inter Agency Group - E-ZPass. 2005. 1 June 2007 <http://www.e-zpass.info/index5.htm>.
Figure 14 ‐ An E‐ZPass lane in Delaware. Photo courtesy of the Delaware Valley Regional Planning Commission.

22
is less vehicle emissions released into the atmosphere. E-ZPass is clearly a win-win situation for the commuter and for transit authorities. D) PrePass For commercial vehicles (mostly commercial trucks) companies can participate in PrePass Plus (see Figure 15). PrePass Plus is a special transponder that has the benefits of E-ZPass tolling along with an onboard color coded system that gives commercial users the possibility of legally passing weigh stations.28 When a truck approaches a weigh
station supported by Prepass, the truck is weighed by a Weigh In Motion (WIM) scale. The truck’s identity from the PrePass along with the truck’s overall weight and weight per axle is electronically sent to the PrePass database. Then the PrePass database checks that the truck is compliant with weight restrictions and that the truck’s credentials are up to date. If the truck is in compliance (according to the database) and the PrePass database deems there is no reason for the truck to stop at the next weigh station, then the truck will be notified to pass the weigh station via a green light and audible noise on the PrePass transponder. If a truck needs to be stopped for noncompliance, bad credentials, or for a random check, then the driver is signaled with a red light and a sound via the PrePass.29 PrePass is designed to help filter out trucks that are more likely to be compliant so that trucks that are less likely to be compliant can be more intensively scrutinized (see Figure 16). In the process, time, money, and fuel are 28 PrePass FAQ. 5 Dec 2007 <http://prepass.com/faqplus.htm>. 29 Ernzen, Julie M. Port Runners - Impacts and Solutions. AzDOT Report. Phoenix, AZ: AzDOT, 2005.
Figure 16 ‐ An example of a PrePass / E‐ZPass system. Image courtesy of PrePass Web site. http://prepass.com/plustransponder.htm
Figure 15 ‐How PrePass works in conjunction with a WIM system. Diagram courtesy of U.S. Department of Transportation report “Electronic Toll Collection/Electronic Screening Interoperability Pilot Project.” http://www.itsdocs.fhwa.dot.gov//JPODOCS/REPTS_TE//14256_files/14256.pdf

23
conserved. Time is saved when drivers can bypass weigh-stations or wait in a shorter line at the weigh-station. Money is saved by conserving time for commercial companies. Fuel is conserved by less time being wasted by trucks idling in weigh-station lines. A byproduct of this is lower emissions. A recent study in the Transportation Research Record found that commercial vehicles using E-ZPass emitted 30.percent less VOC emissions, 23.5 percent less carbon monoxide (CO) emissions, and 5.8 percent less nitrous oxide (NOX)emissions (assuming that the vehicles are processed at a rate of 10 mph or less). If vehicles are processed at speeds of 20 mph, the report states that “reduc-tions in VOC emissions due to truck traffic alone could be as high as 50 percent.”30 In Arizona, PrePass commercial vehicles are processed at much faster highway speeds (50 to 70 mph) because there aren’t any tolls to be paid in Arizona. In E-Zpass applications a truck would still be required to pull up to a toll booth, wait for his E-ZPass to be detected, and then drive through. This still creates a queuing situation that reduces a truck’s speed to 0 to 20 mph (in most cases). Presumably, the PrePass used in Arizona would yield higher reductions of emissions due to the lack of a queue for most PrePass users.
One problem with PrePass is that traffic authorities are not able to override the decision by the PrePass system. The only way authorities can stop the truck if the truck is given the green light is to physically catch up to the truck on the highway. Authorities’ only power over the system is to either complain to PrePass or turn the system off entirely. Another problem with PrePass is that there are RFID systems similar to PrePass that are made by separate companies in different regions. Recently there has been an effort made by Arizona to update WIM systems to support other devices similar to PrePass. Prior to this renovation effort, Arizona authorities were only able to screen between 5 to 7 percent of all passing trucks. After the renovations 12 to 15 percent of all truck traffic can be screened.31 Although these renovations have by and large been helpful, there are still problems being worked out between government authorities and PrePass.
E) Conclusion E-ZPass has proven to be a good solution for all parties involved. Fourteen million road users get convenience and discounted tolls, governments get higher efficiency levels with fewer man hours, and communities get a less congested and less polluted residential environment. But can E-ZPass technology be better? It could certainly be argued that if E-ZPass lanes were converted to true open-road tolling lanes, the benefits of E-ZPass would be enhanced. Another element that might make E-ZPass better is expanding the usage of time-based variable tolling. The E-ZPass system is perfectly capable of this, however, it isn’t widely used. In 2005, New York bridges and tunnels introduced a $1 price increase during peak operation hours. However, the $1 charge simply wasn’t enough of a price hike to make a significant difference in tolling volumes during peak periods.32 Open-road tolling and more variable pricing would allow even more
30 Venigalla, Mohan and Michael Krimmer. "Impact of Electronic Toll Collection and Electronic Screening on Heavy-Duty Vehicle Emissions." Transportation Research Record: Journal of the Transportation Research Board 1987 (2006): 11. 31 Data based on information obtained from Steve Abney, Head of AzDOT’s Mobile Enforcement Division. 32 Wolff, Carolyn. "Congestion Pricing as a Traffic Management Tool : Evaluating the Impacts at New York City's Interstate Crossings." Transportation Research Board 2007 Annual Meeting. National Research Council, 2007.

24
convenience, more efficiency, less congestion, and less pollution. In contrast to E-ZPass, Express Toll Route 407 is a prime example of an open-road tolling mechanism.
2.2.2 Express Toll Route 407 (Ontario) Ontario’s Express Toll Route (ETR) 407 combines the best feature of an E-ZPass system and London’s Congestion Charge system. That’s because this 43-mile toll road combines ALPR with a Mark VI RFID Transponder system in an open-road tolling setting. This means that there are no toll booths on this route. This makes ETR 407 one of the most advanced electronic toll roads in the world.
Figure 17 - How a vehicle that does not have a transponder is photographed.29
Figure 18 - How a motorcycle that is maneuvering evasively is tracked between both gantries. Such evasive maneuvers pose no problem for the RFID transponder system.
A) How the ETR 407 Works When road users get on the toll route, they pass by two overhead gantries that house all of the required equipment for the toll lane to work (see Figures 17 and 18). The first gantry contains lights and license plate cameras. The second gantry contains a vehicle detector/classifier, a read/write antenna, and a locator antenna. If the second gantry’s antenna detects a transponder, then no image is captured by the first gantry’s camera. If the antenna detects there isn’t a transponder, then the camera captures an image of the vehicle’s license plate. When the vehicle then exits the toll route, it passes through the same detection/classification system. The vehicle’s exiting RF identification, or license plate identification, is matched with the entering RF identification, or license plate identification, so that a toll can be assessed.33 As of 2007, toll rates for ETR 407 are $0.176 CAD/km34 during peak travel (6 AM – 10 AM, and 3 PM – 7 PM, Monday through Friday, excluding holidays), and $0.168 CAD/km for off-peak hours 33 Castro, Alex. "H-407, All Electronic Toll Collection System." Report of the Annual Meeting : International Bridge, Tunnel and Turnpike Association (1998): 145-167. 34 Canadian Dollars per Kilometer.

25
($0.267 USD/mile35 and $0.254 USD/mile respectively). Vehicles that do not carry transponders are charged a video toll charge of $3.55 CAD per trip along with a $2.35 CAD per month account fee. Transponder users are charged either $2.35 CAD/month or $19.95 CAD/year for the lease of their transponder. Vehicles that have license plates that are unrecognized by the ALPR system are charged a flat rate of $50 per trip.36 Higher fees are charged for heavy unit vehicles. B) ETR 407 Obstacles Multiple obstacles had to be overcome to ensure that ETR 407’s tolling mechanism would work. First, multiple antennas had to be used on the second gantry in order to prevent “shadowing.” Shadowing is when a larger vehicle blocks a smaller vehicle’s communication path between the smaller vehicle and a road side antenna (see Figure 19). The height of the gantry also helps reduce the risk of shadowing.
Second, a solution was needed to prevent vehicles from changing lanes to avoid not being charged for the toll. To solve this problem, multiple transponders allow for the triangulation of the position of the vehicle. This allows the vehicle’s lane position to be tracked between the gantries, therefore ensuring that the exact lane of the vehicle is known by the time it reaches the second gantry. For vehicles that don’t have transponders, a laser curtain located at the second gantry senses the position of the vehicle and relays that information to the appropriate camera on the first gantry.
The last major problem that needed to be overcome was cuing the cameras to capture an image at the correct time and cuing the system that a transponder vehicle has passed the second gantry. The solution of this problem was achieved by the laser curtain at the second gantry. The laser curtain senses the end of a vehicle and either cues the camera to capture an image or indicates to the processing system that a transponder customer has exited the charging zone. The laser curtain also detects the height and width of a vehicle to help the processing unit determine what type of vehicle is driving through. When the unit knows what type of vehicle is driving through (say a semi-truck vs. a mini-van) it can anticipate when the vehicle will pass the second gantry, or when is the right time to capture an image. Knowing when a vehicle starts and when a vehicle ends is crucial to the effectiveness of the system, and thus the laser detection system is vital to ETR 407.37
Although ETR 407 has been highly successful, several problems have been encountered along the way. ETR is one of the first toll roads built with the “Build, Operate, and 35 United States Dollars per Mile. 36 407 ETR. 407 ETR - Tolls & Fees. 1 June 2007 <http://www.407etr.com/about/custserv_fees.asp>. 37 Castro, Alex. "H-407, All Electronic Toll Collection System." Report of the Annual Meeting : International Bridge, Tunnel and Turnpike Association (1998): 145-167.
Figure 19 ‐ ETR 407's laser curtain is vital to the effectiveness of the tolling mechanism. Otherwise it would be difficult for the system to know when a vehicle starts and when a vehicle ends.
26
Transfer” (BOT) design in mind.38 BOT is a method in which a municipality builds a toll road, begins the operating process, and then transfers the road to a third-party private company. After the road was built and after tolling was operational, ETR 407 was privatized under a 99-year lease and the ensuing company became 407 International Inc. Since the road has been privatized, several disputes have arisen between the Ontario authorities and 407 International. The first dispute came when the 407 International increased the tolling rate. The government claimed that 407 International had to consult the government with any toll increases according to the lease agreement. The courts ruled in favor of 407 International and the price increases on the ETR 407 stood.39 However, the second dispute came when 407 International was granted a court order requiring the government to not renew the registrations of delinquent ETR 407 users. Ontario fought the court order through several appeals and lost. After losing the appeals, Ontario and 407 International reached an out-of-court agreement in which Ontario would not issue plate renewals to those who had outstanding ETR 407 debts of 90 days or more. For this 407 International agreed to allow toll users with disputed charges to have the right to an ombudsman to act on their behalf. They also agreed to set up an independent arbitration process that would allow ETR 407 users the right to argue their cases.40 The somewhat contentious relationship between the Government of Ontario and 407 International might be important to consider when a government tries to have a toll road privatized.
C) Conclusion Despite the quarrelsome relationship between Ontario and 407 International, there are a lot of winners in the building of ETR 407. The people have a quicker alternative to one of the busiest highways in the world, Highway 401.41 The Government of Ontario was able to build a road in a dramatically quick fashion with the help of private funds. And, of course, 407 International has done well in the purchase of ETR 407. All in all, ETR 407 seems like a good solution to congestion in Ontario.
2.3 HOT Lanes A modern trend throughout the U.S. has been the reassignment of High Occupancy Vehicle lanes (HOV lanes) to High Occupancy Toll lanes (HOT lanes). HOV lanes are special lanes that are restricted to vehicles with two or more occupants (sometimes three or more occupants depending on the road). Like HOV lanes, HOT lanes are also restricted and vehicles with more than one occupant are allowed in the lane. The unique element of HOT lanes is that they typically allow single occupancy vehicles access to the lane by paying a toll. The lanes are managed in terms of pricing to keep a steady flow of traffic flowing even during peak operating hours. According to a report by the Federal Highway Administration, “The advantages of a HOT lane are to: expand mobility options
38 Hauer, Ezra. "Safety Review of Highway 407." Transportaton Research Record (1999): 9. 39 TollRoads News. "407 ETR Vindicated By Arbitrator - Govt Can't Interfere in Tolls." 10 July 2004 <http://tollroadsnews.info/artman/publish/article_569.shtml>. . (Accessed 22 May 2007.) 40 Government of Ontario. "Province And 407 ETR Agree To Better Deal For Drivers." 31 March 2006. Government of Ontario, Canada - News. <http://ogov.newswire.ca/ontario/GPOE/2006/03/31/c1204.html?lmatch=&lang=_e.html>. (Accessed 1 June 2007.) 41 Nassereddine, Imad. "Toronto - Transportation Systems for the 21st Century." Institute of Transportation Engineers (1998): 32.

27
in congested urban areas by providing an opportunity for reliable travel times to users prepared to pay a significant premium for this service; to generate a new source of revenue which can be used to pay for transportation improvements, including enhanced service; and to improve the efficiency of HOV facilities which is especially important given the recent decline in HOV mode share in 36 of 40 largest metro areas.”42 Therefore HOT lanes create more favorable, efficient conditions while generating revenue. Several HOT lanes across the United States utilize electronic RFID technology to collect tolls.
A) Interstate 15 – San Diego FasTrack Interstate15’s two-lane HOT lane was originally constructed as an HOV lane in 1988. Both lanes were constructed using Federal Transit Administration dollars. The toll lanes were designed to encourage car pooling, however the lanes were underutilized. In order to increase usage of the lane, the San Diego Association of Governments (SANDAG) participated in a Federal Value Pricing program to construct the HOT lane (see Figure 20).
In December 1996, the HOT lane was ready for use. As part of the program’s Phase I, SANDAG released 500 monthly permits sold at a price of $50 per month. A permit (then called an ExpressPass), granted the toll user unlimited use of the HOT lanes. By February 2007, the permit price was increased to $70 per month, and 200 more permits were released. In June 1997, electronic transponders were released to those that had permits. This allowed HOT lane users to enter the HOT lanes without visual inspection.
By March 1998, Phase II of the project began. This phase included variable priced tolling, charged on a per trip basis. Tolls typically range between $.50 to $4.00 per trip. However the toll can be raised as high as $8.00 per trip if traffic is particularly congested on the I-15. In order to determine the toll charge, real time traffic volumes are measured every six minutes. Vehicles with two or more occupants always can utilize the lanes for free. One unique feature of the I-15 HOT lanes is that they are both one-way lanes that operate southbound in the morning commute (5:30AM-11 AM), and operate northbound on the evening commute (3:30AM-7:30 PM).
Toll users’ FasTrak accounts are prepaid similar to E-ZPass. Similar to E-ZPass, FasTrak is accepted as a form of payment for several other tolls throughout California. However, the greatest advantage FasTrak has over E-ZPass is that users can travel at highway 42 Perez, Benjamin and Gian-Claudia Sciara. "A Guide for HOT Lane Development." Research Report FHWA-OP-03-009. 2003. http://www.its.dot.gov/JPODOCS/REPTS_TE/13668.html. Accessed July 16, 2008.
Figure 20 I-15 FasTrak location. 37

28
speeds when being assessed a toll. This is done via overhead antennas that read transponders at freeway speeds. Currently, road users that have a FasTrak, but don’t spend at least $4.50 per month, are charged a minimum of $4.50 in account maintenance fees. Users that spend more than $4.50 per month are not charged these fees.43 FasTrak users must put down a deposit of $40 for the transponder, the deposit is returned once the transponder is returned. The deposit can be avoided by providing a valid credit card to FasTrak. Similar to E-ZPass, FasTrak uses highway cameras and the local police to enforce laws that require HOT lane users to have either a transponder or more than one person in their vehicle. Penalties for noncompliance start at $341 for first-time offenders.
One obstacle for FasTrak was winning the support of government and the public. The first step in gaining support involved SANDAG hiring a consultant to gather marketing data. I-15 commuters were the subject of focus groups, phone surveys, and intercept surveys on their attitude towards a possible electronic variable tolling program. The data gathered from these surveys was the basis of the planned Phase I and Phase II. The second step was convincing state legislative officials. This was essential because although the proposed I-15 HOT lanes had support from the federal government, it needed state legislation to become a reality. With the help of a political leader that strongly supported the proposed HOT lanes, enough support was available to pass Assembly Bill 713 that authorized the four-year demonstration project from 1994 to 1998. 44 After the demonstration, the continuation of the I-15 HOT lanes has been extended several times with great success and many backers.
After the four-year demonstration of HOT lanes in San Diego and a couple of extensions for continued operation, an 800-person telephone survey was conducted to gauge public opinion about the I-15 HOT lanes. The findings were quite positive. The survey found that 91 percent of those surveyed think that travel time savings options provided by the I-15 HOT lanes are a “good idea;” 66 percent of drivers who do not use the I-15 HOT lanes support them; 73 percent of non-HOT lane users agree that the HOT lanes reduce congestion in the corridor; 89 percent of I-15 users support the extension of the HOT lanes; and 80 percent of the lowest income motorists using the I-15 corridor agreed with the statement: “People who drive alone should be able to use the I-15 express lanes for a fee.”45 It’s safe to say that a majority of people in the San Diego area feel that the I-15 HOT lanes are a good solution to congestion.
The costs and benefits are the best indicator of FasTrak’s success. The cost of converting I-15 HOV lanes into HOT lanes was roughly $140 million. The bulk of this cost was electronic tolling equipment as the lanes for the HOT lane had already been constructed.
43 SANDAG. San Diego's Regional Planning Agency. 23 March 2007. <http://www.sandag.org/index.asp?classid=29&fuseaction=home.classhome>. (Accessed 10 June 2007.) 44 Perez, Benjamin and Gian-Claudia Sciara. "A Guide for HOT Lane Development." Research Report FHWA-OP-03-009. 2003. 45 SANDAG. San Diego's Regional Planning Agency. 23 March 2007. <http://www.sandag.org/index.asp?classid=29&fuseaction=home.classhome>. (Accessed 10 June 2007.) (Accessed 10 June 2007)

29
Reported revenues from FasTrak are $7.5 million per year.46 This allows annual operating costs to be completely funded by the tolls, and there is money left over for other public purposes. For instance, half of the tolls’ generated income goes to financing the Inland Breeze bus service. As of 2005, FasTrak had 27,921 customers. Since FasTrak started, the average daily usage of the carpool lanes has increased from 9,400 to 20,116 vehicles per day.47
SANDAG’s FasTrak has been a great success in the eyes of commuters, and the government. Supporting this claim is the significantly high approval ratings FasTrak gets among commuters, and the fact that in 2004 the government approved a bill that allowed SANDAG to create similar HOT lanes in San Diego. By 2012, State Routes 163 and 78 will feature a 20-mile state-of-the-art managed lane facility.48 FasTrak has been viewed as one of the revolutionary HOT lane facilities in the United States and has encouraged other projects throughout the country. B) State Route 91 – Express Lanes State Route 91 (SR 91) is another HOT lane system in California. The two-lane SR 91 runs approximately 10 miles in each direction in the Orange County/Riverside area. Originally planned to be a toll road, SR 91 became the first road to feature fully automated electronic HOT lanes to supplement the public lanes. SR 91 was also the first toll road in the United States to feature a variable pricing scheme when it opened in December 1995. The $134 million road was fully funded by private funds mostly from the California Private Transportation Company (CPTC). As part of the funding agreement, the CPTC has the right to lease the SR 91 for 35 years.49
SR 91 is for the most part similar to I-15. It utilizes the same FasTrak transponders that are used on the I-15. One difference with SR 91 is that tolls are fixed according to day and time. Therefore at 2 PM on Monday the toll will always be the same. SR 91 encourages carpooling by offering a 50 percent discount to vehicles with three or more occupants. This discount is administered using a special lane on the SR 91.
One notable similarity between SR 91 and the ETR 407 is the tension between the government and the private company running the toll route. In 1999, the California Department of Transportation (Caltrans) wanted to add general-usage lanes to SR 91. The CPTC opposed any such addition as it would cut into their profit margins in operating SR 91. The CPTC subsequently sued Caltrans to stop the addition of the additional lanes. The CPTC argued that under the original 35-year lease agreement, no improvements to general purpose lanes would occur without the consultation of the CPTC. This provision was made so that the CPTC’s ability to recoup its initial investment would not be 46 Wilbur Smith Associates. "I-15 Managed Lanes Value Pricing Project Planning Study." February 2002. SANDAG Homepage. <http://fastrak.sandag.org/pdfs/concept_plan_vol1_part1.pdf>. (Accessed 29 May 2007.) 47 SANDAG. San Diego's Regional Planning Agency. 23 March 2007. <http://www.sandag.org/index.asp?classid=29&fuseaction=home.classhome>. (Accessed June 10 2007.) 48 I-15 FasTrak. "Construction Progress Continues on I-15." Spring 2007. SANDAG Official Website. <http://www.sandag.org/uploads/publicationid/publicationid_1288_6680.pdf>. (Accessed 29 May 2007.) 49 Perez, Benjamin and Gian-Claudia Sciara. "A Guide for HOT Lane Development." Research Report FHWA-OP-03-009. 2003.

30
hindered. Later in a legal settlement, Caltrans dropped the plans to increase the number of general-purpose lanes. The inability of Caltrans to add lanes to SR 91 caused public opinion of the SR 91 HOT lanes to waver. As a result of this, in 2003 the Orange County Transit Authority (OCTA) agreed to purchase SR 91 from the CPTC for $207.5 million. The use of private funds to build a road is quite enticing for local and state authorities; however the ensuing tension between a private company and a government authority may be inevitable. Government authorities and private companies perhaps just can’t see eye to eye due to their differing goals.
SR 91 has proven that variable electronic pricing is a system that can work in highly congested areas. Early research was correct when it predicted that people in the Orange County/Riverside area were willing and able to pay for an alternative to a congested freeway. In 2006 alone, revenues topped $29 million.50 However, despite the usage of the express lanes, support for the HOT lanes was almost withdrawn over a dispute between Caltrans and the CPTC. This raises important questions for governments eliciting private support for electronic tolling mechanisms. C) Other HOT lane networks Several other electronic RFID HOT lane networks are in place across the United States. Other roads that include HOT lanes are: Interstate 10 and U.S. Route 290 in Houston, Interstate 394 in Minnesota, Interstate 15 in Salt Lake City, and Interstate 25 in Denver. A handful of other states including Washington, Virginia, Maryland, Pennsylvania, Florida, and New Jersey have proposed HOT lanes. The stories of other current HOT lanes and future HOT lanes are very similar to those already mentioned. All of these HOT lanes face logistical, political, and public challenges before becoming a reality.
It is vital to a HOT lane’s survival to offer a significant amount of time savings to justify the cost. Road users in many metro areas have demonstrated that they are willing and able to pay for a reduced commute time. Electronic tolls allow for HOT lane systems to be tweaked so that a balance can be struck between the general roads and HOT lanes. For instance, the Houston QuickRide program at one time allowed any vehicle with two or more occupants to travel in the then HOV lane. Since only one lane in each direction existed on the HOV lane, the lane was over utilized. The public gave the HOV lane an F in one survey at the time. Then TxDot began only allowing vehicles with three or more occupants to drive in the HOV lane, which led to a 30 percent drop in traffic. However, the Katy Freeway HOV lane in Houston was being underutilized. To allow the perfect balance on the HOT lane, TxDot deployed QuickRide. With the RFID-enabled QuickRide, users with two occupants can pay a toll of $2.00 to use the HOT lane. Road users with three or more occupants still ride free.51
All in all the surge of existing HOT lanes and potential HOT lanes demonstrates the success of the HOT lane concept. With HOT lanes, no longer are HOV lanes
50 Orange County Transportation Authority. SR 91 Current Traffic and Revenue Information. 2006 <http://www.91expresslanes.com/learnabout/trafficrevenue.asp>. . (Accessed 31 May 2007.) 51 Perez, Benjamin and Gian-Claudia Sciara. "A Guide for HOT Lane Development." Research Report FHWA-OP-03-009. 2003.

31
underutilized. Furthermore, administrators can monitor traffic flow and make changes to a HOT lane system to ensure the HOT lane’s continued value to commuters.
2.4 Homeland Security – e-Passport In the wake of the September 11 attacks, the U.S. Congress passed the Real ID Act. This act requires states and the Federal Government to meet strict guidelines in designing and issuing identifications such as driver’s licenses and passports. The act originally set May 11, 2007, as a deadline for U.S. Government Entities to meet the requirements of this law, but the deadline has since been delayed to December 2009.52 The law also stipulates that IDs be machine-readable. However no clarification is given on what this entails.
In part because of the Real ID Act, the U.S. State Department began issuing e-Passports that include RFID (see Figure 21). The RFID is supposed to promote higher security by cutting down on human error on the part of immigration officials. With an e-Passport, an immigration official could simply wave an e-Passport past a special RFID reader and then all of the passport holder’s information would show up on a moni-tor. Everything, from a picture of the traveler to the traveler’s date of birth, can be seen with a single scan. On the surface this would make the e-Passport even more difficult to forge. For instance an e-Passport’s photo couldn’t simply be cut out and replaced. Also RFID passports could help streamline the customs process with less paperwork that needs to be retain-ed by immigration officials. Immigration officials would also be able to have a more organized, more searchable database of travelers entering and exiting the country.
However, several concerns about the RFID passports have been raised before and after the RFID passport reached the hands of U.S. citizens. One concern is that an RFID passport could be “skimmed,” or read by someone remotely. This could be used by individuals to target the location of tourists in another country, or it could be used to steal a traveler’s identity.53 U.S. State Department officials have countered that the new e-Passports are encrypted so that information can not simply be read by anyone. But privacy advocates predict that the new passports will eventually be hacked or passport databases worldwide could be the subject of hacking. In one demonstration in August 2006 a German security expert demonstrated how he could clone an e-Passport. The expert believed he could use the cloned e-Passport profile to assume the identity of a
52 Stuckey, Mike. "Privacy Lost: Where Rubber Meets the Road in Privacy Debate." 20 October 2006. MSNBC. <http://www.msnbc.msn.com/id/15130989/>. (Accessed 20 April 2007.) 53 Zappone, Christian. "Technologists Object to U.S. RFID Passports." 13 July 2006. CNN Money. http://cnnmoney.printthis.clickability.com/pt/cpt?action=cpt&title=Technologists+object+to+U.S.+RFID+ (Accessed 1 May 2007.)
Figure 21 ‐ Example of an RFID passport, designated by the chip‐looking insignia below the words "United States of America."

32
traveler relatively easily.54 It remains to be seen whether this technology may be exploited in the future.
Privacy experts’ worries about the e-Passport reveal potentially dangerous holes in any RFID system that broadcasts private data. Despite no major problems being reported as of yet, RFID technology in passports has only been around in the United States since the spring of 2006. The fact is that RFID signals can easily be picked up by anybody that has a reader. As a CNN report suggests, “The equipment needed to skim an RFID chip neither has to be large nor expensive. Nokia sells cell phones capable of reading RFID chips. Texas Instruments sells kits to do the same thing.”55 An important element of a statewide EVR technology should be that no sensitive information (i.e. the owner’s name and information) be stored on an EVR. The EVR should only broadcast information that can be seen on the plate (the license plate number, expiration date, etc). It should be the job of a network database to identify any sensitive information about a vehicle. This would greatly reduce the risk of EVRs becoming a source for identity thieves.
2.5 Conclusion The literature has shown both the cost and benefits of implementing an array of RFID applications around the world. The findings of these implementations should be carefully considered when designing an RFID system to support the needs of the state of Arizona. The next step of this research is to take the information learned from the literature review and then apply it directly to the state of Arizona.
54 Stuckey, Mike. "Privacy Lost: Where Rubber Meets the Road in Privacy Debate." 20 October 2006. MSNBC. <http://www.msnbc.msn.com/id/15130989/>. (Accessed 20 April 2007.) 55 Zappone, Christian. "Technologists Object to U.S. RFID Passports." 13 July 2006. CNN Money. <http://cnnmoney.printthis.clickability.com/pt/cpt?action=cpt&title=Technologists+object+to+U.S.+RFID+passports+-+Jul.+13%2C+2006&expire=-1&urlID=18841767&fb=Y&url=http%3A%2F%2Fmoney.cnn.com%2F2006%2F07%2F13%2Fpf%2Frfid_passports%2F&partnerID=2200>. (Accessed 1 May 2007.)

33
Chapter 3 The Benefits of an EVR or ALPR System
Analyzing the potential benefits of an EVR or ALPR system is the purpose of this section, as well as applying those potential benefits to the State of Arizona. This section will focus not only on the benefits relating to the AzDOT but also on potential benefits to the local society and to the commercial community.
3.1 Benefits to AzDOT
3.1.1 Monitor Traffic Flow Currently AzDOT measures traffic flow, like many DOTs, to assist in future road plan-ning and so that proper federal and state funding can be allocated toward Arizona roads. AzDOT uses several methods; these methods include the use of loops, tubes, and acoustic pads. Loops on a given highway are the most common traffic flow monitoring mechan-ism that is currently in use. In a loop, two wires are placed under a road or highway about 18 feet apart. As a car drives over the first and second loop, the vehicle is counted be-cause the vehicle disturbs the magnetic field between the loops. The loop also can detect what type of vehicle (say a car or a commercial truck) passed through and in which lane the vehicle was driven. One problem with this technology is that it’s not always accurate. The loop system requires somewhat constant maintenance and frequently breaks or malfunctions. If these malfunctions result in slightly fewer cars being counted sometimes, it can be harder for AzDOT to detect the malfunction in the system. Also in the loop system, cars that switch lanes in the 18 feet between the two loops are not counted.
AzDOT also uses tubes to calculate traffic flow on less busy roads. In this mechanism air-filled tubes are placed underneath a given road and the tube mechanism can sense the pulse of vehicles driving over it. The reason air tubes are used more on lower volume roads is because they can’t take the constant high-speed use of a busy highway or the heavy traffic of vehicles on a major freeway. The air tube mechanisms seem to have the same downfalls in terms of their reliability.
The counting method AzDOT uses the least involves the use of acoustical pads above a given road. The pad uses the acoustical vibrations given off by cars to count the number of cars that pass the system. One problem with this mechanism is that it has to be constantly calibrated. The pads must be set for either free-flow traffic or busy traffic. Otherwise, counts from the acoustical mechanism can be inaccurate.
The consensus among several traffic engineers at AzDOT was that the loop system was the most accurate system currently in use. That being said, correction factors and graph smoothing software is utilized to make an educated correction of data collected from all mechanisms used. These corrections typically attempt to take into account errors that include cars not being counted, a counting mechanism going completely down, and unusually recorded datasets. AzDOT engineers currently estimate that a good dataset is roughly 5 percent off the actual count of cars (plus or minus 5 percent). It’s arguable that 5 percent off is a significant amount of error. This has led AzDOT to look for other non-intrusive ways to monitor traffic flow. In the next few months, one way in which AzDOT

34
is looking to fill this need is with the use of lasers. Lasers could perhaps give a more accurate picture of traffic flow.
One potential benefit of an EVR or ALPR system is that the flow of traffic could be measured more accurately. In the instance of an ALPR system, every time a car would pass by one of the cameras the car’s license plate would be read. If cameras were positioned over every lane of traffic at any point of interest on the highway, an accurate traffic flow analysis could be taken. For every plate that is read, a tally could be taken to monitor the traffic flow during all hours of the day with little human interaction being necessary. One obstacle with the ALPR system is that, as reported earlier in the literature review, in London the accuracy of an ALPR system is around 70-80 percent. New and improved ALPR systems are more accurate, they recognize about 90 percent of vehicles in a single pass.56 When it comes to attempting to monitor traffic flow, the accuracy of reading the plate is not important; however, if the tally counted anything that it attempted to read, the tally might become inflated. This is because, as reported in London, the ALPR system will sometimes pick up other text from vehicles such as bumper stickers. Furthermore, vehicles changing lanes when passing through the cameras might not be counted. In order for an ALPR system to monitor traffic flow accurately, the system would have to be calibrated and monitored at least initially.
Instead of an ALPR system an EVR system would be much more accurate if imple-mented. London’s trials of the EVR system reported an accuracy rate of 99.55 percent. Possible sources of error in an EVR system could be drivers having a faulty RFID transmitter, drivers tampering with and damaging an RFID transmitter, or by vehicles with plates without RFID chips passing the RFID sensor (without being counted). If the RFID transmitter were embedded in the license plate, removing the RFID transmitter would be more difficult. If the RFID transmitter were displayed on the windshield, the driver would more easily be able to remove the transmitter. One weakness of the RFID system is that it’s not able to produce data regarding what lanes vehicles traveled on. One positive of an RFID system would be the low cost of placing RFID sensors at points of interest. RFID sensors could easily be mobile and set up at temporary points of interest.
It seems error is inherently present in all mechanisms that are used to monitor traffic flow. It’s hard to say without a doubt, without empirical evidence, that an EVR or ALPR system would improve the monitoring of traffic flow. However, if an ALPR system or EVR system were implemented, perhaps the best decision in terms of traffic monitoring is to utilize older methods such as loops in conjunction with the EVR or ALPR system. This would produce a more accurate picture of traffic flow and give traffic engineers at AzDOT more data to work with. Data missed by an EVR system due to an out-of-state plate would probably be picked up by the loops. These technologies working together work similarly to how the RFID and ALPR system work together on ETR 407. Two data sets could also lead to more accurate correction factors for the data. Another advantage of two monitoring systems is that if one of the two monitoring systems went down, the other could still collect the data. This would reduce the number of holes in the continuous monitoring of the data. 56 Evens, Jeremy and Dan Firth. "Transport for London, Congestion Charging Technology Trials, Stage 1 Results." 12th World Congress on Intelligent Transport Systems. San Francisco: ITS America, 2005.

35
3.1.2 Unpaid License and Registration Unregistered vehicles are a costly problem for AzDOT. An estimated 200,000 vehicles are unregistered in Arizona.57 A separate report estimates that 4 percent of Arizona residents don’t register their vehicles, resulting in a loss of $25 million in tax revenue per year.58 The noncompliance losses are the result of many factors including: the high rate of the vehicle license tax, the high number of winter visitors in Arizona, Arizona’s lack of a grace period to register vehicles, and the difficulty of enforcement. The current prot-ocol to encourage citizens to register their vehicles involves issuing registration stickers to those that register their vehicle. The sticker identifies the expiration date of the current registration, and drivers are notified via mail when their registration is set to expire. Vehicle owners can then renew their registration by mail, by phone, or via the Internet.
When law enforcement visually sees a license plate that has an expired registration tag, the car is subject to being stopped and ticketed. The tickets can vary greatly, depending on the municipality involved where the unregistered vehicle is cited. In the city of Tempe, the fine for not having a valid registration is $586; however, if the noncompliant driver registers his/her car before appearing in court, the fine is reduced to $136. Regardless of being ticketed, if a resident of Arizona fails to renew his/her registration, AzDOT charges an additional $8 for the first month late, and then $4 for each additional month. This could result in late fees of $52 for a year of noncompliance.
An EVR or ALPR system would help issue citations to those not in compliance with registration laws. These systems would work similar to a red light camera. After a vehicle is detected to have an expired Arizona tag, a citation could be automatically issued and mailed to the motorist. The ALPR system could also alert law enforcement so that the noncompliant could be stopped by a patrol officer. This option would be necessary if it is unclear that an individual is in fact an Arizona resident. Current laws require that there be proof that someone is a resident before a ticket can be issued for failure to register a vehi-cle. Current Arizona law states that an individual must live in Arizona seven months out of the year to be considered a resident who is required to pay Arizona vehicle registration taxes. An ALPR or EVR system would be able to keep logs of when a particular vehicle has been spotted. This could aid in issuing citations to those that claim to not be Arizona residents when really they are residents according to the law. The software behind the ALPR or EVR system could be designed to flag vehicles with out-of- state plates that are suspected to be owned by residents. This could be very useful in increasing compliance since the largest problem in enforcing registration laws is identifying would-be residents.
A positive side effect of reducing the number of unregistered vehicles in Arizona, would be a reduction in the number of vehicles that are not compliant with Arizona’s emissions standards. Currently in Arizona, a vehicle must pass emissions tests on a periodic basis depending on how old the vehicle is. Passing vehicle emissions is a condition that must be met prior to a vehicle’s Arizona registration being renewed. Therefore, a registered vehicle is always in compliance with emissions laws. By reducing the number of
57 Olsen, Jeremy. "Arizona House Bill 2443." Representative J. P. Weiers, 2007. 58 Windtberg, Mark., & Bain, Andrew. Options for Improving Compliance with Vehicle Registration Laws. Phoenix: Arizona Department of Transportation. 2004.

36
unregistered vehicles, the state would also be reducing the number of vehicles that may not comply with Arizona emissions standards.
Predicting the long term effectiveness of an ALPR or EVR system in regard to vehicle registration is difficult as there are many variables that go into noncompliance. An ALPR or EVR system would definitely increase the number of citations issued, which, at a minimum, would help recover the cost of noncompliance. Fine structures like the ones in the city of Tempe that give greater incentives to comply with registration laws would also aid in increasing the rate of compliance.
3.1.3 Insurance Compliance Similar to registration compliance, drivers driving without insurance is another problem facing Arizona. The Insurance Research Council’s (IRC) 2006 report estimates Arizona’s uninsured rate to be 22 percent, which is the fifth highest uninsured rate by a state in the United States.59 The IRC’s previous report from 2000 estimated Arizona’s uninsured rate to be 16 percent. AzDOT’s Motor Vehicle Division (MVD) estimates that roughly 11 percent of registered drivers are uninsured. Based on this data it is likely that the uninsured motorist rate in Arizona is somewhere between 11 percent and 22 percent. The 11 percent to 22 percent estimated uninsured rate implies that there may be as many as 500,000 to 1,000,000 motorists without insurance driving some of the 4,556,448 registered private vehicles in Arizona.60 The number of uninsured drivers may have dropped more recently due to Arizona State Senate Bill 1420 being signed into law in April 2005. The law went into effect 90 days after the end of the 2005 legislative session. The law requires that an uninsured driver’s vehicle must be towed and impounded for at least 30 days if it is involved in an accident. Also a mandatory $500 fine is imposed on uninsured drivers that are involved in accidents. The IRC can not yet calculate the effect of this legislation on uninsured driving. The IRC’s 2006 report used data from 2002.
Despite this possible step forward in reducing the number of uninsured drivers, uninsured drivers cost insured drivers a lot of money. One source estimates that uninsured vehicle crashes cost U.S. victims $27 billion annually.61 This estimate is based on a figure from the National Safety Council estimating that $192 billion in damages result from U.S. vehicle crashes annually, and 14 percent of drivers nationwide are uninsured. Based on the number of registered vehicles estimated by the Federal Highway Administration, 200 million, the cost of uninsured drivers per registered driver per year is approximately $135.
Using this same methodology with Arizona’s estimated uninsured rate of 11 percent to 22 percent, along with the AzDOT’s 2005 Crash Statistics, produces staggering numbers. AzDOT’s 2005 Crash Statistics estimate that $3,421,034,916 in total economic losses were a result of the crashes that occurred in Arizona in 2005. If 11 percent of these 59 Insurance Research Council. “Uninsured Drivers Increasing; Vary by State; Miss. Highest, Maine Lowest.” Insurance Journal http://www.insurancejournal.com/news/national/2006/06/28/69919.htm (Accessed 15 September 2007.) 60 Arizona Department of Transportation. "Arizona Motor Vehicle Crash Facts." 2006. Arizona Department of Transportation. <http://www.azdot.gov/mvd/Statistics/crash/PDF/05crashfacts.pdf>. 61 Roth, G. J.. Street Smart: Competition, Entrepreneurship, and the Future of Roads. Transaction Publishers. 2006.

37
economic losses were uninsured, the total cost of uninsured drivers in Arizona could be as high as $376,313,841. If 22 percent of these economic losses were uninsured, the total cost of uninsured drivers in Arizona could be as high as $752,627,682. The Arizona Crash Statistics report also says that there were 4,556,448 registered vehicles in Arizona in 2005. Therefore, the cost of uninsured crashes in Arizona per registered vehicle is between $82.59 and $165.18 annually.
There are many potential reasons that can be cited for Arizona’s high uninsured rate. One that is more unique to southern states is the issue of immigration. In 1999, 9.9 million vehicles with more than 25.2 million passengers crossed the Mexico-United States border into Arizona.62 This figure does not include illegal aliens. In order to get insurance one must have a driver’s license, in order to have a driver’s license in Arizona one must prove residency and be a U.S. citizen. Therefore it is impossible for illegal aliens behind the wheel to comply with Arizona laws requiring drivers to have insurance. States such as California have long considered allowing illegal aliens to apply for driver’s licenses. Supporters of such a measure claim that giving licenses to illegal aliens would make the roads safer as they would have to pass a driver’s test and would increase the number of illegal aliens that have insurance. Opponents of such a measure claim that by giving illegal aliens driver’s licenses, you are in fact giving government approval of an illegal alien’s status. Even if illegal immigrants were allowed to have driver’s licenses, it’s impossible to say whether they would acquire insurance. It is doubtful they would, considering the profile of those that don’t pay for insurance. Much of the income generated by undocu-mented workers is sent back to Mexico to support the undocumented worker’s family.
Table 4 – Characteristics of Uninsured Motorists.63
It’s possible that an ALPR system or EVR system could reduce the number of uninsured drivers in Arizona. For this to be a possibility, a driver’s insurance data would have to be correlated with a driver’s license plate. Currently in Arizona, one must only show proof of insurance to first register a vehicle. After the initial registration, Arizona law stipulates that the MVD must be notified electronically by the insurance company if one of its clients renews his/her policy, discontinues the policy, or switches to a new insurance company. If a vehicle owner does not renew his/her policy or get a new policy, the MVD sends a letter informing the vehicle owner that he/she must provide proof of insurance or 62 “Border Crossing Database.” TranStats The Intermodal Transportation Database. Bureau of Transportation Statistics. http://www.transtats.bts.gov/BorderCrossing.aspx. Accessed July 16, 2008. 63 “Characteristics of Uninsured Motorist.” Hunstad, Lyn. California Department of Insurance; February 1999; p.2.

38
risk having the vehicle’s registration suspended. The only way an uninsured driver is penalized monetarily is by either being pulled over by law enforcement and cited or by getting in a traffic accident and getting cited. Many states similarly keep updated insurance databases. Utah contracts with Insure-rite, an independent firm, to help insure compliance.64 In Utah a similar notification letter is sent to a vehicle owner that lacks updated insurance information. The difference is that the letter stipulates that fines will be assessed if the driver’s insurance situation isn’t rectified. The Arizona law lacks teeth, especially since the noncompliant save money by not paying their registration or paying their registration late.
An ALPR or EVR system would be able to flag vehicles that are being driven without insurance. Citations could then be mailed to the registered owner’s residence. Increased enforcement of uninsured drivers could lead to a significant reduction in the economic cost of uninsured crashes in Arizona. Even a 1 percent reduction of Arizona’s uninsured drivers rate (from 22 percent to 21 percent for instance), or a 4.5 percent increase in insurance compliance, would reduce the incidence of uninsured damages by roughly $34 million annually (based on the estimated cost figures above).
3.1.4 AzDOT’s Ability to Implement Congestion Charges, Tolls, HOT Lanes, etc. One benefit that AzDOT would gain from an EVR or ALPR system would be the ability to charge road users a congestion charge, a traditional toll, or a HOT lane toll via modern open lane tolling mechanisms. Very few implementations of an EVR system exist, and thus far none of them have been integrated into a tolling mechanism. However, it wouldn’t be difficult to tie a vehicle’s electronic RFID identity into a charging mechanism that can be used on toll roads, HOT lanes, or congestion charging. The ability for AzDOT to charge any or all of these types of tolls is virtually unbounded.
A) Cordon Congestion Tolls A cordon congestion charge would probably be the least feasible tolling mechanism for Arizona. Cordon congestion charges typically require a highly populated small area into which a large percentage of residents commute. This may sound a lot like the Phoenix metro area; however the Phoenix metro area is very spread out compared to other places in which a congestion charge has been implemented. For instance, in London the charging zone is approximately 15.5 square miles in area, and this required over 700 cameras initially to effectively implement. There really isn’t a 15-square mile part of Phoenix that is nearly as dense in terms of commuting traffic as the charging zone in London. More recently, New York City Mayor Michael Bloomberg has proposed a congestion charge for the busiest parts of Manhattan. Since there really isn’t an urban area as densely populated as London or Manhattan in Arizona, a congestion charge simply doesn’t seem very feasible as it would take a large number of cameras or RFID readers to patrol the points of entry into the Phoenix metro area. Despite a congestion charge not being feasible at present, an EVR or ALPR system would leave the option on the table if a dense centralized business district in Phoenix developed.
64 Markkula, L. Uninsured and Underinsured Motorists: Trends in Policy and Enforcement. Phoenix: Arizona Department of Transportation. 2004.

39
B) Corridor Congestion Tolls Setting up corridor tolls would perhaps be a more useful method of road charging for Arizona. Several open-road tolling mechanisms that are already in place elsewhere could serve Arizona effectively. Toronto’s ETR 407 for instance could work on existing Arizona freeways during rush hour. Users’ entry onto an Arizona highway could be recorded, either by EVR or ALPR, and then the users’ exit would be recorded the same way. Road users could then be sent a bill every month for their road usage. Admittedly, charging Arizona freeway users for driving on the freeway would be difficult as Arizona road users are not used to paying for road usage. Perhaps one way around this projected opposition would be to allow private companies to build, maintain, and operate a separate toll road. Alternative freeways could be made available to busy freeways such as Interstate 10, State Route 101, and U.S. Route 60. These privatized alternative highways would have less opposition, because they are not being paid for with taxpayer’s money, and road users would have the choice of using a tolled highway or the free public freeways. Even road users that continue to use the public freeways would feel the positive result of fewer commuters.
If Arizona were to look to private companies to manage, maintain, and operate such a toll road, Arizona’s contractual agreement would require further research into what powers AzDOT would like to have over the tolled roads and which ones would be given to the private company. Many disputes have arisen in some of the examples listed in the literature review section of this report. Such disagreements are costly in litigation expenses and reduce the benefits of a privately funded road. The reason for many of the disagreements (including those surrounding ETR 407) is the fact that a private company’s goals don’t necessarily match up with the goals of the government. The government’s goal is to serve its citizens, and a private company’s goal is to make a profit, but with compromise and a sound foundation agreement both goals can be served. All in all, the ability for Arizona to create tolls would be very easy once an EVR or ALPR framework were already put into place. This ability to toll could serve the state very well financially and give the state the ability to better manage congestion.
C) HOT Lanes Similar to toll routes, HOT lanes could be built, operated, and managed by either AzDOT or a private company. HOT lanes could either be an expansion to current freeways, or present HOV lanes could be converted into HOT lanes. HOT lanes would allow AzDOT to increase the efficiency of current HOV lanes by allowing vehicles with only one occupant to enter by paying a fee. Using EVR technology, or ALPR technology, a HOT lane system could be implemented relatively easily. This type of road charging method is a little closer to home, as California has several HOT lanes already. It’s possible that this form of charging would have the least amount of opposition, as completely new roads wouldn’t need to be built. Similar to toll roads, users that don’t choose to pay to avoid congestion will feel the positive result of more drivers using the HOT lanes and fewer using the freeway. This charging method would still serve the government financially, while also serving the people of Arizona.

40
3.2 Benefits to Law Enforcement A more controversial aspect of an EVR or ALPR system is its potential to constantly cross-check recognized plates with outstanding warrants. The way this could be done is similar to how the system would check for expired license and registration as described above. The EVR or ALPR system would recognize vehicles as they pass by, then the records of recognized plates could be cross-checked with police records of wanted suspects. Vehicles that might belong to, or be affiliated with, a wanted suspect could be flagged by the system. From there law enforcement could potentially pull over the vehicle in question. This use of an ALPR or EVR system could additionally be used to help locate stolen vehicles. When a car reported stolen drives past an EVR reader or ALPR camera, the system could flag the car and report the information to law enforcement. Law enforcement could attempt to locate the car knowing where it has just been.
Law enforcement could also use an EVR or ALPR system when there is an AMBER Alert issued. An AMBER (America’s Missing: Broadcasting Emergency Response) Alert is a notification to the general public about missing or abducted children. An AMBER Alert is generally broadcast via commercial radio stations, satellite radio, television, cable TV, e-mail, text message, and electronic traffic condition signs. Often when an AMBER Alert is broadcast, a description of a suspect involved in the child abduction is given and a description of the suspect’s vehicle is given. If it were the case in a given AMBER Alert that either a vehicle description or a full or partial license plate were known, an ALPR or EVR system would be able to flag vehicles that match the description of the suspect.
Currently police in Arizona (and almost anywhere else in the United States) use motor vehicle department records when looking up a plate. When an officer runs a query on a given plate number the computer will come up with the following information:
1. Registered vehicle owner
2. The address of the registered owner
3. The make and model of the vehicle
4. The model year of the vehicle
5. Other descriptors of the vehicle (i.e., two-door or four-door)
6. ACIC (Arizona Crime Information Center) and NCIC (National Crime Information Center) crime information linked to the vehicle or the registered vehicle owner.
Although MVD records are generally reliable, they can contain flaws. A majority of the flaws discovered are because MVD depends on the vehicle owner for accurate information. MVD relies on owners to update relevant information regarding their vehicle. For instance the MVD relies on owners to give an accurate description of the car in the first place. An MVD official does not inspect the vehicle to ensure it is the model reported or that the vehicle is a two-door and not a four-door. Another frequent problem

41
Figure 22 – A police cruiser with a mounted ELPR system.
Figure 23 –Components of an ELPR System.
is that drivers do not always update their address after moving. Currently the law in Arizona requires residents to notify the MVD immediately of any address changes. There is no grace period.
Interestingly, many Arizona police forces and other U.S. police forces already use a tool known as an Electronic License Plate Reader or ELPR in many squad cars (see Figure 22). The ELPR camera is a video camera that is hooked up to a digital video recorder in the trunk of the patrol car. The camera constantly searches plates that come into the camera’s view using recognition software. These cameras are generally mounted on the top of the patrol car, but sometimes they are mounted inside. The cameras read plates alongside and in front of the cruiser throughout the day (regardless of whether the car is parked or moving).The computer then checks the plate in the NCIC and ACIC just as if the officer were to have manually keyed the plate into the database. If the ELPR picks up a vehicle associated with a warrant, an alarm goes off within the squad car. From there the officer can pull over the vehicle in question.65 Examples of police forces in Arizona that utilize ELPR technology include: Arizona Department of Public Safety, Phoenix police, Mesa police, Chandler police, Tempe police, and Tucson police departments. Arizona DPS, for instance, is currently utilizing ELPR in 10 marked and unmarked patrol cars. The deployment of these readers has been limited mostly by the cost of the readers which is about $25,000 to $50,000 each, depending mostly on whether the ELPR system has two cameras or four. Despite the cost, Arizona DPS plans to purchase 20 more systems due to their effectiveness particularly in finding stolen vehicles (see Figure 23).
Thanks to ELPR technology utilized by San Jose police, a suspect wanted for child abduction in connection with an Amber Alert was arrested in October 2007. San Jose police found valuable evidence in the parked vehicle (recognized by the ELPR system as stolen) that led to the arrest of the suspect. The new found evidence will also aid in the prosecution of the suspect in the future.66
65 Barge, C. (2007, May 3). “Police Steal Cue from 'Knight Rider'.” Rocky Mountain News: http://www.rockymountainnews.com/drmn/local/article/0,1299,DRMN_15_5518138,00.html. (Accessed 25 September 2007.) 66 Bulwa, Demian. "License plate recognition tools led to abduction arrest." 13 October 2007. San Francisco Chronicle. <http://www.sfgate.com/cgi-bin/article.cgi?file=/c/a/2007/10/13/MNJFSO1NM.DTL>. (Accessed 16 October 2007.)

42
One challenge in implementing an EVR or ALPR system would be preventing license plates from being stolen. A common practice among car thieves is to steal other license plates to try and “legitimize” a stolen vehicle. This way if a car thief has stolen a car and has stolen a license plate of a similar, but different car, the plate won’t necessarily give away that the car is stolen. Furthermore, the person whose license plate was stolen may not report the theft right away because often times the thief will replace the stolen plate with the plate of the stolen car. The owner of the vehicle with swapped plates may not notice that his/her plate has been swapped, and worse yet the owner may be mistaken for a car thief. Police commonly refer to this practice as “plate swapping,” and often refer to a plate that doesn’t belong to a given car as a “fictitious plate.” Although this problem of plate swapping is nothing new, the negative consequences could be amplified by an EVR or ALPR system. An EVR or ALPR system might further aggravate this type of crime since it will become more difficult to get away with grand theft auto without a fictitious plate. While EVR/ALPR won’t eliminate car theft, it ultimately does make it tougher to get away with, especially for the casual thief.
An EVR or ALPR system has the potential to be a great tool for police. An ALPR or EVR system could easily run plates at random in the search for those with outstanding warrants. There would need to be a lot of further research and tests to ensure that it is implemented correctly. Implementation within the lines of the law is the subject of Chapter 5.
3.3 Commercial Benefits
An EVR system could also benefit private business. For instance, a vehicle’s license plate number could be used to restrict or grant access to particular vehicles in a parking garage. This could be done using an RFID reader that could pick up the RFID tag. Once an EVR is recognized and cleared as having access, a gate would allow the driver through. Another commercial benefit that is publicized on the EVR homepage is the ability for gas stations to track the license plate numbers of vehicles using the gas pumps. All that would be needed for this would be an RFID reader that could recognize the vehicle’s RFID transmissions. Then if a driver were to try and leave the gas station without paying for his/her gas, the vehicle’s RFID identity could be used to catch the driver.

43
Chapter 4 Possible EVR or ALPR Estimates and Cost Benefit Analysis
The purpose of this section is to quantify the cost of a possible EVR or ALPR application in the Arizona. The estimates from this section are provided with the help of leading providers of this kind of technology. The numbers quoted in this section may be very different than what they will be in the near future. This is because as this technology continues to advance, it almost inevitably will become more affordable. Furthermore, the companies surveyed for this section are somewhat reluctant to give costs of their technology for fear of competitors getting their numbers. Therefore, there is a good chance that the estimates given are higher than they would be if, say, the same manufacturers were vying for a contract with the state in a competitive bid.
The hard costs (equipment, readers, cameras, RFID chips etc.) are more predictable than softer costs such as installation. For instance, installation costs for both EVR and ALPR technology will vary depending on how remote a given location is. Remote locations may not have electricity readily available. Remote locations also might not have cell phone coverage, making networking more difficult. Therefore, the camera or RFID reader sites will only be placed on the busiest stretches of the following major Arizona highways (see Table 5 and Figure 24).
Table 5 ‐ Length of Arizona Highways
Arizona Highway Length of Highway (miles) I‐10 391 I‐17 146 US 60 369 SR 51 16 SR 74 30 SR 85 118 SR 87 226
Loop 101 60 Loop 202 162 SR 303 25
Approx miles 1543

44
Figure 24 ‐ Valley Freeway System. Arizona Department of Transportation. http://www.dot.state.az.us/Highways/Valley_Freeways/Index.asp
By placing the RFID readers or ALPR cameras only on major highways, they will get the maximum exposure. AzDOT could always expand the number of RFID readers or ALPR cameras at a later date.
For the following estimates, assume that an EVR or ALPR system would:
1. Provide traffic count information.
2. Be able to flag:
a. Vehicles with unpaid registration
b. Vehicles without proper insurance
c. Vehicles that are suspected to be stolen
d. Vehicles associated with known felons
3. Have the possibility to be used as a tolling mechanism at a later date.

45
4.1 Automatic License Plate Recognition Estimate
Eight ALPR cost estimates have been prepared using varying numbers of cameras per site and varying numbers of cameras overall. Each estimate is based on each ALPR camera costing roughly $20,000. This rough cost was obtained using information given by a leading manufacturer of ALPR cameras. This $20,000 does not include any soft costs such as installation, fiber optics, air cards, fixed computers, or heat resistant pods to protect cameras. Therefore 20 percent is added to the hardware costs to account for these soft costs. This 20 percent added is probably the most speculative part of this estimate. Each estimate assumes that the cameras will be used along the 1,543 miles of major highways in Arizona and assume that at each camera site there will be one camera for every lane of traffic. Therefore, if one of the sites is on U.S. 60 and there are four lanes going each way, eight cameras in total will be installed at this site. In Estimates 1, 3, 5, and 7, it is assumed that the average number of lanes per site is 10 (although some roads will have fewer than 10 and some more than 10). Therefore, in these examples camera sites are more likely to be placed on parts of highway that are most used and have the most lanes. In Estimates 2, 4, 6, and 8 the average number of lanes per site is assumed to be eight. Therefore in these examples, cameras will still be placed in busy parts of the highway, but instead areas will have fewer lanes than Estimates 1, 3, 5, and 7. These estimates are shown in Tables 6 and 7. Table 6 ‐ Possible Costs of a Statewide ALPR System in Arizona
Estimate 1 Estimate 2
Number of Camera Sites 100 Number of Camera Sites 100
Number of Cameras Per Site x 10 Number of Cameras Per Site x 8
Total Cameras 1000 Total Cameras 800
Cost Per Camera x $ 20,000 Cost Per Camera x $ 20,000
Total Hard Cost $ 20,000,000 Total Hard Cost $16,000,000
Soft Costs x 20% Soft Costs x 20%
Soft Costs (installation) $ 4,000,000 Soft Costs (installation) $ 3,200,000
Total Cost $ 24,000,000 Total Cost $19,200,000
Estimate 3 Estimate 4
Number of Camera Sites 50 Number of Camera Sites 50
Number of Cameras Per Site x 10 Number of Cameras Per Site x 8
Total Cameras 500 Total Cameras 400
Cost Per Camera x $ 20,000 Cost Per Camera x $ 20,000
Total Hard Cost $10,000,000 Total Hard Cost $8,000,000
Soft Costs x 20% Soft Costs x 20%
Soft Costs (installation) $2,000,000 Soft Costs (installation) $1,600,000
Total Cost $ 12,000,000 Total Cost $ 9,600,000
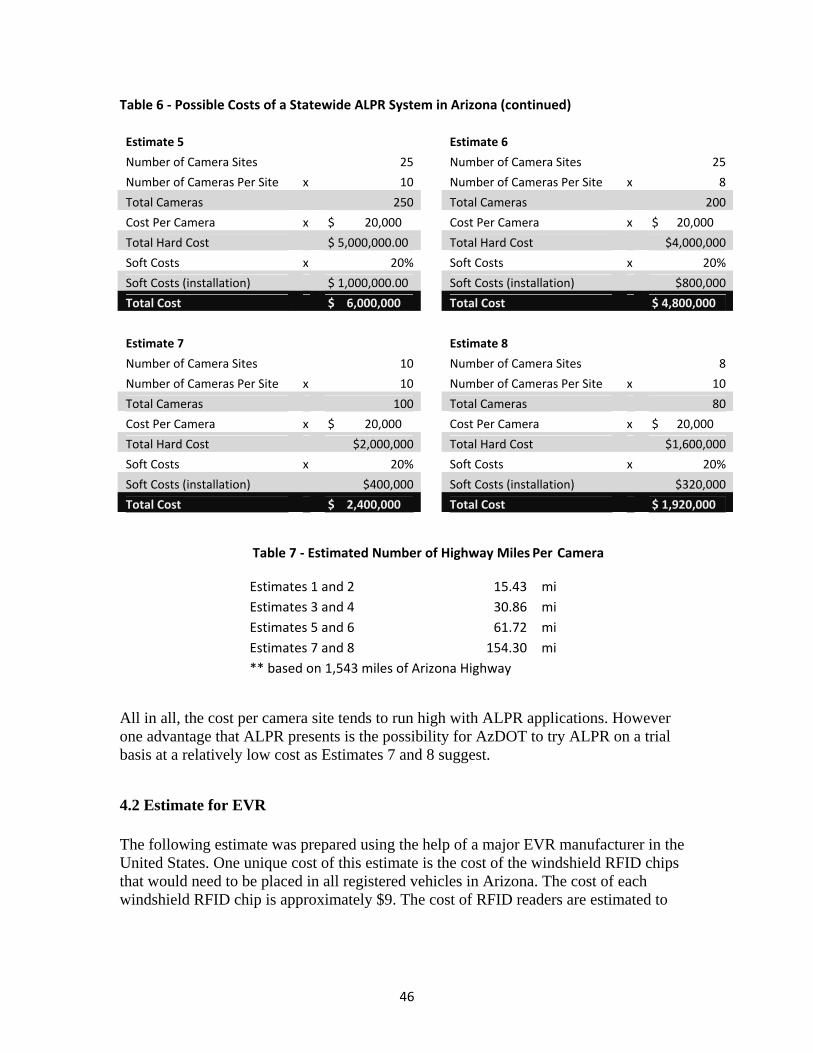
46
Table 6 ‐ Possible Costs of a Statewide ALPR System in Arizona (continued)
Estimate 5 Estimate 6
Number of Camera Sites 25 Number of Camera Sites 25
Number of Cameras Per Site x 10 Number of Cameras Per Site x 8
Total Cameras 250 Total Cameras 200
Cost Per Camera x $ 20,000 Cost Per Camera x $ 20,000
Total Hard Cost $ 5,000,000.00 Total Hard Cost $4,000,000
Soft Costs x 20% Soft Costs x 20%
Soft Costs (installation) $ 1,000,000.00 Soft Costs (installation) $800,000
Total Cost $ 6,000,000 Total Cost $ 4,800,000
Estimate 7 Estimate 8
Number of Camera Sites 10 Number of Camera Sites 8
Number of Cameras Per Site x 10 Number of Cameras Per Site x 10
Total Cameras 100 Total Cameras 80
Cost Per Camera x $ 20,000 Cost Per Camera x $ 20,000
Total Hard Cost $2,000,000 Total Hard Cost $1,600,000
Soft Costs x 20% Soft Costs x 20%
Soft Costs (installation) $400,000 Soft Costs (installation) $320,000
Total Cost $ 2,400,000 Total Cost $ 1,920,000
Table 7 ‐ Estimated Number of Highway Miles Per Camera
Estimates 1 and 2 15.43 mi Estimates 3 and 4 30.86 mi Estimates 5 and 6 61.72 mi Estimates 7 and 8 154.30 mi ** based on 1,543 miles of Arizona Highway
All in all, the cost per camera site tends to run high with ALPR applications. However one advantage that ALPR presents is the possibility for AzDOT to try ALPR on a trial basis at a relatively low cost as Estimates 7 and 8 suggest.
4.2 Estimate for EVR The following estimate was prepared using the help of a major EVR manufacturer in the United States. One unique cost of this estimate is the cost of the windshield RFID chips that would need to be placed in all registered vehicles in Arizona. The cost of each windshield RFID chip is approximately $9. The cost of RFID readers are estimated to

47
cost about $3,000.67 The indirect costs of the required information structure are estimated to be about 20 percent of the total cost; however, this is a very speculative estimate.
Each EVR site would require two RFID receivers to determine traffic flow. If a vehicle were traveling eastbound on U.S. 60 past an EVR site, then receiver A (see Figure 25) would recognize the vehicle first, and then receiver B would recognize it second. Thus the vehicle would be identified as going eastbound. This would tell the system that the vehicle is headed eastbound on the 60. Similarly, if a vehicle was first recognized by receiver B and then receiver A, the vehicle would be identified as traveling westbound.
The following are three sample estimates of an EVR system with a variable number of total RFID sites (1,000, 500, 100). See Figure 25 and Tables 8, 9, and 10.
Table 8 ‐ Cost of a Potential EVR Application
Upfront Cost of RFID EVR Devices for All Registered Vehicles Number of Privately Registered Vehicles 4,556,448 Cost per RFID Card $9 Total Cost of RFID Cards $41,008,032
67 RFID Update. Chipsets Key to RFID Reader Cost Reductions. 8 December 2005. <http://www.rfidupdate.com/articles/index.php?id=1011>.
E
A
B
Figure 25 – Placement of RFID readers in an EVR application.

48
Table 9 - Possible EVR Estimates
Estimate 1 Cost per RFID reader $3,000 Number of RFID sites x 1000 Number of RFID readers per site x 2 Total Cost of Readers $6,000,000 Indirect infostructure costs (20%) x 20% Total Cost of Infostructure $1,200,000 RFID Cards + $41,008,032 RFID Reader Costs + $6,000,000 Infostructure Costs + $1,200,000 Total Cost $48,208,032 Estimate 2 Cost per RFID reader $3,000 Number of RFID sites x 500 Number of RFID readers per site x 2 Total Cost of Readers $3,000,000 Indirect infostructure costs (20%) x 20% Total Cost of Infostructure $600,000 RFID Cards + $41,008,032 RFID Reader Costs + $3,000,000 Infostructure Costs + $600,000 Total Cost $44,608,032
Estimate 3 Cost per RFID reader $3,000 Number of RFID sites x 100 Number of RFID readers per site x 2 Total Cost of Readers $600,000 Indirect infostructure costs (20%) x 20% Total Cost of Infostructure $120,000 RFID Cards + $41,008,032 RFID Reader Costs + $600,000 Infostructure Costs + $120,000 Total Cost $41,728,032

49
Table 10 ‐ Estimated Number of Highway Mil es Per Camera
Estimate 1 1.543 mi Estimate 2 3.086 mi Estimate 3 15.430 mi ** based on 1,543 miles of Arizona Highway
The major disadvantage of the EVR system is the high upfront cost to put an RFID chip in every registered vehicle. Also there are no large operational EVR examples that have proven their effectiveness to date. The main advantage of EVR is the relatively low cost of RFID readers ($3,000) a piece as opposed to the cost of ALPR cameras ($20,000). This could allow for an EVR system to be greatly expanded at a later date at a low relative cost.

50
4.3 Cost Comparison Chart
Figure 26 compares the cost of EVR and ALPR Systems.
Figure 26 ‐ Cost Comparison Chart
* the 8 stands for eight cameras per ALPR site ** the 10 stands for 10 cameras per ALPR site. As the chart indicates, the breakeven point between ALPR and EVR occurs at around $42 million when somewhere between 173 to 217 camera or RFID sites are used. It is therefore advantageous in terms of costs to use an ALPR system if the budget is less than $42 million, and advantageous to use an EVR system with a budget of more than $42 million.
4.4 Cost Benefit Analysis, ALPR Case Study Now understanding the costs of an ALPR or EVR system, it is important to estimate the potential benefits in terms of dollars. The previous section identified the following quantifiable potential benefits as:
1. The potential to levy road usage tolls, or HOT lane tolls,
2. The ability to better ensure registration compliance,
(173.47, $41,632,520)
(217.66, $41,791,625)

51
3. The ability to better ensure insurance compliance, and
4. The ability to locate stolen vehicles.
These benefits will be quantified to determine the overall benefit in the case study.
A) Cost Benefit Analysis Case Study of ALPR Technology Case Study Scope
This case study will consist of placing 10 ALPR cameras on I-10, I-17, Loop101, Loop 202, US 60 and five cameras on SR 51. The cameras will be placed in areas that receive the largest amount of traffic in the Phoenix metro area. Most of the designated camera sites have 100,000 or more vehicles counted on them daily (on average) according to AzDOT’s published Average Annual Daily Traffic (AADT) report.68 The number of lanes at each specified camera site was determined using the State Highway System Log from AzDOT.69 This configuration of ALPR cameras will be the most conducive to capture the maximum number of vehicles in Arizona with minimal camera locations. Also this configuration could easily be used to charge a toll to Arizona drivers.
Assumptions for the cost benefit analysis for ALPR technology:
• Assume that one camera will be placed over each lane at a given ALPR site.
• Assume the technology works at a rate of 95 percent.
Location of ALPR sites: Each camera site will be located at or around the following sites.
I-10 Sites – 88 Cameras
Site #1. Exit 128 – Litchfield Road (beginning milepost (BMP) 128.71) – 4 lanes
Site #2. Exit 134 – 91st Avenue (BMP 134.68) – 10 lanes
Site #3. Exit 138 – 59th Avenue (BMP 138.66) – 10 lanes
Site #4. Exit 141 – 35th Avenue (BMP 141.66) – 10 lanes
Site #5. Exit 144A – 7th Avenue (BMP 144.66) – 10 lanes
Site #6. Exit 148 – Washington St. (BMP 147.49) – 8 lanes
Site #7. Exit 151A – 32nd St / University Dr. (BMP 151.49) – 12 lanes
Site #8. Exit 154 – US 60 (BMP 154.94) – 10 lanes
Site #9. Exit 158 – Warner Rd. (BMP 158.74) – 8 lanes
Site #10. Exit 161 – SR 202 / Pecos Rd (BMP 161.25) – 6 lanes 68 Arizona Department of Transportation. "Average Annual Daily Traffic." 2006. Arizona Department of Transportation <http://tpd.azdot.gov/data/documents/SHSAADT0707.pdf>. . (Accessed 20 January 2008.) 69 Arizona Department of Tranportation. "State Highway System Log." 2006. Arizona Department of Tranportation. <http://tpd.azdot.gov/data/highwaylog.php>. (Accessed 19 January 2008.)

52
U.S. 60 Sites – 86 cameras
Site #1. Exit 172 – Priest Dr (BMP 172.68) – 6 lanes
Site #2. Exit 174 – Rural Rd (BMP 174.42)- 8 lanes
Site #3. Exit 176 – Price Rd / SL 101 (BMP 176.45)- 8 lanes
Site #4. Exit 178 – Alma School Rd (BMP 178.41) – 12 lanes
Site #5. Exit 180 – Mesa Dr (BMP 180.4) – 12 lanes
Site #6. Exit 182 – Gilbert Rd (BMP 182.41) – 12 lanes
Site #7. Exit 185 – Greenfield Rd (BMP 185.4)- 6 lanes
Site #8. Exit 187 – Superstition Springs Blvd (BMP 187.87)- 6 lanes
Site #9. Exit 189 – Sossaman Rd. (BMP 189.39) - 10 lanes
Site #10. Exit 192 – Crismon Rd. (BMP 192.39) – 6 lanes
I-17 Sites – 70 lanes
Site #1. Exit 150A – I-10 (BMP 193.89) – 6 lanes
Site #2. Exit 195B – 7th Ave (BMP 196.93) – 6 lanes
Site #3. Exit 200A – I-10 (BMP 200.6) – 6 lanes
Site #4. Exit 202 – Indian School Rd. (BMP 202.9) – 8 lanes
Site #5. Exit 204 – Bethany Home Rd. (BMP 204.91) – 8 lanes
Site #6. Exit 206 – Northern Ave. (BMP 206.91) – 8 lanes
Site #7. Exit 208 – Peoria Ave. (BMP 208. 95) – 8 lanes
Site #8. Exit 211 – Greenway Rd. (BMP 211.95) - 8 lanes
Site #9. Exit 214A – Utopia Rd. / Yorkshire Dr. (BMP 214.48) – 8 lanes
Site #10. Exit 217 – Pinnacle Peak Rd. (BMP 217.1) – 4 lanes
Loop 101 – 64 cameras
Site #1. Exit 6 – Bethany Home Rd. (BMP 6) – 6 lanes
Site #2. Exit 12 – Thunderbird Rd. (BMP 12.68) – 6 lanes

53
Site #3. Exit 19 – 59th Ave. (BMP 19.19) – 6 lanes
Site #4. Exit 25 – 7th Ave. (BMP 25.18) – 6 lanes
Site #5. Exit 31 – Tatam Blvd. (BMP 31.3) – 6 lanes
Site #6. Exit 37 – Frank Lloyd Wright Blvd. (BMP 37.8) – 8 lanes
Site #7. Exit 43 – Via De Ventura (BMP 43.39) – 6 lanes
Site #8. Exit 49 – McDowell Rd. (BMP 49.05) – 6 lanes
Site #9. Exit 55 – U.S. 60 (BMP 54.62) – 8 lanes
Site #10. Exit 60 – Chandler Blvd. (BMP 60.6) – 6 lanes
Loop 202 – 68 cameras
Site #1. Exit 1A – I-10 / SR 51 (BMP 0) – 4 lanes
Site #2. Exit 3 – SR 143 / McDowell Rd. (BMP 3.5) – 8 lanes
Site #3. Exit 8 – McClintock / Hayden Rd. (BMP 8.8) – 10 lanes
Site #4. Exit 12 – McKellips Rd. (BMP 12.73) – 6 lanes
Site #5. Exit 19 – Val Vista Dr. (BMP 19.02) – 6 lanes
Site #6. Exit 40 – Williams Field Rd. (BMP 40.75) – 6 lanes
Site #7. Exit 42 – Val Vista Dr. (BMP 42.5) – 6 lanes
Site #8. Exit 47 – McQueen Rd (BMP 46.6) – 6 lanes
Site #9. Exit 50 – Dobson Rd. (BMP 49.65) – 8 lanes
Site #10. Exit 52 – Chandler Village / McClintock (BMP 51.75) – 8 lanes
SR 51 – 40 cameras
Site #1. Exit 1 – I-10 (BMP 0) – 8 lanes
Site #2. Exit 3 – Indian School Rd. (BMP 2.62) – 8 lanes
Site #3. Exit 6 – Glendale Ave. / Lincoln Dr. (BMP 5.99) – 10 lanes
Site #4. Exit 10 – Cactus Rd. (BMP 10.53) – 6 lanes
Site #5. Exit 14 – Union Hills Dr. (BMP 14.52) - 8 lanes

54
Cost of the ALPR Trial:
416 cameras x $20,000 per camera = $8,320,000 in hard costs for the camera systems
$8,320,000 x 20% (estimated percent cost for installation) = $1,664,000 in installation costs
Total Cost = $9,984,000
Percent of Arizona Residents Captured by Theoretical ALPR Case Study (see Table 11)
To determine the amount of benefit in dollars for the case study, an approximation of the percentage of Arizona drivers captured by the cameras needs to be determined. This case study will assume that all registered Arizona drivers that reside in the Phoenix metropolitan area (as defined by the U.S. Census70) will at some point throughout the year be captured at least once by the ALPR system on one of the five highways utilized in the case study. This assumption may overestimate the number of Arizona vehicles captured by the system if less than all of Arizonans that reside in the Phoenix metro area utilize the ALPR portion of the highways. On the other hand, this assumption may underestimate the number of Arizona vehicles captured by the system if Arizonans that reside outside the Phoenix metro area utilize the ALPR portions of the highways. This study could over or under estimate the number of Arizonans captured if that number either inside or outside the Phoenix metropolitan area is disproportionate to the number of vehicles registered inside or outside of Phoenix. This study assumes that all of these over- and under-estimation factors will cancel each other out. The number of Arizona residents will be defined by the U.S. Census Bureau. 71
Table 11: Potential Number of Arizona Residents Captured by Case Study
4,039,182 Total Number of Arizonans in Phoenix Metropolitan Area (2006) ÷ 6,166,318 Total Number of Arizona Residents (2006) 65.50% Potential Number of AZ Vehicles Captured x 95% Equipment Percent Accuracy 62.23% % of AZ Vehicles Captured on Camera
Note: This capture rate is only relevant to enforcement benefits, not tolling.
70 U.S. Census Bureau. "Annual Estimates of the Population of Metropolitan and Micropolitan Statistical Areas." 2006. U.S. Census Bureau Web site. <http://www.census.gov/population/www/estimates/metro_general/2006/CBSA-EST2006-01.csv>. (Accessed 14 January 2008.) 71 U.S. Census Bureau. "Arizona QuickFacts." 2006. U.S. Census Bureau Web site. <http://quickfacts.census.gov/qfd/states/04000.html>. (Accessed 15 January 2008.)

55
Revenue Gains to AzDOT of ALPR Case Study
1. Direct Benefit of Registration Compliance
As reported in Section 3.1.2, approximately 200,000 vehicles are either not registered or have expired registration. The estimated cost to Arizona is roughly $25 million a year (see Section 3.1.2). Considering 62.23 percent of vehicles could be photographed and ticketed in the Phoenix metropolitan area case study, approximately $15,557,500 could potentially be recovered of the $25 million annual loss. In addition, approximately $18,459,907 could be generated in ticketing the noncompliant. See Tables 12, 13, and 14.
Table 12: Funds Generated by Noncompliant becoming Compliant
$25,000,000 Cost of Noncompliant to AZ x 62.23% % of AZ Vehicles Captured on Camera $15,557,500 $ Potentially Generated By Noncompliant becoming Compliant
Table 13: Funds Generated by Ticketing Noncompliant
200,000 Estimated Number of Unregistered AZ Vehicles x 62.23% % of AZ Vehicles Captured on Camera x $148.32 Average DPS Fine $18,459,907 Funds Potentially Generated by Fine
Total Direct Benefit from Registration Compliance
$15,557,500 + $18,459,907 = $34,017,407 during the first year.
The average fine for an Arizona resident whose vehicle is not registered varies by jurisdiction. Thus the average was found using the following data collected by calling various city courts. The average fine was reduced by 75 percent because in all jurisdictions one of the following applies: either a judge has unlimited power to reduce the fine generally depending on if the resident properly registers his/her vehicle, or the city’s law automatically reduces the fine provided the resident properly registers his/her car prior to the court appearance.
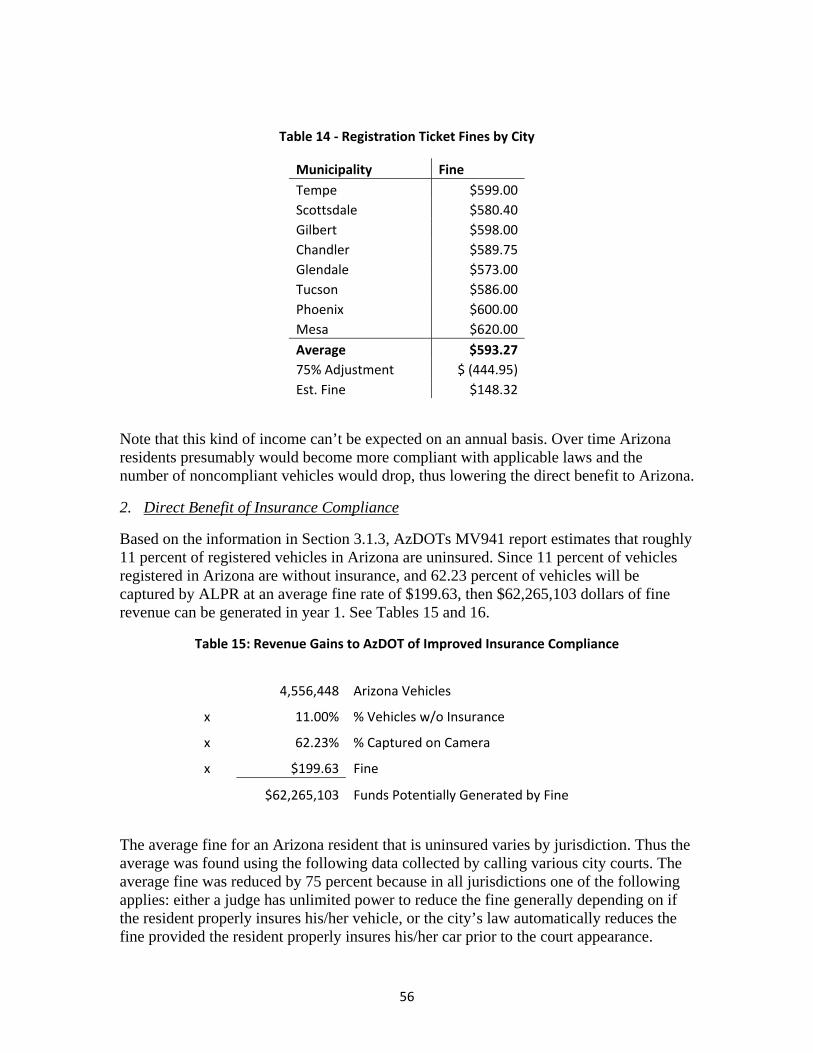
56
Table 14 ‐ Registration Ticket Fines by City
Municipality Fine Tempe $599.00Scottsdale $580.40Gilbert $598.00Chandler $589.75Glendale $573.00Tucson $586.00Phoenix $600.00Mesa $620.00Average $593.27 75% Adjustment $ (444.95)Est. Fine $148.32
Note that this kind of income can’t be expected on an annual basis. Over time Arizona residents presumably would become more compliant with applicable laws and the number of noncompliant vehicles would drop, thus lowering the direct benefit to Arizona.
2. Direct Benefit of Insurance Compliance
Based on the information in Section 3.1.3, AzDOTs MV941 report estimates that roughly 11 percent of registered vehicles in Arizona are uninsured. Since 11 percent of vehicles registered in Arizona are without insurance, and 62.23 percent of vehicles will be captured by ALPR at an average fine rate of $199.63, then $62,265,103 dollars of fine revenue can be generated in year 1. See Tables 15 and 16.
Table 15: Revenue Gains to AzDOT of Improved Insurance Compliance
4,556,448 Arizona Vehicles
x 11.00% % Vehicles w/o Insurance
x 62.23% % Captured on Camera
x $199.63 Fine
$62,265,103 Funds Potentially Generated by Fine
The average fine for an Arizona resident that is uninsured varies by jurisdiction. Thus the average was found using the following data collected by calling various city courts. The average fine was reduced by 75 percent because in all jurisdictions one of the following applies: either a judge has unlimited power to reduce the fine generally depending on if the resident properly insures his/her vehicle, or the city’s law automatically reduces the fine provided the resident properly insures his/her car prior to the court appearance.

57
Table 16 ‐ Insurance Ticket Fine by City
Insurance Ticket Municipality Fine Tempe $946.00Scottsdale $949.00Gilbert $966.00Chandler $497.75Glendale $483.00Tucson $586.00Phoenix $1,000.00 Mesa $960.50Average $798.53 75% Adjustment $ (598.90) Est. Fine $199.63
Note that this kind of income can’t be expected on an annual basis. Presumably over time Arizona residents would become more compliant with applicable laws and the number of noncompliant vehicles would drop, thus lowering the direct benefit to Arizona.
3. Direct Benefit of Potential Toll Tolling is one method that could help curb some of the congestion in Arizona during peak hours. Perhaps the best way to have a direct effect on peak hours is to charge a congestion charge during the peak hours of traffic. To determine how to apply the congestion charge, this subsection will attempt to determine the answers to the following questions:
What are the peak hours of rush hour traffic?
How much are people willing and able to pay to use Arizona highways during peak hours?
What is the direct benefit of tolling during peak hours?
During the hours of 6 AM to 9 AM and 3 PM to 7 PM on weekdays, only vehicles with two or more passengers can enter the HOV lanes on Arizona highways. These same hours will be used to implement a congestion charge using ALPR cameras.
For the purpose of this study, when vehicles are captured by the ALPR cameras between the hours of 6 AM to 9 AM or 3PM to 7 PM (on weekdays), they will be charged a flat fee for using valley highways. This means that each license plate can only be charged a maximum of twice per day—once between the first charging interval (6 AM to 9 AM)
58
and once between the second charging interval (3 PM to 7 PM). This charging approach is similar to the congestion charge in London, and it would encourage commuters to commute outside of peak hours and thus better distribute traffic. Road users would be billed for their peak hour road usage monthly.
The next determination that needs to be made for this case study is the amount that should be charged for the congestion charge. One method that can be used to generate a rough estimate of what toll road users are willing to pay for a toll is the utility method of travel alternatives. This method uses the assumption that the typical road user will use a tolled road if the travel time savings (in minutes) provided by the toll times the value of time to the road user (in dollars/minute) is greater than the total toll.
Travel Time Savings (minutes) x Value of Time ($/min) > Total Toll72
To determine the total time savings for the average peak time commuter, this research will assume that the average commuter travels 13 miles in 28 minutes as reported in Commuting in America for a metro area the size of Phoenix.73 This study assumes that the commuter that does not want to pay the toll but still wants to travel during peak periods will use surface streets.
Assume that:
1. The alternative for the commuter traveling at peak periods is to take 13 miles of surface streets.
2. The average surface street commuter travels at a rate of 25 mph.
3. The average surface street commuter stops an average of 1 minute per intersection.
Thus the assumed average commute via surface street during peak hours will be 44.2 minutes. This approximation is intended to be a conservative estimate; in reality the time savings may be greater, as intersection wait times during peak hours vary greatly.
13 miles / 25 mph = .52 hours
.52 hours x 60 minutes/hour = 31.2 minutes
31.2 minutes + (13 intersections * 1 minute / intersection) = 44.2 minutes of commute time
44.2 minutes of surface street commute – 28 minutes of freeway commute = 16.2 minutes or 0.27 hours of total time savings
To determine the value of time for the average commuter, average wage information from the Arizona Department of Economic Security was consulted. The following box
72 Smith, Don, et al., Estimating Revenues Using a Toll Viability Screening Tool. Austin, TX: TxDot, 2004. 73 Pisarski, Alan E. Commuting In America. Transportation Research Board, 2006.

59
plot was prepared using the information from the 2006 Occupational Employment and Annual Wage Estimates prepared by the Arizona Department of Economic Security.74
Box Plot of Average Wage Data for Arizona:
Figure 27 ‐ Arizonans’ hourly income according to the Arizona Department of Economic Security.
Based on the data from the Arizona Department of Economic Security, the “Value of Time” component will be set at the median (50th percentile) level of $14.07/hr for this case study. This amount is lower than the mean wage value of $17.50.75 (See Figure 27.)
Using the utility method described earlier:
Travel Time Savings (minutes) x Value of Time ($/min) > Total Toll
And Then Substituting the Values for Travel Time Savings and Value of Time:
.27 hours of time savings x $14.07/hr = $3.80
Therefore, this study will assume that the flat congestion charge will be $3.80 for travelling between 6 AM to 9 AM and then again from 3 PM to 7 PM. Again, each license plate can only be charged a maximum of twice per day, once during each peak hour interval. Also for the purposes of this survey, it will be assumed that those that make under $14.07/hour will avoid the congestion charge (50 percent of peak commuters).
By using traffic volume information from AzDOT’s Multimodal Planning Division, the amount directly generated by a toll can be estimated. For the purpose of this assessment the highest peak traffic volume at any one proposed camera location on each highway will be assumed to be that particular highway’s daily peak-hour traffic volume.
74 Arizona Department of Economic Security. Arizona Workforce Informer. 2006. <http://www.workforce.az.gov/cgi/databrowsing/?PAGEID=4&SUBID=143>. 75 Smith, Don, et al., Estimating Revenues Using a Toll Viability Screening Tool. Austin, TX: TxDot, 2004.

60
For example:
The Table 17 data was collected along the SR 51 in March at three different proposed locations for ALPR cameras. The highest traffic volume grand total was collected at the Glendale Ave. exit. Thus the daily peak-hour traffic volume of 69,488 vehicles will be used to estimate the effect of a toll on SR 51.
Table 17 ‐ Sample Data Collected to Determine Traffic Count Information
All traffic volume information is from 2007. The dates that the traffic data were collected vary because traffic data is not necessarily tabulated on a daily basis, and the data is not always accurate. Therefore this study relied on the expertise of the AzDOT’s Multimodal Planning Division to provide the data they felt was the most accurate in 2007.
The Table 18 data reflect the same methodology used above to determine the daily traffic volume during peak hours for each highway used in the case study.
Table 18 ‐ Traffic Count Totals for each Highway
Highway 6AM – 9 AM Traffic 3PM – 7PM Traffic Total Traffic Volume for Peak Hours
US 60 61,253 69,240 130,493 I-17 30,921 42,579 73,500 SR 51 26,968 42,520 69,488 Loop101 35,821 45,645 81,466 Loop 202 – North Side
55,581 54,839 110,420
Loop 202 – South Side
9,676 13,477 23,153
Total 220,220 268,300 488,520
Assuming that roughly 488,520 vehicles use the proposed ALPR sections, and that roughly 50 percent of current peak hour highway users will forgo paying the toll, it can be estimated that roughly 244,260 vehicles will pay the $3.80 toll. Therefore, it can be reasonably estimated that $241 million per year could be generated in revenue if such a toll were to exist.
(244,260 tolls assessed/day x $3.80 per toll) x 260 weekdays per year = $241,328,880 per year
Route Location 6:00 7:00 8:00 Total 15:00 16:00 17:00 18:00 Total Grand Total
SR 51 Exit 3 Indian School Rd 9,375 9,408 9,001 27,784 10,473 8,880 7,641 8,582 35,576 63,360
SR 51 Exit 6 Glendale Ave 9,945 8,347 8,676 26,968 11,463 10,906 10,918 9,233 42,520 69,488
SR 51 Exit 10 Cactus Rd 8,485 9,818 9,579 27,882 10,861 10,823 10,192 9,225 41,101 68,983

61
4. Total Direct Benefit
The sum of the revenue gains to AzDOT in terms of revenue for this case study are shown in Table 19. Table 19 ‐ Sum of Revenue Gains to AzDOT for ALPR
Description Benefit in Dollars Per Year Direct Benefit of Registration Compliance* $34,017,407 Direct Benefit of Insurance Compliance* $62,265,103 Subtotal of Compliance Benefits $96,282,510 Direct Benefit of Potential Toll $241,328,880 Grand Total of Revenue Gains to AzDOT (Dollars Per Year)
$337,611,390
*Note that the revenue gains to AzDOT of both registration compliance and insurance compliance will most likely go down after year 1. Presumably Arizona residents will become more compliant with applicable laws and these numbers will fall in subsequent years.
The total revenue potential per year of an ALPR system that is only used for registration and insurance enforcement is estimated to be $96 million. The total revenue potential per year of an ALPR system that is utilized for both tolling and enforcement is estimated to be $338 million. Both revenue examples far outweigh the start-up cost of $10 million. Despite not knowing the annual maintenance cost of an ALPR system, and not knowing the costs to change the Arizona Motor Vehicle Division, police, and court information structure, there is little doubt that this system would generate a substantial annual surplus.
Indirect Benefits of ALPR Case Study
Indirect benefits are benefits that do not directly benefit the state. In most cases, they benefit Arizonans collectively, instead of the government.
1. Indirect Benefit of Insurance Compliance According to the estimate in Section 3.1.3, uninsured Arizona drivers cost roughly $376,313,841 worth of damage. This figure comes from taking the total economic losses caused by crashes in 2006 ($3,421,034,916, according to the Arizona Crash Facts76) and then multiplying that by Arizona’s estimated uninsured rate of 11 percent according to AzDOT’s MV941 report for May 2008. Considering that 62.23 percent of all Arizona drivers per year can be captured on camera in the case study, approximately $234,180,103 can potentially be saved when uninsured drivers become insured.
$376,313,841 Cost of uninsured drivers x 62.23% % captured on camera $234,180,103 Indirect Savings by Fewer Uninsured drivers
76 Arizona Department of Transportation. "Arizona Motor Vehicle Crash Facts." 2006. Arizona Department of Transportation. <http://www.azdot.gov/mvd/Statistics/crash/PDF/05crashfacts.pdf>.

62
2. Indirect Benefit of Recovering Stolen Vehicles The Insurance Information Institute (III) estimates that 54,849 vehicles are stolen in Arizona per year (4th highest state for vehicle theft). The average cost per vehicle stolen in the United States is $6,649 according to the III.77 Based on this information and the estimated capture rate of 62.23 percent, $226,947,210 could be potentially saved by police recovering stolen vehicles identified by the ALPR system set up by the case study.
54,849 Number of Stolen Vehicles in Arizona
x $6,649 Average Value of Stolen Vehicle x 62.23% % of AZ Vehicles Captured on Camera $226,947,210 Indirect Savings from Recovered Stolen Vehicles
3. Indirect Benefits of Tolling According to the Texas Transportation Institute (TTI), in 2003, congestion cost Phoenix drivers $1,687,000,000 annually. The institute also estimates that 72 percent of all congestion comes from peak-hour traffic. It can therefore be inferred that $1,214,640,000 of this cost is during peak hours.
$1,687,000,000 annual cost of congestion x 72% = $1,214,640,000 annual cost of congestion during peak hours
If peak-hour congestion were reduced by 50 percent by the toll proposed in the case study, then Phoenix could save an estimated $607,320,000.
$1,214,640,000 annual cost of congestion x 50% reduction in peak-hour congestion= $607,320,000 in annual indirect savings
4. Total Indirect Benefit
Based on the previous three subsections, collectively Arizonans would receive an estimated $1,302,627,417 in bene-fits to highway users with tolling and $695,307,417 without tolling (see Tables 20 and 21).
Table 20 - Total Indirect Benefits of an ALPR Application
Indirect Benefit Total Benefit (Dollars per year) Insurance Compliance $234,180,103 Recovering Stolen Vehicles $226,947,210 Subtotal (excluding tolling) $461,127,313 Tolling $607,320,000 Total $1,068,447,313
77 Insurance Information Institute. " Auto Theft.” Insurance Information Institute Web Page. Accessed January 1, 2008.. <http://www.iii.org/media/hottopics/insurance/test4/>.
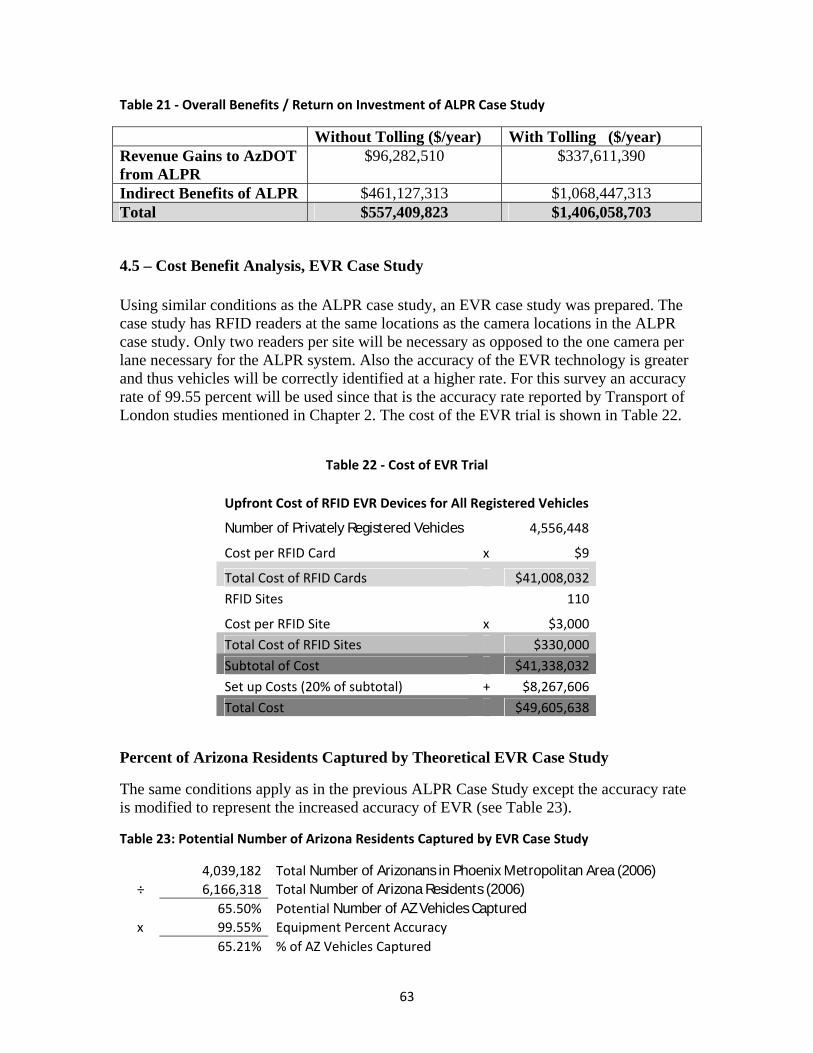
63
Table 21 - Overall Benefits / Return on Investment of ALPR Case Study
Without Tolling ($/year) With Tolling ($/year) Revenue Gains to AzDOT from ALPR
$96,282,510 $337,611,390
Indirect Benefits of ALPR $461,127,313 $1,068,447,313 Total $557,409,823 $1,406,058,703
4.5 – Cost Benefit Analysis, EVR Case Study Using similar conditions as the ALPR case study, an EVR case study was prepared. The case study has RFID readers at the same locations as the camera locations in the ALPR case study. Only two readers per site will be necessary as opposed to the one camera per lane necessary for the ALPR system. Also the accuracy of the EVR technology is greater and thus vehicles will be correctly identified at a higher rate. For this survey an accuracy rate of 99.55 percent will be used since that is the accuracy rate reported by Transport of London studies mentioned in Chapter 2. The cost of the EVR trial is shown in Table 22.
Table 22 ‐ Cost of EVR Trial
Upfront Cost of RFID EVR Devices for All Registered Vehicles
Number of Privately Registered Vehicles 4,556,448
Cost per RFID Card x $9
Total Cost of RFID Cards $41,008,032 RFID Sites 110
Cost per RFID Site x $3,000 Total Cost of RFID Sites $330,000
Subtotal of Cost $41,338,032 Set up Costs (20% of subtotal) + $8,267,606
Total Cost $49,605,638
Percent of Arizona Residents Captured by Theoretical EVR Case Study
The same conditions apply as in the previous ALPR Case Study except the accuracy rate is modified to represent the increased accuracy of EVR (see Table 23).
Table 23: Potential Number of Arizona Residents Captured by EVR Case Study
4,039,182 Total Number of Arizonans in Phoenix Metropolitan Area (2006) ÷ 6,166,318 Total Number of Arizona Residents (2006) 65.50% Potential Number of AZ Vehicles Captured x 99.55% Equipment Percent Accuracy 65.21% % of AZ Vehicles Captured

64
Revenue Gains to AzDOT of EVR Case Study
1. Direct Benefit of Registration Compliance
The same conditions apply as the previous ALPR study except a modified percentage of vehicle capture rate is being used. See the above percent capture rate calculation.
Funds Generated by Noncompliant becoming Compliant
$25,000,000 Cost of Noncompliant to AZ x 65.21% % of AZ Vehicles Captured on Camera $16,302,500 $ Potentially Generated By Noncompliant becoming Compliant
Funds Generated by Ticketing Noncompliant 200,000 Estimated Number of Unregistered AZ Vehicles x 65.21% % of AZ Vehicles Captured on Camera x $148.32 Average DPS Fine $19,343,894 Funds Potentially Generated by Fine
Total Direct Benefit from Registration Compliance
$16,302,500 + 19,343,894 = $35,646,394
The average fine for an Arizona resident that is not registered varies by jurisdiction. Thus the average was found using the following data collected by calling various city courts. The average fine was reduced by 75 percent because in all jurisdictions one of the follow-ing applies: either a judge has unlimited power to reduce the fine generally depending on if the resident properly registers his/her vehicle, or the city’s law automatically reduces the fine provided the resident properly registers his/her car prior to the court appearance.
Table 24 - Registration Fines by City Registration Ticket Municipality Fine Tempe $599.00Scottsdale $580.40Gilbert $598.00Chandler $589.75Glendale $573.00Tucson $586.00Phoenix $600.00Mesa $620.00Average $593.27 75% Adjustment $ (444.95) Est. Fine $148.32
Note that this kind of income can’t be expected on an annual basis. Presumably over time Arizona residents would become more compliant with applicable laws and the number of noncompliant vehicles would drop, thus lowering the direct benefit to Arizona.

65
2. Direct Benefit of Insurance Compliance
Based on the information in Section 3.1.3, roughly 11 percent of vehicles in Arizona are uninsured. The estimated revenue gains to AzDOT of improved insurance enforcement are shown in Tables 25 and 26.
Table 25: Revenue Gains to AzDOT from Improved Insurance Compliance
4,556,448 Arizona Vehicles x 11.00% % Vehicles w/o Insurance x 65.21% % Captured x $199.63 Fine
$65,246,784 Funds Potentially Generated by Fine
The average fine for an Arizona resident that is uninsured varies by jurisdiction. Thus the average was found using the following data collected by calling various city courts. The average fine was reduced by 75 percent because in all jurisdictions one of the following applies: either a judge has unlimited power to reduce the fine generally depending on if the resident properly insures his/her vehicle, or the city’s law automatically reduces the fine provided the resident properly insures his/her car prior to the court appearance.
Table 26 ‐ Insurance Fines by City
Insurance Ticket Municipality Fine Tempe $946.00Scottsdale $949.00Gilbert $966.00Chandler $497.75Glendale $483.00Tucson $586.00Phoenix $1,000.00 Mesa $960.50Average $798.53 75% Adjustment $ (598.90) Est. Fine $199.63
Note that this kind of income can’t be expected on an annual basis. Presumably over time Arizona residents would become more compliant with applicable laws and the number of noncompliant vehicles would drop, thus lowering the direct benefit to Arizona.

66
3. Direct Benefit of Potential Toll
The conditions for the revenue gains to AzDOT of a potential toll are unchanged from the previous ALPR example. Therefore, $241,328,880 could potentially be generated in revenue from an EVR toll.
(244,260 tolls assessed/day x $3.80 per toll) x 260 workdays per year = $241,328,880 per year 4. Total Direct Benefit
The sum of the revenue gains to AzDOT in terms of revenue for this case study is shown in Table 27.
Table 27 ‐ Sum of Revenue Gains to AzDOT from EVR
Description Benefit in Dollars Per Year Direct Benefit of Registration Compliance* $35,646,394 Direct Benefit of Insurance Compliance* $65,246,784 Subtotal of Compliance Benefits $100,893,178 Direct Benefit of Potential Toll $241,328,880 Grand Total of Revenue Gains to AzDOT (Dollars Per Year)
$342,222,058
*Note that the revenue gains to AzDOT of both registration compliance and insurance compliance will most likely go down after year 1. Presumably Arizona residents will become more compliant with applicable laws and these numbers will fall in subsequent years.
The total revenue potential per year of an EVR system that is only used for registration and insurance enforcement is estimated to be $100 million. The total revenue potential per year of an EVR system that is utilized for both tolling and enforcement is estimated to be $342 million. Both revenue examples far outweigh the start-up cost of $50 million. Despite not knowing the annual maintenance cost of an EVR system, and not knowing the costs to change the Arizona Motor Vehicle Division, police, and court information structure, there is little doubt that this system would generate a substantial annual surplus.
Indirect Benefits of EVR
1. Indirect Benefit of Insurance Compliance
The calculation for the benefits to highway users of insurance compliance uses the same numbers as the previous ALPR case study except for the modified EVR percent capture rate.
$376,313,841 Cost of uninsured drivers x 65.21% % captured $245,394,256 Indirect Savings by Fewer Uninsured drivers

67
2. Indirect Benefit of Recovering Stolen Vehicles
The calculation for the benefits to highway users of recovering stolen vehicles uses the same numbers as the previous ALPR case study except for the modified EVR percent capture rate.
54,849 Number of Stolen Vehicles in Arizona
x $6,649 Average Value of Stolen Vehicle
x 65.21% % of AZ Vehicles Captured
$237,815,002 Indirect Savings from Recovered Stolen Vehicles
3. Indirect benefits of Tolling
The benefits to highway users of tolling will be the same as the ALPR example as no variables change in this instance.
$1,214,640,000 annual cost of congestion x 50% reduction in peak-hour congestion = $607,320,000 in annual indirect savings
4. Total Indirect Benefit
Based on the previous three subsections, the State of Arizona would receive an estimated $1,090,529,258 in benefits to highway users (see Table 28).
Table 28 ‐Total Indirect Benefit of EVR
Indirect Benefit Total Benefit (Dollars per year) Insurance Compliance $245,394,256 Recovering Stolen Vehicles $237,815,002 Subtotal (excluding tolling) $483,209,258 Tolling $607,320,000 Total $1,090,529,258
5. Overall Benefits of EVR Case Study
The overall benefits are shown in Table 29.
Table 29 ‐ Overall Benefits of EVR Case Study
Without Tolling ($/year) With Tolling ($/year) Revenue Gains to AzDOT of EVR
$100,893,178 $342,222,058
Indirect Benefits of EVR $483,209,258 $1,090,529,258 Total $584,102,436 $1,432,751,316
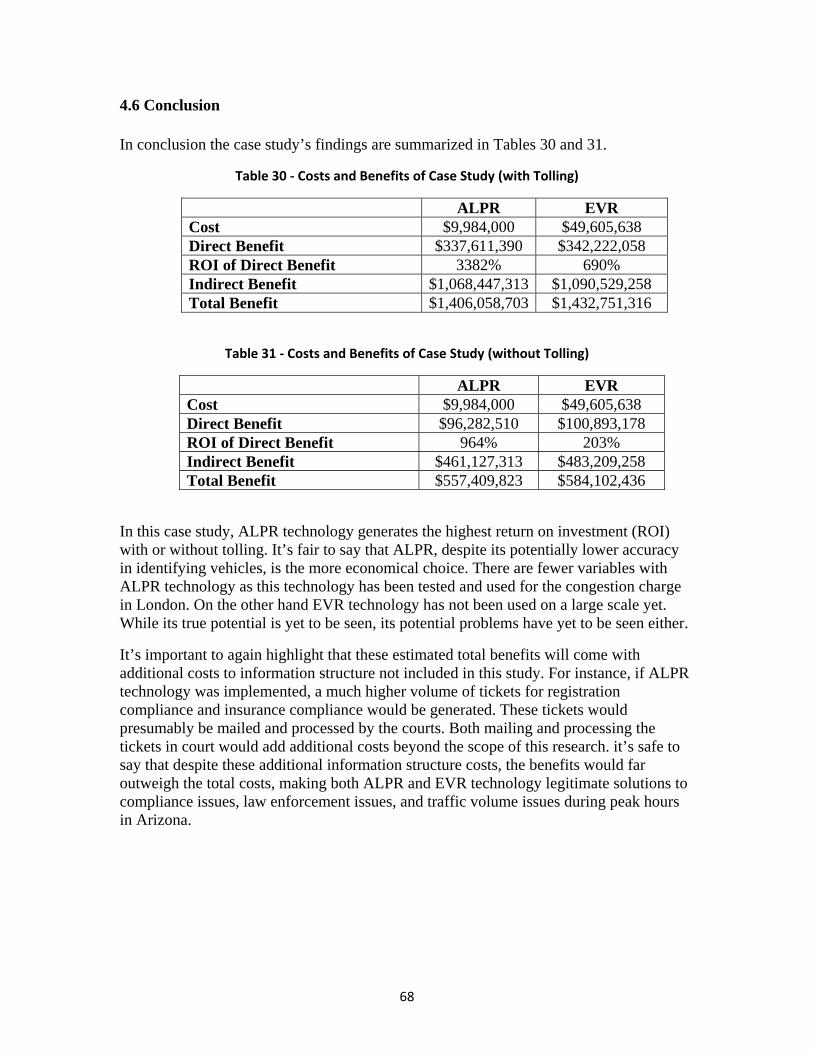
68
4.6 Conclusion In conclusion the case study’s findings are summarized in Tables 30 and 31.
Table 30 ‐ Costs and Benefits of Case Study (with Tolling)
ALPR EVR Cost $9,984,000 $49,605,638 Direct Benefit $337,611,390 $342,222,058 ROI of Direct Benefit 3382% 690% Indirect Benefit $1,068,447,313 $1,090,529,258 Total Benefit $1,406,058,703 $1,432,751,316
Table 31 ‐ Costs and Benefits of Case Study (without Tolling)
ALPR EVR Cost $9,984,000 $49,605,638 Direct Benefit $96,282,510 $100,893,178 ROI of Direct Benefit 964% 203% Indirect Benefit $461,127,313 $483,209,258 Total Benefit $557,409,823 $584,102,436
In this case study, ALPR technology generates the highest return on investment (ROI) with or without tolling. It’s fair to say that ALPR, despite its potentially lower accuracy in identifying vehicles, is the more economical choice. There are fewer variables with ALPR technology as this technology has been tested and used for the congestion charge in London. On the other hand EVR technology has not been used on a large scale yet. While its true potential is yet to be seen, its potential problems have yet to be seen either.
It’s important to again highlight that these estimated total benefits will come with additional costs to information structure not included in this study. For instance, if ALPR technology was implemented, a much higher volume of tickets for registration compliance and insurance compliance would be generated. These tickets would presumably be mailed and processed by the courts. Both mailing and processing the tickets in court would add additional costs beyond the scope of this research. it’s safe to say that despite these additional information structure costs, the benefits would far outweigh the total costs, making both ALPR and EVR technology legitimate solutions to compliance issues, law enforcement issues, and traffic volume issues during peak hours in Arizona.
69
Chapter 5 Legal Aspects and Public Opinion of a Potential ALPR or EVR
Application
The primary goal of this section is to determine if there would be anything unconstitutional or unlawful about a potential ALPR or EVR program in Arizona. Next, this section will take a look at some of the foreseeable effects of an ALPR or EVR system. For instance, in many states individuals have sued under the Freedom of Information Act to receive tolling records for civil lawsuits. The last part of this section will examine public opinion on a potential ALPR or EVR system.
5.1 Legal Aspects of an ALPR or EVR Application
The Fourth Amendment of the U.S. Constitution states, “The right of the people to be secure in their persons, houses, papers, and effects, against unreasonable searches and seizures, shall not be violated, and no Warrants shall issue, but upon probable cause, supported by Oath or affirmation, and particularly describing the place to be searched, and the persons or things to be seized.” The Fourth Amendment sets boundaries in what the government can and cannot do in terms of searches. Although privacy is never specifically mentioned in the Constitution, it is implied by the Fourth Amendment according to Supreme Court cases such as Katz v. United States. In Katz v. United States78 the court acknowledged that without a warrant, citizens have a right to privacy when they have a reasonable expectation of privacy. In short, this case determined that Mr. Katz had a reasonable expectation to privacy when he made a phone call from a phone booth with the door shut. Since FBI agents tapped the pay phone without a warrant, the information the FBI obtained was suppressed or not allowed into the court of law. If for instance, Mr. Katz had left the door open so that anyone could hear his conversation then Mr. Katz wouldn’t have had any expectation of privacy and thus information obtained from the wire tap would have been lawful.
There are several ways in which a citizen can waive his/her Fourth Amendment rights. The most obvious one is if someone consents to having his/her home searched by police. Another loophole to Fourth Amendment rights is under a doctrine called “plain view.” Essentially the plain view doctrine, which was established by the U.S. Supreme Court case Horton v. California,79 gives the government the right to seize without a warrant any evidence that is in plain view. This doctrine would apply to license plates. Because license plates are in plain view, and can be viewed by anyone, it is a police officer’s right to run any license plate for warrants affiliated with any given vehicle. No reasonable expectation of privacy can be expected when a license plate is in plain view. Similarly, if an RFID device were to transmit the same information that is in plain view (i.e. the 78 Katz v. United States. No. 389 U.S. 347. U.S. Supreme Court. 18 December 1967. 79 Horton v. California. No. 496 U.S. 128. U.S. Supreme Court. 4 June 1990.
70
vehicle’s license plate number) it is presumable that the RFID device would not be unlawful if used to scan for vehicles associated with felonies or vehicles not in compliance with registration or insurance laws.
One conceivable situation that the RFID in EVR could be used illegally would be if a police officer had an RFID scanner in his/her vehicle that alerted the officer to a stolen vehicle that is out of sight in a resident’s closed garage. Because the vehicle was out of sight in a resident’s garage and the homeowner has a reasonable expectation of privacy when his garage door is closed, it would probably be unlawful for the officer to search the home. It would also be unlikely that the officer would be able to lawfully obtain a warrant. This situation would probably be unlawful under the Fourth Amendment of the Constitution and Article 2 Section 8 of the Arizona Constitution. Article 2, Section 8 of the Arizona Constitution states that, “No person shall be disturbed in his private affairs, or his home invaded, without authority of law.” Section 8 of the Arizona Constitution has been interpreted by the courts to grant more privacy to the Arizona citizen then they are granted by the Fourth Amendment of the U.S. Constitution. Kyllo v. United States80 is a unique case that determined that using thermal imaging devices to detect heat constitutes a search and thus needs a search warrant. In the case federal authorities used thermal imaging to determine if it was probable that Kyllo was growing marijuana. Because authorities did not obtain a warrant prior to using the thermal imaging device, Kyllo’s expectation to privacy was determined to have been invaded. Similarly in the theoretical RFID example, scanning a home using an RFID scanner would constitute a search and therefore such evidence would probably be suppressed. However, this would not theoretically prevent police from staking out the home to see the stolen vehicle in plain view.
Based on the evidence presented, it appears that either an ALPR system or EVR system would be within the guidelines of the law. Although there may be instances where technology can be unlawful or unconstitutional, this does not prevent ALPR or EVR from being used lawfully and constitutionally. These unlawful or unconstitutional situations merely highlight the necessity that police and other government officials be trained in how ALPR and EVR can and cannot be used in law enforcement.
5.2 Authority of Arizona Department of Transportation Another legal question pertaining to an ALPR system or EVR system is if the AzDOT has the authority to establish such a system. Under 1973 Arizona Session Laws, Chapter 146 (A.R.S. §28-101 et seq) the AzDOT was established. Its purpose and mission statement is to “support Arizona through licensing, vehicle credentialing, revenue collection, safety programs, and by promoting compliance with transportation laws.”81 By this definition it appears AzDOT would have the authority to establish either an ALPR or EVR system since it would be acting on its duty of revenue collection and
80 Kyllo v. United States. No. 533 U.S. 27. U.S. Supreme Court. 11 June 2001. 81 Davenport, Debra. "Performance Audit of the Arizona Department of Transportation." September 2004. Official Site of the Arizona Auditor General. <http://www.auditorgen.state.az.us/Reports/State_Agencies/Agencies/Transportation,%20Department%20of/Performance/04-11/04-11.pdf>. (Accessed 5 January 2008.)

71
compliance. However despite this apparent authority, it might be best to request legislative approval before establishing an ALPR or EVR system. This approach might better avoid potential controversy from the Arizona Legislature and the public.
5.3 Lawsuits for Records One potentially unforeseen cost that may come with an ALPR system or EVR system is the administrative cost of producing records in response to subpoenas. A growing trend on the East Coast has been the subpoena of E-ZPass records in criminal cases, and civil cases. Of the 12 states that use E-ZPass, seven states provide records for both civil and criminal cases, four states provide records for only criminal cases, and one state (West Virginia) has no policy on producing E-ZPass records.82 The majority of civil cases have involved divorce hearings and child custody hearings. “Whereabouts can be very important, especially in a custody case where somebody says, ‘I’m always around. I can take care of this child,’” says Barbara Ellen Handschu, a New York divorce attorney who is quoted in an Associated Press article.83 By using E-ZPass records, a divorce attorney can easily prove where a spouse was or was not. One Pennsylvania divorce lawyer used E-ZPass to prove that her client’s spouse was not in a business meeting in Pennsylvania as he said but instead was in New Jersey for the night as his E-ZPass records indicated. E-ZPass records can reflect infidelity or dishonesty. Despite the usefulness to divorce lawyers, the cost could become cumbersome to authorities. The Illinois Tollway for instance has handed over about 30 records in the first half of 2007 alone.84 Although this number seems small, it could become higher if obtaining such records became a precedent for divorce lawyers. The possibility of such records being requested should be considered if an ALPR or EVR system were implemented. The AzDOT would need to formulate a policy regarding such requests. Along with the policy, administrative costs could be deferred to the party requesting records by charging for the records in accordance with the Freedom of Information Act.
5.4 Arizona Transportation Quality Initiative It is important to have an idea how Arizonans would feel about a potential EVR or ALPR. Although an EVR or ALPR program may be well intended and legal, if it is unpopular it may become illegal because of future changes in the law influenced by public sentiment. For instance, in California one school district tried to place RFID chips 82 WCBS Television. "Not So Fast: E-ZPass Data Used To Catch Cheaters." 11 August 2007. WCBS Television Website. Accessed 1 January 2008 <http://wcbstv.com/topstories/e.z.pass.2.246457.html>. 83 Apuzzo, Matt. "Electronic Toll Records Help Solve Crime." 11 December 2003. Officer.com - Law Enforcement News. <http://www.officer.com/article/article.jsp?id=7813&siteSection=1>. (Accessed 1 January 2008.) 84 WCBS Television. "Not So Fast: E-ZPass Data Used To Catch Cheaters." 11 August 2007. WCBS Television Website. <http://wcbstv.com/topstories/e.z.pass.2.246457.html>. (Accessed 1 January 2008.)

72
into student identification cards. Parents fearing their children could be somehow tracked caused the school district to abandon the effort, and in response California State Bill 768 (formerly known as California State Bill 682) was written to put major restrictions on the use of RFID technology.85 This bill would have threatened the use of RFID technology for EVR in the State of California. The bill passed both California Houses but was vetoed by Governor Schwarzenegger. In a 2000 report, the Arizona Transportation Quality Initiative sought to better understand Arizonans’ concerns and opinions regarding Arizona transportation. The report found that 65 percent of Arizonans opposed paying for the roads via tolling if it was determined that significant money was needed to improve the transportation system in Arizona (see Table 32). Despite the majority opposing tolling as a means of funding roads, 87 percent of Arizonans list widening major highways as a moderate, high, or very high priority; 73 percent of people list building more freeways as a moderate, high, or very high priority.86 This suggests that a majority of people support building or widening roads, yet not as many people support paying for the roads by increasing funding. Table 32 ‐ Percentage of Arizonans that Oppose Increases in the Following to Improve Arizona
Roads and Highways (According to the Arizona Transportation Quality Initiative)
5.5 Conclusion It appears that AzDOT has the legal ability and legal authority to implement an ALPR or EVR system that could potentially charge tolls, monitor traffic flow, cite unregistered vehicles, cite vehicles without insurance, and flag vehicles associated with felonies. The largest opposition to such a program may very well be the public’s opposition to paying tolls and/or their perceived loss of privacy.
85 Zetter, Kim. "State Bill to Limit RFID." 29 April 2005. Wired. <http://www.wired.com/politics/security/news/2005/04/67382>. (Accessed 1 January 2008.) 86 Behavior Research Center. SPR 463: Arizona Transportation Quality Initiative. Phoenix, AZ, 2000.
73
Chapter 6 Conclusion / Recommendations
Both ALPR and EVR technology appear to be more than capable of achieving the desired goals listed below. Goals of an ALPR or EVR system are for AzDOT to be able to:
1. Potentially monitor traffic flow more accurately, 2. Better enforce license and registration compliance, 3. Better enforce auto insurance compliance, 4. Implement a toll, or congestion charge, 5. Aid law enforcement in finding suspected criminals.
Both forms of technology have the potential to generate a large surplus if either technology were just used for insurance compliance, registration compliance, and law enforcement. In the case study, $96 million of direct annual revenue was projected using an ALPR system with a cost estimate of $10 million. On the other hand, $100 million of direct annual compliance revenue was projected for an EVR system that cost $50 million These surpluses are possible because of the large amount of revenue lost annually to noncompliance. Tolling or implementing a congestion charge using either technology could be a useful means to limit congestion problems during peak hours. The case study found that a total of $338 million could be generated by using an ALPR system for a congestion charge and for enforcement purposes, while a total of $342 million could be generated through tolling and enforcement using an EVR system. Tolling is a more controversial aspect of an ALPR or EVR program as reflected by the public opinion polls cited at the end of Chapter 5. However, an ALPR or EVR program could be implemented for registration and insurance enforcement and then tolling could be an optional feature that the state could implement later. It is the recommendation of this report that ALPR technology be pursued and further researched for the State of Arizona to best achieve the previously stated goals for an ALPR or EVR system. It seems that the ALPR technology is the optimal choice for the State of Arizona at present for the following reasons: A) ALPR’s Previous Applications
ALPR technology has been already used in several widespread applications. Transport for London has relied on ALPR technology for the London congestion charge and police forces throughout the United States (and abroad) have relied on ALPR technology for enforcement purposes. These applications and their overall success make ALPR technology a reliable choice for the five stated goals of an ALPR or EVR system. Furthermore, the technology has become increasingly accurate since the London congestion charge cameras have been implemented.

74
EVR on the other hand has not been used in a widespread application. Thus far it has only been used on a voluntary basis for toll roads and HOT lanes. Bermuda’s EVR program, which is in the process of being implemented, will be the first widespread EVR application. This program is not yet fully operational at the time this report is being written and thus the possible problems of the Bermuda EVR application have yet to be recognized and/or analyzed. It would be beneficial to further research future EVR applications. Currently Brazil, China, Dubai, India, and Mexico are either implementing or researching RFID technology.87 The current lack of widespread EVR applications is a drawback of the technology at present.
B) Low Cost of an ALPR Trial vs. High Up-Front Cost of EVR One big advantage of ALPR technology is a lower up-front cost. This lower up-front cost would allow for a cost-effective ALPR trial to be run. The trial could consist of using the technology on just one major Phoenix metro area highway or maybe all of the major Phoenix-area highways as demonstrated in the case study. The cost of placing a $9 RFID tag in every Arizona vehicle is high at the present (a total cost of $42 million). This will likely change as EVR becomes more prevalent and technology and competition further develop. However at present the high up-front cost of EVR is a large drawback of the technology.
C) ALPR’s Ability to Read Virtually Any State’s Plate and Lack of an EVR Standard A potential advantage of ALPR over EVR is that ALPR cameras have the capability to read out-of-state plates. This might aid in identifying individuals that may have out-of-state plates but do not have their cars registered in Arizona. For instance if the ALPR system recognizes that certain out-of-state plates are being recognized nine months out of the year, then a letter could be sent to the vehicle owners requesting them to register their cars. The cost of these residents that do not have Arizona plates is virtually unquantifiable since it is unknown how many there are. Currently, the only way the state can recognize these people is through a whistleblower hotline set up by AzDOT. Increasing registration compliance is the topic of AzDOT’s research project SPR 623 which is currently underway. Early research for SPR 623 has indicated that organizations and/or municipalities are reluctant to disclose records of new residents citing privacy laws. Therefore, ALPR’s ability to read out-of-state plates may be a very valuable technological advantage over EVR. Since an out-of-state plate will probably not have an RFID chip, EVR would not recognize the out-of-state plate. In order for out-of-state plates to be recognized by an EVR system, a national standard for such a program would need to be adopted. Such a standard or mandate by the federal government is unlikely since most regulation regarding roads and driving laws (including vehicle registration) come from the states. In 2005, the REAL ID Act attempted to create a standard for state-issued
87 Bacheldor, Beth. "Electronic Vehicle Registration Picks Up Speed." 28 February 2008. RFID Journal. <http://www.rfidjournal.com/article/articleview/3945/1/1/>.

75
identifications and drivers licenses. There has been much controversy and opposition between states and the federal government over the standard passed by the federal government. An EVR standard might be difficult or unlikely in light of the REAL ID Act of 2005. The current impossibility of identifying out-of-state plates with EVR favors the use of ALPR technology.
D) The Possibility that EVR Technology Will Require ALPR Technology to Ensure Effectiveness The RFID technology that has been designed for EVR has been designed to be tamper resistant in many cases. For example, the EVR system that is being built by Transcore and 3M for the Bermuda EVR system features tamper-resistant, tamper-evident RFID tags. Despite the tags being tamper resistant and tamper evident, it is probably not impossible to remove the tags. It might be necessary for ALPR cameras to back up an EVR system when a car goes by that does not emit an RFID signal. EVR’s potential need for a back-up medium may prove to be a disadvantage.
E) The Potentially Lower Degree of Public Opposition to ALPR ALPR might be perceived as less intrusive by the public, as it will not be necessary to install an RFID device in all Arizona vehicles with ALPR. From personal experience researching this topic, the author noted a perception among many that an RFID tag would allow the government to track a citizen’s individual movements similar to a GPS. This false perception might be better avoided if an ALPR system were implemented over an EVR system. The public is used to photo radar in enforcing speed limits. Using ALPR to enforce registration and insurance laws might not be as negatively perceived given the prevalence of photo radar. The less intrusive nature of ALPR may be an advantage in gaining support from the public on a future electronic license plate system.
Both ALPR technology and EVR technology are rapidly progressing in effectiveness and affordability. A change in the technology’s effectiveness, the technology’s affordability, or U.S. policy regarding a standard could change the variables that generated the recommendation for ALPR technology. This report simply suggests that based on the information available today it appears that ALPR technology should be further researched and implemented, more so than EVR technology.

76
Bibliography 407 ETR. 407 ETR - Tolls & Fees. <http://www.407etr.com/about/custserv_fees.asp>. (Accessed 1 June 2007.)
Apuzzo, Matt. "Electronic Toll Records Help Solve Crime." 11 December 2003. Officer.com - Law Enforcement News. <http://www.officer.com/article/article.jsp?id=7813&siteSection=1>. (Accessed 1 January 2008.)
Arizona Department of Transportation. Arizona Motor Vehicle Crash Facts. 2006. <http://www.azdot.gov/mvd/Statistics/crash/PDF/05crashfacts.pdf>.
Arizona Department of Economic Security. Arizona Workforce Informer. 2006. <http://www.workforce.az.gov/cgi/databrowsing/?PAGEID=4&SUBID=143>.
Arizona Department of Transportation. Average Annual Daily Traffic. 2006. <http://tpd.azdot.gov/data/documents/SHSAADT0707.pdf>. (Accessed 20 January 2008.)
Arizona Department of Transportation. State Highway System Log. 2006. <http://tpd.azdot.gov/data/highwaylog.php>.(Accessed 19 January 2008.)
Bacheldor, Beth. "Electronic Vehicle Registration Picks Up Speed." 28 February 2008. RFID Journal. <http://www.rfidjournal.com/article/articleview/3945/1/1/>.
Barge, C. “Police Steal Cue from 'Knight Rider'”. 3 May 2007. Rocky Mountain News . http://www.rockymountainnews.com/drmn/local/article/0,1299,DRMN_15_5518138,00.html. (Accessed 25 September 2007.)
Bayliss, David. "Road User Charging and Taxation." Proceedings of the Institution of Civil Engineers. Thomas Telford, 2006. 147-152.
Behavior Research Center. SPR 463: Arizona Transportation Quality Initiative. Phoenix, AZ, 2000.
“Border Crossing Database,” TranStats The Intermodal Transportation Database; Bureau of Transportation Statistics. http://www.transtats.bts.gov/BorderCrossing.aspx. Accessed July 16, 2008. (Accessed 10 July 2008.)
Bulwa, Demian. "License plate recognition tools led to abduction arrest." 13 October 2007. San Francisco Chronicle. <http://www.sfgate.com/cgi-bin/article.cgi?file=/c/a/2007/10/13/MNJFSO1NM.DTL>. (Accessed 16 October 2007.)

77
Castro, Alex. "H-407, All Electronic Toll Collection System." Report of the Annual Meeting : International Bridge, Tunnel and Turnpike Association (1998): pp. 145-167.
"C-charge plans 'will waste £166m'." 21 June 2006. BBC News. <http://news.bbc.co.uk/1/hi/england/london/5098642.stm>. (Accessed 7 June 2007.)
Hunstad, Lyn, “Characteristics of Uninsured Motorist,” California Department of Insurance; February 1999; p.2.
"Congestion Charge." 2006. BBC News. <http://www.bbc.co.uk/london/content/articles/2006/11/21/congestion_update_feature.shtml>. (Accessed 4 June 2007.)
"Congestion Charging: In London." 2003. BBC News. <http://news.bbc.co.uk/2/shared/spl/hi/uk/03/congestion_charge/exemptions_guide/html/works.stm>. (Accessed 4 June 2007.)
Davenport, Debra. "Performance Audit of the Arizona Department of Transportation." September 2004. Official Site of the Arizona Auditor General. <http://www.auditorgen.state.az.us/Reports/State_Agencies/Agencies/Transportation,%20Department%20of/Performance/04-11/04-11.pdf>. (Accessed 5 January 2008.)
Department for Transport, United Kingdom. City Congestion Charging in London. <http://www.dft.gov.uk/pgr/regional/policy/archive/urbanandlocaltransportcompen3715?page=6>. (Accessed 29 June 2007.)
Ernzen, Julie M. Port Runners - Impacts and Solutions. AzDOT Report. Phoenix, AZ: AzDOT, 2005.
Evens, Jeremy and Dan Firth. "Transport for London, Congestion Charging Technology Trials, Stage 1 Results." 12th World Congress on Intelligent Transport Systems. San Francisco: ITS America, 2005.
E-ZPass New York Service Center. E-ZPass Information. <http://www.e-zpassny.com/static/info/index.shtml>. (Accessed 1 June 2007.)
Fergueson, Renee. Eweek.com WeBMPage. <http://www.eweek.com/article2/0,1759,2126991,00.asp>. (Accessed 7 May 2007.)
Government of Ontario. "Province And 407 ETR Agree To Better Deal For Drivers." 31 March 2006. Government of Ontario, Canada - News. <http://ogov.newswire.ca/ontario/GPOE/2006/03/31/c1204.html?lmatch=&lang=_e.html>. (Accessed 1 June 2007.)
Graham, Daniel. "Road User Charging." Public Transport International (2006): 32.

78
Hauer, Ezra. "Safety Review of Highway 407." Transportaton Research Record (1999): 9.
Horton v. California. No. 496 U.S. 128. United States Supreme Court. 4 June 1990.
Hunstad, Lyn, “Characteristics of Uninsured Motorist,” California Department of Insurance; February 1999; p.2.
I-15 FasTrak. "Construction Progress Continues on I-15." Spring 2007. SANDAG Official Web site. <http://www.sandag.org/uploads/publicationid/publicationid_1288_6680.pdf>. (Accessed 29 May 2007.)
Insurance Information Institute. "Insurance Information Institute Web Page." January 2008. Auto Theft. <http://www.iii.org/media/hottopics/insurance/test4/>.
Insurance Research Council. (n.d.). Uninsured Drivers Increasing; Vary by State; Miss. Highest, Maine Lowest. Insurance Journal. http://www.insurancejournal.com/news/national/2006/06/28/69919.htm (Accessed 15 September 2007.)
Inter Agency Group. Inter Agency Group - E-ZPass. 2005. <http://www.e-zpass.info/index5.htm>. (Accessed 1 June 2007.)
Katz v. United States. No. 389 U.S. 347. U.S. Supreme Court. 18 December 1967.
Kyllo v. United States. No. 533 U.S. 27. U.S. Supreme Court. 11 June 2001.
Markkula, Lisa. Uninsured and Underinsured Motorists: Trends In Policy and Enforcement. Phoenix: Arizona Department of Transportation. (2004).
Nash, Chris. "Road Pricing in Britain." Journal of Transport Economics and Policy (2006): 135-147.
Nassereddine, Imad. "Toronto - Transportation Systems for the 21st Century." Institute of Transportation Engineers (1998): 32.
Olsen, Jeremy. "Arizona House Bill 2443." Representative J. P. Weiers, 2007.
Orange County Transportation Authority. SR 91 Current Traffic and Revenue Information. 2006. <http://www.91expresslanes.com/learnabout/trafficrevenue.asp>. (Accessed 31 May 2007.)
Owens, Nicholas D. "Electronic Toll Collection/Electronic Screening Interoperability Pilot Project." USDOT Synthesis. 2005.
79
PA Consulting Group. "Driving Crime Down - Official Report for the Home Office." October 2004. Police Home Office Web site (UK). <http://police.homeoffice.gov.uk/news-and-publications/publication/operational-policing/Driving_Crime_Down_-_Denyin1.pdf?view=Binary>. (Accessed 4 June 2007.)
Pennsylvania Turnpike Commission. PA Turnpike E-ZPass Agreement. <http://www.paturnpike.com/ezpass/personalterms.htm>. (Accessed 4 June 2007.)
Perez, Benjamin and Gian-Claudia Sciara. "A Guide for HOT Lane Development." Research Report FHWA-OP-03-009. 2003.
Pisarski, Alan E. Commuting In America. 2006: Transportation Research Board, 2006.
PrePass FAQ. Prepass Web site. <http://prepass.com/faqplus.htm>. (Accessed 5 December 2007.)
Quddus, Mohammed, Alon Carmel and Michael Bell. "The Impact of the Congestion Charge on Retail." Journal of Transport Economics and Policy (2006): pp. 114-115.
RFID Update. Chipsets Key to RFID Reader Cost Reductions. 8 December 2005. <http://www.rfidupdate.com/articles/index.php?id=1011>.
Roth, G. J. (2006). Street Smart: Competition, Entrepreneurship, and the Future of Roads. Transaction Publishers.
Robinson, Steve and John Polak. "Overtaking Rule Method for the Cleaning of Matched License-Plate Data." Journal of Transportation Engineering 132.8 (2006): pp. 609-617.
SANDAG. Interstate 15 FasTrak - When You Need the Time. May 2005 <http://www.sandag.org/uploads/publicationid/publicationid_831_4185.pdf>. . (Accessed 1 June 2007.)
—. San Diego's Regional Planning Agency. 23 March 2007. <http://www.sandag.org/index.asp?classid=29&fuseaction=home.classhome>. (Accessed June 10 2007.)
Samuel, Peter. "Technologies Will Work in Parallel." World Highways (2005): pp. 54-55.
Smith, Don, et al. Estimating Revenues Using a Toll Viability Screening Tool. Austin, TX: TxDot, 2004.
Stuckey, Mike. "Privacy Lost: Where Rubber Meets the Road in Privacy Debate." MSNBC. <http://www.msnbc.msn.com/id/15130989/>. (Accessed 20 April 2007.)
Symonds, Tom. "Preparing for Congestion." 11 February 2003. BBC News. <http://news.bbc.co.uk/1/hi/uk/2748319.stm>. (Accessed 5 June 2007.)

80
TollRoads News. "407 ETR Vindicated By Arbitrator - Govt Can't Interfere in Tolls." <http://tollroadsnews.info/artman/publish/article_569.shtml>. (Accessed 22 May 2007.)
Transport for London. Transport for London Homepage. 28 May 2007 <http://www.cclondon.com/>.
UK Parliament. Greater London Authority Act of 1999. 11 November 1999.
U.S. Census Bureau. "Annual Estimates of the Population of Metropolitan and Micropolitan Statistical Areas." 2006. U.S. Census Bureau Web site. <http://www.census.gov/population/www/estimates/metro_general/2006/CBSA-EST2006-01.csv>. (Accessed 14 January 2008.)
U.S. Census Bureau. "Arizona QuickFacts." 2006. U.S. Census Bureau Web site. <http://quickfacts.census.gov/qfd/states/04000.html>. (Accessed 15 January 2008.)
Venigalla, Mohan and Michael Krimmer. "Impact of Electronic Toll Collection and Electronic Screening on Heavy-Duty Vehicle Emissions." Transportation Research Record: Journal of the Transportation Research Board 1987 (2006): p. 11.
WCBS Television. "Not So Fast: E-ZPass Data Used To Catch Cheaters." 11 August 2007. WCBS Television Web site. <http://wcbstv.com/topstories/e.z.pass.2.246457.html>. (Accessed 1 January 2008.)
Webster, Ben. "Electronic Tags for Cars as Congestion Charge Spreads Out." 22 February 2006. Times Online. <http://www.timesonline.co.uk/tol/news/article733481.ece>. (Accessed 5 June 2007.)
Wilbur Smith Associates. "I-15 Managed Lanes Value Pricing Project Planning Study." February 2002. SANDAG Homepage. <http://fastrak.sandag.org/pdfs/concept_plan_vol1_part1.pdf>. (Accessed 29 May 2007.)
Windtberg, Mark, and Andrew Bain. Options for Improving Compliance with Vehicle Registration Laws. Tempe: Arizona Department of Transportation. 2004.
Wessel, Rhea. RFID Journal. 18 May 2007. <http://www.rfidjournal.com/article/view/3321/>.
Wolff, Carolyn. "Congestion Pricing as a Traffic Management Tool : Evaluating the Impacts at New York City's Interstate Crossings." Transportation Research Board 2007 Annual Meeting. National Research Council, 2007.
Zappone, Christian. "Technologists Object to U.S. RFID Passports." 13 July 2006. CNN Money. <http://cnnmoney.printthis.clickability.com/pt/cpt?action=cpt&title=Technologists+objec

81
t+to+U.S.+RFID+passports+-+Jul.+13%2C+2006&expire=-1&urlID=18841767&fb=Y&url=http%3A%2F%2Fmoney.cnn.com%2F2006%2F07%2F13%2Fpf%2Frfid_passports%2F&partnerID=2200>. (Accessed 1 May 2007.)
Zetter, Kim. "State Bill to Limit RFID." 29 April 2005. Wired. <http://www.wired.com/politics/security/news/2005/04/67382>. (Accessed 1 January 2008.)