Embed Size (px)
Citation preview

Dallas/Ft. Worth Retail MarketF I R S T Q U A R T E R 2 0 1 4
The CoStarRetail Report

Dallas/Ft. Worth Retail Market
©2014 COSTAR GROUP, INC. THE COSTAR RETAIL REPORT A
FIRST QUARTER 2014 – DALLAS/FT. WORTH
Table of ContentsTable of Contents . . . . . . . . . . . . . . . . . . . . . . . . . . . . . . . . . . . . . . . . . . . . . . . . . . . . . . . . . . . . . . . . . . . . A
Methodology. . . . . . . . . . . . . . . . . . . . . . . . . . . . . . . . . . . . . . . . . . . . . . . . . . . . . . . . . . . . . . . . . . . . . . . . B
Terms & Definitions. . . . . . . . . . . . . . . . . . . . . . . . . . . . . . . . . . . . . . . . . . . . . . . . . . . . . . . . . . . . . . . . . . C
Market Highlights & Overview. . . . . . . . . . . . . . . . . . . . . . . . . . . . . . . . . . . . . . . . . . . . . . . . . . . . . . . . . 1
CoStar Markets & Submarkets . . . . . . . . . . . . . . . . . . . . . . . . . . . . . . . . . . . . . . . . . . . . . . . . . . . . . . . . . 4
Inventory & Development Analysis. . . . . . . . . . . . . . . . . . . . . . . . . . . . . . . . . . . . . . . . . . . . . . . . . . . . . . 5Inventory & Development AnalysisSelect Top DeliveriesSelect Top Under Construction Properties
Figures at a Glance . . . . . . . . . . . . . . . . . . . . . . . . . . . . . . . . . . . . . . . . . . . . . . . . . . . . . . . . . . . . . . . . . . . 9Figures at a Glance by Building Type & MarketFigures at a Glance by Building Type & SubmarketHistorical Figures at a Glance
Leasing Activity Analysis . . . . . . . . . . . . . . . . . . . . . . . . . . . . . . . . . . . . . . . . . . . . . . . . . . . . . . . . . . . . . 25Select Top Lease Transactions
Sales Activity Analysis . . . . . . . . . . . . . . . . . . . . . . . . . . . . . . . . . . . . . . . . . . . . . . . . . . . . . . . . . . . . . . . 27Sales Activity AnalysisSelect Top Sales Transactions
Analysis of Individual CoStar Submarket Clusters . . . . . . . . . . . . . . . . . . . . . . . . . . . . . . . . . . . . . . . . . 29Central Dallas MarketCentral Fort Worth MarketEast Dallas Outlying MarketFar North Dallas MarketMid-Cities MarketNear North Dallas MarketNorth Central Dallas MarketSoutheast Dallas MarketSouthwest Dallas MarketSouthwest Outlying MarketSuburban Fort Worth MarketWest Dallas Market

Dallas/Ft. Worth Retail Market
B THE COSTAR RETAIL REPORT ©2014 COSTAR GROUP, INC.
DALLAS/FT. WORTH – FIRST QUARTER 2014
Dallas/Ft. Worth Retail Market
©2014 COSTAR GROUP, INC. THE COSTAR RETAIL REPORT C
FIRST QUARTER 2014 – DALLAS/FT. WORTH
Methodology
The CoStar Retail Report calculates Retail statistics using CoStar Group's base of existing, under construction and under renovation Retail buildings in each given metropolitan area. All Retail building types are included, including Community Center, Freestanding Retail, Neighborhood Center, Power Center, Regional Mall, Specialty Center and Unanchored Strip Center, in both single-tenant and multi-tenant buildings, including owner-occupied buildings. CoStar Group's national database includes approximately 80.7 billion square feet of coverage in 3.5 million properties. All rental rates reported in the CoStar Retail Report are calculated using Triple Net (NNN) rental rates.
© Copyright 2012 CoStar Group, Inc. All Rights Reserved. Although CoStar makes efforts to ensure the accuracy and reliability of the information contained herein, CoStar makes no guarantee, representation or warranty regarding the quality, accuracy, timeliness or completeness of the information. The publication is provided ‘as is’ and CoStar expressly disclaims any guarantees, representations or warranties of any kind, including those of MERCHANTABILITY AND FITNESS FOR A PARTICULAR PURPOSE.
CoStar Group, Inc.
1331 L ST NW • Washington, DC 20005• (800) 204-5960 • www.costar.com • NASDAQ: CSGP
For information on subscribing to CoStar’s other products and services, please contact us at
1-877-7COSTAR, or visit our web site at www.costar.com

Dallas/Ft. Worth Retail Market
B THE COSTAR RETAIL REPORT ©2014 COSTAR GROUP, INC.
DALLAS/FT. WORTH – FIRST QUARTER 2014
Dallas/Ft. Worth Retail Market
©2014 COSTAR GROUP, INC. THE COSTAR RETAIL REPORT C
FIRST QUARTER 2014 – DALLAS/FT. WORTH
Terms & DefinitionsAnchor Tenant: A large national or regional retailer that serves as a primary draw for a shopping center; a store strategically located in a retail property in order to enhance, bring attention to, or increase traffic at the property. Sometimes called a “destination” tenant, usually these tenants lease at least 25,000 SF.
Availability Rate: The ratio of available space to total rentable space, calculated by dividing the total available square feet by the total rentable square feet.
Available Space: The total amount of space that is currently being marketed as available for lease in a given time period. It includes any space that is available, regardless of whether the space is vacant, occupied, available for sublease, or available at a future date.
Buyer: The individual, group, company, or entity that has pur-chased a commercial real estate asset.
Cap Rate: Short for capitalization rate. The Cap Rate is a calcula-tion that reflects the relationship between one year’s net operating income and the current market value of a particular property. The Cap Rate is calculated by dividing the annual net operating income by the sales price (or asking sales price).
Community Center: A shopping center development that has a total square footage between 100,000 – 350,000 SF. Generally will have 2-3 large anchored tenants, but not department store anchors. Community Center typically offers a wider range of apparel and other soft goods than the Neighborhood Center. Among the more common anchors are supermarkets and super drugstores. Community Center tenants sometime contain retail-ers selling such items as apparel, home improvement/furnishings, toys, electronics or sporting goods. The center is usually config-ured as a strip, in a straight line, or an “L” or “U” shape.
Construction Starts: Buildings that began construction during a specific period of time. (See also: Deliveries)
Deliveries: Buildings that complete construction during a specified period of time. In order for space to be considered delivered, a certificate of occupancy must have been issued for the property.
Delivery Date: The date a building completes construction and receives a certificate of occupancy.
Developer: The company, entity or individual that transforms raw land to improved property by use of labor, capital and entrepre-neurial efforts.
Direct Space: Space that is being offered for lease directly from the landlord or owner of a building, as opposed to space being offered in a building by another tenant (or broker of a tenant) trying to sublet a space that has already been leased.
Existing Inventory: The square footage of buildings that have received a certificate of occupancy and are able to be occupied by tenants. It does not include space in buildings that are either planned, under construction or under renovation.
Freestanding Retail: Single tenant building with a retail tenant. Examples include video stores, fast food restaurant, etc.
Full Service Rental Rate: Rental rates that include all operating expenses such as utilities, electricity, janitorial services, taxes and insurance.
General Retail: Typically are single tenant freestanding general-purpose commercial buildings with parking. Many single retail buildings fall into this use code, especially when they don’t meet any of the more detailed use code descriptions.
Growth in Inventory: The change in size of the existing square footage in a given area over a given period of time, generally due to the construction of new buildings.
Landlord Rep: (Landlord Representative) In a typical lease trans-
action between an owner/landlord and tenant, the broker that represents the interests of the owner/landlord is referred to as the Landlord Rep.
Leased Space: All the space that has a financial lease obligation. It includes all leased space, regardless of whether the space is currently occupied by a tenant. Leased space also includes space being offered for sublease.
Leasing Activity: The volume of square footage that is commit-ted to and signed under a lease obligation for a specific building or market in a given period of time. It includes direct leases, subleases and renewals of existing leases. It also includes any pre-leasing activity in planned, under construction, or under renovation buildings.
Lifestyle Center: An upscale, specialty retail, main street concept shopping center. An open center, usually without anchors, about 300,000 SF GLA or larger, located near affluent neighborhoods, includes upscale retail, trendy restaurants and entertainment retail. Nicely landscaped with convenient parking located close to the stores.
Mall: The combined retail center types of Lifestyle Center, Regional Mall and Super Regional Mall.
Market: Geographic boundaries that serve to delineate core areas that are competitive with each other and constitute a generally accepted primary competitive set of areas. Markets are building-type specific, and are non-overlapping contiguous geographic designations having a cumulative sum that matches the boundar-ies of the entire Region (See also: Region). Markets can be further subdivided into Submarkets. (See also: Submarkets)
Multi-Tenant: Buildings that house more than one tenant at a given time. Usually, multi-tenant buildings were designed and built to accommodate many different floor plans and designs for different tenant needs. (See also: Tenancy).
Neighborhood Center: Provides for the sales of convenience goods (food, drugs, etc.) and personal services (laundry, dry cleaning, etc.) for day-to-day living needs of the immediate neigh-borhood with a supermarket being the principal tenant. In theory, the typical GLA is 50,000 square feet. In practice, the GLA may range from 30,000 to 100,000 square feet.
Net Absorption: The net change in occupied space over a given period of time. Unless otherwise noted Net Absorption includes direct and sublease space.
New Space: Sometimes called first generation space, refers to space that has never been occupied and/or leased by a tenant.
Occupied Space: Space that is physically occupied by a tenant. It does not include leased space that is not currently occupied by a tenant.
Outlet Center: Usually located in a rural or occasionally in a tour-ist location, an Outlet Center consists of manufacturer’s outlet stores selling their own brands at a discount. 50,000 – 500,000 SF. An Outlet Center does not have to be anchored. A strip con-figuration is most common, although some are enclosed malls and others can be arranged in a village cluster.
Owner: The company, entity, or individual that holds title on a given building or property.
Planned/Proposed: The status of a building that has been announced for future development but not yet started construction.
Power Center: The center typically consists of several freestand-ing (unconnected) anchors and only a minimum amount of small specialty tenants. 250,000 – 600,000 SF. A Power Center is dom-inated by several large anchors, including discount department stores, off-price stores, warehouse clubs, or "category killers," i.e.,
Dallas/Ft. Worth Retail Market
D THE COSTAR RETAIL REPORT ©2014 COSTAR GROUP, INC.
DALLAS/FT. WORTH – FIRST QUARTER 2014 FIRST QUARTER 2014 – DALLAS/FT. WORTH
Dallas/Ft. Worth Retail Market
©2014 COSTAR GROUP, INC. THE COSTAR RETAIL REPORT 1
stores that offer tremendous selection in a particular merchandise category at low prices.
Preleased Space: The amount of space in a building that has been leased prior to its construction completion date, or certificate of occupancy date.
Price/SF: Calculated by dividing the price of a building (either sales price or asking sales price) by the Rentable Building Area (RBA).
Quoted Rental Rate: The asking rate per square foot for a par-ticular building or unit of space by a broker or property owner. Quoted rental rates may differ from the actual rates paid by tenants following the negotiation of all terms and conditions in a specific lease.
RBA: Abbreviation for Rentable Building Area. (See also: Rentable Building Area)
Region: Core areas containing a large population nucleus, that together with adjacent communities have a high degree of eco-nomic and social integration. Regions are further divided into market areas, called Markets. (See also: Markets)
Regional Mall: Provides shopping goods, general merchandise, apparel, and furniture, and home furnishings in full depth and variety. It is built around the full-line department store with a minimum GLA of 100,000 square feet, as the major drawing power. For even greater comparative shopping, two, three, or more department stores may be included. In theory a regional center has a GLA of 400,000 square feet, and may range from 300,000 to more than 1,000,000 square feet. Regional centers in excess of 750,000 square feet GLA with three or more depart-ment stores are considered Super Regional. (See also: Super Regional Mall).
Relet Space: Sometimes called second generation or direct space, refers to existing space that has previously been occupied by another tenant.
Rentable Building Area: (RBA) The total square footage of a building that can be occupied by, or assigned to a tenant for the purpose of determining a tenant’s rental obligation. Generally RBA includes a percentage of common areas including all hall-ways, main lobbies, bathrooms, and telephone closets.
Rental Rates: The annual costs of occupancy for a particular space quoted on a per square foot basis.
Sales Price: The total dollar amount paid for a particular property at a particular point in time.
Sales Volume: The sum of sales prices for a given group of build-ings in a given time period.
Seller: The individual, group, company, or entity that sells a par-ticular commercial real estate asset.
SF: Abbreviation for Square Feet.
Shopping Center: The combined retail center types of Community Center, Neighborhood Center and Strip Center.
Single-Tenant: Buildings that are occupied, or intended to be occupied by a single tenant. (See also: Build-to-suit and Tenancy)
Specialty Center: The combined retail center types of Airport Retail, Outlet Center and Theme/Festival Center.
Sports & Entertainment: A facility suited for recreational activi-ties, including: Amusement Facility, Aquatic Facility/Swimming Pool, Bowling Alley, Casino/Gaming Facility, Equestrian Center/Stable, Fitness, Court and Spa Facility, Golf Related, Racetrack, Skating Rink, Ski Resort, Sports Arena/Stadium, and Theatre/Performing Art Facility.
Strip Center: A strip center is an attached row of stores or service outlets managed as a coherent retail entity, with on-site parking usually located in front of the stores. Open canopies may con-nect the storefronts, but a strip center does not have enclosed walkways linking the stores. A strip center may be configured in
a straight line, or have an "L" or "U" shape.
Sublease Space: Space that has been leased by a tenant and is being offered for lease back to the market by the tenant with the lease obligation. Sublease space is sometimes referred to as sublet space.
Submarkets: Specific geographic boundaries that serve to delin-eate a core group of buildings that are competitive with each other and constitute a generally accepted primary competitive set, or peer group. Submarkets are building type specific (office, industrial, retail, etc.), with distinct boundaries dependent on different factors relevant to each building type. Submarkets are non-overlapping, contiguous geographic designations having a cumulative sum that matches the boundaries of the Market they are located within (See also: Market).
Super Regional Mall: Similar to a regional mall, but because of its larger size, a super regional mall has more anchors, a deeper selec-tion of merchandise, and draws from a larger population base. As with regional malls, the typical configuration is as an enclosed mall, frequently with multiple levels (See also: Regional Mall).
Tenancy: A term used to indicate whether or not a building is occupied by multiple tenants (See also: Multi-tenant) or a single tenant. (See also: Single-tenant)
Tenant Rep: Tenant Rep stands for Tenant Representative. In a typical lease transaction between an owner/landlord and tenant, the broker that represents the interests of the tenant is referred to as a Tenant Rep.
Theme/Festival Center: These centers typically employ a unify-ing theme that is carried out by the individual shops in their architectural design and, to an extent, in their merchandise. Sometimes the biggest appeal of these centers is to tourists; they can be anchored by restaurants and entertainment facilities. These centers, generally located in urban areas, tend to be adapted from older, sometimes historic, buildings, and can be part of mixed-use projects. 80,000 – 250,000 SF.
Under Construction: The status of a building that is in the process of being developed, assembled, built or constructed. A building is considered to be under construction after it has begun construc-tion and until it receives a certificate of occupancy.
Vacancy Rate: A measurement expressed as a percentage of the total amount of physically vacant space divided by the total amount of existing inventory. Under construction space generally is not included in vacancy calculations.
Vacant Space: Space that is not currently occupied by a tenant, regardless of any lease obligation that may be on the space. Vacant space could be space that is either available or not avail-able. For example, sublease space that is currently being paid for by a tenant but not occupied by that tenant, would be considered vacant space. Likewise, space that has been leased but not yet occupied because of finish work being done, would also be con-sidered vacant space.
Weighted Average Rental Rate: Rental rates that are calculated by factoring in, or weighting, the square footage associated with each particular rental rate. This has the effect of causing rental rates on larger spaces to affect the average more than that of smaller spaces. The weighted average rental rate is calculated by taking the ratio of the square footage associated with the rental rate on each individual available space to the square footage associated with rental rates on all available spaces, multiplying the rental rate by that ratio, and then adding together all the resulting numbers. Unless specifically specified otherwise, rental rate averages include both Direct and Sublet available spaces.
Year Built: The year in which a building completed construction and was issued a certificate of occupancy.
YTD: Abbreviation for Year-to-Date. Describes statistics that are cumulative from the beginning of a calendar year through what-ever time period is being studied.

Dallas/Ft. Worth Retail Market
D THE COSTAR RETAIL REPORT ©2014 COSTAR GROUP, INC.
DALLAS/FT. WORTH – FIRST QUARTER 2014 FIRST QUARTER 2014 – DALLAS/FT. WORTH
Dallas/Ft. Worth Retail Market
©2014 COSTAR GROUP, INC. THE COSTAR RETAIL REPORT 1
OVERVIEW
Dallas/Ft. Worth’s Vacancy Stays at 7.3% Net Absorption Positive 793,260 SF in the Quarter
The Dallas/Ft. Worth retail market did not experience much change in market conditions in the first quarter 2014. The vacancy rate remained at 7.3% in the first
quarter. Net absorption was positive 793,260 square feet, and vacant sublease space decreased by (31,216) square feet. Quoted rental rates increased from fourth quarter 2013 levels, ending at $13.80 per square foot per year. A total of 46 retail buildings with 794,722 square feet of retail space were delivered to the market in the quarter, with 2,895,205 square feet still under con-struction at the end of the quarter.
Net AbsorptionRetail net absorption was moderate in Dallas/Ft. Worth
first quarter 2014, with positive 793,260 square feet absorbed in the quarter. In fourth quarter 2013, net absorption was positive 1,332,875 square feet, while in third quarter 2013, absorption came in at positive 1,321,629 square feet. In second quarter 2013, positive 1,438,861 square feet was absorbed in the mar-ket.
Tenants moving out of large blocks of space in 2014 include: AMC Services, Inc. moving out of 29,967 square feet at The Highlands of Flower Mound and Westlake Ace Hardware mov-ing out of 26,000 square feet at Westlake Shopping.
Tenants moving into large blocks of space in 2014 include: WinCo Foods moving into 92,352 square feet at 1800 N Graves St; ALDI moving into 40,047 square feet at 1315 N Front St; and Drivers Select-Snell Auto moving into 34,101 square feet at 13615 N Central Expy.
VacancyOver the past four quarters, the Dallas/Ft. Worth’s retail
market has seen an overall decrease in the vacancy rate, with the rate going from 7.6% in the second quarter 2013, to 7.5% at the end of the third quarter 2013, 7.3% at the end of the fourth quarter 2013 and remained the same for the current quarter.
The amount of vacant sublease space in the Dallas/Ft. Worth market has trended down over the past four quarters. At the end of the second quarter 2013, there were 898,555 square feet of vacant sublease space. Currently, there are 683,344 square feet vacant in the market.
Largest Lease SigningsThe largest lease signings occurring in 2014 included: the
62,232-square-foot-lease signed by Mac Churchill Used Cars at 3737 Airport Fwy; the 60,000-square-foot-deal signed by Walmart at Dalrock Crossing; and the 40,090-square-foot-lease signed by Big Lots at 1326 W Main St.
Rental RatesAverage quoted asking rental rates in the Dallas/Ft. Worth
retail market are up over previous quarter levels, and up from their levels four quarters ago. Quoted rents ended the first quar-ter 2014 at $13.80 per square foot per year. That compares to $13.57 per square foot in the fourth quarter 2013, and $13.51 per square foot at the end of the second quarter 2013. This rep-resents a 1.7% increase in rental rates in the current quarter, and a 2.10% increase from four quarters ago.
Vacancy Rates by Building Type 2000-2014
Source: CoStar Property®
Absorption & Deliveries Vacancy & RentPast 7 Quarters Past 7 Quarters
Source: CoStar Property• Source: CoStar Property•
0%
2%
4%
6%
8%
10%
12%
14%
16%
20001q
20003q
20011q
20013q
20021q
20023q
20031q
20033q
20041q
20043q
20051q
20053q
20061q
20063q
20071q
20073q
20081q
20083q
20091q
20093q
20101q
20103q
20111q
20113q
20121q
20123q
20131q
20133q
20141q
Power Center Specialty Center General Retail Shopping Center Mall Total Market
1.57
2.11
1.17
1.441.32 1.33
0.790.65
1.07
0.79
0.51
1.38
0.65
0.79
0.0
0.5
1.0
1.5
2.0
2.5
2012 3q 2012 4q 2013 1q 2013 2q 2013 3q 2013 4q 2014 1q
Millio
ns
SF
Net Absorption Deliveries
$13
$13
$13
$14
$14
$14
$14
$14
20123q
20124q
20131q
20132q
20133q
20134q
20141q
Price
in D
ollars p
er U
nit
6.6%
6.8%
7.0%7.2%
7.4%
7.6%
7.8%
8.0%8.2%
8.4%
8.6%
Vac
ancy
Rat
e P
erc
enta
ge
Average Rental Rate Vacancy Rate

2 THE COSTAR RETAIL REPORT ©2014 COSTAR GROUP, INC.
DALLAS/FT. WORTH – FIRST QUARTER 2014
Dallas/Ft. Worth Retail MarketFIRST QUARTER 2014 – DALLAS/FT. WORTH
Dallas/Ft. Worth Retail Market
©2014 COSTAR GROUP, INC. THE COSTAR RETAIL REPORT 3
OVERVIEW
Inventory & ConstructionDuring the first quarter 2014, 46 buildings totaling 794,722
square feet were completed in the Dallas/Ft. Worth retail market. Over the past four quarters, a total of 3,331,867 square feet of retail space has been built in Dallas/Ft. Worth. In addition to the current quarter, 29 buildings with 645,718 square feet were com-pleted in fourth quarter 2013, 55 buildings totaling 1,383,528 square feet completed in third quarter 2013, and 507,899 square feet in 50 buildings completed in second quarter 2013.
There were 2,895,205 square feet of retail space under con-struction at the end of the first quarter 2014.
Some of the notable 2014 deliveries include: 500 Marketplace Blvd, a 123,429-square-foot facility that delivered in first quarter 2014, and 200 Short Blvd, a 118,574-square-foot building that delivered in first quarter 2014 and is now 100% occupied.
Total retail inventory in the Dallas/Ft. Worth market area amounted to 379,321,533 square feet in 26,962 buildings and 3683 centers as of the end of the first quarter 2014.
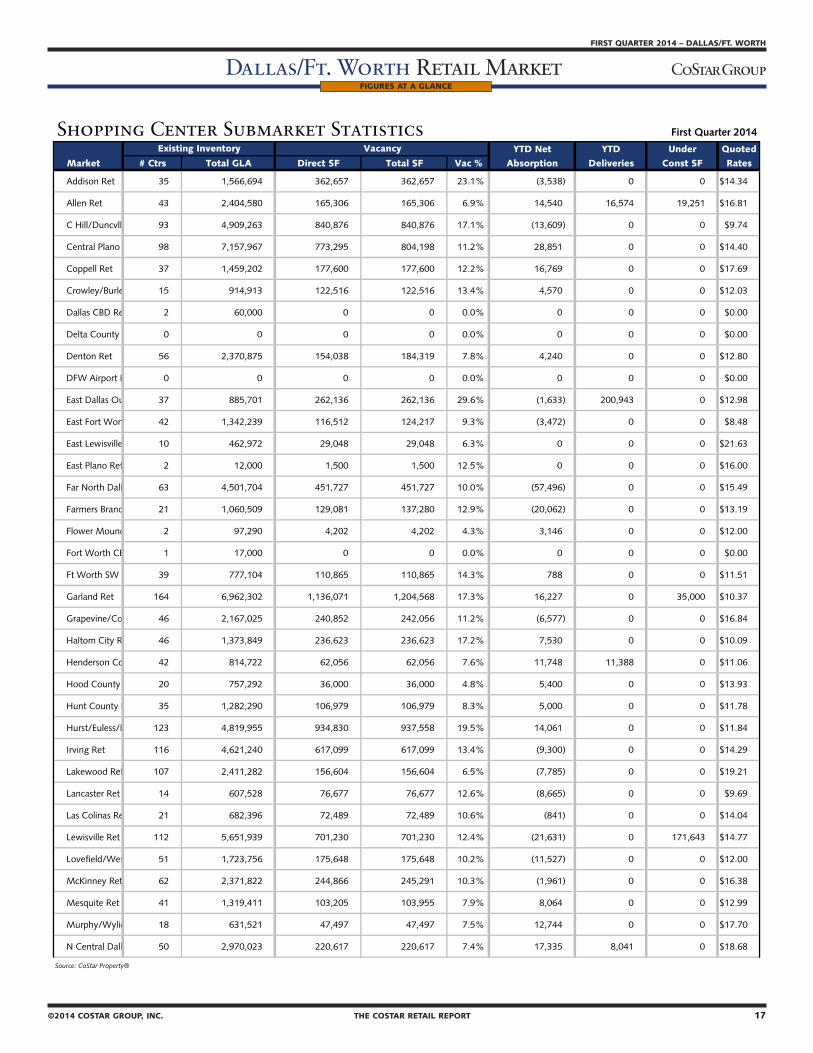
Shopping CenterThe Shopping Center market in Dallas/Ft. Worth currently
consists of 3562 projects with 152,607,224 square feet of retail space in 6,442 buildings. In this report the Shopping Center mar-ket is comprised of all Community Center, Neighborhood Center, and Strip Centers.
After absorbing 308,203 square feet and delivering 400,800 square feet in the current quarter, the Shopping Center sector saw the vacancy rate go from 11.7% at the end of the fourth quarter 2013 to 11.7% this quarter.
Over the past four quarters, the Shopping Center vacancy rate has gone from 12.2% at the end of the second quarter 2013, to 12.1% at the end of the third quarter 2013, to 11.7% at the end of the fourth quarter 2013, and finally to 11.7% at the end of the current quarter.
Rental rates ended the first quarter 2014 at $13.23 per
square foot, up from the $13.10 they were at the end of fourth quarter 2013. Rental rates have trended up over the past year, going from $13.10 per square foot a year ago to their current levels.
Net absorption in the Shopping Center sector has totaled 1,895,406 square feet over the past four quarters. In addition to the positive 308,203 square feet absorbed this quarter, positive 638,997 square feet was absorbed in the fourth quarter 2013, positive 529,468 square feet was absorbed in the third quarter 2013, and positive 418,738 square feet was absorbed in the sec-ond quarter 2013.
Power CentersThe Power Center average vacancy rate was 4.6% in the first
quarter 2014. With negative (41,425) square feet of net absorp-tion and no new deliveries, the vacancy rate went from 4.4% at the end of last quarter to 4.6% at the end of the first quarter.
In the fourth quarter 2013, Power Centers absorbed posi-tive 280,271 square feet, delivered 130,085 square feet, and the vacancy rate went from 5.0% to 4.4% over the course of the quarter. Rental started the quarter at $20.42 per square foot and ended the quarter at $20.26 per square foot.
A year ago, in first quarter 2013, the vacancy rate was 5.8%. Over the past four quarters, Power Centers have absorbed a cumulative 659,985 square feet of space and delivered cumu-lative 354,021 square feet of space. Vacant sublease space has gone from 25,898 square feet to 27,098 square feet over that time period, and rental rates have gone from $19.44 to $20.16.
At the end of the first quarter 2014, there were 31,450 square feet under construction in the Dallas/Ft. Worth market. The total stock of Power Center space in Dallas/Ft. Worth cur-rently sits at 26,350,936 square feet in 66 centers comprised of 638 buildings.
A total of 31,450 square feet of space was under construc-tion at the end of the first quarter 2014.
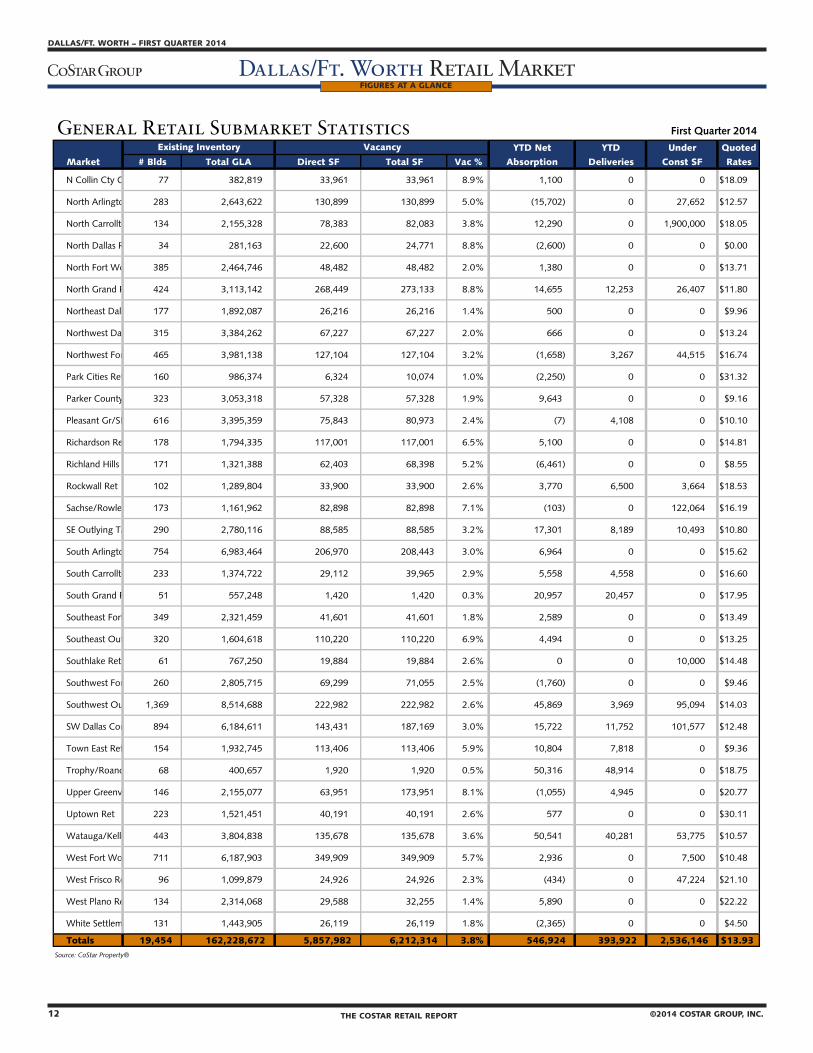
General Retail PropertiesThe General Retail sector of the market, which includes
all freestanding retail buildings, except those contained within a center, reported a vacancy rate of 3.8% at the end of first quarter 2014. There was a total of 6,212,314 square feet vacant at that time. The General Retail sector in Dallas/Ft. Worth currently has average rental rates of $13.93 per square foot per year. There are 2,536,146 square feet of space under construction in this sector, with 393,922 square feet having been completed in the first quar-ter. In all, there are a total of 19,454 buildings with 162,228,672 square feet of General Retail space in Dallas/Ft. Worth.
Specialty CentersThere are currently 11 Specialty Centers in the Dallas/Ft.
Worth market, making up 2,030,564 square feet of retail space. In this report the Specialty Center market is comprised of Outlet Center, Airport Retail and Theme/Festival Centers.
Vacancy Rates by Building Type 2000-2014
Source: CoStar Property®
Absorption & Deliveries Vacancy & RentPast 7 Quarters Past 7 Quarters
Source: CoStar Property• Source: CoStar Property•
0%
2%
4%
6%
8%
10%
12%
14%
16%
20001q
20003q
20011q
20013q
20021q
20023q
20031q
20033q
20041q
20043q
20051q
20053q
20061q
20063q
20071q
20073q
20081q
20083q
20091q
20093q
20101q
20103q
20111q
20113q
20121q
20123q
20131q
20133q
20141q
Power Center Specialty Center General Retail Shopping Center Mall Total Market
1.57
2.11
1.17
1.441.32 1.33
0.790.65
1.07
0.79
0.51
1.38
0.65
0.79
0.0
0.5
1.0
1.5
2.0
2.5
2012 3q 2012 4q 2013 1q 2013 2q 2013 3q 2013 4q 2014 1q
Millio
ns
SF
Net Absorption Deliveries
$13
$13
$13
$14
$14
$14
$14
$14
20123q
20124q
20131q
20132q
20133q
20134q
20141q
Price
in D
ollars p
er U
nit
6.6%
6.8%
7.0%7.2%
7.4%
7.6%
7.8%
8.0%8.2%
8.4%
8.6%
Vac
ancy
Rat
e P
erc
enta
ge
Average Rental Rate Vacancy Rate
2 THE COSTAR RETAIL REPORT ©2014 COSTAR GROUP, INC.
DALLAS/FT. WORTH – FIRST QUARTER 2014
Dallas/Ft. Worth Retail MarketFIRST QUARTER 2014 – DALLAS/FT. WORTH
Dallas/Ft. Worth Retail Market
©2014 COSTAR GROUP, INC. THE COSTAR RETAIL REPORT 3
OVERVIEW
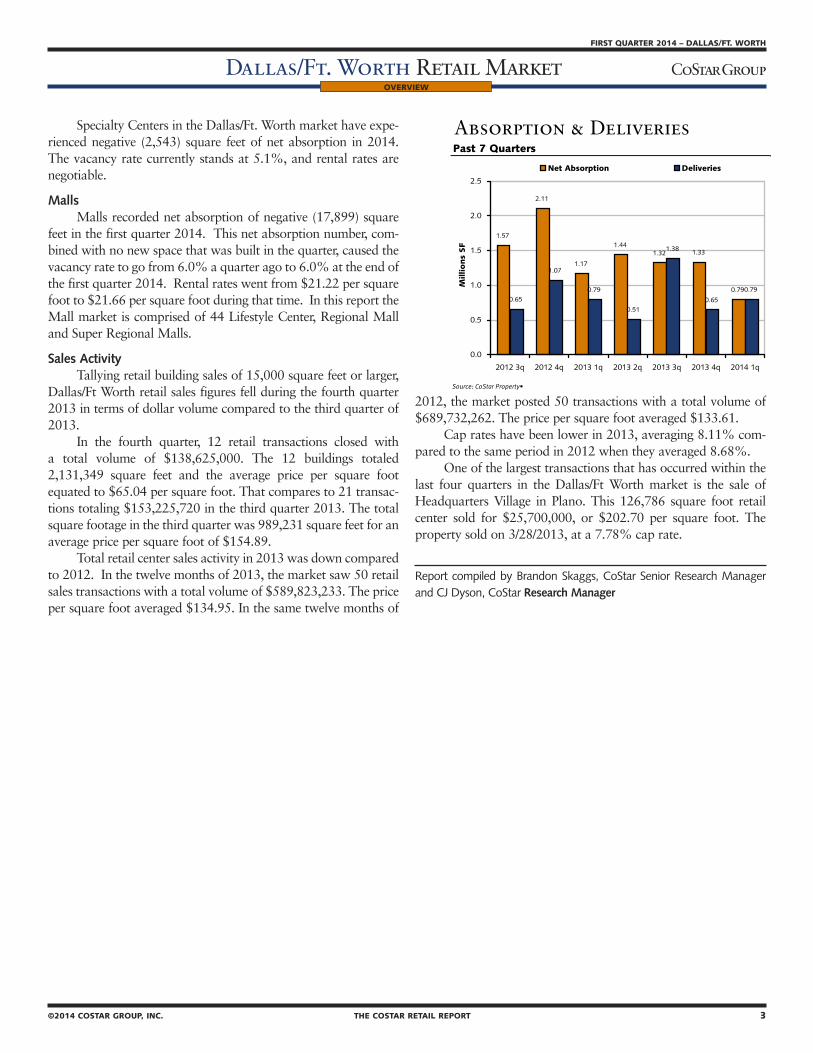
Specialty Centers in the Dallas/Ft. Worth market have expe-rienced negative (2,543) square feet of net absorption in 2014. The vacancy rate currently stands at 5.1%, and rental rates are negotiable.
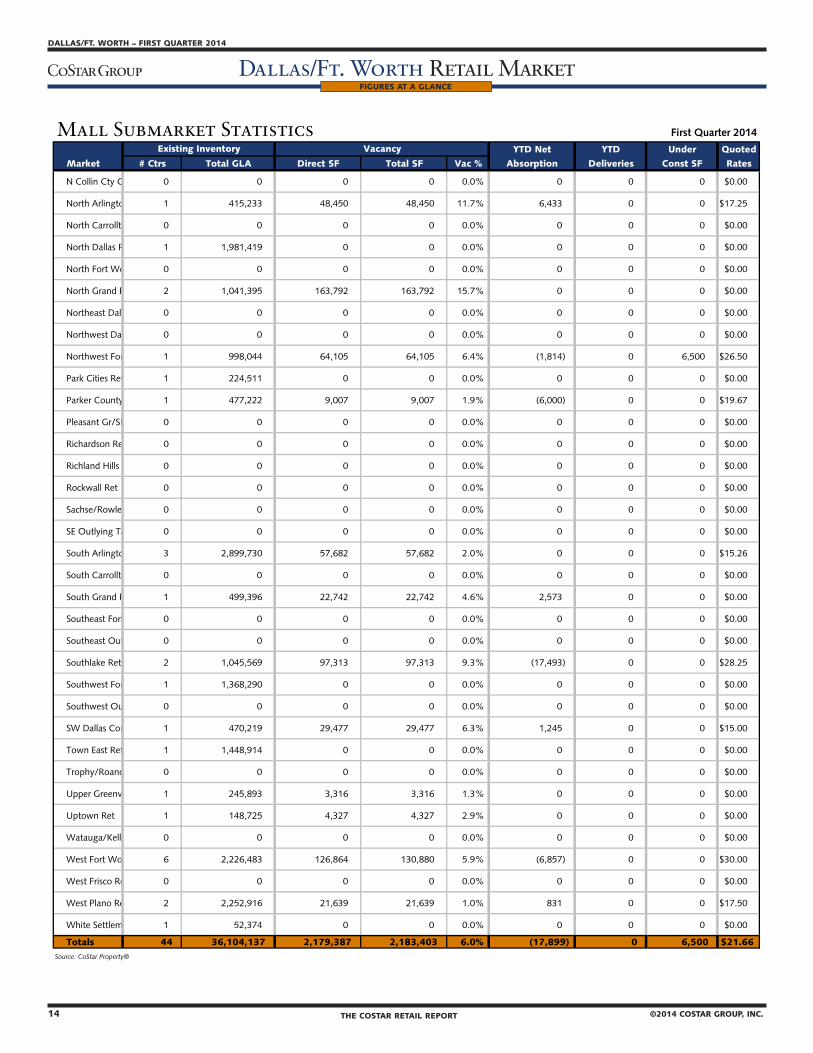
MallsMalls recorded net absorption of negative (17,899) square
feet in the first quarter 2014. This net absorption number, com-bined with no new space that was built in the quarter, caused the vacancy rate to go from 6.0% a quarter ago to 6.0% at the end of the first quarter 2014. Rental rates went from $21.22 per square foot to $21.66 per square foot during that time. In this report the Mall market is comprised of 44 Lifestyle Center, Regional Mall and Super Regional Malls.
Sales ActivityTallying retail building sales of 15,000 square feet or larger,
Dallas/Ft Worth retail sales figures fell during the fourth quarter 2013 in terms of dollar volume compared to the third quarter of 2013.
In the fourth quarter, 12 retail transactions closed with a total volume of $138,625,000. The 12 buildings totaled 2,131,349 square feet and the average price per square foot equated to $65.04 per square foot. That compares to 21 transac-tions totaling $153,225,720 in the third quarter 2013. The total square footage in the third quarter was 989,231 square feet for an average price per square foot of $154.89.
Total retail center sales activity in 2013 was down compared to 2012. In the twelve months of 2013, the market saw 50 retail sales transactions with a total volume of $589,823,233. The price per square foot averaged $134.95. In the same twelve months of
2012, the market posted 50 transactions with a total volume of $689,732,262. The price per square foot averaged $133.61.
Cap rates have been lower in 2013, averaging 8.11% com-pared to the same period in 2012 when they averaged 8.68%.
One of the largest transactions that has occurred within the last four quarters in the Dallas/Ft Worth market is the sale of Headquarters Village in Plano. This 126,786 square foot retail center sold for $25,700,000, or $202.70 per square foot. The property sold on 3/28/2013, at a 7.78% cap rate.
Report compiled by Brandon Skaggs, CoStar Senior Research Manager and CJ Dyson, CoStar Research Manager
Vacancy Rates by Building Type 2000-2014
Source: CoStar Property®
Absorption & Deliveries Vacancy & RentPast 7 Quarters Past 7 Quarters
Source: CoStar Property• Source: CoStar Property•
0%
2%
4%
6%
8%
10%
12%
14%
16%
20001q
20003q
20011q
20013q
20021q
20023q
20031q
20033q
20041q
20043q
20051q
20053q
20061q
20063q
20071q
20073q
20081q
20083q
20091q
20093q
20101q
20103q
20111q
20113q
20121q
20123q
20131q
20133q
20141q
Power Center Specialty Center General Retail Shopping Center Mall Total Market
1.57
2.11
1.17
1.441.32 1.33
0.790.65
1.07
0.79
0.51
1.38
0.65
0.79
0.0
0.5
1.0
1.5
2.0
2.5
2012 3q 2012 4q 2013 1q 2013 2q 2013 3q 2013 4q 2014 1q
Millio
ns
SF
Net Absorption Deliveries
$13
$13
$13
$14
$14
$14
$14
$14
20123q
20124q
20131q
20132q
20133q
20134q
20141q
Price
in D
ollars p
er U
nit
6.6%
6.8%
7.0%7.2%
7.4%
7.6%
7.8%
8.0%8.2%
8.4%
8.6%
Vac
ancy
Rat
e P
erc
enta
ge
Average Rental Rate Vacancy Rate

4 THE COSTAR RETAIL REPORT ©2014 COSTAR GROUP, INC.
DALLAS/FT. WORTH – FIRST QUARTER 2014
Dallas/Ft. Worth Retail MarketFIRST QUARTER 2014 – DALLAS/FT. WORTH
Dallas/Ft. Worth Retail Market
©2014 COSTAR GROUP, INC. THE COSTAR RETAIL REPORT 5
CoStar Submarket Clusters & Submarkets
In analyzing metropolitan areas, CoStar has developed geographic designations to help group properties together, called Markets, Submarket Clusters and Submarkets. Markets are the equivalent of metropolitan areas, or areas containing a large population nucleus, that together with adjacent communities have a high degree of economic and social integration. Markets are then divided into Submarket Clusters, which are core areas within a metropolitan area that are known to be competitive with each other in terms of attracting and keeping tenants. Markets are then further subdivided into smaller units called Submarkets, which serve to delineate a core group of buildings that are competitive with each other and constitute a generally accepted competitive set, or peer group.
MARKETS
Submarket Clusters Submarkets
Central Dallas Ret Dallas CBD Ret Lakewood Ret Lovefield/West Dallas Ret Uptown Ret
Central Fort Worth Ret East Fort Worth Ret Fort Worth CBD Ret Ft Worth SW Quadrant Ret Haltom City RetNorth Fort Worth Ret Southeast Fort Worth Ret West Fort Worth Ret
East Dallas Outlying Ret East Dallas Outlying Ret Rockwall Ret
Far North Dallas Ret Allen Ret Central Plano Ret Delta County Ret East Plano RetFar North Dallas Ret Garland Ret Hunt County Ret McKinney RetMurphy/Wylie Ret N Collin Cty Outlying Ret Richardson Ret Sachse/Rowlett Ret
Mid-Cities Ret Denton Ret Flower Mound Ret Grapevine/Colleyville Ret Hurst/Euless/Bedford RetNorth Arlington Ret Richland Hills Ret SE Outlying Tarrant Ret South Arlington RetSouth Grand Prairie Ret Southlake Ret Trophy/Roanoke/WLake Ret
Near North Dallas Ret North Dallas Ret Northeast Dallas Ret Northwest Dallas Ret Park Cities RetUpper Greenville Ret
North Central Dallas Ret Addison Ret East Lewisville Ret Farmers Branch Ret N Central Dallas Out RetNorth Carrollton Ret South Carrollton Ret West Frisco Ret West Plano Ret
Southeast Dallas Ret Henderson County Ret Mesquite Ret Pleasant Gr/SE Dallas Ret Southeast Outlying RetTown East Ret
Southwest Dallas Ret C Hill/Duncvlle/Deso Ret Lancaster Ret SW Dallas County Ret
Southwest Outlying Ret Hood County Ret Southwest Outlying Ret
Suburban Fort Worth Ret Crowley/Burleson Ret Northwest Fort Worth Ret Parker County Ret Southwest Fort Worth RetWatauga/Keller/NRH Ret White Settlement Ret
West Dallas Ret Coppell Ret DFW Airport Ret Irving Ret Las Colinas RetLewisville Ret North Grand Prairie Ret

4 THE COSTAR RETAIL REPORT ©2014 COSTAR GROUP, INC.
DALLAS/FT. WORTH – FIRST QUARTER 2014
Dallas/Ft. Worth Retail MarketFIRST QUARTER 2014 – DALLAS/FT. WORTH
Dallas/Ft. Worth Retail Market
©2014 COSTAR GROUP, INC. THE COSTAR RETAIL REPORT 5
Historical Deliveries 1982 - 2014
Source: CoStar Property® * Future deliveries based on current under construction buildings.
Construction Activity Markets Ranked by Under Construction Square Footage
# Bldgs Preleased SF Preleased % All Existing U/C
North Central Dallas Ret 6 1,952,798 98.3% 20,124 331,187
West Dallas Ret 12 227,357 81.7% 15,815 23,183
Far North Dallas Ret 7 141,691 69.1% 17,790 29,277
Suburban Fort Worth Ret 5 95,959 91.6% 14,488 20,958
Southwest Dallas Ret 3 101,577 100.0% 12,633 33,859
Mid-Cities Ret 9 57,908 60.6% 15,978 10,624
Southwest Outlying Ret 2 95,094 100.0% 8,619 47,547
Near North Dallas Ret 1 14,000 100.0% 18,510 14,000
Central Fort Worth Ret 1 7,500 100.0% 10,321 7,500
East Dallas Outlying Ret 1 3,664 100.0% 12,598 3,664
All Other 1 0 0.0% 9,436 2,700
Totals 48 2,697,548 93.2% 14,069 60,317
Source: CoStar Property®
Recent Deliveries Future Deliveries Leased & Un-Leased SF in Deliveries Since 2010 Preleased & Un-Leased SF in Properties Scheduled to Deliver
Source: CoStar Property® Source: CoStar Property®
14,000
7,500
3,664
Market
Under Construction Inventory Average Bldg Size
Total GLA
2,700
1,987,123
2,895,205
278,200
204,942
104,790
101,577
95,615
95,094
6.06.8
10.0
13.3
11.7
7.6
5.9
3.72.8 3.2
5.1
6.35.6
6.87.2
9.09.6
13.113.7
11.5
8.69.5
10.8 10.7 10.9 11.3
10.0
4.9
3.1 3.0 3.2 3.3
1.7
0.0
2.0
4.0
6.0
8.0
10.0
12.0
14.0
16.0
1982 1984 1986 1988 1990 1992 1994 1996 1998 2000 2002 2004 2006 2008 2010 2012 2014
Millio
ns
of
SF
Deliveries Average Delivered SF
0.0
0.5
1.0
1.5
2.0
2.5
3.0
3.5
2010 2011 2012 2013 2014
Millio
ns
of
SF
Leased Un-Leased
0
500
1,000
1,500
2,000
2,500
2014 2q 2014 3q 2014 4q 2015 2q
T
Thousa
nds
of
SF
Preleased Un-Leased
INVENTORY & DEVELOPMENT

6 THE COSTAR RETAIL REPORT ©2014 COSTAR GROUP, INC.
DALLAS/FT. WORTH – FIRST QUARTER 2014
Dallas/Ft. Worth Retail MarketFIRST QUARTER 2014 – DALLAS/FT. WORTH
Dallas/Ft. Worth Retail Market
©2014 COSTAR GROUP, INC. THE COSTAR RETAIL REPORT 7
Historical Construction Starts & DeliveriesSquare Footage Per Quarter Starting and Completing Construction
Source: CoStar Property®
Recent Deliveries by Project Size of Year-to-Date DevelopmentBuilding Size # Bldgs GLA SF Leased % Leased Avg Rate Single-Tenant Multi-Tenant
< 50,000 SF 43 382,853 329,412 86.0% $21.18 257,061 125,792
50,000 SF - 99,999 SF 1 92,352 92,352 100.0% $0.00 92,352 0
100,000 SF - 249,999 SF 2 319,517 118,574 37.1% $0.00 0 319,517
250,000 SF - 499,999 SF 0 0 0 0.0% $0.00 0 0
>= 500,000 SF 0 0 0 0.0% $0.00 0 0
Source: CoStar Property®
Recent Development by Tenancy Existing Inventory ComparisonBased on GLA Developed for Single & Multi Tenant Use Based on Total GLA
2014 Deliveries
Source: CoStar Property® Source: CoStar Property®
Currently Under Construction
0.67
1.27
0.73
0.30
0.78 0.74
1.29
0.56
2.85
0.95
0.30 0.250.38
1.02
0.45
0.99
0.59
0.790.66 0.65
1.07
0.79
0.51
1.38
0.650.79
0.0
0.5
1.0
1.5
2.0
2.5
3.0
2011 1q 2011 2q 2011 3q 2011 4q 2012 1q 2012 2q 2012 3q 2012 4q 2013 1q 2013 2q 2013 3q 2013 4q 2014 1q
Millio
ns
of
SF
Construction Starts Deliveries
21%
79%
Multi Single
44%
56%
Multi Single 0 20 40 60 80 100 120 140 160 180
Specialty Center
Power Center
Mall
Shopping Center
General Retail
Millions of Square Feet
INVENTORY & DEVELOPMENT

6 THE COSTAR RETAIL REPORT ©2014 COSTAR GROUP, INC.
DALLAS/FT. WORTH – FIRST QUARTER 2014
Dallas/Ft. Worth Retail MarketFIRST QUARTER 2014 – DALLAS/FT. WORTH
Dallas/Ft. Worth Retail Market
©2014 COSTAR GROUP, INC. THE COSTAR RETAIL REPORT 7
������������������������������ �������������������������������
������������������������
���� ����������������������������� ����������������������������
����������� ����������������� ���������������� �������������������������������������������������������� ������������������������������ ����������������������������������� ����
���� ��������������������������������������������� ����������������������������������� ����������������� ����������������� ������������������������������������������������ ������������������������������ �������������� ����
���� ��������������������������� ����������������������������������� ���������������� ����������������� ������������������������������������������������� ������������������������������ �������������� ����
���� ������������������������������ ����������������������������
����������� ���������������� ����������������� ������������������������������������������������ ������������������������������ �������������� ����
���� �������������������������� ����������������������������� ���������������� ����������������� ������������������������������������������������ ������������������������������ �������������� ����
���� �������������������������� ����������������������������
����������� ���������������� ����������������� ������������������������������������������������ ������������������������������ �������������� ����
���� ����������������������������� ����������������������������������� ���������������� ��������������� ������������������������������������������������������� ������������������������������ ����������������������������������� ����
���� �������������������������� ����������������������������������� ���������������� ���������������� ���������������������������������������������������� ������������������������������ ���������������������������� ����
���� ���������������������������� ����������������������������������� ���������������� ���������������� ���������������������������������������������������� ������������������������������ ������������������������������ ����
���������������������������� ����������������������������������� ���������������� ���������������� ���������������������������������������������������� ������������������������������ ���������������������������� ����
������������������������������� ����������������������������
����������� ��������������� ����������������� ������������������������������������������������� ������������������������������ ����������������������������� ����
����������������������������������� ����������������������������� ��������������� ����������������� ������������������������������������������������� ������������������������������ �������������� ����
���������������������������������� ��������������������������
����������� ��������������� ���������������� ���������������������������������������������������� ������������������������������ �������������������������������
��������������� ����
���������������������������� ����������������������������� ��������������� ����������������� ������������������������������������������������ ������������������������������ �������������� ����
������������������������������������������������� ������������������������������ ��������������� ����������������� ������������������������������������������������� ������������������������������ ��������������������������������������� �����������������������������
INVENTORY & DEVELOPMENT
8 THE COSTAR RETAIL REPORT ©2014 COSTAR GROUP, INC.
DALLAS/FT. WORTH – FIRST QUARTER 2014
Dallas/Ft. Worth Retail MarketFIRST QUARTER 2014 – DALLAS/FT. WORTH
Dallas/Ft. Worth Retail Market
©2014 COSTAR GROUP, INC. THE COSTAR RETAIL REPORT 9
INVENTORY & DEVELOPMENT
���������������������������������������� �������������������������������
������������������������
���� ������������������������������������������������ ����������������������������
����������� �������������������� ����������������� ������������������������������������������������ ������������������������������� �������������� ����
���� �������������������������������������� ������������������������������ ������������������ ����������������� ������������������������������������������������ ������������������������������� ������������������������������ ����
���� ���������������������������������������� ����������������������������������� ������������������ ����������������� ������������������������������������������������ ������������������������������� �������������� ����
���� ������������������������������ ����������������������������������� ����������������� ����������������� ������������������������������������������������� ������������������������������� �������������� ����
���� ���������������������� ��������������������������
����������� ����������������� ����������������� ������������������������������������������������� ������������������������������� �������������� ����
���� ����������������������������� ���������������������������
����������� ����������������� ����������������� ������������������������������������������������ ������������������������������� �������������� ����
���� �������������������������� ������������������������������ ����������������� ����������������� ������������������������������������������������ ������������������������������ �������������� ����
���� ����������������������������� ����������������������������������� ����������������� ��������������� �������������������������������������������������������� ������������������������������� ������������������������
��������������������� ����
���� �������������������������������������� ���������������������������
����������� ����������������� ����������������� ������������������������������������������������ ������������������������������ ������������������������������������� ����
������������������������������������������������� ������������������������������ ����������������� ����������������� ������������������������������������������������ ������������������������������� �������������� ����
���������������������������� ����������������������������
����������� ����������������� ���������������� ��������������������������������������������������� ������������������������������ ������������������������������ ����
��������������������������������������� ����������������������������� ����������������� ����������������� ������������������������������������������������ ������������������������������� �������������� ����
���������������������������������������������� ����������������������������
����������� ����������������� ���������������� ���������������������������������������������������� ������������������������������ ������������������������������� ����
���������������������������������������������������������� ������������������������������ ����������������� ��������������� ���������������������������������������������������� ������������������������������ ����������������������������������� ����
��������������������������������� ����������������������������������� ����������������� ��������������� ���������������������������������������������������� ������������������������������� ������������������������������ ����

8 THE COSTAR RETAIL REPORT ©2014 COSTAR GROUP, INC.
DALLAS/FT. WORTH – FIRST QUARTER 2014
Dallas/Ft. Worth Retail MarketFIRST QUARTER 2014 – DALLAS/FT. WORTH
Dallas/Ft. Worth Retail Market
©2014 COSTAR GROUP, INC. THE COSTAR RETAIL REPORT 9
General Retail Market Statistics First Quarter 2014
YTD Net YTD Under Quoted
Market # Blds Total GLA Direct SF Total SF Vac % Absorption Deliveries Const SF Rates
Central Dallas Ret 1,727 10,977,382 435,254 437,254 4.0% (3,580) 7,951 2,700 $17.27
Central Fort Worth Ret 2,772 18,588,383 833,551 839,021 4.5% 14,769 0 7,500 $10.69
East Dallas Outlying Ret 373 2,751,448 82,125 82,125 3.0% 6,508 8,600 3,664 $12.19
Far North Dallas Ret 2,266 23,641,898 1,157,479 1,159,662 4.9% 142,619 116,352 150,691 $15.94
Mid-Cities Ret 2,736 25,915,733 986,860 994,328 3.8% 100,214 86,543 54,299 $14.20
Near North Dallas Ret 832 8,698,963 186,318 302,239 3.5% (4,739) 4,945 0 $16.22
North Central Dallas Ret 994 12,060,795 329,943 490,328 4.1% 113,090 75,153 1,947,224 $17.57
Southeast Dallas Ret 1,567 10,135,705 416,887 422,017 4.2% 10,295 11,926 0 $10.51
Southwest Dallas Ret 1,310 9,283,473 248,296 292,034 3.1% 15,418 11,752 101,577 $11.34
Southwest Outlying Ret 1,512 9,885,600 273,925 273,925 2.8% 48,190 3,969 95,094 $13.78
Suburban Fort Worth Ret 1,710 16,075,049 426,186 427,942 2.7% 54,901 43,548 98,290 $11.02
West Dallas Ret 1,655 14,214,243 481,158 491,439 3.5% 49,239 23,183 75,107 $13.18
Totals 19,454 162,228,672 5,857,982 6,212,314 3.8% 546,924 393,922 2,536,146 $13.93
Source: CoStar Property®
Mall Market Statistics First Quarter 2014
YTD Net YTD Under Quoted
Market # Ctrs Total GLA Direct SF Total SF Vac % Absorption Deliveries Const SF Rates
Central Dallas Ret 1 148,725 4,327 4,327 2.9% 0 0 0 $0.00
Central Fort Worth Ret 7 3,382,529 238,468 242,484 7.2% (7,475) 0 0 $30.00
East Dallas Outlying Ret 0 0 0 0 0.0% 0 0 0 $0.00
Far North Dallas Ret 8 7,297,760 1,143,259 1,143,259 15.7% 0 0 0 $23.56
Mid-Cities Ret 10 9,240,436 235,395 235,395 2.5% (8,487) 0 0 $17.02
Near North Dallas Ret 3 2,451,823 3,316 3,316 0.1% 0 0 0 $0.00
North Central Dallas Ret 3 3,935,565 21,639 21,639 0.5% 831 0 0 $17.50
Southeast Dallas Ret 1 1,448,914 0 0 0.0% 0 0 0 $0.00
Southwest Dallas Ret 2 1,098,415 100,624 100,624 9.2% 2,965 0 0 $15.00
Southwest Outlying Ret 0 0 0 0 0.0% 0 0 0 $0.00
Suburban Fort Worth Ret 4 2,895,930 73,112 73,112 2.5% (7,814) 0 6,500 $20.34
West Dallas Ret 5 4,204,040 359,247 359,247 8.5% 2,081 0 0 $30.00
Totals 44 36,104,137 2,179,387 2,183,403 6.0% (17,899) 0 6,500 $21.66
Source: CoStar Property®
Power Center Market Statistics First Quarter 2014
YTD Net YTD Under Quoted
Market # Ctrs Total GLA Direct SF Total SF Vac % Absorption Deliveries Const SF Rates
Central Dallas Ret 1 200,347 0 0 0.0% 0 0 0 $0.00
Central Fort Worth Ret 5 2,189,254 212,895 212,895 9.7% 1,212 0 0 $19.47
East Dallas Outlying Ret 5 1,932,322 37,171 37,171 1.9% 13,170 0 0 $20.96
Far North Dallas Ret 9 3,656,645 124,240 124,240 3.4% (48,619) 0 0 $20.12
Mid-Cities Ret 13 4,836,016 136,472 161,499 3.3% (31,723) 0 0 $24.65
Near North Dallas Ret 1 466,740 1,985 1,985 0.4% 3,114 0 0 $27.00
North Central Dallas Ret 5 2,307,259 89,428 89,428 3.9% (1,922) 0 0 $36.00
Southeast Dallas Ret 3 1,316,320 81,279 81,279 6.2% 0 0 0 $23.29
Southwest Dallas Ret 3 1,293,483 76,080 76,080 5.9% 3,414 0 0 $18.10
Southwest Outlying Ret 3 971,411 6,228 6,228 0.6% 0 0 0 $0.00
Suburban Fort Worth Ret 5 1,939,959 43,472 45,543 2.3% 12,194 0 0 $19.50
West Dallas Ret 13 5,241,180 362,656 362,656 6.9% 7,735 0 31,450 $15.95
Totals 66 26,350,936 1,171,906 1,199,004 4.6% (41,425) 0 31,450 $20.16
Source: CoStar Property®
Existing Inventory Vacancy
Existing Inventory Vacancy
Existing Inventory Vacancy
FIGURES AT A GLANCE
10 THE COSTAR RETAIL REPORT ©2014 COSTAR GROUP, INC.
DALLAS/FT. WORTH – FIRST QUARTER 2014
Dallas/Ft. Worth Retail MarketFIRST QUARTER 2014 – DALLAS/FT. WORTH
Dallas/Ft. Worth Retail Market
©2014 COSTAR GROUP, INC. THE COSTAR RETAIL REPORT 11
Shopping Center Market Statistics First Quarter 2014
YTD Net YTD Under Quoted
Market # Ctrs Total GLA Direct SF Total SF Vac % Absorption Deliveries Const SF Rates
Central Dallas Ret 191 4,726,842 355,044 355,044 7.5% (20,112) 0 0 $17.37
Central Fort Worth Ret 309 9,895,631 1,407,156 1,419,269 14.3% (35,125) 9,600 0 $9.65
East Dallas Outlying Ret 59 2,031,006 322,409 322,409 15.9% 157 200,943 0 $17.15
Far North Dallas Ret 618 31,019,790 3,651,715 3,769,114 12.2% 63,011 33,149 54,251 $13.84
Mid-Cities Ret 597 23,702,261 2,780,828 2,840,002 12.0% 57,925 6,655 41,316 $14.12
Near North Dallas Ret 258 13,547,582 1,267,173 1,267,173 9.4% (13,630) 0 14,000 $14.45
North Central Dallas Ret 306 17,466,336 1,902,834 1,911,033 10.9% 58,393 17,991 39,899 $15.55
Southeast Dallas Ret 237 8,019,858 797,669 798,419 10.0% 33,946 11,388 0 $10.56
Southwest Dallas Ret 239 11,098,369 1,569,974 1,569,974 14.1% 105,568 118,574 0 $10.17
Southwest Outlying Ret 135 4,277,485 361,105 365,363 8.5% (2,263) 0 0 $11.48
Suburban Fort Worth Ret 260 12,613,626 1,439,839 1,535,844 12.2% 67,566 2,500 0 $12.81
West Dallas Ret 353 14,208,438 1,772,600 1,772,600 12.5% (7,233) 0 171,643 $14.06
Totals 3,562 152,607,224 17,628,346 17,926,244 11.7% 308,203 400,800 321,109 $13.23
Source: CoStar Property®
Specialty Center Market Statistics First Quarter 2014
YTD Net YTD Under Quoted
Market # Ctrs Total GLA Direct SF Total SF Vac % Absorption Deliveries Const SF Rates
Central Dallas Ret 0 0 0 0 0.0% 0 0 0 $0.00
Central Fort Worth Ret 1 44,915 0 0 0.0% 0 0 0 $0.00
East Dallas Outlying Ret 0 0 0 0 0.0% 0 0 0 $0.00
Far North Dallas Ret 1 473,302 0 0 0.0% 0 0 0 $0.00
Mid-Cities Ret 1 40,574 0 0 0.0% 0 0 0 $0.00
Near North Dallas Ret 2 138,669 1,200 1,200 0.9% 0 0 0 $0.00
North Central Dallas Ret 1 352,553 38,667 38,667 11.0% (2,543) 0 0 $0.00
Southeast Dallas Ret 2 250,667 9,300 9,300 3.7% 0 0 0 $0.00
Southwest Dallas Ret 1 41,634 0 0 0.0% 0 0 0 $0.00
Southwest Outlying Ret 0 0 0 0 0.0% 0 0 0 $0.00
Suburban Fort Worth Ret 0 0 0 0 0.0% 0 0 0 $0.00
West Dallas Ret 2 688,250 54,742 54,742 8.0% 0 0 0 $0.00
Totals 11 2,030,564 103,909 103,909 5.1% (2,543) 0 0 $0.00
Source: CoStar Property®
Total Retail Market Statistics First Quarter 2014
YTD Net YTD Under Quoted
Market # Blds Total GLA Direct SF Total SF Vac % Absorption Deliveries Const SF Rates
Central Dallas Ret 1,988 16,053,296 794,625 796,625 5.0% (23,692) 7,951 2,700 $17.31
Central Fort Worth Ret 3,304 34,100,712 2,692,070 2,713,669 8.0% (26,619) 9,600 7,500 $10.27
East Dallas Outlying Ret 533 6,714,776 441,705 441,705 6.6% 19,835 209,543 3,664 $17.74
Far North Dallas Ret 3,715 66,089,395 6,076,693 6,196,275 9.4% 157,011 149,501 204,942 $14.90
Mid-Cities Ret 3,989 63,735,020 4,139,555 4,231,224 6.6% 117,929 93,198 95,615 $14.38
Near North Dallas Ret 1,367 25,303,777 1,459,992 1,575,913 6.2% (15,255) 4,945 14,000 $14.73
North Central Dallas Ret 1,795 36,122,508 2,382,511 2,551,095 7.1% 167,849 93,144 1,987,123 $15.90
Southeast Dallas Ret 1,957 21,171,464 1,305,135 1,311,015 6.2% 44,241 23,314 0 $11.71
Southwest Dallas Ret 1,806 22,815,374 1,994,974 2,038,712 8.9% 127,365 130,326 101,577 $10.62
Southwest Outlying Ret 1,756 15,134,496 641,258 645,516 4.3% 45,927 3,969 95,094 $12.02
Suburban Fort Worth Ret 2,314 33,524,564 1,982,609 2,082,441 6.2% 126,847 46,048 104,790 $12.82
West Dallas Ret 2,438 38,556,151 3,030,403 3,040,684 7.9% 51,822 23,183 278,200 $14.61
Totals 26,962 379,321,533 26,941,530 27,624,874 7.3% 793,260 794,722 2,895,205 $13.80
Source: CoStar Property®
Existing Inventory Vacancy
Existing Inventory Vacancy
Existing Inventory Vacancy
FIGURES AT A GLANCE

10 THE COSTAR RETAIL REPORT ©2014 COSTAR GROUP, INC.
DALLAS/FT. WORTH – FIRST QUARTER 2014
Dallas/Ft. Worth Retail MarketFIRST QUARTER 2014 – DALLAS/FT. WORTH
Dallas/Ft. Worth Retail Market
©2014 COSTAR GROUP, INC. THE COSTAR RETAIL REPORT 11
FIGURES AT A GLANCE
General Retail Submarket Statistics First Quarter 2014
YTD Net YTD Under Quoted
Market # Blds Total GLA Direct SF Total SF Vac % Absorption Deliveries Const SF Rates
Addison Ret 115 1,034,673 97,503 98,978 9.6% 120 0 0 $13.32
Allen Ret 119 1,419,960 15,459 15,459 1.1% 4,631 0 0 $19.27
C Hill/Duncvll 313 2,098,106 99,619 99,619 4.7% (3,008) 0 0 $12.59
Central Plano 412 6,091,667 233,349 233,349 3.8% (6,651) 0 14,550 $15.36
Coppell Ret 99 1,045,178 20,836 20,836 2.0% 8,016 0 0 $19.81
Crowley/Burle 88 986,135 10,658 10,658 1.1% 500 0 0 $12.75
Dallas CBD Re 108 1,460,466 95,864 95,864 6.6% (2,500) 0 0 $14.76
Delta County 7 27,802 0 0 0.0% 0 0 0 $0.00
Denton Ret 357 3,040,018 187,686 187,686 6.2% (6,263) 0 6,154 $15.48
DFW Airport R 5 29,826 0 0 0.0% 0 0 0 $0.00
East Dallas Ou 271 1,461,644 48,225 48,225 3.3% 2,738 2,100 0 $7.94
East Fort Wort 341 1,615,899 96,376 96,376 6.0% 11,000 0 0 $5.60
East Lewisville 75 949,733 13,346 13,346 1.4% 2,742 0 0 $19.37
East Plano Ret 7 30,641 4,800 4,800 15.7% (2,400) 0 0 $12.75
Far North Dall 128 1,474,452 67,853 70,036 4.7% (2,964) 0 9,000 $19.63
Farmers Branc 54 1,080,427 35,689 177,379 16.4% 13,729 0 0 $17.84
Flower Mound 11 51,090 4,000 4,000 7.8% 1,975 0 0 $12.67
Fort Worth CB 69 953,781 52,437 57,007 6.0% 11,593 0 0 $22.69
Ft Worth SW Q 459 2,424,119 61,560 61,560 2.5% 6,305 0 0 $16.19
Garland Ret 523 5,175,503 358,697 358,697 6.9% 31,987 0 0 $13.17
Grapevine/Co 263 3,134,517 25,172 25,172 0.8% 14,556 6,088 0 $20.20
Haltom City R 458 2,620,476 183,186 184,086 7.0% (21,034) 0 0 $8.73
Henderson Co 298 2,032,572 83,506 83,506 4.1% 5,704 0 0 $9.40
Hood County 143 1,370,912 50,943 50,943 3.7% 2,321 0 0 $12.75
Hunt County R 272 1,851,562 84,235 84,235 4.5% 16,757 0 0 $12.65
Hurst/Euless/B 427 4,236,363 257,921 257,921 6.1% 16,571 2,895 0 $14.00
Irving Ret 588 3,505,959 74,676 77,534 2.2% 25,662 10,930 3,200 $9.78
Lakewood Ret 756 3,799,796 195,498 195,498 5.1% 10,934 7,951 0 $17.58
Lancaster Ret 103 1,000,756 5,246 5,246 0.5% 2,704 0 0 $6.42
Las Colinas Re 109 898,071 10,553 10,553 1.2% 0 0 0 $12.26
Lewisville Ret 430 5,622,067 106,644 109,383 1.9% 906 0 45,500 $16.75
Lovefield/Wes 640 4,195,669 103,701 105,701 2.5% (12,591) 0 2,700 $14.14
McKinney Ret 286 3,186,065 135,154 135,154 4.2% 94,662 116,352 0 $16.46
Mesquite Ret 179 1,170,411 33,912 33,912 2.9% (10,700) 0 0 $12.80
Murphy/Wylie 84 1,045,130 24,072 24,072 2.3% 500 0 5,077 $14.40
N Central Dall 153 2,051,965 21,396 21,396 1.0% 73,195 70,595 0 $22.53
Source: CoStar Property®
Existing Inventory Vacancy
12 THE COSTAR RETAIL REPORT ©2014 COSTAR GROUP, INC.
DALLAS/FT. WORTH – FIRST QUARTER 2014
Dallas/Ft. Worth Retail MarketFIRST QUARTER 2014 – DALLAS/FT. WORTH
Dallas/Ft. Worth Retail Market
©2014 COSTAR GROUP, INC. THE COSTAR RETAIL REPORT 13
FIGURES AT A GLANCE
General Retail Submarket Statistics First Quarter 2014
YTD Net YTD Under Quoted
Market # Blds Total GLA Direct SF Total SF Vac % Absorption Deliveries Const SF Rates
N Collin Cty O 77 382,819 33,961 33,961 8.9% 1,100 0 0 $18.09
North Arlingto 283 2,643,622 130,899 130,899 5.0% (15,702) 0 27,652 $12.57
North Carrollto 134 2,155,328 78,383 82,083 3.8% 12,290 0 1,900,000 $18.05
North Dallas R 34 281,163 22,600 24,771 8.8% (2,600) 0 0 $0.00
North Fort Wo 385 2,464,746 48,482 48,482 2.0% 1,380 0 0 $13.71
North Grand P 424 3,113,142 268,449 273,133 8.8% 14,655 12,253 26,407 $11.80
Northeast Dall 177 1,892,087 26,216 26,216 1.4% 500 0 0 $9.96
Northwest Da 315 3,384,262 67,227 67,227 2.0% 666 0 0 $13.24
Northwest For 465 3,981,138 127,104 127,104 3.2% (1,658) 3,267 44,515 $16.74
Park Cities Ret 160 986,374 6,324 10,074 1.0% (2,250) 0 0 $31.32
Parker County 323 3,053,318 57,328 57,328 1.9% 9,643 0 0 $9.16
Pleasant Gr/SE 616 3,395,359 75,843 80,973 2.4% (7) 4,108 0 $10.10
Richardson Re 178 1,794,335 117,001 117,001 6.5% 5,100 0 0 $14.81
Richland Hills 171 1,321,388 62,403 68,398 5.2% (6,461) 0 0 $8.55
Rockwall Ret 102 1,289,804 33,900 33,900 2.6% 3,770 6,500 3,664 $18.53
Sachse/Rowle 173 1,161,962 82,898 82,898 7.1% (103) 0 122,064 $16.19
SE Outlying Ta 290 2,780,116 88,585 88,585 3.2% 17,301 8,189 10,493 $10.80
South Arlingto 754 6,983,464 206,970 208,443 3.0% 6,964 0 0 $15.62
South Carrollto 233 1,374,722 29,112 39,965 2.9% 5,558 4,558 0 $16.60
South Grand P 51 557,248 1,420 1,420 0.3% 20,957 20,457 0 $17.95
Southeast Fort 349 2,321,459 41,601 41,601 1.8% 2,589 0 0 $13.49
Southeast Out 320 1,604,618 110,220 110,220 6.9% 4,494 0 0 $13.25
Southlake Ret 61 767,250 19,884 19,884 2.6% 0 0 10,000 $14.48
Southwest For 260 2,805,715 69,299 71,055 2.5% (1,760) 0 0 $9.46
Southwest Ou 1,369 8,514,688 222,982 222,982 2.6% 45,869 3,969 95,094 $14.03
SW Dallas Cou 894 6,184,611 143,431 187,169 3.0% 15,722 11,752 101,577 $12.48
Town East Ret 154 1,932,745 113,406 113,406 5.9% 10,804 7,818 0 $9.36
Trophy/Roano 68 400,657 1,920 1,920 0.5% 50,316 48,914 0 $18.75
Upper Greenv 146 2,155,077 63,951 173,951 8.1% (1,055) 4,945 0 $20.77
Uptown Ret 223 1,521,451 40,191 40,191 2.6% 577 0 0 $30.11
Watauga/Kelle 443 3,804,838 135,678 135,678 3.6% 50,541 40,281 53,775 $10.57
West Fort Wo 711 6,187,903 349,909 349,909 5.7% 2,936 0 7,500 $10.48
West Frisco Re 96 1,099,879 24,926 24,926 2.3% (434) 0 47,224 $21.10
West Plano Re 134 2,314,068 29,588 32,255 1.4% 5,890 0 0 $22.22
White Settlem 131 1,443,905 26,119 26,119 1.8% (2,365) 0 0 $4.50
Totals 19,454 162,228,672 5,857,982 6,212,314 3.8% 546,924 393,922 2,536,146 $13.93 Source: CoStar Property®
Existing Inventory Vacancy

12 THE COSTAR RETAIL REPORT ©2014 COSTAR GROUP, INC.
DALLAS/FT. WORTH – FIRST QUARTER 2014
Dallas/Ft. Worth Retail MarketFIRST QUARTER 2014 – DALLAS/FT. WORTH
Dallas/Ft. Worth Retail Market
©2014 COSTAR GROUP, INC. THE COSTAR RETAIL REPORT 13
FIGURES AT A GLANCE
Mall Submarket Statistics First Quarter 2014
YTD Net YTD Under Quoted
Market # Ctrs Total GLA Direct SF Total SF Vac % Absorption Deliveries Const SF Rates
Addison Ret 0 0 0 0 0.0% 0 0 0 $0.00
Allen Ret 3 2,719,014 356,834 356,834 13.1% 0 0 0 $25.35
C Hill/Duncvll 1 628,196 71,147 71,147 11.3% 1,720 0 0 $0.00
Central Plano 2 1,250,390 0 0 0.0% 0 0 0 $0.00
Coppell Ret 0 0 0 0 0.0% 0 0 0 $0.00
Crowley/Burle 0 0 0 0 0.0% 0 0 0 $0.00
Dallas CBD Re 0 0 0 0 0.0% 0 0 0 $0.00
Delta County 0 0 0 0 0.0% 0 0 0 $0.00
Denton Ret 1 737,665 0 0 0.0% 0 0 0 $0.00
DFW Airport R 0 0 0 0 0.0% 0 0 0 $0.00
East Dallas Ou 0 0 0 0 0.0% 0 0 0 $0.00
East Fort Wort 0 0 0 0 0.0% 0 0 0 $0.00
East Lewisville 0 0 0 0 0.0% 0 0 0 $0.00
East Plano Ret 0 0 0 0 0.0% 0 0 0 $0.00
Far North Dall 2 2,191,258 638,821 638,821 29.2% 0 0 0 $18.70
Farmers Branc 0 0 0 0 0.0% 0 0 0 $0.00
Flower Mound 0 0 0 0 0.0% 0 0 0 $0.00
Fort Worth CB 0 0 0 0 0.0% 0 0 0 $0.00
Ft Worth SW Q 1 1,156,046 111,604 111,604 9.7% (618) 0 0 $0.00
Garland Ret 1 1,137,098 147,604 147,604 13.0% 0 0 0 $22.46
Grapevine/Co 1 1,985,032 9,208 9,208 0.5% 0 0 0 $19.00
Haltom City R 0 0 0 0 0.0% 0 0 0 $0.00
Henderson Co 0 0 0 0 0.0% 0 0 0 $0.00
Hood County 0 0 0 0 0.0% 0 0 0 $0.00
Hunt County R 0 0 0 0 0.0% 0 0 0 $0.00
Hurst/Euless/B 1 1,657,811 0 0 0.0% 0 0 0 $0.00
Irving Ret 1 1,394,853 81,716 81,716 5.9% 0 0 0 $0.00
Lakewood Ret 0 0 0 0 0.0% 0 0 0 $0.00
Lancaster Ret 0 0 0 0 0.0% 0 0 0 $0.00
Las Colinas Re 0 0 0 0 0.0% 0 0 0 $0.00
Lewisville Ret 2 1,767,792 113,739 113,739 6.4% 2,081 0 0 $30.00
Lovefield/Wes 0 0 0 0 0.0% 0 0 0 $0.00
McKinney Ret 0 0 0 0 0.0% 0 0 0 $0.00
Mesquite Ret 0 0 0 0 0.0% 0 0 0 $0.00
Murphy/Wylie 0 0 0 0 0.0% 0 0 0 $0.00
N Central Dall 1 1,682,649 0 0 0.0% 0 0 0 $0.00
Source: CoStar Property®
Existing Inventory Vacancy
14 THE COSTAR RETAIL REPORT ©2014 COSTAR GROUP, INC.
DALLAS/FT. WORTH – FIRST QUARTER 2014
Dallas/Ft. Worth Retail MarketFIRST QUARTER 2014 – DALLAS/FT. WORTH
Dallas/Ft. Worth Retail Market
©2014 COSTAR GROUP, INC. THE COSTAR RETAIL REPORT 15
FIGURES AT A GLANCE
Mall Submarket Statistics First Quarter 2014
YTD Net YTD Under Quoted
Market # Ctrs Total GLA Direct SF Total SF Vac % Absorption Deliveries Const SF Rates
N Collin Cty O 0 0 0 0 0.0% 0 0 0 $0.00
North Arlingto 1 415,233 48,450 48,450 11.7% 6,433 0 0 $17.25
North Carrollto 0 0 0 0 0.0% 0 0 0 $0.00
North Dallas R 1 1,981,419 0 0 0.0% 0 0 0 $0.00
North Fort Wo 0 0 0 0 0.0% 0 0 0 $0.00
North Grand P 2 1,041,395 163,792 163,792 15.7% 0 0 0 $0.00
Northeast Dall 0 0 0 0 0.0% 0 0 0 $0.00
Northwest Da 0 0 0 0 0.0% 0 0 0 $0.00
Northwest For 1 998,044 64,105 64,105 6.4% (1,814) 0 6,500 $26.50
Park Cities Ret 1 224,511 0 0 0.0% 0 0 0 $0.00
Parker County 1 477,222 9,007 9,007 1.9% (6,000) 0 0 $19.67
Pleasant Gr/SE 0 0 0 0 0.0% 0 0 0 $0.00
Richardson Re 0 0 0 0 0.0% 0 0 0 $0.00
Richland Hills 0 0 0 0 0.0% 0 0 0 $0.00
Rockwall Ret 0 0 0 0 0.0% 0 0 0 $0.00
Sachse/Rowle 0 0 0 0 0.0% 0 0 0 $0.00
SE Outlying Ta 0 0 0 0 0.0% 0 0 0 $0.00
South Arlingto 3 2,899,730 57,682 57,682 2.0% 0 0 0 $15.26
South Carrollto 0 0 0 0 0.0% 0 0 0 $0.00
South Grand P 1 499,396 22,742 22,742 4.6% 2,573 0 0 $0.00
Southeast Fort 0 0 0 0 0.0% 0 0 0 $0.00
Southeast Out 0 0 0 0 0.0% 0 0 0 $0.00
Southlake Ret 2 1,045,569 97,313 97,313 9.3% (17,493) 0 0 $28.25
Southwest For 1 1,368,290 0 0 0.0% 0 0 0 $0.00
Southwest Ou 0 0 0 0 0.0% 0 0 0 $0.00
SW Dallas Cou 1 470,219 29,477 29,477 6.3% 1,245 0 0 $15.00
Town East Ret 1 1,448,914 0 0 0.0% 0 0 0 $0.00
Trophy/Roano 0 0 0 0 0.0% 0 0 0 $0.00
Upper Greenv 1 245,893 3,316 3,316 1.3% 0 0 0 $0.00
Uptown Ret 1 148,725 4,327 4,327 2.9% 0 0 0 $0.00
Watauga/Kelle 0 0 0 0 0.0% 0 0 0 $0.00
West Fort Wo 6 2,226,483 126,864 130,880 5.9% (6,857) 0 0 $30.00
West Frisco Re 0 0 0 0 0.0% 0 0 0 $0.00
West Plano Re 2 2,252,916 21,639 21,639 1.0% 831 0 0 $17.50
White Settlem 1 52,374 0 0 0.0% 0 0 0 $0.00
Totals 44 36,104,137 2,179,387 2,183,403 6.0% (17,899) 0 6,500 $21.66 Source: CoStar Property®
Existing Inventory Vacancy

14 THE COSTAR RETAIL REPORT ©2014 COSTAR GROUP, INC.
DALLAS/FT. WORTH – FIRST QUARTER 2014
Dallas/Ft. Worth Retail MarketFIRST QUARTER 2014 – DALLAS/FT. WORTH
Dallas/Ft. Worth Retail Market
©2014 COSTAR GROUP, INC. THE COSTAR RETAIL REPORT 15
FIGURES AT A GLANCE
Power Center Submarket Statistics First Quarter 2014
YTD Net YTD Under Quoted
Market # Ctrs Total GLA Direct SF Total SF Vac % Absorption Deliveries Const SF Rates
Addison Ret 1 451,844 13,910 13,910 3.1% (2,000) 0 0 $0.00
Allen Ret 0 0 0 0 0.0% 0 0 0 $0.00
C Hill/Duncvll 1 411,492 42,800 42,800 10.4% 11,344 0 0 $23.50
Central Plano 1 482,192 28,697 28,697 6.0% (22,855) 0 0 $0.00
Coppell Ret 2 1,026,288 0 0 0.0% 0 0 31,450 $0.00
Crowley/Burle 1 468,938 27,547 29,618 6.3% (1,500) 0 0 $20.31
Dallas CBD Re 0 0 0 0 0.0% 0 0 0 $0.00
Delta County 0 0 0 0 0.0% 0 0 0 $0.00
Denton Ret 2 1,005,102 21,100 21,100 2.1% (18,600) 0 0 $20.68
DFW Airport R 0 0 0 0 0.0% 0 0 0 $0.00
East Dallas Ou 1 548,556 11,331 11,331 2.1% 14,600 0 0 $19.54
East Fort Wort 2 820,249 16,755 16,755 2.0% 0 0 0 $14.45
East Lewisville 0 0 0 0 0.0% 0 0 0 $0.00
East Plano Ret 0 0 0 0 0.0% 0 0 0 $0.00
Far North Dall 1 274,546 31,775 31,775 11.6% 0 0 0 $16.79
Farmers Branc 0 0 0 0 0.0% 0 0 0 $0.00
Flower Mound 0 0 0 0 0.0% 0 0 0 $0.00
Fort Worth CB 0 0 0 0 0.0% 0 0 0 $0.00
Ft Worth SW Q 0 0 0 0 0.0% 0 0 0 $0.00
Garland Ret 1 229,215 0 0 0.0% 0 0 0 $0.00
Grapevine/Co 1 419,142 60,966 85,993 20.5% 5,446 0 0 $25.08
Haltom City R 0 0 0 0 0.0% 0 0 0 $0.00
Henderson Co 0 0 0 0 0.0% 0 0 0 $0.00
Hood County 0 0 0 0 0.0% 0 0 0 $0.00
Hunt County R 0 0 0 0 0.0% 0 0 0 $0.00
Hurst/Euless/B 3 1,001,840 13,701 13,701 1.4% (4,959) 0 0 $0.00
Irving Ret 2 592,703 63,886 63,886 10.8% 714 0 0 $10.70
Lakewood Ret 1 200,347 0 0 0.0% 0 0 0 $0.00
Lancaster Ret 0 0 0 0 0.0% 0 0 0 $0.00
Las Colinas Re 2 854,119 29,485 29,485 3.5% 10,168 0 0 $18.76
Lewisville Ret 6 2,444,321 260,287 260,287 10.6% (4,617) 0 0 $17.73
Lovefield/Wes 0 0 0 0 0.0% 0 0 0 $0.00
McKinney Ret 3 1,366,711 63,768 63,768 4.7% (25,764) 0 0 $21.85
Mesquite Ret 0 0 0 0 0.0% 0 0 0 $0.00
Murphy/Wylie 2 791,887 0 0 0.0% 0 0 0 $0.00
N Central Dall 2 1,147,458 65,718 65,718 5.7% 1,878 0 0 $0.00
Source: CoStar Property®
Existing Inventory Vacancy

16 THE COSTAR RETAIL REPORT ©2014 COSTAR GROUP, INC.
DALLAS/FT. WORTH – FIRST QUARTER 2014
Dallas/Ft. Worth Retail MarketFIRST QUARTER 2014 – DALLAS/FT. WORTH
Dallas/Ft. Worth Retail Market
©2014 COSTAR GROUP, INC. THE COSTAR RETAIL REPORT 17
FIGURES AT A GLANCE
Power Center Submarket Statistics First Quarter 2014
YTD Net YTD Under Quoted
Market # Ctrs Total GLA Direct SF Total SF Vac % Absorption Deliveries Const SF Rates
N Collin Cty O 0 0 0 0 0.0% 0 0 0 $0.00
North Arlingto 0 0 0 0 0.0% 0 0 0 $0.00
North Carrollto 0 0 0 0 0.0% 0 0 0 $0.00
North Dallas R 0 0 0 0 0.0% 0 0 0 $0.00
North Fort Wo 0 0 0 0 0.0% 0 0 0 $0.00
North Grand P 1 323,749 8,998 8,998 2.8% 1,470 0 0 $0.00
Northeast Dall 0 0 0 0 0.0% 0 0 0 $0.00
Northwest Da 0 0 0 0 0.0% 0 0 0 $0.00
Northwest For 1 180,000 0 0 0.0% 0 0 0 $0.00
Park Cities Ret 0 0 0 0 0.0% 0 0 0 $0.00
Parker County 1 544,200 8,030 8,030 1.5% 0 0 0 $18.00
Pleasant Gr/SE 0 0 0 0 0.0% 0 0 0 $0.00
Richardson Re 1 512,094 0 0 0.0% 0 0 0 $0.00
Richland Hills 1 149,000 0 0 0.0% 0 0 0 $0.00
Rockwall Ret 4 1,383,766 25,840 25,840 1.9% (1,430) 0 0 $21.49
Sachse/Rowle 0 0 0 0 0.0% 0 0 0 $0.00
SE Outlying Ta 2 992,562 24,385 24,385 2.5% (10,550) 0 0 $26.51
South Arlingto 1 212,940 0 0 0.0% 0 0 0 $0.00
South Carrollto 0 0 0 0 0.0% 0 0 0 $0.00
South Grand P 1 316,693 3,060 3,060 1.0% (3,060) 0 0 $0.00
Southeast Fort 0 0 0 0 0.0% 0 0 0 $0.00
Southeast Out 0 0 0 0 0.0% 0 0 0 $0.00
Southlake Ret 1 353,478 13,260 13,260 3.8% 0 0 0 $23.52
Southwest For 0 0 0 0 0.0% 0 0 0 $0.00
Southwest Ou 3 971,411 6,228 6,228 0.6% 0 0 0 $0.00
SW Dallas Cou 2 881,991 33,280 33,280 3.8% (7,930) 0 0 $15.50
Town East Ret 3 1,316,320 81,279 81,279 6.2% 0 0 0 $23.29
Trophy/Roano 1 385,259 0 0 0.0% 0 0 0 $0.00
Upper Greenv 1 466,740 1,985 1,985 0.4% 3,114 0 0 $27.00
Uptown Ret 0 0 0 0 0.0% 0 0 0 $0.00
Watauga/Kelle 1 331,632 0 0 0.0% 0 0 0 $19.00
West Fort Wo 3 1,369,005 196,140 196,140 14.3% 1,212 0 0 $21.99
West Frisco Re 1 484,694 9,800 9,800 2.0% (1,800) 0 0 $0.00
West Plano Re 1 223,263 0 0 0.0% 0 0 0 $36.00
White Settlem 1 415,189 7,895 7,895 1.9% 13,694 0 0 $18.99
Totals 66 26,350,936 1,171,906 1,199,004 4.6% (41,425) 0 31,450 $20.16 Source: CoStar Property®
Existing Inventory Vacancy
16 THE COSTAR RETAIL REPORT ©2014 COSTAR GROUP, INC.
DALLAS/FT. WORTH – FIRST QUARTER 2014
Dallas/Ft. Worth Retail MarketFIRST QUARTER 2014 – DALLAS/FT. WORTH
Dallas/Ft. Worth Retail Market
©2014 COSTAR GROUP, INC. THE COSTAR RETAIL REPORT 17
FIGURES AT A GLANCE
Shopping Center Submarket Statistics First Quarter 2014
YTD Net YTD Under Quoted
Market # Ctrs Total GLA Direct SF Total SF Vac % Absorption Deliveries Const SF Rates
Addison Ret 35 1,566,694 362,657 362,657 23.1% (3,538) 0 0 $14.34
Allen Ret 43 2,404,580 165,306 165,306 6.9% 14,540 16,574 19,251 $16.81
C Hill/Duncvll 93 4,909,263 840,876 840,876 17.1% (13,609) 0 0 $9.74
Central Plano 98 7,157,967 773,295 804,198 11.2% 28,851 0 0 $14.40
Coppell Ret 37 1,459,202 177,600 177,600 12.2% 16,769 0 0 $17.69
Crowley/Burle 15 914,913 122,516 122,516 13.4% 4,570 0 0 $12.03
Dallas CBD Re 2 60,000 0 0 0.0% 0 0 0 $0.00
Delta County 0 0 0 0 0.0% 0 0 0 $0.00
Denton Ret 56 2,370,875 154,038 184,319 7.8% 4,240 0 0 $12.80
DFW Airport R 0 0 0 0 0.0% 0 0 0 $0.00
East Dallas Ou 37 885,701 262,136 262,136 29.6% (1,633) 200,943 0 $12.98
East Fort Wort 42 1,342,239 116,512 124,217 9.3% (3,472) 0 0 $8.48
East Lewisville 10 462,972 29,048 29,048 6.3% 0 0 0 $21.63
East Plano Ret 2 12,000 1,500 1,500 12.5% 0 0 0 $16.00
Far North Dall 63 4,501,704 451,727 451,727 10.0% (57,496) 0 0 $15.49
Farmers Branc 21 1,060,509 129,081 137,280 12.9% (20,062) 0 0 $13.19
Flower Mound 2 97,290 4,202 4,202 4.3% 3,146 0 0 $12.00
Fort Worth CB 1 17,000 0 0 0.0% 0 0 0 $0.00
Ft Worth SW Q 39 777,104 110,865 110,865 14.3% 788 0 0 $11.51
Garland Ret 164 6,962,302 1,136,071 1,204,568 17.3% 16,227 0 35,000 $10.37
Grapevine/Co 46 2,167,025 240,852 242,056 11.2% (6,577) 0 0 $16.84
Haltom City R 46 1,373,849 236,623 236,623 17.2% 7,530 0 0 $10.09
Henderson Co 42 814,722 62,056 62,056 7.6% 11,748 11,388 0 $11.06
Hood County 20 757,292 36,000 36,000 4.8% 5,400 0 0 $13.93
Hunt County R 35 1,282,290 106,979 106,979 8.3% 5,000 0 0 $11.78
Hurst/Euless/B 123 4,819,955 934,830 937,558 19.5% 14,061 0 0 $11.84
Irving Ret 116 4,621,240 617,099 617,099 13.4% (9,300) 0 0 $14.29
Lakewood Ret 107 2,411,282 156,604 156,604 6.5% (7,785) 0 0 $19.21
Lancaster Ret 14 607,528 76,677 76,677 12.6% (8,665) 0 0 $9.69
Las Colinas Re 21 682,396 72,489 72,489 10.6% (841) 0 0 $14.04
Lewisville Ret 112 5,651,939 701,230 701,230 12.4% (21,631) 0 171,643 $14.77
Lovefield/Wes 51 1,723,756 175,648 175,648 10.2% (11,527) 0 0 $12.00
McKinney Ret 62 2,371,822 244,866 245,291 10.3% (1,961) 0 0 $16.38
Mesquite Ret 41 1,319,411 103,205 103,955 7.9% 8,064 0 0 $12.99
Murphy/Wylie 18 631,521 47,497 47,497 7.5% 12,744 0 0 $17.70
N Central Dall 50 2,970,023 220,617 220,617 7.4% 17,335 8,041 0 $18.68
Source: CoStar Property®
Existing Inventory Vacancy

18 THE COSTAR RETAIL REPORT ©2014 COSTAR GROUP, INC.
DALLAS/FT. WORTH – FIRST QUARTER 2014
Dallas/Ft. Worth Retail MarketFIRST QUARTER 2014 – DALLAS/FT. WORTH
Dallas/Ft. Worth Retail Market
©2014 COSTAR GROUP, INC. THE COSTAR RETAIL REPORT 19
FIGURES AT A GLANCE
Shopping Center Submarket Statistics First Quarter 2014
YTD Net YTD Under Quoted
Market # Ctrs Total GLA Direct SF Total SF Vac % Absorption Deliveries Const SF Rates
N Collin Cty O 15 292,796 25,000 25,000 8.5% 3,234 0 0 $16.05
North Arlingto 45 1,652,949 207,494 207,494 12.6% 8,247 0 0 $15.65
North Carrollto 54 2,843,148 207,292 207,292 7.3% 11,724 0 0 $15.62
North Dallas R 27 1,730,370 101,580 101,580 5.9% 4,239 0 14,000 $22.51
North Fort Wo 28 1,072,125 75,685 75,685 7.1% 3,547 0 0 $12.01
North Grand P 67 1,793,661 204,182 204,182 11.4% 7,770 0 0 $10.07
Northeast Dall 83 4,135,735 504,347 504,347 12.2% (13,895) 0 0 $11.05
Northwest Da 71 3,540,659 327,956 327,956 9.3% 1,695 0 0 $14.53
Northwest For 48 1,814,579 193,953 193,953 10.7% 8,316 2,500 0 $17.48
Park Cities Ret 34 1,222,912 79,080 79,080 6.5% (2,383) 0 0 $21.11
Parker County 33 876,954 82,685 82,685 9.4% 16,177 0 0 $13.17
Pleasant Gr/SE 83 3,068,913 209,389 209,389 6.8% 11,751 0 0 $9.09
Richardson Re 83 3,953,128 550,221 565,358 14.3% 40,319 0 0 $12.86
Richland Hills 27 837,309 106,253 110,503 13.2% 1,342 0 0 $9.14
Rockwall Ret 22 1,145,305 60,273 60,273 5.3% 1,790 0 0 $19.61
Sachse/Rowle 35 1,449,680 149,253 151,690 10.5% 1,553 16,575 0 $16.54
SE Outlying Ta 59 1,770,194 233,041 233,041 13.2% (17,861) 0 0 $17.28
South Arlingto 192 7,893,675 765,634 786,345 10.0% 39,678 0 0 $13.17
South Carrollto 54 2,471,383 435,455 435,455 17.6% 15,024 0 0 $11.37
South Grand P 10 343,741 16,314 16,314 4.7% 4,808 0 0 $13.48
Southeast Fort 36 827,616 114,887 114,887 13.9% 7,211 9,600 0 $13.63
Southeast Out 29 655,323 87,167 87,167 13.3% 5,049 0 0 $9.81
Southlake Ret 26 1,376,240 91,060 91,060 6.6% 7,557 0 41,316 $24.73
Southwest For 57 3,699,416 494,515 531,560 14.4% 1,240 0 0 $10.30
Southwest Ou 115 3,520,193 325,105 329,363 9.4% (7,663) 0 0 $11.24
SW Dallas Cou 132 5,581,578 652,421 652,421 11.7% 127,842 118,574 0 $10.75
Town East Ret 42 2,161,489 335,852 335,852 15.5% (2,666) 0 0 $11.22
Trophy/Roano 11 373,008 27,110 27,110 7.3% (716) 6,655 0 $16.98
Upper Greenv 43 2,917,906 254,210 254,210 8.7% (3,286) 0 0 $15.71
Uptown Ret 31 531,804 22,792 22,792 4.3% (800) 0 0 $32.08
Watauga/Kelle 94 4,560,239 528,567 587,527 12.9% 37,263 0 0 $13.11
West Fort Wo 117 4,485,698 752,584 756,992 16.9% (50,729) 0 0 $8.87
West Frisco Re 33 1,837,868 188,976 188,976 10.3% 53,452 9,950 39,899 $18.52
West Plano Re 49 4,253,739 329,708 329,708 7.8% (15,542) 0 0 $18.77
White Settlem 13 747,525 17,603 17,603 2.4% 0 0 0 $16.96
Totals 3,562 152,607,224 17,628,346 17,926,244 11.7% 308,203 400,800 321,109 $13.23 Source: CoStar Property®
Existing Inventory Vacancy

18 THE COSTAR RETAIL REPORT ©2014 COSTAR GROUP, INC.
DALLAS/FT. WORTH – FIRST QUARTER 2014
Dallas/Ft. Worth Retail MarketFIRST QUARTER 2014 – DALLAS/FT. WORTH
Dallas/Ft. Worth Retail Market
©2014 COSTAR GROUP, INC. THE COSTAR RETAIL REPORT 19
FIGURES AT A GLANCE
Specialty Center Submarket Statistics First Quarter 2014
YTD Net YTD Under Quoted
Market # Ctrs Total GLA Direct SF Total SF Vac % Absorption Deliveries Const SF Rates
Addison Ret 0 0 0 0 0.0% 0 0 0 $0.00
Allen Ret 1 473,302 0 0 0.0% 0 0 0 $0.00
C Hill/Duncvll 0 0 0 0 0.0% 0 0 0 $0.00
Central Plano 0 0 0 0 0.0% 0 0 0 $0.00
Coppell Ret 0 0 0 0 0.0% 0 0 0 $0.00
Crowley/Burle 0 0 0 0 0.0% 0 0 0 $0.00
Dallas CBD Re 0 0 0 0 0.0% 0 0 0 $0.00
Delta County 0 0 0 0 0.0% 0 0 0 $0.00
Denton Ret 0 0 0 0 0.0% 0 0 0 $0.00
DFW Airport R 1 271,250 0 0 0.0% 0 0 0 $0.00
East Dallas Ou 0 0 0 0 0.0% 0 0 0 $0.00
East Fort Wort 0 0 0 0 0.0% 0 0 0 $0.00
East Lewisville 0 0 0 0 0.0% 0 0 0 $0.00
East Plano Ret 0 0 0 0 0.0% 0 0 0 $0.00
Far North Dall 0 0 0 0 0.0% 0 0 0 $0.00
Farmers Branc 0 0 0 0 0.0% 0 0 0 $0.00
Flower Mound 0 0 0 0 0.0% 0 0 0 $0.00
Fort Worth CB 1 44,915 0 0 0.0% 0 0 0 $0.00
Ft Worth SW Q 0 0 0 0 0.0% 0 0 0 $0.00
Garland Ret 0 0 0 0 0.0% 0 0 0 $0.00
Grapevine/Co 0 0 0 0 0.0% 0 0 0 $0.00
Haltom City R 0 0 0 0 0.0% 0 0 0 $0.00
Henderson Co 0 0 0 0 0.0% 0 0 0 $0.00
Hood County 0 0 0 0 0.0% 0 0 0 $0.00
Hunt County R 0 0 0 0 0.0% 0 0 0 $0.00
Hurst/Euless/B 0 0 0 0 0.0% 0 0 0 $0.00
Irving Ret 0 0 0 0 0.0% 0 0 0 $0.00
Lakewood Ret 0 0 0 0 0.0% 0 0 0 $0.00
Lancaster Ret 0 0 0 0 0.0% 0 0 0 $0.00
Las Colinas Re 0 0 0 0 0.0% 0 0 0 $0.00
Lewisville Ret 0 0 0 0 0.0% 0 0 0 $0.00
Lovefield/Wes 0 0 0 0 0.0% 0 0 0 $0.00
McKinney Ret 0 0 0 0 0.0% 0 0 0 $0.00
Mesquite Ret 0 0 0 0 0.0% 0 0 0 $0.00
Murphy/Wylie 0 0 0 0 0.0% 0 0 0 $0.00
N Central Dall 0 0 0 0 0.0% 0 0 0 $0.00
Source: CoStar Property®
Existing Inventory Vacancy
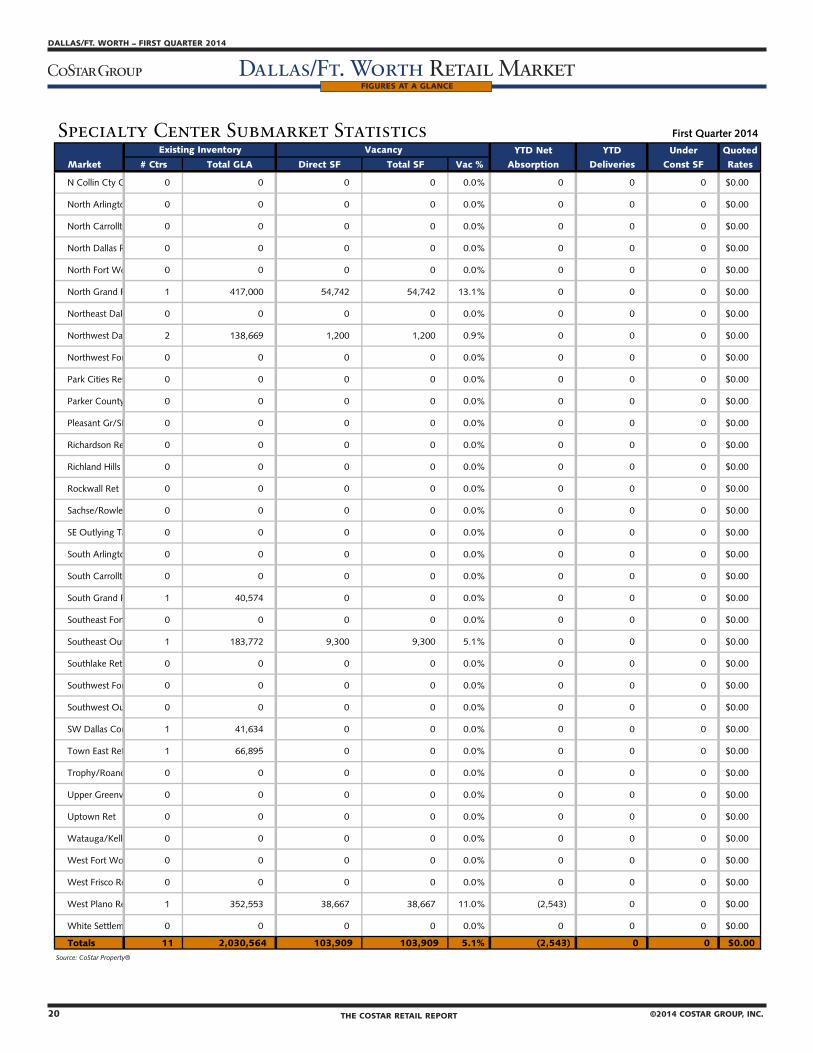
20 THE COSTAR RETAIL REPORT ©2014 COSTAR GROUP, INC.
DALLAS/FT. WORTH – FIRST QUARTER 2014
Dallas/Ft. Worth Retail MarketFIRST QUARTER 2014 – DALLAS/FT. WORTH
Dallas/Ft. Worth Retail Market
©2014 COSTAR GROUP, INC. THE COSTAR RETAIL REPORT 21
FIGURES AT A GLANCE
Specialty Center Submarket Statistics First Quarter 2014
YTD Net YTD Under Quoted
Market # Ctrs Total GLA Direct SF Total SF Vac % Absorption Deliveries Const SF Rates
N Collin Cty O 0 0 0 0 0.0% 0 0 0 $0.00
North Arlingto 0 0 0 0 0.0% 0 0 0 $0.00
North Carrollto 0 0 0 0 0.0% 0 0 0 $0.00
North Dallas R 0 0 0 0 0.0% 0 0 0 $0.00
North Fort Wo 0 0 0 0 0.0% 0 0 0 $0.00
North Grand P 1 417,000 54,742 54,742 13.1% 0 0 0 $0.00
Northeast Dall 0 0 0 0 0.0% 0 0 0 $0.00
Northwest Da 2 138,669 1,200 1,200 0.9% 0 0 0 $0.00
Northwest For 0 0 0 0 0.0% 0 0 0 $0.00
Park Cities Ret 0 0 0 0 0.0% 0 0 0 $0.00
Parker County 0 0 0 0 0.0% 0 0 0 $0.00
Pleasant Gr/SE 0 0 0 0 0.0% 0 0 0 $0.00
Richardson Re 0 0 0 0 0.0% 0 0 0 $0.00
Richland Hills 0 0 0 0 0.0% 0 0 0 $0.00
Rockwall Ret 0 0 0 0 0.0% 0 0 0 $0.00
Sachse/Rowle 0 0 0 0 0.0% 0 0 0 $0.00
SE Outlying Ta 0 0 0 0 0.0% 0 0 0 $0.00
South Arlingto 0 0 0 0 0.0% 0 0 0 $0.00
South Carrollto 0 0 0 0 0.0% 0 0 0 $0.00
South Grand P 1 40,574 0 0 0.0% 0 0 0 $0.00
Southeast Fort 0 0 0 0 0.0% 0 0 0 $0.00
Southeast Out 1 183,772 9,300 9,300 5.1% 0 0 0 $0.00
Southlake Ret 0 0 0 0 0.0% 0 0 0 $0.00
Southwest For 0 0 0 0 0.0% 0 0 0 $0.00
Southwest Ou 0 0 0 0 0.0% 0 0 0 $0.00
SW Dallas Cou 1 41,634 0 0 0.0% 0 0 0 $0.00
Town East Ret 1 66,895 0 0 0.0% 0 0 0 $0.00
Trophy/Roano 0 0 0 0 0.0% 0 0 0 $0.00
Upper Greenv 0 0 0 0 0.0% 0 0 0 $0.00
Uptown Ret 0 0 0 0 0.0% 0 0 0 $0.00
Watauga/Kelle 0 0 0 0 0.0% 0 0 0 $0.00
West Fort Wo 0 0 0 0 0.0% 0 0 0 $0.00
West Frisco Re 0 0 0 0 0.0% 0 0 0 $0.00
West Plano Re 1 352,553 38,667 38,667 11.0% (2,543) 0 0 $0.00
White Settlem 0 0 0 0 0.0% 0 0 0 $0.00
Totals 11 2,030,564 103,909 103,909 5.1% (2,543) 0 0 $0.00 Source: CoStar Property®
Existing Inventory Vacancy

20 THE COSTAR RETAIL REPORT ©2014 COSTAR GROUP, INC.
DALLAS/FT. WORTH – FIRST QUARTER 2014
Dallas/Ft. Worth Retail MarketFIRST QUARTER 2014 – DALLAS/FT. WORTH
Dallas/Ft. Worth Retail Market
©2014 COSTAR GROUP, INC. THE COSTAR RETAIL REPORT 21
FIGURES AT A GLANCE
Total Retail Submarket Statistics First Quarter 2014
YTD Net YTD Under Quoted
Market # Blds Total GLA Direct SF Total SF Vac % Absorption Deliveries Const SF Rates
Addison Ret 184 3,053,211 474,070 475,545 15.6% (5,418) 0 0 $14.09
Allen Ret 283 7,016,856 537,599 537,599 7.7% 19,171 16,574 19,251 $19.44
C Hill/Duncvll 539 8,047,057 1,054,442 1,054,442 13.1% (3,553) 0 0 $9.96
Central Plano 642 14,982,216 1,035,341 1,066,244 7.1% (655) 0 14,550 $14.52
Coppell Ret 184 3,530,668 198,436 198,436 5.6% 24,785 0 31,450 $17.96
Crowley/Burle 151 2,369,986 160,721 162,792 6.9% 3,570 0 0 $14.64
Dallas CBD Re 110 1,520,466 95,864 95,864 6.3% (2,500) 0 0 $14.76
Delta County 7 27,802 0 0 0.0% 0 0 0 $0.00
Denton Ret 474 7,153,660 362,824 393,105 5.5% (20,623) 0 6,154 $14.26
DFW Airport R 6 301,076 0 0 0.0% 0 0 0 $0.00
East Dallas Ou 343 2,895,901 321,692 321,692 11.1% 15,705 203,043 0 $13.67
East Fort Wort 421 3,778,387 229,643 237,348 6.3% 7,528 0 0 $7.99
East Lewisville 99 1,412,705 42,394 42,394 3.0% 2,742 0 0 $20.81
East Plano Ret 9 42,641 6,300 6,300 14.8% (2,400) 0 0 $13.52
Far North Dall 330 8,441,960 1,190,176 1,192,359 14.1% (60,460) 0 9,000 $16.13
Farmers Branc 95 2,140,936 164,770 314,659 14.7% (6,333) 0 0 $13.93
Flower Mound 15 148,380 8,202 8,202 5.5% 5,121 0 0 $12.46
Fort Worth CB 72 1,015,696 52,437 57,007 5.6% 11,593 0 0 $22.69
Ft Worth SW Q 510 4,357,269 284,029 284,029 6.5% 6,475 0 0 $12.60
Garland Ret 853 13,504,118 1,642,372 1,710,869 12.7% 48,214 0 35,000 $12.27
Grapevine/Co 391 7,705,716 336,198 362,429 4.7% 13,425 6,088 0 $17.59
Haltom City R 521 3,994,325 419,809 420,709 10.5% (13,504) 0 0 $9.83
Henderson Co 355 2,847,294 145,562 145,562 5.1% 17,452 11,388 0 $10.71
Hood County 177 2,128,204 86,943 86,943 4.1% 7,721 0 0 $13.46
Hunt County R 325 3,133,852 191,214 191,214 6.1% 21,757 0 0 $11.91
Hurst/Euless/B 651 11,715,969 1,206,452 1,209,180 10.3% 25,673 2,895 0 $12.24
Irving Ret 795 10,114,755 837,377 840,235 8.3% 17,076 10,930 3,200 $13.45
Lakewood Ret 895 6,411,425 352,102 352,102 5.5% 3,149 7,951 0 $18.37
Lancaster Ret 125 1,608,284 81,923 81,923 5.1% (5,961) 0 0 $8.78
Las Colinas Re 182 2,434,586 112,527 112,527 4.6% 9,327 0 0 $14.47
Lewisville Ret 711 15,486,119 1,181,900 1,184,639 7.6% (23,261) 0 217,143 $17.00
Lovefield/Wes 717 5,919,425 279,349 281,349 4.8% (24,118) 0 2,700 $13.21
McKinney Ret 429 6,924,598 443,788 444,213 6.4% 66,937 116,352 0 $17.81
Mesquite Ret 246 2,489,822 137,117 137,867 5.5% (2,636) 0 0 $12.94
Murphy/Wylie 141 2,468,538 71,569 71,569 2.9% 13,244 0 5,077 $16.88
N Central Dall 315 7,852,095 307,731 307,731 3.9% 92,408 78,636 0 $19.21
Source: CoStar Property®
Existing Inventory Vacancy

22 THE COSTAR RETAIL REPORT ©2014 COSTAR GROUP, INC.
DALLAS/FT. WORTH – FIRST QUARTER 2014
Dallas/Ft. Worth Retail MarketFIRST QUARTER 2014 – DALLAS/FT. WORTH
Dallas/Ft. Worth Retail Market
©2014 COSTAR GROUP, INC. THE COSTAR RETAIL REPORT 23
FIGURES AT A GLANCE
Total Retail Submarket Statistics First Quarter 2014
YTD Net YTD Under Quoted
Market # Blds Total GLA Direct SF Total SF Vac % Absorption Deliveries Const SF Rates
N Collin Cty O 102 675,615 58,961 58,961 8.7% 4,334 0 0 $16.53
North Arlingto 365 4,711,804 386,843 386,843 8.2% (1,022) 0 27,652 $15.02
North Carrollto 252 4,998,476 285,675 289,375 5.8% 24,014 0 1,900,000 $15.86
North Dallas R 92 3,992,952 124,180 126,351 3.2% 1,639 0 14,000 $22.51
North Fort Wo 419 3,536,871 124,167 124,167 3.5% 4,927 0 0 $12.79
North Grand P 560 6,688,947 700,163 704,847 10.5% 23,895 12,253 26,407 $11.09
Northeast Dall 342 6,027,822 530,563 530,563 8.8% (13,395) 0 0 $11.02
Northwest Da 465 7,063,590 396,383 396,383 5.6% 2,361 0 0 $14.22
Northwest For 584 6,973,761 385,162 385,162 5.5% 4,844 5,767 51,015 $17.42
Park Cities Ret 227 2,433,797 85,404 89,154 3.7% (4,633) 0 0 $22.59
Parker County 385 4,951,694 157,050 157,050 3.2% 19,820 0 0 $12.75
Pleasant Gr/SE 734 6,464,272 285,232 290,362 4.5% 11,744 4,108 0 $9.34
Richardson Re 364 6,259,557 667,222 682,359 10.9% 45,419 0 0 $13.23
Richland Hills 213 2,307,697 168,656 178,901 7.8% (5,119) 0 0 $9.02
Rockwall Ret 190 3,818,875 120,013 120,013 3.1% 4,130 6,500 3,664 $20.03
Sachse/Rowle 230 2,611,642 232,151 234,588 9.0% 1,450 16,575 122,064 $16.40
SE Outlying Ta 413 5,542,872 346,011 346,011 6.2% (11,110) 8,189 10,493 $16.46
South Arlingto 1,112 17,989,809 1,030,286 1,052,470 5.9% 46,642 0 0 $13.84
South Carrollto 335 3,846,105 464,567 475,420 12.4% 20,582 4,558 0 $11.56
South Grand P 88 1,757,652 43,536 43,536 2.5% 25,278 20,457 0 $13.93
Southeast Fort 388 3,149,075 156,488 156,488 5.0% 9,800 9,600 0 $13.62
Southeast Out 357 2,443,713 206,687 206,687 8.5% 9,543 0 0 $10.05
Southlake Ret 177 3,542,537 221,517 221,517 6.3% (9,936) 0 51,316 $23.29
Southwest For 371 7,873,421 563,814 602,615 7.7% (520) 0 0 $10.20
Southwest Ou 1,579 13,006,292 554,315 558,573 4.3% 38,206 3,969 95,094 $11.83
SW Dallas Cou 1,142 13,160,033 858,609 902,347 6.9% 136,879 130,326 101,577 $11.53
Town East Ret 265 6,926,363 530,537 530,537 7.7% 8,138 7,818 0 $13.67
Trophy/Roano 90 1,158,924 29,030 29,030 2.5% 49,600 55,569 0 $17.11
Upper Greenv 241 5,785,616 323,462 433,462 7.5% (1,227) 4,945 0 $16.67
Uptown Ret 266 2,201,980 67,310 67,310 3.1% (223) 0 0 $30.82
Watauga/Kelle 641 8,696,709 664,245 723,205 8.3% 87,804 40,281 53,775 $12.62
West Fort Wo 973 14,269,089 1,425,497 1,433,921 10.0% (53,438) 0 7,500 $9.85
West Frisco Re 188 3,422,441 223,702 223,702 6.5% 51,218 9,950 87,123 $18.85
West Plano Re 327 9,396,539 419,602 422,269 4.5% (11,364) 0 0 $19.57
White Settlem 182 2,658,993 51,617 51,617 1.9% 11,329 0 0 $16.10
Totals 26,962 379,321,533 26,941,530 27,624,874 7.3% 793,260 794,722 2,895,205 $13.80 Source: CoStar Property®
Existing Inventory Vacancy

22 THE COSTAR RETAIL REPORT ©2014 COSTAR GROUP, INC.
DALLAS/FT. WORTH – FIRST QUARTER 2014
Dallas/Ft. Worth Retail MarketFIRST QUARTER 2014 – DALLAS/FT. WORTH
Dallas/Ft. Worth Retail Market
©2014 COSTAR GROUP, INC. THE COSTAR RETAIL REPORT 23
FIGURES AT A GLANCE
General Retail Market Statistics First Quarter 2014
Net Quoted
Period # Blds Total GLA Direct SF Total SF Vac % Absorption # Blds Total GLA # Blds Total GLA Rates
2014 1q 19,454 162,228,672 5,857,982 6,212,314 3.8% 546,924 36 393,922 30 2,536,146 $13.93 2013 4q 19,428 161,898,381 6,074,328 6,428,947 4.0% 395,198 20 395,982 55 2,760,708 $13.12 2013 3q 19,424 161,609,853 6,152,677 6,535,617 4.0% 720,008 37 718,232 64 3,049,728 $12.59 2013 2q 19,397 161,167,612 6,304,194 6,813,384 4.2% 927,241 43 427,833 81 3,491,941 $12.40 2013 1q 19,356 160,858,362 6,897,378 7,431,375 4.6% 625,486 44 515,271 90 3,354,363 $12.56
2012 19,319 160,639,345 7,327,026 7,837,844 4.9% 2,153,696 132 1,707,590 96 1,440,455 $11.50 2011 19,214 159,277,001 7,801,506 8,629,196 5.4% 1,208,675 111 1,312,303 62 964,734 $11.80 2010 19,132 158,524,358 8,308,014 9,085,228 5.7% 1,056,592 103 1,408,152 72 1,009,445 $12.73 2009 19,038 157,349,732 8,211,931 8,967,194 5.7% 796,270 171 1,569,558 72 1,257,064 $12.53 2008 18,873 155,931,058 7,686,584 8,344,790 5.4% 3,447,124 278 2,623,313 103 1,037,775 $11.89 2007 18,618 153,584,398 8,700,862 9,445,254 6.1% 840,295 296 3,551,606 188 1,937,920 $11.29 2006 18,332 150,535,401 6,520,249 7,236,552 4.8% 4,334,221 355 4,845,630 209 2,694,796 $11.21 2005 17,991 146,359,019 6,604,543 7,394,391 5.1% 3,364,268 316 4,253,138 258 3,922,912 $12.39 2004 17,693 142,871,704 6,899,831 7,271,344 5.1% 2,246,922 307 4,445,220 226 3,639,691 $10.72 2003 17,399 139,987,828 6,321,756 6,634,390 4.7% 3,713,396 348 4,422,617 212 3,396,010 $11.67 2002 17,066 135,878,591 6,227,684 6,238,549 4.6% 3,267,060 364 4,266,049 252 3,135,382 $14.38
Source: CoStar Property®
Mall Market Statistics First Quarter 2014
Net Quoted
Period # Ctrs Total GLA Direct SF Total SF Vac % Absorption # Blds Total GLA # Blds Total GLA Rates
2014 1q 44 36,104,137 2,179,387 2,183,403 6.0% (17,899) 0 0 1 6,500 $21.66 2013 4q 44 36,104,137 2,161,488 2,165,504 6.0% 18,409 2 20,912 0 0 $21.22 2013 3q 44 36,083,225 2,158,985 2,163,001 6.0% (250,761) 1 6,823 2 20,912 $20.16 2013 2q 44 36,076,402 1,901,401 1,905,417 5.3% (26,784) 2 13,500 2 19,243 $20.35 2013 1q 44 36,062,902 1,861,117 1,865,133 5.2% 66,434 1 8,500 3 20,323 $20.53
2012 44 36,054,402 1,923,067 1,923,067 5.3% 379,914 7 257,775 1 8,500 $20.39 2011 44 35,796,627 2,027,206 2,045,206 5.7% 510,477 10 319,362 3 228,850 $21.29 2010 43 35,477,265 2,197,889 2,236,321 6.3% 645,516 21 780,082 4 211,761 $23.27 2009 42 34,697,183 2,046,283 2,101,755 6.1% 553,597 16 857,565 21 877,610 $24.12 2008 42 33,839,618 1,714,526 1,797,787 5.3% 1,348,052 48 1,826,876 19 1,157,053 $28.60 2007 39 32,012,742 1,293,201 1,318,963 4.1% 2,030,908 56 2,295,911 60 2,302,092 $27.77 2006 34 29,716,831 1,027,123 1,053,960 3.5% 501,634 28 769,729 52 2,507,456 $25.50 2005 33 28,947,102 760,103 785,865 2.7% 1,275,250 17 1,164,414 27 778,584 $27.32 2004 33 27,782,688 896,701 896,701 3.2% 537,788 15 611,199 17 1,122,394 $27.33 2003 32 27,171,489 823,290 823,290 3.0% 156,374 8 205,464 13 569,812 $24.55 2002 32 26,966,025 769,129 774,200 2.9% (119,959) 5 107,077 8 316,927 $27.54
Source: CoStar Property®
Power Center Market Statistics First Quarter 2014
Net Quoted
Period # Ctrs Total GLA Direct SF Total SF Vac % Absorption # Blds Total GLA # Blds Total GLA Rates
2014 1q 66 26,350,936 1,171,906 1,199,004 4.6% (41,425) 0 0 1 31,450 $20.16 2013 4q 66 26,350,936 1,130,481 1,157,579 4.4% 280,271 1 130,085 0 0 $20.26 2013 3q 66 26,220,851 1,281,867 1,307,765 5.0% 317,373 2 223,936 1 130,085 $20.42 2013 2q 65 25,996,915 1,375,304 1,401,202 5.4% 103,766 0 0 3 354,021 $19.65 2013 1q 65 25,996,915 1,479,070 1,504,968 5.8% 279,269 2 173,546 3 354,021 $19.44
2012 65 25,823,369 1,581,293 1,610,691 6.2% 350,535 11 207,761 4 397,482 $19.54 2011 65 25,615,608 1,698,438 1,753,465 6.8% 564,540 10 625,642 10 202,233 $19.34 2010 65 24,989,966 1,656,053 1,692,363 6.8% 650,391 11 335,577 10 507,464 $19.89 2009 65 24,654,389 1,849,772 2,007,177 8.1% 59,340 16 382,100 9 314,584 $20.14 2008 63 24,272,289 1,554,228 1,684,417 6.9% 1,866,321 38 2,104,304 19 399,791 $21.94 2007 61 22,167,985 1,436,330 1,446,434 6.5% 1,472,732 47 1,867,402 44 2,123,123 $21.38 2006 57 20,300,583 1,037,470 1,051,764 5.2% 1,418,119 55 1,584,525 55 2,254,116 $22.57 2005 52 18,716,058 878,816 885,358 4.7% 1,538,171 49 1,651,199 46 1,251,684 $18.86 2004 50 17,064,859 757,007 772,330 4.5% 1,707,222 36 1,721,283 40 1,431,567 $14.54 2003 49 15,343,576 725,199 758,269 4.9% 1,004,005 34 1,320,248 44 1,962,443 $12.74 2002 46 14,023,328 435,845 442,026 3.2% 1,222,694 20 906,651 27 920,079 $0.00
Source: CoStar Property®
UC Inventory
Existing Inventory Vacancy Deliveries UC Inventory
Existing Inventory Vacancy Deliveries UC Inventory
Existing Inventory Vacancy Deliveries
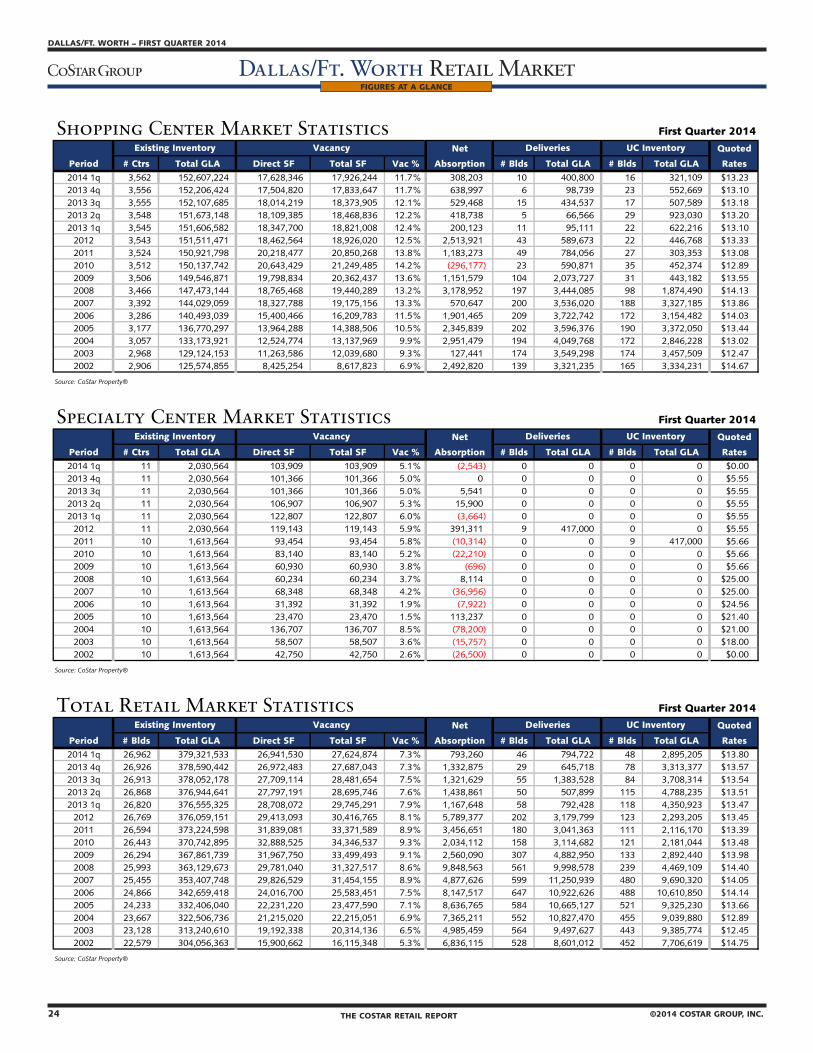
24 THE COSTAR RETAIL REPORT ©2014 COSTAR GROUP, INC.
DALLAS/FT. WORTH – FIRST QUARTER 2014
Dallas/Ft. Worth Retail MarketFIRST QUARTER 2014 – DALLAS/FT. WORTH
Dallas/Ft. Worth Retail Market
©2014 COSTAR GROUP, INC. THE COSTAR RETAIL REPORT 25
FIGURES AT A GLANCE
Shopping Center Market Statistics First Quarter 2014
Net Quoted
Period # Ctrs Total GLA Direct SF Total SF Vac % Absorption # Blds Total GLA # Blds Total GLA Rates
2014 1q 3,562 152,607,224 17,628,346 17,926,244 11.7% 308,203 10 400,800 16 321,109 $13.23 2013 4q 3,556 152,206,424 17,504,820 17,833,647 11.7% 638,997 6 98,739 23 552,669 $13.10 2013 3q 3,555 152,107,685 18,014,219 18,373,905 12.1% 529,468 15 434,537 17 507,589 $13.18 2013 2q 3,548 151,673,148 18,109,385 18,468,836 12.2% 418,738 5 66,566 29 923,030 $13.20 2013 1q 3,545 151,606,582 18,347,700 18,821,008 12.4% 200,123 11 95,111 22 622,216 $13.10
2012 3,543 151,511,471 18,462,564 18,926,020 12.5% 2,513,921 43 589,673 22 446,768 $13.33 2011 3,524 150,921,798 20,218,477 20,850,268 13.8% 1,183,273 49 784,056 27 303,353 $13.08 2010 3,512 150,137,742 20,643,429 21,249,485 14.2% (296,177) 23 590,871 35 452,374 $12.89 2009 3,506 149,546,871 19,798,834 20,362,437 13.6% 1,151,579 104 2,073,727 31 443,182 $13.55 2008 3,466 147,473,144 18,765,468 19,440,289 13.2% 3,178,952 197 3,444,085 98 1,874,490 $14.13 2007 3,392 144,029,059 18,327,788 19,175,156 13.3% 570,647 200 3,536,020 188 3,327,185 $13.86 2006 3,286 140,493,039 15,400,466 16,209,783 11.5% 1,901,465 209 3,722,742 172 3,154,482 $14.03 2005 3,177 136,770,297 13,964,288 14,388,506 10.5% 2,345,839 202 3,596,376 190 3,372,050 $13.44 2004 3,057 133,173,921 12,524,774 13,137,969 9.9% 2,951,479 194 4,049,768 172 2,846,228 $13.02 2003 2,968 129,124,153 11,263,586 12,039,680 9.3% 127,441 174 3,549,298 174 3,457,509 $12.47 2002 2,906 125,574,855 8,425,254 8,617,823 6.9% 2,492,820 139 3,321,235 165 3,334,231 $14.67
Source: CoStar Property®
Specialty Center Market Statistics First Quarter 2014
Net Quoted
Period # Ctrs Total GLA Direct SF Total SF Vac % Absorption # Blds Total GLA # Blds Total GLA Rates
2014 1q 11 2,030,564 103,909 103,909 5.1% (2,543) 0 0 0 0 $0.00 2013 4q 11 2,030,564 101,366 101,366 5.0% 0 0 0 0 0 $5.55 2013 3q 11 2,030,564 101,366 101,366 5.0% 5,541 0 0 0 0 $5.55 2013 2q 11 2,030,564 106,907 106,907 5.3% 15,900 0 0 0 0 $5.55 2013 1q 11 2,030,564 122,807 122,807 6.0% (3,664) 0 0 0 0 $5.55
2012 11 2,030,564 119,143 119,143 5.9% 391,311 9 417,000 0 0 $5.55 2011 10 1,613,564 93,454 93,454 5.8% (10,314) 0 0 9 417,000 $5.66 2010 10 1,613,564 83,140 83,140 5.2% (22,210) 0 0 0 0 $5.66 2009 10 1,613,564 60,930 60,930 3.8% (696) 0 0 0 0 $5.66 2008 10 1,613,564 60,234 60,234 3.7% 8,114 0 0 0 0 $25.00 2007 10 1,613,564 68,348 68,348 4.2% (36,956) 0 0 0 0 $25.00 2006 10 1,613,564 31,392 31,392 1.9% (7,922) 0 0 0 0 $24.56 2005 10 1,613,564 23,470 23,470 1.5% 113,237 0 0 0 0 $21.40 2004 10 1,613,564 136,707 136,707 8.5% (78,200) 0 0 0 0 $21.00 2003 10 1,613,564 58,507 58,507 3.6% (15,757) 0 0 0 0 $18.00 2002 10 1,613,564 42,750 42,750 2.6% (26,500) 0 0 0 0 $0.00
Source: CoStar Property®
Total Retail Market Statistics First Quarter 2014
Net Quoted
Period # Blds Total GLA Direct SF Total SF Vac % Absorption # Blds Total GLA # Blds Total GLA Rates
2014 1q 26,962 379,321,533 26,941,530 27,624,874 7.3% 793,260 46 794,722 48 2,895,205 $13.80 2013 4q 26,926 378,590,442 26,972,483 27,687,043 7.3% 1,332,875 29 645,718 78 3,313,377 $13.57 2013 3q 26,913 378,052,178 27,709,114 28,481,654 7.5% 1,321,629 55 1,383,528 84 3,708,314 $13.54 2013 2q 26,868 376,944,641 27,797,191 28,695,746 7.6% 1,438,861 50 507,899 115 4,788,235 $13.51 2013 1q 26,820 376,555,325 28,708,072 29,745,291 7.9% 1,167,648 58 792,428 118 4,350,923 $13.47
2012 26,769 376,059,151 29,413,093 30,416,765 8.1% 5,789,377 202 3,179,799 123 2,293,205 $13.45 2011 26,594 373,224,598 31,839,081 33,371,589 8.9% 3,456,651 180 3,041,363 111 2,116,170 $13.39 2010 26,443 370,742,895 32,888,525 34,346,537 9.3% 2,034,112 158 3,114,682 121 2,181,044 $13.48 2009 26,294 367,861,739 31,967,750 33,499,493 9.1% 2,560,090 307 4,882,950 133 2,892,440 $13.98 2008 25,993 363,129,673 29,781,040 31,327,517 8.6% 9,848,563 561 9,998,578 239 4,469,109 $14.40 2007 25,455 353,407,748 29,826,529 31,454,155 8.9% 4,877,626 599 11,250,939 480 9,690,320 $14.05 2006 24,866 342,659,418 24,016,700 25,583,451 7.5% 8,147,517 647 10,922,626 488 10,610,850 $14.14 2005 24,233 332,406,040 22,231,220 23,477,590 7.1% 8,636,765 584 10,665,127 521 9,325,230 $13.66 2004 23,667 322,506,736 21,215,020 22,215,051 6.9% 7,365,211 552 10,827,470 455 9,039,880 $12.89 2003 23,128 313,240,610 19,192,338 20,314,136 6.5% 4,985,459 564 9,497,627 443 9,385,774 $12.45 2002 22,579 304,056,363 15,900,662 16,115,348 5.3% 6,836,115 528 8,601,012 452 7,706,619 $14.75
Source: CoStar Property®
UC Inventory
Existing Inventory Vacancy Deliveries UC Inventory
Existing Inventory Vacancy Deliveries UC Inventory
Existing Inventory Vacancy Deliveries

24 THE COSTAR RETAIL REPORT ©2014 COSTAR GROUP, INC.
DALLAS/FT. WORTH – FIRST QUARTER 2014
Dallas/Ft. Worth Retail MarketFIRST QUARTER 2014 – DALLAS/FT. WORTH
Dallas/Ft. Worth Retail Market
©2014 COSTAR GROUP, INC. THE COSTAR RETAIL REPORT 25
Historical Rental RatesBased on NNN Rental Rates
Source: CoStar Property®
Vacancy by Available Space Type Vacancy by Building TypePercent of All Vacant Space in Direct vs. Sublet Percent of All Vacant Space by Building Type
Source: CoStar Property® Source: CoStar Property®
GLA By Building Type Future Space AvailableRatio of Total GLA by Building Type Space Scheduled to be Available for Occupancy*
Source: CoStar Property® * Includes Under Construction Spaces Source: CoStar Property®
$0.00
$5.00
$10.00
$15.00
$20.00
$25.00
$30.00
$35.00
2000
1q
2000
3q
2001
1q
2001
3q
2002
1q
2002
3q
2003
1q
2003
3q
2004
1q
2004
3q
2005
1q
2005
3q
2006
1q
2006
3q
2007
1q
2007
3q
2008
1q
2008
3q
2009
1q
2009
3q
2010
1q
2010
3q
2011
1q
2011
3q
2012
1q
2012
3q
2013
1q
2013
3q
2014
1q
Dollar
s/SF/Y
ear
Power Center Specialty Center General Retail Shopping Center Mall Total Market
0 20 40 60 80 100 120 140 160 180
Specialty Center
Power Center
Mall
Shopping Center
General Retail
Millions of Square Feet
2%
98%
Direct Sublet 0% 10% 20% 30% 40% 50% 60% 70%
Specialty Center
Power Center
Mall
General Retail
Shopping Center
0.46
0.120.10
0.010.00 0.00
0.0
0.1
0.1
0.2
0.2
0.3
0.3
0.4
0.4
0.5
0.5
2014 2q 2014 3q 2014 4q 2015 1q 2015 2q 2015 3q
Mill
ions
LEASING ACTIVITY

26 THE COSTAR RETAIL REPORT ©2014 COSTAR GROUP, INC.
DALLAS/FT. WORTH – FIRST QUARTER 2014
Dallas/Ft. Worth Retail MarketFIRST QUARTER 2014 – DALLAS/FT. WORTH
Dallas/Ft. Worth Retail Market
©2014 COSTAR GROUP, INC. THE COSTAR RETAIL REPORT 27
LEASING ACTIVITY
Source: CoStar Property®
* Renewal
Building Submarket SF Qtr Tenant Name Tenant Rep Company Landlord Rep Company
1 3737 Airport Fwy Hurst/Euless/Bedford Ret 62,232 1st Mac Churchill Used Cars N/A The Weitzman Group
2 Dalrock Crossing Sachse/Rowlett Ret 60,000 1st Walmart N/A Center Point Commercial Properties
3 1326 W Main St* Lewisville Ret 40,090 1st Big Lots N/A L3 Investment Properties
4 Precinct Village Watauga/Keller/NRH Ret 17,786 1st Texas Family Fitness N/A NAI Robert Lynn
5 Vista Ridge Village Lewisville Ret 15,707 1st N/A N/A JLL
6 11311 Reeder Rd - Building 2 Northwest Dallas Ret 13,140 1st N/A N/A Morgan Realty Group
7 Champp’s Americana Addison Ret 11,258 1st N/A N/A Beltway Commercial Real Estate
8 3845 N Garland Ave Garland Ret 11,200 1st N/A N/A United Homeland Realty
9 14760 Preston Rd Far North Dallas Ret 11,136 1st N/A N/A Crestview Companies
10 Village On The Parkway - Building 800 Far North Dallas Ret 11,039 1st Gloria’s N/A N/A
11 5405 E Lancaster Ave East Fort Worth Ret 11,000 1st N/A N/A Green Earth Realty
12 6605 Forest Hill Dr - Dollar Tree SE Outlying Tarrant Ret 11,000 1st N/A N/A Remexnet
13 Headquarters Village - Bldg II West Plano Ret 10,877 1st N/A N/A Whitestone REIT
14 Irving Square Irving Ret 10,009 1st N/A N/A Center Point Commercial Properties
15 Little Sunshine’s Playhouse & Preschool Southlake Ret 10,000 1st Little Sunshine Playhouse & Preschool N/A N/A
16 Town West Shopping Center East Dallas Outlying Ret 9,000 1st N/A N/A Marquette Realty Investments
17 Northcrest Village North Carrollton Ret 8,647 1st Lal Quila N/A Zerby Interests
18 1940 W FM 407 Lewisville Ret 8,640 1st Bluegrass Bicycles N/A Henry S. Miller Brokerage, LLC
19 Golden Corral Southwest Outlying Ret 7,551 1st Golden Corral N/A N/A
20 3010 N Henderson Ave Lakewood Ret 7,408 1st N/A N/A Open Realty Advisors
21 2301 N Collins St North Arlington Ret 7,124 1st N/A N/A NAI Robert Lynn
22 300 - 383 W Jefferson Blvd SW Dallas County Ret 7,095 1st N/A N/A Jim Lake Companies
23 MacArthur Village Coppell Ret 7,016 1st Hilltop Indian Rest N/A Crest Commercial Real Estate Inc.
24 South Frisco Village N Central Dallas Out Ret 6,400 1st Carpet One N/A CBRE
25 Windhaven Park - Bldg C West Plano Ret 6,400 1st Serge Center N/A Search Commercial Healthcare & Offi
26 2620 Gus Thomasson Rd Town East Ret 6,000 1st Osteocare Management Inc N/A Henry S. Miller Brokerage, LLC
27 Medallion Center - Bldgs 1, 2 & 3 Upper Greenville Ret 5,774 1st America’s Best Contacts & Eyeglasses N/A Venture Commercial Real Estate
28 Northgate Plaza Shopping Center SW Dallas County Ret 5,700 1st JC Fitness & Essential Elements Direct Deal 4 Way Investments, Inc
29 Pantego Auto Mall - Main Bldg South Arlington Ret 5,624 1st Mitchell Automotive N/A Coldwell Banker Commercial Alliance
30 5000 Block Of Teasley Ln Lewisville Ret 5,081 1st Anytime Fitness N/A VERUS Real Estate Advisors
31 3578 W Airport Fwy Irving Ret 5,000 1st Lumber Liquidators N/A N/A
32 3578 W Airport Fwy Irving Ret 5,000 1st Cabinets to Go N/A N/A
33 1926 Market Center Blvd Lovefield/West Dallas Ret 4,994 1st Shannon Winn N/A ABG Holdings
34 755 E State Highway 121 Lewisville Ret 4,810 1st Fossil Creek Liquor N/A Street Commercial
35 Plaza Del Oro SW Dallas County Ret 4,800 1st Rent A Center N/A MQ Development Partners
36 405 N Fielder Rd North Arlington Ret 4,464 1st Don Mario’s Mexican Restaurant N/A The Weitzman Group
37 Plaza del Oro SW Dallas County Ret 4,380 1st Rent-A-Center N/A CJ Dunn Commercial
38 2404 Cedar Springs Rd Uptown Ret 4,200 1st Nightclub N/A Shop Companies
39 3321 Wheatland Rd SW Dallas County Ret 4,072 1st Western Dental N/A CBRE
40 6305 Precinct Line Rd Hurst/Euless/Bedford Ret 3,988 1st Frost Bank The Westover Group, LP Ellis & Tinsley, Inc.
Select Top Retail Leases Based on Leased Square Footage For Deals Signed in 2014

26 THE COSTAR RETAIL REPORT ©2014 COSTAR GROUP, INC.
DALLAS/FT. WORTH – FIRST QUARTER 2014
Dallas/Ft. Worth Retail MarketFIRST QUARTER 2014 – DALLAS/FT. WORTH
Dallas/Ft. Worth Retail Market
©2014 COSTAR GROUP, INC. THE COSTAR RETAIL REPORT 27
SALES ACTIVITY
The Optimist Sales Index Average of Two Highest Price/SF's and Two Lowest Cap Rates
Source: CoStar COMPS®
Sales Volume & Price Sales Analysis by Building SizeBased on Retail Building Sales of 15,000 SF and Larger Based on Retail Building Sales From Jan. 2013 - Dec. 2013
Bldg Size # RBA $ Volume Price/SF Cap Rate
< 25,000 SF 108 902,033 257,328,729$ 285.28$ 7.11%
25K-99K SF 27 1,391,586 183,099,373$ 131.58$ 8.22%
100K-249K SF 9 1,488,540 281,445,000$ 189.07$ 7.47%
>250K SF 1 1,234,297 60,900,000$ 49.34$ -
Source: CoStar COMPS® Source: CoStar COMPS®
U.S. Price/SF Comparison U.S. Cap Rate ComparisonBased on Retail Building Sales of 15,000 SF and Larger Based on Retail Building Sales of 15,000 SF and Larger
Source: CoStar COMPS® Source: CoStar COMPS®
$30
$80
$130
$180
$230
$280
$330
20101q
20103q
20111q
20113q
20121q
20123q
20131q
20133q
Dollar
s per
SF
Dallas/Ft Worth US
$0
$50
$100
$150
$200
$250
$300
$350
$400
2010 1q 2010 3q 2011 1q 2011 3q 2012 1q 2012 3q 2013 1q 2013 3q
Millio
ns
of
Sal
es V
olu
me
Do
llar
s
$0
$50
$100
$150
$200
$250
$300
Price
/SF
Sales Volume Price/SF
0.0%
1.0%
2.0%
3.0%
4.0%
5.0%
6.0%
7.0%
8.0%
9.0%
10.0%
2011 1q 2011 2q 2011 3q 2011 4q 2012 1q 2012 2q 2012 3q 2012 4q 2013 1q 2013 2q 2013 3q 2013 4q
Cap
Rat
e P
erc
enta
ge
$0
$50
$100
$150
$200
$250
$300
$350
Dollars/S
F
Cap Rate Price/SF
3.0%
4.0%
5.0%
6.0%
7.0%
8.0%
9.0%
10.0%
11.0%
20101q
20103q
20111q
20113q
20121q
20123q
20131q
20133q
Cap
Rat
e P
erc
enta
ge
Dallas/Ft Worth US
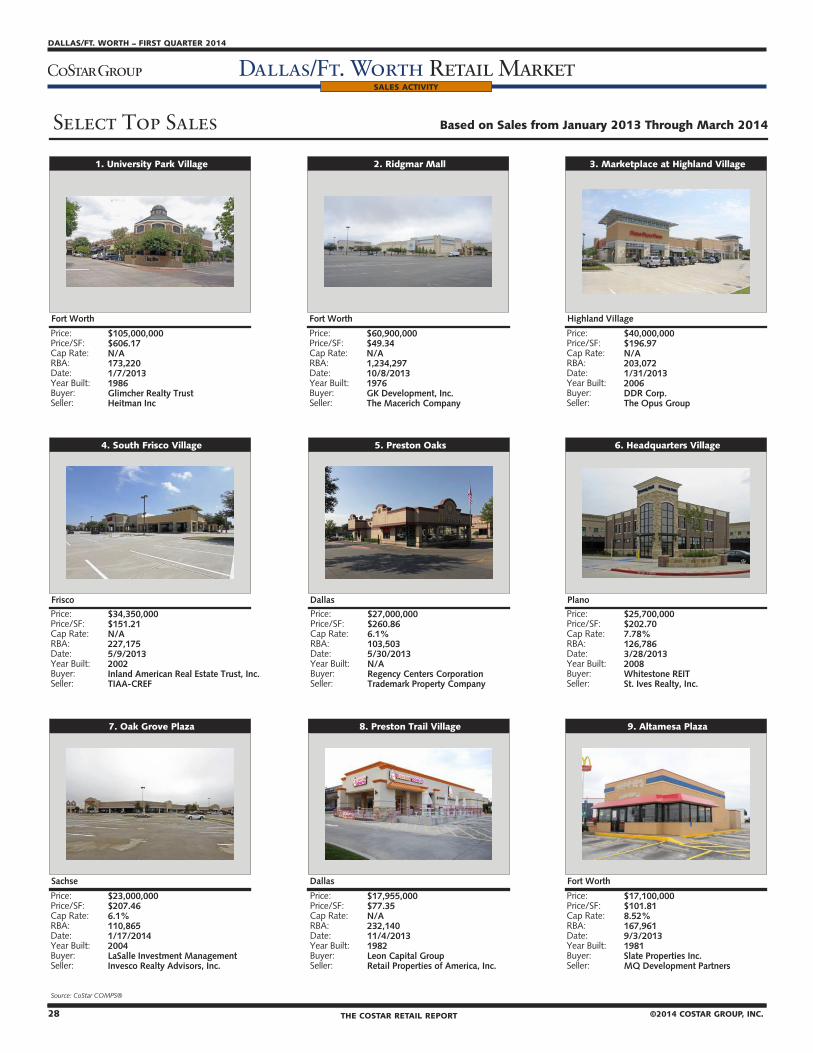
28 THE COSTAR RETAIL REPORT ©2014 COSTAR GROUP, INC.
DALLAS/FT. WORTH – FIRST QUARTER 2014
Dallas/Ft. Worth Retail Market
©2014 COSTAR GROUP, INC. THE COSTAR RETAIL REPORT 29
FIRST QUARTER 2014 – DALLAS/FT. WORTH
Dallas/Ft. Worth Retail MarketMARKET HIGHLIGHTS – CLASS “A, B & C”
SALES ACTIVITY
���������������� ���������������������������������������������������
���������������������
���������������������������������������������������������
�������������������������������������������������������������������������
���������������������������
����������
���������������������������������������������������������
����������������������������������������������������������������������������������
����������������
����������
���������������������������������������������������������
����������������������������������������������������������������
�����������������������������������
����������������
���������������������������������������������������������
����������������������������������������������������������������������������������������
������������������������
������
���������������������������������������������������������
����������������������������������������������������������������������������������������������
����������������
������
���������������������������������������������������������
�������������������������������������������������������������������������������
������������������������
�����
���������������������������������������������������������
����������������������������������������������������������������������������������������������������
�������������������
������
���������������������������������������������������������
��������������������������������������������������������������������������������������������
�������������������������
������
���������������������������������������������������������
��������������������������������������������������������������������������������������
������������������
����������

28 THE COSTAR RETAIL REPORT ©2014 COSTAR GROUP, INC.
DALLAS/FT. WORTH – FIRST QUARTER 2014
Dallas/Ft. Worth Retail Market
©2014 COSTAR GROUP, INC. THE COSTAR RETAIL REPORT 29
FIRST QUARTER 2014 – DALLAS/FT. WORTH
Dallas/Ft. Worth Retail MarketMARKET HIGHLIGHTS – CLASS “A, B & C”
C E N T R A L D A L L A S M A R K E T
Deliveries, Absorption & Vacancy Historical Analysis, All Classes
Source: CoStar Property®
Vacant Space Quoted Rental RatesHistorical Analysis, All Classes Historical Analysis, All Classes
Source: CoStar Property® Source: CoStar Property®
Net QuotedPeriod # Bldgs Total RBA Vacant SF Vacancy % Absorption # Bldgs Total RBA # Bldgs Total RBA Rates2014 1q 1,988 16,053,296 796,625 5.0% (23,692) 2 7,951 1 2,700 $17.31
2013 4q 1,988 16,048,186 767,823 4.8% 5,616 2 14,059 2 7,951 $17.19
2013 3q 1,988 16,041,802 767,055 4.8% 29,080 0 0 4 22,010 $17.17
2013 2q 1,990 16,075,610 829,943 5.2% 13,429 1 11,583 2 14,059 $16.62
2013 1q 1,990 16,067,610 835,372 5.2% 64,360 2 27,960 2 21,742 $16.52
2012 4q 1,989 16,042,543 874,665 5.5% 218,485 5 157,764 3 39,543 $16.22
2012 3q 1,984 15,884,779 935,386 5.9% 35,369 0 0 8 197,307 $16.95
2012 2q 1,990 15,915,596 1,001,572 6.3% (2,598) 2 4,378 6 169,347 $16.63
2012 1q 1,988 15,911,218 994,596 6.3% 40,874 1 57,584 5 126,567 $16.64
2011 4q 1,987 15,853,634 977,886 6.2% 28,674 0 0 4 64,575 $15.88
2011 3q 1,987 15,853,634 1,006,560 6.3% 67,345 0 0 1 57,584 $16.88
2011 2q 1,987 15,853,634 1,073,905 6.8% 16,675 0 0 1 57,584 $16.88
2011 1q 1,987 15,853,634 1,090,580 6.9% (13,153) 2 7,500 0 0 $17.04
2010 4q 1,985 15,846,134 1,069,927 6.8% 87,459 0 0 2 7,500 $16.77
2010 3q 1,985 15,846,134 1,157,386 7.3% 9,723 0 0 2 7,500 $16.75
2010 2q 1,985 15,846,134 1,167,109 7.4% 39,008 1 59,279 1 5,000 $15.49
Source: CoStar Property®
UC InventoryDelivered InventoryExisting Inventory Vacancy
(0.050)
0.000
0.050
0.100
0.150
0.200
0.250
2011 1q 2011 2q 2011 3q 2011 4q 2012 1q 2012 2q 2012 3q 2012 4q 2013 1q 2013 2q 2013 3q 2013 4q 2014 1q
Millio
ns
SF
0.0%
1.0%
2.0%
3.0%
4.0%
5.0%
6.0%
7.0%
8.0%
Perce
nt V
acant
Delivered SF Absorption SF Vacancy
$16.00
$16.20
$16.40
$16.60
$16.80
$17.00
$17.20
$17.40
2013 1q 2013 2q 2013 3q 2013 4q 2014 1q
Dollar
s/SF/Y
ear
0.72
0.74
0.76
0.78
0.80
0.82
0.84
0.86
2013 1q 2013 2q 2013 3q 2013 4q 2014 1q
Millio
ns
SF
Direct SF Sublet SF
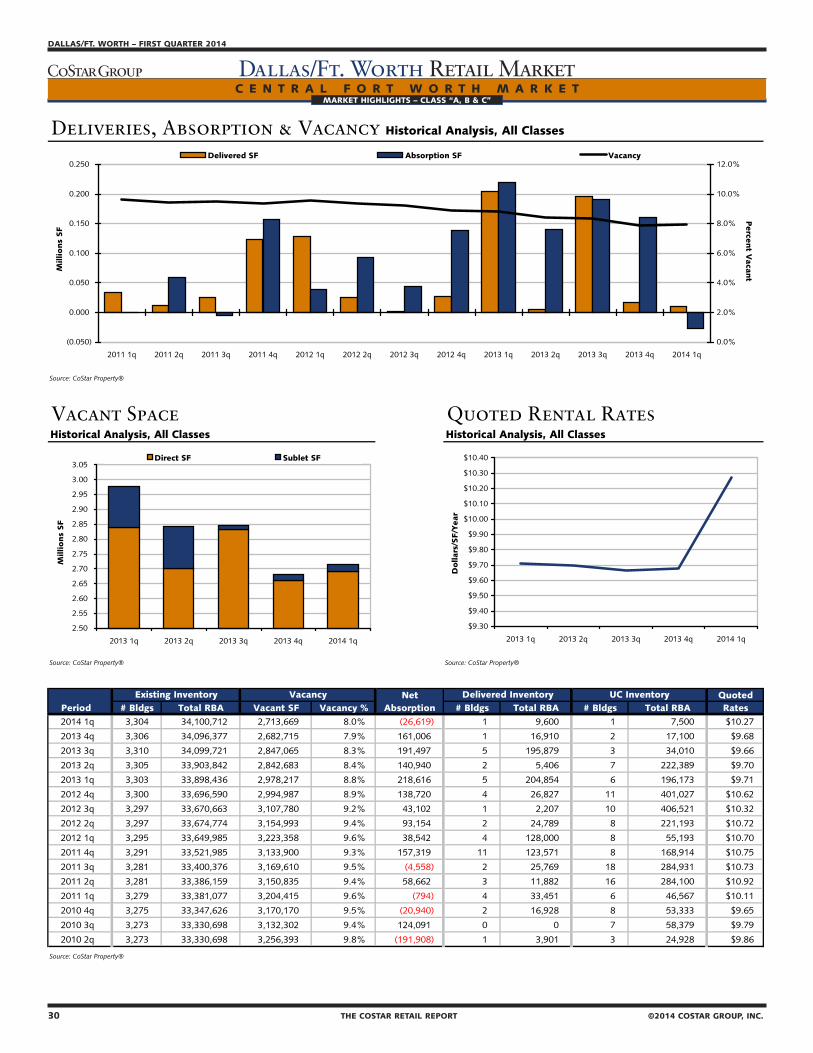
30 THE COSTAR RETAIL REPORT ©2014 COSTAR GROUP, INC.
DALLAS/FT. WORTH – FIRST QUARTER 2014
Dallas/Ft. Worth Retail MarketMARKET HIGHLIGHTS – CLASS “A, B & C”
©2014 COSTAR GROUP, INC. THE COSTAR RETAIL REPORT 31
FIRST QUARTER 2014 – DALLAS/FT. WORTH
Dallas/Ft. Worth Retail MarketMARKET HIGHLIGHTS – CLASS “A, B & C”
C E N T R A L F O R T W O R T H M A R K E T
Deliveries, Absorption & Vacancy Historical Analysis, All Classes
Source: CoStar Property®
Vacant Space Quoted Rental RatesHistorical Analysis, All Classes Historical Analysis, All Classes
Source: CoStar Property® Source: CoStar Property®
Net QuotedPeriod # Bldgs Total RBA Vacant SF Vacancy % Absorption # Bldgs Total RBA # Bldgs Total RBA Rates2014 1q 3,304 34,100,712 2,713,669 8.0% (26,619) 1 9,600 1 7,500 $10.27
2013 4q 3,306 34,096,377 2,682,715 7.9% 161,006 1 16,910 2 17,100 $9.68
2013 3q 3,310 34,099,721 2,847,065 8.3% 191,497 5 195,879 3 34,010 $9.66
2013 2q 3,305 33,903,842 2,842,683 8.4% 140,940 2 5,406 7 222,389 $9.70
2013 1q 3,303 33,898,436 2,978,217 8.8% 218,616 5 204,854 6 196,173 $9.71
2012 4q 3,300 33,696,590 2,994,987 8.9% 138,720 4 26,827 11 401,027 $10.62
2012 3q 3,297 33,670,663 3,107,780 9.2% 43,102 1 2,207 10 406,521 $10.32
2012 2q 3,297 33,674,774 3,154,993 9.4% 93,154 2 24,789 8 221,193 $10.72
2012 1q 3,295 33,649,985 3,223,358 9.6% 38,542 4 128,000 8 55,193 $10.70
2011 4q 3,291 33,521,985 3,133,900 9.3% 157,319 11 123,571 8 168,914 $10.75
2011 3q 3,281 33,400,376 3,169,610 9.5% (4,558) 2 25,769 18 284,931 $10.73
2011 2q 3,281 33,386,159 3,150,835 9.4% 58,662 3 11,882 16 284,100 $10.92
2011 1q 3,279 33,381,077 3,204,415 9.6% (794) 4 33,451 6 46,567 $10.11
2010 4q 3,275 33,347,626 3,170,170 9.5% (20,940) 2 16,928 8 53,333 $9.65
2010 3q 3,273 33,330,698 3,132,302 9.4% 124,091 0 0 7 58,379 $9.79
2010 2q 3,273 33,330,698 3,256,393 9.8% (191,908) 1 3,901 3 24,928 $9.86
Source: CoStar Property®
UC InventoryDelivered InventoryExisting Inventory Vacancy
(0.050)
0.000
0.050
0.100
0.150
0.200
0.250
2011 1q 2011 2q 2011 3q 2011 4q 2012 1q 2012 2q 2012 3q 2012 4q 2013 1q 2013 2q 2013 3q 2013 4q 2014 1q
Millio
ns
SF
0.0%
2.0%
4.0%
6.0%
8.0%
10.0%
12.0%
Perce
nt V
acant
Delivered SF Absorption SF Vacancy
$9.30
$9.40
$9.50
$9.60
$9.70
$9.80
$9.90
$10.00
$10.10
$10.20
$10.30
$10.40
2013 1q 2013 2q 2013 3q 2013 4q 2014 1q
Dollar
s/SF/Y
ear
2.50
2.55
2.60
2.65
2.70
2.75
2.80
2.85
2.90
2.95
3.00
3.05
2013 1q 2013 2q 2013 3q 2013 4q 2014 1q
Millio
ns
SF
Direct SF Sublet SF

30 THE COSTAR RETAIL REPORT ©2014 COSTAR GROUP, INC.
DALLAS/FT. WORTH – FIRST QUARTER 2014
Dallas/Ft. Worth Retail MarketMARKET HIGHLIGHTS – CLASS “A, B & C”
©2014 COSTAR GROUP, INC. THE COSTAR RETAIL REPORT 31
FIRST QUARTER 2014 – DALLAS/FT. WORTH
Dallas/Ft. Worth Retail MarketMARKET HIGHLIGHTS – CLASS “A, B & C”
E A S T D A L L A S O U T L Y I N G M A R K E T
Deliveries, Absorption & Vacancy Historical Analysis, All Classes
Source: CoStar Property®
Vacant Space Quoted Rental RatesHistorical Analysis, All Classes Historical Analysis, All Classes
Source: CoStar Property® Source: CoStar Property®
Net QuotedPeriod # Bldgs Total RBA Vacant SF Vacancy % Absorption # Bldgs Total RBA # Bldgs Total RBA Rates2014 1q 533 6,714,776 441,705 6.6% 19,835 3 209,543 1 3,664 $17.74
2013 4q 530 6,505,233 251,997 3.9% 64,511 3 24,206 4 213,207 $18.04
2013 3q 530 6,493,835 305,110 4.7% (10,065) 0 0 5 231,649 $17.94
2013 2q 530 6,493,835 295,045 4.5% (13,308) 1 3,010 3 223,080 $17.91
2013 1q 529 6,490,825 278,727 4.3% 45,477 4 23,010 2 21,547 $18.18
2012 4q 525 6,467,815 301,194 4.7% (13,549) 1 7,757 5 26,020 $18.18
2012 3q 525 6,466,008 285,838 4.4% (4,337) 0 0 6 33,777 $17.95
2012 2q 525 6,466,008 281,501 4.4% 40,415 2 11,688 3 13,777 $18.79
2012 1q 523 6,454,320 310,228 4.8% 50,100 0 0 2 11,688 $18.57
2011 4q 523 6,454,320 360,328 5.6% (20,534) 2 14,595 2 11,688 $19.56
2011 3q 521 6,439,725 325,199 5.0% 96,951 4 127,055 2 14,595 $17.74
2011 2q 517 6,312,670 295,095 4.7% 16,800 0 0 5 132,650 $17.22
2011 1q 517 6,312,670 311,895 4.9% (2,648) 5 23,223 4 127,055 $16.48
2010 4q 512 6,289,447 286,024 4.5% 9,150 1 5,974 8 124,278 $16.41
2010 3q 511 6,283,473 289,200 4.6% 26,975 0 0 6 29,197 $17.00
2010 2q 511 6,283,473 316,175 5.0% 64,647 2 80,093 1 5,974 $17.22
Source: CoStar Property®
UC InventoryDelivered InventoryExisting Inventory Vacancy
(0.050)
0.000
0.050
0.100
0.150
0.200
0.250
2011 1q 2011 2q 2011 3q 2011 4q 2012 1q 2012 2q 2012 3q 2012 4q 2013 1q 2013 2q 2013 3q 2013 4q 2014 1q
Millio
ns
SF
0.0%
1.0%
2.0%
3.0%
4.0%
5.0%
6.0%
7.0%
Perce
nt V
acant
Delivered SF Absorption SF Vacancy
$17.50
$17.60
$17.70
$17.80
$17.90
$18.00
$18.10
$18.20
$18.30
2013 1q 2013 2q 2013 3q 2013 4q 2014 1q
Dollar
s/SF/Y
ear
0.00
0.05
0.10
0.15
0.20
0.25
0.30
0.35
0.40
0.45
0.50
2013 1q 2013 2q 2013 3q 2013 4q 2014 1q
Millio
ns
SF
Direct SF Sublet SF

32 THE COSTAR RETAIL REPORT ©2014 COSTAR GROUP, INC.
DALLAS/FT. WORTH – FIRST QUARTER 2014
Dallas/Ft. Worth Retail MarketMARKET HIGHLIGHTS – CLASS “A, B & C”
©2014 COSTAR GROUP, INC. THE COSTAR RETAIL REPORT 33
FIRST QUARTER 2014 – DALLAS/FT. WORTH
Dallas/Ft. Worth Retail MarketMARKET HIGHLIGHTS – CLASS “A, B & C”
F A R N O R T H D A L L A S M A R K E TMARKET HIGHLIGHTS – CLASS “A, B & C”
Deliveries, Absorption & Vacancy Historical Analysis, All Classes
Source: CoStar Property®
Vacant Space Quoted Rental RatesHistorical Analysis, All Classes Historical Analysis, All Classes
Source: CoStar Property® Source: CoStar Property®
Net QuotedPeriod # Bldgs Total RBA Vacant SF Vacancy % Absorption # Bldgs Total RBA # Bldgs Total RBA Rates2014 1q 3,715 66,089,395 6,196,275 9.4% 157,011 4 149,501 7 204,942 $14.90
2013 4q 3,711 65,939,894 6,203,785 9.4% 210,807 4 90,142 10 342,379 $14.89
2013 3q 3,709 65,865,208 6,339,906 9.6% 339,930 11 329,775 9 349,643 $14.78
2013 2q 3,700 65,695,868 6,510,496 9.9% 251,027 11 211,060 19 569,418 $14.66
2013 1q 3,689 65,484,808 6,550,463 10.0% 77,946 6 52,342 25 575,875 $14.35
2012 4q 3,684 65,472,466 6,616,067 10.1% 260,412 11 89,443 20 487,860 $14.46
2012 3q 3,673 65,383,023 6,787,036 10.4% 404,471 6 59,274 19 359,501 $14.63
2012 2q 3,668 65,354,741 7,163,225 11.0% 314,047 8 68,468 19 205,091 $14.53
2012 1q 3,662 65,296,362 7,418,893 11.4% 288,052 9 259,429 19 206,143 $14.45
2011 4q 3,654 65,111,933 7,522,516 11.6% 189,940 3 10,517 17 338,033 $14.22
2011 3q 3,651 65,101,416 7,701,939 11.8% 75,844 3 17,595 17 321,886 $14.46
2011 2q 3,648 65,083,821 7,760,188 11.9% 233,766 4 131,860 15 309,356 $14.41
2011 1q 3,644 64,951,961 7,862,094 12.1% (25,237) 11 53,080 14 205,011 $14.41
2010 4q 3,634 64,902,041 7,786,937 12.0% 66,016 2 8,838 23 242,881 $14.41
2010 3q 3,632 64,893,203 7,844,115 12.1% (235,920) 4 23,474 22 228,486 $14.47
2010 2q 3,628 64,869,729 7,584,721 11.7% 465,885 14 514,475 16 198,716 $14.60
Source: CoStar Property®
UC InventoryDelivered InventoryExisting Inventory Vacancy
(0.050)
0.000
0.050
0.100
0.150
0.200
0.250
0.300
0.350
0.400
0.450
2011 1q 2011 2q 2011 3q 2011 4q 2012 1q 2012 2q 2012 3q 2012 4q 2013 1q 2013 2q 2013 3q 2013 4q 2014 1q
Millio
ns
SF
0.0%
2.0%
4.0%
6.0%
8.0%
10.0%
12.0%
14.0%
Perce
nt V
acant
Delivered SF Absorption SF Vacancy
$14.00
$14.10
$14.20
$14.30
$14.40
$14.50
$14.60
$14.70
$14.80
$14.90
$15.00
2013 1q 2013 2q 2013 3q 2013 4q 2014 1q
Dollar
s/SF/Y
ear
5.80
5.90
6.00
6.10
6.20
6.30
6.40
6.50
6.60
2013 1q 2013 2q 2013 3q 2013 4q 2014 1q
Millio
ns
SF
Direct SF Sublet SF

32 THE COSTAR RETAIL REPORT ©2014 COSTAR GROUP, INC.
DALLAS/FT. WORTH – FIRST QUARTER 2014
Dallas/Ft. Worth Retail MarketMARKET HIGHLIGHTS – CLASS “A, B & C”
©2014 COSTAR GROUP, INC. THE COSTAR RETAIL REPORT 33
FIRST QUARTER 2014 – DALLAS/FT. WORTH
Dallas/Ft. Worth Retail MarketMARKET HIGHLIGHTS – CLASS “A, B & C”
M I D - C I T I E S M A R K E TMARKET HIGHLIGHTS – CLASS “A, B & C”
Deliveries, Absorption & Vacancy Historical Analysis, All Classes
Source: CoStar Property®
Vacant Space Quoted Rental RatesHistorical Analysis, All Classes Historical Analysis, All Classes
Source: CoStar Property® Source: CoStar Property®
Net QuotedPeriod # Bldgs Total RBA Vacant SF Vacancy % Absorption # Bldgs Total RBA # Bldgs Total RBA Rates2014 1q 3,989 63,735,020 4,231,224 6.6% 117,929 10 93,198 9 95,615 $14.38
2013 4q 3,980 63,650,008 4,264,141 6.7% 331,089 5 160,397 16 145,007 $14.37
2013 3q 3,976 63,491,513 4,436,735 7.0% 309,309 14 137,841 15 254,436 $14.37
2013 2q 3,963 63,356,059 4,610,590 7.3% 259,787 16 113,062 24 325,216 $14.29
2013 1q 3,947 63,242,997 4,757,315 7.5% 408,504 13 240,383 33 386,422 $14.18
2012 4q 3,934 63,002,614 4,925,436 7.8% 360,953 13 120,638 30 407,317 $14.06
2012 3q 3,923 62,904,300 5,188,075 8.2% 201,526 7 31,720 34 469,886 $13.84
2012 2q 3,916 62,872,580 5,357,881 8.5% 18,707 6 42,491 29 234,704 $13.90
2012 1q 3,911 62,838,479 5,342,487 8.5% 276,432 7 60,858 21 168,022 $13.83
2011 4q 3,906 62,783,360 5,563,800 8.9% 83,293 10 62,477 19 130,655 $13.63
2011 3q 3,898 62,722,883 5,586,616 8.9% 163,418 8 112,533 26 171,654 $13.67
2011 2q 3,896 62,714,683 5,741,834 9.2% 147,075 7 111,811 28 253,089 $13.69
2011 1q 3,891 62,611,063 5,785,289 9.2% (169,881) 7 35,687 18 258,256 $13.84
2010 4q 3,886 62,704,882 5,709,227 9.1% (64,463) 3 24,598 18 244,153 $13.79
2010 3q 3,883 62,680,284 5,620,166 9.0% 241,958 3 148,978 15 109,748 $14.17
2010 2q 3,880 62,531,306 5,713,146 9.1% 99,845 2 15,281 12 230,339 $14.20
Source: CoStar Property®
UC InventoryDelivered InventoryExisting Inventory Vacancy
(0.200)
(0.100)
0.000
0.100
0.200
0.300
0.400
0.500
2011 1q 2011 2q 2011 3q 2011 4q 2012 1q 2012 2q 2012 3q 2012 4q 2013 1q 2013 2q 2013 3q 2013 4q 2014 1q
Millio
ns
SF
0.0%
1.0%
2.0%
3.0%
4.0%
5.0%
6.0%
7.0%
8.0%
9.0%
10.0%
Perce
nt V
acant
Delivered SF Absorption SF Vacancy
$14.05
$14.10
$14.15
$14.20
$14.25
$14.30
$14.35
$14.40
$14.45
2013 1q 2013 2q 2013 3q 2013 4q 2014 1q
Dollar
s/SF/Y
ear
3.80
3.90
4.00
4.10
4.20
4.30
4.40
4.50
4.60
4.70
4.80
4.90
2013 1q 2013 2q 2013 3q 2013 4q 2014 1q
Millio
ns
SF
Direct SF Sublet SF
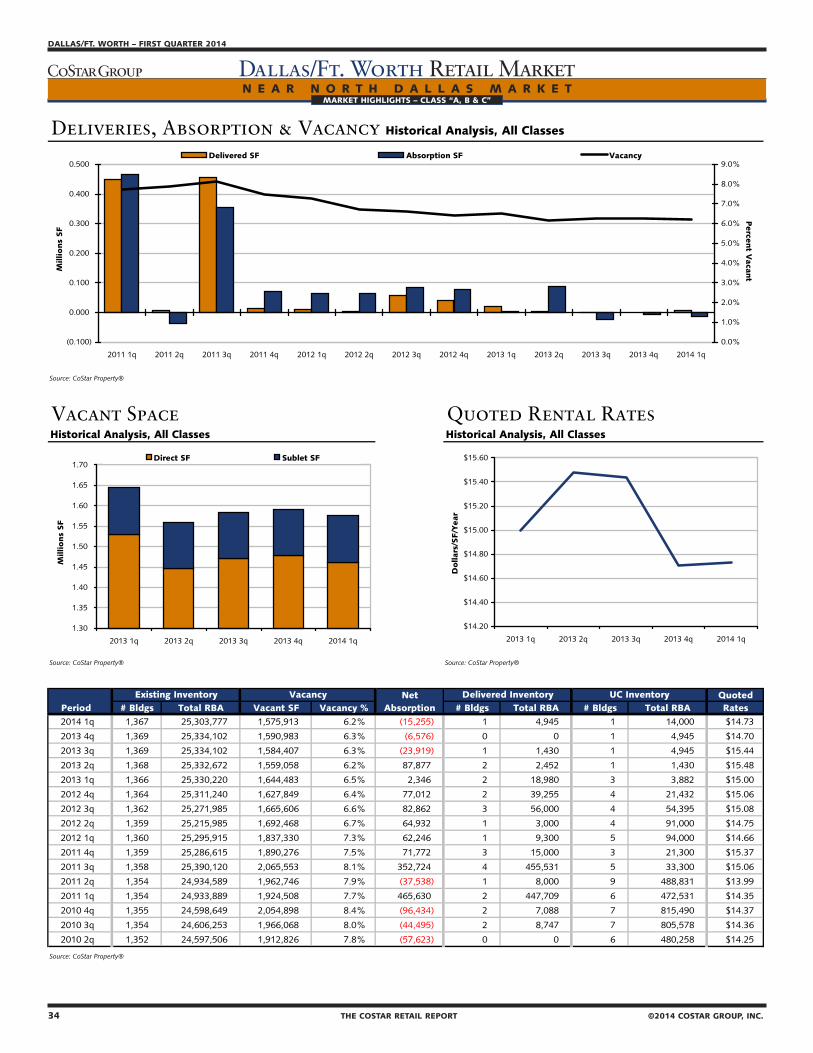
34 THE COSTAR RETAIL REPORT ©2014 COSTAR GROUP, INC.
DALLAS/FT. WORTH – FIRST QUARTER 2014
Dallas/Ft. Worth Retail MarketMARKET HIGHLIGHTS – CLASS “A, B & C”
©2014 COSTAR GROUP, INC. THE COSTAR RETAIL REPORT 35
FIRST QUARTER 2014 – DALLAS/FT. WORTH
Dallas/Ft. Worth Retail MarketMARKET HIGHLIGHTS – CLASS “A, B & C”
N E A R N O R T H D A L L A S M A R K E T
Deliveries, Absorption & Vacancy Historical Analysis, All Classes
Source: CoStar Property®
Vacant Space Quoted Rental RatesHistorical Analysis, All Classes Historical Analysis, All Classes
Source: CoStar Property® Source: CoStar Property®
Net QuotedPeriod # Bldgs Total RBA Vacant SF Vacancy % Absorption # Bldgs Total RBA # Bldgs Total RBA Rates2014 1q 1,367 25,303,777 1,575,913 6.2% (15,255) 1 4,945 1 14,000 $14.73
2013 4q 1,369 25,334,102 1,590,983 6.3% (6,576) 0 0 1 4,945 $14.70
2013 3q 1,369 25,334,102 1,584,407 6.3% (23,919) 1 1,430 1 4,945 $15.44
2013 2q 1,368 25,332,672 1,559,058 6.2% 87,877 2 2,452 1 1,430 $15.48
2013 1q 1,366 25,330,220 1,644,483 6.5% 2,346 2 18,980 3 3,882 $15.00
2012 4q 1,364 25,311,240 1,627,849 6.4% 77,012 2 39,255 4 21,432 $15.06
2012 3q 1,362 25,271,985 1,665,606 6.6% 82,862 3 56,000 4 54,395 $15.08
2012 2q 1,359 25,215,985 1,692,468 6.7% 64,932 1 3,000 4 91,000 $14.75
2012 1q 1,360 25,295,915 1,837,330 7.3% 62,246 1 9,300 5 94,000 $14.66
2011 4q 1,359 25,286,615 1,890,276 7.5% 71,772 3 15,000 3 21,300 $15.37
2011 3q 1,358 25,390,120 2,065,553 8.1% 352,724 4 455,531 5 33,300 $15.06
2011 2q 1,354 24,934,589 1,962,746 7.9% (37,538) 1 8,000 9 488,831 $13.99
2011 1q 1,354 24,933,889 1,924,508 7.7% 465,630 2 447,709 6 472,531 $14.35
2010 4q 1,355 24,598,649 2,054,898 8.4% (96,434) 2 7,088 7 815,490 $14.37
2010 3q 1,354 24,606,253 1,966,068 8.0% (44,495) 2 8,747 7 805,578 $14.36
2010 2q 1,352 24,597,506 1,912,826 7.8% (57,623) 0 0 6 480,258 $14.25
Source: CoStar Property®
UC InventoryDelivered InventoryExisting Inventory Vacancy
(0.100)
0.000
0.100
0.200
0.300
0.400
0.500
2011 1q 2011 2q 2011 3q 2011 4q 2012 1q 2012 2q 2012 3q 2012 4q 2013 1q 2013 2q 2013 3q 2013 4q 2014 1q
Millio
ns
SF
0.0%
1.0%
2.0%
3.0%
4.0%
5.0%
6.0%
7.0%
8.0%
9.0%
Perce
nt V
acant
Delivered SF Absorption SF Vacancy
$14.20
$14.40
$14.60
$14.80
$15.00
$15.20
$15.40
$15.60
2013 1q 2013 2q 2013 3q 2013 4q 2014 1q
Dollar
s/SF/Y
ear
1.30
1.35
1.40
1.45
1.50
1.55
1.60
1.65
1.70
2013 1q 2013 2q 2013 3q 2013 4q 2014 1q
Millio
ns
SF
Direct SF Sublet SF
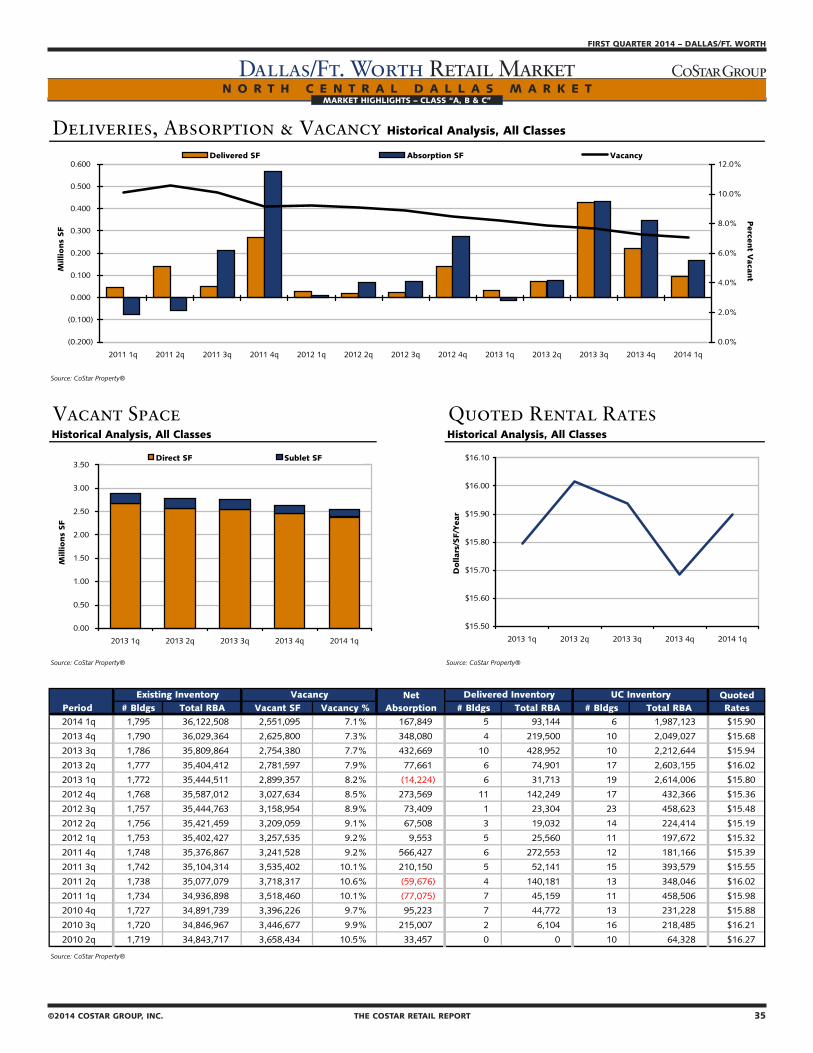
34 THE COSTAR RETAIL REPORT ©2014 COSTAR GROUP, INC.
DALLAS/FT. WORTH – FIRST QUARTER 2014
Dallas/Ft. Worth Retail MarketMARKET HIGHLIGHTS – CLASS “A, B & C”
©2014 COSTAR GROUP, INC. THE COSTAR RETAIL REPORT 35
FIRST QUARTER 2014 – DALLAS/FT. WORTH
Dallas/Ft. Worth Retail MarketMARKET HIGHLIGHTS – CLASS “A, B & C”
N O R T H C E N T R A L D A L L A S M A R K E T
Deliveries, Absorption & Vacancy Historical Analysis, All Classes
Source: CoStar Property®
Vacant Space Quoted Rental RatesHistorical Analysis, All Classes Historical Analysis, All Classes
Source: CoStar Property® Source: CoStar Property®
Net QuotedPeriod # Bldgs Total RBA Vacant SF Vacancy % Absorption # Bldgs Total RBA # Bldgs Total RBA Rates2014 1q 1,795 36,122,508 2,551,095 7.1% 167,849 5 93,144 6 1,987,123 $15.90
2013 4q 1,790 36,029,364 2,625,800 7.3% 348,080 4 219,500 10 2,049,027 $15.68
2013 3q 1,786 35,809,864 2,754,380 7.7% 432,669 10 428,952 10 2,212,644 $15.94
2013 2q 1,777 35,404,412 2,781,597 7.9% 77,661 6 74,901 17 2,603,155 $16.02
2013 1q 1,772 35,444,511 2,899,357 8.2% (14,224) 6 31,713 19 2,614,006 $15.80
2012 4q 1,768 35,587,012 3,027,634 8.5% 273,569 11 142,249 17 432,366 $15.36
2012 3q 1,757 35,444,763 3,158,954 8.9% 73,409 1 23,304 23 458,623 $15.48
2012 2q 1,756 35,421,459 3,209,059 9.1% 67,508 3 19,032 14 224,414 $15.19
2012 1q 1,753 35,402,427 3,257,535 9.2% 9,553 5 25,560 11 197,672 $15.32
2011 4q 1,748 35,376,867 3,241,528 9.2% 566,427 6 272,553 12 181,166 $15.39
2011 3q 1,742 35,104,314 3,535,402 10.1% 210,150 5 52,141 15 393,579 $15.55
2011 2q 1,738 35,077,079 3,718,317 10.6% (59,676) 4 140,181 13 348,046 $16.02
2011 1q 1,734 34,936,898 3,518,460 10.1% (77,075) 7 45,159 11 458,506 $15.98
2010 4q 1,727 34,891,739 3,396,226 9.7% 95,223 7 44,772 13 231,228 $15.88
2010 3q 1,720 34,846,967 3,446,677 9.9% 215,007 2 6,104 16 218,485 $16.21
2010 2q 1,719 34,843,717 3,658,434 10.5% 33,457 0 0 10 64,328 $16.27
Source: CoStar Property®
UC InventoryDelivered InventoryExisting Inventory Vacancy
(0.200)
(0.100)
0.000
0.100
0.200
0.300
0.400
0.500
0.600
2011 1q 2011 2q 2011 3q 2011 4q 2012 1q 2012 2q 2012 3q 2012 4q 2013 1q 2013 2q 2013 3q 2013 4q 2014 1q
Millio
ns
SF
0.0%
2.0%
4.0%
6.0%
8.0%
10.0%
12.0%
Perce
nt V
acant
Delivered SF Absorption SF Vacancy
$15.50
$15.60
$15.70
$15.80
$15.90
$16.00
$16.10
2013 1q 2013 2q 2013 3q 2013 4q 2014 1q
Dollar
s/SF/Y
ear
0.00
0.50
1.00
1.50
2.00
2.50
3.00
3.50
2013 1q 2013 2q 2013 3q 2013 4q 2014 1q
Millio
ns
SF
Direct SF Sublet SF

36 THE COSTAR RETAIL REPORT ©2014 COSTAR GROUP, INC.
DALLAS/FT. WORTH – FIRST QUARTER 2014
Dallas/Ft. Worth Retail MarketMARKET HIGHLIGHTS – CLASS “A, B & C”
©2014 COSTAR GROUP, INC. THE COSTAR RETAIL REPORT 37
FIRST QUARTER 2014 – DALLAS/FT. WORTH
Dallas/Ft. Worth Retail MarketMARKET HIGHLIGHTS – CLASS “A, B & C”
S O U T H E A S T D A L L A S M A R K E T
Deliveries, Absorption & Vacancy Historical Analysis, All Classes
Source: CoStar Property®
Vacant Space Quoted Rental RatesHistorical Analysis, All Classes Historical Analysis, All Classes
Source: CoStar Property® Source: CoStar Property®
Net QuotedPeriod # Bldgs Total RBA Vacant SF Vacancy % Absorption # Bldgs Total RBA # Bldgs Total RBA Rates2014 1q 1,957 21,171,464 1,311,015 6.2% 44,241 3 23,314 0 0 $11.71
2013 4q 1,954 21,148,150 1,331,942 6.3% (20,032) 0 0 3 23,314 $11.00
2013 3q 1,955 21,156,545 1,320,305 6.2% (89,658) 2 6,104 3 23,314 $11.02
2013 2q 1,955 21,199,792 1,273,894 6.0% 122,008 3 24,579 4 21,600 $11.24
2013 1q 1,952 21,175,213 1,371,323 6.5% 74,631 5 39,123 5 30,683 $11.03
2012 4q 1,947 21,136,090 1,406,831 6.7% 17,578 4 19,529 8 63,702 $11.32
2012 3q 1,943 21,116,561 1,404,880 6.7% 121,401 1 22,750 10 71,132 $11.42
2012 2q 1,942 21,093,811 1,503,531 7.1% 4,472 2 27,219 5 42,279 $11.83
2012 1q 1,941 21,069,520 1,483,712 7.0% 8,183 2 49,962 4 36,939 $11.22
2011 4q 1,940 21,024,298 1,446,673 6.9% 9,399 1 15,150 3 55,587 $10.96
2011 3q 1,940 21,009,994 1,441,768 6.9% 211,314 0 0 3 65,112 $10.83
2011 2q 1,940 21,009,994 1,653,082 7.9% (45,920) 0 0 1 15,150 $10.83
2011 1q 1,940 21,009,994 1,607,162 7.6% (121,168) 4 16,453 1 15,150 $11.24
2010 4q 1,936 20,993,541 1,469,541 7.0% 26,567 1 3,980 5 31,603 $11.24
2010 3q 1,936 20,992,773 1,495,340 7.1% 34,342 2 6,437 6 35,583 $11.42
2010 2q 1,935 21,006,336 1,543,245 7.3% (23,433) 0 0 3 10,417 $11.10
Source: CoStar Property®
UC InventoryDelivered InventoryExisting Inventory Vacancy
(0.150)
(0.100)
(0.050)
0.000
0.050
0.100
0.150
0.200
0.250
2011 1q 2011 2q 2011 3q 2011 4q 2012 1q 2012 2q 2012 3q 2012 4q 2013 1q 2013 2q 2013 3q 2013 4q 2014 1q
Millio
ns
SF
0.0%
1.0%
2.0%
3.0%
4.0%
5.0%
6.0%
7.0%
8.0%
9.0%
Perce
nt V
acant
Delivered SF Absorption SF Vacancy
$10.60
$10.80
$11.00
$11.20
$11.40
$11.60
$11.80
2013 1q 2013 2q 2013 3q 2013 4q 2014 1q
Dollar
s/SF/Y
ear
1.20
1.22
1.24
1.26
1.28
1.30
1.32
1.34
1.36
1.38
2013 1q 2013 2q 2013 3q 2013 4q 2014 1q
Millio
ns
SF
Direct SF Sublet SF

36 THE COSTAR RETAIL REPORT ©2014 COSTAR GROUP, INC.
DALLAS/FT. WORTH – FIRST QUARTER 2014
Dallas/Ft. Worth Retail MarketMARKET HIGHLIGHTS – CLASS “A, B & C”
©2014 COSTAR GROUP, INC. THE COSTAR RETAIL REPORT 37
FIRST QUARTER 2014 – DALLAS/FT. WORTH
Dallas/Ft. Worth Retail MarketMARKET HIGHLIGHTS – CLASS “A, B & C”
S O U T H W E S T D A L L A S M A R K E T
Deliveries, Absorption & Vacancy Historical Analysis, All Classes
Source: CoStar Property®
Vacant Space Quoted Rental RatesHistorical Analysis, All Classes Historical Analysis, All Classes
Source: CoStar Property® Source: CoStar Property®
Net QuotedPeriod # Bldgs Total RBA Vacant SF Vacancy % Absorption # Bldgs Total RBA # Bldgs Total RBA Rates2014 1q 1,806 22,815,374 2,038,712 8.9% 127,365 3 130,326 3 101,577 $10.62
2013 4q 1,803 22,685,048 2,035,751 9.0% (10,430) 1 2,500 6 231,903 $10.36
2013 3q 1,802 22,682,548 2,022,821 8.9% (30,400) 1 10,467 6 233,800 $10.23
2013 2q 1,802 22,674,781 1,984,654 8.8% 34,830 1 3,003 6 236,285 $10.29
2013 1q 1,801 22,671,778 2,016,481 8.9% 28,401 3 23,451 3 132,044 $10.23
2012 4q 1,799 22,724,466 2,097,570 9.2% 129,015 3 13,991 4 26,454 $10.59
2012 3q 1,796 22,710,475 2,212,594 9.7% 87,474 7 44,259 7 40,445 $10.57
2012 2q 1,789 22,666,216 2,255,809 10.0% 68,031 6 177,682 9 61,530 $10.33
2012 1q 1,783 22,488,534 2,146,158 9.5% 14,480 1 1,666 14 230,261 $10.30
2011 4q 1,782 22,486,868 2,158,972 9.6% 7,490 0 0 6 170,652 $10.46
2011 3q 1,782 22,486,868 2,166,462 9.6% 11,928 1 2,916 4 148,252 $10.46
2011 2q 1,781 22,483,952 2,175,474 9.7% (2,508) 2 17,334 1 2,916 $10.50
2011 1q 1,780 22,468,618 2,157,632 9.6% 105,211 5 82,773 3 20,250 $10.31
2010 4q 1,775 22,385,845 2,180,070 9.7% 90,310 3 41,327 7 94,009 $10.32
2010 3q 1,772 22,344,518 2,229,053 10.0% (21,503) 1 3,138 9 127,016 $10.39
2010 2q 1,771 22,341,380 2,204,412 9.9% (28,568) 3 16,359 6 105,031 $10.12
Source: CoStar Property®
UC InventoryDelivered InventoryExisting Inventory Vacancy
(0.050)
0.000
0.050
0.100
0.150
0.200
2011 1q 2011 2q 2011 3q 2011 4q 2012 1q 2012 2q 2012 3q 2012 4q 2013 1q 2013 2q 2013 3q 2013 4q 2014 1q
Millio
ns
SF
8.0%
8.2%
8.4%
8.6%
8.8%
9.0%
9.2%
9.4%
9.6%
9.8%
10.0%
10.2%
Perce
nt V
acant
Delivered SF Absorption SF Vacancy
$10.00
$10.10
$10.20
$10.30
$10.40
$10.50
$10.60
$10.70
2013 1q 2013 2q 2013 3q 2013 4q 2014 1q
Dollar
s/SF/Y
ear
1.90
1.92
1.94
1.96
1.98
2.00
2.02
2.04
2.06
2013 1q 2013 2q 2013 3q 2013 4q 2014 1q
Millio
ns
SF
Direct SF Sublet SF

38 THE COSTAR RETAIL REPORT ©2014 COSTAR GROUP, INC.
DALLAS/FT. WORTH – FIRST QUARTER 2014
Dallas/Ft. Worth Retail MarketMARKET HIGHLIGHTS – CLASS “A, B & C”
©2014 COSTAR GROUP, INC. THE COSTAR RETAIL REPORT 39
FIRST QUARTER 2014 – DALLAS/FT. WORTH
Dallas/Ft. Worth Retail MarketMARKET HIGHLIGHTS – CLASS “A, B & C”
S O U T H W E S T O U T L Y I N G M A R K E T
Deliveries, Absorption & Vacancy Historical Analysis, All Classes
Source: CoStar Property®
Vacant Space Quoted Rental RatesHistorical Analysis, All Classes Historical Analysis, All Classes
Source: CoStar Property® Source: CoStar Property®
Net QuotedPeriod # Bldgs Total RBA Vacant SF Vacancy % Absorption # Bldgs Total RBA # Bldgs Total RBA Rates2014 1q 1,756 15,134,496 645,516 4.3% 45,927 1 3,969 2 95,094 $12.02
2013 4q 1,755 15,130,527 687,474 4.5% 53,228 5 26,204 3 99,063 $11.85
2013 3q 1,750 15,104,323 714,498 4.7% (4,444) 0 0 8 125,267 $11.79
2013 2q 1,750 15,104,323 710,054 4.7% 47,950 2 25,843 5 112,873 $12.11
2013 1q 1,748 15,078,480 732,161 4.9% 81,524 3 42,230 4 40,869 $11.98
2012 4q 1,745 15,036,250 771,455 5.1% 192,262 3 137,195 5 68,073 $12.03
2012 3q 1,742 14,899,055 826,522 5.5% 33,999 2 8,076 6 179,425 $11.85
2012 2q 1,740 14,890,979 852,445 5.7% 12,641 4 19,814 5 172,808 $11.83
2012 1q 1,737 14,873,665 847,772 5.7% 98,303 1 14,772 8 162,685 $11.65
2011 4q 1,736 14,858,893 931,303 6.3% (5,186) 3 21,644 5 34,586 $11.58
2011 3q 1,733 14,837,249 904,473 6.1% 97,458 5 141,487 4 36,416 $11.62
2011 2q 1,728 14,695,762 860,444 5.9% 15,859 2 5,099 7 152,331 $11.63
2011 1q 1,726 14,690,663 871,204 5.9% 100,941 6 110,677 7 146,586 $11.82
2010 4q 1,720 14,579,986 861,468 5.9% 2,058 4 21,532 8 115,776 $12.28
2010 3q 1,716 14,558,454 841,994 5.8% 38,918 2 100,476 10 132,209 $12.30
2010 2q 1,714 14,457,978 780,436 5.4% (2,427) 1 2,000 5 170,331 $10.92
Source: CoStar Property®
UC InventoryDelivered InventoryExisting Inventory Vacancy
(0.050)
0.000
0.050
0.100
0.150
0.200
0.250
2011 1q 2011 2q 2011 3q 2011 4q 2012 1q 2012 2q 2012 3q 2012 4q 2013 1q 2013 2q 2013 3q 2013 4q 2014 1q
Millio
ns
SF
0.0%
1.0%
2.0%
3.0%
4.0%
5.0%
6.0%
7.0%
Perce
nt V
acant
Delivered SF Absorption SF Vacancy
$11.60
$11.70
$11.80
$11.90
$12.00
$12.10
$12.20
2013 1q 2013 2q 2013 3q 2013 4q 2014 1q
Dollar
s/SF/Y
ear
0.58
0.60
0.62
0.64
0.66
0.68
0.70
0.72
0.74
2013 1q 2013 2q 2013 3q 2013 4q 2014 1q
Millio
ns
SF
Direct SF Sublet SF
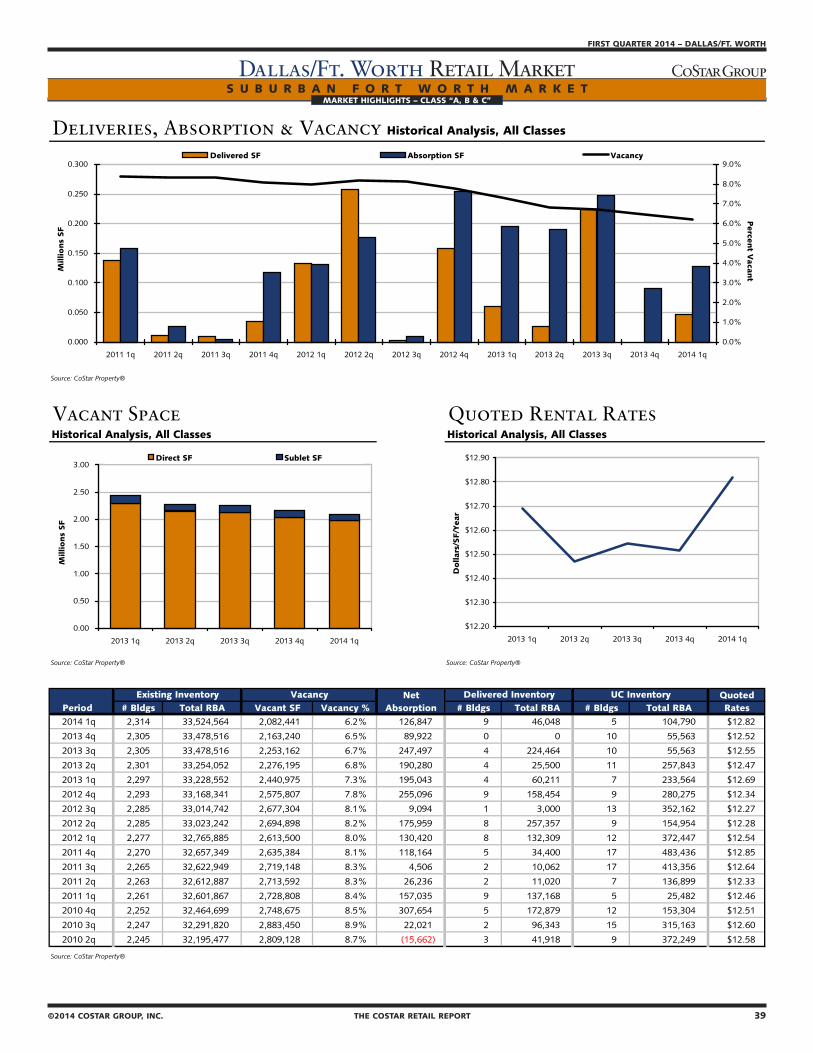
38 THE COSTAR RETAIL REPORT ©2014 COSTAR GROUP, INC.
DALLAS/FT. WORTH – FIRST QUARTER 2014
Dallas/Ft. Worth Retail MarketMARKET HIGHLIGHTS – CLASS “A, B & C”
©2014 COSTAR GROUP, INC. THE COSTAR RETAIL REPORT 39
FIRST QUARTER 2014 – DALLAS/FT. WORTH
Dallas/Ft. Worth Retail MarketMARKET HIGHLIGHTS – CLASS “A, B & C”
S U B U R B A N F O R T W O R T H M A R K E T
Deliveries, Absorption & Vacancy Historical Analysis, All Classes
Source: CoStar Property®
Vacant Space Quoted Rental RatesHistorical Analysis, All Classes Historical Analysis, All Classes
Source: CoStar Property® Source: CoStar Property®
Net QuotedPeriod # Bldgs Total RBA Vacant SF Vacancy % Absorption # Bldgs Total RBA # Bldgs Total RBA Rates2014 1q 2,314 33,524,564 2,082,441 6.2% 126,847 9 46,048 5 104,790 $12.82
2013 4q 2,305 33,478,516 2,163,240 6.5% 89,922 0 0 10 55,563 $12.52
2013 3q 2,305 33,478,516 2,253,162 6.7% 247,497 4 224,464 10 55,563 $12.55
2013 2q 2,301 33,254,052 2,276,195 6.8% 190,280 4 25,500 11 257,843 $12.47
2013 1q 2,297 33,228,552 2,440,975 7.3% 195,043 4 60,211 7 233,564 $12.69
2012 4q 2,293 33,168,341 2,575,807 7.8% 255,096 9 158,454 9 280,275 $12.34
2012 3q 2,285 33,014,742 2,677,304 8.1% 9,094 1 3,000 13 352,162 $12.27
2012 2q 2,285 33,023,242 2,694,898 8.2% 175,959 8 257,357 9 154,954 $12.28
2012 1q 2,277 32,765,885 2,613,500 8.0% 130,420 8 132,309 12 372,447 $12.54
2011 4q 2,270 32,657,349 2,635,384 8.1% 118,164 5 34,400 17 483,436 $12.85
2011 3q 2,265 32,622,949 2,719,148 8.3% 4,506 2 10,062 17 413,356 $12.64
2011 2q 2,263 32,612,887 2,713,592 8.3% 26,236 2 11,020 7 136,899 $12.33
2011 1q 2,261 32,601,867 2,728,808 8.4% 157,035 9 137,168 5 25,482 $12.46
2010 4q 2,252 32,464,699 2,748,675 8.5% 307,654 5 172,879 12 153,304 $12.51
2010 3q 2,247 32,291,820 2,883,450 8.9% 22,021 2 96,343 15 315,163 $12.60
2010 2q 2,245 32,195,477 2,809,128 8.7% (15,662) 3 41,918 9 372,249 $12.58
Source: CoStar Property®
UC InventoryDelivered InventoryExisting Inventory Vacancy
0.000
0.050
0.100
0.150
0.200
0.250
0.300
2011 1q 2011 2q 2011 3q 2011 4q 2012 1q 2012 2q 2012 3q 2012 4q 2013 1q 2013 2q 2013 3q 2013 4q 2014 1q
Millio
ns
SF
0.0%
1.0%
2.0%
3.0%
4.0%
5.0%
6.0%
7.0%
8.0%
9.0%
Perce
nt V
acant
Delivered SF Absorption SF Vacancy
$12.20
$12.30
$12.40
$12.50
$12.60
$12.70
$12.80
$12.90
2013 1q 2013 2q 2013 3q 2013 4q 2014 1q
Dollar
s/SF/Y
ear
0.00
0.50
1.00
1.50
2.00
2.50
3.00
2013 1q 2013 2q 2013 3q 2013 4q 2014 1q
Millio
ns
SF
Direct SF Sublet SF

40 THE COSTAR RETAIL REPORT ©2014 COSTAR GROUP, INC.
DALLAS/FT. WORTH – FIRST QUARTER 2014
Dallas/Ft. Worth Retail MarketMARKET HIGHLIGHTS – CLASS “A, B & C”
W E S T D A L L A S M A R K E T
Deliveries, Absorption & Vacancy Historical Analysis, All Classes
Source: CoStar Property®
Vacant Space Quoted Rental RatesHistorical Analysis, All Classes Historical Analysis, All Classes
Source: CoStar Property® Source: CoStar Property®
Net QuotedPeriod # Bldgs Total RBA Vacant SF Vacancy % Absorption # Bldgs Total RBA # Bldgs Total RBA Rates2014 1q 2,438 38,556,151 3,040,684 7.9% 51,822 4 23,183 12 278,200 $14.61
2013 4q 2,435 38,545,037 3,081,392 8.0% 105,654 4 91,800 11 123,918 $14.73
2013 3q 2,433 38,494,201 3,136,210 8.1% (69,867) 7 48,616 10 161,033 $14.51
2013 2q 2,427 38,449,395 3,021,537 7.9% 226,380 1 7,500 16 200,887 $14.68
2013 1q 2,426 38,441,895 3,240,417 8.4% (14,976) 5 28,171 9 94,116 $15.28
2012 4q 2,421 38,413,724 3,197,270 8.3% 197,239 8 158,671 7 39,136 $13.74
2012 3q 2,413 38,255,053 3,235,838 8.5% 484,237 10 404,356 12 186,742 $14.17
2012 2q 2,403 37,850,697 3,315,719 8.8% 131,860 1 3,000 21 588,598 $13.80
2012 1q 2,403 37,863,198 3,460,080 9.1% 103,665 5 54,722 15 441,341 $13.37
2011 4q 2,398 37,808,476 3,509,023 9.3% 132,375 3 18,635 15 455,578 $13.39
2011 3q 2,397 37,804,371 3,637,293 9.6% 12,739 6 40,986 16 459,783 $13.33
2011 2q 2,391 37,763,385 3,609,046 9.6% (27,934) 1 12,000 18 476,621 $13.23
2011 1q 2,391 37,762,985 3,580,712 9.5% 57,341 5 24,679 8 56,506 $13.56
2010 4q 2,386 37,738,306 3,613,374 9.6% 2,594 3 8,431 10 67,489 $13.60
2010 3q 2,383 37,729,875 3,607,537 9.6% 86,667 2 7,700 12 72,400 $13.38
2010 2q 2,381 37,722,175 3,686,504 9.8% (143) 5 33,274 9 55,421 $13.66
Source: CoStar Property®
UC InventoryDelivered InventoryExisting Inventory Vacancy
(0.100)
0.000
0.100
0.200
0.300
0.400
0.500
0.600
2011 1q 2011 2q 2011 3q 2011 4q 2012 1q 2012 2q 2012 3q 2012 4q 2013 1q 2013 2q 2013 3q 2013 4q 2014 1q
Millio
ns
SF
0.0%
2.0%
4.0%
6.0%
8.0%
10.0%
12.0%
Perce
nt V
acant
Delivered SF Absorption SF Vacancy
$14.00
$14.20
$14.40
$14.60
$14.80
$15.00
$15.20
$15.40
2013 1q 2013 2q 2013 3q 2013 4q 2014 1q
Dollar
s/SF/Y
ear
2.85
2.90
2.95
3.00
3.05
3.10
3.15
3.20
3.25
3.30
2013 1q 2013 2q 2013 3q 2013 4q 2014 1q
Millio
ns
SF
Direct SF Sublet SF