Embed Size (px)
Citation preview
© International Monetary Fund
IMF Country Report No. 15/29
COSTA RICA 2014 ARTICLE IV CONSULTATION––STAFF REPORT; PRESS RELEASE; STAFF STATEMENT; AND STATEMENT BY THE EXECUTIVE DIRECTOR FOR COSTA RICA
Under Article IV of the IMF’s Articles of Agreement, the IMF holds bilateral discussions with members, usually every year. In the context of the 2014 Article IV consultation with Costa Rica, the following documents have been released and are included in this package:
The Staff Report prepared by a staff team of the IMF for the Executive Board’sconsideration on January 30, 2015, following discussions that ended onNovember 10, 2014, with the officials of Costa Rica on economic developments andpolicies. Based on information available at the time of these discussions, the staff reportwas completed on January 9, 2015.
An Informational Annex prepared by the IMF.
A Staff Statement of January 27, 2015 updating information on recent developments.
A Press Release summarizing the views of the Executive Board as expressed during itsJanuary 30, 2015 consideration of the staff report that concluded the Article IVconsultation with Costa Rica.
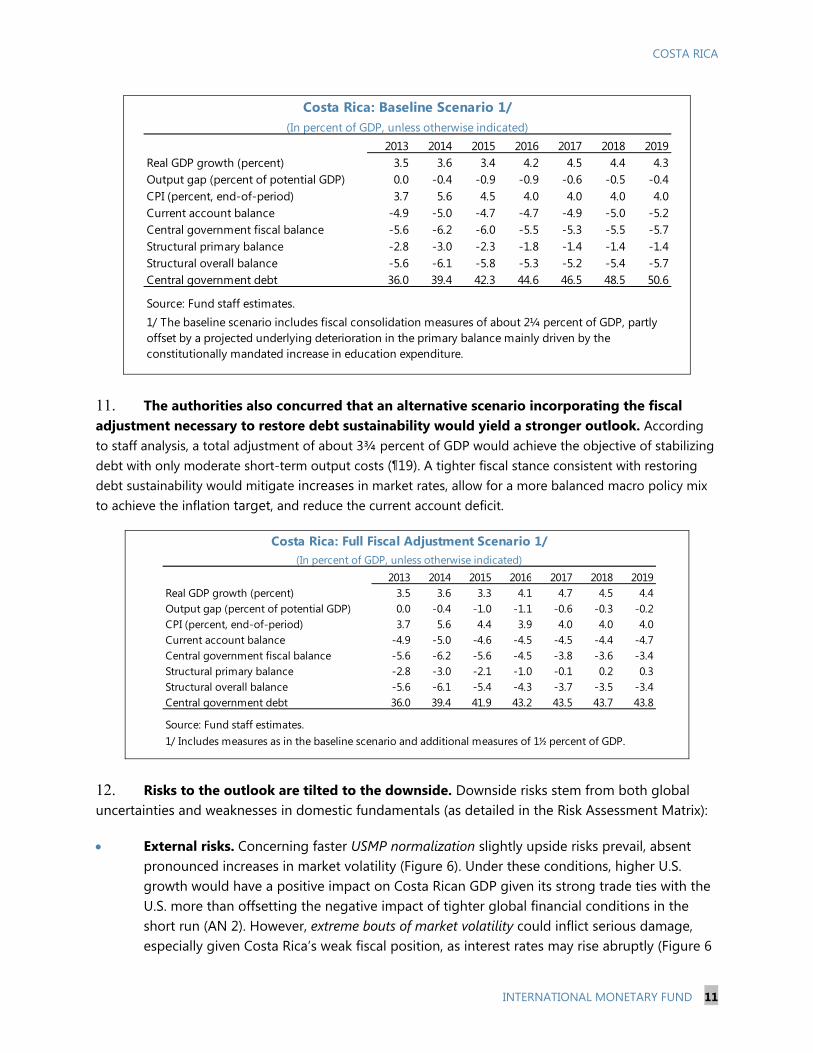
A Statement by the Executive Director for Costa Rica.
The document listed below has been or will be separately released.
Selected Issues Paper
The policy of publication of staff reports and other documents allows for the deletion of market-sensitive information.
Copies of this report are available to the public from
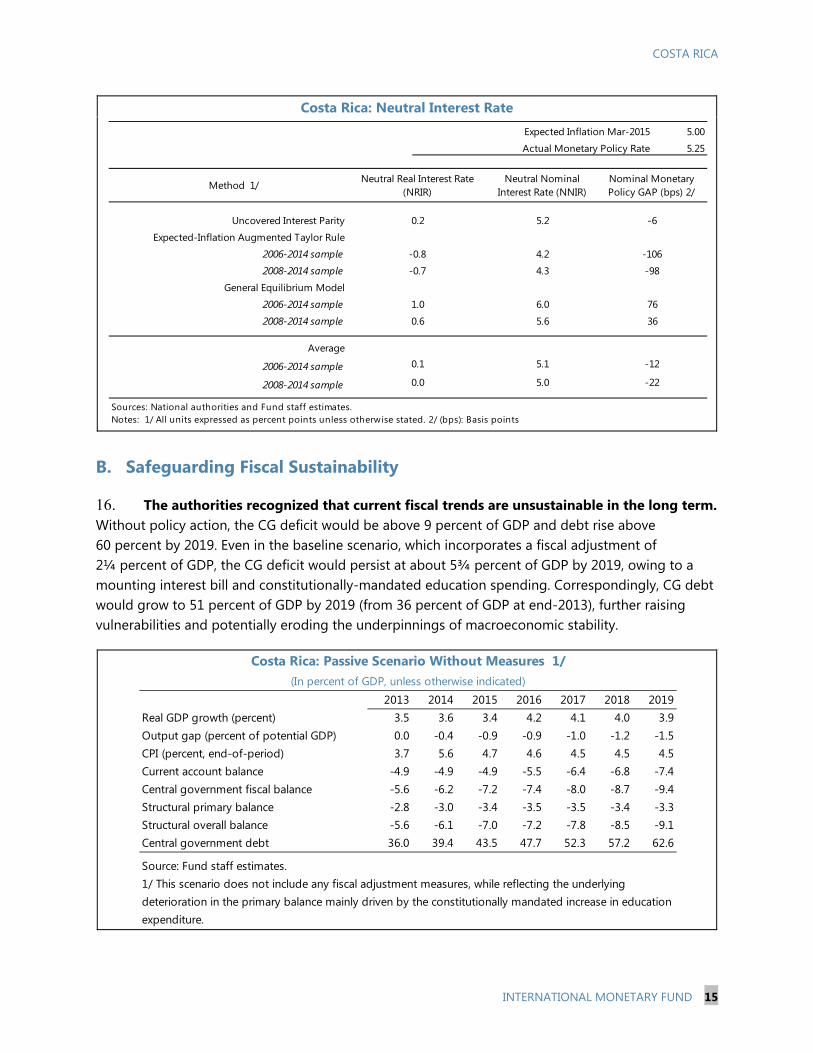
International Monetary Fund Publication Services PO Box 92780 Washington, D.C. 20090
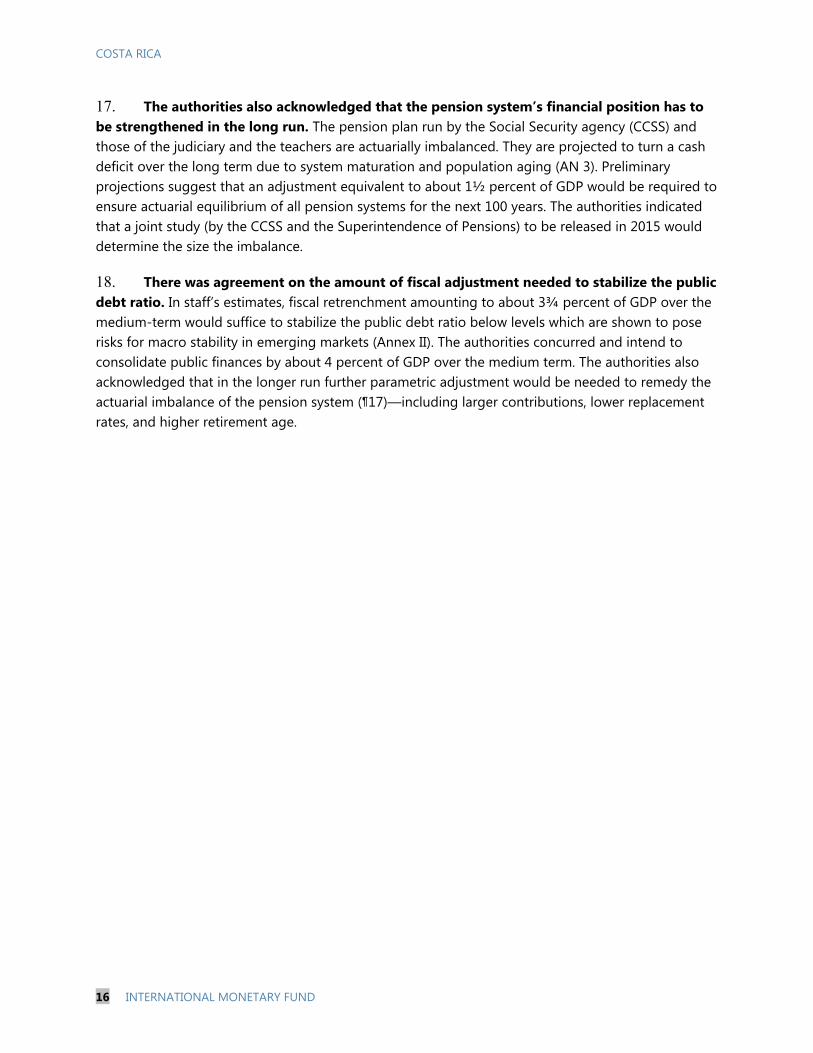
Telephone: (202) 623-7430 Fax: (202) 623-7201 E-mail: [email protected] Web: http://www.imf.org
Price: $18.00 per printed copy
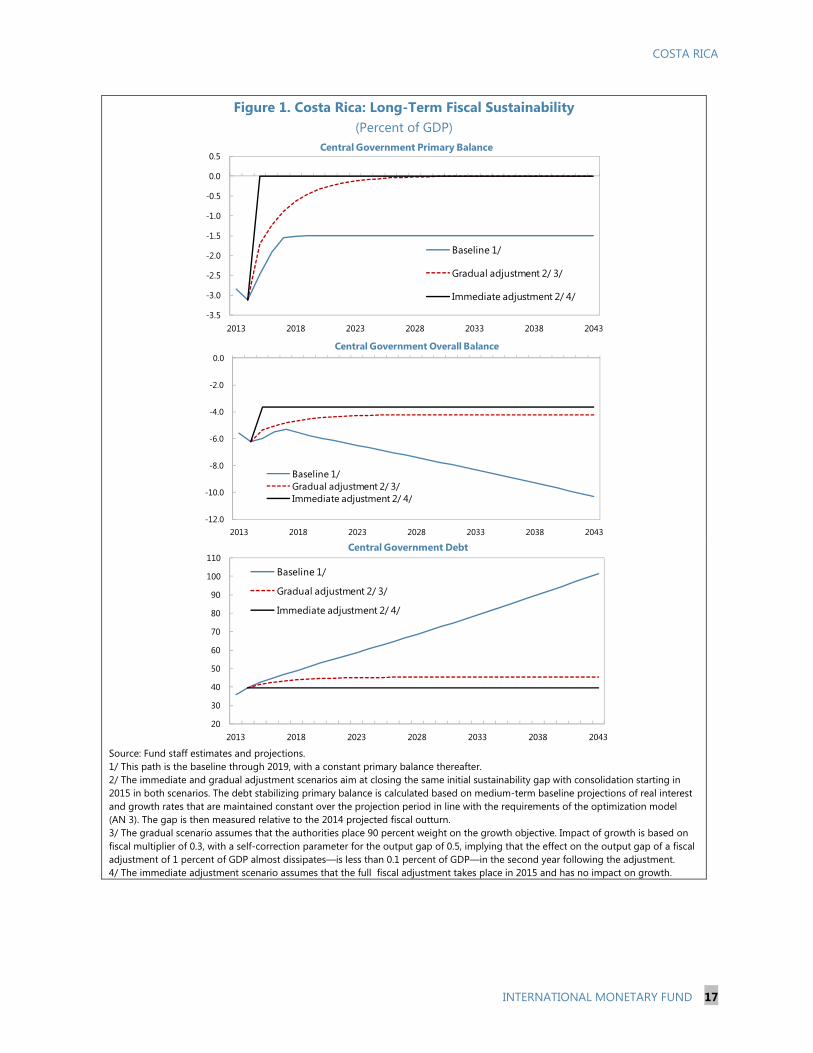
International Monetary Fund Washington, D.C.
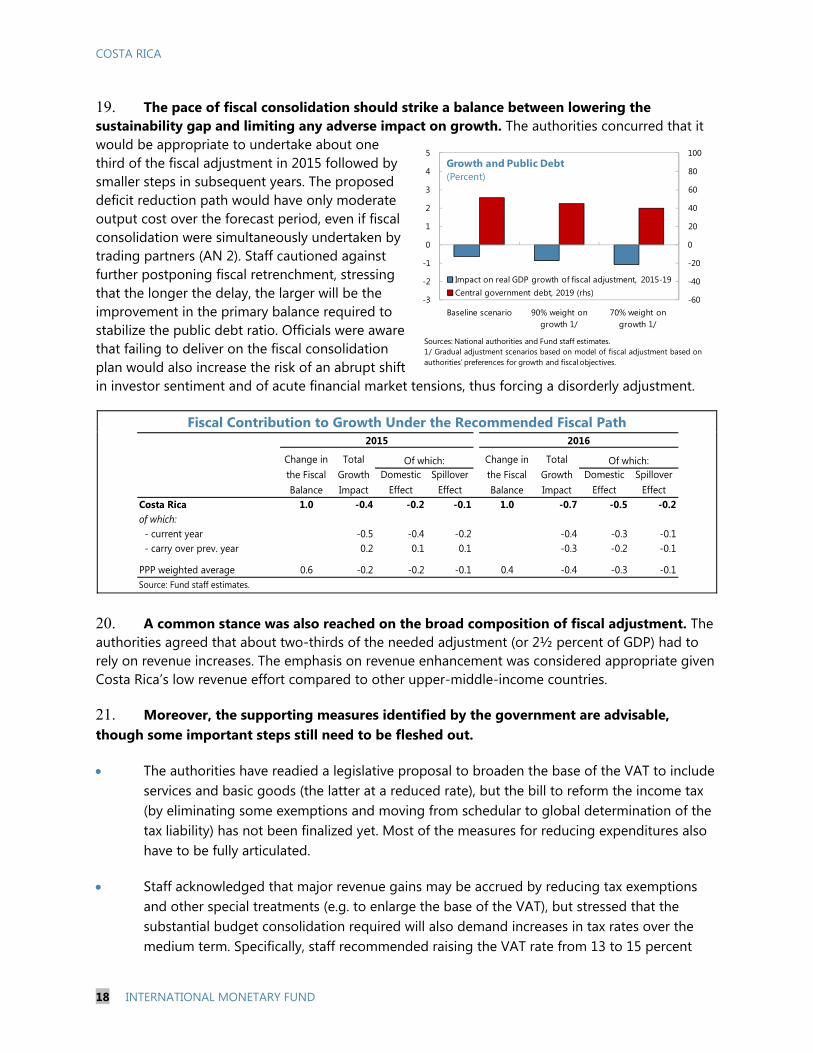
February 2015
COSTA RICA STAFF REPORT FOR THE 2014 ARTICLE IV CONSULTATION
KEY ISSUES
Context. The economy recovered quickly from the global crisis of 2008–09, with healthy
growth and low inflation. Growth has, however, slowed recently and is expected to
remain subdued in the short run, since gains from recovery in the U.S. will be offset by
the closure of the Intel manufacturing plant. Inflation is elevated, owing primarily to
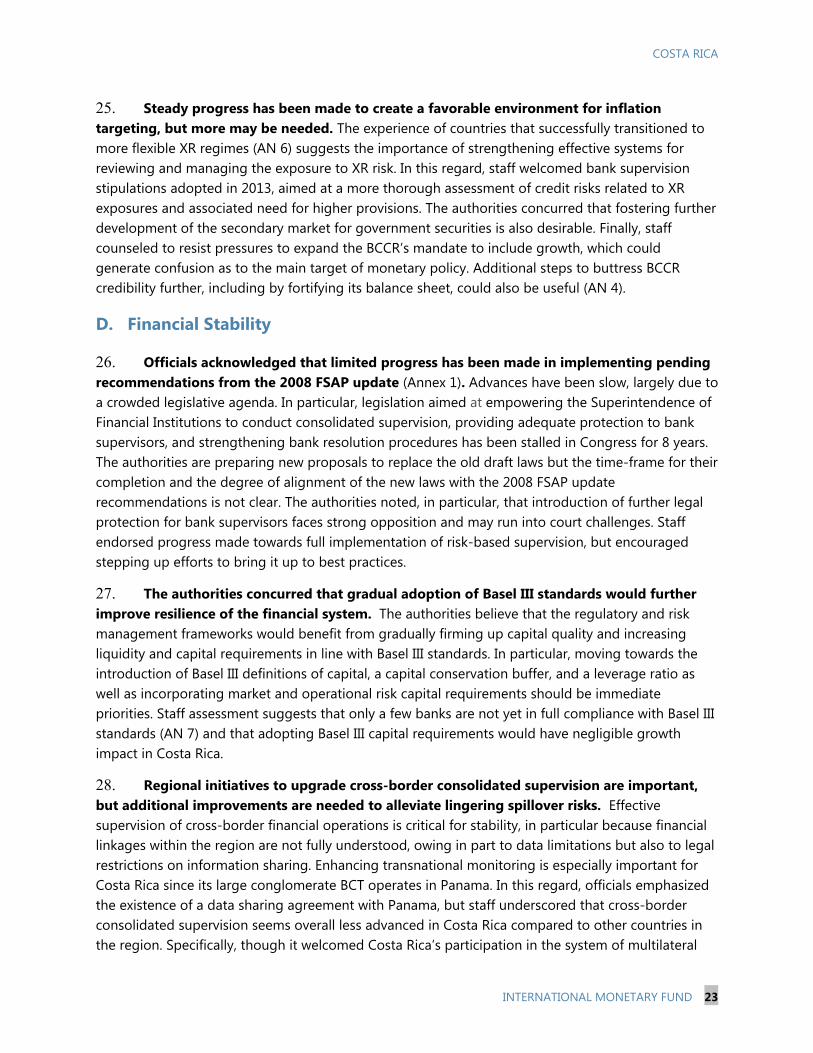
exchange rate (XR) depreciation triggered by global repricing of emerging market assets
in early 2014. Risks to the outlook are tilted to the downside. Absent consolidation, large
fiscal deficits would make public debt dynamics unsustainable in the long-run.
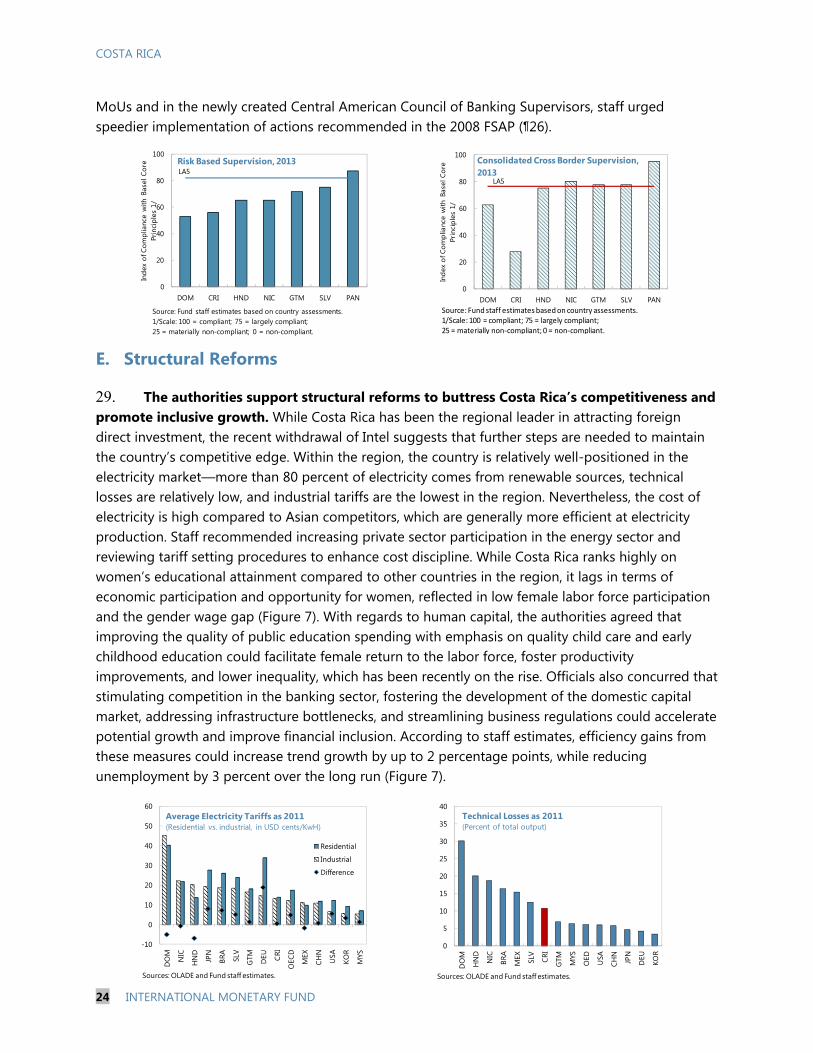
The short-term policy mix should envision a lower budget deficit and vigilance
over inflation. A tighter fiscal stance would mitigate risks of inflation, external
imbalances, and start restoring long-run sustainability. The authorities should also stand
ready to increase interest rates and allow greater exchange rate flexibility if inflationary
pressures persist, especially in the absence of fiscal adjustment.
Steady fiscal consolidation is required over the medium term. The threat of
unsustainable public debt dynamics calls for corrective action, as postponing budgetary
retrenchment could seriously endanger macroeconomic stability. The authorities’ fiscal
plan, which contemplates somewhat front-loaded followed by gradual adjustment, is
appropriate to bring public debt on a sustainable footing, while maintaining robust
growth. Full specification and swift adoption of supporting measures will be critical to
achieve these objectives.
It is important to strengthen the monetary policy framework. Increasing XR
flexibility and completing the transition to inflation targeting are key. This would permit
consolidating gains in lowering inflation made in recent years.
Further improvements in financial system regulation and supervision, as well as
structural reforms to stimulate inclusive growth, are desirable. Deepening
consolidated, risk-based, and cross-border supervision as well as gradually adopting
Basel III capital and liquidity standards would further buttress financial stability.
Efficiency-enhancing measures to fuel competition, improve the education system, and
eliminate red-tape would help boost trend growth, reduce unemployment, and bolster
external competitiveness.
January 9, 2015
COSTA RICA
2 INTERNATIONAL MONETARY FUND
Approved By K. Srinivisan (WHD) and Masato Miyazaki (SPR)
Discussions took place in San José during October 28–November 10, 2014. The mission comprised L. Figliuoli (Head), A. Ivanova, J. Puig, L. Erickson, J. Wong (all WHD), J. Restrepo (ICD), and M. Garza (Regional Resident Representative). K. Srinivasan (WHD) and Juan Carlos Pacheco (OED) participated in the closing meeting.
CONTENTS
OVERVIEW _________________________________________________________________________________________ 4
RECENT ECONOMIC DEVELOPMENTS AND OUTLOOK _________________________________________ 4
A. Recent Developments ____________________________________________________________________________4
B. Macroeconomic Outlook and Risks _____________________________________________________________ 10
POLICY DISCUSSIONS____________________________________________________________________________ 14
A. Near-term Policy Mix ___________________________________________________________________________ 14
B. Safeguarding Fiscal Sustainability ______________________________________________________________ 15
C. Improving the Monetary and Exchange Rate Policy Framework ________________________________ 21
D. Financial Stability _______________________________________________________________________________ 23
E. Structural Reforms ______________________________________________________________________________ 24
STAFF APPRAISAL________________________________________________________________________________ 25 BOX 1. External Stability Assessment _____________________________________________________________________7 FIGURES 1. Long-Term Fiscal Sustainability _________________________________________________________________ 17
2. Recent Developments and Prospects, Real Sector ______________________________________________ 27
3. Recent Developments, Nominal Exchange Rate and Inflation __________________________________ 28
4. Recent Developments, External Sector __________________________________________________________ 29
5. Recent Developments and Prospects, Fiscal Sector _____________________________________________ 30
6. Recent Developments, Financial Sector _________________________________________________________ 31
7. The Impact of U.S. Monetary Policy Normalization _____________________________________________ 32
8. Labor Market Structure and Inclusive Growth Potential ________________________________________ 33

COSTA RICA
INTERNATIONAL MONETARY FUND 3
TABLES 1. Extent of Preparedness for Transitioning to Greater Exchange Rate Flexibility _________________ 22
2a. Selected Social and Economic Indicators, Baseline Scenario, Partial Fiscal Adjustment _______ 34
2b. Selected Social and Economic Indicators, Full Fiscal Adjustment Scenario ____________________ 35
3. Balance of Payments, Baseline Scenario, Partial Fiscal Adjustment _____________________________ 36
4a. Central Government Balance, Baseline Scenario, Partial Fiscal Adjustment ____________________ 37
4b. Central Government Balance, Full Fiscal Adjustment Scenario ________________________________ 38
5a. Summary Operations of the Central Government, GFSM 2001 Classification, Baseline Scenario,
Partial Fiscal Adjustment __________________________________________________________________ 39
5b. Summary Operations of the Central Government, GFSM 2001 Classification,
Full Fiscal Adjustment Scenario ___________________________________________________________ 40
6a. Consolidated Public Sector Operations, Baseline Scenario, Partial Fiscal Adjustment _________ 41
6b. Consolidated Public Sector Operations, Full Fiscal Adjustment Scenario ______________________ 42
7a. Summary Operations of the Consolidated Public Sector, GFSM 2001 Classification,
Baseline Scenario, Partial Fiscal Adjustment ______________________________________________ 43
7b. Summary Operations of the Consolidated Public Sector, GFSM 2001 Classification,
Full Fiscal Adjustment Scenario ___________________________________________________________ 44
8. Public Sector Debt, Baseline Scenario, Partial Fiscal Adjustment ________________________________ 45
9. Monetary Survey, Baseline Scenario, Partial Fiscal Adjustment _________________________________ 46
10a. Medium-Term Framework, Baseline Scenario, Partial Fiscal Adjustment _____________________ 47
10b. Medium-Term Framework, Full Fiscal Adjustment Scenario __________________________________ 48
11. Banking Sector Indicators _____________________________________________________________________ 49 ANNEXES I. Financial System Assessment Program (FSAP) Main Pending Recommendations (2008) ________ 50
II. Public Debt Sustainability Analysis ______________________________________________________________ 51
III. External Debt Sustainability Assessment _______________________________________________________ 61 APPENDIX I. Press Release ____________________________________________________________________________________ 67
COSTA RICA
4 INTERNATIONAL MONETARY FUND
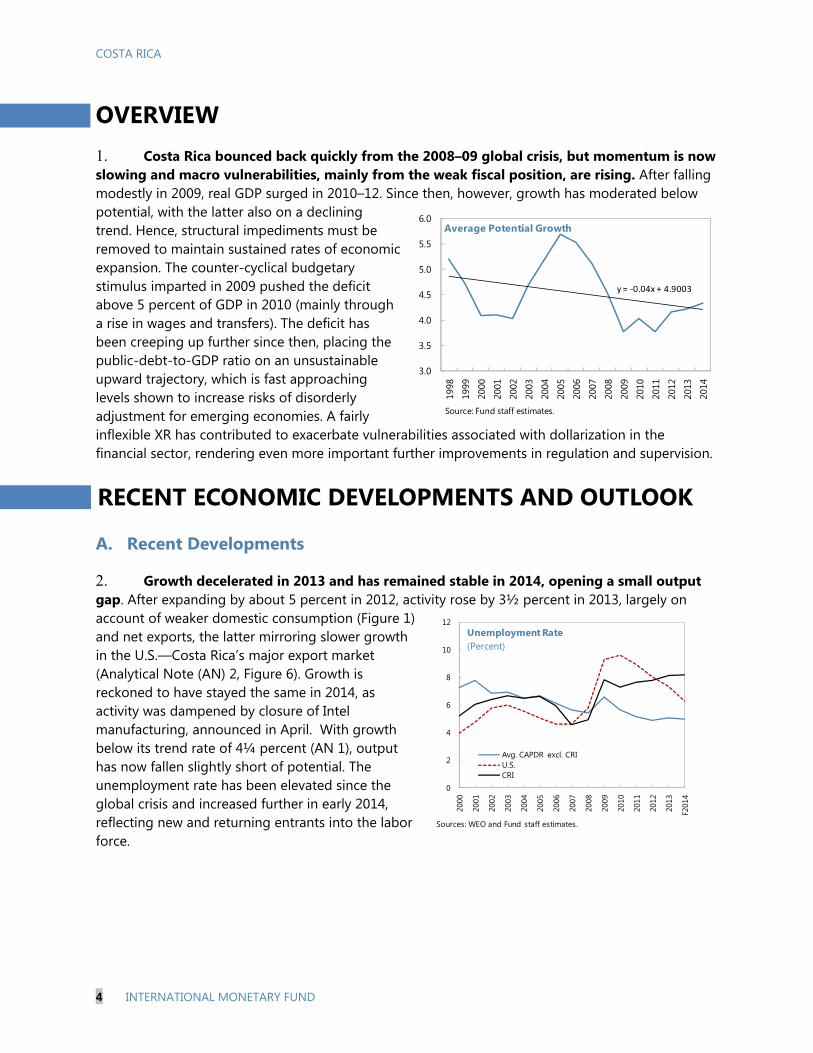
OVERVIEW 1. Costa Rica bounced back quickly from the 2008–09 global crisis, but momentum is now slowing and macro vulnerabilities, mainly from the weak fiscal position, are rising. After falling modestly in 2009, real GDP surged in 2010–12. Since then, however, growth has moderated below potential, with the latter also on a declining trend. Hence, structural impediments must be removed to maintain sustained rates of economic expansion. The counter-cyclical budgetary stimulus imparted in 2009 pushed the deficit above 5 percent of GDP in 2010 (mainly through a rise in wages and transfers). The deficit has been creeping up further since then, placing the public-debt-to-GDP ratio on an unsustainable upward trajectory, which is fast approaching levels shown to increase risks of disorderly adjustment for emerging economies. A fairly inflexible XR has contributed to exacerbate vulnerabilities associated with dollarization in the financial sector, rendering even more important further improvements in regulation and supervision.
RECENT ECONOMIC DEVELOPMENTS AND OUTLOOK
A. Recent Developments
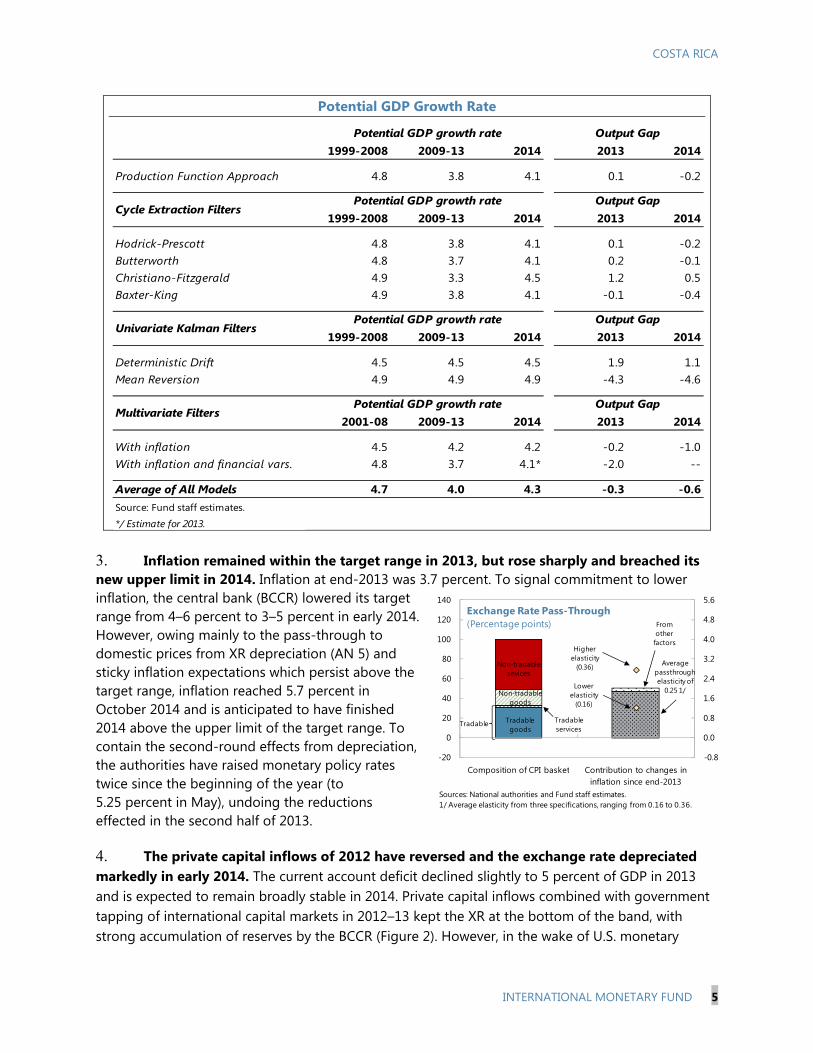
2. Growth decelerated in 2013 and has remained stable in 2014, opening a small output gap. After expanding by about 5 percent in 2012, activity rose by 3½ percent in 2013, largely on account of weaker domestic consumption (Figure 1) and net exports, the latter mirroring slower growth in the U.S.—Costa Rica’s major export market (Analytical Note (AN) 2, Figure 6). Growth is reckoned to have stayed the same in 2014, as activity was dampened by closure of Intel manufacturing, announced in April. With growth below its trend rate of 4¼ percent (AN 1), output has now fallen slightly short of potential. The unemployment rate has been elevated since the global crisis and increased further in early 2014, reflecting new and returning entrants into the labor force.
y = -0.04x + 4.9003
3.0
3.5
4.0
4.5
5.0
5.5
6.0
1998
1999
2000
2001
2002
2003
2004
2005
2006
2007
2008
2009
2010
2011
2012
2013
2014
Average Potential Growth
Source: Fund staff estimates.
0
2
4
6
8
10
12
2000
2001
2002
2003
2004
2005
2006
2007
2008
2009
2010
2011
2012
2013
F201
4
Avg. CAPDR excl. CRIU.S.CRI
Unemployment Rate(Percent)
Sources: WEO and Fund staff estimates.
COSTA RICA
INTERNATIONAL MONETARY FUND 5
Potential GDP Growth Rate
3. Inflation remained within the target range in 2013, but rose sharply and breached its new upper limit in 2014. Inflation at end-2013 was 3.7 percent. To signal commitment to lower inflation, the central bank (BCCR) lowered its target range from 4–6 percent to 3–5 percent in early 2014. However, owing mainly to the pass-through to domestic prices from XR depreciation (AN 5) and sticky inflation expectations which persist above the target range, inflation reached 5.7 percent in October 2014 and is anticipated to have finished 2014 above the upper limit of the target range. To contain the second-round effects from depreciation, the authorities have raised monetary policy rates twice since the beginning of the year (to 5.25 percent in May), undoing the reductions effected in the second half of 2013.
4. The private capital inflows of 2012 have reversed and the exchange rate depreciated markedly in early 2014. The current account deficit declined slightly to 5 percent of GDP in 2013 and is expected to remain broadly stable in 2014. Private capital inflows combined with government tapping of international capital markets in 2012–13 kept the XR at the bottom of the band, with strong accumulation of reserves by the BCCR (Figure 2). However, in the wake of U.S. monetary
1999-2008 2009-13 2014 2013 2014
Production Function Approach 4.8 3.8 4.1 0.1 -0.2
1999-2008 2009-13 2014 2013 2014
Hodrick-Prescott 4.8 3.8 4.1 0.1 -0.2Butterworth 4.8 3.7 4.1 0.2 -0.1Christiano-Fitzgerald 4.9 3.3 4.5 1.2 0.5Baxter-King 4.9 3.8 4.1 -0.1 -0.4
1999-2008 2009-13 2014 2013 2014
Deterministic Drift 4.5 4.5 4.5 1.9 1.1Mean Reversion 4.9 4.9 4.9 -4.3 -4.6
2001-08 2009-13 2014 2013 2014
With inflation 4.5 4.2 4.2 -0.2 -1.0With inflation and financial vars. 4.8 3.7 4.1* -2.0 --
Average of All Models 4.7 4.0 4.3 -0.3 -0.6Source: Fund staff estimates.
*/ Estimate for 2013.
Output Gap
Output Gap
Output Gap
Multivariate FiltersPotential GDP growth rate Output Gap
Cycle Extraction FiltersPotential GDP growth rate
Univariate Kalman FiltersPotential GDP growth rate
Potential GDP growth rate
-0.8
0.0
0.8
1.6
2.4
3.2
4.0
4.8
5.6
-20
0
20
40
60
80
100
120
140
Composition of CPI basket Contribution to changes in inflation since end-2013
Exchange Rate Pass-Through(Percentage points)
Sources: National authorities and Fund staff estimates.1/ Average elasticity from three specifications, ranging from 0.16 to 0.36.
Non-tradable goods
Tradable services
Tradable goods
Tradable
Higherelasticity
(0.36)
Lower elasticity
(0.16)
Non-tradable sevices
Averagepassthrough elasticity of
0.25 1/
Fromother
factors
COSTA RICA
6 INTERNATIONAL MONETARY FUND
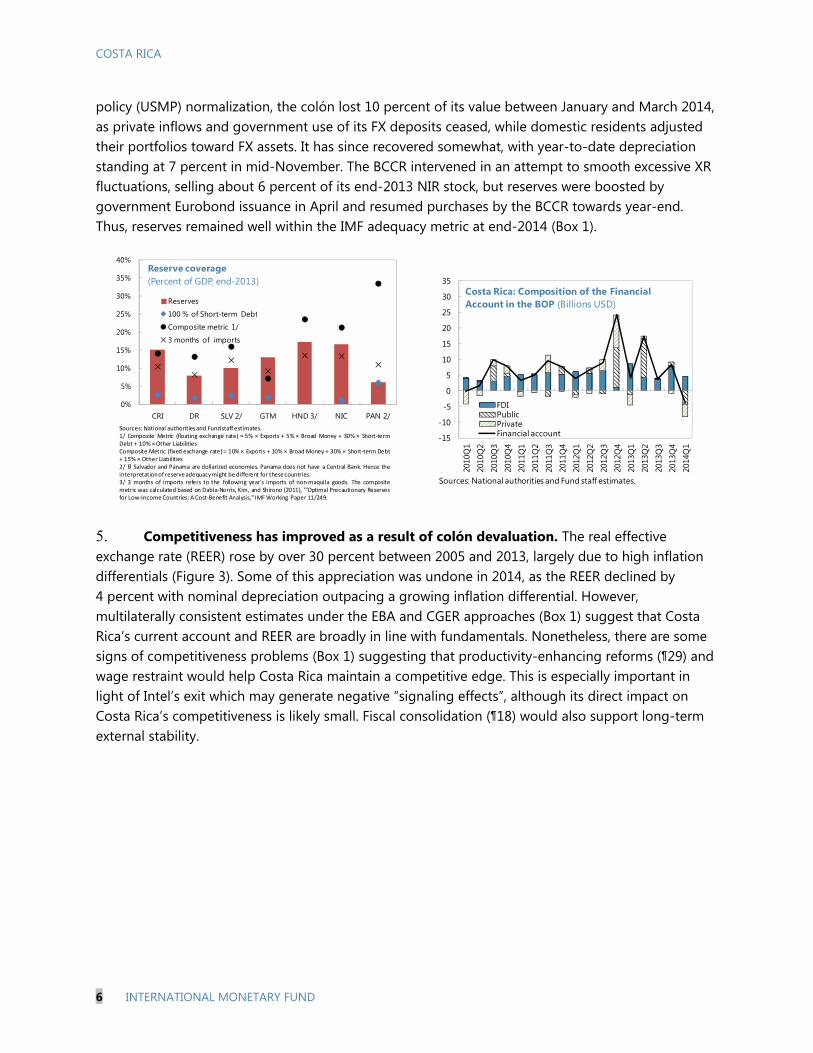
policy (USMP) normalization, the colón lost 10 percent of its value between January and March 2014, as private inflows and government use of its FX deposits ceased, while domestic residents adjusted their portfolios toward FX assets. It has since recovered somewhat, with year-to-date depreciation standing at 7 percent in mid-November. The BCCR intervened in an attempt to smooth excessive XR fluctuations, selling about 6 percent of its end-2013 NIR stock, but reserves were boosted by government Eurobond issuance in April and resumed purchases by the BCCR towards year-end. Thus, reserves remained well within the IMF adequacy metric at end-2014 (Box 1).
5. Competitiveness has improved as a result of colón devaluation. The real effective exchange rate (REER) rose by over 30 percent between 2005 and 2013, largely due to high inflation differentials (Figure 3). Some of this appreciation was undone in 2014, as the REER declined by 4 percent with nominal depreciation outpacing a growing inflation differential. However, multilaterally consistent estimates under the EBA and CGER approaches (Box 1) suggest that Costa Rica’s current account and REER are broadly in line with fundamentals. Nonetheless, there are some signs of competitiveness problems (Box 1) suggesting that productivity-enhancing reforms (¶29) and wage restraint would help Costa Rica maintain a competitive edge. This is especially important in light of Intel’s exit which may generate negative “signaling effects”, although its direct impact on Costa Rica’s competitiveness is likely small. Fiscal consolidation (¶18) would also support long-term external stability.
0%
5%
10%
15%
20%
25%
30%
35%
40%
CRI DR SLV 2/ GTM HND 3/ NIC PAN 2/
Reserve coverage (Percent of GDP, end-2013)
Reserves
100 % of Short-term Debt
Composite metric 1/
3 months of imports
Sources: National authorities and Fundstaff estimates.1/ Composite Metric (floating exchange rate) = 5% × Exports + 5% × Broad Money + 30% × Short-termDebt + 10% × Other LiabilitiesComposite Metric (fixed exchange rate) = 10% × Exports + 10% × Broad Money + 30% × Short-term Debt+ 15% × Other Liabilities2/ El Salvador and Panama are dollarized economies. Panama does not have a Central Bank. Hence theinterpretationof reserve adequacymight be different for these countries.3/ 3 months of imports refers to the following year's imports of non-maquila goods. The compositemetric was calculated based on Dabla-Norris, Kim, and Shirono (2011), '"Optimal Precautionary Reservesfor Low-Income Countries: A Cost-Benefit Analysis," IMF Working Paper 11/249.
-15
-10
-5
0
5
10
15
20
25
30
35
2010
Q1
2010
Q2
2010
Q3
2010
Q4
2011
Q1
2011
Q2
2011
Q3
2011
Q4
2012
Q1
2012
Q2
2012
Q3
2012
Q4
2013
Q1
2013
Q2
2013
Q3
2013
Q4
2014
Q1
FDIPublicPrivateFinancial account
Costa Rica: Composition of the Financial Account in the BOP (Billions USD)
Sources: National authorities and Fund staff estimates.
COSTA RICA
INTERNATIONAL MONETARY FUND 7
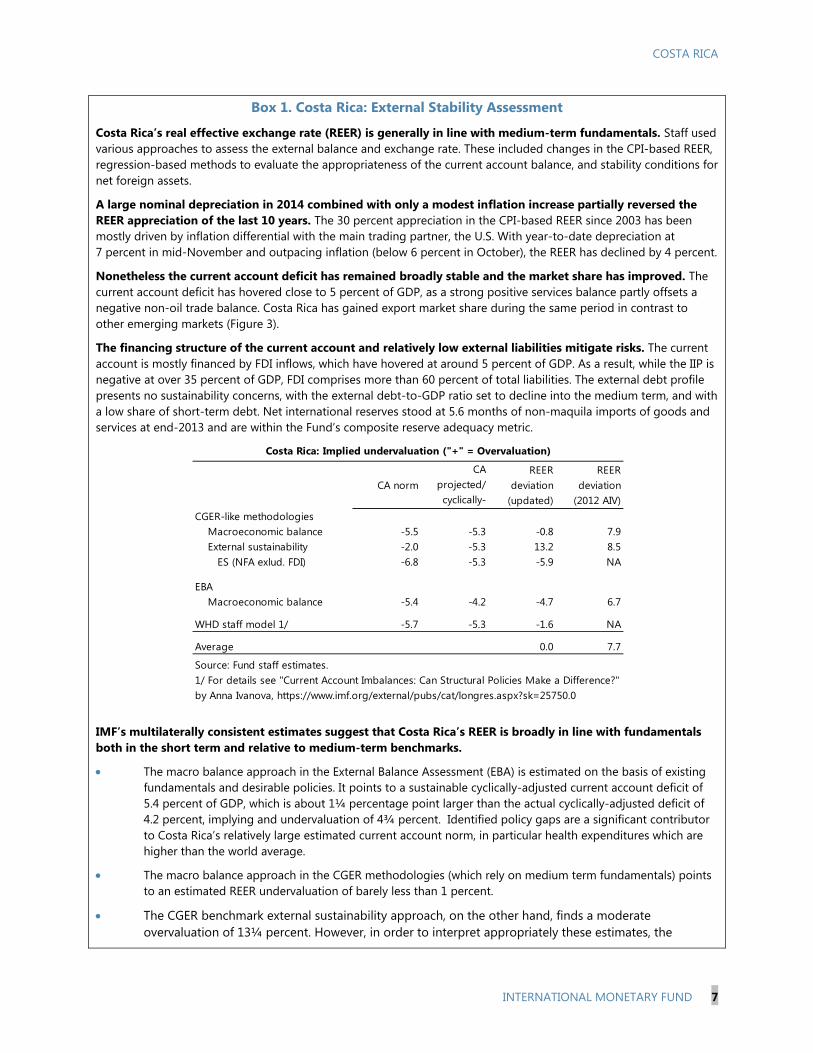
Box 1. Costa Rica: External Stability Assessment
Costa Rica’s real effective exchange rate (REER) is generally in line with medium-term fundamentals. Staff used various approaches to assess the external balance and exchange rate. These included changes in the CPI-based REER, regression-based methods to evaluate the appropriateness of the current account balance, and stability conditions for net foreign assets.
A large nominal depreciation in 2014 combined with only a modest inflation increase partially reversed the REER appreciation of the last 10 years. The 30 percent appreciation in the CPI-based REER since 2003 has been mostly driven by inflation differential with the main trading partner, the U.S. With year-to-date depreciation at 7 percent in mid-November and outpacing inflation (below 6 percent in October), the REER has declined by 4 percent.
Nonetheless the current account deficit has remained broadly stable and the market share has improved. The current account deficit has hovered close to 5 percent of GDP, as a strong positive services balance partly offsets a negative non-oil trade balance. Costa Rica has gained export market share during the same period in contrast to other emerging markets (Figure 3).
The financing structure of the current account and relatively low external liabilities mitigate risks. The current account is mostly financed by FDI inflows, which have hovered at around 5 percent of GDP. As a result, while the IIP is negative at over 35 percent of GDP, FDI comprises more than 60 percent of total liabilities. The external debt profile presents no sustainability concerns, with the external debt-to-GDP ratio set to decline into the medium term, and with a low share of short-term debt. Net international reserves stood at 5.6 months of non-maquila imports of goods and services at end-2013 and are within the Fund’s composite reserve adequacy metric.
IMF’s multilaterally consistent estimates suggest that Costa Rica’s REER is broadly in line with fundamentals both in the short term and relative to medium-term benchmarks.
The macro balance approach in the External Balance Assessment (EBA) is estimated on the basis of existing fundamentals and desirable policies. It points to a sustainable cyclically-adjusted current account deficit of 5.4 percent of GDP, which is about 1¼ percentage point larger than the actual cyclically-adjusted deficit of 4.2 percent, implying and undervaluation of 4¾ percent. Identified policy gaps are a significant contributor to Costa Rica’s relatively large estimated current account norm, in particular health expenditures which are higher than the world average.
The macro balance approach in the CGER methodologies (which rely on medium term fundamentals) points to an estimated REER undervaluation of barely less than 1 percent.
The CGER benchmark external sustainability approach, on the other hand, finds a moderate overvaluation of 13¼ percent. However, in order to interpret appropriately these estimates, the
CA normCA
projected/ cyclically-
REER deviation
(updated)
REER deviation
(2012 AIV)CGER-like methodologies Macroeconomic balance -5.5 -5.3 -0.8 7.9 External sustainability -2.0 -5.3 13.2 8.5 ES (NFA exlud. FDI) -6.8 -5.3 -5.9 NA
EBA Macroeconomic balance -5.4 -4.2 -4.7 6.7
WHD staff model 1/ -5.7 -5.3 -1.6 NA
Average 0.0 7.7
Source: Fund staff estimates.1/ For details see "Current Account Imbalances: Can Structural Policies Make a Difference?" by Anna Ivanova, https://www.imf.org/external/pubs/cat/longres.aspx?sk=25750.0
Costa Rica: Implied undervaluation ("+" = Overvaluation)
COSTA RICA
8 INTERNATIONAL MONETARY FUND
Box 1. Costa Rica: External Stability Assessment (concluded)
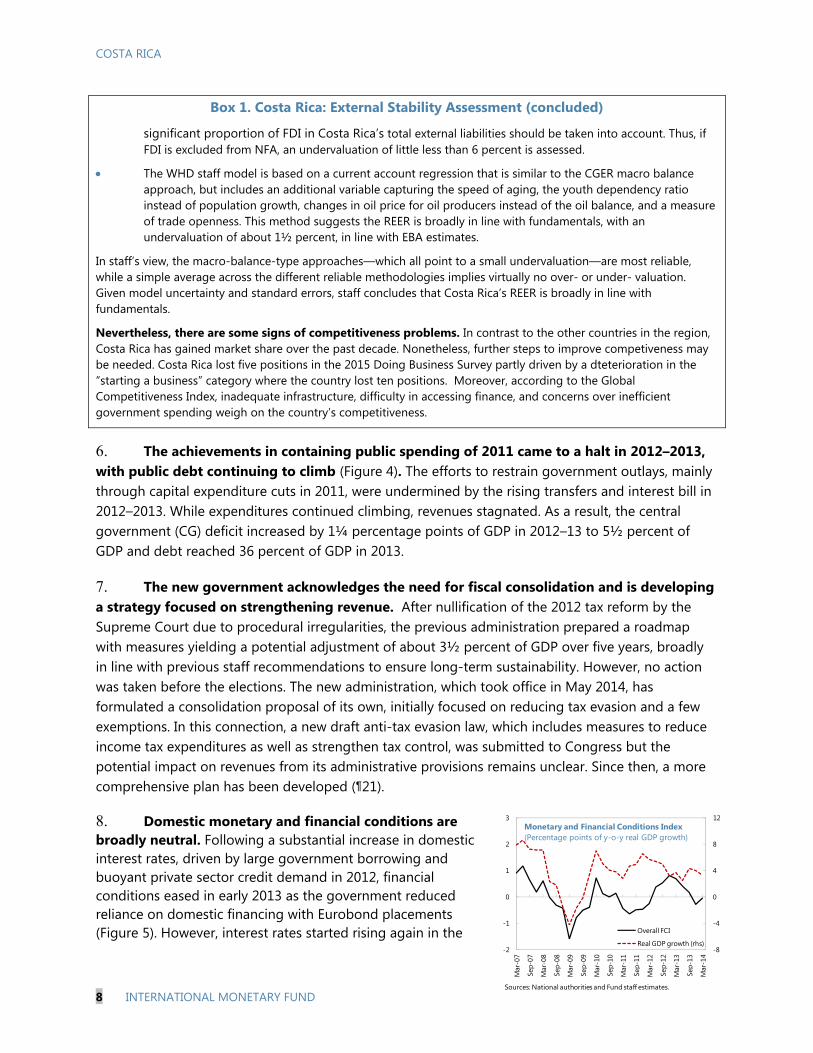
significant proportion of FDI in Costa Rica’s total external liabilities should be taken into account. Thus, if FDI is excluded from NFA, an undervaluation of little less than 6 percent is assessed.
The WHD staff model is based on a current account regression that is similar to the CGER macro balance approach, but includes an additional variable capturing the speed of aging, the youth dependency ratio instead of population growth, changes in oil price for oil producers instead of the oil balance, and a measure of trade openness. This method suggests the REER is broadly in line with fundamentals, with an undervaluation of about 1½ percent, in line with EBA estimates.
In staff’s view, the macro-balance-type approaches—which all point to a small undervaluation—are most reliable, while a simple average across the different reliable methodologies implies virtually no over- or under- valuation. Given model uncertainty and standard errors, staff concludes that Costa Rica’s REER is broadly in line with fundamentals.
Nevertheless, there are some signs of competitiveness problems. In contrast to the other countries in the region, Costa Rica has gained market share over the past decade. Nonetheless, further steps to improve competiveness may be needed. Costa Rica lost five positions in the 2015 Doing Business Survey partly driven by a dteterioration in the “starting a business” category where the country lost ten positions. Moreover, according to the Global Competitiveness Index, inadequate infrastructure, difficulty in accessing finance, and concerns over inefficient government spending weigh on the country’s competitiveness.
6. The achievements in containing public spending of 2011 came to a halt in 2012–2013, with public debt continuing to climb (Figure 4). The efforts to restrain government outlays, mainly through capital expenditure cuts in 2011, were undermined by the rising transfers and interest bill in 2012–2013. While expenditures continued climbing, revenues stagnated. As a result, the central government (CG) deficit increased by 1¼ percentage points of GDP in 2012–13 to 5½ percent of GDP and debt reached 36 percent of GDP in 2013.
7. The new government acknowledges the need for fiscal consolidation and is developing a strategy focused on strengthening revenue. After nullification of the 2012 tax reform by the Supreme Court due to procedural irregularities, the previous administration prepared a roadmap with measures yielding a potential adjustment of about 3½ percent of GDP over five years, broadly in line with previous staff recommendations to ensure long-term sustainability. However, no action was taken before the elections. The new administration, which took office in May 2014, has formulated a consolidation proposal of its own, initially focused on reducing tax evasion and a few exemptions. In this connection, a new draft anti-tax evasion law, which includes measures to reduce income tax expenditures as well as strengthen tax control, was submitted to Congress but the potential impact on revenues from its administrative provisions remains unclear. Since then, a more comprehensive plan has been developed (¶21).
8. Domestic monetary and financial conditions are broadly neutral. Following a substantial increase in domestic interest rates, driven by large government borrowing and buoyant private sector credit demand in 2012, financial conditions eased in early 2013 as the government reduced reliance on domestic financing with Eurobond placements (Figure 5). However, interest rates started rising again in the
-8
-4
0
4
8
12
-2
-1
0
1
2
3
Mar
-07
Sep-
07
Mar
-08
Sep-
08
Mar
-09
Sep-
09
Mar
-10
Sep-
10
Mar
-11
Sep-
11
Mar
-12
Sep-
12
Mar
-13
Sep-
13
Mar
-14
Overall FCI
Real GDP growth (rhs)
Sources: National authorities and Fund staff estimates.
Monetary and Financial Conditions Index(Percentage points of y-o-y real GDP growth)
COSTA RICA
INTERNATIONAL MONETARY FUND 9
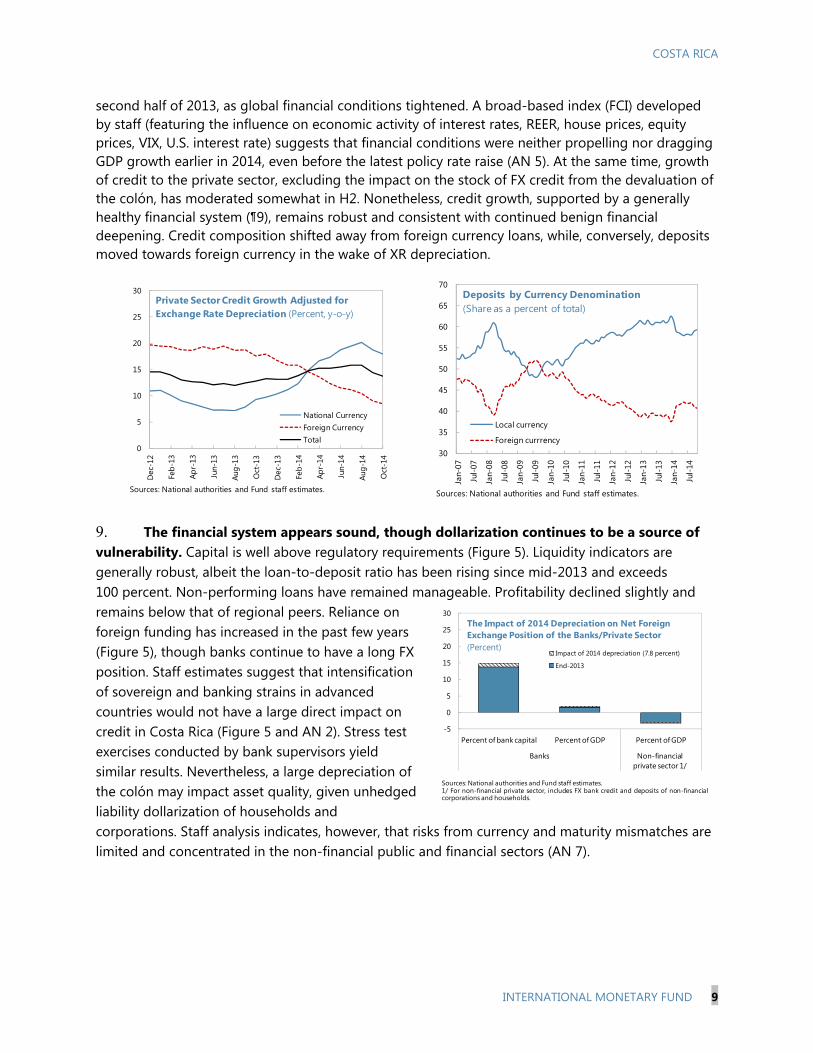
second half of 2013, as global financial conditions tightened. A broad-based index (FCI) developed by staff (featuring the influence on economic activity of interest rates, REER, house prices, equity prices, VIX, U.S. interest rate) suggests that financial conditions were neither propelling nor dragging GDP growth earlier in 2014, even before the latest policy rate raise (AN 5). At the same time, growth of credit to the private sector, excluding the impact on the stock of FX credit from the devaluation of the colón, has moderated somewhat in H2. Nonetheless, credit growth, supported by a generally healthy financial system (¶9), remains robust and consistent with continued benign financial deepening. Credit composition shifted away from foreign currency loans, while, conversely, deposits moved towards foreign currency in the wake of XR depreciation.
9. The financial system appears sound, though dollarization continues to be a source of vulnerability. Capital is well above regulatory requirements (Figure 5). Liquidity indicators are generally robust, albeit the loan-to-deposit ratio has been rising since mid-2013 and exceeds 100 percent. Non-performing loans have remained manageable. Profitability declined slightly and remains below that of regional peers. Reliance on foreign funding has increased in the past few years (Figure 5), though banks continue to have a long FX position. Staff estimates suggest that intensification of sovereign and banking strains in advanced countries would not have a large direct impact on credit in Costa Rica (Figure 5 and AN 2). Stress test exercises conducted by bank supervisors yield similar results. Nevertheless, a large depreciation of the colón may impact asset quality, given unhedged liability dollarization of households and corporations. Staff analysis indicates, however, that risks from currency and maturity mismatches are limited and concentrated in the non-financial public and financial sectors (AN 7).
0
5
10
15
20
25
30
Dec
-12
Feb-
13
Apr-
13
Jun-
13
Aug-
13
Oct
-13
Dec
-13
Feb-
14
Apr-
14
Jun-
14
Aug-
14
Oct
-14
National CurrencyForeign CurrencyTotal
Private Sector Credit Growth Adjusted for Exchange Rate Depreciation (Percent, y-o-y)
Sources: National authorities and Fund staff estimates.
30
35
40
45
50
55
60
65
70
Jan-
07
Jul-0
7
Jan-
08
Jul-0
8
Jan-
09
Jul-0
9
Jan-
10
Jul-1
0
Jan-
11
Jul-1
1
Jan-
12
Jul-1
2
Jan-
13
Jul-1
3
Jan-
14
Jul-1
4
Local currency
Foreign currrency
Deposits by Currency Denomination (Share as a percent of total)
Sources: National authorities and Fund staff estimates.
-5
0
5
10
15
20
25
30
Percent of bank capital Percent of GDP Percent of GDP
Banks Non-financial private sector 1/
Impact of 2014 depreciation (7.8 percent)
End-2013
Sources: National authorities and Fund staff estimates.1/ For non-financial private sector, includes FX bank credit and deposits of non-financialcorporations and households.
The Impact of 2014 Depreciation on Net Foreign Exchange Position of the Banks/Private Sector(Percent)
COSTA RICA
10 INTERNATIONAL MONETARY FUND
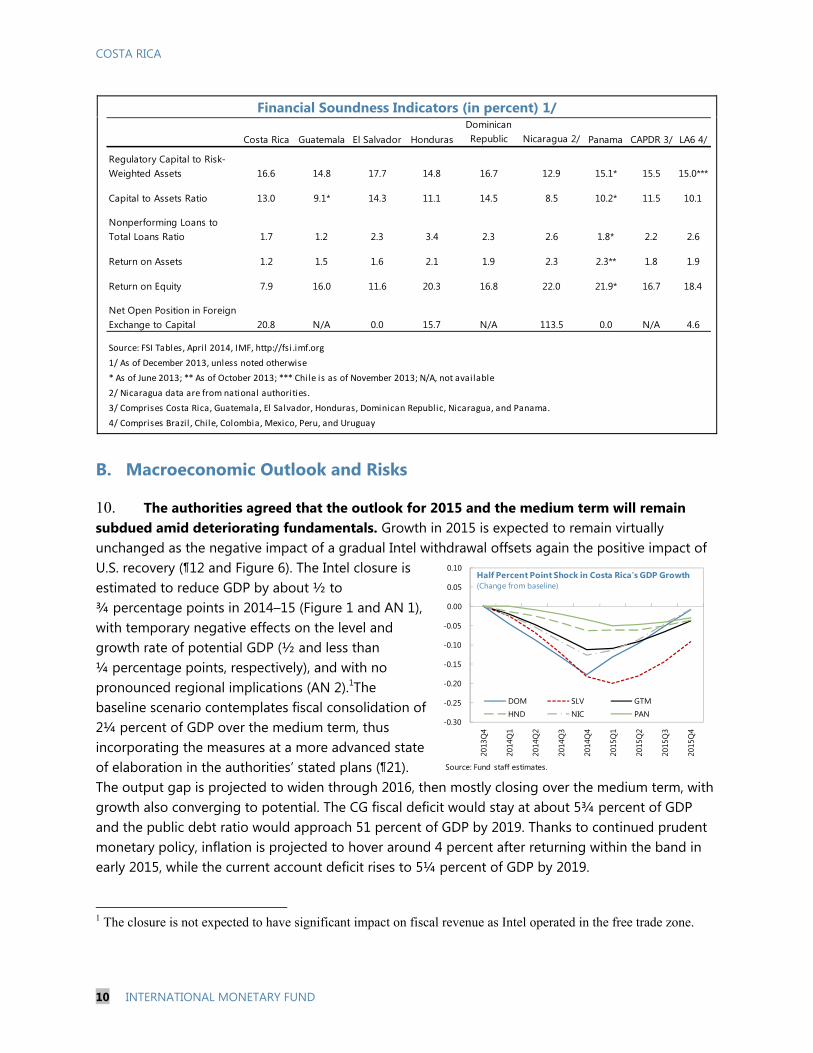
Financial Soundness Indicators (in percent) 1/
B. Macroeconomic Outlook and Risks
10. The authorities agreed that the outlook for 2015 and the medium term will remain subdued amid deteriorating fundamentals. Growth in 2015 is expected to remain virtually unchanged as the negative impact of a gradual Intel withdrawal offsets again the positive impact of U.S. recovery (¶12 and Figure 6). The Intel closure is estimated to reduce GDP by about ½ to ¾ percentage points in 2014–15 (Figure 1 and AN 1), with temporary negative effects on the level and growth rate of potential GDP (½ and less than ¼ percentage points, respectively), and with no pronounced regional implications (AN 2).1The baseline scenario contemplates fiscal consolidation of 2¼ percent of GDP over the medium term, thus incorporating the measures at a more advanced state of elaboration in the authorities’ stated plans (¶21). The output gap is projected to widen through 2016, then mostly closing over the medium term, with growth also converging to potential. The CG fiscal deficit would stay at about 5¾ percent of GDP and the public debt ratio would approach 51 percent of GDP by 2019. Thanks to continued prudent monetary policy, inflation is projected to hover around 4 percent after returning within the band in early 2015, while the current account deficit rises to 5¼ percent of GDP by 2019.
1 The closure is not expected to have significant impact on fiscal revenue as Intel operated in the free trade zone.
Costa Rica Guatemala El Salvador HondurasDominican Republic Nicaragua 2/ Panama CAPDR 3/ LA6 4/
Regulatory Capital to Risk-Weighted Assets 16.6 14.8 17.7 14.8 16.7 12.9 15.1* 15.5 15.0***
Capital to Assets Ratio 13.0 9.1* 14.3 11.1 14.5 8.5 10.2* 11.5 10.1
Nonperforming Loans to Total Loans Ratio 1.7 1.2 2.3 3.4 2.3 2.6 1.8* 2.2 2.6
Return on Assets 1.2 1.5 1.6 2.1 1.9 2.3 2.3** 1.8 1.9
Return on Equity 7.9 16.0 11.6 20.3 16.8 22.0 21.9* 16.7 18.4
Net Open Position in Foreign Exchange to Capital 20.8 N/A 0.0 15.7 N/A 113.5 0.0 N/A 4.6
Source: FSI Tables, April 2014, IMF, http://fsi.imf.org
1/ As of December 2013, unless noted otherwise
* As of June 2013; ** As of October 2013; *** Chile is as of November 2013; N/A, not available
2/ Nicaragua data are from national authorities.
3/ Comprises Costa Rica, Guatemala, El Salvador, Honduras, Dominican Republic, Nicaragua, and Panama.
4/ Comprises Brazil , Chile, Colombia, Mexico, Peru, and Uruguay
-0.30
-0.25
-0.20
-0.15
-0.10
-0.05
0.00
0.05
0.10
2013
Q4
2014
Q1
2014
Q2
2014
Q3
2014
Q4
2015
Q1
2015
Q2
2015
Q3
2015
Q4
DOM SLV GTM
HND NIC PAN
Half Percent Point Shock in Costa Rica's GDP Growth (Change from baseline)
Source: Fund staff estimates.
COSTA RICA
INTERNATIONAL MONETARY FUND 11
11. The authorities also concurred that an alternative scenario incorporating the fiscal adjustment necessary to restore debt sustainability would yield a stronger outlook. According to staff analysis, a total adjustment of about 3¾ percent of GDP would achieve the objective of stabilizing debt with only moderate short-term output costs (¶19). A tighter fiscal stance consistent with restoring debt sustainability would mitigate increases in market rates, allow for a more balanced macro policy mix to achieve the inflation target, and reduce the current account deficit.
12. Risks to the outlook are tilted to the downside. Downside risks stem from both global uncertainties and weaknesses in domestic fundamentals (as detailed in the Risk Assessment Matrix):
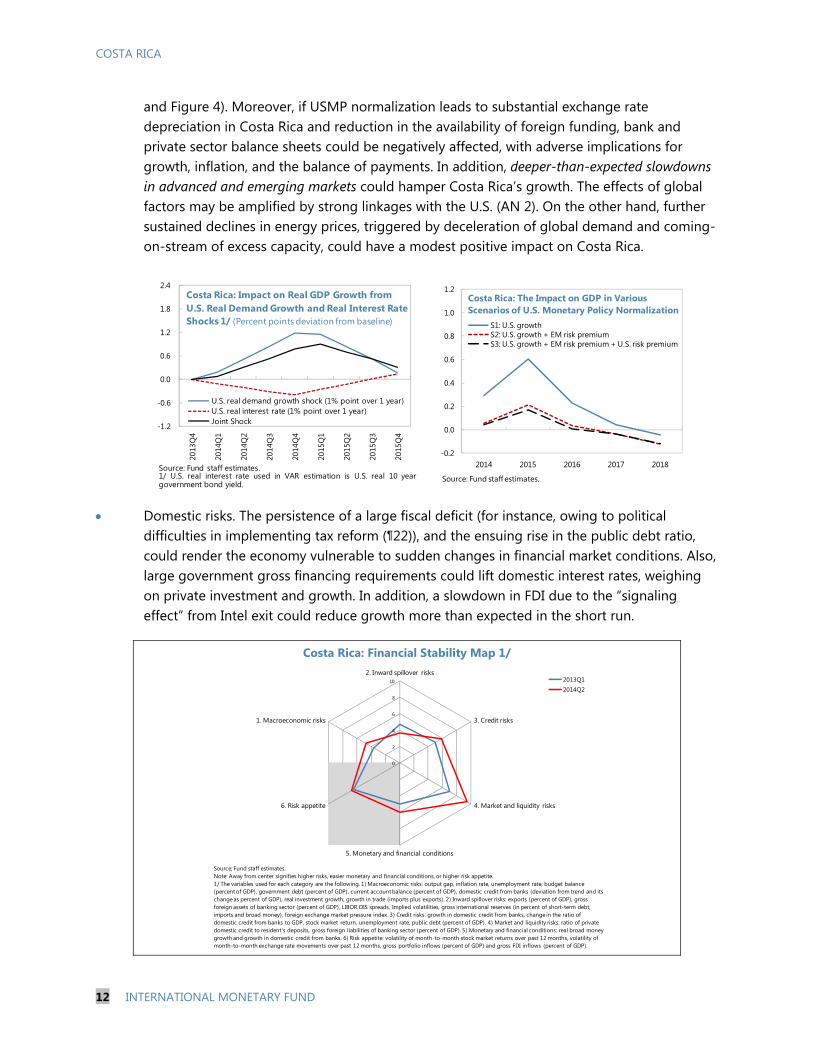
External risks. Concerning faster USMP normalization slightly upside risks prevail, absent pronounced increases in market volatility (Figure 6). Under these conditions, higher U.S. growth would have a positive impact on Costa Rican GDP given its strong trade ties with the U.S. more than offsetting the negative impact of tighter global financial conditions in the short run (AN 2). However, extreme bouts of market volatility could inflict serious damage, especially given Costa Rica’s weak fiscal position, as interest rates may rise abruptly (Figure 6
Costa Rica: Baseline Scenario 1/(In percent of GDP, unless otherwise indicated)
2013 2014 2015 2016 2017 2018 2019Real GDP growth (percent) 3.5 3.6 3.4 4.2 4.5 4.4 4.3Output gap (percent of potential GDP) 0.0 -0.4 -0.9 -0.9 -0.6 -0.5 -0.4CPI (percent, end-of-period) 3.7 5.6 4.5 4.0 4.0 4.0 4.0Current account balance -4.9 -5.0 -4.7 -4.7 -4.9 -5.0 -5.2Central government fiscal balance -5.6 -6.2 -6.0 -5.5 -5.3 -5.5 -5.7Structural primary balance -2.8 -3.0 -2.3 -1.8 -1.4 -1.4 -1.4Structural overall balance -5.6 -6.1 -5.8 -5.3 -5.2 -5.4 -5.7Central government debt 36.0 39.4 42.3 44.6 46.5 48.5 50.6
Source: Fund staff estimates.1/ The baseline scenario includes fiscal consolidation measures of about 2¼ percent of GDP, partly offset by a projected underlying deterioration in the primary balance mainly driven by the constitutionally mandated increase in education expenditure.
Costa Rica: Full Fiscal Adjustment Scenario 1/(In percent of GDP, unless otherwise indicated)
2013 2014 2015 2016 2017 2018 2019Real GDP growth (percent) 3.5 3.6 3.3 4.1 4.7 4.5 4.4Output gap (percent of potential GDP) 0.0 -0.4 -1.0 -1.1 -0.6 -0.3 -0.2CPI (percent, end-of-period) 3.7 5.6 4.4 3.9 4.0 4.0 4.0Current account balance -4.9 -5.0 -4.6 -4.5 -4.5 -4.4 -4.7Central government fiscal balance -5.6 -6.2 -5.6 -4.5 -3.8 -3.6 -3.4Structural primary balance -2.8 -3.0 -2.1 -1.0 -0.1 0.2 0.3Structural overall balance -5.6 -6.1 -5.4 -4.3 -3.7 -3.5 -3.4Central government debt 36.0 39.4 41.9 43.2 43.5 43.7 43.8
Source: Fund staff estimates.1/ Includes measures as in the baseline scenario and additional measures of 1½ percent of GDP.
COSTA RICA
12 INTERNATIONAL MONETARY FUND
and Figure 4). Moreover, if USMP normalization leads to substantial exchange rate depreciation in Costa Rica and reduction in the availability of foreign funding, bank and private sector balance sheets could be negatively affected, with adverse implications for growth, inflation, and the balance of payments. In addition, deeper-than-expected slowdowns in advanced and emerging markets could hamper Costa Rica’s growth. The effects of global factors may be amplified by strong linkages with the U.S. (AN 2). On the other hand, further sustained declines in energy prices, triggered by deceleration of global demand and coming-on-stream of excess capacity, could have a modest positive impact on Costa Rica.
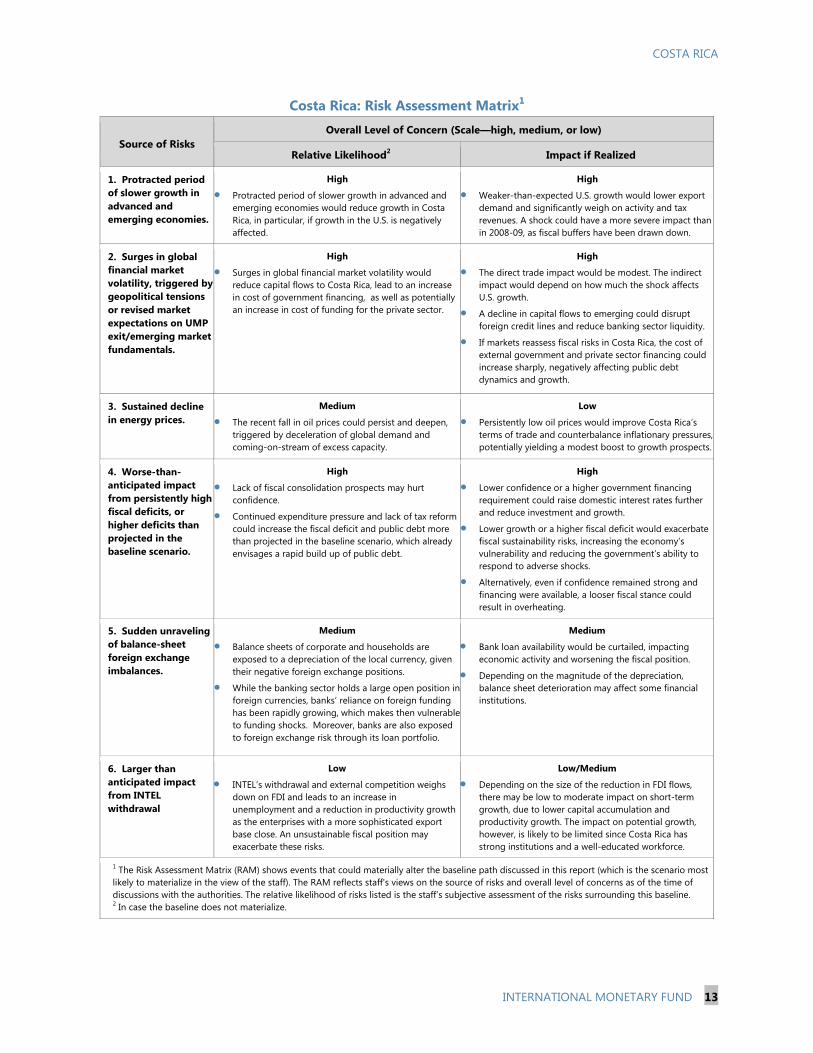
Domestic risks. The persistence of a large fiscal deficit (for instance, owing to political difficulties in implementing tax reform (¶22)), and the ensuing rise in the public debt ratio, could render the economy vulnerable to sudden changes in financial market conditions. Also, large government gross financing requirements could lift domestic interest rates, weighing on private investment and growth. In addition, a slowdown in FDI due to the “signaling effect” from Intel exit could reduce growth more than expected in the short run.
Costa Rica: Financial Stability Map 1/
-1.2
-0.6
0.0
0.6
1.2
1.8
2.4
2013
Q4
2014
Q1
2014
Q2
2014
Q3
2014
Q4
2015
Q1
2015
Q2
2015
Q3
2015
Q4
U.S. real demand growth shock (1% point over 1 year)U.S. real interest rate (1% point over 1 year)Joint Shock
Costa Rica: Impact on Real GDP Growth from U.S. Real Demand Growth and Real Interest Rate Shocks 1/ (Percent points deviation from baseline)
Source: Fund staff estimates.1/ U.S. real interest rate used in VAR estimation is U.S. real 10 yeargovernment bond yield.
-0.2
0.0
0.2
0.4
0.6
0.8
1.0
1.2
2014 2015 2016 2017 2018
S1: U.S. growthS2: U.S. growth + EM risk premiumS3: U.S. growth + EM risk premium + U.S. risk premium
Costa Rica: The Impact on GDP in Various Scenarios of U.S. Monetary Policy Normalization
Source: Fund staff estimates.
2. Inward spillover risks
3. Credit risks
4. Market and liquidity risks
5. Monetary and financial conditions
6. Risk appetite
1. Macroeconomic risks
0
2
4
6
8
10 2013Q12014Q2
Source; Fund staff estimates.Note: Away from center signifies higher risks, easier monetary and financial conditions, or higher risk appetite.1/ The variables used for each category are the following. 1) Macroeconomic risks: output gap, inflation rate, unemployment rate, budget balance (percent of GDP), government debt (percent of GDP), current account balance (percent of GDP), domestic credit from banks (deviation from trend and its change as percent of GDP), real investment growth, growth in trade (imports plus exports). 2) Inward spillover risks: exports (percent of GDP), gross foreign assets of banking sector (percent of GDP), LIBOR OIS spreads, Implied volatilities, gross international reserves (in percent of short-term debt, imports and broad money), foreign exchange market pressure index. 3) Credit risks: growth in domestic credit from banks, change in the ratio of domestic credit from banks to GDP, stock market return, unemployment rate, public debt (percent of GDP). 4) Market and liquidity risks: ratio of private domestic credit to resident's deposits, gross foreign liabilities of banking sector (percent of GDP). 5) Monetary and financial conditions: real broad money growth and growth in domestic credit from banks. 6) Risk appetite: volatility of month-to-month stock market returns over past 12 months, volatility of month-to-month exchange rate movements over past 12 months, gross portfolio inflows (percent of GDP) and gross FDI inflows (percent of GDP).
COSTA RICA
INTERNATIONAL MONETARY FUND 13
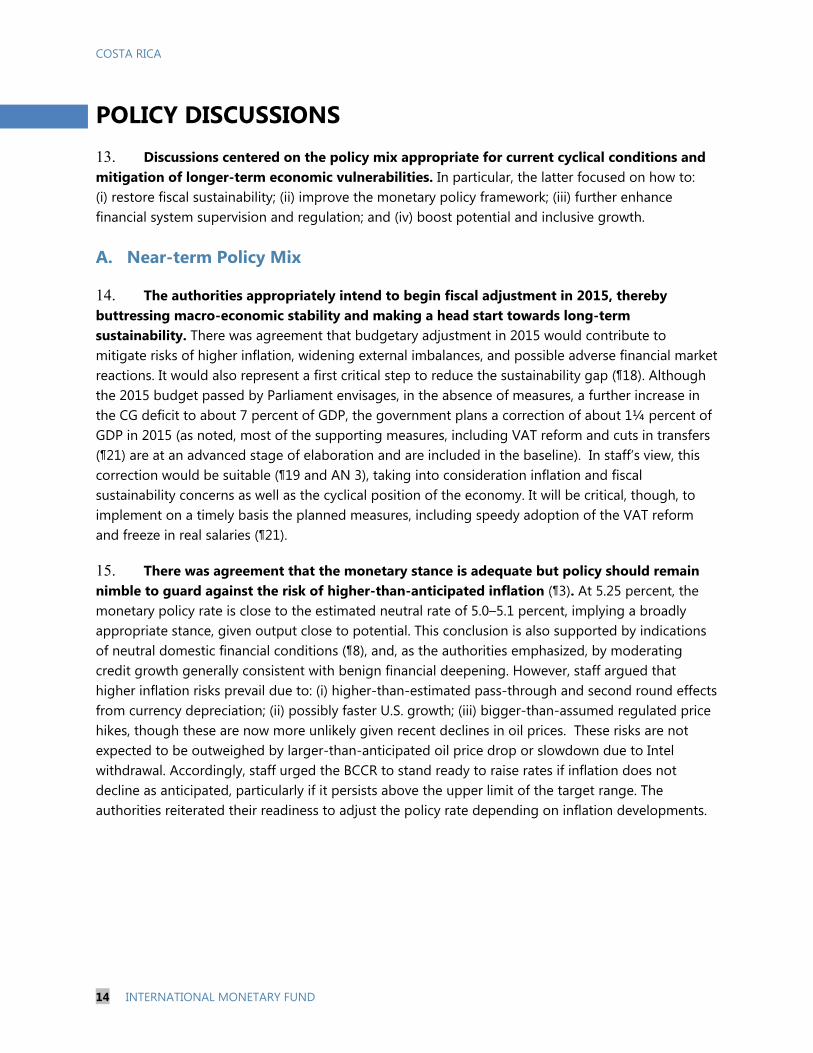
Costa Rica: Risk Assessment Matrix1
Source of Risks
Overall Level of Concern (Scale—high, medium, or low)
Relative Likelihood2 Impact if Realized
1. Protracted period of slower growth in advanced and emerging economies.
High
Protracted period of slower growth in advanced and emerging economies would reduce growth in Costa Rica, in particular, if growth in the U.S. is negatively affected.
High
Weaker-than-expected U.S. growth would lower export demand and significantly weigh on activity and tax revenues. A shock could have a more severe impact than in 2008-09, as fiscal buffers have been drawn down.
2. Surges in global financial market volatility, triggered by geopolitical tensions or revised market expectations on UMP exit/emerging market fundamentals.
High
Surges in global financial market volatility would reduce capital flows to Costa Rica, lead to an increase in cost of government financing, as well as potentially an increase in cost of funding for the private sector.
High
The direct trade impact would be modest. The indirect impact would depend on how much the shock affects U.S. growth.
A decline in capital flows to emerging could disrupt foreign credit lines and reduce banking sector liquidity.
If markets reassess fiscal risks in Costa Rica, the cost of external government and private sector financing could increase sharply, negatively affecting public debt dynamics and growth.
3. Sustained decline in energy prices.
Medium
The recent fall in oil prices could persist and deepen, triggered by deceleration of global demand and coming-on-stream of excess capacity.
Low
Persistently low oil prices would improve Costa Rica’s terms of trade and counterbalance inflationary pressures, potentially yielding a modest boost to growth prospects.
4. Worse-than-anticipated impact from persistently high fiscal deficits, or higher deficits than projected in the baseline scenario.
High
Lack of fiscal consolidation prospects may hurt confidence.
Continued expenditure pressure and lack of tax reform could increase the fiscal deficit and public debt more than projected in the baseline scenario, which already envisages a rapid build up of public debt.
High
Lower confidence or a higher government financing requirement could raise domestic interest rates further and reduce investment and growth.
Lower growth or a higher fiscal deficit would exacerbate fiscal sustainability risks, increasing the economy’s vulnerability and reducing the government’s ability to respond to adverse shocks.
Alternatively, even if confidence remained strong and financing were available, a looser fiscal stance could result in overheating.
5. Sudden unraveling of balance-sheet foreign exchange imbalances.
Medium
Balance sheets of corporate and households are exposed to a depreciation of the local currency, given their negative foreign exchange positions.
While the banking sector holds a large open position in foreign currencies, banks’ reliance on foreign funding has been rapidly growing, which makes then vulnerable to funding shocks. Moreover, banks are also exposed to foreign exchange risk through its loan portfolio.
Medium
Bank loan availability would be curtailed, impacting economic activity and worsening the fiscal position.
Depending on the magnitude of the depreciation, balance sheet deterioration may affect some financial institutions.
6. Larger than anticipated impact from INTEL withdrawal
Low
INTEL’s withdrawal and external competition weighs down on FDI and leads to an increase in unemployment and a reduction in productivity growth as the enterprises with a more sophisticated export base close. An unsustainable fiscal position may exacerbate these risks.
Low/Medium
Depending on the size of the reduction in FDI flows, there may be low to moderate impact on short-term growth, due to lower capital accumulation and productivity growth. The impact on potential growth, however, is likely to be limited since Costa Rica has strong institutions and a well-educated workforce.
1 The Risk Assessment Matrix (RAM) shows events that could materially alter the baseline path discussed in this report (which is the scenario most likely to materialize in the view of the staff). The RAM reflects staff's views on the source of risks and overall level of concerns as of the time of discussions with the authorities. The relative likelihood of risks listed is the staff’s subjective assessment of the risks surrounding this baseline. 2 In case the baseline does not materialize.
COSTA RICA
14 INTERNATIONAL MONETARY FUND
POLICY DISCUSSIONS 13. Discussions centered on the policy mix appropriate for current cyclical conditions and mitigation of longer-term economic vulnerabilities. In particular, the latter focused on how to: (i) restore fiscal sustainability; (ii) improve the monetary policy framework; (iii) further enhance financial system supervision and regulation; and (iv) boost potential and inclusive growth.
A. Near-term Policy Mix
14. The authorities appropriately intend to begin fiscal adjustment in 2015, thereby buttressing macro-economic stability and making a head start towards long-term sustainability. There was agreement that budgetary adjustment in 2015 would contribute to mitigate risks of higher inflation, widening external imbalances, and possible adverse financial market reactions. It would also represent a first critical step to reduce the sustainability gap (¶18). Although the 2015 budget passed by Parliament envisages, in the absence of measures, a further increase in the CG deficit to about 7 percent of GDP, the government plans a correction of about 1¼ percent of GDP in 2015 (as noted, most of the supporting measures, including VAT reform and cuts in transfers (¶21) are at an advanced stage of elaboration and are included in the baseline). In staff’s view, this correction would be suitable (¶19 and AN 3), taking into consideration inflation and fiscal sustainability concerns as well as the cyclical position of the economy. It will be critical, though, to implement on a timely basis the planned measures, including speedy adoption of the VAT reform and freeze in real salaries (¶21).
15. There was agreement that the monetary stance is adequate but policy should remain nimble to guard against the risk of higher-than-anticipated inflation (¶3). At 5.25 percent, the monetary policy rate is close to the estimated neutral rate of 5.0–5.1 percent, implying a broadly appropriate stance, given output close to potential. This conclusion is also supported by indications of neutral domestic financial conditions (¶8), and, as the authorities emphasized, by moderating credit growth generally consistent with benign financial deepening. However, staff argued that higher inflation risks prevail due to: (i) higher-than-estimated pass-through and second round effects from currency depreciation; (ii) possibly faster U.S. growth; (iii) bigger-than-assumed regulated price hikes, though these are now more unlikely given recent declines in oil prices. These risks are not expected to be outweighed by larger-than-anticipated oil price drop or slowdown due to Intel withdrawal. Accordingly, staff urged the BCCR to stand ready to raise rates if inflation does not decline as anticipated, particularly if it persists above the upper limit of the target range. The authorities reiterated their readiness to adjust the policy rate depending on inflation developments.
COSTA RICA
INTERNATIONAL MONETARY FUND 15
Costa Rica: Neutral Interest Rate
B. Safeguarding Fiscal Sustainability
16. The authorities recognized that current fiscal trends are unsustainable in the long term. Without policy action, the CG deficit would be above 9 percent of GDP and debt rise above 60 percent by 2019. Even in the baseline scenario, which incorporates a fiscal adjustment of 2¼ percent of GDP, the CG deficit would persist at about 5¾ percent of GDP by 2019, owing to a mounting interest bill and constitutionally-mandated education spending. Correspondingly, CG debt would grow to 51 percent of GDP by 2019 (from 36 percent of GDP at end-2013), further raising vulnerabilities and potentially eroding the underpinnings of macroeconomic stability.
5.00
5.25
2006-2014 sample
2008-2014 sample
2006-2014 sample
2008-2014 sample
Average
2006-2014 sample
2008-2014 sample
Sources: National authorities and Fund staff estimates.Notes: 1/ All units expressed as percent points unless otherwise stated. 2/ (bps): Basis points
Expected Inflation Mar-2015
Actual Monetary Policy Rate
Method 1/Neutral Real Interest Rate
(NRIR)Neutral Nominal
Interest Rate (NNIR)Nominal Monetary Policy GAP (bps) 2/
-0.8 4.2 -106
0.6 5.6 36
-0.7
Uncovered Interest Parity 0.2 5.2 -6
Expected-Inflation Augmented Taylor Rule
General Equilibrium Model
1.0 6.0 76
0.0 5.0 -22
4.3 -98
0.1 5.1 -12
Costa Rica: Passive Scenario Without Measures 1/(In percent of GDP, unless otherwise indicated)
2013 2014 2015 2016 2017 2018 2019Real GDP growth (percent) 3.5 3.6 3.4 4.2 4.1 4.0 3.9Output gap (percent of potential GDP) 0.0 -0.4 -0.9 -0.9 -1.0 -1.2 -1.5CPI (percent, end-of-period) 3.7 5.6 4.7 4.6 4.5 4.5 4.5Current account balance -4.9 -4.9 -4.9 -5.5 -6.4 -6.8 -7.4Central government fiscal balance -5.6 -6.2 -7.2 -7.4 -8.0 -8.7 -9.4Structural primary balance -2.8 -3.0 -3.4 -3.5 -3.5 -3.4 -3.3Structural overall balance -5.6 -6.1 -7.0 -7.2 -7.8 -8.5 -9.1Central government debt 36.0 39.4 43.5 47.7 52.3 57.2 62.6
Source: Fund staff estimates.1/ This scenario does not include any fiscal adjustment measures, while reflecting the underlying deterioration in the primary balance mainly driven by the constitutionally mandated increase in education expenditure.
COSTA RICA
16 INTERNATIONAL MONETARY FUND
17. The authorities also acknowledged that the pension system’s financial position has to be strengthened in the long run. The pension plan run by the Social Security agency (CCSS) and those of the judiciary and the teachers are actuarially imbalanced. They are projected to turn a cash deficit over the long term due to system maturation and population aging (AN 3). Preliminary projections suggest that an adjustment equivalent to about 1½ percent of GDP would be required to ensure actuarial equilibrium of all pension systems for the next 100 years. The authorities indicated that a joint study (by the CCSS and the Superintendence of Pensions) to be released in 2015 would determine the size the imbalance.
18. There was agreement on the amount of fiscal adjustment needed to stabilize the public debt ratio. In staff’s estimates, fiscal retrenchment amounting to about 3¾ percent of GDP over the medium-term would suffice to stabilize the public debt ratio below levels which are shown to pose risks for macro stability in emerging markets (Annex II). The authorities concurred and intend to consolidate public finances by about 4 percent of GDP over the medium term. The authorities also acknowledged that in the longer run further parametric adjustment would be needed to remedy the actuarial imbalance of the pension system (¶17)—including larger contributions, lower replacement rates, and higher retirement age.
COSTA RICA
INTERNATIONAL MONETARY FUND 17
Figure 1. Costa Rica: Long-Term Fiscal Sustainability (Percent of GDP)
Source: Fund staff estimates and projections. 1/ This path is the baseline through 2019, with a constant primary balance thereafter. 2/ The immediate and gradual adjustment scenarios aim at closing the same initial sustainability gap with consolidation starting in 2015 in both scenarios. The debt stabilizing primary balance is calculated based on medium-term baseline projections of real interest and growth rates that are maintained constant over the projection period in line with the requirements of the optimization model (AN 3). The gap is then measured relative to the 2014 projected fiscal outturn. 3/ The gradual scenario assumes that the authorities place 90 percent weight on the growth objective. Impact of growth is based on fiscal multiplier of 0.3, with a self-correction parameter for the output gap of 0.5, implying that the effect on the output gap of a fiscal adjustment of 1 percent of GDP almost dissipates—is less than 0.1 percent of GDP—in the second year following the adjustment. 4/ The immediate adjustment scenario assumes that the full fiscal adjustment takes place in 2015 and has no impact on growth.
-3.5
-3.0
-2.5
-2.0
-1.5
-1.0
-0.5
0.0
0.5
2013 2018 2023 2028 2033 2038 2043
Baseline 1/
Gradual adjustment 2/ 3/
Immediate adjustment 2/ 4/
Central Government Primary Balance
-12.0
-10.0
-8.0
-6.0
-4.0
-2.0
0.0
2013 2018 2023 2028 2033 2038 2043
Baseline 1/Gradual adjustment 2/ 3/Immediate adjustment 2/ 4/
Central Government Overall Balance
20
30
40
50
60
70
80
90
100
110
2013 2018 2023 2028 2033 2038 2043
Baseline 1/
Gradual adjustment 2/ 3/
Immediate adjustment 2/ 4/
Central Government Debt
COSTA RICA
18 INTERNATIONAL MONETARY FUND
19. The pace of fiscal consolidation should strike a balance between lowering the sustainability gap and limiting any adverse impact on growth. The authorities concurred that it would be appropriate to undertake about one third of the fiscal adjustment in 2015 followed by smaller steps in subsequent years. The proposed deficit reduction path would have only moderate output cost over the forecast period, even if fiscal consolidation were simultaneously undertaken by trading partners (AN 2). Staff cautioned against further postponing fiscal retrenchment, stressing that the longer the delay, the larger will be the improvement in the primary balance required to stabilize the public debt ratio. Officials were aware that failing to deliver on the fiscal consolidation plan would also increase the risk of an abrupt shift in investor sentiment and of acute financial market tensions, thus forcing a disorderly adjustment.
Fiscal Contribution to Growth Under the Recommended Fiscal Path
20. A common stance was also reached on the broad composition of fiscal adjustment. The authorities agreed that about two-thirds of the needed adjustment (or 2½ percent of GDP) had to rely on revenue increases. The emphasis on revenue enhancement was considered appropriate given Costa Rica’s low revenue effort compared to other upper-middle-income countries.
21. Moreover, the supporting measures identified by the government are advisable, though some important steps still need to be fleshed out.
The authorities have readied a legislative proposal to broaden the base of the VAT to include services and basic goods (the latter at a reduced rate), but the bill to reform the income tax (by eliminating some exemptions and moving from schedular to global determination of the tax liability) has not been finalized yet. Most of the measures for reducing expenditures also have to be fully articulated.
Staff acknowledged that major revenue gains may be accrued by reducing tax exemptions and other special treatments (e.g. to enlarge the base of the VAT), but stressed that the substantial budget consolidation required will also demand increases in tax rates over the medium term. Specifically, staff recommended raising the VAT rate from 13 to 15 percent
Domestic Effect
Spillover Effect
Domestic Effect
Spillover Effect
Costa Rica 1.0 -0.4 -0.2 -0.1 1.0 -0.7 -0.5 -0.2of which: - current year -0.5 -0.4 -0.2 -0.4 -0.3 -0.1 - carry over prev. year 0.2 0.1 0.1 -0.3 -0.2 -0.1
PPP weighted average 0.6 -0.2 -0.2 -0.1 0.4 -0.4 -0.3 -0.1Source: Fund staff estimates.
2015 2016
Change in the Fiscal Balance
Total Growth Impact
Of which: Change in the Fiscal Balance
Total Growth Impact
Of which:
-60
-40
-20
0
20
40
60
80
100
-3
-2
-1
0
1
2
3
4
5
Baseline scenario 90% weight on growth 1/
70% weight on growth 1/
Impact on real GDP growth of fiscal adjustment, 2015-19Central government debt, 2019 (rhs)
Growth and Public Debt(Percent)
Sources: National authorities and Fund staff estimates.1/ Gradual adjustment scenarios based on model of fiscal adjustment based onauthorities’ preferences for growth and fiscal objectives.
COSTA RICA
INTERNATIONAL MONETARY FUND 19
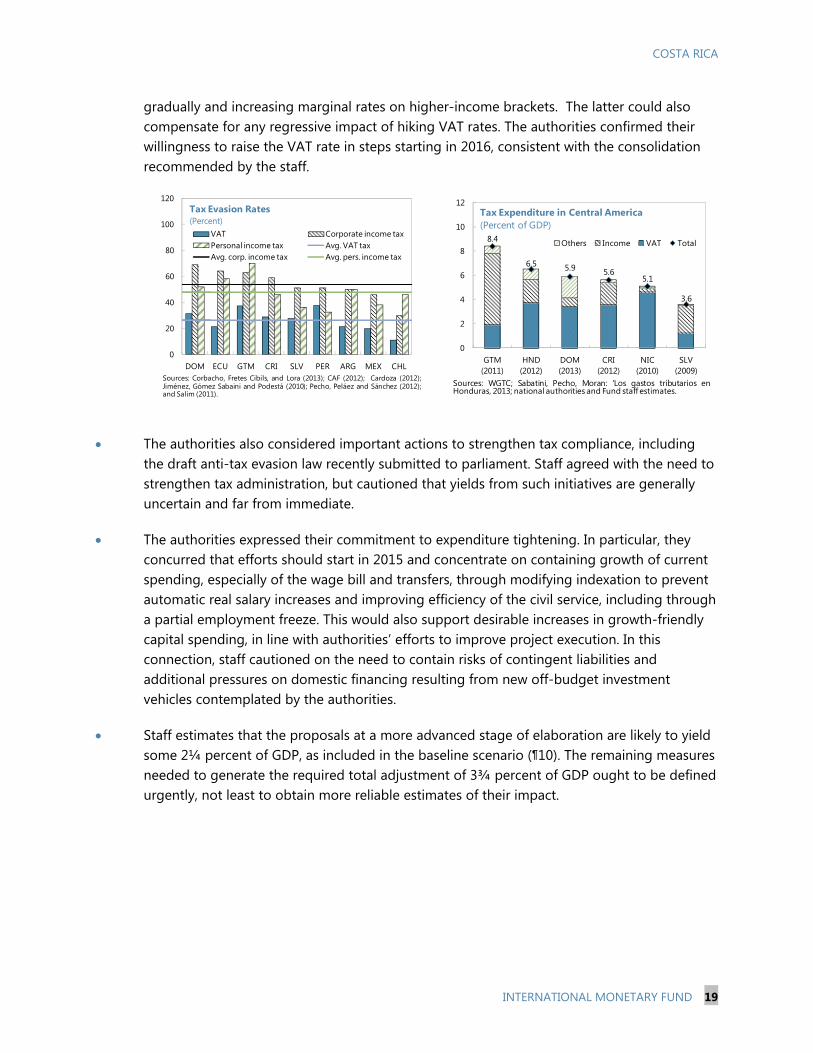
gradually and increasing marginal rates on higher-income brackets. The latter could also compensate for any regressive impact of hiking VAT rates. The authorities confirmed their willingness to raise the VAT rate in steps starting in 2016, consistent with the consolidation recommended by the staff.
The authorities also considered important actions to strengthen tax compliance, including the draft anti-tax evasion law recently submitted to parliament. Staff agreed with the need to strengthen tax administration, but cautioned that yields from such initiatives are generally uncertain and far from immediate.
The authorities expressed their commitment to expenditure tightening. In particular, they concurred that efforts should start in 2015 and concentrate on containing growth of current spending, especially of the wage bill and transfers, through modifying indexation to prevent automatic real salary increases and improving efficiency of the civil service, including through a partial employment freeze. This would also support desirable increases in growth-friendly capital spending, in line with authorities’ efforts to improve project execution. In this connection, staff cautioned on the need to contain risks of contingent liabilities and additional pressures on domestic financing resulting from new off-budget investment vehicles contemplated by the authorities.
Staff estimates that the proposals at a more advanced stage of elaboration are likely to yield some 2¼ percent of GDP, as included in the baseline scenario (¶10). The remaining measures needed to generate the required total adjustment of 3¾ percent of GDP ought to be defined urgently, not least to obtain more reliable estimates of their impact.
0
20
40
60
80
100
120
DOM ECU GTM CRI SLV PER ARG MEX CHL
VAT Corporate income taxPersonal income tax Avg. VAT taxAvg. corp. income tax Avg. pers. income tax
Tax Evasion Rates(Percent)
Sources: Corbacho, Fretes Cibils, and Lora (2013); CAF (2012); Cardoza (2012);Jiménez, Gómez Sabaini and Podestá (2010); Pecho, Peláez and Sánchez (2012);and Salim (2011).
8.4
6.5 5.9 5.65.1
3.6
0
2
4
6
8
10
12
GTM(2011)
HND(2012)
DOM(2013)
CRI(2012)
NIC(2010)
SLV(2009)
Others Income VAT Total
Tax Expenditure in Central America(Percent of GDP)
Sources: WGTC; Sabatini, Pecho, Moran: 'Los gastos tributarios enHonduras, 2013; national authorities and Fund staff estimates.
COSTA RICA
20 INTERNATIONAL MONETARY FUND
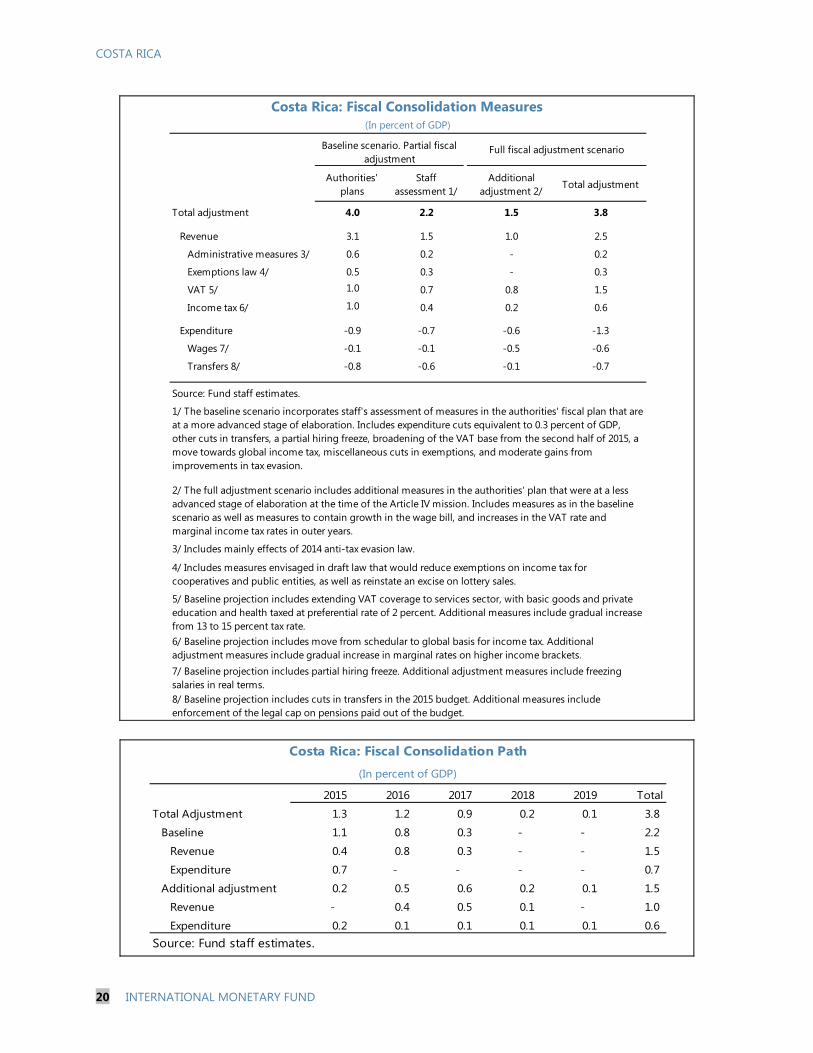
Costa Rica: Fiscal Consolidation Measures
Authorities' plans
Staff assessment 1/
Additional adjustment 2/
Total adjustment
Total adjustment 4.0 2.2 1.5 3.8
Revenue 3.1 1.5 1.0 2.5
Administrative measures 3/ 0.6 0.2 - 0.2
Exemptions law 4/ 0.5 0.3 - 0.3
VAT 5/ 1.0 0.7 0.8 1.5
Income tax 6/ 1.0 0.4 0.2 0.6
Expenditure -0.9 -0.7 -0.6 -1.3
Wages 7/ -0.1 -0.1 -0.5 -0.6
Transfers 8/ -0.8 -0.6 -0.1 -0.7
Source: Fund staff estimates.
8/ Baseline projection includes cuts in transfers in the 2015 budget. Additional measures include enforcement of the legal cap on pensions paid out of the budget.
(In percent of GDP)
Baseline scenario. Partial fiscal adjustment
3/ Includes mainly effects of 2014 anti-tax evasion law.
4/ Includes measures envisaged in draft law that would reduce exemptions on income tax for cooperatives and public entities, as well as reinstate an excise on lottery sales.
5/ Baseline projection includes extending VAT coverage to services sector, with basic goods and private education and health taxed at preferential rate of 2 percent. Additional measures include gradual increase from 13 to 15 percent tax rate.6/ Baseline projection includes move from schedular to global basis for income tax. Additional adjustment measures include gradual increase in marginal rates on higher income brackets.
1/ The baseline scenario incorporates staff's assessment of measures in the authorities' fiscal plan that are at a more advanced stage of elaboration. Includes expenditure cuts equivalent to 0.3 percent of GDP, other cuts in transfers, a partial hiring freeze, broadening of the VAT base from the second half of 2015, a move towards global income tax, miscellaneous cuts in exemptions, and moderate gains from improvements in tax evasion.
7/ Baseline projection includes partial hiring freeze. Additional adjustment measures include freezing salaries in real terms.
Full fiscal adjustment scenario
2/ The full adjustment scenario includes additional measures in the authorities' plan that were at a less advanced stage of elaboration at the time of the Article IV mission. Includes measures as in the baseline scenario as well as measures to contain growth in the wage bill, and increases in the VAT rate and marginal income tax rates in outer years.
Costa Rica: Fiscal Consolidation Path
(In percent of GDP)
2015 2016 2017 2018 2019 Total
Total Adjustment 1.3 1.2 0.9 0.2 0.1 3.8
Baseline 1.1 0.8 0.3 - - 2.2
Revenue 0.4 0.8 0.3 - - 1.5
Expenditure 0.7 - - - - 0.7
Additional adjustment 0.2 0.5 0.6 0.2 0.1 1.5
Revenue - 0.4 0.5 0.1 - 1.0
Expenditure 0.2 0.1 0.1 0.1 0.1 0.6 Source: Fund staff estimates.
COSTA RICA
INTERNATIONAL MONETARY FUND 21
22. In addition, most deficit-reducing measures require parliamentary approval, which is made difficult by a complex political situation. The new administration should take advantage of its high political capital to push forward reforms early in its mandate, not least to persuade the powerful public sector unions to accept sacrifices (the containment of wage growth in the public sector does not require parliamentary approval). Nevertheless, the government noted that it only has a minority representation in Congress, hence passage of several budget consolidation measures requires the cooperation of opposition parties. Lingering resentments from the bitter presidential campaign raise concerns about legislative approval of adjustment measures, notably the reforms of the VAT and income taxes. Nonetheless, there appears to be broad consensus across the political spectrum and society at large that fiscal retrenchment is needed. Thus, there may be scope for leveraging containment of public sector wages to bargain for revenue increases.
C. Improving the Monetary and Exchange Rate Policy Framework
23. Discussions identified areas to strengthen further the monetary policy framework. Staff commended the authorities’ achievements in lowering inflation since the global crisis. Having posted double-digit inflation for almost 30 years, Costa Rica has maintained it within the BCCR target range of 4–6 percent since 2009 (the range was further reduced to 3–5 percent in 2014). However, the recent depreciation episode illustrated that inflation expectations are not well-anchored. Moreover, perceived exchange rate stability in the past few years has encouraged dollarization, building up vulnerabilities in the balance sheets of banks and the private sector. The FX intervention rule, which aims both to avert excessive volatility and counter excessive deviations from medium-term fundamentals, remains undisclosed. Staff noted that lack of transparency may undermine confidence in the subordination of XR management objectives to the inflation target.
24. The authorities aim to move towards full-fledged inflation targeting, while maintaining a significant role for active XR management. Staff argued that allowing more XR flexibility would help establish inflation as the undisputed monetary anchor and lower XR pass-through to inflation. In particular, since appreciation pressures have now subsided, it is an opportune time for abandoning the XR band. More flexibility would enhance the role of the XR as a shock absorber and make market participants more cognizant of two-way risks in exchange markets, promoting the development and use of hedging facilities and the reduction of foreign currency mismatches, while more generally discouraging dollarization. The elimination of the band would not preclude the BCCR from engaging in FX market interventions to smooth out short-term sharp XR fluctuations and strengthen the NIR position as long as interventions do not jeopardize the inflation target. The authorities agreed in principle, but stressed the need to remain vigilant about the impact of XR movements on financial stability and inflation expectations given the high levels of dollarization and unhedged FX borrowing. Specifically, officials noted that other “inflation-targeting” central banks intervene frequently to stem excessive XR volatility and they are likely to follow this mold. The authorities were also cautious about making the intervention rule public due to the fear of facilitating speculation.
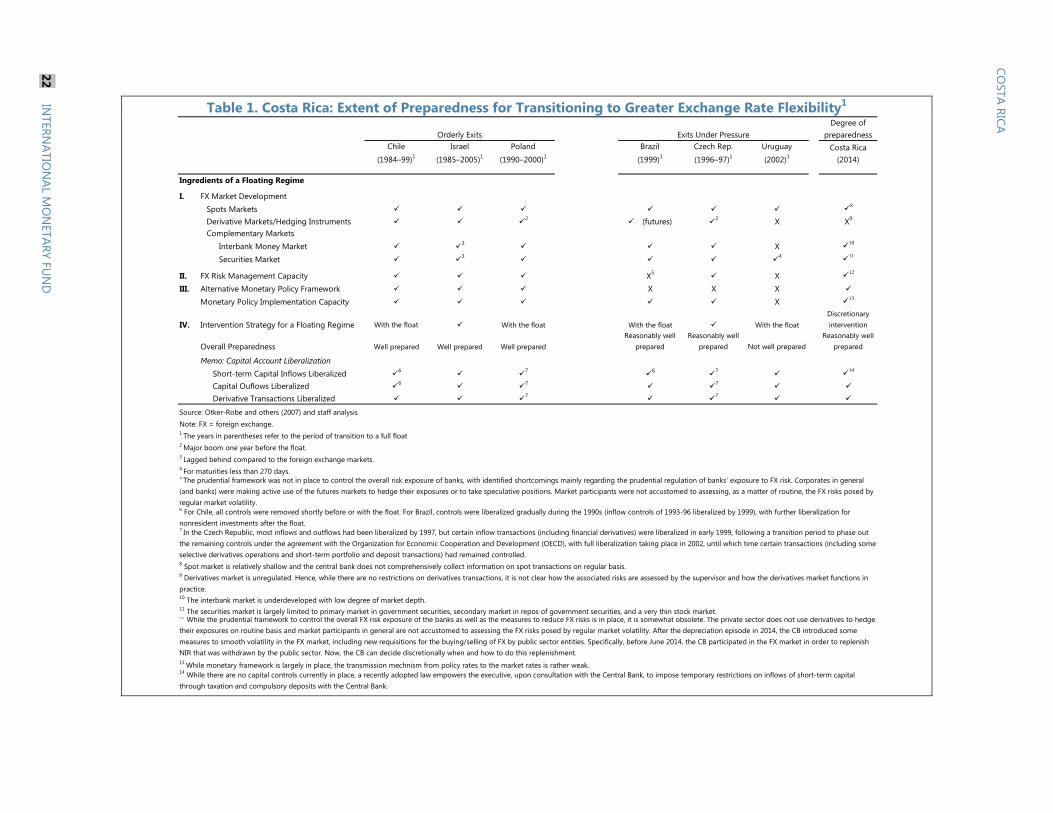
Table 1. Costa Rica: Extent of Preparedness for Transitioning to Greater Exchange Rate Flexibility1
Degree of preparedness
Chile
(1984–99)1
Israel
(1985–2005)1
Poland
(1990–2000)1
Brazil
(1999)1
Czech Rep.
(1996–97)1
Uruguay
(2002)1Costa Rica
(2014)
Ingredients of a Floating Regime
I. FX Market DevelopmentSpots Markets 8
Derivative Markets/Hedging Instruments 2 (futures) 2 X X9
Complementary MarketsInterbank Money Market 3 X 10
Securities Market 3 4 11
II. FX Risk Management Capacity X5 X 12
III. Alternative Monetary Policy Framework X X X
Monetary Policy Implementation Capacity X 13
IV. Intervention Strategy for a Floating Regime With the float With the float With the float With the floatDiscretionary intervention
Overall Preparedness Well prepared Well prepared Well preparedReasonably well
preparedReasonably well
prepared Not well preparedReasonably well
prepared
Memo: Capital Account LiberalizationShort-term Capital Inflows Liberalized 6 7 6 7 14
Capital Ouflows Liberalized 6 7 7
Derivative Transactions Liberalized 7 7
6 For Chile, all controls were removed shortly before or with the float. For Brazil, controls were liberalized gradually during the 1990s (inflow controls of 1993-96 liberalized by 1999), with further liberalization for nonresident investments after the float.
5 The prudential framework was not in place to control the overall risk exposure of banks, with identified shortcomings mainly regarding the prudential regulation of banks' exposure to FX risk. Corporates in general (and banks) were making active use of the futures markets to hedge their exposures or to take speculative positions. Market participants were not accustomed to assessing, as a matter of routine, the FX risks posed by regular market volatility.
4 For maturities less than 270 days.
3 Lagged behind compared to the foreign exchange markets.
2 Major boom one year before the float.
1 The years in parentheses refer to the period of transition to a full floatNote: FX = foreign exchange.Source: Otker-Robe and others (2007) and staff analysis
10 The interbank market is underdeveloped with low degree of market depth.
14 While there are no capital controls currently in place, a recently adopted law empowers the executive, upon consultation with the Central Bank, to impose temporary restrictions on inflows of short-term capital through taxation and compulsory deposits with the Central Bank.
13 While monetary framework is largely in place, the transmission mechnism from policy rates to the market rates is rather weak.
12 While the prudential framework to control the overall FX risk exposure of the banks as well as the measures to reduce FX risks is in place, it is somewhat obsolete. The private sector does not use derivatives to hedge their exposures on routine basis and market participants in general are not accustomed to assessing the FX risks posed by regular market volatility. After the depreciation episode in 2014, the CB introduced some measures to smooth volatility in the FX market, including new requisitions for the buying/selling of FX by public sector entities. Specifically, before June 2014, the CB participated in the FX market in order to replenish NIR that was withdrawn by the public sector. Now, the CB can decide discretionally when and how to do this replenishment.
11 The securities market is largely limited to primary market in government securities, secondary market in repos of government securities, and a very thin stock market.
9 Derivatives market is unregulated. Hence, while there are no restrictions on derivatives transactions, it is not clear how the associated risks are assessed by the supervisor and how the derivatives market functions in practice.
8 Spot market is relatively shallow and the central bank does not comprehensively collect information on spot transactions on regular basis.
7 In the Czech Republic, most inflows and outflows had been liberalized by 1997, but certain inflow transactions (including financial derivatives) were liberalized in early 1999, following a transition period to phase out the remaining controls under the agreement with the Organization for Economic Cooperation and Development (OECD), with full liberalization taking place in 2002, until which time certain transactions (including some selective derivatives operations and short-term portfolio and deposit transactions) had remained controlled.
Orderly Exits Exits Under Pressure
COSTA
RICA
22 IN
TERNATIO
NAL M
ON
ETARY FUN
D
COSTA RICA
INTERNATIONAL MONETARY FUND 23
25. Steady progress has been made to create a favorable environment for inflation targeting, but more may be needed. The experience of countries that successfully transitioned to more flexible XR regimes (AN 6) suggests the importance of strengthening effective systems for reviewing and managing the exposure to XR risk. In this regard, staff welcomed bank supervision stipulations adopted in 2013, aimed at a more thorough assessment of credit risks related to XR exposures and associated need for higher provisions. The authorities concurred that fostering further development of the secondary market for government securities is also desirable. Finally, staff counseled to resist pressures to expand the BCCR’s mandate to include growth, which could generate confusion as to the main target of monetary policy. Additional steps to buttress BCCR credibility further, including by fortifying its balance sheet, could also be useful (AN 4).
D. Financial Stability
26. Officials acknowledged that limited progress has been made in implementing pending recommendations from the 2008 FSAP update (Annex 1). Advances have been slow, largely due to a crowded legislative agenda. In particular, legislation aimed at empowering the Superintendence of Financial Institutions to conduct consolidated supervision, providing adequate protection to bank supervisors, and strengthening bank resolution procedures has been stalled in Congress for 8 years. The authorities are preparing new proposals to replace the old draft laws but the time-frame for their completion and the degree of alignment of the new laws with the 2008 FSAP update recommendations is not clear. The authorities noted, in particular, that introduction of further legal protection for bank supervisors faces strong opposition and may run into court challenges. Staff endorsed progress made towards full implementation of risk-based supervision, but encouraged stepping up efforts to bring it up to best practices.
27. The authorities concurred that gradual adoption of Basel III standards would further improve resilience of the financial system. The authorities believe that the regulatory and risk management frameworks would benefit from gradually firming up capital quality and increasing liquidity and capital requirements in line with Basel III standards. In particular, moving towards the introduction of Basel III definitions of capital, a capital conservation buffer, and a leverage ratio as well as incorporating market and operational risk capital requirements should be immediate priorities. Staff assessment suggests that only a few banks are not yet in full compliance with Basel III standards (AN 7) and that adopting Basel III capital requirements would have negligible growth impact in Costa Rica.
28. Regional initiatives to upgrade cross-border consolidated supervision are important, but additional improvements are needed to alleviate lingering spillover risks. Effective supervision of cross-border financial operations is critical for stability, in particular because financial linkages within the region are not fully understood, owing in part to data limitations but also to legal restrictions on information sharing. Enhancing transnational monitoring is especially important for Costa Rica since its large conglomerate BCT operates in Panama. In this regard, officials emphasized the existence of a data sharing agreement with Panama, but staff underscored that cross-border consolidated supervision seems overall less advanced in Costa Rica compared to other countries in the region. Specifically, though it welcomed Costa Rica’s participation in the system of multilateral
COSTA RICA
24 INTERNATIONAL MONETARY FUND
MoUs and in the newly created Central American Council of Banking Supervisors, staff urged speedier implementation of actions recommended in the 2008 FSAP (¶26).
E. Structural Reforms
29. The authorities support structural reforms to buttress Costa Rica’s competitiveness and promote inclusive growth. While Costa Rica has been the regional leader in attracting foreign direct investment, the recent withdrawal of Intel suggests that further steps are needed to maintain the country’s competitive edge. Within the region, the country is relatively well-positioned in the electricity market—more than 80 percent of electricity comes from renewable sources, technical losses are relatively low, and industrial tariffs are the lowest in the region. Nevertheless, the cost of electricity is high compared to Asian competitors, which are generally more efficient at electricity production. Staff recommended increasing private sector participation in the energy sector and reviewing tariff setting procedures to enhance cost discipline. While Costa Rica ranks highly on women’s educational attainment compared to other countries in the region, it lags in terms of economic participation and opportunity for women, reflected in low female labor force participation and the gender wage gap (Figure 7). With regards to human capital, the authorities agreed that improving the quality of public education spending with emphasis on quality child care and early childhood education could facilitate female return to the labor force, foster productivity improvements, and lower inequality, which has been recently on the rise. Officials also concurred that stimulating competition in the banking sector, fostering the development of the domestic capital market, addressing infrastructure bottlenecks, and streamlining business regulations could accelerate potential growth and improve financial inclusion. According to staff estimates, efficiency gains from these measures could increase trend growth by up to 2 percentage points, while reducing unemployment by 3 percent over the long run (Figure 7).
LA5
0
20
40
60
80
100
DOM CRI HND NIC GTM SLV PAN
Inde
x of
Com
plia
nce
with
Bas
el C
ore
Prin
cipl
es 1
/Risk Based Supervision, 2013
Source: Fund staff estimates based on country assessments.1/Scale: 100 = compliant; 75 = largely compliant; 25 = materially non-compliant; 0 = non-compliant.
LA5
0
20
40
60
80
100
DOM CRI HND NIC GTM SLV PAN
Inde
x of
Com
plia
nce
with
Bas
el C
ore
Prin
cipl
es 1
/
Consolidated Cross Border Supervision, 2013
Source: Fund staff estimates based on country assessments.1/Scale: 100 = compliant; 75 = largely compliant; 25 = materially non-compliant; 0 = non-compliant.
-10
0
10
20
30
40
50
60
MYS
KOR
USA
CHN
MEX
OEC
D
CRI
DEU
GTMSL
V
BRA
JPN
HN
D
NIC
DO
M
Residential
Industrial
Difference
Average Electricity Tariffs as 2011(Residential vs. industrial, in USD cents/KwH)
Sources: OLADE and Fund staff estimates.
0
5
10
15
20
25
30
35
40
DO
M
HN
D
NIC
BRA
MEX SLV
CRI
GTM MYS
OED
USA
CHN
JPN
DEU
KOR
Technical Losses as 2011(Percent of total output)
Sources: OLADE and Fund staff estimates.
COSTA RICA
INTERNATIONAL MONETARY FUND 25
STAFF APPRAISAL 30. Costa Rica must address existing vulnerabilities and attain long-term fiscal sustainability, while upgrading productivity and safeguarding financial stability. In the near term, a tighter fiscal policy stance and vigilance over inflation would buttress macroeconomic stability. At the same time, public finances should be placed on a sustainable path, the monetary policy framework strengthened, and banking sector supervision and regulation further enhanced. Reforms to foster competition, increase efficiency, and promote external competitiveness would accelerate long-run inclusive growth.
31. With long-term fiscal trends unsustainable, ambitious fiscal consolidation is needed, though it can be implemented at a measured pace. Excluding the pension system actuarial deficit, a permanent improvement in the fiscal primary balance of 3¾ percent of GDP is required to stabilize the public debt ratio after 2019 at a prudent level and safeguard macroeconomic stability. Given that output is close to potential, the rapid growth of public debt calls for significant upfront fiscal tightening, with about a third of the overall budget adjustment in 2015 followed by smaller steps in subsequent years. Postponing consolidation would result in larger tightening needs to stabilize debt-to-GDP and increase the probability of disorderly adjustment in the event of an adverse turn in investor sentiment. While the social security actuarial deficit could be addressed at a later stage, the longer the correction is delayed, the larger it will be.
32. Thus, the authorities’ fiscal adjustment plan of about 4 percent of GDP is suitable, but supporting measures still need to be fully developed and implemented. The plan’s emphasis on revenue enhancement is well-founded, given Costa Rica’s low revenue effort compared to other upper-middle-income countries. However, the proposals at a more advanced phase of elaboration are likely to yield only some 2¼ percent of GDP. Other measures still need to be fleshed out and virtually all have to be enacted. On the revenue side, it is advisable to broaden the VAT base and raise the VAT rate from 13 to 15 percent, as well as to increase marginal tax rates on higher income brackets as part of the introduction of a global income tax, thereby addressing also distributional concerns. Efforts to contain growth of current outlays, particularly the wage bill and transfers, should be stepped up, thus creating space for much needed infrastructural spending. Although recent
35
40
45
50
55
2000
2001
2002
2003
2004
2005
2006
2007
2008
2009
2010
2011
2012
2013
2014
Gini Index by Household 1/(Income equality = 0)
Sources: INEC and Fund staff estimates.1/ The line break in 2010 reflects a methodological change in the measurement of the Gini Index.
16
18
20
22
24
2003
2004
2005
2006
2007
2008
2009
2010
2011
2012
2013
2014
Incidence of Poverty 1/(Percent of households below the poverty line 2/)
Sources: INEC and Fund staff estimates.1/ The line break in 2010 reflects a methodological change in the measurement of the poverty.2/ The poverty line is calculated according to the cost of the essential goods and services to afford minimal standards of living.
COSTA RICA
26 INTERNATIONAL MONETARY FUND
actions to strengthen tax compliance are positive, associated revenue gains are likely to materialize only in the longer term.
33. The monetary stance is broadly appropriate, but the authorities should complete the transition to inflation targeting. Current monetary policy is expected to support the reentry of inflation within the target band, though vigilance is warranted in case inflation does not decline in line with projections. Elimination of the XR band and concurrent adoption of a more transparent intervention rule would establish the inflation target as the undisputed bearing of monetary policy, while still allowing for smoothing out exchange rate volatility. At the same time, higher XR flexibility would help lower the XR pass-through to inflation and force market participants to internalize currency risks, discouraging dollarization. It is important to foster development of the tools necessary to underpin greater XR flexibility, including hedging instruments and a deeper secondary market for government securities. The authorities should also avoid expanding the BCCR’s mandate to include growth, which could generate confusion as to the true target of monetary policy.
34. Enactment of the pending FSAP recommendations, a gradual move towards Basel III standards, and strengthening cross-border supervision are important. In particular, greater urgency is required in empowering the Superintendence of Financial Institutions to conduct consolidated and transnational supervision, providing adequate protection to bank supervisors, and enhancing bank resolution procedures. Progress made towards the full implementation of risk-based supervision is welcome, but more efforts are needed to bring it in line with best practices. The regulatory and risk management frameworks would greatly benefit from introducing gradually Basel III standards.
35. Structural reforms offer the opportunity to boost productivity and foster long-run inclusive growth. It would be desirable to step up private sector participation in the energy sector and review tariff setting procedures to strengthen cost controls. Ameliorating efficiency and efficacy of education spending, with the focus on early childhood, could raise women’s labor force participation, stimulate productivity, and reduce inequality in the long term. Promoting competition in the banking sector, facilitating capital market development, alleviating infrastructure bottlenecks, and simplifying the regulatory environment would also buttress competitiveness and accelerate potential growth.
36. It is recommended that the next Article IV consultation be held on the standard 12-month cycle.
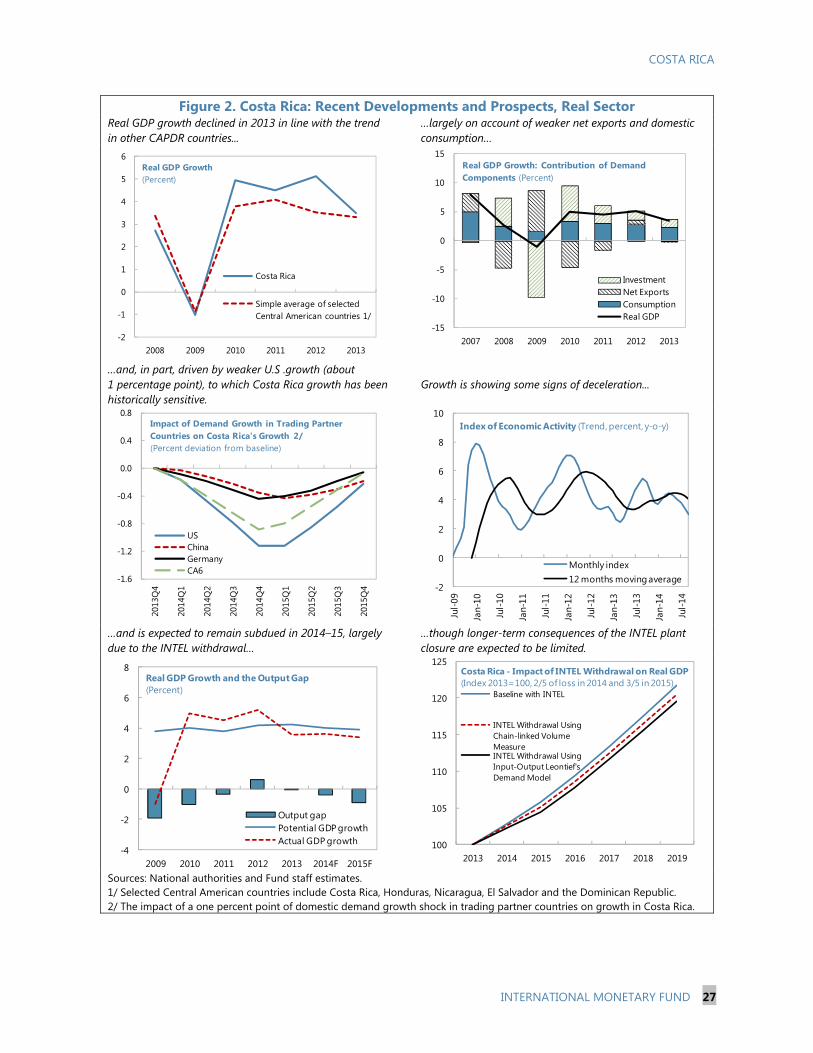
COSTA RICA
INTERNATIONAL MONETARY FUND 27
Figure 2. Costa Rica: Recent Developments and Prospects, Real Sector Real GDP growth declined in 2013 in line with the trend in other CAPDR countries...
…largely on account of weaker net exports and domestic consumption…
…and, in part, driven by weaker U.S .growth (about 1 percentage point), to which Costa Rica growth has been historically sensitive.
Growth is showing some signs of deceleration...
…and is expected to remain subdued in 2014–15, largelydue to the INTEL withdrawal…
…though longer-term consequences of the INTEL plant closure are expected to be limited.
Sources: National authorities and Fund staff estimates. 1/ Selected Central American countries include Costa Rica, Honduras, Nicaragua, El Salvador and the Dominican Republic. 2/ The impact of a one percent point of domestic demand growth shock in trading partner countries on growth in Costa Rica.
-2
-1
0
1
2
3
4
5
6
2008 2009 2010 2011 2012 2013
Costa Rica
Simple average of selected Central American countries 1/
Real GDP Growth (Percent)
-15
-10
-5
0
5
10
15
2007 2008 2009 2010 2011 2012 2013
InvestmentNet ExportsConsumptionReal GDP
Real GDP Growth: Contribution of Demand Components (Percent)
-1.6
-1.2
-0.8
-0.4
0.0
0.4
0.8
2013
Q4
2014
Q1
2014
Q2
2014
Q3
2014
Q4
2015
Q1
2015
Q2
2015
Q3
2015
Q4
USChinaGermanyCA6
Impact of Demand Growth in Trading Partner Countries on Costa Rica's Growth 2/(Percent deviation from baseline)
-2
0
2
4
6
8
10
Jul-0
9
Jan-
10
Jul-1
0
Jan-
11
Jul-1
1
Jan-
12
Jul-1
2
Jan-
13
Jul-1
3
Jan-
14
Jul-1
4
Monthly index12 months moving average
Index of Economic Activity (Trend, percent, y-o-y)
-4
-2
0
2
4
6
8
2009 2010 2011 2012 2013 2014F 2015F
Output gapPotential GDP growthActual GDP growth
Real GDP Growth and the Output Gap(Percent)
100
105
110
115
120
125
2013 2014 2015 2016 2017 2018 2019
Baseline with INTEL
INTEL Withdrawal Using Chain-linked Volume MeasureINTEL Withdrawal Using Input-Output Leontief's Demand Model
Costa Rica - Impact of INTEL Withdrawal on Real GDP(Index 2013=100, 2/5 of loss in 2014 and 3/5 in 2015)
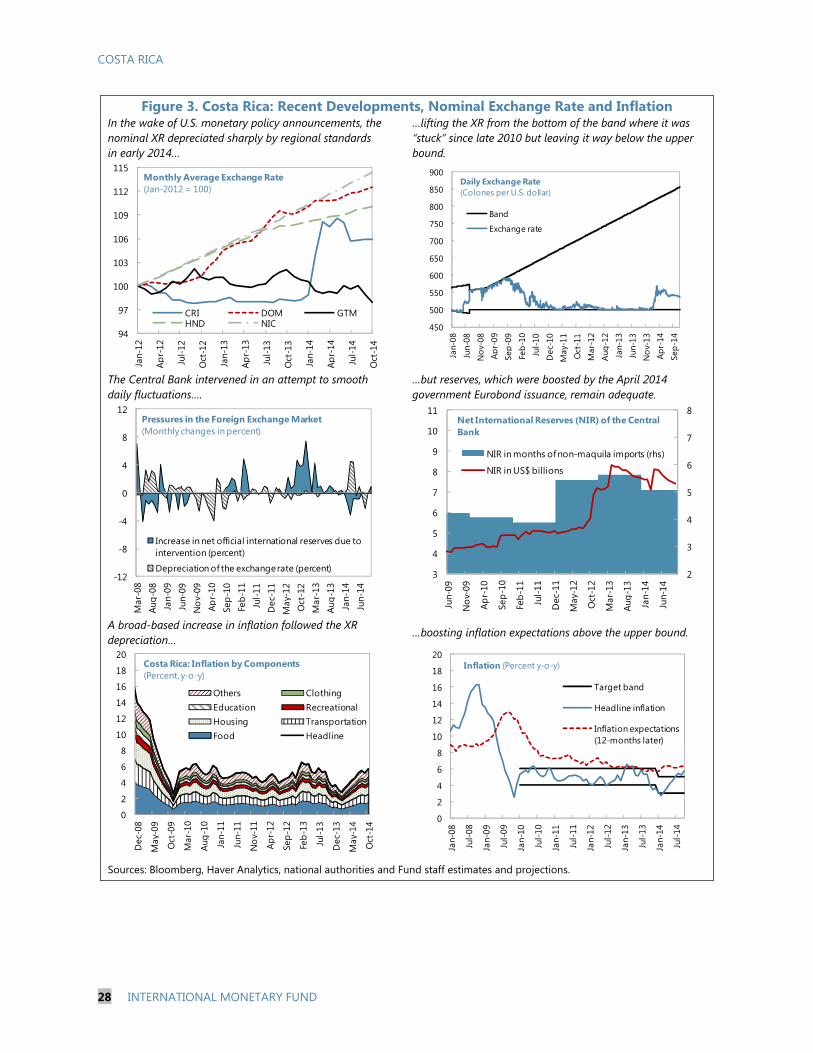
COSTA RICA
28 INTERNATIONAL MONETARY FUND
Figure 3. Costa Rica: Recent Developments, Nominal Exchange Rate and Inflation In the wake of U.S. monetary policy announcements, the nominal XR depreciated sharply by regional standards in early 2014…
…lifting the XR from the bottom of the band where it was “stuck” since late 2010 but leaving it way below the upper bound.
The Central Bank intervened in an attempt to smooth daily fluctuations….
…but reserves, which were boosted by the April 2014 government Eurobond issuance, remain adequate.
A broad-based increase in inflation followed the XR depreciation…
…boosting inflation expectations above the upper bound.
Sources: Bloomberg, Haver Analytics, national authorities and Fund staff estimates and projections.
94
97
100
103
106
109
112
115
Jan-
12
Apr-
12
Jul-1
2
Oct
-12
Jan-
13
A pr-
13
Jul-1
3
Oct
-13
Jan-
14
A pr-
14
Jul-1
4
Oct
-14
CRI DOM GTMHND NIC
Monthly Average Exchange Rate(Jan-2012 = 100)
450
500
550
600
650
700
750
800
850
900
Jan-
08Ju
n-08
Nov
-08
Apr-
09Se
p-09
Feb-
10Ju
l-10
Dec
-10
May
-11
Oct
-11
Mar
-12
Aug-
12Ja
n-13
Jun-
13
Nov
-13
Apr-
14Se
p-14
Band
Exchange rate
Daily Exchange Rate (Colones per U.S. dollar)
-12
-8
-4
0
4
8
12
Mar
-08
Aug-
08Ja
n-09
Jun-
09N
ov-0
9Ap
r-10
Sep-
10Fe
b-11
Jul-1
1D
ec-1
1M
ay-1
2O
ct-1
2M
ar-1
3Au
g-13
Jan-
14Ju
n-14
Increase in net official international reserves due to intervention (percent)
Depreciation of the exchange rate (percent)
Pressures in the Foreign Exchange Market(Monthly changes in percent)
2
3
4
5
6
7
8
3
4
5
6
7
8
9
10
11
Jun-
09
Nov
-09
Apr-
10
Sep-
10
Feb-
11
Jul-1
1
Dec
-11
May
-12
Oct
-12
Mar
-13
Aug-
13
Jan-
14
Jun-
14
Net International Reserves (NIR) of the Central Bank
NIR in months of non-maquila imports (rhs)
NIR in US$ billions
0
2
4
6
8
10
12
14
16
18
20
Dec
-08
Ma y
-09
Oct
-09
Mar
-10
Aug-
10
Jan-
11
Jun-
11
Nov
-11
A pr-
12
Sep-
12
Feb-
13
Jul-1
3
Dec
-13
Ma y
-14
Oct
-14
Others ClothingEducation RecreationalHousing TransportationFood Headline
Costa Rica: Inflation by Components(Percent, y-o-y)
0
2
4
6
8
10
12
14
16
18
20
Jan-
08
Jul-0
8
Jan-
09
Jul-0
9
Jan-
10
Jul-1
0
Jan-
11
Jul-1
1
Jan-
12
Jul-1
2
Jan-
13
Jul-1
3
Jan-
14
Jul-1
4Target band
Headline inflation
Inflation expectations (12-months later)
Inflation (Percent y-o-y)
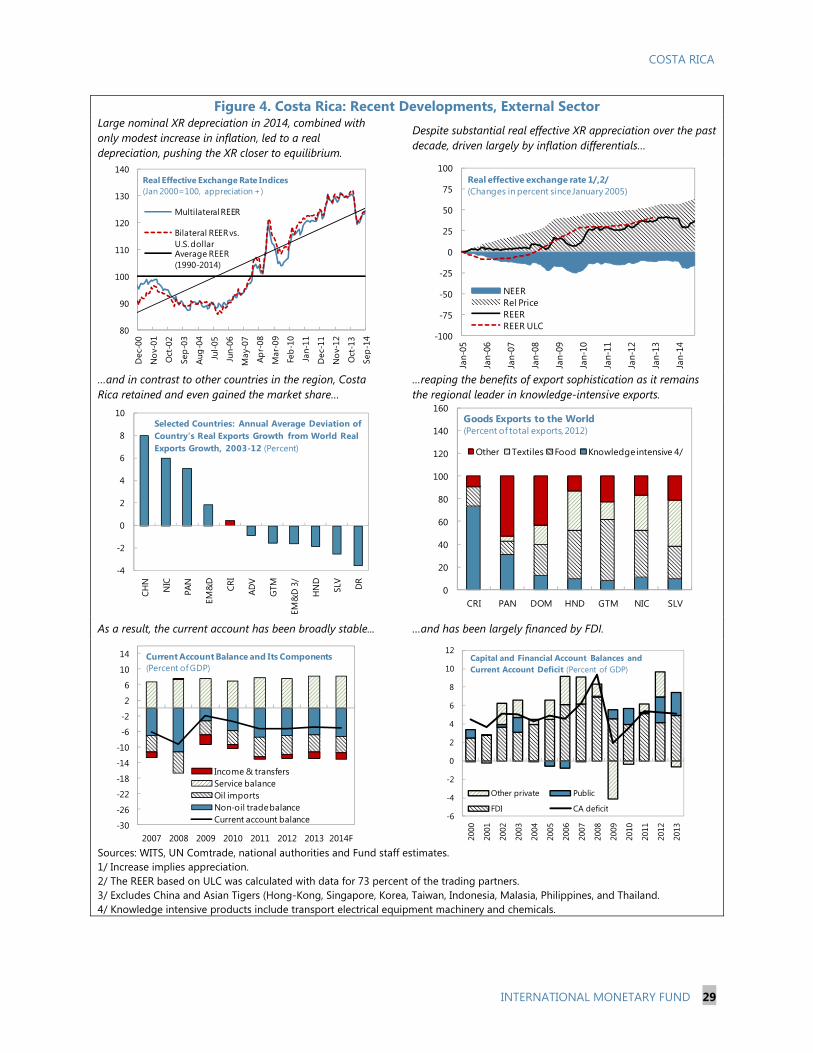
COSTA RICA
INTERNATIONAL MONETARY FUND 29
Figure 4. Costa Rica: Recent Developments, External Sector Large nominal XR depreciation in 2014, combined with only modest increase in inflation, led to a real depreciation, pushing the XR closer to equilibrium.
Despite substantial real effective XR appreciation over the past decade, driven largely by inflation differentials…
…and in contrast to other countries in the region, Costa Rica retained and even gained the market share…
…reaping the benefits of export sophistication as it remains the regional leader in knowledge-intensive exports.
As a result, the current account has been broadly stable... …and has been largely financed by FDI.
Sources: WITS, UN Comtrade, national authorities and Fund staff estimates. 1/ Increase implies appreciation. 2/ The REER based on ULC was calculated with data for 73 percent of the trading partners. 3/ Excludes China and Asian Tigers (Hong-Kong, Singapore, Korea, Taiwan, Indonesia, Malasia, Philippines, and Thailand. 4/ Knowledge intensive products include transport electrical equipment machinery and chemicals.
80
90
100
110
120
130
140
Dec
-00
Nov
-01
Oct
-02
Sep-
03
Aug-
04
Jul-0
5
Jun-
06
Ma y
-07
A pr-
08
Mar
-09
Feb-
10
Jan-
11
Dec
-11
Nov
-12
Oct
-13
Sep-
14
Multilateral REER
Bilateral REER vs. U.S. dollar Average REER (1990-2014)
Real Effective Exchange Rate Indices (Jan 2000=100, appreciation +)
-100
-75
-50
-25
0
25
50
75
100
Jan-
05
Jan-
06
Jan-
07
Jan-
08
Jan-
09
Jan-
10
Jan-
11
Jan-
12
Jan-
13
Jan-
14
NEERRel PriceREERREER ULC
Real effective exchange rate 1/,2/ (Changes in percent since January 2005)
-4
-2
0
2
4
6
8
10
CHN
NIC
PAN
EM&
D
CRI
ADV
GTM
EM&
D 3
/
HN
D
SLV
DR
Selected Countries: Annual Average Deviation of Country's Real Exports Growth from World Real Exports Growth, 2003-12 (Percent)
0
20
40
60
80
100
120
140
160
CRI PAN DOM HND GTM NIC SLV
Other Textiles Food Knowledge intensive 4/
Goods Exports to the World(Percent of total exports, 2012)
-30
-26
-22
-18
-14
-10
-6
-2
2
6
10
14
2007 2008 2009 2010 2011 2012 2013 2014F
Income & transfersService balanceOil importsNon-oil trade balanceCurrent account balance
Current Account Balance and Its Components(Percent of GDP)
-6
-4
-2
0
2
4
6
8
10
12
2000
2001
2002
2003
2004
2005
2006
2007
2008
2009
2010
2011
2012
2013
Capital and Financial Account Balances and Current Account Deficit (Percent of GDP)
Other private Public
FDI CA deficit
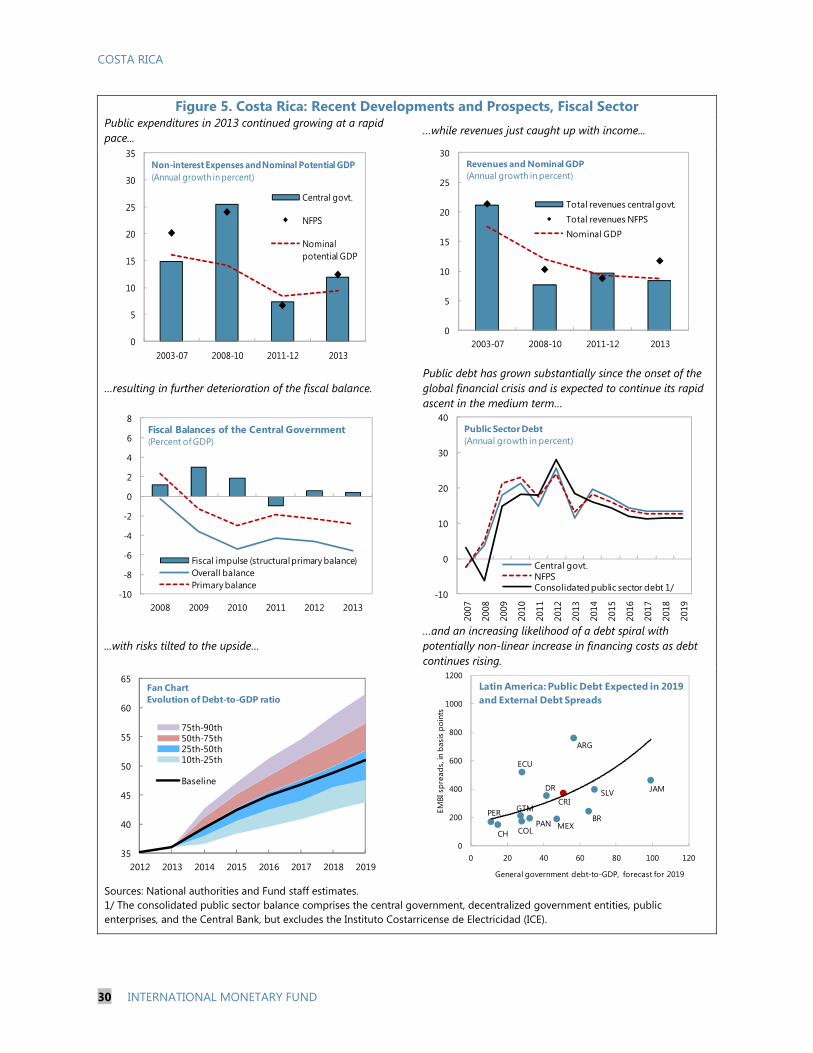
COSTA RICA
30 INTERNATIONAL MONETARY FUND
Figure 5. Costa Rica: Recent Developments and Prospects, Fiscal Sector Public expenditures in 2013 continued growing at a rapid pace...
…while revenues just caught up with income...
…resulting in further deterioration of the fiscal balance. Public debt has grown substantially since the onset of the global financial crisis and is expected to continue its rapid ascent in the medium term…
...with risks tilted to the upside… …and an increasing likelihood of a debt spiral with potentially non-linear increase in financing costs as debt continues rising.
Sources: National authorities and Fund staff estimates. 1/ The consolidated public sector balance comprises the central government, decentralized government entities, public enterprises, and the Central Bank, but excludes the Instituto Costarricense de Electricidad (ICE).
0
5
10
15
20
25
30
35
2003-07 2008-10 2011-12 2013
Central govt.
NFPS
Nominal potential GDP
Non-interest Expenses and Nominal Potential GDP(Annual growth in percent)
0
5
10
15
20
25
30
2003-07 2008-10 2011-12 2013
Total revenues central govt.Total revenues NFPSNominal GDP
Revenues and Nominal GDP(Annual growth in percent)
-10
-8
-6
-4
-2
0
2
4
6
8
2008 2009 2010 2011 2012 2013
Fiscal impulse (structural primary balance)Overall balancePrimary balance
Fiscal Balances of the Central Government (Percent of GDP)
-10
0
10
20
30
40
2007
2008
2009
2010
2011
2012
2013
2014
2015
2016
2017
2018
2019
Central govt.NFPSConsolidated public sector debt 1/
Public Sector Debt(Annual growth in percent)
35
40
45
50
55
60
65
2012 2013 2014 2015 2016 2017 2018 2019
Fan ChartEvolution of Debt-to-GDP ratio
75th-90th50th-75th25th-50th10th-25th
Baseline
ARG
BR
CH COL
CRI
DR
ECU
SLV
GTM
JAM
MEXPANPER
0
200
400
600
800
1000
1200
0 20 40 60 80 100 120
EMBI
spr
eads
, in
basi
s po
ints
General government debt-to-GDP, forecast for 2019
Latin America: Public Debt Expected in 2019 and External Debt Spreads
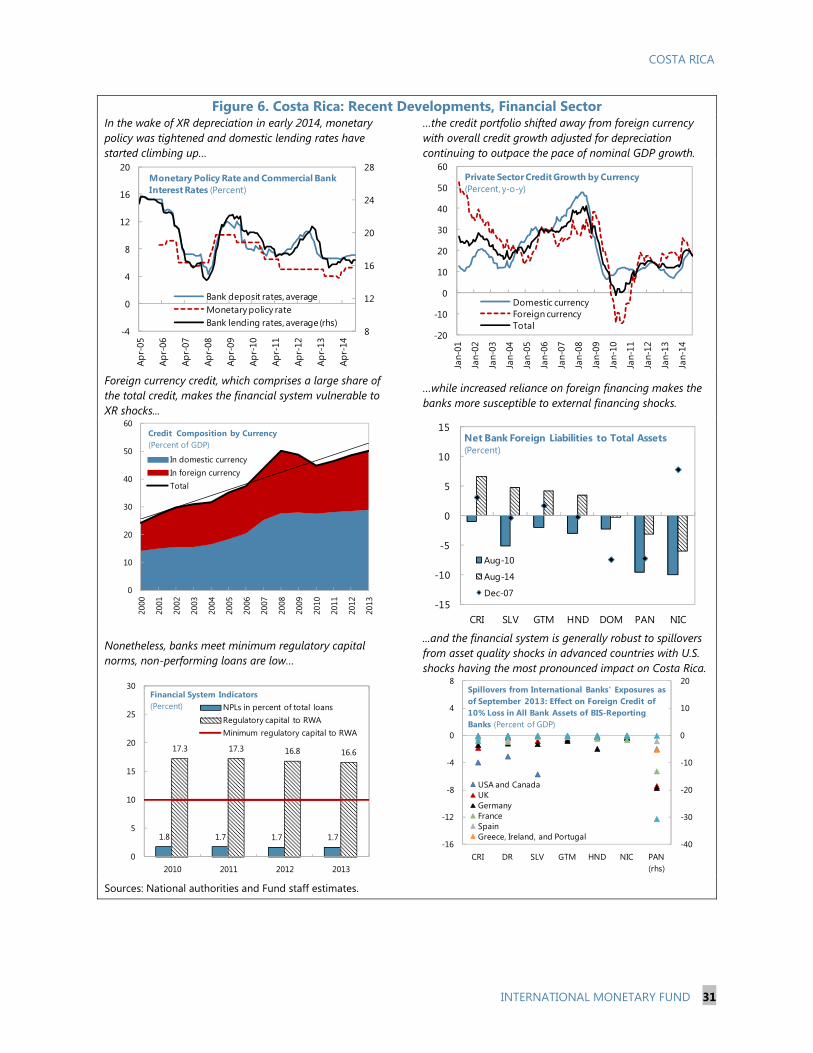
COSTA RICA
INTERNATIONAL MONETARY FUND 31
Figure 6. Costa Rica: Recent Developments, Financial Sector In the wake of XR depreciation in early 2014, monetary policy was tightened and domestic lending rates have started climbing up…
…the credit portfolio shifted away from foreign currency with overall credit growth adjusted for depreciation continuing to outpace the pace of nominal GDP growth.
Foreign currency credit, which comprises a large share of the total credit, makes the financial system vulnerable to XR shocks...
…while increased reliance on foreign financing makes the banks more susceptible to external financing shocks.
Nonetheless, banks meet minimum regulatory capital norms, non-performing loans are low…
...and the financial system is generally robust to spillovers from asset quality shocks in advanced countries with U.S. shocks having the most pronounced impact on Costa Rica.
Sources: National authorities and Fund staff estimates.
8
12
16
20
24
28
-4
0
4
8
12
16
20
Apr-
05
Apr-
06
Apr-
07
Apr-
08
Apr-
09
Apr-
10
Apr-
11
Apr-
12
Apr-
13
Apr-
14
Bank deposit rates, averageMonetary policy rateBank lending rates, average (rhs)
Monetary Policy Rate and Commercial Bank Interest Rates (Percent)
-20
-10
0
10
20
30
40
50
60
Jan-
01
Jan-
02
Jan-
03
Jan-
04
Jan-
05
Jan-
06
Jan-
07
Jan-
08
Jan-
09
Jan-
10
Jan-
11
Jan-
12
Jan-
13
Jan-
14
Domestic currencyForeign currencyTotal
Private Sector Credit Growth by Currency (Percent, y-o-y)
0
10
20
30
40
50
60
2000
2001
2002
2003
2004
2005
2006
2007
2008
2009
2010
2011
2012
2013
In domestic currencyIn foreign currencyTotal
Credit Composition by Currency(Percent of GDP)
-15
-10
-5
0
5
10
15
CRI SLV GTM HND DOM PAN NIC
Aug-10
Aug-14
Dec-07
Net Bank Foreign Liabilities to Total Assets(Percent)
1.8 1.7 1.7 1.7
17.3 17.3 16.8 16.6
0
5
10
15
20
25
30
2010 2011 2012 2013
NPLs in percent of total loansRegulatory capital to RWAMinimum regulatory capital to RWA
Financial System Indicators (Percent)
-40
-30
-20
-10
0
10
20
-16
-12
-8
-4
0
4
8
CRI DR SLV GTM HND NIC PAN (rhs)
USA and CanadaUKGermanyFranceSpainGreece, Ireland, and Portugal
Spillovers from International Banks' Exposures as of September 2013: Effect on Foreign Credit of 10% Loss in All Bank Assets of BIS-Reporting Banks (Percent of GDP)
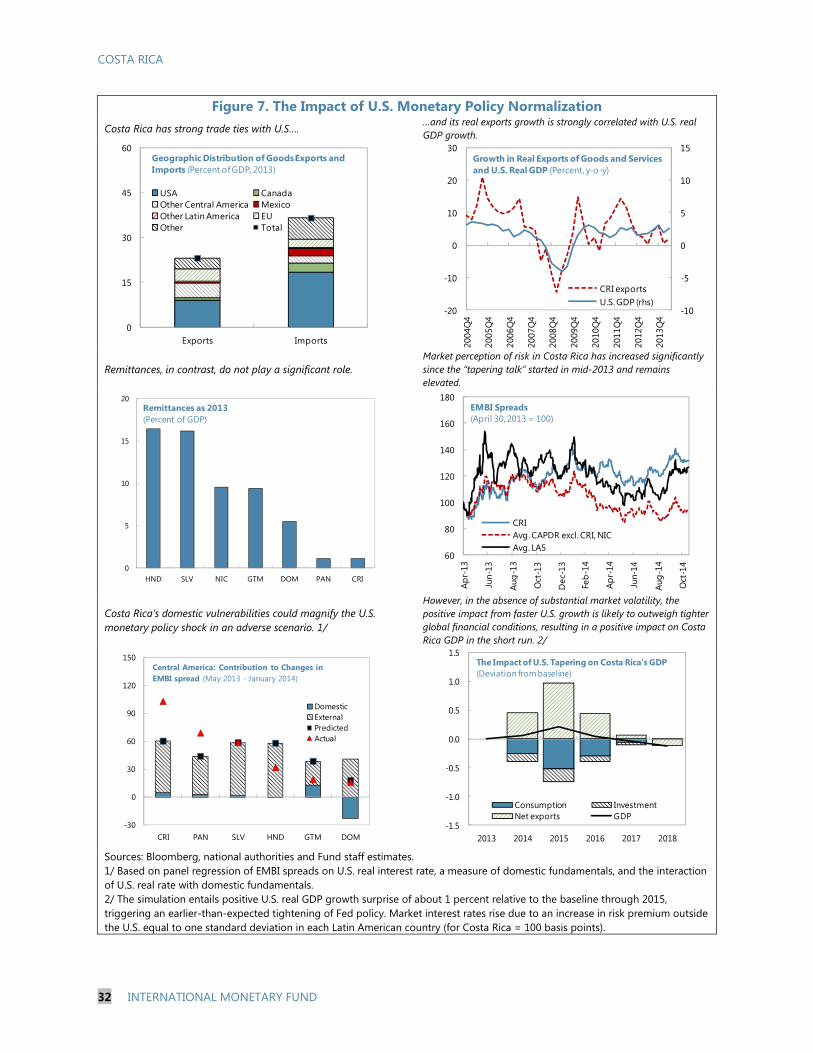
COSTA RICA
32 INTERNATIONAL MONETARY FUND
Figure 7. The Impact of U.S. Monetary Policy Normalization Costa Rica has strong trade ties with U.S….
…and its real exports growth is strongly correlated with U.S. real GDP growth.
Remittances, in contrast, do not play a significant role. Market perception of risk in Costa Rica has increased significantly since the “tapering talk” started in mid-2013 and remains elevated.
Costa Rica’s domestic vulnerabilities could magnify the U.S. monetary policy shock in an adverse scenario. 1/
However, in the absence of substantial market volatility, the positive impact from faster U.S. growth is likely to outweigh tighter global financial conditions, resulting in a positive impact on Costa Rica GDP in the short run. 2/
Sources: Bloomberg, national authorities and Fund staff estimates. 1/ Based on panel regression of EMBI spreads on U.S. real interest rate, a measure of domestic fundamentals, and the interaction of U.S. real rate with domestic fundamentals. 2/ The simulation entails positive U.S. real GDP growth surprise of about 1 percent relative to the baseline through 2015, triggering an earlier-than-expected tightening of Fed policy. Market interest rates rise due to an increase in risk premium outside the U.S. equal to one standard deviation in each Latin American country (for Costa Rica = 100 basis points).
0
15
30
45
60
Exports Imports
USA CanadaOther Central America MexicoOther Latin America EUOther Total
Geographic Distribution of Goods Exports and Imports (Percent of GDP, 2013)
-10
-5
0
5
10
15
-20
-10
0
10
20
30
2004
Q4
2005
Q4
2006
Q4
2007
Q4
2008
Q4
2009
Q4
2010
Q4
2011
Q4
2012
Q4
2013
Q4
CRI exportsU.S. GDP (rhs)
Growth in Real Exports of Goods and Services and U.S. Real GDP (Percent, y-o-y)
0
5
10
15
20
HND SLV NIC GTM DOM PAN CRI
Remittances as 2013 (Percent of GDP)
60
80
100
120
140
160
180
Apr-
13
Jun-
13
Aug-
13
Oct
-13
Dec
-13
Feb-
14
Apr-
14
Jun-
14
Aug-
14
Oct
-14
CRIAvg. CAPDR excl. CRI, NICAvg. LA5
EMBI Spreads(April 30, 2013 = 100)
-30
0
30
60
90
120
150
CRI PAN SLV HND GTM DOM
DomesticExternalPredicted Actual
Central America: Contribution to Changes in EMBI spread (May 2013 - January 2014)
-1.5
-1.0
-0.5
0.0
0.5
1.0
1.5
2013 2014 2015 2016 2017 2018
Consumption InvestmentNet exports GDP
The Impact of U.S. Tapering on Costa Rica's GDP (Deviation from baseline)

COSTA RICA
INTERNATIONAL MONETARY FUND 33
Figure 8. Costa Rica: Labor Market Structure and Growth Potential Labor force participation for men is at the regional level, albeit somewhat low for women...
...with relatively high levels of education....
...but some signs of persisting intergenerational inequality. Unemployment rates are high by regional standardsthough these indicators could be distorted by differences In the degree of informality across countries...
...disproportionately affecting the youth. Structural reforms estimated to raise potential growth by 2 percentage points over the medium term could help reduce unemployment rate by 3 percentage points.
Sources: WDI Household Surveys and Fund staff estimates.
0
20
40
60
80
100
120
CRI DOM SLV GTM HND NIC
Women Men
Labor Force Participation Rates(Percent of 15+ population, 2012)
LAC men
LAC women
0
10
20
30
40
50
60
70
80
CRI DOM SLV GTM HND NIC
Tertiary Secondary
Labor Force with Secondary and Tertiary School(Percent of labor force, 2012)
LAC secondary
LAC tertiary
3
5
7
9
11
13
15
17
< 6 6 yrs btw.6 and 11
11 yrs > 11
Distribution of Children's Years of Education(Conditional on head of household's years of education)
Median
10th 25th 75th 90th ptile.
Household head's years of schooling
0
5
10
15
20
25
30
CRI DOM SLV GTM HND NIC
Women Men
Unemployment Rates(Percent of labor force, 2012)
LAC men
LAC women
0
1
2
3
4
5
6
7
13 20 28 36 44 52 60 67
Unemployment Distribution by Age(Frequency in percent)
4
5
6
7
8
9
10
11
2012 2013 2014 2015 2016 2017 2018 2019
baseline: 4.2% growth
6.3% growth in 2019
Unemployment Rate Projections(Percent)
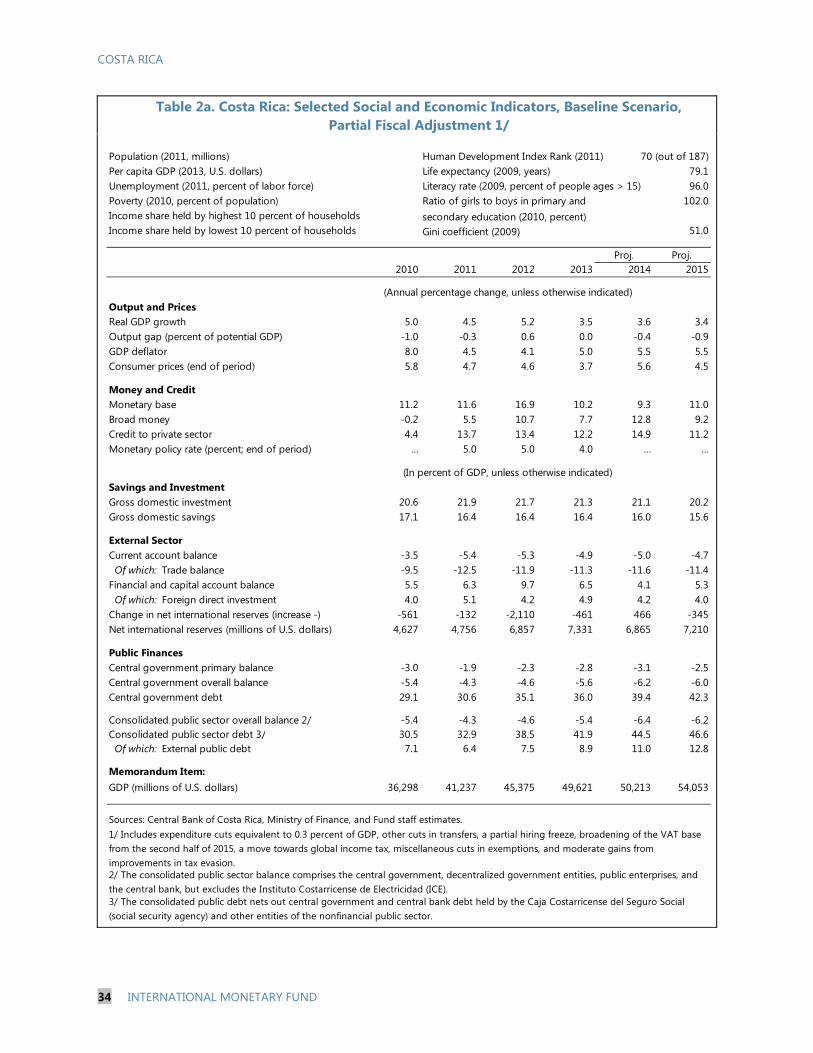
COSTA RICA
34 INTERNATIONAL MONETARY FUND
Table 2a. Costa Rica: Selected Social and Economic Indicators, Baseline Scenario, Partial Fiscal Adjustment 1/
Population (2011, millions) Human Development Index Rank (2011) 70 (out of 187)Per capita GDP (2013, U.S. dollars) Life expectancy (2009, years) 79.1Unemployment (2011, percent of labor force) Literacy rate (2009, percent of people ages > 15) 96.0Poverty (2010, percent of population) Ratio of girls to boys in primary and 102.0Income share held by highest 10 percent of households secondary education (2010, percent)Income share held by lowest 10 percent of households Gini coefficient (2009) 51.0
Proj. Proj.2010 2011 2012 2013 2014 2015
Output and PricesReal GDP growth 5.0 4.5 5.2 3.5 3.6 3.4Output gap (percent of potential GDP) -1.0 -0.3 0.6 0.0 -0.4 -0.9GDP deflator 8.0 4.5 4.1 5.0 5.5 5.5Consumer prices (end of period) 5.8 4.7 4.6 3.7 5.6 4.5
Money and CreditMonetary base 11.2 11.6 16.9 10.2 9.3 11.0Broad money -0.2 5.5 10.7 7.7 12.8 9.2Credit to private sector 4.4 13.7 13.4 12.2 14.9 11.2Monetary policy rate (percent; end of period) … 5.0 5.0 4.0 … …
Savings and InvestmentGross domestic investment 20.6 21.9 21.7 21.3 21.1 20.2Gross domestic savings 17.1 16.4 16.4 16.4 16.0 15.6
External SectorCurrent account balance -3.5 -5.4 -5.3 -4.9 -5.0 -4.7 Of which: Trade balance -9.5 -12.5 -11.9 -11.3 -11.6 -11.4Financial and capital account balance 5.5 6.3 9.7 6.5 4.1 5.3 Of which: Foreign direct investment 4.0 5.1 4.2 4.9 4.2 4.0Change in net international reserves (increase -) -561 -132 -2,110 -461 466 -345Net international reserves (millions of U.S. dollars) 4,627 4,756 6,857 7,331 6,865 7,210
Public FinancesCentral government primary balance -3.0 -1.9 -2.3 -2.8 -3.1 -2.5Central government overall balance -5.4 -4.3 -4.6 -5.6 -6.2 -6.0Central government debt 29.1 30.6 35.1 36.0 39.4 42.3
Consolidated public sector overall balance 2/ -5.4 -4.3 -4.6 -5.4 -6.4 -6.2Consolidated public sector debt 3/ 30.5 32.9 38.5 41.9 44.5 46.6 Of which: External public debt 7.1 6.4 7.5 8.9 11.0 12.8
Memorandum Item:GDP (millions of U.S. dollars) 36,298 41,237 45,375 49,621 50,213 54,053
Sources: Central Bank of Costa Rica, Ministry of Finance, and Fund staff estimates.
3/ The consolidated public debt nets out central government and central bank debt held by the Caja Costarricense del Seguro Social (social security agency) and other entities of the nonfinancial public sector.
(Annual percentage change, unless otherwise indicated)
(In percent of GDP, unless otherwise indicated)
2/ The consolidated public sector balance comprises the central government, decentralized government entities, public enterprises, and the central bank, but excludes the Instituto Costarricense de Electricidad (ICE).
1/ Includes expenditure cuts equivalent to 0.3 percent of GDP, other cuts in transfers, a partial hiring freeze, broadening of the VAT base from the second half of 2015, a move towards global income tax, miscellaneous cuts in exemptions, and moderate gains from improvements in tax evasion.
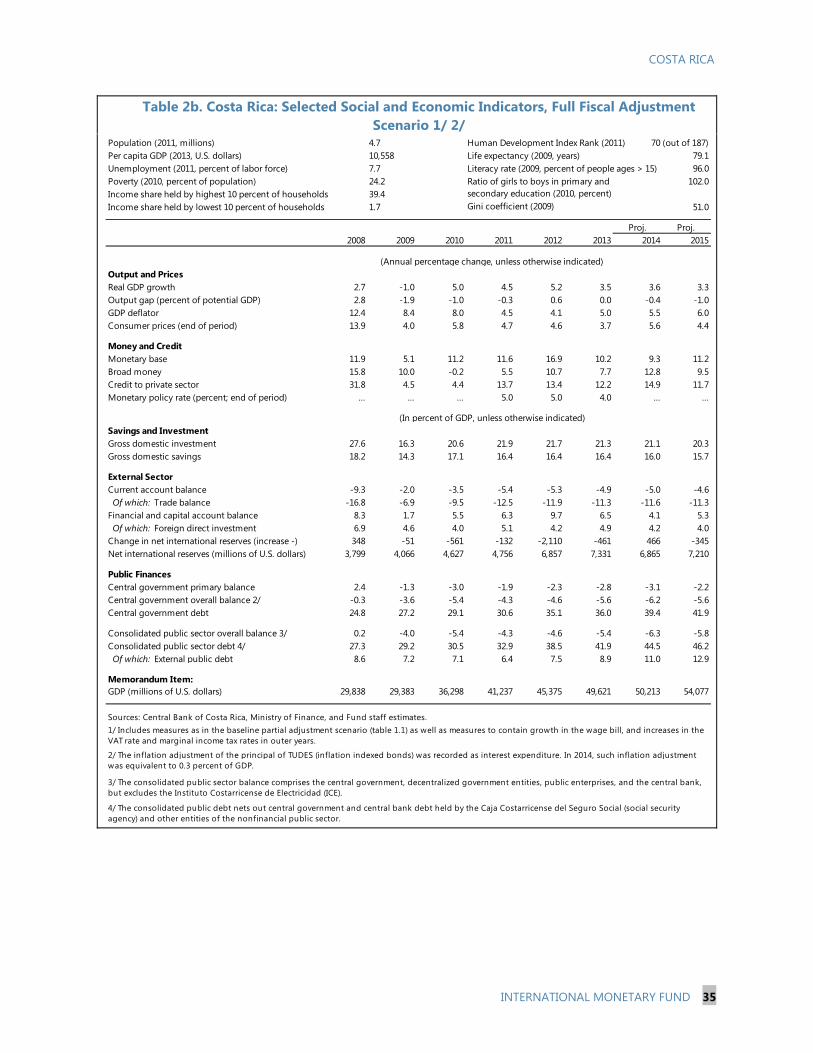
COSTA RICA
INTERNATIONAL MONETARY FUND 35
Table 2b. Costa Rica: Selected Social and Economic Indicators, Full Fiscal Adjustment Scenario 1/ 2/
Population (2011, millions) 4.7 Human Development Index Rank (2011) 70 (out of 187)Per capita GDP (2013, U.S. dollars) 10,558 Life expectancy (2009, years) 79.1Unemployment (2011, percent of labor force) 7.7 Literacy rate (2009, percent of people ages > 15) 96.0Poverty (2010, percent of population) 24.2 Ratio of girls to boys in primary and 102.0Income share held by highest 10 percent of households 39.4 secondary education (2010, percent)Income share held by lowest 10 percent of households 1.7 Gini coefficient (2009) 51.0
Proj. Proj.2008 2009 2010 2011 2012 2013 2014 2015
Output and PricesReal GDP growth 2.7 -1.0 5.0 4.5 5.2 3.5 3.6 3.3Output gap (percent of potential GDP) 2.8 -1.9 -1.0 -0.3 0.6 0.0 -0.4 -1.0GDP deflator 12.4 8.4 8.0 4.5 4.1 5.0 5.5 6.0Consumer prices (end of period) 13.9 4.0 5.8 4.7 4.6 3.7 5.6 4.4
Money and CreditMonetary base 11.9 5.1 11.2 11.6 16.9 10.2 9.3 11.2Broad money 15.8 10.0 -0.2 5.5 10.7 7.7 12.8 9.5Credit to private sector 31.8 4.5 4.4 13.7 13.4 12.2 14.9 11.7Monetary policy rate (percent; end of period) … … … 5.0 5.0 4.0 … …
Savings and InvestmentGross domestic investment 27.6 16.3 20.6 21.9 21.7 21.3 21.1 20.3Gross domestic savings 18.2 14.3 17.1 16.4 16.4 16.4 16.0 15.7
External SectorCurrent account balance -9.3 -2.0 -3.5 -5.4 -5.3 -4.9 -5.0 -4.6 Of which: Trade balance -16.8 -6.9 -9.5 -12.5 -11.9 -11.3 -11.6 -11.3Financial and capital account balance 8.3 1.7 5.5 6.3 9.7 6.5 4.1 5.3 Of which: Foreign direct investment 6.9 4.6 4.0 5.1 4.2 4.9 4.2 4.0Change in net international reserves (increase -) 348 -51 -561 -132 -2,110 -461 466 -345Net international reserves (millions of U.S. dollars) 3,799 4,066 4,627 4,756 6,857 7,331 6,865 7,210
Public FinancesCentral government primary balance 2.4 -1.3 -3.0 -1.9 -2.3 -2.8 -3.1 -2.2Central government overall balance 2/ -0.3 -3.6 -5.4 -4.3 -4.6 -5.6 -6.2 -5.6Central government debt 24.8 27.2 29.1 30.6 35.1 36.0 39.4 41.9
Consolidated public sector overall balance 3/ 0.2 -4.0 -5.4 -4.3 -4.6 -5.4 -6.3 -5.8Consolidated public sector debt 4/ 27.3 29.2 30.5 32.9 38.5 41.9 44.5 46.2 Of which: External public debt 8.6 7.2 7.1 6.4 7.5 8.9 11.0 12.9
Memorandum Item:GDP (millions of U.S. dollars) 29,838 29,383 36,298 41,237 45,375 49,621 50,213 54,077
Sources: Central Bank of Costa Rica, Ministry of Finance, and Fund staff estimates.
2/ The inflation adjustment of the principal of TUDES (inflation indexed bonds) was recorded as interest expenditure. In 2014, such inflation adjustmentwas equivalent to 0.3 percent of GDP.
4/ The consolidated public debt nets out central government and central bank debt held by the Caja Costarricense del Seguro Social (social security agency) and other entities of the nonfinancial public sector.
(Annual percentage change, unless otherwise indicated)
(In percent of GDP, unless otherwise indicated)
3/ The consolidated public sector balance comprises the central government, decentralized government entities, public enterprises, and the central bank, but excludes the Instituto Costarricense de Electricidad (ICE).
1/ Includes measures as in the baseline partial adjustment scenario (table 1.1) as well as measures to contain growth in the wage bill, and increases in the VAT rate and marginal income tax rates in outer years.
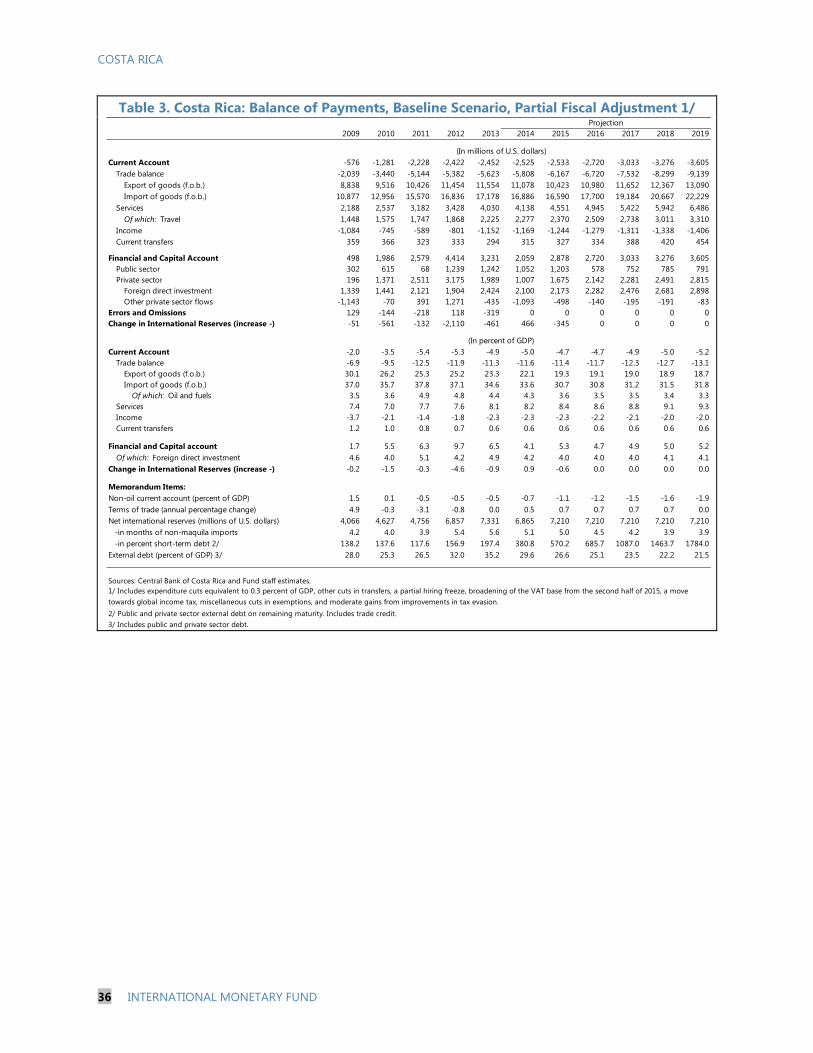
COSTA RICA
36 INTERNATIONAL MONETARY FUND
Table 3. Costa Rica: Balance of Payments, Baseline Scenario, Partial Fiscal Adjustment 1/
2009 2010 2011 2012 2013 2014 2015 2016 2017 2018 2019
Current Account -576 -1,281 -2,228 -2,422 -2,452 -2,525 -2,533 -2,720 -3,033 -3,276 -3,605Trade balance -2,039 -3,440 -5,144 -5,382 -5,623 -5,808 -6,167 -6,720 -7,532 -8,299 -9,139
Export of goods (f.o.b.) 8,838 9,516 10,426 11,454 11,554 11,078 10,423 10,980 11,652 12,367 13,090Import of goods (f.o.b.) 10,877 12,956 15,570 16,836 17,178 16,886 16,590 17,700 19,184 20,667 22,229
Services 2,188 2,537 3,182 3,428 4,030 4,138 4,551 4,945 5,422 5,942 6,486Of which: Travel 1,448 1,575 1,747 1,868 2,225 2,277 2,370 2,509 2,738 3,011 3,310
Income -1,084 -745 -589 -801 -1,152 -1,169 -1,244 -1,279 -1,311 -1,338 -1,406Current transfers 359 366 323 333 294 315 327 334 388 420 454
Financial and Capital Account 498 1,986 2,579 4,414 3,231 2,059 2,878 2,720 3,033 3,276 3,605Public sector 302 615 68 1,239 1,242 1,052 1,203 578 752 785 791Private sector 196 1,371 2,511 3,175 1,989 1,007 1,675 2,142 2,281 2,491 2,815
Foreign direct investment 1,339 1,441 2,121 1,904 2,424 2,100 2,173 2,282 2,476 2,681 2,898Other private sector flows -1,143 -70 391 1,271 -435 -1,093 -498 -140 -195 -191 -83
Errors and Omissions 129 -144 -218 118 -319 0 0 0 0 0 0Change in International Reserves (increase -) -51 -561 -132 -2,110 -461 466 -345 0 0 0 0
Current Account -2.0 -3.5 -5.4 -5.3 -4.9 -5.0 -4.7 -4.7 -4.9 -5.0 -5.2Trade balance -6.9 -9.5 -12.5 -11.9 -11.3 -11.6 -11.4 -11.7 -12.3 -12.7 -13.1
Export of goods (f.o.b.) 30.1 26.2 25.3 25.2 23.3 22.1 19.3 19.1 19.0 18.9 18.7Import of goods (f.o.b.) 37.0 35.7 37.8 37.1 34.6 33.6 30.7 30.8 31.2 31.5 31.8
Of which: Oil and fuels 3.5 3.6 4.9 4.8 4.4 4.3 3.6 3.5 3.5 3.4 3.3Services 7.4 7.0 7.7 7.6 8.1 8.2 8.4 8.6 8.8 9.1 9.3Income -3.7 -2.1 -1.4 -1.8 -2.3 -2.3 -2.3 -2.2 -2.1 -2.0 -2.0Current transfers 1.2 1.0 0.8 0.7 0.6 0.6 0.6 0.6 0.6 0.6 0.6
Financial and Capital account 1.7 5.5 6.3 9.7 6.5 4.1 5.3 4.7 4.9 5.0 5.2Of which: Foreign direct investment 4.6 4.0 5.1 4.2 4.9 4.2 4.0 4.0 4.0 4.1 4.1
Change in International Reserves (increase -) -0.2 -1.5 -0.3 -4.6 -0.9 0.9 -0.6 0.0 0.0 0.0 0.0
Memorandum Items:Non-oil current account (percent of GDP) 1.5 0.1 -0.5 -0.5 -0.5 -0.7 -1.1 -1.2 -1.5 -1.6 -1.9Terms of trade (annual percentage change) 4.9 -0.3 -3.1 -0.8 0.0 0.5 0.7 0.7 0.7 0.7 0.0Net international reserves (millions of U.S. dollars) 4,066 4,627 4,756 6,857 7,331 6,865 7,210 7,210 7,210 7,210 7,210 -in months of non-maquila imports 4.2 4.0 3.9 5.4 5.6 5.1 5.0 4.5 4.2 3.9 3.9 -in percent short-term debt 2/ 138.2 137.6 117.6 156.9 197.4 380.8 570.2 685.7 1087.0 1463.7 1784.0External debt (percent of GDP) 3/ 28.0 25.3 26.5 32.0 35.2 29.6 26.6 25.1 23.5 22.2 21.5
Sources: Central Bank of Costa Rica and Fund staff estimates.
2/ Public and private sector external debt on remaining maturity. Includes trade credit.3/ Includes public and private sector debt.
1/ Includes expenditure cuts equivalent to 0.3 percent of GDP, other cuts in transfers, a partial hiring freeze, broadening of the VAT base from the second half of 2015, a move towards global income tax, miscellaneous cuts in exemptions, and moderate gains from improvements in tax evasion.
(In percent of GDP)
(In millions of U.S. dollars)
Projection
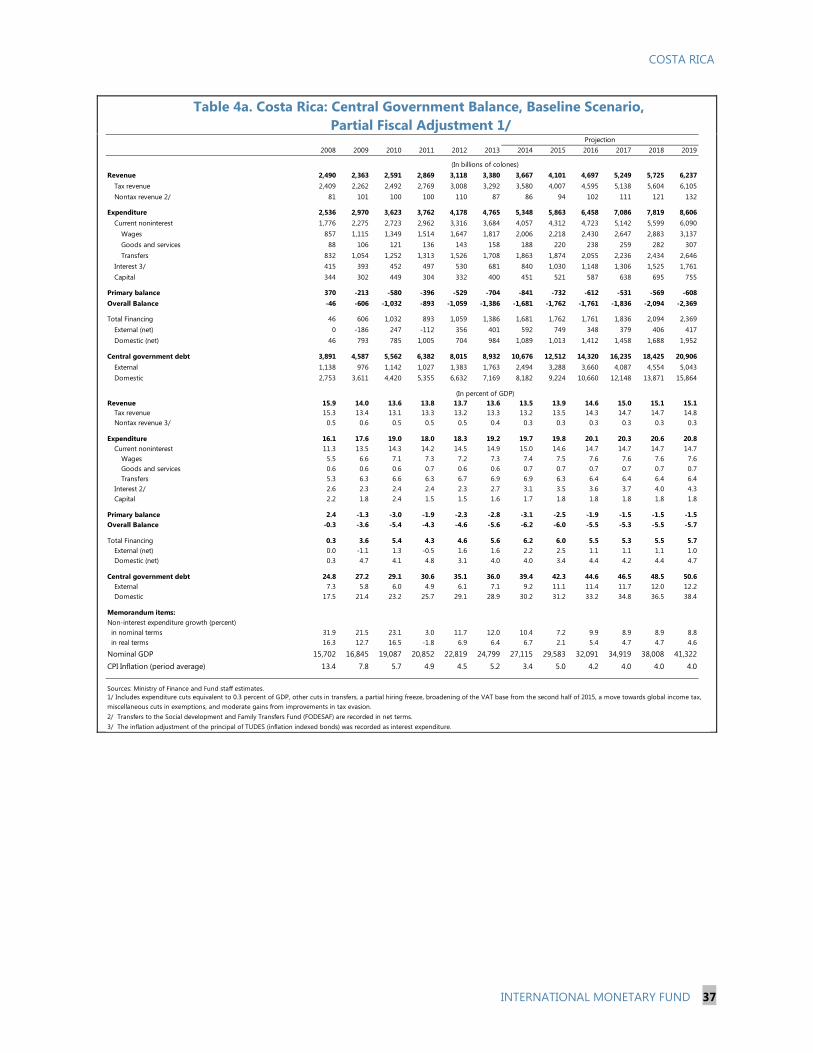
COSTA RICA
INTERNATIONAL MONETARY FUND 37
Table 4a. Costa Rica: Central Government Balance, Baseline Scenario, Partial Fiscal Adjustment 1/
2008 2009 2010 2011 2012 2013 2014 2015 2016 2017 2018 2019
Revenue 2,490 2,363 2,591 2,869 3,118 3,380 3,667 4,101 4,697 5,249 5,725 6,237Tax revenue 2,409 2,262 2,492 2,769 3,008 3,292 3,580 4,007 4,595 5,138 5,604 6,105Nontax revenue 2/ 81 101 100 100 110 87 86 94 102 111 121 132
Expenditure 2,536 2,970 3,623 3,762 4,178 4,765 5,348 5,863 6,458 7,086 7,819 8,606Current noninterest 1,776 2,275 2,723 2,962 3,316 3,684 4,057 4,312 4,723 5,142 5,599 6,090
Wages 857 1,115 1,349 1,514 1,647 1,817 2,006 2,218 2,430 2,647 2,883 3,137Goods and services 88 106 121 136 143 158 188 220 238 259 282 307Transfers 832 1,054 1,252 1,313 1,526 1,708 1,863 1,874 2,055 2,236 2,434 2,646
Interest 3/ 415 393 452 497 530 681 840 1,030 1,148 1,306 1,525 1,761Capital 344 302 449 304 332 400 451 521 587 638 695 755
Primary balance 370 -213 -580 -396 -529 -704 -841 -732 -612 -531 -569 -608Overall Balance -46 -606 -1,032 -893 -1,059 -1,386 -1,681 -1,762 -1,761 -1,836 -2,094 -2,369
Total Financing 46 606 1,032 893 1,059 1,386 1,681 1,762 1,761 1,836 2,094 2,369External (net) 0 -186 247 -112 356 401 592 749 348 379 406 417Domestic (net) 46 793 785 1,005 704 984 1,089 1,013 1,412 1,458 1,688 1,952
Central government debt 3,891 4,587 5,562 6,382 8,015 8,932 10,676 12,512 14,320 16,235 18,425 20,906External 1,138 976 1,142 1,027 1,383 1,763 2,494 3,288 3,660 4,087 4,554 5,043Domestic 2,753 3,611 4,420 5,355 6,632 7,169 8,182 9,224 10,660 12,148 13,871 15,864
Revenue 15.9 14.0 13.6 13.8 13.7 13.6 13.5 13.9 14.6 15.0 15.1 15.1Tax revenue 15.3 13.4 13.1 13.3 13.2 13.3 13.2 13.5 14.3 14.7 14.7 14.8Nontax revenue 3/ 0.5 0.6 0.5 0.5 0.5 0.4 0.3 0.3 0.3 0.3 0.3 0.3
Expenditure 16.1 17.6 19.0 18.0 18.3 19.2 19.7 19.8 20.1 20.3 20.6 20.8Current noninterest 11.3 13.5 14.3 14.2 14.5 14.9 15.0 14.6 14.7 14.7 14.7 14.7
Wages 5.5 6.6 7.1 7.3 7.2 7.3 7.4 7.5 7.6 7.6 7.6 7.6Goods and services 0.6 0.6 0.6 0.7 0.6 0.6 0.7 0.7 0.7 0.7 0.7 0.7Transfers 5.3 6.3 6.6 6.3 6.7 6.9 6.9 6.3 6.4 6.4 6.4 6.4
Interest 2/ 2.6 2.3 2.4 2.4 2.3 2.7 3.1 3.5 3.6 3.7 4.0 4.3Capital 2.2 1.8 2.4 1.5 1.5 1.6 1.7 1.8 1.8 1.8 1.8 1.8
Primary balance 2.4 -1.3 -3.0 -1.9 -2.3 -2.8 -3.1 -2.5 -1.9 -1.5 -1.5 -1.5Overall Balance -0.3 -3.6 -5.4 -4.3 -4.6 -5.6 -6.2 -6.0 -5.5 -5.3 -5.5 -5.7
Total Financing 0.3 3.6 5.4 4.3 4.6 5.6 6.2 6.0 5.5 5.3 5.5 5.7External (net) 0.0 -1.1 1.3 -0.5 1.6 1.6 2.2 2.5 1.1 1.1 1.1 1.0Domestic (net) 0.3 4.7 4.1 4.8 3.1 4.0 4.0 3.4 4.4 4.2 4.4 4.7
Central government debt 24.8 27.2 29.1 30.6 35.1 36.0 39.4 42.3 44.6 46.5 48.5 50.6External 7.3 5.8 6.0 4.9 6.1 7.1 9.2 11.1 11.4 11.7 12.0 12.2Domestic 17.5 21.4 23.2 25.7 29.1 28.9 30.2 31.2 33.2 34.8 36.5 38.4
Memorandum items:Non-interest expenditure growth (percent) in nominal terms 31.9 21.5 23.1 3.0 11.7 12.0 10.4 7.2 9.9 8.9 8.9 8.8 in real terms 16.3 12.7 16.5 -1.8 6.9 6.4 6.7 2.1 5.4 4.7 4.7 4.6
Nominal GDP 15,702 16,845 19,087 20,852 22,819 24,799 27,115 29,583 32,091 34,919 38,008 41,322CPI Inflation (period average) 13.4 7.8 5.7 4.9 4.5 5.2 3.4 5.0 4.2 4.0 4.0 4.0
Sources: Ministry of Finance and Fund staff estimates.
2/ Transfers to the Social development and Family Transfers Fund (FODESAF) are recorded in net terms.3/ The inflation adjustment of the principal of TUDES (inflation indexed bonds) was recorded as interest expenditure.
(In billions of colones)
(In percent of GDP)
Projection
1/ Includes expenditure cuts equivalent to 0.3 percent of GDP, other cuts in transfers, a partial hiring freeze, broadening of the VAT base from the second half of 2015, a move towards global income tax, miscellaneous cuts in exemptions, and moderate gains from improvements in tax evasion.
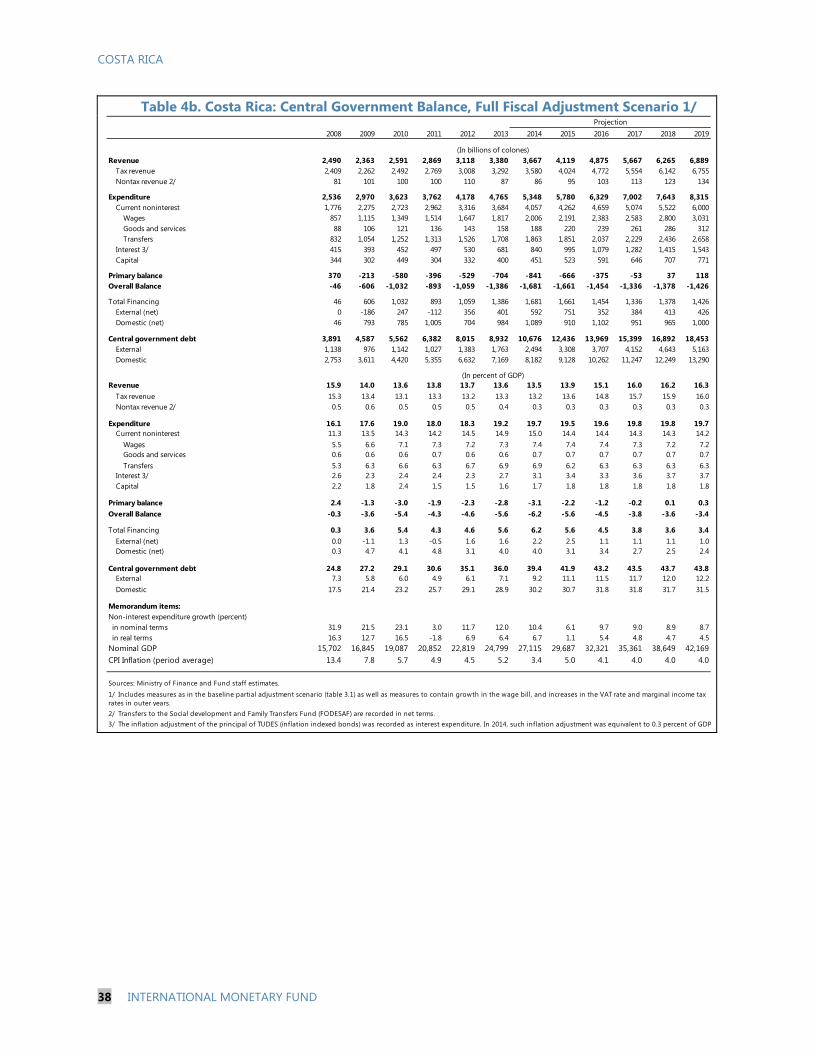
COSTA RICA
38 INTERNATIONAL MONETARY FUND
Table 4b. Costa Rica: Central Government Balance, Full Fiscal Adjustment Scenario 1/
2008 2009 2010 2011 2012 2013 2014 2015 2016 2017 2018 2019
Revenue 2,490 2,363 2,591 2,869 3,118 3,380 3,667 4,119 4,875 5,667 6,265 6,889Tax revenue 2,409 2,262 2,492 2,769 3,008 3,292 3,580 4,024 4,772 5,554 6,142 6,755Nontax revenue 2/ 81 101 100 100 110 87 86 95 103 113 123 134
Expenditure 2,536 2,970 3,623 3,762 4,178 4,765 5,348 5,780 6,329 7,002 7,643 8,315Current noninterest 1,776 2,275 2,723 2,962 3,316 3,684 4,057 4,262 4,659 5,074 5,522 6,000
Wages 857 1,115 1,349 1,514 1,647 1,817 2,006 2,191 2,383 2,583 2,800 3,031Goods and services 88 106 121 136 143 158 188 220 239 261 286 312Transfers 832 1,054 1,252 1,313 1,526 1,708 1,863 1,851 2,037 2,229 2,436 2,658
Interest 3/ 415 393 452 497 530 681 840 995 1,079 1,282 1,415 1,543Capital 344 302 449 304 332 400 451 523 591 646 707 771
Primary balance 370 -213 -580 -396 -529 -704 -841 -666 -375 -53 37 118Overall Balance -46 -606 -1,032 -893 -1,059 -1,386 -1,681 -1,661 -1,454 -1,336 -1,378 -1,426
Total Financing 46 606 1,032 893 1,059 1,386 1,681 1,661 1,454 1,336 1,378 1,426External (net) 0 -186 247 -112 356 401 592 751 352 384 413 426Domestic (net) 46 793 785 1,005 704 984 1,089 910 1,102 951 965 1,000
Central government debt 3,891 4,587 5,562 6,382 8,015 8,932 10,676 12,436 13,969 15,399 16,892 18,453External 1,138 976 1,142 1,027 1,383 1,763 2,494 3,308 3,707 4,152 4,643 5,163Domestic 2,753 3,611 4,420 5,355 6,632 7,169 8,182 9,128 10,262 11,247 12,249 13,290
Revenue 15.9 14.0 13.6 13.8 13.7 13.6 13.5 13.9 15.1 16.0 16.2 16.3Tax revenue 15.3 13.4 13.1 13.3 13.2 13.3 13.2 13.6 14.8 15.7 15.9 16.0Nontax revenue 2/ 0.5 0.6 0.5 0.5 0.5 0.4 0.3 0.3 0.3 0.3 0.3 0.3
Expenditure 16.1 17.6 19.0 18.0 18.3 19.2 19.7 19.5 19.6 19.8 19.8 19.7Current noninterest 11.3 13.5 14.3 14.2 14.5 14.9 15.0 14.4 14.4 14.3 14.3 14.2
Wages 5.5 6.6 7.1 7.3 7.2 7.3 7.4 7.4 7.4 7.3 7.2 7.2Goods and services 0.6 0.6 0.6 0.7 0.6 0.6 0.7 0.7 0.7 0.7 0.7 0.7Transfers 5.3 6.3 6.6 6.3 6.7 6.9 6.9 6.2 6.3 6.3 6.3 6.3
Interest 3/ 2.6 2.3 2.4 2.4 2.3 2.7 3.1 3.4 3.3 3.6 3.7 3.7Capital 2.2 1.8 2.4 1.5 1.5 1.6 1.7 1.8 1.8 1.8 1.8 1.8
Primary balance 2.4 -1.3 -3.0 -1.9 -2.3 -2.8 -3.1 -2.2 -1.2 -0.2 0.1 0.3Overall Balance -0.3 -3.6 -5.4 -4.3 -4.6 -5.6 -6.2 -5.6 -4.5 -3.8 -3.6 -3.4
Total Financing 0.3 3.6 5.4 4.3 4.6 5.6 6.2 5.6 4.5 3.8 3.6 3.4External (net) 0.0 -1.1 1.3 -0.5 1.6 1.6 2.2 2.5 1.1 1.1 1.1 1.0Domestic (net) 0.3 4.7 4.1 4.8 3.1 4.0 4.0 3.1 3.4 2.7 2.5 2.4
Central government debt 24.8 27.2 29.1 30.6 35.1 36.0 39.4 41.9 43.2 43.5 43.7 43.8External 7.3 5.8 6.0 4.9 6.1 7.1 9.2 11.1 11.5 11.7 12.0 12.2Domestic 17.5 21.4 23.2 25.7 29.1 28.9 30.2 30.7 31.8 31.8 31.7 31.5
Memorandum items:Non-interest expenditure growth (percent) in nominal terms 31.9 21.5 23.1 3.0 11.7 12.0 10.4 6.1 9.7 9.0 8.9 8.7 in real terms 16.3 12.7 16.5 -1.8 6.9 6.4 6.7 1.1 5.4 4.8 4.7 4.5Nominal GDP 15,702 16,845 19,087 20,852 22,819 24,799 27,115 29,687 32,321 35,361 38,649 42,169CPI Inflation (period average) 13.4 7.8 5.7 4.9 4.5 5.2 3.4 5.0 4.1 4.0 4.0 4.0
Sources: Ministry of Finance and Fund staff estimates.
2/ Transfers to the Social development and Family Transfers Fund (FODESAF) are recorded in net terms.3/ The inflation adjustment of the principal of TUDES (inflation indexed bonds) was recorded as interest expenditure. In 2014, such inflation adjustment was equivalent to 0.3 percent of GDP
(In billions of colones)
(In percent of GDP)
Projection
1/ Includes measures as in the baseline partial adjustment scenario (table 3.1) as well as measures to contain growth in the wage bill, and increases in the VAT rate and marginal income tax rates in outer years.
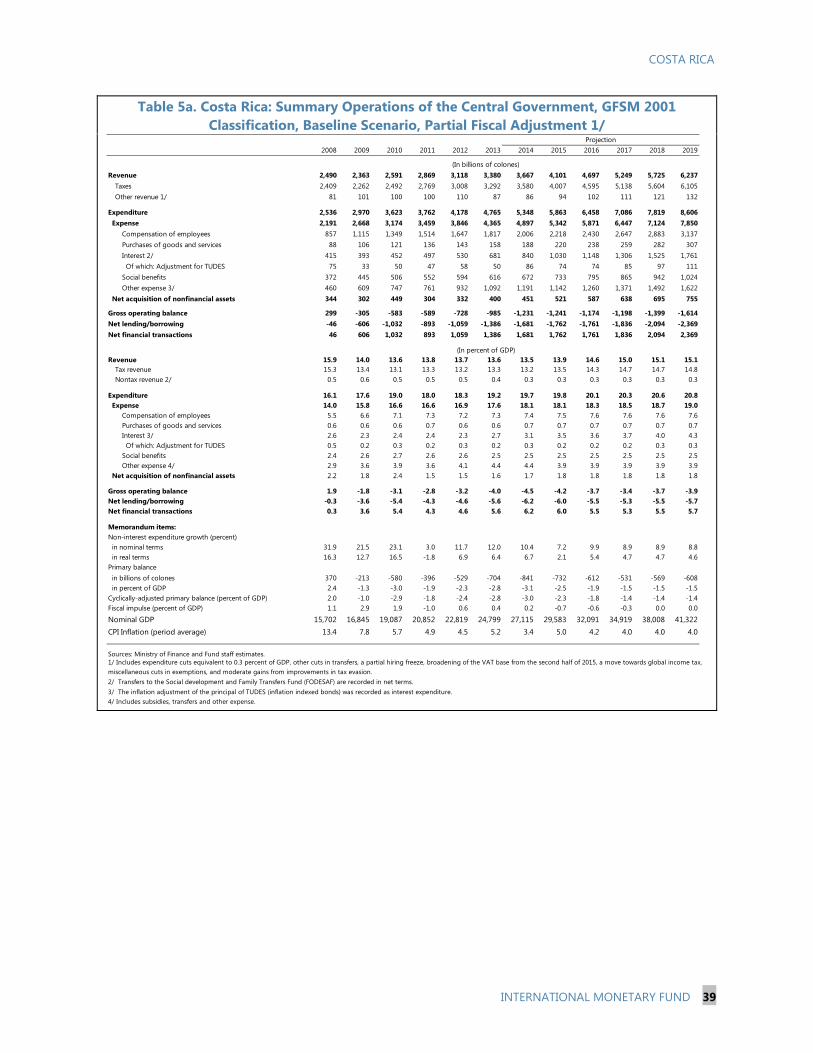
COSTA RICA
INTERNATIONAL MONETARY FUND 39
Table 5a. Costa Rica: Summary Operations of the Central Government, GFSM 2001 Classification, Baseline Scenario, Partial Fiscal Adjustment 1/
2008 2009 2010 2011 2012 2013 2014 2015 2016 2017 2018 2019
Revenue 2,490 2,363 2,591 2,869 3,118 3,380 3,667 4,101 4,697 5,249 5,725 6,237Taxes 2,409 2,262 2,492 2,769 3,008 3,292 3,580 4,007 4,595 5,138 5,604 6,105Other revenue 1/ 81 101 100 100 110 87 86 94 102 111 121 132
Expenditure 2,536 2,970 3,623 3,762 4,178 4,765 5,348 5,863 6,458 7,086 7,819 8,606 Expense 2,191 2,668 3,174 3,459 3,846 4,365 4,897 5,342 5,871 6,447 7,124 7,850
Compensation of employees 857 1,115 1,349 1,514 1,647 1,817 2,006 2,218 2,430 2,647 2,883 3,137Purchases of goods and services 88 106 121 136 143 158 188 220 238 259 282 307Interest 2/ 415 393 452 497 530 681 840 1,030 1,148 1,306 1,525 1,761 Of which: Adjustment for TUDES 75 33 50 47 58 50 86 74 74 85 97 111Social benefits 372 445 506 552 594 616 672 733 795 865 942 1,024Other expense 3/ 460 609 747 761 932 1,092 1,191 1,142 1,260 1,371 1,492 1,622
Net acquisition of nonfinancial assets 344 302 449 304 332 400 451 521 587 638 695 755
Gross operating balance 299 -305 -583 -589 -728 -985 -1,231 -1,241 -1,174 -1,198 -1,399 -1,614Net lending/borrowing -46 -606 -1,032 -893 -1,059 -1,386 -1,681 -1,762 -1,761 -1,836 -2,094 -2,369Net financial transactions 46 606 1,032 893 1,059 1,386 1,681 1,762 1,761 1,836 2,094 2,369
Revenue 15.9 14.0 13.6 13.8 13.7 13.6 13.5 13.9 14.6 15.0 15.1 15.1Tax revenue 15.3 13.4 13.1 13.3 13.2 13.3 13.2 13.5 14.3 14.7 14.7 14.8Nontax revenue 2/ 0.5 0.6 0.5 0.5 0.5 0.4 0.3 0.3 0.3 0.3 0.3 0.3
Expenditure 16.1 17.6 19.0 18.0 18.3 19.2 19.7 19.8 20.1 20.3 20.6 20.8 Expense 14.0 15.8 16.6 16.6 16.9 17.6 18.1 18.1 18.3 18.5 18.7 19.0
Compensation of employees 5.5 6.6 7.1 7.3 7.2 7.3 7.4 7.5 7.6 7.6 7.6 7.6Purchases of goods and services 0.6 0.6 0.6 0.7 0.6 0.6 0.7 0.7 0.7 0.7 0.7 0.7Interest 3/ 2.6 2.3 2.4 2.4 2.3 2.7 3.1 3.5 3.6 3.7 4.0 4.3 Of which: Adjustment for TUDES 0.5 0.2 0.3 0.2 0.3 0.2 0.3 0.2 0.2 0.2 0.3 0.3Social benefits 2.4 2.6 2.7 2.6 2.6 2.5 2.5 2.5 2.5 2.5 2.5 2.5Other expense 4/ 2.9 3.6 3.9 3.6 4.1 4.4 4.4 3.9 3.9 3.9 3.9 3.9
Net acquisition of nonfinancial assets 2.2 1.8 2.4 1.5 1.5 1.6 1.7 1.8 1.8 1.8 1.8 1.8
Gross operating balance 1.9 -1.8 -3.1 -2.8 -3.2 -4.0 -4.5 -4.2 -3.7 -3.4 -3.7 -3.9Net lending/borrowing -0.3 -3.6 -5.4 -4.3 -4.6 -5.6 -6.2 -6.0 -5.5 -5.3 -5.5 -5.7Net financial transactions 0.3 3.6 5.4 4.3 4.6 5.6 6.2 6.0 5.5 5.3 5.5 5.7
Memorandum items:Non-interest expenditure growth (percent) in nominal terms 31.9 21.5 23.1 3.0 11.7 12.0 10.4 7.2 9.9 8.9 8.9 8.8 in real terms 16.3 12.7 16.5 -1.8 6.9 6.4 6.7 2.1 5.4 4.7 4.7 4.6Primary balance in billions of colones 370 -213 -580 -396 -529 -704 -841 -732 -612 -531 -569 -608 in percent of GDP 2.4 -1.3 -3.0 -1.9 -2.3 -2.8 -3.1 -2.5 -1.9 -1.5 -1.5 -1.5Cyclically-adjusted primary balance (percent of GDP) 2.0 -1.0 -2.9 -1.8 -2.4 -2.8 -3.0 -2.3 -1.8 -1.4 -1.4 -1.4Fiscal impulse (percent of GDP) 1.1 2.9 1.9 -1.0 0.6 0.4 0.2 -0.7 -0.6 -0.3 0.0 0.0
Nominal GDP 15,702 16,845 19,087 20,852 22,819 24,799 27,115 29,583 32,091 34,919 38,008 41,322CPI Inflation (period average) 13.4 7.8 5.7 4.9 4.5 5.2 3.4 5.0 4.2 4.0 4.0 4.0
Sources: Ministry of Finance and Fund staff estimates.
2/ Transfers to the Social development and Family Transfers Fund (FODESAF) are recorded in net terms.3/ The inflation adjustment of the principal of TUDES (inflation indexed bonds) was recorded as interest expenditure.4/ Includes subsidies, transfers and other expense.
(In billions of colones)
(In percent of GDP)
Projection
1/ Includes expenditure cuts equivalent to 0.3 percent of GDP, other cuts in transfers, a partial hiring freeze, broadening of the VAT base from the second half of 2015, a move towards global income tax, miscellaneous cuts in exemptions, and moderate gains from improvements in tax evasion.
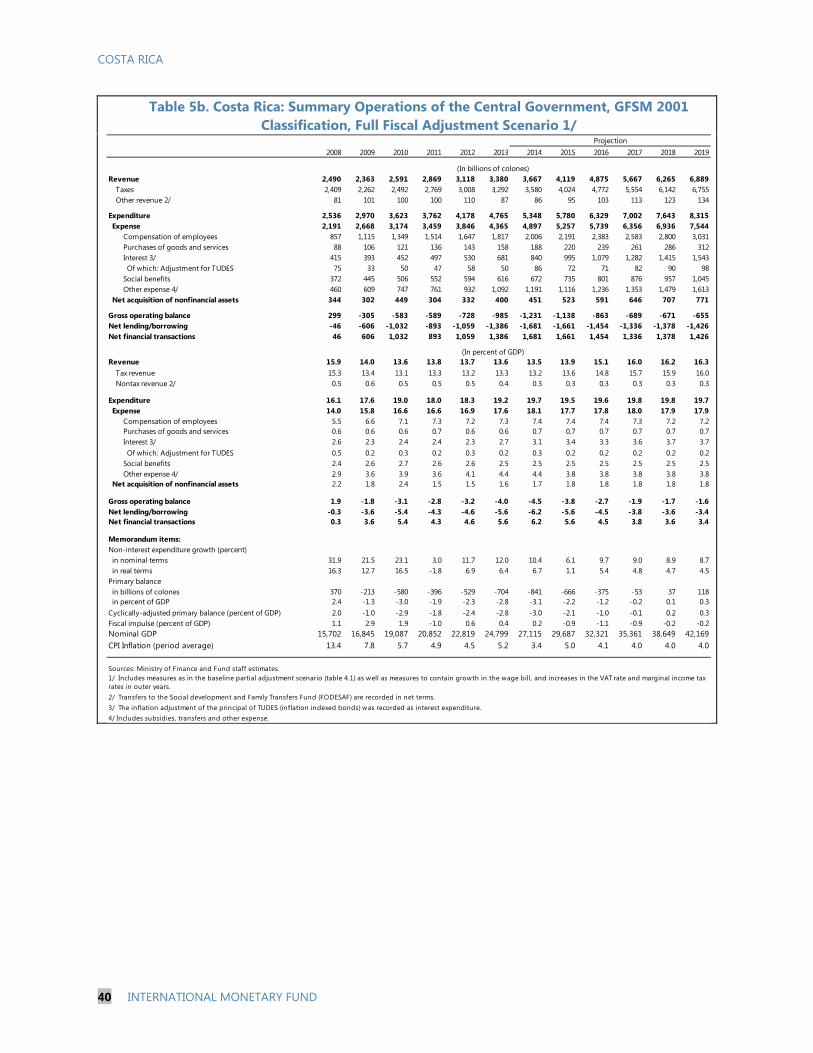
COSTA RICA
40 INTERNATIONAL MONETARY FUND
Table 5b. Costa Rica: Summary Operations of the Central Government, GFSM 2001 Classification, Full Fiscal Adjustment Scenario 1/
2008 2009 2010 2011 2012 2013 2014 2015 2016 2017 2018 2019
Revenue 2,490 2,363 2,591 2,869 3,118 3,380 3,667 4,119 4,875 5,667 6,265 6,889Taxes 2,409 2,262 2,492 2,769 3,008 3,292 3,580 4,024 4,772 5,554 6,142 6,755Other revenue 2/ 81 101 100 100 110 87 86 95 103 113 123 134
Expenditure 2,536 2,970 3,623 3,762 4,178 4,765 5,348 5,780 6,329 7,002 7,643 8,315 Expense 2,191 2,668 3,174 3,459 3,846 4,365 4,897 5,257 5,739 6,356 6,936 7,544
Compensation of employees 857 1,115 1,349 1,514 1,647 1,817 2,006 2,191 2,383 2,583 2,800 3,031Purchases of goods and services 88 106 121 136 143 158 188 220 239 261 286 312Interest 3/ 415 393 452 497 530 681 840 995 1,079 1,282 1,415 1,543 Of which: Adjustment for TUDES 75 33 50 47 58 50 86 72 71 82 90 98Social benefits 372 445 506 552 594 616 672 735 801 876 957 1,045Other expense 4/ 460 609 747 761 932 1,092 1,191 1,116 1,236 1,353 1,479 1,613
Net acquisition of nonfinancial assets 344 302 449 304 332 400 451 523 591 646 707 771
Gross operating balance 299 -305 -583 -589 -728 -985 -1,231 -1,138 -863 -689 -671 -655Net lending/borrowing -46 -606 -1,032 -893 -1,059 -1,386 -1,681 -1,661 -1,454 -1,336 -1,378 -1,426Net financial transactions 46 606 1,032 893 1,059 1,386 1,681 1,661 1,454 1,336 1,378 1,426
Revenue 15.9 14.0 13.6 13.8 13.7 13.6 13.5 13.9 15.1 16.0 16.2 16.3Tax revenue 15.3 13.4 13.1 13.3 13.2 13.3 13.2 13.6 14.8 15.7 15.9 16.0Nontax revenue 2/ 0.5 0.6 0.5 0.5 0.5 0.4 0.3 0.3 0.3 0.3 0.3 0.3
Expenditure 16.1 17.6 19.0 18.0 18.3 19.2 19.7 19.5 19.6 19.8 19.8 19.7 Expense 14.0 15.8 16.6 16.6 16.9 17.6 18.1 17.7 17.8 18.0 17.9 17.9
Compensation of employees 5.5 6.6 7.1 7.3 7.2 7.3 7.4 7.4 7.4 7.3 7.2 7.2Purchases of goods and services 0.6 0.6 0.6 0.7 0.6 0.6 0.7 0.7 0.7 0.7 0.7 0.7Interest 3/ 2.6 2.3 2.4 2.4 2.3 2.7 3.1 3.4 3.3 3.6 3.7 3.7 Of which: Adjustment for TUDES 0.5 0.2 0.3 0.2 0.3 0.2 0.3 0.2 0.2 0.2 0.2 0.2Social benefits 2.4 2.6 2.7 2.6 2.6 2.5 2.5 2.5 2.5 2.5 2.5 2.5Other expense 4/ 2.9 3.6 3.9 3.6 4.1 4.4 4.4 3.8 3.8 3.8 3.8 3.8
Net acquisition of nonfinancial assets 2.2 1.8 2.4 1.5 1.5 1.6 1.7 1.8 1.8 1.8 1.8 1.8
Gross operating balance 1.9 -1.8 -3.1 -2.8 -3.2 -4.0 -4.5 -3.8 -2.7 -1.9 -1.7 -1.6Net lending/borrowing -0.3 -3.6 -5.4 -4.3 -4.6 -5.6 -6.2 -5.6 -4.5 -3.8 -3.6 -3.4Net financial transactions 0.3 3.6 5.4 4.3 4.6 5.6 6.2 5.6 4.5 3.8 3.6 3.4
Memorandum items:Non-interest expenditure growth (percent) in nominal terms 31.9 21.5 23.1 3.0 11.7 12.0 10.4 6.1 9.7 9.0 8.9 8.7 in real terms 16.3 12.7 16.5 -1.8 6.9 6.4 6.7 1.1 5.4 4.8 4.7 4.5Primary balance in billions of colones 370 -213 -580 -396 -529 -704 -841 -666 -375 -53 37 118 in percent of GDP 2.4 -1.3 -3.0 -1.9 -2.3 -2.8 -3.1 -2.2 -1.2 -0.2 0.1 0.3Cyclically-adjusted primary balance (percent of GDP) 2.0 -1.0 -2.9 -1.8 -2.4 -2.8 -3.0 -2.1 -1.0 -0.1 0.2 0.3Fiscal impulse (percent of GDP) 1.1 2.9 1.9 -1.0 0.6 0.4 0.2 -0.9 -1.1 -0.9 -0.2 -0.2Nominal GDP 15,702 16,845 19,087 20,852 22,819 24,799 27,115 29,687 32,321 35,361 38,649 42,169CPI Inflation (period average) 13.4 7.8 5.7 4.9 4.5 5.2 3.4 5.0 4.1 4.0 4.0 4.0
Sources: Ministry of Finance and Fund staff estimates.
2/ Transfers to the Social development and Family Transfers Fund (FODESAF) are recorded in net terms.3/ The inflation adjustment of the principal of TUDES (inflation indexed bonds) was recorded as interest expenditure.4/ Includes subsidies, transfers and other expense.
(In billions of colones)
(In percent of GDP)
Projection
1/ Includes measures as in the baseline partial adjustment scenario (table 4.1) as well as measures to contain growth in the wage bill, and increases in the VAT rate and marginal income tax rates in outer years.
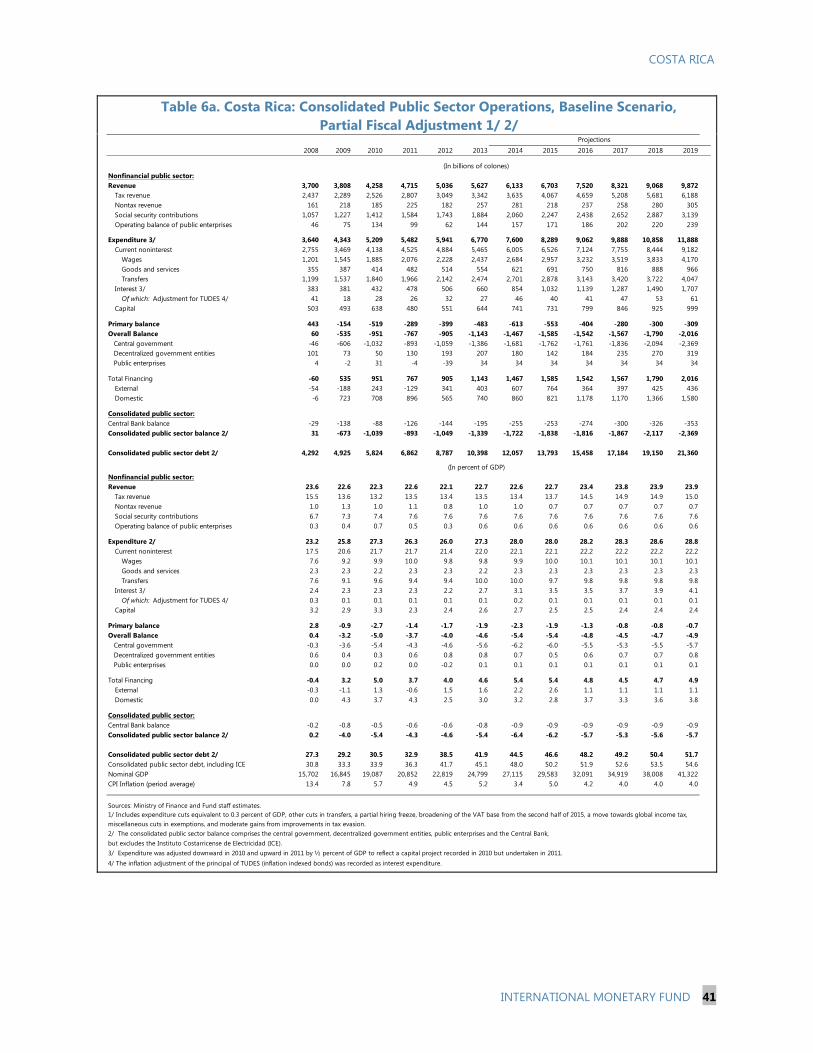
COSTA RICA
INTERNATIONAL MONETARY FUND 41
Table 6a. Costa Rica: Consolidated Public Sector Operations, Baseline Scenario, Partial Fiscal Adjustment 1/ 2/
2008 2009 2010 2011 2012 2013 2014 2015 2016 2017 2018 2019
Nonfinancial public sector:Revenue 3,700 3,808 4,258 4,715 5,036 5,627 6,133 6,703 7,520 8,321 9,068 9,872
Tax revenue 2,437 2,289 2,526 2,807 3,049 3,342 3,635 4,067 4,659 5,208 5,681 6,188Nontax revenue 161 218 185 225 182 257 281 218 237 258 280 305Social security contributions 1,057 1,227 1,412 1,584 1,743 1,884 2,060 2,247 2,438 2,652 2,887 3,139Operating balance of public enterprises 46 75 134 99 62 144 157 171 186 202 220 239
Expenditure 3/ 3,640 4,343 5,209 5,482 5,941 6,770 7,600 8,289 9,062 9,888 10,858 11,888Current noninterest 2,755 3,469 4,138 4,525 4,884 5,465 6,005 6,526 7,124 7,755 8,444 9,182
Wages 1,201 1,545 1,885 2,076 2,228 2,437 2,684 2,957 3,232 3,519 3,833 4,170Goods and services 355 387 414 482 514 554 621 691 750 816 888 966Transfers 1,199 1,537 1,840 1,966 2,142 2,474 2,701 2,878 3,143 3,420 3,722 4,047
Interest 3/ 383 381 432 478 506 660 854 1,032 1,139 1,287 1,490 1,707Of which: Adjustment for TUDES 4/ 41 18 28 26 32 27 46 40 41 47 53 61
Capital 503 493 638 480 551 644 741 731 799 846 925 999
Primary balance 443 -154 -519 -289 -399 -483 -613 -553 -404 -280 -300 -309Overall Balance 60 -535 -951 -767 -905 -1,143 -1,467 -1,585 -1,542 -1,567 -1,790 -2,016 Central government -46 -606 -1,032 -893 -1,059 -1,386 -1,681 -1,762 -1,761 -1,836 -2,094 -2,369 Decentralized government entities 101 73 50 130 193 207 180 142 184 235 270 319 Public enterprises 4 -2 31 -4 -39 34 34 34 34 34 34 34
Total Financing -60 535 951 767 905 1,143 1,467 1,585 1,542 1,567 1,790 2,016External -54 -188 243 -129 341 403 607 764 364 397 425 436Domestic -6 723 708 896 565 740 860 821 1,178 1,170 1,366 1,580
Consolidated public sector:Central Bank balance -29 -138 -88 -126 -144 -195 -255 -253 -274 -300 -326 -353Consolidated public sector balance 2/ 31 -673 -1,039 -893 -1,049 -1,339 -1,722 -1,838 -1,816 -1,867 -2,117 -2,369
Consolidated public sector debt 2/ 4,292 4,925 5,824 6,862 8,787 10,398 12,057 13,793 15,458 17,184 19,150 21,360
Nonfinancial public sector:Revenue 23.6 22.6 22.3 22.6 22.1 22.7 22.6 22.7 23.4 23.8 23.9 23.9
Tax revenue 15.5 13.6 13.2 13.5 13.4 13.5 13.4 13.7 14.5 14.9 14.9 15.0Nontax revenue 1.0 1.3 1.0 1.1 0.8 1.0 1.0 0.7 0.7 0.7 0.7 0.7Social security contributions 6.7 7.3 7.4 7.6 7.6 7.6 7.6 7.6 7.6 7.6 7.6 7.6Operating balance of public enterprises 0.3 0.4 0.7 0.5 0.3 0.6 0.6 0.6 0.6 0.6 0.6 0.6
Expenditure 2/ 23.2 25.8 27.3 26.3 26.0 27.3 28.0 28.0 28.2 28.3 28.6 28.8Current noninterest 17.5 20.6 21.7 21.7 21.4 22.0 22.1 22.1 22.2 22.2 22.2 22.2
Wages 7.6 9.2 9.9 10.0 9.8 9.8 9.9 10.0 10.1 10.1 10.1 10.1Goods and services 2.3 2.3 2.2 2.3 2.3 2.2 2.3 2.3 2.3 2.3 2.3 2.3Transfers 7.6 9.1 9.6 9.4 9.4 10.0 10.0 9.7 9.8 9.8 9.8 9.8
Interest 3/ 2.4 2.3 2.3 2.3 2.2 2.7 3.1 3.5 3.5 3.7 3.9 4.1Of which: Adjustment for TUDES 4/ 0.3 0.1 0.1 0.1 0.1 0.1 0.2 0.1 0.1 0.1 0.1 0.1
Capital 3.2 2.9 3.3 2.3 2.4 2.6 2.7 2.5 2.5 2.4 2.4 2.4
Primary balance 2.8 -0.9 -2.7 -1.4 -1.7 -1.9 -2.3 -1.9 -1.3 -0.8 -0.8 -0.7Overall Balance 0.4 -3.2 -5.0 -3.7 -4.0 -4.6 -5.4 -5.4 -4.8 -4.5 -4.7 -4.9 Central government -0.3 -3.6 -5.4 -4.3 -4.6 -5.6 -6.2 -6.0 -5.5 -5.3 -5.5 -5.7 Decentralized government entities 0.6 0.4 0.3 0.6 0.8 0.8 0.7 0.5 0.6 0.7 0.7 0.8 Public enterprises 0.0 0.0 0.2 0.0 -0.2 0.1 0.1 0.1 0.1 0.1 0.1 0.1
Total Financing -0.4 3.2 5.0 3.7 4.0 4.6 5.4 5.4 4.8 4.5 4.7 4.9External -0.3 -1.1 1.3 -0.6 1.5 1.6 2.2 2.6 1.1 1.1 1.1 1.1Domestic 0.0 4.3 3.7 4.3 2.5 3.0 3.2 2.8 3.7 3.3 3.6 3.8
Consolidated public sector:Central Bank balance -0.2 -0.8 -0.5 -0.6 -0.6 -0.8 -0.9 -0.9 -0.9 -0.9 -0.9 -0.9Consolidated public sector balance 2/ 0.2 -4.0 -5.4 -4.3 -4.6 -5.4 -6.4 -6.2 -5.7 -5.3 -5.6 -5.7
Consolidated public sector debt 2/ 27.3 29.2 30.5 32.9 38.5 41.9 44.5 46.6 48.2 49.2 50.4 51.7Consolidated public sector debt, including ICE 30.8 33.3 33.9 36.3 41.7 45.1 48.0 50.2 51.9 52.6 53.5 54.6Nominal GDP 15,702 16,845 19,087 20,852 22,819 24,799 27,115 29,583 32,091 34,919 38,008 41,322CPI Inflation (period average) 13.4 7.8 5.7 4.9 4.5 5.2 3.4 5.0 4.2 4.0 4.0 4.0
Sources: Ministry of Finance and Fund staff estimates.
2/ The consolidated public sector balance comprises the central government, decentralized government entities, public enterprises and the Central Bank, but excludes the Instituto Costarricense de Electricidad (ICE).3/ Expenditure was adjusted downward in 2010 and upward in 2011 by ½ percent of GDP to reflect a capital project recorded in 2010 but undertaken in 2011.4/ The inflation adjustment of the principal of TUDES (inflation indexed bonds) was recorded as interest expenditure.
(In billions of colones)
(In percent of GDP)
Projections
1/ Includes expenditure cuts equivalent to 0.3 percent of GDP, other cuts in transfers, a partial hiring freeze, broadening of the VAT base from the second half of 2015, a move towards global income tax, miscellaneous cuts in exemptions, and moderate gains from improvements in tax evasion.
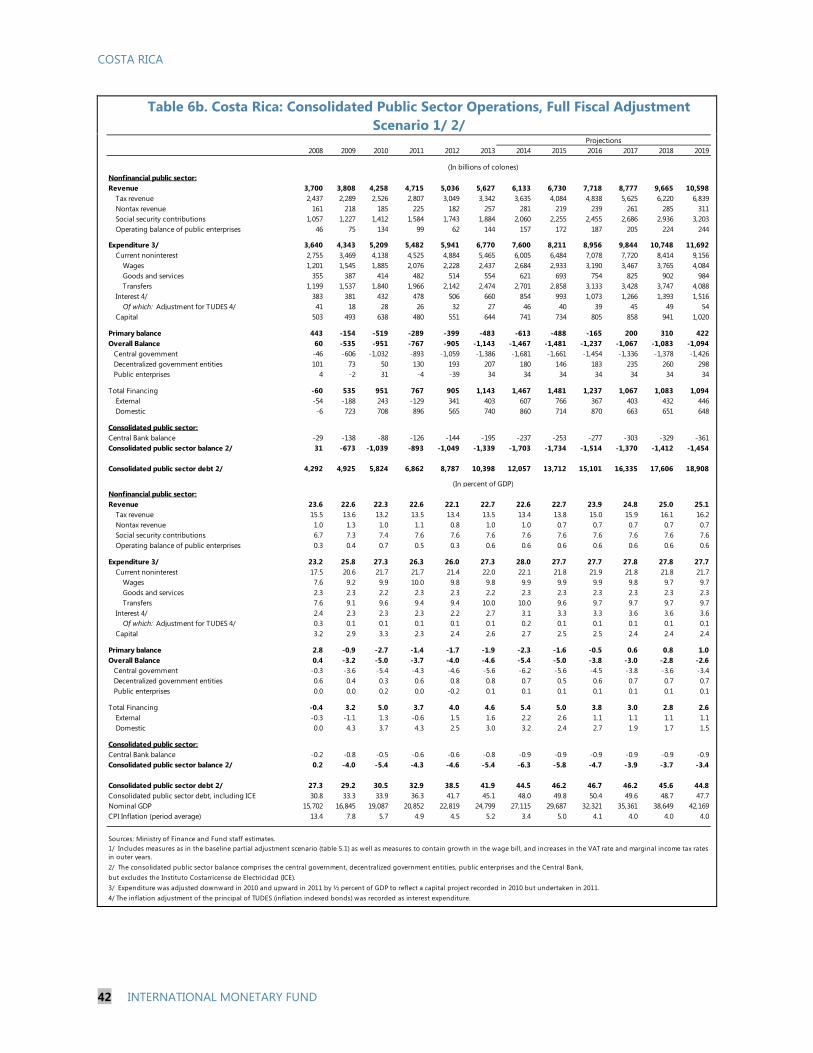
COSTA RICA
42 INTERNATIONAL MONETARY FUND
Table 6b. Costa Rica: Consolidated Public Sector Operations, Full Fiscal Adjustment Scenario 1/ 2/
2008 2009 2010 2011 2012 2013 2014 2015 2016 2017 2018 2019
Nonfinancial public sector:Revenue 3,700 3,808 4,258 4,715 5,036 5,627 6,133 6,730 7,718 8,777 9,665 10,598
Tax revenue 2,437 2,289 2,526 2,807 3,049 3,342 3,635 4,084 4,838 5,625 6,220 6,839Nontax revenue 161 218 185 225 182 257 281 219 239 261 285 311Social security contributions 1,057 1,227 1,412 1,584 1,743 1,884 2,060 2,255 2,455 2,686 2,936 3,203Operating balance of public enterprises 46 75 134 99 62 144 157 172 187 205 224 244
Expenditure 3/ 3,640 4,343 5,209 5,482 5,941 6,770 7,600 8,211 8,956 9,844 10,748 11,692Current noninterest 2,755 3,469 4,138 4,525 4,884 5,465 6,005 6,484 7,078 7,720 8,414 9,156
Wages 1,201 1,545 1,885 2,076 2,228 2,437 2,684 2,933 3,190 3,467 3,765 4,084Goods and services 355 387 414 482 514 554 621 693 754 825 902 984Transfers 1,199 1,537 1,840 1,966 2,142 2,474 2,701 2,858 3,133 3,428 3,747 4,088
Interest 4/ 383 381 432 478 506 660 854 993 1,073 1,266 1,393 1,516Of which: Adjustment for TUDES 4/ 41 18 28 26 32 27 46 40 39 45 49 54
Capital 503 493 638 480 551 644 741 734 805 858 941 1,020
Primary balance 443 -154 -519 -289 -399 -483 -613 -488 -165 200 310 422Overall Balance 60 -535 -951 -767 -905 -1,143 -1,467 -1,481 -1,237 -1,067 -1,083 -1,094 Central government -46 -606 -1,032 -893 -1,059 -1,386 -1,681 -1,661 -1,454 -1,336 -1,378 -1,426 Decentralized government entities 101 73 50 130 193 207 180 146 183 235 260 298 Public enterprises 4 -2 31 -4 -39 34 34 34 34 34 34 34
Total Financing -60 535 951 767 905 1,143 1,467 1,481 1,237 1,067 1,083 1,094External -54 -188 243 -129 341 403 607 766 367 403 432 446Domestic -6 723 708 896 565 740 860 714 870 663 651 648
Consolidated public sector:Central Bank balance -29 -138 -88 -126 -144 -195 -237 -253 -277 -303 -329 -361Consolidated public sector balance 2/ 31 -673 -1,039 -893 -1,049 -1,339 -1,703 -1,734 -1,514 -1,370 -1,412 -1,454
Consolidated public sector debt 2/ 4,292 4,925 5,824 6,862 8,787 10,398 12,057 13,712 15,101 16,335 17,606 18,908
Nonfinancial public sector:Revenue 23.6 22.6 22.3 22.6 22.1 22.7 22.6 22.7 23.9 24.8 25.0 25.1
Tax revenue 15.5 13.6 13.2 13.5 13.4 13.5 13.4 13.8 15.0 15.9 16.1 16.2Nontax revenue 1.0 1.3 1.0 1.1 0.8 1.0 1.0 0.7 0.7 0.7 0.7 0.7Social security contributions 6.7 7.3 7.4 7.6 7.6 7.6 7.6 7.6 7.6 7.6 7.6 7.6Operating balance of public enterprises 0.3 0.4 0.7 0.5 0.3 0.6 0.6 0.6 0.6 0.6 0.6 0.6
Expenditure 3/ 23.2 25.8 27.3 26.3 26.0 27.3 28.0 27.7 27.7 27.8 27.8 27.7Current noninterest 17.5 20.6 21.7 21.7 21.4 22.0 22.1 21.8 21.9 21.8 21.8 21.7
Wages 7.6 9.2 9.9 10.0 9.8 9.8 9.9 9.9 9.9 9.8 9.7 9.7Goods and services 2.3 2.3 2.2 2.3 2.3 2.2 2.3 2.3 2.3 2.3 2.3 2.3Transfers 7.6 9.1 9.6 9.4 9.4 10.0 10.0 9.6 9.7 9.7 9.7 9.7
Interest 4/ 2.4 2.3 2.3 2.3 2.2 2.7 3.1 3.3 3.3 3.6 3.6 3.6Of which: Adjustment for TUDES 4/ 0.3 0.1 0.1 0.1 0.1 0.1 0.2 0.1 0.1 0.1 0.1 0.1
Capital 3.2 2.9 3.3 2.3 2.4 2.6 2.7 2.5 2.5 2.4 2.4 2.4
Primary balance 2.8 -0.9 -2.7 -1.4 -1.7 -1.9 -2.3 -1.6 -0.5 0.6 0.8 1.0Overall Balance 0.4 -3.2 -5.0 -3.7 -4.0 -4.6 -5.4 -5.0 -3.8 -3.0 -2.8 -2.6 Central government -0.3 -3.6 -5.4 -4.3 -4.6 -5.6 -6.2 -5.6 -4.5 -3.8 -3.6 -3.4 Decentralized government entities 0.6 0.4 0.3 0.6 0.8 0.8 0.7 0.5 0.6 0.7 0.7 0.7 Public enterprises 0.0 0.0 0.2 0.0 -0.2 0.1 0.1 0.1 0.1 0.1 0.1 0.1
Total Financing -0.4 3.2 5.0 3.7 4.0 4.6 5.4 5.0 3.8 3.0 2.8 2.6External -0.3 -1.1 1.3 -0.6 1.5 1.6 2.2 2.6 1.1 1.1 1.1 1.1Domestic 0.0 4.3 3.7 4.3 2.5 3.0 3.2 2.4 2.7 1.9 1.7 1.5
Consolidated public sector:Central Bank balance -0.2 -0.8 -0.5 -0.6 -0.6 -0.8 -0.9 -0.9 -0.9 -0.9 -0.9 -0.9Consolidated public sector balance 2/ 0.2 -4.0 -5.4 -4.3 -4.6 -5.4 -6.3 -5.8 -4.7 -3.9 -3.7 -3.4
Consolidated public sector debt 2/ 27.3 29.2 30.5 32.9 38.5 41.9 44.5 46.2 46.7 46.2 45.6 44.8Consolidated public sector debt, including ICE 30.8 33.3 33.9 36.3 41.7 45.1 48.0 49.8 50.4 49.6 48.7 47.7Nominal GDP 15,702 16,845 19,087 20,852 22,819 24,799 27,115 29,687 32,321 35,361 38,649 42,169CPI Inflation (period average) 13.4 7.8 5.7 4.9 4.5 5.2 3.4 5.0 4.1 4.0 4.0 4.0
Sources: Ministry of Finance and Fund staff estimates.
2/ The consolidated public sector balance comprises the central government, decentralized government entities, public enterprises and the Central Bank, but excludes the Instituto Costarricense de Electricidad (ICE).3/ Expenditure was adjusted downward in 2010 and upward in 2011 by ½ percent of GDP to reflect a capital project recorded in 2010 but undertaken in 2011.4/ The inflation adjustment of the principal of TUDES (inflation indexed bonds) was recorded as interest expenditure.
(In billions of colones)
(In percent of GDP)
Projections
1/ Includes measures as in the baseline partial adjustment scenario (table 5.1) as well as measures to contain growth in the wage bill, and increases in the VAT rate and marginal income tax rates in outer years.
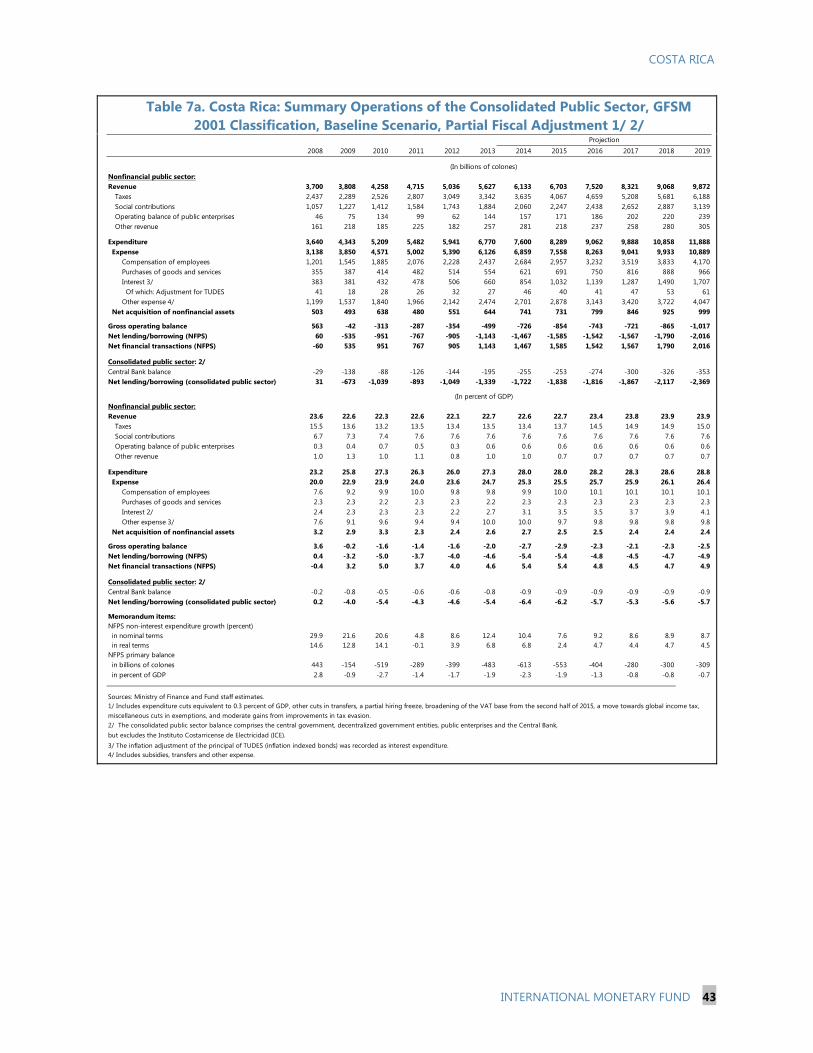
COSTA RICA
INTERNATIONAL MONETARY FUND 43
Table 7a. Costa Rica: Summary Operations of the Consolidated Public Sector, GFSM 2001 Classification, Baseline Scenario, Partial Fiscal Adjustment 1/ 2/
2008 2009 2010 2011 2012 2013 2014 2015 2016 2017 2018 2019
Nonfinancial public sector:Revenue 3,700 3,808 4,258 4,715 5,036 5,627 6,133 6,703 7,520 8,321 9,068 9,872
Taxes 2,437 2,289 2,526 2,807 3,049 3,342 3,635 4,067 4,659 5,208 5,681 6,188Social contributions 1,057 1,227 1,412 1,584 1,743 1,884 2,060 2,247 2,438 2,652 2,887 3,139Operating balance of public enterprises 46 75 134 99 62 144 157 171 186 202 220 239Other revenue 161 218 185 225 182 257 281 218 237 258 280 305
Expenditure 3,640 4,343 5,209 5,482 5,941 6,770 7,600 8,289 9,062 9,888 10,858 11,888 Expense 3,138 3,850 4,571 5,002 5,390 6,126 6,859 7,558 8,263 9,041 9,933 10,889
Compensation of employees 1,201 1,545 1,885 2,076 2,228 2,437 2,684 2,957 3,232 3,519 3,833 4,170Purchases of goods and services 355 387 414 482 514 554 621 691 750 816 888 966Interest 3/ 383 381 432 478 506 660 854 1,032 1,139 1,287 1,490 1,707 Of which: Adjustment for TUDES 41 18 28 26 32 27 46 40 41 47 53 61Other expense 4/ 1,199 1,537 1,840 1,966 2,142 2,474 2,701 2,878 3,143 3,420 3,722 4,047
Net acquisition of nonfinancial assets 503 493 638 480 551 644 741 731 799 846 925 999
Gross operating balance 563 -42 -313 -287 -354 -499 -726 -854 -743 -721 -865 -1,017Net lending/borrowing (NFPS) 60 -535 -951 -767 -905 -1,143 -1,467 -1,585 -1,542 -1,567 -1,790 -2,016Net financial transactions (NFPS) -60 535 951 767 905 1,143 1,467 1,585 1,542 1,567 1,790 2,016
Consolidated public sector: 2/Central Bank balance -29 -138 -88 -126 -144 -195 -255 -253 -274 -300 -326 -353Net lending/borrowing (consolidated public sector) 31 -673 -1,039 -893 -1,049 -1,339 -1,722 -1,838 -1,816 -1,867 -2,117 -2,369
Nonfinancial public sector:Revenue 23.6 22.6 22.3 22.6 22.1 22.7 22.6 22.7 23.4 23.8 23.9 23.9
Taxes 15.5 13.6 13.2 13.5 13.4 13.5 13.4 13.7 14.5 14.9 14.9 15.0Social contributions 6.7 7.3 7.4 7.6 7.6 7.6 7.6 7.6 7.6 7.6 7.6 7.6Operating balance of public enterprises 0.3 0.4 0.7 0.5 0.3 0.6 0.6 0.6 0.6 0.6 0.6 0.6Other revenue 1.0 1.3 1.0 1.1 0.8 1.0 1.0 0.7 0.7 0.7 0.7 0.7
Expenditure 23.2 25.8 27.3 26.3 26.0 27.3 28.0 28.0 28.2 28.3 28.6 28.8 Expense 20.0 22.9 23.9 24.0 23.6 24.7 25.3 25.5 25.7 25.9 26.1 26.4
Compensation of employees 7.6 9.2 9.9 10.0 9.8 9.8 9.9 10.0 10.1 10.1 10.1 10.1Purchases of goods and services 2.3 2.3 2.2 2.3 2.3 2.2 2.3 2.3 2.3 2.3 2.3 2.3Interest 2/ 2.4 2.3 2.3 2.3 2.2 2.7 3.1 3.5 3.5 3.7 3.9 4.1Other expense 3/ 7.6 9.1 9.6 9.4 9.4 10.0 10.0 9.7 9.8 9.8 9.8 9.8
Net acquisition of nonfinancial assets 3.2 2.9 3.3 2.3 2.4 2.6 2.7 2.5 2.5 2.4 2.4 2.4
Gross operating balance 3.6 -0.2 -1.6 -1.4 -1.6 -2.0 -2.7 -2.9 -2.3 -2.1 -2.3 -2.5Net lending/borrowing (NFPS) 0.4 -3.2 -5.0 -3.7 -4.0 -4.6 -5.4 -5.4 -4.8 -4.5 -4.7 -4.9Net financial transactions (NFPS) -0.4 3.2 5.0 3.7 4.0 4.6 5.4 5.4 4.8 4.5 4.7 4.9
Consolidated public sector: 2/Central Bank balance -0.2 -0.8 -0.5 -0.6 -0.6 -0.8 -0.9 -0.9 -0.9 -0.9 -0.9 -0.9Net lending/borrowing (consolidated public sector) 0.2 -4.0 -5.4 -4.3 -4.6 -5.4 -6.4 -6.2 -5.7 -5.3 -5.6 -5.7
Memorandum items:NFPS non-interest expenditure growth (percent) in nominal terms 29.9 21.6 20.6 4.8 8.6 12.4 10.4 7.6 9.2 8.6 8.9 8.7 in real terms 14.6 12.8 14.1 -0.1 3.9 6.8 6.8 2.4 4.7 4.4 4.7 4.5NFPS primary balance in billions of colones 443 -154 -519 -289 -399 -483 -613 -553 -404 -280 -300 -309 in percent of GDP 2.8 -0.9 -2.7 -1.4 -1.7 -1.9 -2.3 -1.9 -1.3 -0.8 -0.8 -0.7
Sources: Ministry of Finance and Fund staff estimates.
2/ The consolidated public sector balance comprises the central government, decentralized government entities, public enterprises and the Central Bank, but excludes the Instituto Costarricense de Electricidad (ICE).3/ The inflation adjustment of the principal of TUDES (inflation indexed bonds) was recorded as interest expenditure.4/ Includes subsidies, transfers and other expense.
(In billions of colones)
(In percent of GDP)
Projection
1/ Includes expenditure cuts equivalent to 0.3 percent of GDP, other cuts in transfers, a partial hiring freeze, broadening of the VAT base from the second half of 2015, a move towards global income tax, miscellaneous cuts in exemptions, and moderate gains from improvements in tax evasion.
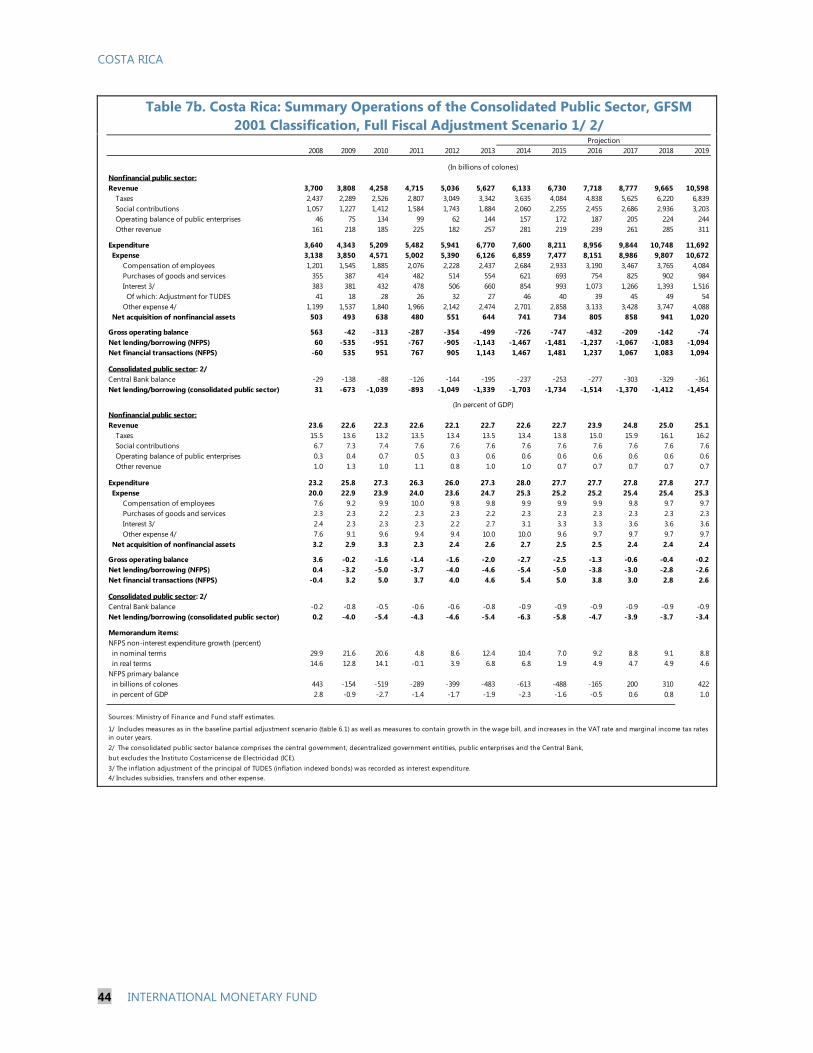
COSTA RICA
44 INTERNATIONAL MONETARY FUND
Table 7b. Costa Rica: Summary Operations of the Consolidated Public Sector, GFSM 2001 Classification, Full Fiscal Adjustment Scenario 1/ 2/
2008 2009 2010 2011 2012 2013 2014 2015 2016 2017 2018 2019
Nonfinancial public sector:Revenue 3,700 3,808 4,258 4,715 5,036 5,627 6,133 6,730 7,718 8,777 9,665 10,598
Taxes 2,437 2,289 2,526 2,807 3,049 3,342 3,635 4,084 4,838 5,625 6,220 6,839Social contributions 1,057 1,227 1,412 1,584 1,743 1,884 2,060 2,255 2,455 2,686 2,936 3,203Operating balance of public enterprises 46 75 134 99 62 144 157 172 187 205 224 244Other revenue 161 218 185 225 182 257 281 219 239 261 285 311
Expenditure 3,640 4,343 5,209 5,482 5,941 6,770 7,600 8,211 8,956 9,844 10,748 11,692 Expense 3,138 3,850 4,571 5,002 5,390 6,126 6,859 7,477 8,151 8,986 9,807 10,672
Compensation of employees 1,201 1,545 1,885 2,076 2,228 2,437 2,684 2,933 3,190 3,467 3,765 4,084Purchases of goods and services 355 387 414 482 514 554 621 693 754 825 902 984Interest 3/ 383 381 432 478 506 660 854 993 1,073 1,266 1,393 1,516 Of which: Adjustment for TUDES 41 18 28 26 32 27 46 40 39 45 49 54Other expense 4/ 1,199 1,537 1,840 1,966 2,142 2,474 2,701 2,858 3,133 3,428 3,747 4,088
Net acquisition of nonfinancial assets 503 493 638 480 551 644 741 734 805 858 941 1,020
Gross operating balance 563 -42 -313 -287 -354 -499 -726 -747 -432 -209 -142 -74Net lending/borrowing (NFPS) 60 -535 -951 -767 -905 -1,143 -1,467 -1,481 -1,237 -1,067 -1,083 -1,094Net financial transactions (NFPS) -60 535 951 767 905 1,143 1,467 1,481 1,237 1,067 1,083 1,094
Consolidated public sector: 2/Central Bank balance -29 -138 -88 -126 -144 -195 -237 -253 -277 -303 -329 -361Net lending/borrowing (consolidated public sector) 31 -673 -1,039 -893 -1,049 -1,339 -1,703 -1,734 -1,514 -1,370 -1,412 -1,454
Nonfinancial public sector:Revenue 23.6 22.6 22.3 22.6 22.1 22.7 22.6 22.7 23.9 24.8 25.0 25.1
Taxes 15.5 13.6 13.2 13.5 13.4 13.5 13.4 13.8 15.0 15.9 16.1 16.2Social contributions 6.7 7.3 7.4 7.6 7.6 7.6 7.6 7.6 7.6 7.6 7.6 7.6Operating balance of public enterprises 0.3 0.4 0.7 0.5 0.3 0.6 0.6 0.6 0.6 0.6 0.6 0.6Other revenue 1.0 1.3 1.0 1.1 0.8 1.0 1.0 0.7 0.7 0.7 0.7 0.7
Expenditure 23.2 25.8 27.3 26.3 26.0 27.3 28.0 27.7 27.7 27.8 27.8 27.7 Expense 20.0 22.9 23.9 24.0 23.6 24.7 25.3 25.2 25.2 25.4 25.4 25.3
Compensation of employees 7.6 9.2 9.9 10.0 9.8 9.8 9.9 9.9 9.9 9.8 9.7 9.7Purchases of goods and services 2.3 2.3 2.2 2.3 2.3 2.2 2.3 2.3 2.3 2.3 2.3 2.3Interest 3/ 2.4 2.3 2.3 2.3 2.2 2.7 3.1 3.3 3.3 3.6 3.6 3.6Other expense 4/ 7.6 9.1 9.6 9.4 9.4 10.0 10.0 9.6 9.7 9.7 9.7 9.7
Net acquisition of nonfinancial assets 3.2 2.9 3.3 2.3 2.4 2.6 2.7 2.5 2.5 2.4 2.4 2.4
Gross operating balance 3.6 -0.2 -1.6 -1.4 -1.6 -2.0 -2.7 -2.5 -1.3 -0.6 -0.4 -0.2Net lending/borrowing (NFPS) 0.4 -3.2 -5.0 -3.7 -4.0 -4.6 -5.4 -5.0 -3.8 -3.0 -2.8 -2.6Net financial transactions (NFPS) -0.4 3.2 5.0 3.7 4.0 4.6 5.4 5.0 3.8 3.0 2.8 2.6
Consolidated public sector: 2/Central Bank balance -0.2 -0.8 -0.5 -0.6 -0.6 -0.8 -0.9 -0.9 -0.9 -0.9 -0.9 -0.9Net lending/borrowing (consolidated public sector) 0.2 -4.0 -5.4 -4.3 -4.6 -5.4 -6.3 -5.8 -4.7 -3.9 -3.7 -3.4
Memorandum items:NFPS non-interest expenditure growth (percent) in nominal terms 29.9 21.6 20.6 4.8 8.6 12.4 10.4 7.0 9.2 8.8 9.1 8.8 in real terms 14.6 12.8 14.1 -0.1 3.9 6.8 6.8 1.9 4.9 4.7 4.9 4.6NFPS primary balance in billions of colones 443 -154 -519 -289 -399 -483 -613 -488 -165 200 310 422 in percent of GDP 2.8 -0.9 -2.7 -1.4 -1.7 -1.9 -2.3 -1.6 -0.5 0.6 0.8 1.0
Sources: Ministry of Finance and Fund staff estimates.
2/ The consolidated public sector balance comprises the central government, decentralized government entities, public enterprises and the Central Bank, but excludes the Instituto Costarricense de Electricidad (ICE).3/ The inflation adjustment of the principal of TUDES (inflation indexed bonds) was recorded as interest expenditure.4/ Includes subsidies, transfers and other expense.
(In billions of colones)
(In percent of GDP)
Projection
1/ Includes measures as in the baseline partial adjustment scenario (table 6.1) as well as measures to contain growth in the wage bill, and increases in the VAT rate and marginal income tax rates in outer years.
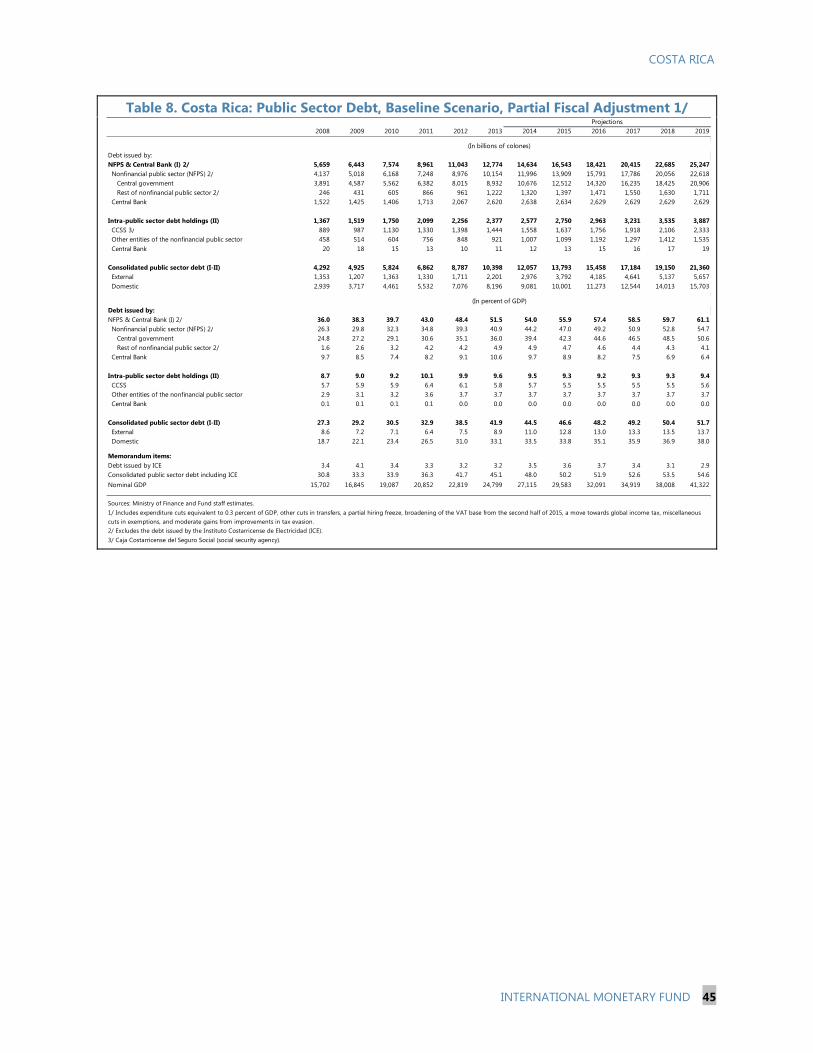
COSTA RICA
INTERNATIONAL MONETARY FUND 45
Table 8. Costa Rica: Public Sector Debt, Baseline Scenario, Partial Fiscal Adjustment 1/
2008 2009 2010 2011 2012 2013 2014 2015 2016 2017 2018 2019
Debt issued by:NFPS & Central Bank (I) 2/ 5,659 6,443 7,574 8,961 11,043 12,774 14,634 16,543 18,421 20,415 22,685 25,247 Nonfinancial public sector (NFPS) 2/ 4,137 5,018 6,168 7,248 8,976 10,154 11,996 13,909 15,791 17,786 20,056 22,618 Central government 3,891 4,587 5,562 6,382 8,015 8,932 10,676 12,512 14,320 16,235 18,425 20,906 Rest of nonfinancial public sector 2/ 246 431 605 866 961 1,222 1,320 1,397 1,471 1,550 1,630 1,711 Central Bank 1,522 1,425 1,406 1,713 2,067 2,620 2,638 2,634 2,629 2,629 2,629 2,629
Intra-public sector debt holdings (II) 1,367 1,519 1,750 2,099 2,256 2,377 2,577 2,750 2,963 3,231 3,535 3,887 CCSS 3/ 889 987 1,130 1,330 1,398 1,444 1,558 1,637 1,756 1,918 2,106 2,333 Other entities of the nonfinancial public sector 458 514 604 756 848 921 1,007 1,099 1,192 1,297 1,412 1,535 Central Bank 20 18 15 13 10 11 12 13 15 16 17 19
Consolidated public sector debt (I-II) 4,292 4,925 5,824 6,862 8,787 10,398 12,057 13,793 15,458 17,184 19,150 21,360 External 1,353 1,207 1,363 1,330 1,711 2,201 2,976 3,792 4,185 4,641 5,137 5,657 Domestic 2,939 3,717 4,461 5,532 7,076 8,196 9,081 10,001 11,273 12,544 14,013 15,703
Debt issued by:NFPS & Central Bank (I) 2/ 36.0 38.3 39.7 43.0 48.4 51.5 54.0 55.9 57.4 58.5 59.7 61.1 Nonfinancial public sector (NFPS) 2/ 26.3 29.8 32.3 34.8 39.3 40.9 44.2 47.0 49.2 50.9 52.8 54.7 Central government 24.8 27.2 29.1 30.6 35.1 36.0 39.4 42.3 44.6 46.5 48.5 50.6 Rest of nonfinancial public sector 2/ 1.6 2.6 3.2 4.2 4.2 4.9 4.9 4.7 4.6 4.4 4.3 4.1 Central Bank 9.7 8.5 7.4 8.2 9.1 10.6 9.7 8.9 8.2 7.5 6.9 6.4
Intra-public sector debt holdings (II) 8.7 9.0 9.2 10.1 9.9 9.6 9.5 9.3 9.2 9.3 9.3 9.4 CCSS 5.7 5.9 5.9 6.4 6.1 5.8 5.7 5.5 5.5 5.5 5.5 5.6 Other entities of the nonfinancial public sector 2.9 3.1 3.2 3.6 3.7 3.7 3.7 3.7 3.7 3.7 3.7 3.7 Central Bank 0.1 0.1 0.1 0.1 0.0 0.0 0.0 0.0 0.0 0.0 0.0 0.0
Consolidated public sector debt (I-II) 27.3 29.2 30.5 32.9 38.5 41.9 44.5 46.6 48.2 49.2 50.4 51.7 External 8.6 7.2 7.1 6.4 7.5 8.9 11.0 12.8 13.0 13.3 13.5 13.7 Domestic 18.7 22.1 23.4 26.5 31.0 33.1 33.5 33.8 35.1 35.9 36.9 38.0
Memorandum items:Debt issued by ICE 3.4 4.1 3.4 3.3 3.2 3.2 3.5 3.6 3.7 3.4 3.1 2.9Consolidated public sector debt including ICE 30.8 33.3 33.9 36.3 41.7 45.1 48.0 50.2 51.9 52.6 53.5 54.6Nominal GDP 15,702 16,845 19,087 20,852 22,819 24,799 27,115 29,583 32,091 34,919 38,008 41,322
Sources: Ministry of Finance and Fund staff estimates.
2/ Excludes the debt issued by the Instituto Costarricense de Electricidad (ICE).3/ Caja Costarricense del Seguro Social (social security agency).
Projections
(In billions of colones)
(In percent of GDP)
1/ Includes expenditure cuts equivalent to 0.3 percent of GDP, other cuts in transfers, a partial hiring freeze, broadening of the VAT base from the second half of 2015, a move towards global income tax, miscellaneous cuts in exemptions, and moderate gains from improvements in tax evasion.

COSTA RICA
46 INTERNATIONAL MONETARY FUND
Table 9. Costa Rica: Monetary Survey, Baseline Scenario, Partial Fiscal Adjustment 1/
2008 2009 2010 2011 2012 2013 2014 2015
Net foreign assets 2,178 2,413 2,485 2,567 3,612 3,799 3,883 4,166Net international reserves 2,090 2,272 2,350 2,403 3,443 3,629 3,712 3,994
(In millions of U.S. dollars) 3,799 4,066 4,627 4,756 6,857 7,331 6,865 7,210Net medium-term foreign assets 89 141 135 164 170 171 171 0
Net domestic assets -1,027 -1,203 -1,140 -1,067 -1,858 -1,865 -1,769 -1,819Net domestic credit -547 -790 -926 -729 -1,303 -935 -1,065 -1,149
Credit to nonfinancial public sector -20 -50 -288 -87 -561 -201 -216 -216Credit to other depository corporations (net) -525 -734 -625 -633 -733 -722 -839 -923Credit to other financial corporations (net) 0 -4 -9 -7 -7 -9 -10 -9Credit to the private sector (net) -2 -2 -3 -2 -2 -2 0 0
Monetary stabilization instruments (-) -1,316 -1,130 -1,252 -1,588 -1,787 -2,492 -2,629 -2,629Other items (net) -392 -551 -303 -140 -441 -325 -216 -435Capital account (-) 1,228 1,268 1,341 1,390 1,673 1,886 2,141 2,394
Monetary base 1,151 1,210 1,345 1,500 1,754 1,934 2,115 2,347Currency 575 613 665 743 845 921 1,013 1,106Required reserves 576 597 680 757 909 1,013 1,102 1,241
Net foreign assets -420 -20 -87 -580 -1,018 -1,534 -2,034 -2,012Net domestic assets 7,840 8,325 8,389 9,287 10,565 11,797 13,701 14,554
Net domestic credit 10,157 11,189 11,891 13,175 15,265 17,241 19,816 21,945Credit to nonfinancial public sector (net) 412 693 980 1,001 1,148 1,225 1,451 1,664Credit to nonfinancial private sector 7,925 8,281 8,645 9,832 11,145 12,507 14,372 15,984Credit to financial corporations (net) 1,820 2,216 2,267 2,342 2,973 3,508 3,994 4,298
Other items (net) -720 -1,034 -1,466 -1,595 -2,097 -2,526 -3,078 -4,137Capital account 1,597 1,829 2,036 2,294 2,602 2,918 3,037 3,254
Liabilities to nonfinancial private sector 7,420 8,305 8,301 8,707 9,547 10,263 11,667 12,543In national currency 4,080 4,461 4,911 5,171 6,045 6,912 7,832 8,476In foreign currency 3,341 3,844 3,390 3,536 3,503 3,409 3,898 4,066
Of which: Deposits 7,255 8,111 8,096 8,470 9,300 9,984 11,362 12,548
Net foreign assets 1,758 2,393 2,398 1,988 2,594 2,265 1,850 2,154
Net domestic assets 7,235 7,499 7,478 8,427 8,937 10,158 12,163 13,146Net domestic credit 8,317 8,923 9,336 10,746 11,731 13,532 15,606 17,431Other items (net) -712 -863 -1,163 -1,415 -1,865 -2,342 -2,548 -3,425Capital account 369 561 695 904 930 1,032 896 860
Broad money 8,994 9,892 9,875 10,415 11,530 12,424 14,012 15,301
Memorandum Items:Monetary base 11.9 5.1 11.2 11.6 16.9 10.2 9.3 11.0Broad money 15.8 10.0 -0.2 5.5 10.7 7.7 12.8 9.2Credit to the private sector 31.8 4.5 4.4 13.7 13.4 12.2 14.9 11.2 Adjusted by changes in the exchange rate 25.7 3.9 8.6 13.8 13.7 12.9 11.4 10.2
Monetary base 7.3 7.2 7.0 7.2 7.7 7.8 7.8 7.9Broad money 57.3 58.7 51.7 49.9 50.5 50.1 51.7 51.7 Of which: Deposits denominated in foreign currency 21.3 22.8 17.8 17.0 15.4 13.7 14.4 14.4Credit to the private sector 50.5 49.2 45.3 47.2 48.8 50.4 53.0 54.0 Of which: In foreign currency 22.4 20.9 17.5 18.6 20.0 21.2 21.5 21.5Central bank balance -0.3 -0.2 -0.4 -0.2 -1.2 -0.9 -0.9 -0.9
Sources: Central Bank of Costa Rica and Fund staff estimates.1/ Includes expenditure cuts equivalent to 0.3 percent of GDP, other cuts in transfers, a partial hiring freeze, broadening of the VAT base from the second half of 2015, a move towards global income tax, miscellaneous cuts in exemptions, and moderate gains from improvements in tax evasion.
Projection
(In billions of colones, unless otherwise indicated)
(Annual percentage change)
(In percent of GDP)
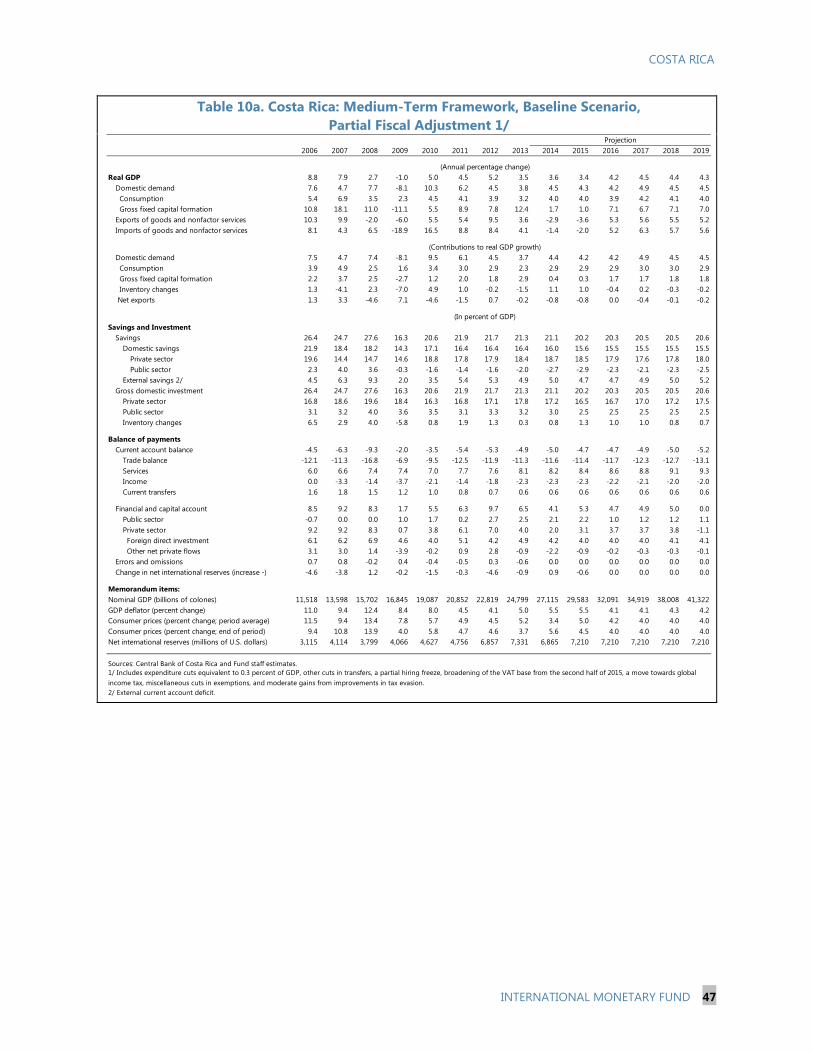
COSTA RICA
INTERNATIONAL MONETARY FUND 47
Table 10a. Costa Rica: Medium-Term Framework, Baseline Scenario, Partial Fiscal Adjustment 1/
2006 2007 2008 2009 2010 2011 2012 2013 2014 2015 2016 2017 2018 2019
Real GDP 8.8 7.9 2.7 -1.0 5.0 4.5 5.2 3.5 3.6 3.4 4.2 4.5 4.4 4.3Domestic demand 7.6 4.7 7.7 -8.1 10.3 6.2 4.5 3.8 4.5 4.3 4.2 4.9 4.5 4.5 Consumption 5.4 6.9 3.5 2.3 4.5 4.1 3.9 3.2 4.0 4.0 3.9 4.2 4.1 4.0 Gross fixed capital formation 10.8 18.1 11.0 -11.1 5.5 8.9 7.8 12.4 1.7 1.0 7.1 6.7 7.1 7.0Exports of goods and nonfactor services 10.3 9.9 -2.0 -6.0 5.5 5.4 9.5 3.6 -2.9 -3.6 5.3 5.6 5.5 5.2Imports of goods and nonfactor services 8.1 4.3 6.5 -18.9 16.5 8.8 8.4 4.1 -1.4 -2.0 5.2 6.3 5.7 5.6
Domestic demand 7.5 4.7 7.4 -8.1 9.5 6.1 4.5 3.7 4.4 4.2 4.2 4.9 4.5 4.5 Consumption 3.9 4.9 2.5 1.6 3.4 3.0 2.9 2.3 2.9 2.9 2.9 3.0 3.0 2.9 Gross fixed capital formation 2.2 3.7 2.5 -2.7 1.2 2.0 1.8 2.9 0.4 0.3 1.7 1.7 1.8 1.8 Inventory changes 1.3 -4.1 2.3 -7.0 4.9 1.0 -0.2 -1.5 1.1 1.0 -0.4 0.2 -0.3 -0.2Net exports 1.3 3.3 -4.6 7.1 -4.6 -1.5 0.7 -0.2 -0.8 -0.8 0.0 -0.4 -0.1 -0.2
Savings and InvestmentSavings 26.4 24.7 27.6 16.3 20.6 21.9 21.7 21.3 21.1 20.2 20.3 20.5 20.5 20.6
Domestic savings 21.9 18.4 18.2 14.3 17.1 16.4 16.4 16.4 16.0 15.6 15.5 15.5 15.5 15.5Private sector 19.6 14.4 14.7 14.6 18.8 17.8 17.9 18.4 18.7 18.5 17.9 17.6 17.8 18.0Public sector 2.3 4.0 3.6 -0.3 -1.6 -1.4 -1.6 -2.0 -2.7 -2.9 -2.3 -2.1 -2.3 -2.5
External savings 2/ 4.5 6.3 9.3 2.0 3.5 5.4 5.3 4.9 5.0 4.7 4.7 4.9 5.0 5.2Gross domestic investment 26.4 24.7 27.6 16.3 20.6 21.9 21.7 21.3 21.1 20.2 20.3 20.5 20.5 20.6
Private sector 16.8 18.6 19.6 18.4 16.3 16.8 17.1 17.8 17.2 16.5 16.7 17.0 17.2 17.5Public sector 3.1 3.2 4.0 3.6 3.5 3.1 3.3 3.2 3.0 2.5 2.5 2.5 2.5 2.5Inventory changes 6.5 2.9 4.0 -5.8 0.8 1.9 1.3 0.3 0.8 1.3 1.0 1.0 0.8 0.7
Balance of payments Current account balance -4.5 -6.3 -9.3 -2.0 -3.5 -5.4 -5.3 -4.9 -5.0 -4.7 -4.7 -4.9 -5.0 -5.2
Trade balance -12.1 -11.3 -16.8 -6.9 -9.5 -12.5 -11.9 -11.3 -11.6 -11.4 -11.7 -12.3 -12.7 -13.1Services 6.0 6.6 7.4 7.4 7.0 7.7 7.6 8.1 8.2 8.4 8.6 8.8 9.1 9.3Income 0.0 -3.3 -1.4 -3.7 -2.1 -1.4 -1.8 -2.3 -2.3 -2.3 -2.2 -2.1 -2.0 -2.0Current transfers 1.6 1.8 1.5 1.2 1.0 0.8 0.7 0.6 0.6 0.6 0.6 0.6 0.6 0.6
Financial and capital account 8.5 9.2 8.3 1.7 5.5 6.3 9.7 6.5 4.1 5.3 4.7 4.9 5.0 0.0Public sector -0.7 0.0 0.0 1.0 1.7 0.2 2.7 2.5 2.1 2.2 1.0 1.2 1.2 1.1Private sector 9.2 9.2 8.3 0.7 3.8 6.1 7.0 4.0 2.0 3.1 3.7 3.7 3.8 -1.1 Foreign direct investment 6.1 6.2 6.9 4.6 4.0 5.1 4.2 4.9 4.2 4.0 4.0 4.0 4.1 4.1 Other net private flows 3.1 3.0 1.4 -3.9 -0.2 0.9 2.8 -0.9 -2.2 -0.9 -0.2 -0.3 -0.3 -0.1
Errors and omissions 0.7 0.8 -0.2 0.4 -0.4 -0.5 0.3 -0.6 0.0 0.0 0.0 0.0 0.0 0.0Change in net international reserves (increase -) -4.6 -3.8 1.2 -0.2 -1.5 -0.3 -4.6 -0.9 0.9 -0.6 0.0 0.0 0.0 0.0
Memorandum items:Nominal GDP (billions of colones) 11,518 13,598 15,702 16,845 19,087 20,852 22,819 24,799 27,115 29,583 32,091 34,919 38,008 41,322GDP deflator (percent change) 11.0 9.4 12.4 8.4 8.0 4.5 4.1 5.0 5.5 5.5 4.1 4.1 4.3 4.2Consumer prices (percent change; period average) 11.5 9.4 13.4 7.8 5.7 4.9 4.5 5.2 3.4 5.0 4.2 4.0 4.0 4.0Consumer prices (percent change; end of period) 9.4 10.8 13.9 4.0 5.8 4.7 4.6 3.7 5.6 4.5 4.0 4.0 4.0 4.0Net international reserves (millions of U.S. dollars) 3,115 4,114 3,799 4,066 4,627 4,756 6,857 7,331 6,865 7,210 7,210 7,210 7,210 7,210
Sources: Central Bank of Costa Rica and Fund staff estimates.
2/ External current account deficit.
1/ Includes expenditure cuts equivalent to 0.3 percent of GDP, other cuts in transfers, a partial hiring freeze, broadening of the VAT base from the second half of 2015, a move towards global income tax, miscellaneous cuts in exemptions, and moderate gains from improvements in tax evasion.
(In percent of GDP)
(Annual percentage change)
(Contributions to real GDP growth)
Projection
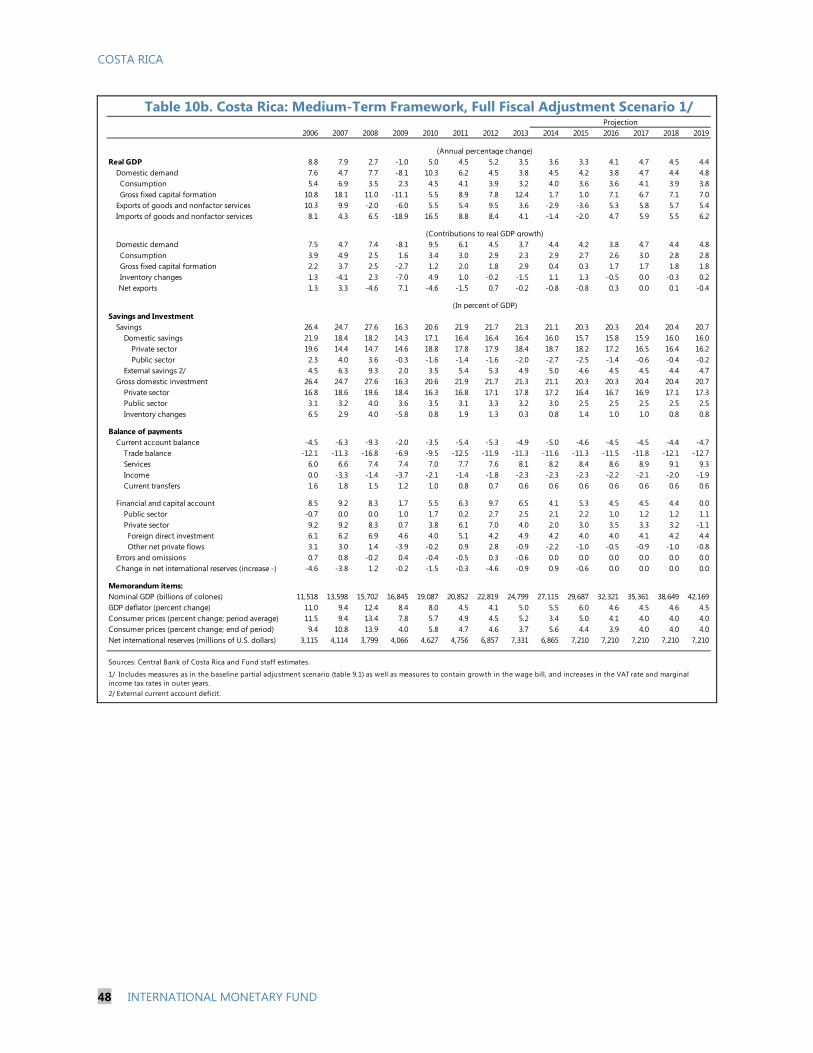
COSTA RICA
48 INTERNATIONAL MONETARY FUND
Table 10b. Costa Rica: Medium-Term Framework, Full Fiscal Adjustment Scenario 1/
2006 2007 2008 2009 2010 2011 2012 2013 2014 2015 2016 2017 2018 2019
Real GDP 8.8 7.9 2.7 -1.0 5.0 4.5 5.2 3.5 3.6 3.3 4.1 4.7 4.5 4.4Domestic demand 7.6 4.7 7.7 -8.1 10.3 6.2 4.5 3.8 4.5 4.2 3.8 4.7 4.4 4.8 Consumption 5.4 6.9 3.5 2.3 4.5 4.1 3.9 3.2 4.0 3.6 3.6 4.1 3.9 3.8 Gross fixed capital formation 10.8 18.1 11.0 -11.1 5.5 8.9 7.8 12.4 1.7 1.0 7.1 6.7 7.1 7.0Exports of goods and nonfactor services 10.3 9.9 -2.0 -6.0 5.5 5.4 9.5 3.6 -2.9 -3.6 5.3 5.8 5.7 5.4Imports of goods and nonfactor services 8.1 4.3 6.5 -18.9 16.5 8.8 8.4 4.1 -1.4 -2.0 4.7 5.9 5.5 6.2
Domestic demand 7.5 4.7 7.4 -8.1 9.5 6.1 4.5 3.7 4.4 4.2 3.8 4.7 4.4 4.8 Consumption 3.9 4.9 2.5 1.6 3.4 3.0 2.9 2.3 2.9 2.7 2.6 3.0 2.8 2.8 Gross fixed capital formation 2.2 3.7 2.5 -2.7 1.2 2.0 1.8 2.9 0.4 0.3 1.7 1.7 1.8 1.8 Inventory changes 1.3 -4.1 2.3 -7.0 4.9 1.0 -0.2 -1.5 1.1 1.3 -0.5 0.0 -0.3 0.2Net exports 1.3 3.3 -4.6 7.1 -4.6 -1.5 0.7 -0.2 -0.8 -0.8 0.3 0.0 0.1 -0.4
Savings and InvestmentSavings 26.4 24.7 27.6 16.3 20.6 21.9 21.7 21.3 21.1 20.3 20.3 20.4 20.4 20.7
Domestic savings 21.9 18.4 18.2 14.3 17.1 16.4 16.4 16.4 16.0 15.7 15.8 15.9 16.0 16.0Private sector 19.6 14.4 14.7 14.6 18.8 17.8 17.9 18.4 18.7 18.2 17.2 16.5 16.4 16.2Public sector 2.3 4.0 3.6 -0.3 -1.6 -1.4 -1.6 -2.0 -2.7 -2.5 -1.4 -0.6 -0.4 -0.2
External savings 2/ 4.5 6.3 9.3 2.0 3.5 5.4 5.3 4.9 5.0 4.6 4.5 4.5 4.4 4.7Gross domestic investment 26.4 24.7 27.6 16.3 20.6 21.9 21.7 21.3 21.1 20.3 20.3 20.4 20.4 20.7
Private sector 16.8 18.6 19.6 18.4 16.3 16.8 17.1 17.8 17.2 16.4 16.7 16.9 17.1 17.3Public sector 3.1 3.2 4.0 3.6 3.5 3.1 3.3 3.2 3.0 2.5 2.5 2.5 2.5 2.5Inventory changes 6.5 2.9 4.0 -5.8 0.8 1.9 1.3 0.3 0.8 1.4 1.0 1.0 0.8 0.8
Balance of payments Current account balance -4.5 -6.3 -9.3 -2.0 -3.5 -5.4 -5.3 -4.9 -5.0 -4.6 -4.5 -4.5 -4.4 -4.7
Trade balance -12.1 -11.3 -16.8 -6.9 -9.5 -12.5 -11.9 -11.3 -11.6 -11.3 -11.5 -11.8 -12.1 -12.7Services 6.0 6.6 7.4 7.4 7.0 7.7 7.6 8.1 8.2 8.4 8.6 8.9 9.1 9.3Income 0.0 -3.3 -1.4 -3.7 -2.1 -1.4 -1.8 -2.3 -2.3 -2.3 -2.2 -2.1 -2.0 -1.9Current transfers 1.6 1.8 1.5 1.2 1.0 0.8 0.7 0.6 0.6 0.6 0.6 0.6 0.6 0.6
Financial and capital account 8.5 9.2 8.3 1.7 5.5 6.3 9.7 6.5 4.1 5.3 4.5 4.5 4.4 0.0Public sector -0.7 0.0 0.0 1.0 1.7 0.2 2.7 2.5 2.1 2.2 1.0 1.2 1.2 1.1Private sector 9.2 9.2 8.3 0.7 3.8 6.1 7.0 4.0 2.0 3.0 3.5 3.3 3.2 -1.1 Foreign direct investment 6.1 6.2 6.9 4.6 4.0 5.1 4.2 4.9 4.2 4.0 4.0 4.1 4.2 4.4 Other net private flows 3.1 3.0 1.4 -3.9 -0.2 0.9 2.8 -0.9 -2.2 -1.0 -0.5 -0.9 -1.0 -0.8
Errors and omissions 0.7 0.8 -0.2 0.4 -0.4 -0.5 0.3 -0.6 0.0 0.0 0.0 0.0 0.0 0.0Change in net international reserves (increase -) -4.6 -3.8 1.2 -0.2 -1.5 -0.3 -4.6 -0.9 0.9 -0.6 0.0 0.0 0.0 0.0
Memorandum items:Nominal GDP (billions of colones) 11,518 13,598 15,702 16,845 19,087 20,852 22,819 24,799 27,115 29,687 32,321 35,361 38,649 42,169GDP deflator (percent change) 11.0 9.4 12.4 8.4 8.0 4.5 4.1 5.0 5.5 6.0 4.6 4.5 4.6 4.5Consumer prices (percent change; period average) 11.5 9.4 13.4 7.8 5.7 4.9 4.5 5.2 3.4 5.0 4.1 4.0 4.0 4.0Consumer prices (percent change; end of period) 9.4 10.8 13.9 4.0 5.8 4.7 4.6 3.7 5.6 4.4 3.9 4.0 4.0 4.0Net international reserves (millions of U.S. dollars) 3,115 4,114 3,799 4,066 4,627 4,756 6,857 7,331 6,865 7,210 7,210 7,210 7,210 7,210
Sources: Central Bank of Costa Rica and Fund staff estimates.
2/ External current account deficit.
1/ Includes measures as in the baseline partial adjustment scenario (table 9.1) as well as measures to contain growth in the wage bill, and increases in the VAT rate and marginal income tax rates in outer years.
(In percent of GDP)
(Annual percentage change)
(Contributions to real GDP growth)
Projection
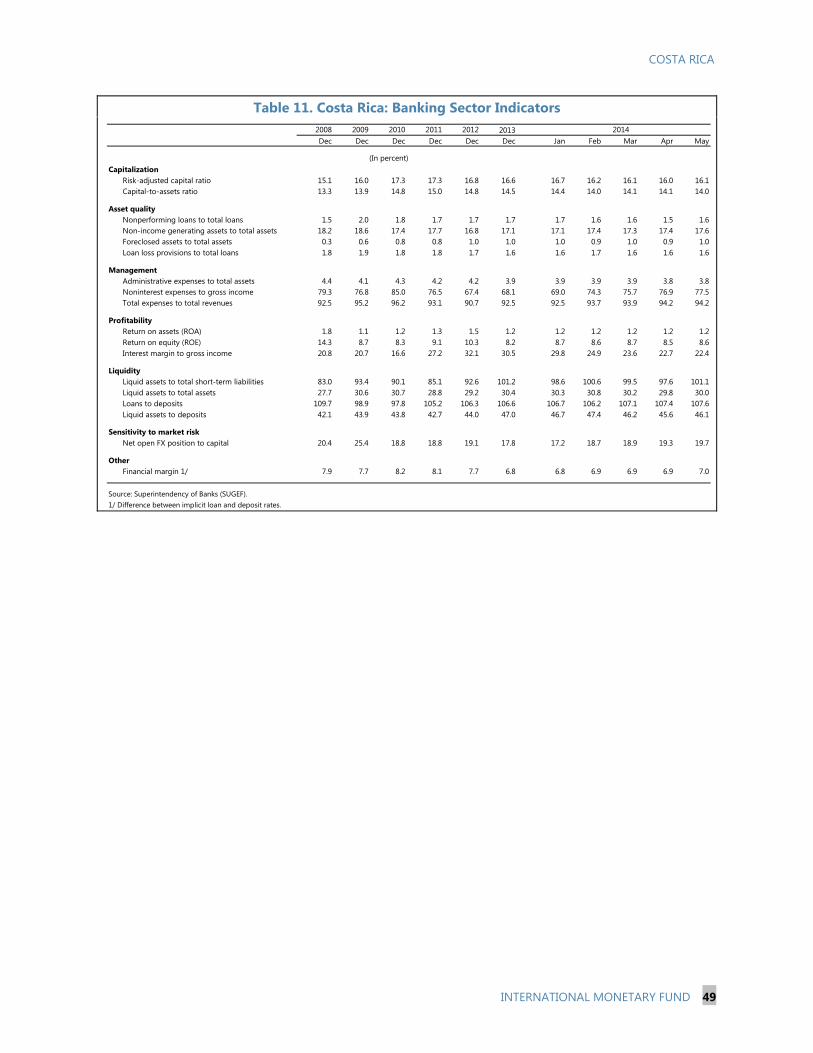
COSTA RICA
INTERNATIONAL MONETARY FUND 49
Table 11. Costa Rica: Banking Sector Indicators
2013Dec Dec Dec Dec Dec Dec Jan Feb Mar Apr May
CapitalizationRisk-adjusted capital ratio 15.1 16.0 17.3 17.3 16.8 16.6 16.7 16.2 16.1 16.0 16.1Capital-to-assets ratio 13.3 13.9 14.8 15.0 14.8 14.5 14.4 14.0 14.1 14.1 14.0
Asset qualityNonperforming loans to total loans 1.5 2.0 1.8 1.7 1.7 1.7 1.7 1.6 1.6 1.5 1.6Non-income generating assets to total assets 18.2 18.6 17.4 17.7 16.8 17.1 17.1 17.4 17.3 17.4 17.6Foreclosed assets to total assets 0.3 0.6 0.8 0.8 1.0 1.0 1.0 0.9 1.0 0.9 1.0Loan loss provisions to total loans 1.8 1.9 1.8 1.8 1.7 1.6 1.6 1.7 1.6 1.6 1.6
ManagementAdministrative expenses to total assets 4.4 4.1 4.3 4.2 4.2 3.9 3.9 3.9 3.9 3.8 3.8Noninterest expenses to gross income 79.3 76.8 85.0 76.5 67.4 68.1 69.0 74.3 75.7 76.9 77.5Total expenses to total revenues 92.5 95.2 96.2 93.1 90.7 92.5 92.5 93.7 93.9 94.2 94.2
ProfitabilityReturn on assets (ROA) 1.8 1.1 1.2 1.3 1.5 1.2 1.2 1.2 1.2 1.2 1.2Return on equity (ROE) 14.3 8.7 8.3 9.1 10.3 8.2 8.7 8.6 8.7 8.5 8.6Interest margin to gross income 20.8 20.7 16.6 27.2 32.1 30.5 29.8 24.9 23.6 22.7 22.4
LiquidityLiquid assets to total short-term liabilities 83.0 93.4 90.1 85.1 92.6 101.2 98.6 100.6 99.5 97.6 101.1Liquid assets to total assets 27.7 30.6 30.7 28.8 29.2 30.4 30.3 30.8 30.2 29.8 30.0Loans to deposits 109.7 98.9 97.8 105.2 106.3 106.6 106.7 106.2 107.1 107.4 107.6Liquid assets to deposits 42.1 43.9 43.8 42.7 44.0 47.0 46.7 47.4 46.2 45.6 46.1
Sensitivity to market riskNet open FX position to capital 20.4 25.4 18.8 18.8 19.1 17.8 17.2 18.7 18.9 19.3 19.7
OtherFinancial margin 1/ 7.9 7.7 8.2 8.1 7.7 6.8 6.8 6.9 6.9 6.9 7.0
Source: Superintendency of Banks (SUGEF).1/ Difference between implicit loan and deposit rates.
20142012
(In percent)
2008 2009 2010 2011
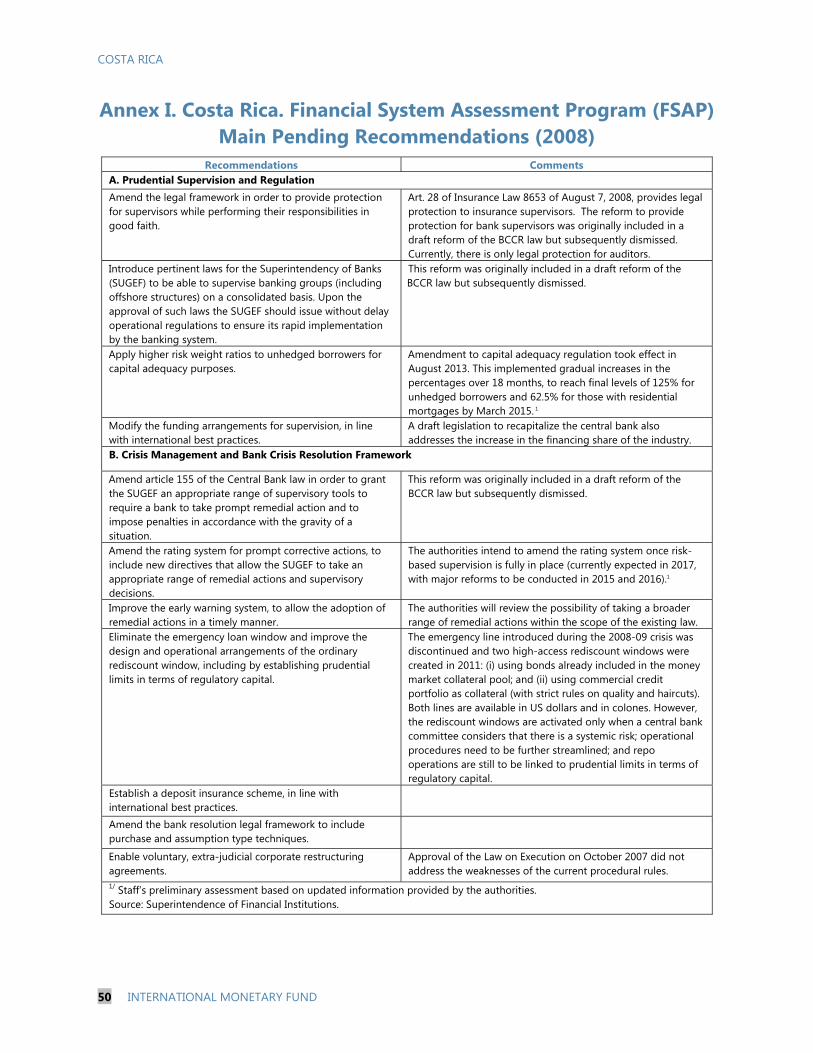
COSTA RICA
50 INTERNATIONAL MONETARY FUND
Annex I. Costa Rica. Financial System Assessment Program (FSAP) Main Pending Recommendations (2008)
Recommendations Comments A. Prudential Supervision and Regulation Amend the legal framework in order to provide protection for supervisors while performing their responsibilities in good faith.
Art. 28 of Insurance Law 8653 of August 7, 2008, provides legal protection to insurance supervisors. The reform to provide protection for bank supervisors was originally included in a draft reform of the BCCR law but subsequently dismissed. Currently, there is only legal protection for auditors.
Introduce pertinent laws for the Superintendency of Banks (SUGEF) to be able to supervise banking groups (including offshore structures) on a consolidated basis. Upon the approval of such laws the SUGEF should issue without delay operational regulations to ensure its rapid implementation by the banking system.
This reform was originally included in a draft reform of the BCCR law but subsequently dismissed.
Apply higher risk weight ratios to unhedged borrowers for capital adequacy purposes.
Amendment to capital adequacy regulation took effect in August 2013. This implemented gradual increases in the percentages over 18 months, to reach final levels of 125% for unhedged borrowers and 62.5% for those with residential mortgages by March 2015. 1
Modify the funding arrangements for supervision, in line with international best practices.
A draft legislation to recapitalize the central bank also addresses the increase in the financing share of the industry.
B. Crisis Management and Bank Crisis Resolution Framework
Amend article 155 of the Central Bank law in order to grant the SUGEF an appropriate range of supervisory tools to require a bank to take prompt remedial action and to impose penalties in accordance with the gravity of a situation.
This reform was originally included in a draft reform of the BCCR law but subsequently dismissed.
Amend the rating system for prompt corrective actions, to include new directives that allow the SUGEF to take an appropriate range of remedial actions and supervisory decisions.
The authorities intend to amend the rating system once risk-based supervision is fully in place (currently expected in 2017, with major reforms to be conducted in 2015 and 2016).1
Improve the early warning system, to allow the adoption of remedial actions in a timely manner.
The authorities will review the possibility of taking a broader range of remedial actions within the scope of the existing law.
Eliminate the emergency loan window and improve the design and operational arrangements of the ordinary rediscount window, including by establishing prudential limits in terms of regulatory capital.
The emergency line introduced during the 2008-09 crisis was discontinued and two high-access rediscount windows were created in 2011: (i) using bonds already included in the money market collateral pool; and (ii) using commercial credit portfolio as collateral (with strict rules on quality and haircuts). Both lines are available in US dollars and in colones. However, the rediscount windows are activated only when a central bank committee considers that there is a systemic risk; operational procedures need to be further streamlined; and repo operations are still to be linked to prudential limits in terms of regulatory capital.
Establish a deposit insurance scheme, in line with international best practices.
Amend the bank resolution legal framework to include purchase and assumption type techniques.
Enable voluntary, extra-judicial corporate restructuring agreements.
Approval of the Law on Execution on October 2007 did not address the weaknesses of the current procedural rules.
1/ Staff’s preliminary assessment based on updated information provided by the authorities. Source: Superintendence of Financial Institutions.
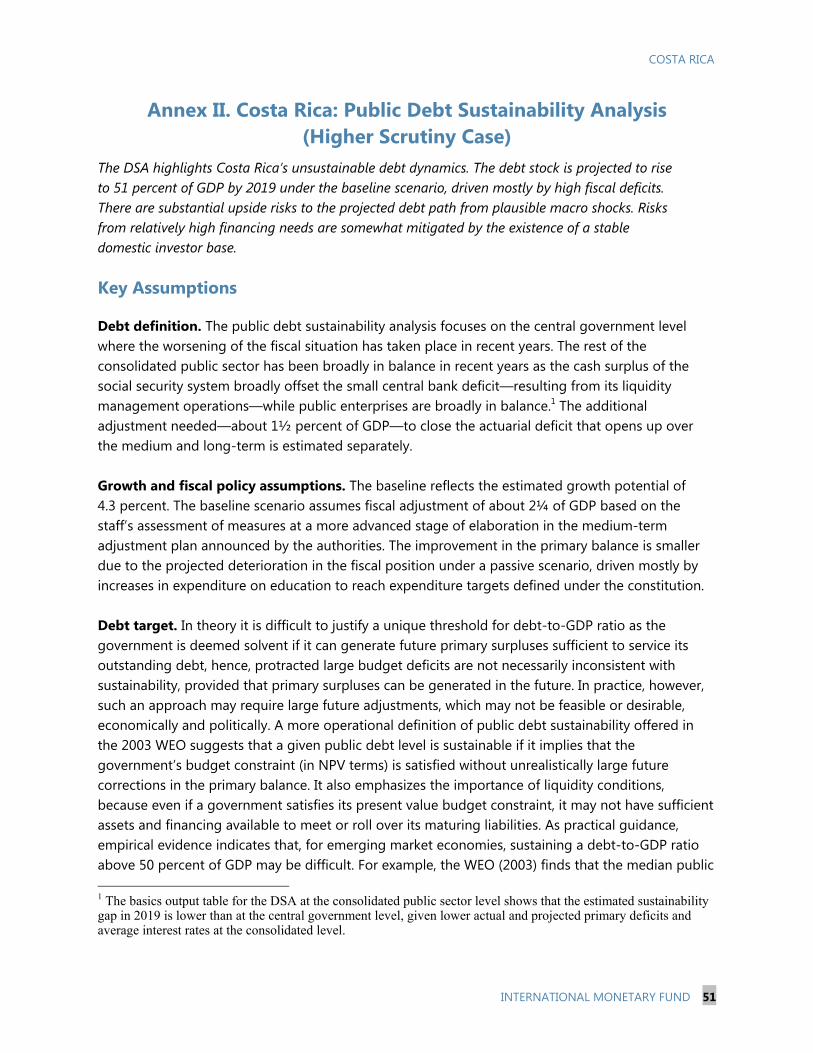
COSTA RICA
INTERNATIONAL MONETARY FUND 51
Annex II. Costa Rica: Public Debt Sustainability Analysis (Higher Scrutiny Case)
The DSA highlights Costa Rica’s unsustainable debt dynamics. The debt stock is projected to rise to 51 percent of GDP by 2019 under the baseline scenario, driven mostly by high fiscal deficits. There are substantial upside risks to the projected debt path from plausible macro shocks. Risks from relatively high financing needs are somewhat mitigated by the existence of a stable domestic investor base.
Key Assumptions
Debt definition. The public debt sustainability analysis focuses on the central government level where the worsening of the fiscal situation has taken place in recent years. The rest of the consolidated public sector has been broadly in balance in recent years as the cash surplus of the social security system broadly offset the small central bank deficit—resulting from its liquidity management operations—while public enterprises are broadly in balance.1 The additional adjustment needed—about 1½ percent of GDP—to close the actuarial deficit that opens up over the medium and long-term is estimated separately. Growth and fiscal policy assumptions. The baseline reflects the estimated growth potential of 4.3 percent. The baseline scenario assumes fiscal adjustment of about 2¼ of GDP based on the staff’s assessment of measures at a more advanced stage of elaboration in the medium-term adjustment plan announced by the authorities. The improvement in the primary balance is smaller due to the projected deterioration in the fiscal position under a passive scenario, driven mostly by increases in expenditure on education to reach expenditure targets defined under the constitution. Debt target. In theory it is difficult to justify a unique threshold for debt-to-GDP ratio as the government is deemed solvent if it can generate future primary surpluses sufficient to service its outstanding debt, hence, protracted large budget deficits are not necessarily inconsistent with sustainability, provided that primary surpluses can be generated in the future. In practice, however, such an approach may require large future adjustments, which may not be feasible or desirable, economically and politically. A more operational definition of public debt sustainability offered in the 2003 WEO suggests that a given public debt level is sustainable if it implies that the government’s budget constraint (in NPV terms) is satisfied without unrealistically large future corrections in the primary balance. It also emphasizes the importance of liquidity conditions, because even if a government satisfies its present value budget constraint, it may not have sufficient assets and financing available to meet or roll over its maturing liabilities. As practical guidance, empirical evidence indicates that, for emerging market economies, sustaining a debt-to-GDP ratio above 50 percent of GDP may be difficult. For example, the WEO (2003) finds that the median public 1 The basics output table for the DSA at the consolidated public sector level shows that the estimated sustainability gap in 2019 is lower than at the central government level, given lower actual and projected primary deficits and average interest rates at the consolidated level.

COSTA RICA
52 INTERNATIONAL MONETARY FUND
debt-to-GDP ratio for emerging markets in the year before a default was about 50 percent of GDP. This study also concludes that, on average, the conduct of fiscal policy in emerging market economies is not consistent with ensuring sustainability once public debt exceeds a threshold of 50 percent of GDP. Moreover, WEO (2003) argues that a sustainable debt level may be lower for countries that have relatively low revenue-to-GDP ratio, high volatility of the revenue-to-GDP, as well as a weak track record of fiscal consolidations. Given that Costa Rica has low and fairly volatile revenue-to-GDP ratio, compared to other emerging markets, and has not demonstrated the ability to achieve substantial expenditure consolidation in the past decade, the debt threshold for Costa Rica should be significantly lower than 50 percent of GDP to provide a safety margin against the risk of default or at least severe budget funding problems. This is why targeting an upper bound to the public debt ratio of 40 to 45 percent of GDP appears justifiable in the case of Costa Rica.
Results and Assessment
Results. In the baseline, the headline deficit remains close to 6 percent of GDP in 2019, as the higher interest bill from rising public debt—which reaches 51 percent of GDP in 2019 and stays on an upward trajectory thereafter—largely offsets the improvement in the primary balance. The gross financing needs would average almost 10 percent of GDP in 2014–19. In the adjustment scenario, additional measures of 1½ of GDP, as part of a gradual but frontloaded consolidation plan, suffice to stabilize debt by 2019 at a level below 45 percent of GDP. This outcome assumes significant tightening in credit spreads driven by favorable market reaction to a frontloaded adjustment plan with credible measures. Assessment. While most standard debt profile characteristics are not at “danger” levels (see heat-map), the debt and gross financing needs approach the debt burden benchmarks under stressed scenarios. In particular, debt rises above 60 percent of GDP under the combined macro-fiscal shock, with particularly high sensitivity to growth and fiscal shocks. Debt profile indicators also highlight risks from relatively high spreads on external bonds, elevated financing needs, and significant external and FX debt. The recent loss of the sovereign’s only investment grade rating and warnings of potential downgrades by other main agencies highlight the risk that credit risk perceptions could intensify. Mitigating factors. A stable investor base is an important mitigating factor. Notwithstanding the moderate risk ratings for external and FX debt in the debt profile indicators heat map, the share of these types of debt are at the low end of the reference range for moderate risk countries—external and FX debt represent about 20 and 30 percent of total debt, respectively, compared to benchmark ranges of 15 to 45 for external debt and 20 to 60 for FX debt. Moreover, about 60 percent of domestic debt is held by captive local institutional investors, including the social security system, nonfinancial public sector institutions, and banks.
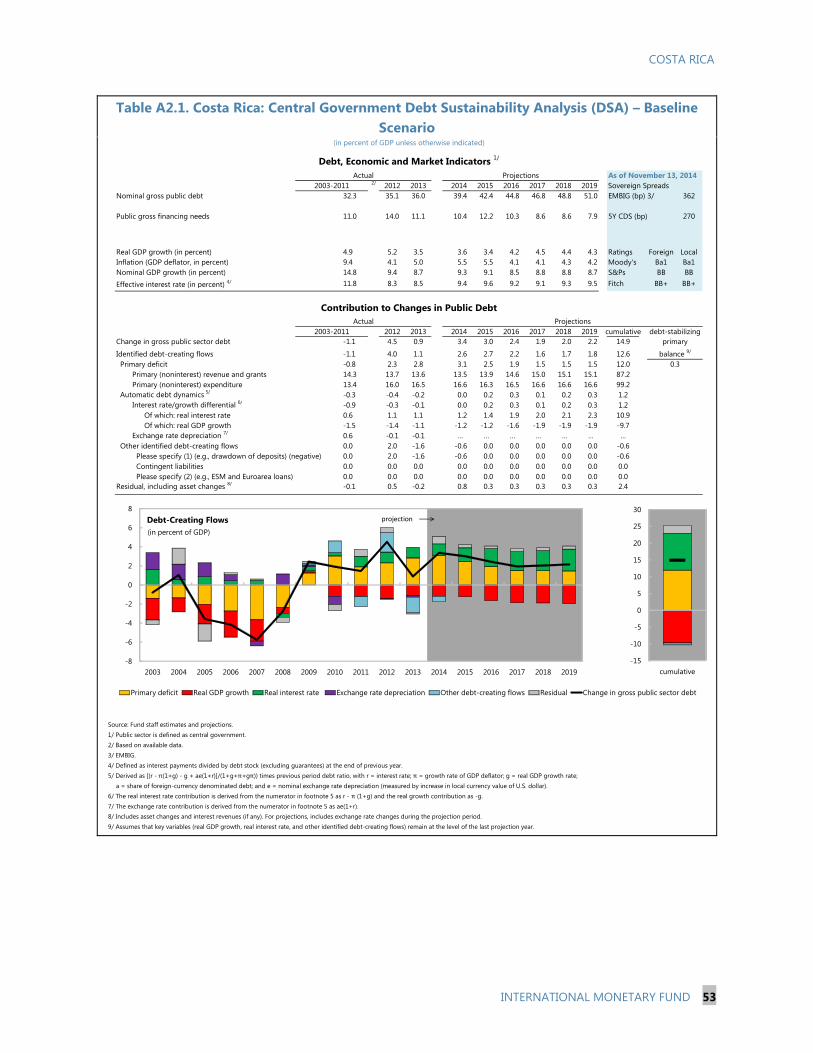
COSTA RICA
INTERNATIONAL MONETARY FUND 53
Table A2.1. Costa Rica: Central Government Debt Sustainability Analysis (DSA) – Baseline Scenario
As of November 13, 20142/ 2012 2013 2014 2015 2016 2017 2018 2019 Sovereign Spreads
Nominal gross public debt 32.3 35.1 36.0 39.4 42.4 44.8 46.8 48.8 51.0 EMBIG (bp) 3/ 362
Public gross financing needs 11.0 14.0 11.1 10.4 12.2 10.3 8.6 8.6 7.9 5Y CDS (bp) 270
Real GDP growth (in percent) 4.9 5.2 3.5 3.6 3.4 4.2 4.5 4.4 4.3 Ratings Foreign LocalInflation (GDP deflator, in percent) 9.4 4.1 5.0 5.5 5.5 4.1 4.1 4.3 4.2 Moody's Ba1 Ba1Nominal GDP growth (in percent) 14.8 9.4 8.7 9.3 9.1 8.5 8.8 8.8 8.7 S&Ps BB BBEffective interest rate (in percent) 4/ 11.8 8.3 8.5 9.4 9.6 9.2 9.1 9.3 9.5 Fitch BB+ BB+
2012 2013 2014 2015 2016 2017 2018 2019 cumulativeChange in gross public sector debt -1.1 4.5 0.9 3.4 3.0 2.4 1.9 2.0 2.2 14.9
Identified debt-creating flows -1.1 4.0 1.1 2.6 2.7 2.2 1.6 1.7 1.8 12.6Primary deficit -0.8 2.3 2.8 3.1 2.5 1.9 1.5 1.5 1.5 12.0
Primary (noninterest) revenue and grants 14.3 13.7 13.6 13.5 13.9 14.6 15.0 15.1 15.1 87.2Primary (noninterest) expenditure 13.4 16.0 16.5 16.6 16.3 16.5 16.6 16.6 16.6 99.2
Automatic debt dynamics 5/ -0.3 -0.4 -0.2 0.0 0.2 0.3 0.1 0.2 0.3 1.2Interest rate/growth differential 6/ -0.9 -0.3 -0.1 0.0 0.2 0.3 0.1 0.2 0.3 1.2
Of which: real interest rate 0.6 1.1 1.1 1.2 1.4 1.9 2.0 2.1 2.3 10.9Of which: real GDP growth -1.5 -1.4 -1.1 -1.2 -1.2 -1.6 -1.9 -1.9 -1.9 -9.7
Exchange rate depreciation 7/ 0.6 -0.1 -0.1 … … … … … … …Other identified debt-creating flows 0.0 2.0 -1.6 -0.6 0.0 0.0 0.0 0.0 0.0 -0.6
Please specify (1) (e.g., drawdown of deposits) (negative) 0.0 2.0 -1.6 -0.6 0.0 0.0 0.0 0.0 0.0 -0.6Contingent liabilities 0.0 0.0 0.0 0.0 0.0 0.0 0.0 0.0 0.0 0.0Please specify (2) (e.g., ESM and Euroarea loans) 0.0 0.0 0.0 0.0 0.0 0.0 0.0 0.0 0.0 0.0
Residual, including asset changes 8/ -0.1 0.5 -0.2 0.8 0.3 0.3 0.3 0.3 0.3 2.4
Source: Fund staff estimates and projections.1/ Public sector is defined as central government.2/ Based on available data.3/ EMBIG.4/ Defined as interest payments divided by debt stock (excluding guarantees) at the end of previous year.5/ Derived as [(r - π(1+g) - g + ae(1+r)]/(1+g+π+gπ)) times previous period debt ratio, with r = interest rate; π = growth rate of GDP deflator; g = real GDP growth rate;
a = share of foreign-currency denominated debt; and e = nominal exchange rate depreciation (measured by increase in local currency value of U.S. dollar).6/ The real interest rate contribution is derived from the numerator in footnote 5 as r - π (1+g) and the real growth contribution as -g.7/ The exchange rate contribution is derived from the numerator in footnote 5 as ae(1+r). 8/ Includes asset changes and interest revenues (if any). For projections, includes exchange rate changes during the projection period.9/ Assumes that key variables (real GDP growth, real interest rate, and other identified debt-creating flows) remain at the level of the last projection year.
0.3balance 9/
primary
(in percent of GDP unless otherwise indicated)
Debt, Economic and Market Indicators 1/
2003-2011Actual
Projections
Contribution to Changes in Public DebtProjections
2003-2011Actual
debt-stabilizing
-8
-6
-4
-2
0
2
4
6
8
2003 2004 2005 2006 2007 2008 2009 2010 2011 2012 2013 2014 2015 2016 2017 2018 2019
Debt-Creating Flows
Primary deficit Real GDP growth Real interest rate Exchange rate depreciation Other debt-creating flows Residual Change in gross public sector debt
projection
(in percent of GDP)
-15
-10
-5
0
5
10
15
20
25
30
cumulative
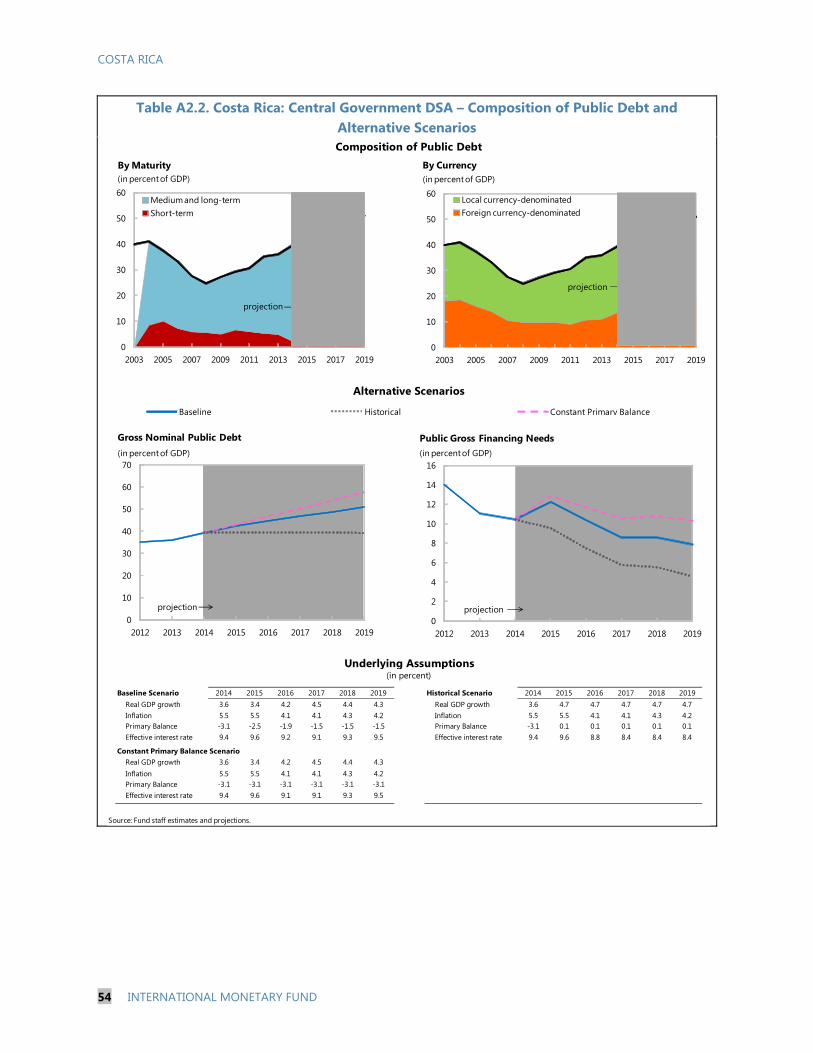
COSTA RICA
54 INTERNATIONAL MONETARY FUND
Table A2.2. Costa Rica: Central Government DSA – Composition of Public Debt and Alternative Scenarios
Baseline Scenario 2014 2015 2016 2017 2018 2019 Historical Scenario 2014 2015 2016 2017 2018 2019Real GDP growth 3.6 3.4 4.2 4.5 4.4 4.3 Real GDP growth 3.6 4.7 4.7 4.7 4.7 4.7Inflation 5.5 5.5 4.1 4.1 4.3 4.2 Inflation 5.5 5.5 4.1 4.1 4.3 4.2Primary Balance -3.1 -2.5 -1.9 -1.5 -1.5 -1.5 Primary Balance -3.1 0.1 0.1 0.1 0.1 0.1Effective interest rate 9.4 9.6 9.2 9.1 9.3 9.5 Effective interest rate 9.4 9.6 8.8 8.4 8.4 8.4
Constant Primary Balance ScenarioReal GDP growth 3.6 3.4 4.2 4.5 4.4 4.3Inflation 5.5 5.5 4.1 4.1 4.3 4.2Primary Balance -3.1 -3.1 -3.1 -3.1 -3.1 -3.1Effective interest rate 9.4 9.6 9.1 9.1 9.3 9.5
Source: Fund staff estimates and projections.
Underlying Assumptions(in percent)
Alternative Scenarios
Composition of Public Debt
Baseline Historical Constant Primary Balance
0
10
20
30
40
50
60
70
2012 2013 2014 2015 2016 2017 2018 2019
Gross Nominal Public Debt(in percent of GDP)
projection0
2
4
6
8
10
12
14
16
2012 2013 2014 2015 2016 2017 2018 2019
Public Gross Financing Needs(in percent of GDP)
projection
0
10
20
30
40
50
60
2003 2005 2007 2009 2011 2013 2015 2017 2019
By Maturity
Medium and long-termShort-term
projection
(in percent of GDP)
0
10
20
30
40
50
60
2003 2005 2007 2009 2011 2013 2015 2017 2019
By Currency
Local currency-denominatedForeign currency-denominated
projection
(in percent of GDP)
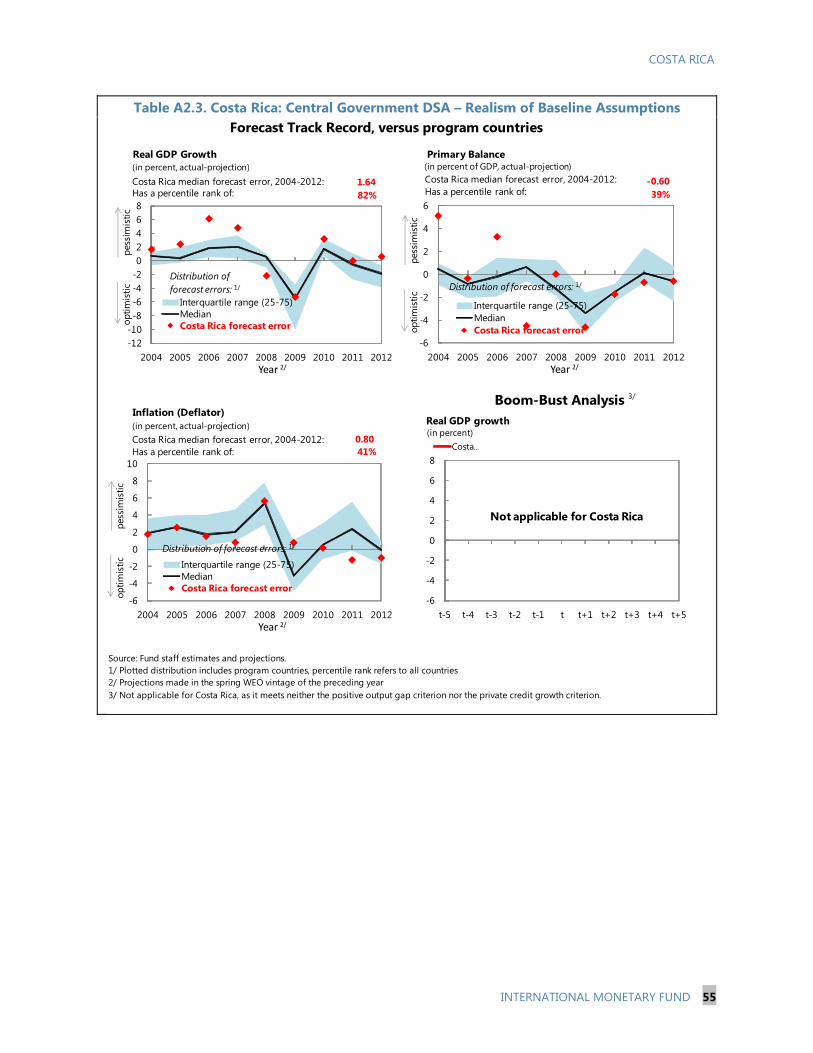
COSTA RICA
INTERNATIONAL MONETARY FUND 55
Table A2.3. Costa Rica: Central Government DSA – Realism of Baseline Assumptions
Source: Fund staff estimates and projections.1/ Plotted distribution includes program countries, percentile rank refers to all countries2/ Projections made in the spring WEO vintage of the preceding year
Forecast Track Record, versus program countries
Boom-Bust Analysis 3/
3/ Not applicable for Costa Rica, as it meets neither the positive output gap criterion nor the private credit growth criterion.
-12-10-8-6-4-202468
2004 2005 2006 2007 2008 2009 2010 2011 2012Year 2/
Real GDP Growth
Interquartile range (25-75)MedianCosta Rica forecast error
1.6482%Has a percentile rank of:
Costa Rica median forecast error, 2004-2012:
Distribution of forecast errors: 1/
(in percent, actual-projection)
-6
-4
-2
0
2
4
6
2004 2005 2006 2007 2008 2009 2010 2011 2012Year 2/
Primary Balance
Interquartile range (25-75)MedianCosta Rica forecast error
-0.6039%Has a percentile rank of:
Costa Rica median forecast error, 2004-2012:
Distribution of forecast errors: 1/
(in percent of GDP, actual-projection)
-6
-4
-2
0
2
4
6
8
10
2004 2005 2006 2007 2008 2009 2010 2011 2012Year 2/
Inflation (Deflator)
Interquartile range (25-75)MedianCosta Rica forecast error
0.8041%Has a percentile rank of:
Costa Rica median forecast error, 2004-2012:
Distribution of forecast errors: 1/
(in percent, actual-projection)
pess
imis
ticop
timis
tic
-6
-4
-2
0
2
4
6
8
t-5 t-4 t-3 t-2 t-1 t t+1 t+2 t+3 t+4 t+5
Real GDP growth
Costa …(in percent)
Not applicable for Costa Rica
pess
imis
ticop
timis
tic
pess
imis
ticop
timis
tic
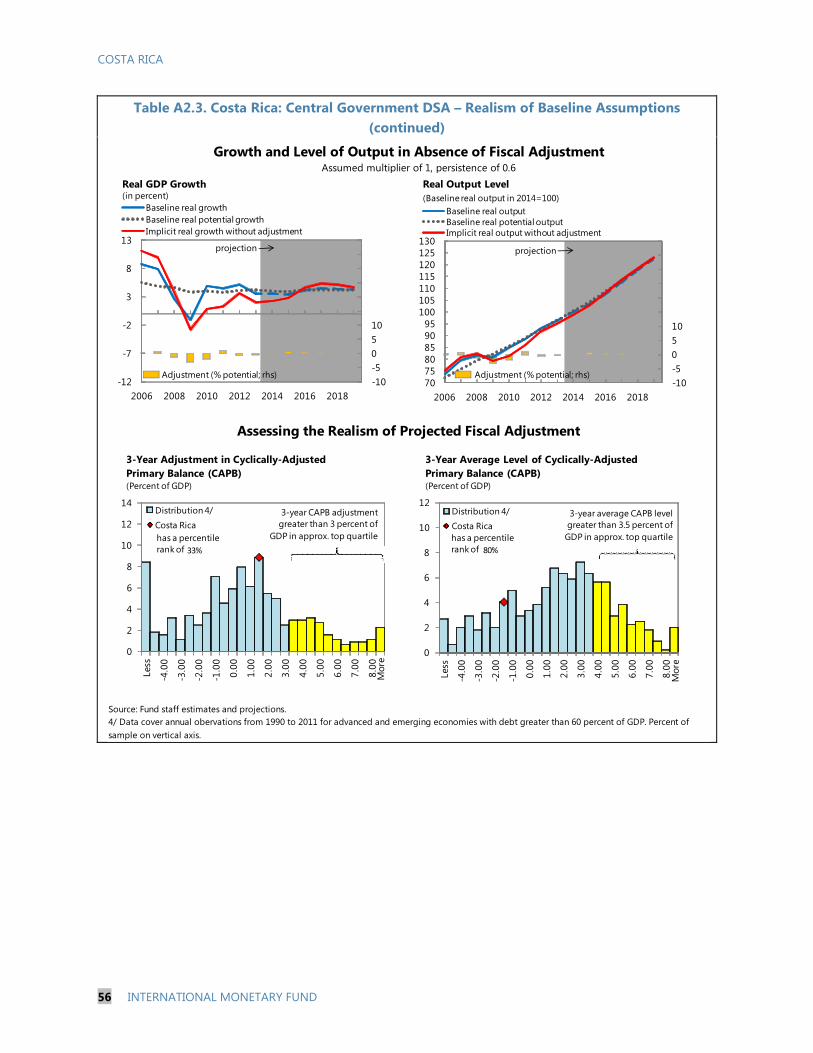
COSTA RICA
56 INTERNATIONAL MONETARY FUND
Table A2.3. Costa Rica: Central Government DSA – Realism of Baseline Assumptions (continued)
Source: Fund staff estimates and projections.4/ Data cover annual obervations from 1990 to 2011 for advanced and emerging economies with debt greater than 60 percent of GDP. Percent of sample on vertical axis.
Assumed multiplier of 1, persistence of 0.6Growth and Level of Output in Absence of Fiscal Adjustment
Assessing the Realism of Projected Fiscal Adjustment
-10-50510152025303540
707580859095
100105110115120125130
2006 2008 2010 2012 2014 2016 2018
Baseline real outputBaseline real potential outputImplicit real output without adjustment
Real Output Level(Baseline real output in 2014=100)
Adjustment (% potential; rhs)
projection
-10-50510152025303540
-12
-7
-2
3
8
13
2006 2008 2010 2012 2014 2016 2018
Baseline real growthBaseline real potential growthImplicit real growth without adjustment
(in percent)
Adjustment (% potential; rhs)
Real GDP Growth
projection
0
2
4
6
8
10
12
14
Less
-4.0
0
-3.0
0
-2.0
0
-1.0
0
0.00
1.00
2.00
3.00
4.00
5.00
6.00
7.00
8.00
Distribution 4/
Costa Rica
3-Year Adjustment in Cyclically-Adjusted Primary Balance (CAPB)(Percent of GDP)
Mor
e
3-year CAPB adjustment greater than 3 percent of
GDP in approx. top quartile
0
2
4
6
8
10
12
Less
-4.0
0
-3.0
0
-2.0
0
-1.0
0
0.00
1.00
2.00
3.00
4.00
5.00
6.00
7.00
8.00
Distribution 4/Costa Rica
3-Year Average Level of Cyclically-Adjusted Primary Balance (CAPB)(Percent of GDP)
Mor
e
3-year average CAPB level greater than 3.5 percent of GDP in approx. top quartilehas a percentile
rank of 33%
has a percentile rank of 80%

COSTA RICA
INTERNATIONAL MONETARY FUND 57
Table A2.4. Costa Rica: Central Government DSA – Stress Tests
Primary Balance Shock 2014 2015 2016 2017 2018 2019 Real GDP Growth Shock 2014 2015 2016 2017 2018 2019Real GDP growth 3.6 3.4 4.2 4.5 4.4 4.3 Real GDP growth 3.6 0.7 1.5 4.5 4.4 4.3Inflation 5.5 5.5 4.1 4.1 4.3 4.2 Inflation 5.5 4.8 3.4 4.1 4.3 4.2Primary balance -3.1 -3.8 -3.2 -1.5 -1.5 -1.5 Primary balance -3.1 -3.0 -3.0 -1.5 -1.5 -1.5Effective interest rate 9.4 9.6 9.2 9.2 9.4 9.6 Effective interest rate 9.4 9.6 9.2 9.2 9.4 9.6
Real Interest Rate Shock Real Exchange Rate ShockReal GDP growth 3.6 3.4 4.2 4.5 4.4 4.3 Real GDP growth 3.6 3.4 4.2 4.5 4.4 4.3Inflation 5.5 5.5 4.1 4.1 4.3 4.2 Inflation 5.5 9.4 4.1 4.1 4.3 4.2Primary balance -3.1 -2.5 -1.9 -1.5 -1.5 -1.5 Primary balance -3.1 -2.5 -1.9 -1.5 -1.5 -1.5Effective interest rate 9.4 9.6 9.7 9.9 10.4 10.7 Effective interest rate 9.4 10.0 9.0 9.0 9.3 9.4
Combined ShockReal GDP growth 3.6 0.7 1.5 4.5 4.4 4.3Inflation 5.5 4.8 3.4 4.1 4.3 4.2Primary balance -3.1 -3.8 -3.2 -1.5 -1.5 -1.5Effective interest rate 9.4 10.0 9.6 9.8 10.3 10.7
Source: Fund staff estimates and projections.
(in percent)
Real Exchange Rate Shock
Combined Macro-Fiscal Shock
Additional Stress Tests
Baseline
Underlying Assumptions
Macro-Fiscal Stress Tests
Baseline Primary Balance ShockReal GDP Growth Shock
Real Interest Rate Shock
0
10
20
30
40
50
60
2014 2015 2016 2017 2018 2019
Gross Nominal Public Debt(in percent of GDP)
0
50
100
150
200
250
300
350
400
2014 2015 2016 2017 2018 2019
Gross Nominal Public Debt(in percent of Revenue)
0
2
4
6
8
10
12
14
16
2014 2015 2016 2017 2018 2019
Public Gross Financing Needs(in percent of GDP)
0
10
20
30
40
50
60
70
2014 2015 2016 2017 2018 2019
Gross Nominal Public Debt(in percent of GDP)
200
250
300
350
400
450
2014 2015 2016 2017 2018 2019
Gross Nominal Public Debt(in percent of Revenue)
0
2
4
6
8
10
12
14
16
2014 2015 2016 2017 2018 2019
Public Gross Financing Needs(in percent of GDP)
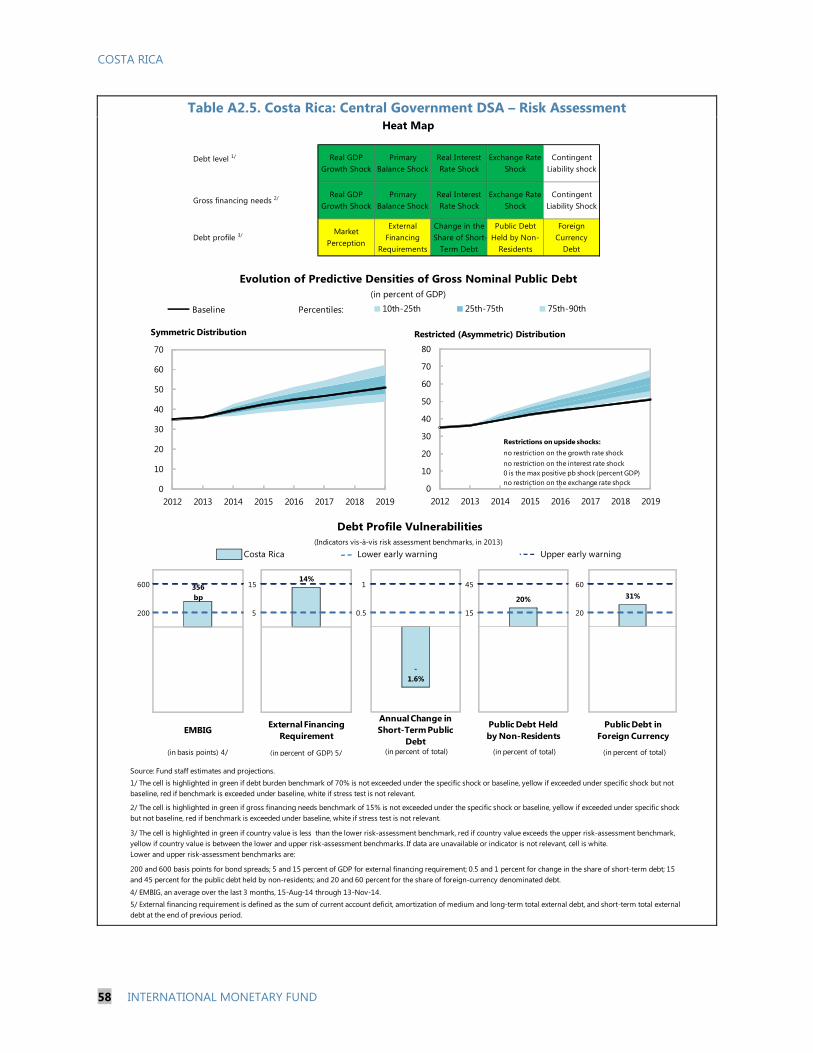
COSTA RICA
58 INTERNATIONAL MONETARY FUND
Table A2.5. Costa Rica: Central Government DSA – Risk Assessment
Costa Rica
Source: Fund staff estimates and projections.
5/ External financing requirement is defined as the sum of current account deficit, amortization of medium and long-term total external debt, and short-term total external debt at the end of previous period.
4/ EMBIG, an average over the last 3 months, 15-Aug-14 through 13-Nov-14.
2/ The cell is highlighted in green if gross financing needs benchmark of 15% is not exceeded under the specific shock or baseline, yellow if exceeded under specific shock but not baseline, red if benchmark is exceeded under baseline, white if stress test is not relevant.
200 and 600 basis points for bond spreads; 5 and 15 percent of GDP for external financing requirement; 0.5 and 1 percent for change in the share of short-term debt; 15 and 45 percent for the public debt held by non-residents; and 20 and 60 percent for the share of foreign-currency denominated debt.
Market Perception
Debt level 1/ Real GDP Growth Shock
Primary Balance Shock
3/ The cell is highlighted in green if country value is less than the lower risk-assessment benchmark, red if country value exceeds the upper risk-assessment benchmark, yellow if country value is between the lower and upper risk-assessment benchmarks. If data are unavailable or indicator is not relevant, cell is white. Lower and upper risk-assessment benchmarks are:
Change in the Share of Short-
Term Debt
Foreign Currency
Debt
Public Debt Held by Non-
Residents
Primary Balance Shock
Real Interest Rate Shock
Exchange Rate Shock
Contingent Liability Shock
Exchange Rate Shock
Contingent Liability shock
1/ The cell is highlighted in green if debt burden benchmark of 70% is not exceeded under the specific shock or baseline, yellow if exceeded under specific shock but not baseline, red if benchmark is exceeded under baseline, white if stress test is not relevant.
Real Interest Rate Shock
External Financing
Requirements
Real GDP Growth Shock
Heat Map
Upper early warning
Evolution of Predictive Densities of Gross Nominal Public Debt(in percent of GDP)
Debt profile 3/
Lower early warning(Indicators vis-à-vis risk assessment benchmarks, in 2013)
Debt Profile Vulnerabilities
Gross financing needs 2/
20
6031%
1 2
200
600 356 bp
1 2
5
1514%
1 2
0.5
1
-1.6%
1 2
EMBIG External Financing Requirement
Annual Change in Short-Term Public
Debt
Public Debt in Foreign Currency
(in basis points) 4/ (in percent of GDP) 5/ (in percent of total) (in percent of total)
0
10
20
30
40
50
60
70
2012 2013 2014 2015 2016 2017 2018 2019
10th-25th 25th-75th 75th-90thPercentiles:Baseline
Symmetric Distribution
0
10
20
30
40
50
60
70
80
2012 2013 2014 2015 2016 2017 2018 2019
Restricted (Asymmetric) Distribution
no restriction on the growth rate shockno restriction on the interest rate shock0 is the max positive pb shock (percent GDP)no restriction on the exchange rate shock
Restrictions on upside shocks:
15
45
20%
1 2
Public Debt Held by Non-Residents
(in percent of total)
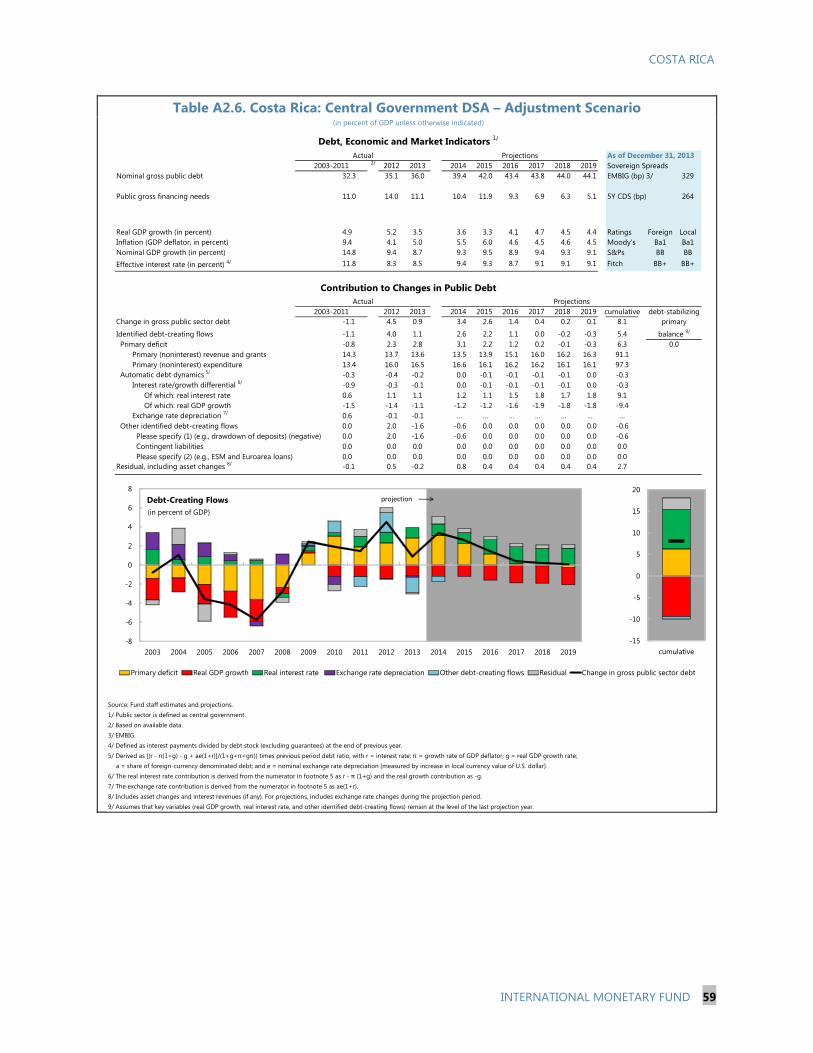
COSTA RICA
INTERNATIONAL MONETARY FUND 59
Table A2.6. Costa Rica: Central Government DSA – Adjustment Scenario
As of December 31, 20132/ 2012 2013 2014 2015 2016 2017 2018 2019 Sovereign Spreads
Nominal gross public debt 32.3 35.1 36.0 39.4 42.0 43.4 43.8 44.0 44.1 EMBIG (bp) 3/ 329
Public gross financing needs 11.0 14.0 11.1 10.4 11.9 9.3 6.9 6.3 5.1 5Y CDS (bp) 264
Real GDP growth (in percent) 4.9 5.2 3.5 3.6 3.3 4.1 4.7 4.5 4.4 Ratings Foreign LocalInflation (GDP deflator, in percent) 9.4 4.1 5.0 5.5 6.0 4.6 4.5 4.6 4.5 Moody's Ba1 Ba1Nominal GDP growth (in percent) 14.8 9.4 8.7 9.3 9.5 8.9 9.4 9.3 9.1 S&Ps BB BBEffective interest rate (in percent) 4/ 11.8 8.3 8.5 9.4 9.3 8.7 9.1 9.1 9.1 Fitch BB+ BB+
2012 2013 2014 2015 2016 2017 2018 2019 cumulativeChange in gross public sector debt -1.1 4.5 0.9 3.4 2.6 1.4 0.4 0.2 0.1 8.1
Identified debt-creating flows -1.1 4.0 1.1 2.6 2.2 1.1 0.0 -0.2 -0.3 5.4Primary deficit -0.8 2.3 2.8 3.1 2.2 1.2 0.2 -0.1 -0.3 6.3
Primary (noninterest) revenue and grants 14.3 13.7 13.6 13.5 13.9 15.1 16.0 16.2 16.3 91.1Primary (noninterest) expenditure 13.4 16.0 16.5 16.6 16.1 16.2 16.2 16.1 16.1 97.3
Automatic debt dynamics 5/ -0.3 -0.4 -0.2 0.0 -0.1 -0.1 -0.1 -0.1 0.0 -0.3Interest rate/growth differential 6/ -0.9 -0.3 -0.1 0.0 -0.1 -0.1 -0.1 -0.1 0.0 -0.3
Of which: real interest rate 0.6 1.1 1.1 1.2 1.1 1.5 1.8 1.7 1.8 9.1Of which: real GDP growth -1.5 -1.4 -1.1 -1.2 -1.2 -1.6 -1.9 -1.8 -1.8 -9.4
Exchange rate depreciation 7/ 0.6 -0.1 -0.1 … … … … … … …Other identified debt-creating flows 0.0 2.0 -1.6 -0.6 0.0 0.0 0.0 0.0 0.0 -0.6
Please specify (1) (e.g., drawdown of deposits) (negative) 0.0 2.0 -1.6 -0.6 0.0 0.0 0.0 0.0 0.0 -0.6Contingent liabilities 0.0 0.0 0.0 0.0 0.0 0.0 0.0 0.0 0.0 0.0Please specify (2) (e.g., ESM and Euroarea loans) 0.0 0.0 0.0 0.0 0.0 0.0 0.0 0.0 0.0 0.0
Residual, including asset changes 8/ -0.1 0.5 -0.2 0.8 0.4 0.4 0.4 0.4 0.4 2.7
Source: Fund staff estimates and projections.1/ Public sector is defined as central government.2/ Based on available data.3/ EMBIG.4/ Defined as interest payments divided by debt stock (excluding guarantees) at the end of previous year.5/ Derived as [(r - π(1+g) - g + ae(1+r)]/(1+g+π+gπ)) times previous period debt ratio, with r = interest rate; π = growth rate of GDP deflator; g = real GDP growth rate;
a = share of foreign-currency denominated debt; and e = nominal exchange rate depreciation (measured by increase in local currency value of U.S. dollar).6/ The real interest rate contribution is derived from the numerator in footnote 5 as r - π (1+g) and the real growth contribution as -g.7/ The exchange rate contribution is derived from the numerator in footnote 5 as ae(1+r). 8/ Includes asset changes and interest revenues (if any). For projections, includes exchange rate changes during the projection period.9/ Assumes that key variables (real GDP growth, real interest rate, and other identified debt-creating flows) remain at the level of the last projection year.
0.0balance 9/
primary
(in percent of GDP unless otherwise indicated)
Debt, Economic and Market Indicators 1/
2003-2011Actual
Projections
Contribution to Changes in Public DebtProjections
2003-2011Actual
debt-stabilizing
-8
-6
-4
-2
0
2
4
6
8
2003 2004 2005 2006 2007 2008 2009 2010 2011 2012 2013 2014 2015 2016 2017 2018 2019
Debt-Creating Flows
Primary deficit Real GDP growth Real interest rate Exchange rate depreciation Other debt-creating flows Residual Change in gross public sector debt
projection
(in percent of GDP)
-15
-10
-5
0
5
10
15
20
cumulative
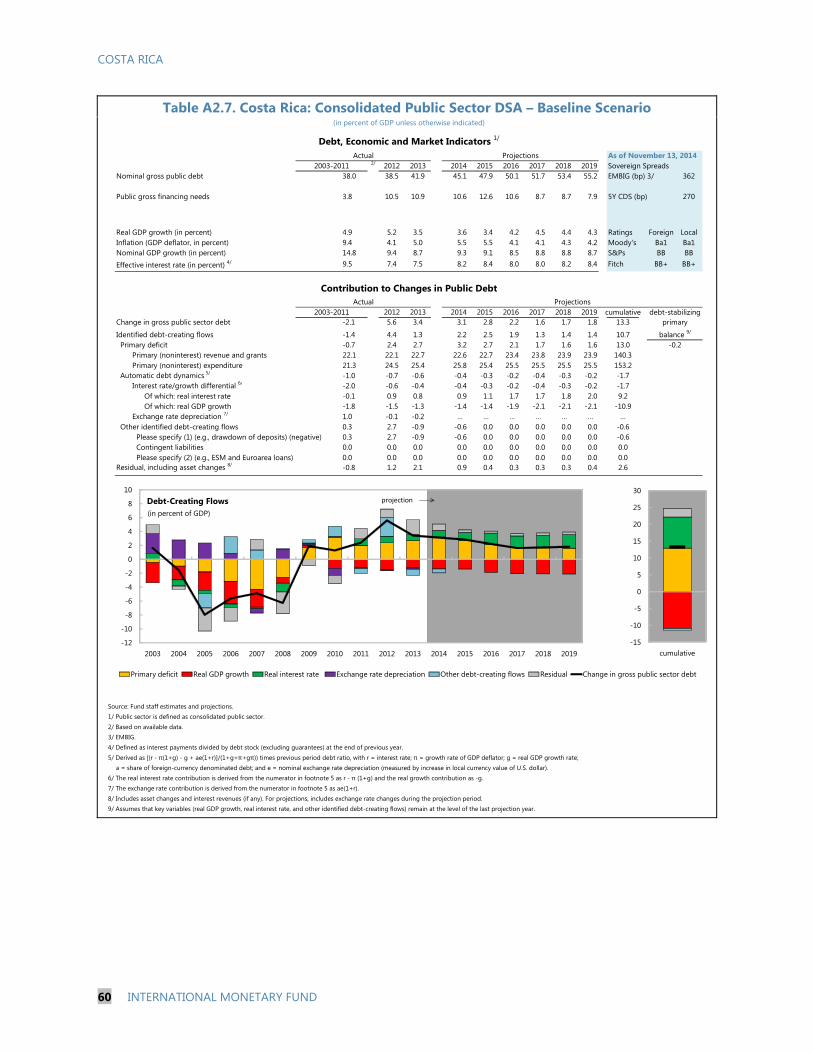
COSTA RICA
60 INTERNATIONAL MONETARY FUND
Table A2.7. Costa Rica: Consolidated Public Sector DSA – Baseline Scenario
As of November 13, 20142/ 2012 2013 2014 2015 2016 2017 2018 2019 Sovereign Spreads
Nominal gross public debt 38.0 38.5 41.9 45.1 47.9 50.1 51.7 53.4 55.2 EMBIG (bp) 3/ 362
Public gross financing needs 3.8 10.5 10.9 10.6 12.6 10.6 8.7 8.7 7.9 5Y CDS (bp) 270
Real GDP growth (in percent) 4.9 5.2 3.5 3.6 3.4 4.2 4.5 4.4 4.3 Ratings Foreign LocalInflation (GDP deflator, in percent) 9.4 4.1 5.0 5.5 5.5 4.1 4.1 4.3 4.2 Moody's Ba1 Ba1Nominal GDP growth (in percent) 14.8 9.4 8.7 9.3 9.1 8.5 8.8 8.8 8.7 S&Ps BB BB
Effective interest rate (in percent) 4/ 9.5 7.4 7.5 8.2 8.4 8.0 8.0 8.2 8.4 Fitch BB+ BB+
2012 2013 2014 2015 2016 2017 2018 2019 cumulativeChange in gross public sector debt -2.1 5.6 3.4 3.1 2.8 2.2 1.6 1.7 1.8 13.3
Identified debt-creating flows -1.4 4.4 1.3 2.2 2.5 1.9 1.3 1.4 1.4 10.7Primary deficit -0.7 2.4 2.7 3.2 2.7 2.1 1.7 1.6 1.6 13.0
Primary (noninterest) revenue and grants 22.1 22.1 22.7 22.6 22.7 23.4 23.8 23.9 23.9 140.3Primary (noninterest) expenditure 21.3 24.5 25.4 25.8 25.4 25.5 25.5 25.5 25.5 153.2
Automatic debt dynamics 5/ -1.0 -0.7 -0.6 -0.4 -0.3 -0.2 -0.4 -0.3 -0.2 -1.7Interest rate/growth differential 6/ -2.0 -0.6 -0.4 -0.4 -0.3 -0.2 -0.4 -0.3 -0.2 -1.7
Of which: real interest rate -0.1 0.9 0.8 0.9 1.1 1.7 1.7 1.8 2.0 9.2Of which: real GDP growth -1.8 -1.5 -1.3 -1.4 -1.4 -1.9 -2.1 -2.1 -2.1 -10.9
Exchange rate depreciation 7/ 1.0 -0.1 -0.2 … … … … … … …Other identified debt-creating flows 0.3 2.7 -0.9 -0.6 0.0 0.0 0.0 0.0 0.0 -0.6
Please specify (1) (e.g., drawdown of deposits) (negative) 0.3 2.7 -0.9 -0.6 0.0 0.0 0.0 0.0 0.0 -0.6Contingent liabilities 0.0 0.0 0.0 0.0 0.0 0.0 0.0 0.0 0.0 0.0Please specify (2) (e.g., ESM and Euroarea loans) 0.0 0.0 0.0 0.0 0.0 0.0 0.0 0.0 0.0 0.0
Residual, including asset changes 8/ -0.8 1.2 2.1 0.9 0.4 0.3 0.3 0.3 0.4 2.6
Source: Fund staff estimates and projections.1/ Public sector is defined as consolidated public sector.2/ Based on available data.3/ EMBIG.4/ Defined as interest payments divided by debt stock (excluding guarantees) at the end of previous year.5/ Derived as [(r - π(1+g) - g + ae(1+r)]/(1+g+π+gπ)) times previous period debt ratio, with r = interest rate; π = growth rate of GDP deflator; g = real GDP growth rate;
a = share of foreign-currency denominated debt; and e = nominal exchange rate depreciation (measured by increase in local currency value of U.S. dollar).6/ The real interest rate contribution is derived from the numerator in footnote 5 as r - π (1+g) and the real growth contribution as -g.7/ The exchange rate contribution is derived from the numerator in footnote 5 as ae(1+r). 8/ Includes asset changes and interest revenues (if any). For projections, includes exchange rate changes during the projection period.9/ Assumes that key variables (real GDP growth, real interest rate, and other identified debt-creating flows) remain at the level of the last projection year.
-0.2balance 9/
primary
(in percent of GDP unless otherwise indicated)
Debt, Economic and Market Indicators 1/
2003-2011Actual
Projections
Contribution to Changes in Public DebtProjections
2003-2011Actual
debt-stabilizing
-12
-10
-8
-6
-4
-2
0
2
4
6
8
10
2003 2004 2005 2006 2007 2008 2009 2010 2011 2012 2013 2014 2015 2016 2017 2018 2019
Debt-Creating Flows
Primary deficit Real GDP growth Real interest rate Exchange rate depreciation Other debt-creating flows Residual Change in gross public sector debt
projection
(in percent of GDP)
-15
-10
-5
0
5
10
15
20
25
30
cumulative
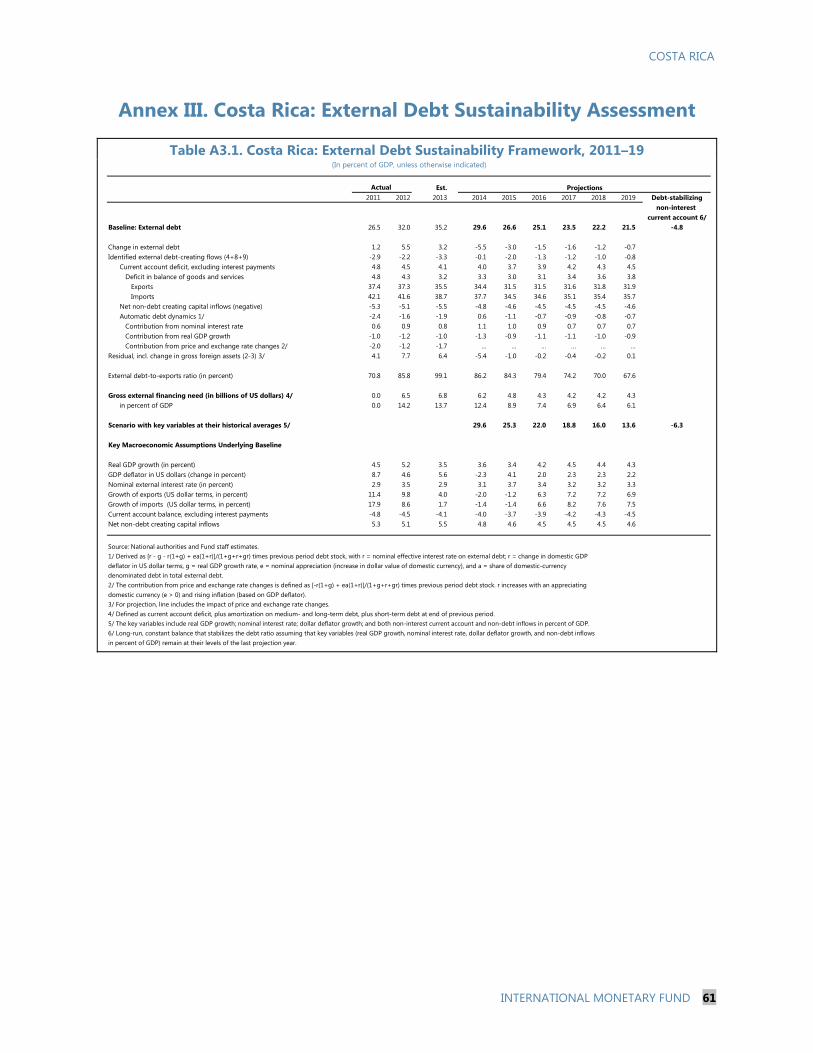
COSTA RICA
INTERNATIONAL MONETARY FUND 61
Annex III. Costa Rica: External Debt Sustainability Assessment
Table A3.1. Costa Rica: External Debt Sustainability Framework, 2011–19
Est. Projections2011 2012 2013 2014 2015 2016 2017 2018 2019 Debt-stabilizing
non-interest current account 6/
Baseline: External debt 26.5 32.0 35.2 29.6 26.6 25.1 23.5 22.2 21.5 -4.8
Change in external debt 1.2 5.5 3.2 -5.5 -3.0 -1.5 -1.6 -1.2 -0.7Identified external debt-creating flows (4+8+9) -2.9 -2.2 -3.3 -0.1 -2.0 -1.3 -1.2 -1.0 -0.8
Current account deficit, excluding interest payments 4.8 4.5 4.1 4.0 3.7 3.9 4.2 4.3 4.5Deficit in balance of goods and services 4.8 4.3 3.2 3.3 3.0 3.1 3.4 3.6 3.8
Exports 37.4 37.3 35.5 34.4 31.5 31.5 31.6 31.8 31.9Imports 42.1 41.6 38.7 37.7 34.5 34.6 35.1 35.4 35.7
Net non-debt creating capital inflows (negative) -5.3 -5.1 -5.5 -4.8 -4.6 -4.5 -4.5 -4.5 -4.6Automatic debt dynamics 1/ -2.4 -1.6 -1.9 0.6 -1.1 -0.7 -0.9 -0.8 -0.7
Contribution from nominal interest rate 0.6 0.9 0.8 1.1 1.0 0.9 0.7 0.7 0.7Contribution from real GDP growth -1.0 -1.2 -1.0 -1.3 -0.9 -1.1 -1.1 -1.0 -0.9Contribution from price and exchange rate changes 2/ -2.0 -1.2 -1.7 … … … … … …
Residual, incl. change in gross foreign assets (2-3) 3/ 4.1 7.7 6.4 -5.4 -1.0 -0.2 -0.4 -0.2 0.1
External debt-to-exports ratio (in percent) 70.8 85.8 99.1 86.2 84.3 79.4 74.2 70.0 67.6
Gross external financing need (in billions of US dollars) 4/ 0.0 6.5 6.8 6.2 4.8 4.3 4.2 4.2 4.3in percent of GDP 0.0 14.2 13.7 12.4 8.9 7.4 6.9 6.4 6.1
Scenario with key variables at their historical averages 5/ 29.6 25.3 22.0 18.8 16.0 13.6 -6.3
Key Macroeconomic Assumptions Underlying Baseline
Real GDP growth (in percent) 4.5 5.2 3.5 3.6 3.4 4.2 4.5 4.4 4.3GDP deflator in US dollars (change in percent) 8.7 4.6 5.6 -2.3 4.1 2.0 2.3 2.3 2.2Nominal external interest rate (in percent) 2.9 3.5 2.9 3.1 3.7 3.4 3.2 3.2 3.3Growth of exports (US dollar terms, in percent) 11.4 9.8 4.0 -2.0 -1.2 6.3 7.2 7.2 6.9Growth of imports (US dollar terms, in percent) 17.9 8.6 1.7 -1.4 -1.4 6.6 8.2 7.6 7.5Current account balance, excluding interest payments -4.8 -4.5 -4.1 -4.0 -3.7 -3.9 -4.2 -4.3 -4.5Net non-debt creating capital inflows 5.3 5.1 5.5 4.8 4.6 4.5 4.5 4.5 4.6
Source: National authorities and Fund staff estimates.1/ Derived as [r - g - r(1+g) + ea(1+r)]/(1+g+r+gr) times previous period debt stock, with r = nominal effective interest rate on external debt; r = change in domestic GDP deflator in US dollar terms, g = real GDP growth rate, e = nominal appreciation (increase in dollar value of domestic currency), and a = share of domestic-currency denominated debt in total external debt.2/ The contribution from price and exchange rate changes is defined as [-r(1+g) + ea(1+r)]/(1+g+r+gr) times previous period debt stock. r increases with an appreciating domestic currency (e > 0) and rising inflation (based on GDP deflator). 3/ For projection, line includes the impact of price and exchange rate changes.4/ Defined as current account deficit, plus amortization on medium- and long-term debt, plus short-term debt at end of previous period. 5/ The key variables include real GDP growth; nominal interest rate; dollar deflator growth; and both non-interest current account and non-debt inflows in percent of GDP.6/ Long-run, constant balance that stabilizes the debt ratio assuming that key variables (real GDP growth, nominal interest rate, dollar deflator growth, and non-debt inflows in percent of GDP) remain at their levels of the last projection year.
(In percent of GDP, unless otherwise indicated)
Actual
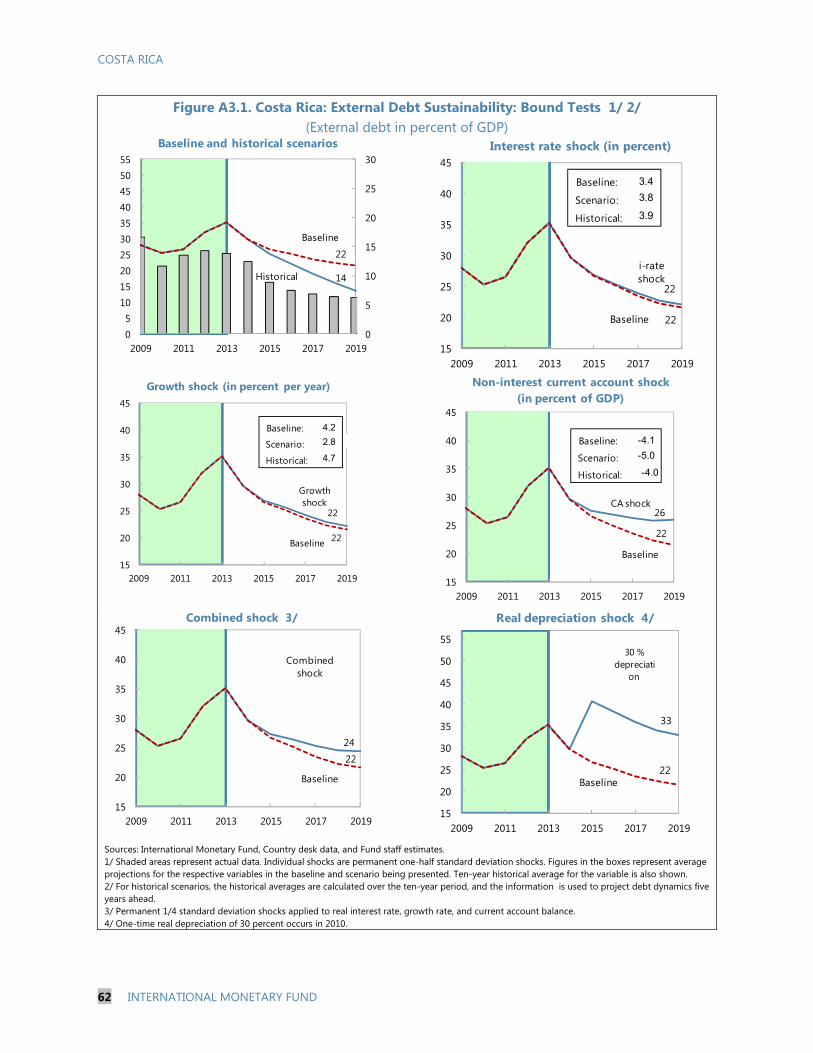
COSTA RICA
62 INTERNATIONAL MONETARY FUND
Figure A3.1. Costa Rica: External Debt Sustainability: Bound Tests 1/ 2/ (External debt in percent of GDP)
Sources: International Monetary Fund, Country desk data, and Fund staff estimates. 1/ Shaded areas represent actual data. Individual shocks are permanent one-half standard deviation shocks. Figures in the boxes represent average projections for the respective variables in the baseline and scenario being presented. Ten-year historical average for the variable is also shown. 2/ For historical scenarios, the historical averages are calculated over the ten-year period, and the information is used to project debt dynamics five years ahead. 3/ Permanent 1/4 standard deviation shocks applied to real interest rate, growth rate, and current account balance. 4/ One-time real depreciation of 30 percent occurs in 2010.
Historical 14
Baseline
22
0
5
10
15
20
25
30
05
10152025303540455055
2009 2011 2013 2015 2017 2019
Baseline and historical scenarios
i-rate shock
22
Baseline 22
15
20
25
30
35
40
45
2009 2011 2013 2015 2017 2019
Interest rate shock (in percent)
Baseline:
Scenario:
Historical:
3.4
3.8
3.9
Growth shock
22
Baseline 22
15
20
25
30
35
40
45
2009 2011 2013 2015 2017 2019
Growth shock (in percent per year)
Baseline:
Scenario:
Historical:
4.2
2.8
4.7
CA shock 26
Baseline
22
15
20
25
30
35
40
45
2009 2011 2013 2015 2017 2019
Non-interest current account shock (in percent of GDP)
Baseline:
Scenario:
Historical:
-4.1
-5.0
-4.0
Combined shock
24
Baseline
22
15
20
25
30
35
40
45
2009 2011 2013 2015 2017 2019
Combined shock 3/
30 % depreciati
on
33
Baseline22
15
20
25
30
35
40
45
50
55
2009 2011 2013 2015 2017 2019
Real depreciation shock 4/
i
COSTA RICA
STAFF REPORT FOR THE 2014 ARTICLE IV
CONSULTATION—INFORMATIONAL ANNEX
Prepared By: The Western Hemisphere Department
FUND RELATIONS __________________________________________________________________________ 2
PAST FUND STAFF RECOMMENDATIONS AND IMPLEMENTATION _____________________ 4
RELATIONS WITH THE WORLD BANK AND BANK-FUND COLLABORATION UNDER
THE JOINT MANAGEMENT ACTION PLAN (JMAP) _______________________________________ 5
RELATIONS WITH THE INTER-AMERICAN DEVELOPMENT BANK _______________________ 8
STATISTICAL ISSUES _____________________________________________________________________ 10
CONTENTS
January 9, 2015
COSTA RICA
2 INTERNATIONAL MONETARY FUND
FUND RELATIONS
(As of October 31, 2014)
Membership Status: Joined: January 8, 1946
General Resources Account: SDR Million % Quota
Quota 164.10 100.00
Fund holdings of currency 144.09 87.81
Reserve Tranche Position 20.02 12.20
SDR Department: SDR Million % Allocation
Net cumulative allocation 156.53 100.00
Holdings 132.50 84.65
Outstanding Purchases and Loans:
None
Latest Financial Arrangements:
Date of Expiration Amount
Approved Amount Drawn
Type Arrangement Date (SDR Million) (SDR Million)
Stand-By 04/11/2009 07/10/2010 492.30 0.00
Stand-By 11/29/1995 02/28/1997 52.00 0.00
Stand-By 04/19/1993 02/18/1994 21.04 0.00
Projected Payments to Fund
(SDR Million; based on existing use of resources and present holdings of SDRs):
Overdue Forthcoming
2015 2016 2017 2018
Principal 0.00 0.00 0.00 0.00 0.00
Charges/Interest 0.00 0.01 0.01 0.01 0.01
Total 0.00 0.01 0.01 0.01 0.01
Exchange Rate Arrangement. Costa Rica’s de jure exchange rate arrangement is classified as a
“crawling band,” while the de facto exchange rate arrangement is classified as “stabilized.” Since
October 2006, the de jure exchange rate arrangement has been a crawling band with an increasing
width. The ceiling and floor of the band have been adjusted several times, most recently in
January 2009, when the crawl rate of the band’s ceiling has been set at 0.20 colones (previously 0.06
colones) a business day. The floor of the band has been flat since July 2008. As of December 3, 2014,
the intervention buying and selling exchange rates were 500 and 858.25 colones per U.S. dollar
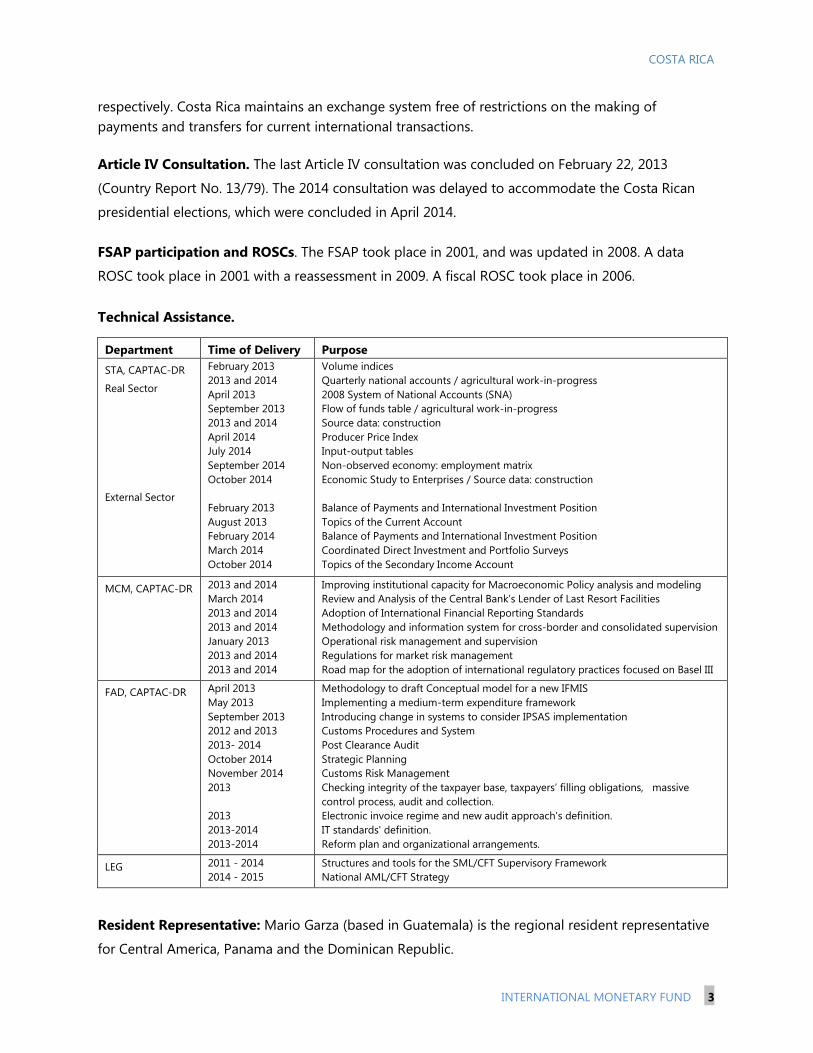
COSTA RICA
INTERNATIONAL MONETARY FUND 3
respectively. Costa Rica maintains an exchange system free of restrictions on the making of
payments and transfers for current international transactions.
Article IV Consultation. The last Article IV consultation was concluded on February 22, 2013
(Country Report No. 13/79). The 2014 consultation was delayed to accommodate the Costa Rican
presidential elections, which were concluded in April 2014.
FSAP participation and ROSCs. The FSAP took place in 2001, and was updated in 2008. A data
ROSC took place in 2001 with a reassessment in 2009. A fiscal ROSC took place in 2006.
Technical Assistance.
Department Time of Delivery Purpose
STA, CAPTAC-DR
Real Sector
External Sector
February 2013
2013 and 2014
April 2013
September 2013
2013 and 2014
April 2014
July 2014
September 2014
October 2014
February 2013
August 2013
February 2014
March 2014
October 2014
Volume indices
Quarterly national accounts / agricultural work-in-progress
2008 System of National Accounts (SNA)
Flow of funds table / agricultural work-in-progress
Source data: construction
Producer Price Index
Input-output tables
Non-observed economy: employment matrix
Economic Study to Enterprises / Source data: construction
Balance of Payments and International Investment Position
Topics of the Current Account
Balance of Payments and International Investment Position
Coordinated Direct Investment and Portfolio Surveys
Topics of the Secondary Income Account
MCM, CAPTAC-DR 2013 and 2014
March 2014
2013 and 2014
2013 and 2014
January 2013
2013 and 2014
2013 and 2014
Improving institutional capacity for Macroeconomic Policy analysis and modeling
Review and Analysis of the Central Bank’s Lender of Last Resort Facilities
Adoption of International Financial Reporting Standards
Methodology and information system for cross-border and consolidated supervision
Operational risk management and supervision
Regulations for market risk management
Road map for the adoption of international regulatory practices focused on Basel III
FAD, CAPTAC-DR April 2013
May 2013
September 2013
2012 and 2013
2013- 2014
October 2014
November 2014
2013
2013
2013-2014
2013-2014
Methodology to draft Conceptual model for a new IFMIS
Implementing a medium-term expenditure framework
Introducing change in systems to consider IPSAS implementation
Customs Procedures and System
Post Clearance Audit
Strategic Planning
Customs Risk Management
Checking integrity of the taxpayer base, taxpayers’ filling obligations, massive
control process, audit and collection.
Electronic invoice regime and new audit approach's definition.
IT standards' definition.
Reform plan and organizational arrangements.
LEG 2011 - 2014
2014 - 2015
Structures and tools for the SML/CFT Supervisory Framework
National AML/CFT Strategy
Resident Representative: Mario Garza (based in Guatemala) is the regional resident representative
for Central America, Panama and the Dominican Republic.
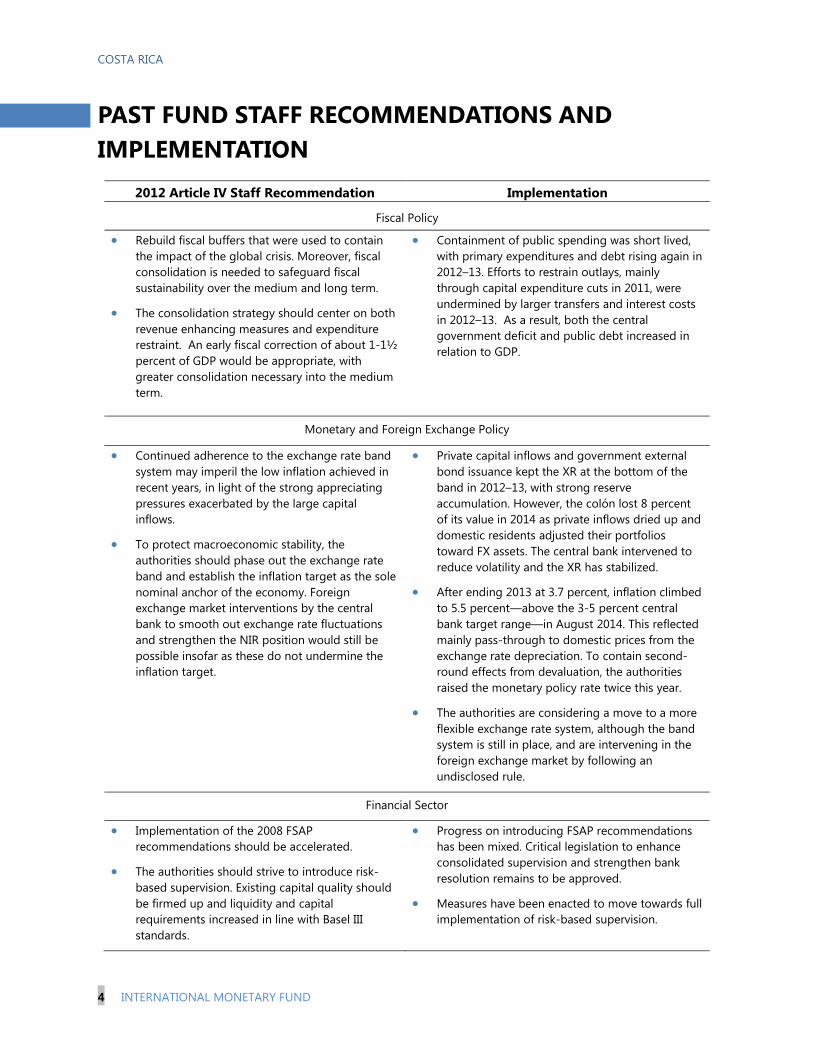
COSTA RICA
4 INTERNATIONAL MONETARY FUND
PAST FUND STAFF RECOMMENDATIONS AND
IMPLEMENTATION
2012 Article IV Staff Recommendation Implementation
Fiscal Policy
Rebuild fiscal buffers that were used to contain
the impact of the global crisis. Moreover, fiscal
consolidation is needed to safeguard fiscal
sustainability over the medium and long term.
The consolidation strategy should center on both
revenue enhancing measures and expenditure
restraint. An early fiscal correction of about 1-1½
percent of GDP would be appropriate, with
greater consolidation necessary into the medium
term.
Containment of public spending was short lived,
with primary expenditures and debt rising again in
2012–13. Efforts to restrain outlays, mainly
through capital expenditure cuts in 2011, were
undermined by larger transfers and interest costs
in 2012–13. As a result, both the central
government deficit and public debt increased in
relation to GDP.
Monetary and Foreign Exchange Policy
Continued adherence to the exchange rate band
system may imperil the low inflation achieved in
recent years, in light of the strong appreciating
pressures exacerbated by the large capital
inflows.
To protect macroeconomic stability, the
authorities should phase out the exchange rate
band and establish the inflation target as the sole
nominal anchor of the economy. Foreign
exchange market interventions by the central
bank to smooth out exchange rate fluctuations
and strengthen the NIR position would still be
possible insofar as these do not undermine the
inflation target.
Private capital inflows and government external
bond issuance kept the XR at the bottom of the
band in 2012–13, with strong reserve
accumulation. However, the colón lost 8 percent
of its value in 2014 as private inflows dried up and
domestic residents adjusted their portfolios
toward FX assets. The central bank intervened to
reduce volatility and the XR has stabilized.
After ending 2013 at 3.7 percent, inflation climbed
to 5.5 percent—above the 3-5 percent central
bank target range—in August 2014. This reflected
mainly pass-through to domestic prices from the
exchange rate depreciation. To contain second-
round effects from devaluation, the authorities
raised the monetary policy rate twice this year.
The authorities are considering a move to a more
flexible exchange rate system, although the band
system is still in place, and are intervening in the
foreign exchange market by following an
undisclosed rule.
Financial Sector
Implementation of the 2008 FSAP
recommendations should be accelerated.
The authorities should strive to introduce risk-
based supervision. Existing capital quality should
be firmed up and liquidity and capital
requirements increased in line with Basel III
standards.
Progress on introducing FSAP recommendations
has been mixed. Critical legislation to enhance
consolidated supervision and strengthen bank
resolution remains to be approved.
Measures have been enacted to move towards full
implementation of risk-based supervision.
COSTA RICA
INTERNATIONAL MONETARY FUND 5
RELATIONS WITH THE WORLD BANK AND BANK-
FUND COLLABORATION UNDER THE JOINT
MANAGEMENT ACTION PLAN (JMAP)
1. In November 2014, the IMF’s Costa Rica team led by Mr. Figliuoli (mission chief) met
with the World Bank’s Costa Rica team led by Mr. Calvo-Gonzalez (lead economist and PREM
sector leader) to discuss macroeconomic challenges, identify macro-critical structural reforms,
and coordinate the two teams’ work.
2. The teams agreed that Costa Rica’s main macroeconomic challenges are to safeguard
fiscal sustainability, increase the effectiveness of monetary policy, maintain financial sector
stability and enhance competitiveness.
3. The teams also discussed potential strategies to foster inclusive growth in the context
of growing inequality.
4. Based on the shared assessment of macroeconomic challenges, the teams identified
four structural reform areas as macro-critical:
Fiscal consolidation. The fiscal consolidation strategy should comprise both revenue and
expenditure components, with a slant towards revenue enhancement. The adjustment plan
laid out by the authorities is appropriate, though critical elements need further elaboration.
Key elements for a successful adjustment plan include broadening the base for the VAT,
increasing VAT rates, raising marginal tax rates on high earners and containing growth of the
public sector wage bill.
Monetary policy framework. The transition to inflation targeting and greater exchange rate
flexibility should be accelerated in order to lock in low inflation achieved in recently years.
Financial sector stability. Progress has been made in adopting risk-based financial
supervision. Looking ahead, approval of legislation on consolidated supervision, deposit
insurance and banking resolution will be critical to bring the regulatory framework up to
international best practices.
Productivity. The country is making progress in addressing issues of universal coverage and
quality in secondary education, and is seeking to develop its scientific and technological
capabilities, which would help maintain Costa Rica’s growth of knowledge-intensive exports.
There is also strong commitment to improving the business environment and removing
burdensome red tape. Given the sizable investments required to upgrade infrastructure and
the tight fiscal situation, the government is seeking to create the institutional conditions to
engage the private sector in financing, construction and management of infrastructure
COSTA RICA
6 INTERNATIONAL MONETARY FUND
projects (public-private partnerships), though these will require vigilance to avoid undue
contingent liabilities.
5. The teams agreed the following division of labor:
Fiscal consolidation. The IMF (the Fund) will continue to provide policy recommendations on
macro-fiscal issues, including the overall strategy of fiscal consolidation and the tax reform.
The World Bank (the Bank) will provide technical assistance to support the use of public-
private partnerships as a vehicle to finance key infrastructure projects. The government also
requested assistance to improve financial management, service delivery, and sustainability of
its social security system.
Monetary policy framework. The Fund will continue to provide policy recommendations
regarding the transition to inflation targeting and a more flexible exchange rate regime.
Financial sector stability. The Bank and the Fund will cooperate as necessary in assisting the
country in implementing the FSAP recommendations.
Productivity. The Bank will continue to provide policy recommendations in key areas. In
terms of lending, the government is being supported by a project in higher education
(approved in September 2012) and a catastrophe draw down deferred option (approved in
March 2009). The government has also requested technical assistance from IFC Advisory
services to improve the investment climate.
6. The teams have the following requests for information from their counterparts:
The Fund team requests to be kept informed of progress in the above macro-critical
structural reform areas. Timing: when milestones are reached (and at least semi-annually).
The Bank team requests to be kept informed of the Fund’s assessments of macroeconomic
policies and prospects. Timing: when milestones are reached (and at least semi-annually).
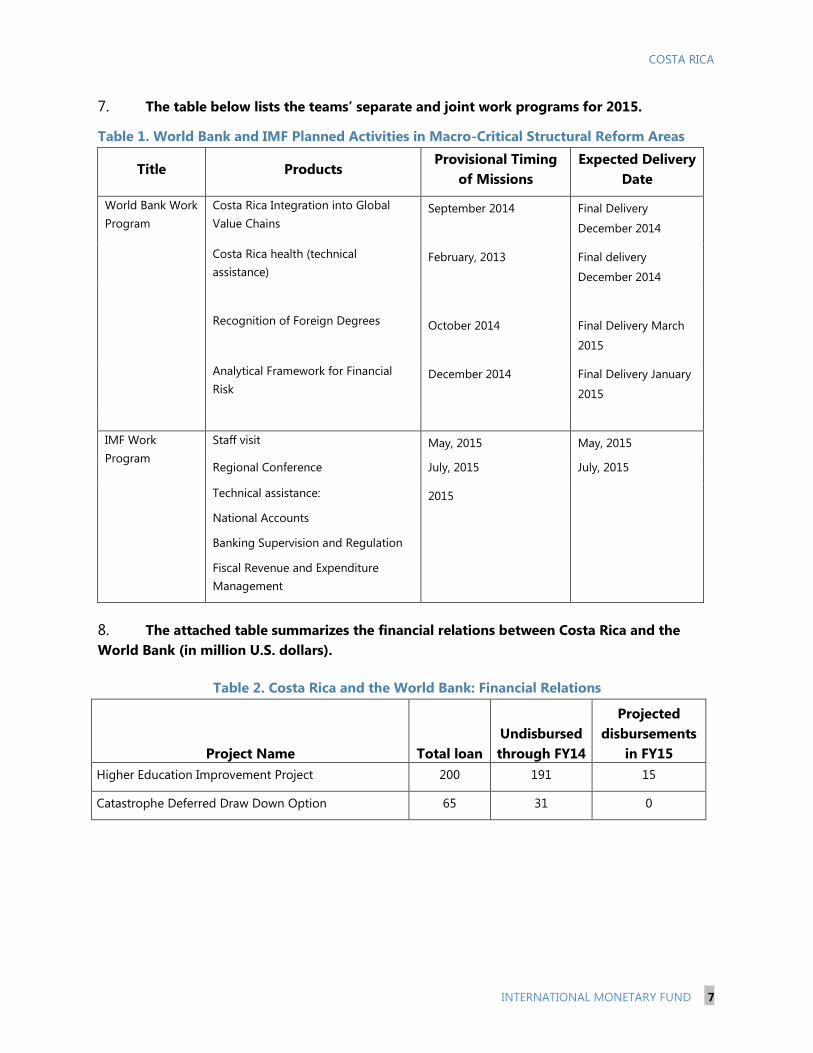
COSTA RICA
INTERNATIONAL MONETARY FUND 7
7. The table below lists the teams’ separate and joint work programs for 2015.
Table 1. World Bank and IMF Planned Activities in Macro-Critical Structural Reform Areas
Title Products Provisional Timing
of Missions
Expected Delivery
Date
World Bank Work
Program
Costa Rica Integration into Global
Value Chains
September 2014 Final Delivery
December 2014
Costa Rica health (technical
assistance)
February, 2013 Final delivery
December 2014
Recognition of Foreign Degrees
October 2014
Final Delivery March
2015
Analytical Framework for Financial
Risk
December 2014 Final Delivery January
2015
IMF Work
Program
Staff visit May, 2015 May, 2015
Regional Conference July, 2015 July, 2015
Technical assistance:
National Accounts
Banking Supervision and Regulation
Fiscal Revenue and Expenditure
Management
2015
8. The attached table summarizes the financial relations between Costa Rica and the
World Bank (in million U.S. dollars).
Table 2. Costa Rica and the World Bank: Financial Relations
Project Name Total loan
Undisbursed
through FY14
Projected
disbursements
in FY15
Higher Education Improvement Project 200 191 15
Catastrophe Deferred Draw Down Option 65 31 0
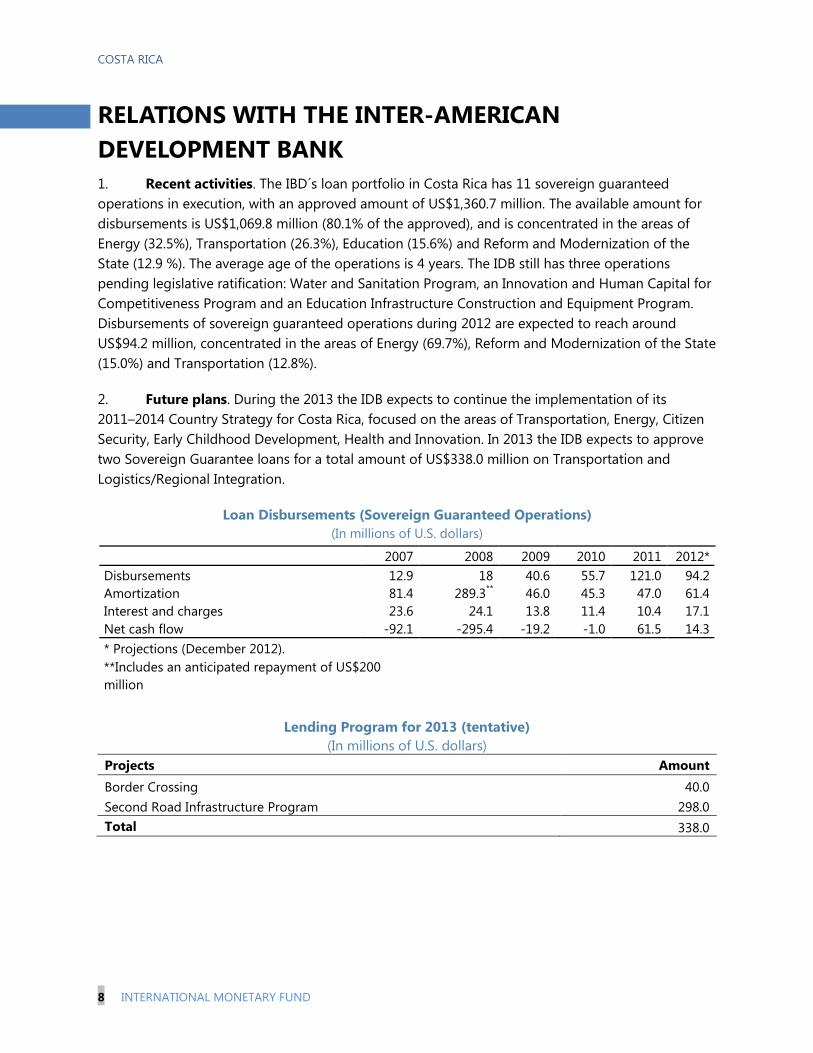
COSTA RICA
8 INTERNATIONAL MONETARY FUND
RELATIONS WITH THE INTER-AMERICAN
DEVELOPMENT BANK
1. Recent activities. The IBD´s loan portfolio in Costa Rica has 11 sovereign guaranteed
operations in execution, with an approved amount of US$1,360.7 million. The available amount for
disbursements is US$1,069.8 million (80.1% of the approved), and is concentrated in the areas of
Energy (32.5%), Transportation (26.3%), Education (15.6%) and Reform and Modernization of the
State (12.9 %). The average age of the operations is 4 years. The IDB still has three operations
pending legislative ratification: Water and Sanitation Program, an Innovation and Human Capital for
Competitiveness Program and an Education Infrastructure Construction and Equipment Program.
Disbursements of sovereign guaranteed operations during 2012 are expected to reach around
US$94.2 million, concentrated in the areas of Energy (69.7%), Reform and Modernization of the State
(15.0%) and Transportation (12.8%).
2. Future plans. During the 2013 the IDB expects to continue the implementation of its
2011–2014 Country Strategy for Costa Rica, focused on the areas of Transportation, Energy, Citizen
Security, Early Childhood Development, Health and Innovation. In 2013 the IDB expects to approve
two Sovereign Guarantee loans for a total amount of US$338.0 million on Transportation and
Logistics/Regional Integration.
Loan Disbursements (Sovereign Guaranteed Operations)
(In millions of U.S. dollars)
2007 2008 2009 2010 2011 2012*
Disbursements 12.9 18 40.6 55.7 121.0 94.2
Amortization 81.4 289.3** 46.0 45.3 47.0 61.4
Interest and charges 23.6 24.1 13.8 11.4 10.4 17.1
Net cash flow -92.1 -295.4 -19.2 -1.0 61.5 14.3
* Projections (December 2012).
**Includes an anticipated repayment of US$200
million
Lending Program for 2013 (tentative)
(In millions of U.S. dollars)
Projects Amount
Border Crossing 40.0
Second Road Infrastructure Program 298.0
Total 338.0
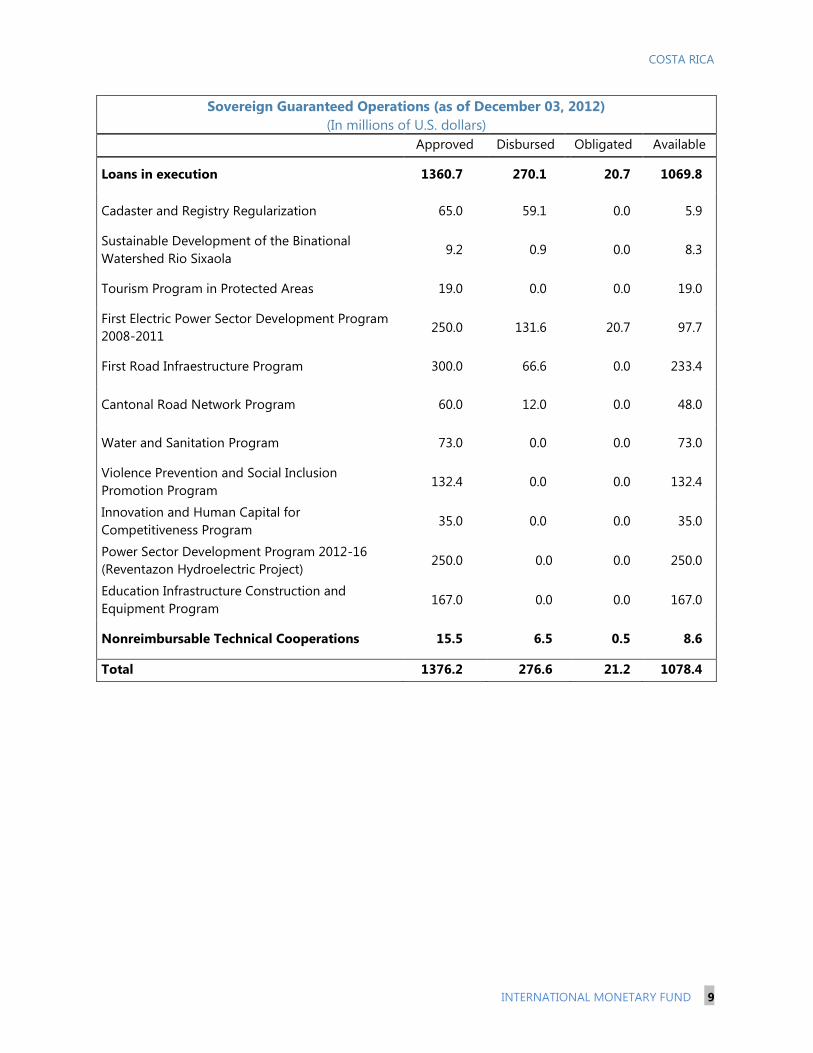
COSTA RICA
INTERNATIONAL MONETARY FUND 9
Sovereign Guaranteed Operations (as of December 03, 2012)
(In millions of U.S. dollars)
Approved Disbursed Obligated Available
Loans in execution 1360.7 270.1 20.7 1069.8
Cadaster and Registry Regularization 65.0 59.1 0.0 5.9
Sustainable Development of the Binational
Watershed Rio Sixaola 9.2 0.9 0.0 8.3
Tourism Program in Protected Areas 19.0 0.0 0.0 19.0
First Electric Power Sector Development Program
2008-2011 250.0 131.6 20.7 97.7
First Road Infraestructure Program 300.0 66.6 0.0 233.4
Cantonal Road Network Program 60.0 12.0 0.0 48.0
Water and Sanitation Program 73.0 0.0 0.0 73.0
Violence Prevention and Social Inclusion
Promotion Program 132.4 0.0 0.0 132.4
Innovation and Human Capital for
Competitiveness Program 35.0 0.0 0.0 35.0
Power Sector Development Program 2012-16
(Reventazon Hydroelectric Project) 250.0 0.0 0.0 250.0
Education Infrastructure Construction and
Equipment Program 167.0 0.0 0.0 167.0
Nonreimbursable Technical Cooperations 15.5 6.5 0.5 8.6
Total 1376.2 276.6 21.2 1078.4
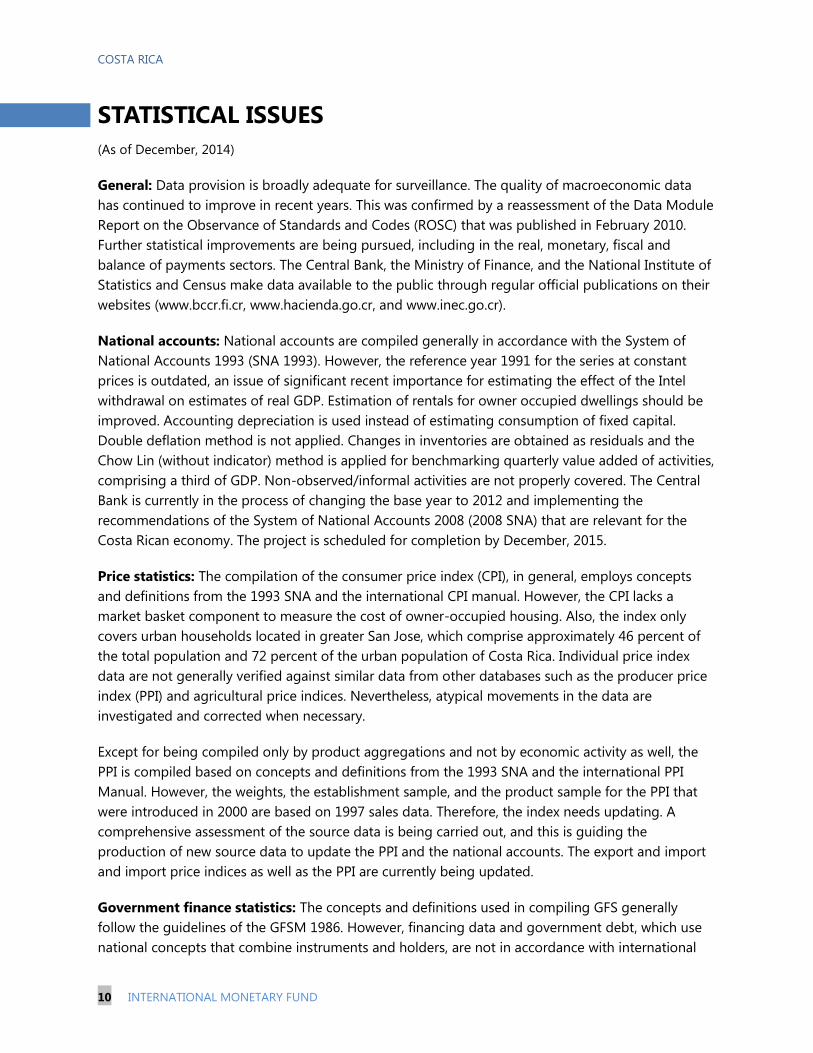
COSTA RICA
10 INTERNATIONAL MONETARY FUND
STATISTICAL ISSUES
(As of December, 2014)
General: Data provision is broadly adequate for surveillance. The quality of macroeconomic data
has continued to improve in recent years. This was confirmed by a reassessment of the Data Module
Report on the Observance of Standards and Codes (ROSC) that was published in February 2010.
Further statistical improvements are being pursued, including in the real, monetary, fiscal and
balance of payments sectors. The Central Bank, the Ministry of Finance, and the National Institute of
Statistics and Census make data available to the public through regular official publications on their
websites (www.bccr.fi.cr, www.hacienda.go.cr, and www.inec.go.cr).
National accounts: National accounts are compiled generally in accordance with the System of
National Accounts 1993 (SNA 1993). However, the reference year 1991 for the series at constant
prices is outdated, an issue of significant recent importance for estimating the effect of the Intel
withdrawal on estimates of real GDP. Estimation of rentals for owner occupied dwellings should be
improved. Accounting depreciation is used instead of estimating consumption of fixed capital.
Double deflation method is not applied. Changes in inventories are obtained as residuals and the
Chow Lin (without indicator) method is applied for benchmarking quarterly value added of activities,
comprising a third of GDP. Non-observed/informal activities are not properly covered. The Central
Bank is currently in the process of changing the base year to 2012 and implementing the
recommendations of the System of National Accounts 2008 (2008 SNA) that are relevant for the
Costa Rican economy. The project is scheduled for completion by December, 2015.
Price statistics: The compilation of the consumer price index (CPI), in general, employs concepts
and definitions from the 1993 SNA and the international CPI manual. However, the CPI lacks a
market basket component to measure the cost of owner-occupied housing. Also, the index only
covers urban households located in greater San Jose, which comprise approximately 46 percent of
the total population and 72 percent of the urban population of Costa Rica. Individual price index
data are not generally verified against similar data from other databases such as the producer price
index (PPI) and agricultural price indices. Nevertheless, atypical movements in the data are
investigated and corrected when necessary.
Except for being compiled only by product aggregations and not by economic activity as well, the
PPI is compiled based on concepts and definitions from the 1993 SNA and the international PPI
Manual. However, the weights, the establishment sample, and the product sample for the PPI that
were introduced in 2000 are based on 1997 sales data. Therefore, the index needs updating. A
comprehensive assessment of the source data is being carried out, and this is guiding the
production of new source data to update the PPI and the national accounts. The export and import
and import price indices as well as the PPI are currently being updated.
Government finance statistics: The concepts and definitions used in compiling GFS generally
follow the guidelines of the GFSM 1986. However, financing data and government debt, which use
national concepts that combine instruments and holders, are not in accordance with international
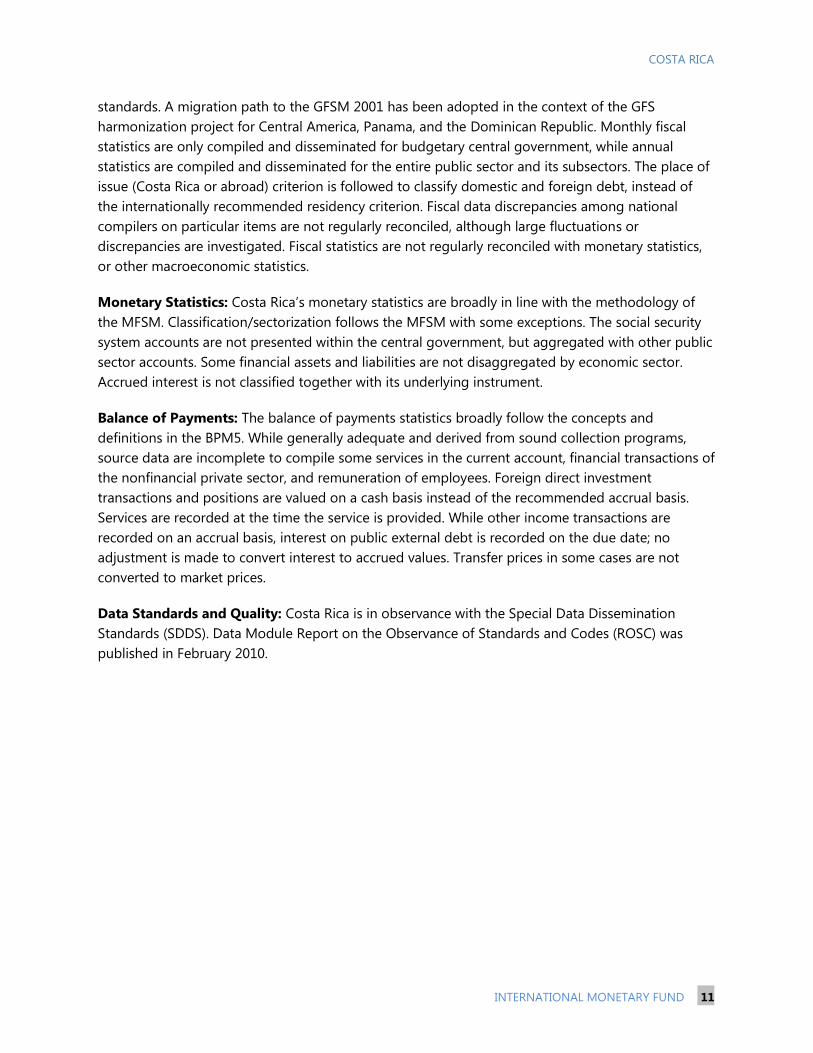
COSTA RICA
INTERNATIONAL MONETARY FUND 11
standards. A migration path to the GFSM 2001 has been adopted in the context of the GFS
harmonization project for Central America, Panama, and the Dominican Republic. Monthly fiscal
statistics are only compiled and disseminated for budgetary central government, while annual
statistics are compiled and disseminated for the entire public sector and its subsectors. The place of
issue (Costa Rica or abroad) criterion is followed to classify domestic and foreign debt, instead of
the internationally recommended residency criterion. Fiscal data discrepancies among national
compilers on particular items are not regularly reconciled, although large fluctuations or
discrepancies are investigated. Fiscal statistics are not regularly reconciled with monetary statistics,
or other macroeconomic statistics.
Monetary Statistics: Costa Rica’s monetary statistics are broadly in line with the methodology of
the MFSM. Classification/sectorization follows the MFSM with some exceptions. The social security
system accounts are not presented within the central government, but aggregated with other public
sector accounts. Some financial assets and liabilities are not disaggregated by economic sector.
Accrued interest is not classified together with its underlying instrument.
Balance of Payments: The balance of payments statistics broadly follow the concepts and
definitions in the BPM5. While generally adequate and derived from sound collection programs,
source data are incomplete to compile some services in the current account, financial transactions of
the nonfinancial private sector, and remuneration of employees. Foreign direct investment
transactions and positions are valued on a cash basis instead of the recommended accrual basis.
Services are recorded at the time the service is provided. While other income transactions are
recorded on an accrual basis, interest on public external debt is recorded on the due date; no
adjustment is made to convert interest to accrued values. Transfer prices in some cases are not
converted to market prices.
Data Standards and Quality: Costa Rica is in observance with the Special Data Dissemination
Standards (SDDS). Data Module Report on the Observance of Standards and Codes (ROSC) was
published in February 2010.
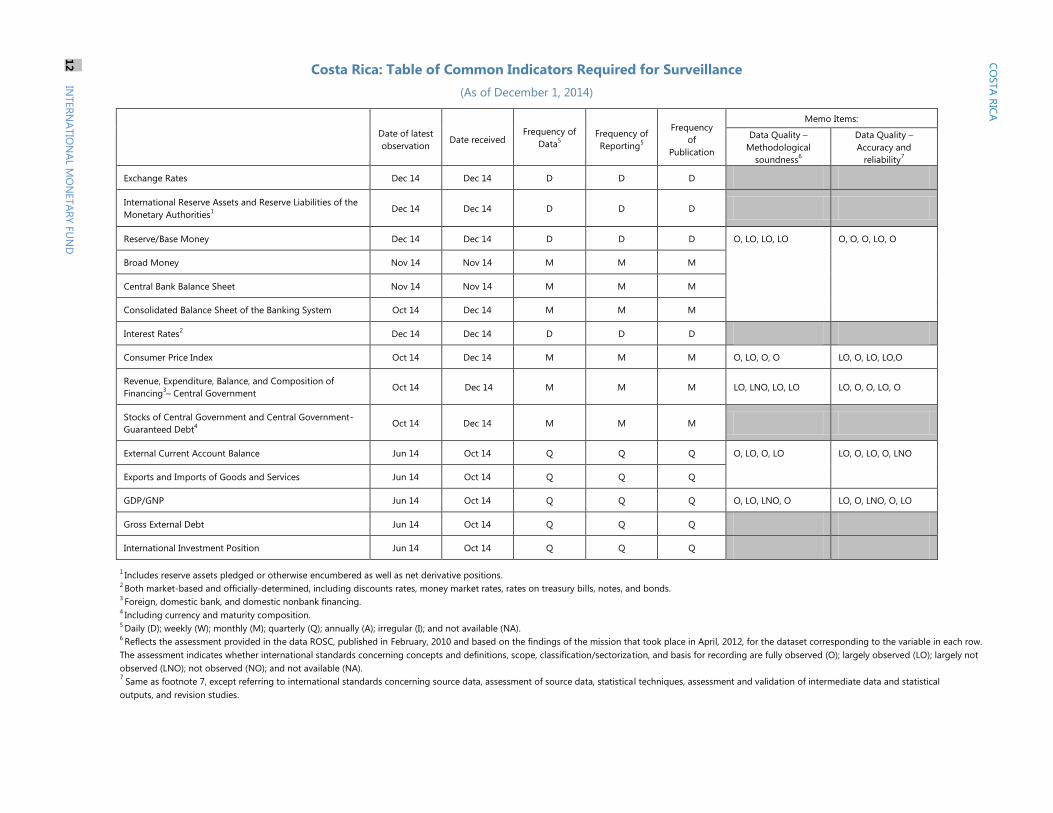
CO
STA
RIC
A
12
INTER
NA
TIO
NA
L M
ON
ETA
RY
FU
ND
Costa Rica: Table of Common Indicators Required for Surveillance
(As of December 1, 2014)
Date of latest
observation Date received
Frequency of
Data5
Frequency of
Reporting5
Frequency
of
Publication
Memo Items:
Data Quality –
Methodological
soundness6
Data Quality –
Accuracy and
reliability7
Exchange Rates Dec 14 Dec 14 D D D
International Reserve Assets and Reserve Liabilities of the
Monetary Authorities1 Dec 14 Dec 14 D D D
Reserve/Base Money Dec 14 Dec 14 D D D O, LO, LO, LO O, O, O, LO, O
Broad Money Nov 14 Nov 14 M M M
Central Bank Balance Sheet Nov 14 Nov 14 M M M
Consolidated Balance Sheet of the Banking System Oct 14 Dec 14 M M M
Interest Rates2
Dec 14 Dec 14 D D D
Consumer Price Index Oct 14 Dec 14 M M M O, LO, O, O LO, O, LO, LO,O
Revenue, Expenditure, Balance, and Composition of
Financing3– Central Government
Oct 14 Dec 14 M M M LO, LNO, LO, LO LO, O, O, LO, O
Stocks of Central Government and Central Government-
Guaranteed Debt4 Oct 14 Dec 14 M M M
External Current Account Balance Jun 14 Oct 14 Q Q Q O, LO, O, LO LO, O, LO, O, LNO
Exports and Imports of Goods and Services Jun 14 Oct 14 Q Q Q
GDP/GNP Jun 14 Oct 14 Q Q Q O, LO, LNO, O LO, O, LNO, O, LO
Gross External Debt
Jun 14 Oct 14 Q Q Q
International Investment Position Jun 14 Oct 14 Q Q Q
1 Includes reserve assets pledged or otherwise encumbered as well as net derivative positions.
2 Both market-based and officially-determined, including discounts rates, money market rates, rates on treasury bills, notes, and bonds.
3 Foreign, domestic bank, and domestic nonbank financing.
4 Including currency and maturity composition.
5 Daily (D); weekly (W); monthly (M); quarterly (Q); annually (A); irregular (I); and not available (NA).
6 Reflects the assessment provided in the data ROSC, published in February, 2010 and based on the findings of the mission that took place in April, 2012, for the dataset corresponding to the variable in each row.
The assessment indicates whether international standards concerning concepts and definitions, scope, classification/sectorization, and basis for recording are fully observed (O); largely observed (LO); largely not
observed (LNO); not observed (NO); and not available (NA). 7
Same as footnote 7, except referring to international standards concerning source data, assessment of source data, statistical techniques, assessment and validation of intermediate data and statistical
outputs, and revision studies.
Statement by the Staff Representative on Costa Rica Executive Board Meeting
January 30, 2014 1. This statement provides additional information that has become available since the staff report was issued. It does not alter the thrust of the staff appraisal.
2. Headline economic indicators remain broadly in line with the baseline scenario in the staff report.
Economic activity slowed down in late 2014, especially in the free trade zone—reflecting faster than expected winding-down of operations at the Intel assembly plant—and in the agriculture sector owing to weather factors. As a result, GDP growth for 2014 as a whole is now estimated at 3.5 percent, marginally lower than the 3.6 percent in the staff report. On the other hand, GDP in 2015 is now projected to expand somewhat faster (3.7 percent) than in the staff report reflecting both lower international oil prices and higher U.S. growth projections.1
End-2014 inflation was lower than projected—5.1 versus 5.6 percent—mainly the effect of lower oil prices. Second round effects from lower oil prices should bring inflation closer to the center of the 3–5 percent target band earlier than expected in the staff report. End-2015 inflation is currently anticipated at 4.4 percent (versus 4.5 percent), with significant potential for further downward revisions
The decline in international reserves over 2014 was lower than anticipated—about US$0.1 bn, versus expected US$0.5 bn—as the central bank stepped up FX purchases in the latter part of the year in response to stronger demand for colones. The exchange rate has remained stable at around 540 colones per dollar. The current account deficit for 2015 is now expected to be significantly lower than in the staff report after recent downward revisions in international oil price projections. However, staff’s assessment that the external position is adequate remains unchanged.
3. The authorities have publicly reiterated their commitment to fiscal adjustment in line with Fund advice. A VAT law aimed at broadening the tax base to include the services sector and at gradually raising the tax rate from 13 to 15 percent has been drafted by the Ministry of Finance and is expected to be submitted to Congress shortly, together with the reform of the income tax law. The minister of finance has also publicly committed to other adjustment measures, including base public salary increases below inflation and cuts in transfers. 1 The WEO oil price forecast has been revised from US$73.4 per barrel to US$56.7 per barrel for 2015.
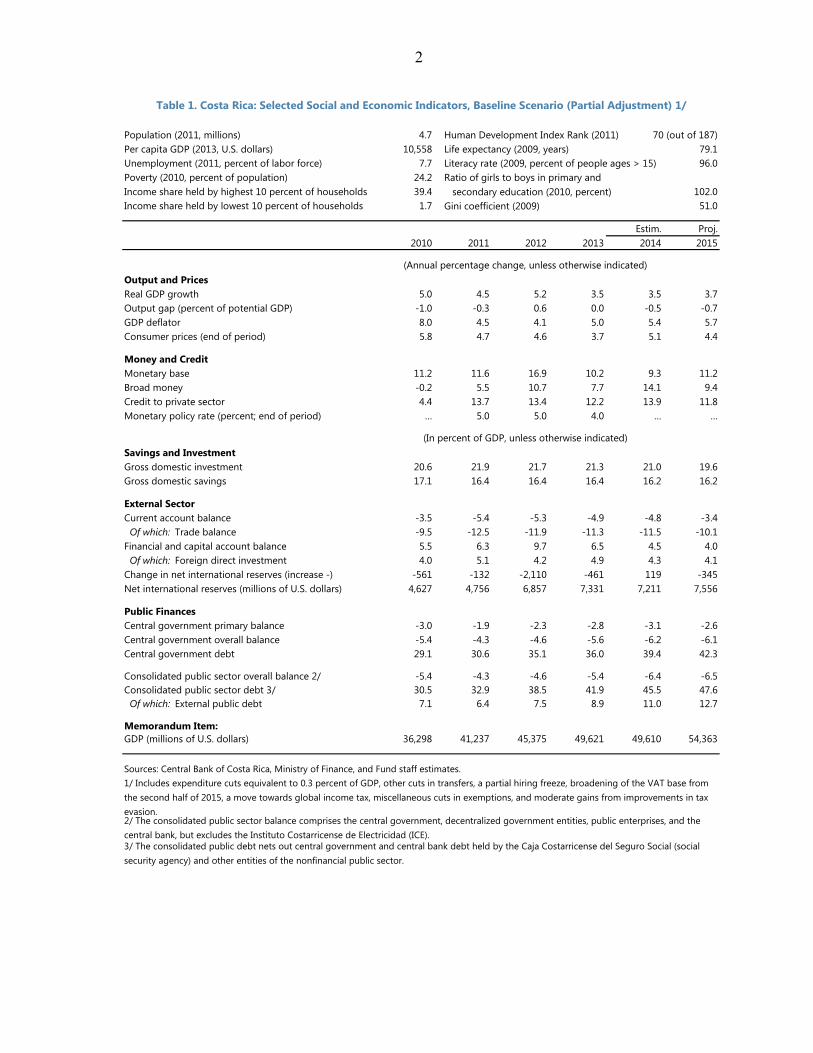
2
Population (2011, millions) 4.7 Human Development Index Rank (2011) 70 (out of 187)Per capita GDP (2013, U.S. dollars) 10,558 Life expectancy (2009, years) 79.1Unemployment (2011, percent of labor force) 7.7 Literacy rate (2009, percent of people ages > 15) 96.0Poverty (2010, percent of population) 24.2 Ratio of girls to boys in primary andIncome share held by highest 10 percent of households 39.4 secondary education (2010, percent) 102.0Income share held by lowest 10 percent of households 1.7 Gini coefficient (2009) 51.0
Estim. Proj.2010 2011 2012 2013 2014 2015
Output and PricesReal GDP growth 5.0 4.5 5.2 3.5 3.5 3.7Output gap (percent of potential GDP) -1.0 -0.3 0.6 0.0 -0.5 -0.7GDP deflator 8.0 4.5 4.1 5.0 5.4 5.7Consumer prices (end of period) 5.8 4.7 4.6 3.7 5.1 4.4
Money and CreditMonetary base 11.2 11.6 16.9 10.2 9.3 11.2Broad money -0.2 5.5 10.7 7.7 14.1 9.4Credit to private sector 4.4 13.7 13.4 12.2 13.9 11.8Monetary policy rate (percent; end of period) … 5.0 5.0 4.0 … …
Savings and InvestmentGross domestic investment 20.6 21.9 21.7 21.3 21.0 19.6Gross domestic savings 17.1 16.4 16.4 16.4 16.2 16.2
External SectorCurrent account balance -3.5 -5.4 -5.3 -4.9 -4.8 -3.4 Of which: Trade balance -9.5 -12.5 -11.9 -11.3 -11.5 -10.1Financial and capital account balance 5.5 6.3 9.7 6.5 4.5 4.0 Of which: Foreign direct investment 4.0 5.1 4.2 4.9 4.3 4.1Change in net international reserves (increase -) -561 -132 -2,110 -461 119 -345Net international reserves (millions of U.S. dollars) 4,627 4,756 6,857 7,331 7,211 7,556
Public FinancesCentral government primary balance -3.0 -1.9 -2.3 -2.8 -3.1 -2.6Central government overall balance -5.4 -4.3 -4.6 -5.6 -6.2 -6.1Central government debt 29.1 30.6 35.1 36.0 39.4 42.3
Consolidated public sector overall balance 2/ -5.4 -4.3 -4.6 -5.4 -6.4 -6.5Consolidated public sector debt 3/ 30.5 32.9 38.5 41.9 45.5 47.6 Of which: External public debt 7.1 6.4 7.5 8.9 11.0 12.7
Memorandum Item:GDP (millions of U.S. dollars) 36,298 41,237 45,375 49,621 49,610 54,363
Sources: Central Bank of Costa Rica, Ministry of Finance, and Fund staff estimates.
3/ The consolidated public debt nets out central government and central bank debt held by the Caja Costarricense del Seguro Social (social security agency) and other entities of the nonfinancial public sector.
(Annual percentage change, unless otherwise indicated)
(In percent of GDP, unless otherwise indicated)
Table 1. Costa Rica: Selected Social and Economic Indicators, Baseline Scenario (Partial Adjustment) 1/
2/ The consolidated public sector balance comprises the central government, decentralized government entities, public enterprises, and the central bank, but excludes the Instituto Costarricense de Electricidad (ICE).
1/ Includes expenditure cuts equivalent to 0.3 percent of GDP, other cuts in transfers, a partial hiring freeze, broadening of the VAT base from the second half of 2015, a move towards global income tax, miscellaneous cuts in exemptions, and moderate gains from improvements in tax evasion.
Press Release No. 15/32 FOR IMMEDIATE RELEASE February 4, 2015
IMF Executive Board Concludes 2014 Article IV Consultation with Costa Rica January 30, the Executive Board of the International Monetary Fund (IMF) concluded the Article IV consultation1 with Costa Rica. Costa Rica bounced back quickly from the 2008–09 global crisis, but growth momentum is now slowing and macro vulnerabilities, mainly from the weak fiscal position, are rising. After falling modestly in 2009, real GDP surged in 2010–12. Since then, however, growth has moderated below potential, with the latter also on a declining trend. The counter-cyclical budgetary stimulus imparted in 2009 pushed the deficit above 5 percent of GDP in 2010 (mainly through a rise in wages and transfers). The deficit has been creeping up further since then, placing the public-debt-to-GDP ratio on an unsustainable upward trajectory, which is fast approaching levels shown to increase risks of disorderly adjustment for emerging economies. A fairly inflexible exchange rate has contributed to vulnerabilities associated with dollarization in the financial sector. The outlook for 2015 and beyond remains subdued amid deteriorating fundamentals. Growth in 2015 is expected to stay virtually unchanged, as the positive influence of U.S. recovery offsets the negative impact of a gradual Intel withdrawal. The output gap is projected to widen through 2016, then mostly closing over the medium term, with growth also converging to potential. The baseline scenario contemplates fiscal consolidation of 2.2percent of GDP over the medium term. In this case, the central government fiscal deficit would stay at about 5.75 percent of GDP, and the public debt ratio would approach 51 percent of GDP by 2019. Thanks to continued prudent monetary policy, inflation is projected to hover around 4 percent after returning within the Central Bank’s announced band in early 2015, while the current account deficit rises to 5.25percent of GDP by 2019. Risks to the outlook are tilted to the downside. Concerning external factors, in the case of faster U.S. monetary policy normalization, slightly upside risks prevail, with a positive impact of
1 Under Article IV of the IMF's Articles of Agreement, the IMF holds bilateral discussions with members, usually every year. A staff team visits the country, collects economic and financial information, and discusses with officials the country's economic developments and policies. On return to headquarters, the staff prepares a report, which forms the basis for discussion by the Executive Board.
International Monetary Fund 700 19th Street, NW Washington, D. C. 20431 USA
2
higher U.S. growth more than offsetting the negative influence of tighter global financial conditions in the short run. However, extreme bouts of market volatility could inflict serious damage, especially given Costa Rica’s weak fiscal position, as interest rates may rise abruptly. On the other hand, further sustained declines in energy prices could have a modest positive effect on Costa Rica. On the domestic side, the persistence of a large fiscal deficit and the ensuing rise in the public debt ratio could render the economy vulnerable to sudden changes in financial market conditions. Executive Board Assessment While commending Costa Rica’s resilience in the aftermath of the global financial crisis, Executive Directors called for reinvigorated efforts to preserve macroeconomic stability in the wake of waning growth and rising unemployment and vulnerabilities. They recommended an ambitious but phased budget consolidation to arrest the deterioration in the fiscal accounts and put the public debt on a sustainable trajectory, along with a strengthening of the monetary policy framework and structural reforms to boost competitiveness and inclusive growth. Directors welcomed the authorities’ intention to implement a total fiscal adjustment of about 4 percent of GDP, with a front-loaded adjustment in 2015 followed by more incremental steps in subsequent years. Noting Costa Rica’s low revenue effort relative to peer countries, they supported the emphasis on boosting revenue mobilization through a mix of administrative and policy reforms—including broadening the tax base, and raising the VAT rate and marginal rates on higher-income brackets. Directors also encouraged efforts to contain the growth of current outlays, particularly the wage bill and transfers, thus creating space for much-needed infrastructure spending. They looked forward to Parliamentary approval of outstanding legislative reforms and encouraged consensus building for a comprehensive package of measures to underpin deficit reduction. Over the longer run, measures are also needed to address the social security actuarial deficit. Directors considered the current monetary policy stance to be appropriate, while calling on the Banco Central de Costa Rica (BCCR) to stand ready to increase its policy rate should inflationary pressure persist. They recommended strengthening the monetary policy framework, including further steps towards inflation targeting and enhanced exchange rate flexibility. In this regard, most Directors supported the elimination of the exchange rate band. Directors also recommended the development of tools to underpin greater exchange rate flexibility, including hedging instruments. Directors encouraged implementation of pending FSAP recommendations, to help strengthen financial sector supervision and resilience. They advised a gradual move towards Basel III standards, and strengthening cross-border supervision. Priority should also be given to empowering the Financial Institutions Superintendence to conduct consolidated and transnational
3
supervision, providing adequate protection to supervisors, and enhancing bank resolution procedures. Directors called for continued progress in structural reforms to boost productivity, enhance external competitiveness, and foster long-run inclusive growth. Efforts are needed to streamline the regulatory environment, increase private sector participation in the energy sector, alleviate infrastructure bottlenecks, and promote capital market development. Directors also recommended ameliorating the efficiency of education spending, with a view to increasing women’s labor force participation, stimulating productivity, and reducing inequality in the long term.
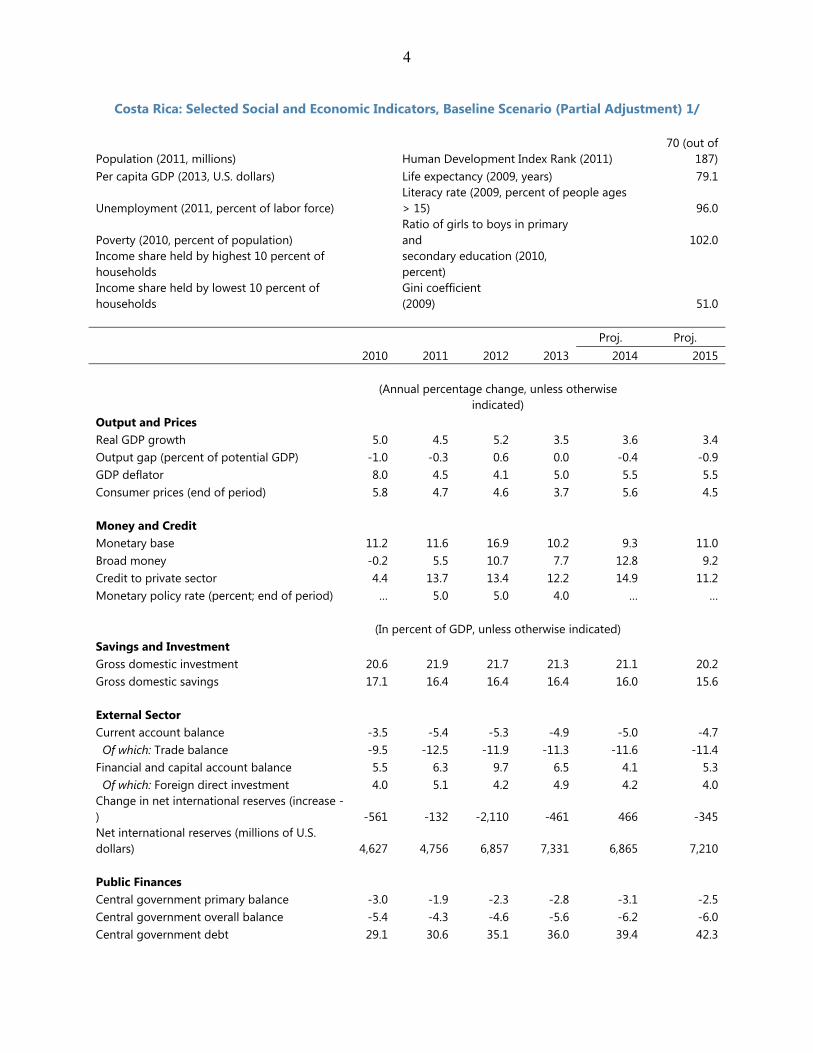
4
Costa Rica: Selected Social and Economic Indicators, Baseline Scenario (Partial Adjustment) 1/
Population (2011, millions) Human Development Index Rank (2011) 70 (out of
187) Per capita GDP (2013, U.S. dollars) Life expectancy (2009, years) 79.1
Unemployment (2011, percent of labor force) Literacy rate (2009, percent of people ages > 15) 96.0
Poverty (2010, percent of population) Ratio of girls to boys in primary and 102.0
Income share held by highest 10 percent of households
secondary education (2010, percent)
Income share held by lowest 10 percent of households
Gini coefficient (2009) 51.0
Proj. Proj. 2010 2011 2012 2013 2014 2015
(Annual percentage change, unless otherwise
indicated)
Output and Prices
Real GDP growth 5.0 4.5 5.2 3.5 3.6 3.4 Output gap (percent of potential GDP) -1.0 -0.3 0.6 0.0 -0.4 -0.9 GDP deflator 8.0 4.5 4.1 5.0 5.5 5.5 Consumer prices (end of period) 5.8 4.7 4.6 3.7 5.6 4.5
Money and Credit
Monetary base 11.2 11.6 16.9 10.2 9.3 11.0 Broad money -0.2 5.5 10.7 7.7 12.8 9.2 Credit to private sector 4.4 13.7 13.4 12.2 14.9 11.2 Monetary policy rate (percent; end of period) … 5.0 5.0 4.0 … …
(In percent of GDP, unless otherwise indicated)
Savings and Investment
Gross domestic investment 20.6 21.9 21.7 21.3 21.1 20.2 Gross domestic savings 17.1 16.4 16.4 16.4 16.0 15.6
External Sector
Current account balance -3.5 -5.4 -5.3 -4.9 -5.0 -4.7 Of which: Trade balance -9.5 -12.5 -11.9 -11.3 -11.6 -11.4 Financial and capital account balance 5.5 6.3 9.7 6.5 4.1 5.3 Of which: Foreign direct investment 4.0 5.1 4.2 4.9 4.2 4.0 Change in net international reserves (increase -) -561 -132 -2,110 -461 466 -345 Net international reserves (millions of U.S. dollars) 4,627 4,756 6,857 7,331 6,865 7,210
Public Finances
Central government primary balance -3.0 -1.9 -2.3 -2.8 -3.1 -2.5 Central government overall balance -5.4 -4.3 -4.6 -5.6 -6.2 -6.0 Central government debt 29.1 30.6 35.1 36.0 39.4 42.3
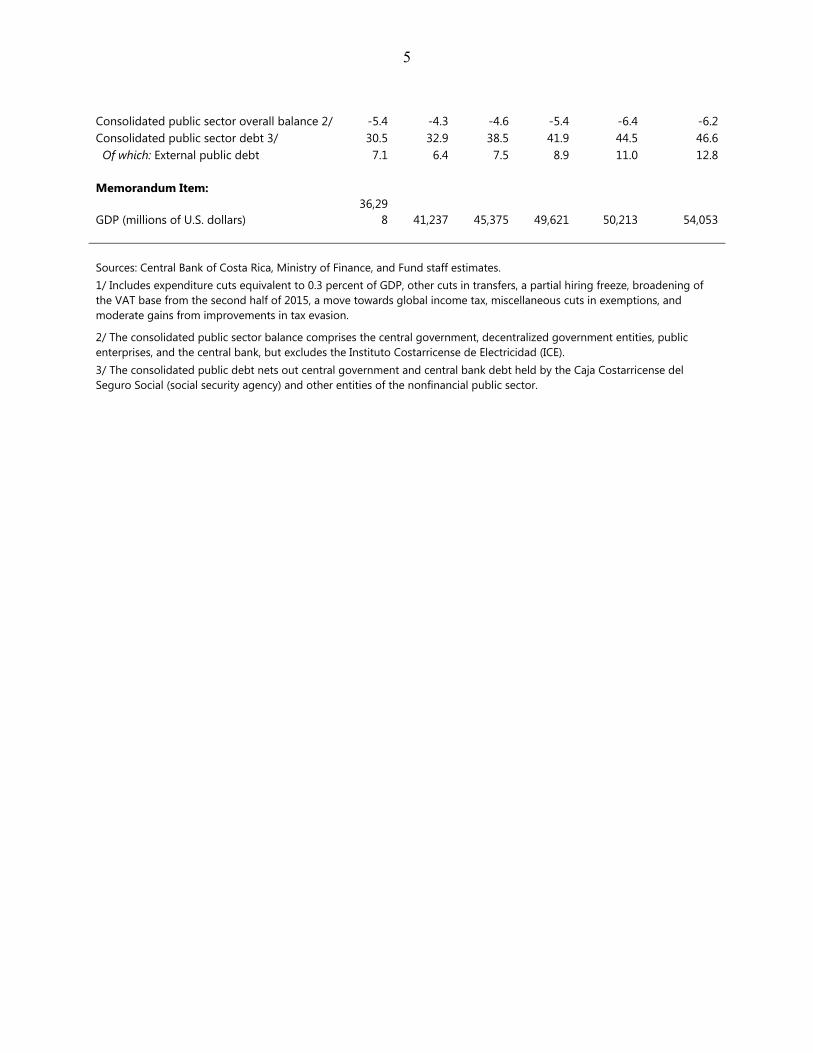
5
Consolidated public sector overall balance 2/ -5.4 -4.3 -4.6 -5.4 -6.4 -6.2 Consolidated public sector debt 3/ 30.5 32.9 38.5 41.9 44.5 46.6 Of which: External public debt 7.1 6.4 7.5 8.9 11.0 12.8 Memorandum Item:
GDP (millions of U.S. dollars) 36,29
8 41,237 45,375 49,621 50,213 54,053 Sources: Central Bank of Costa Rica, Ministry of Finance, and Fund staff estimates.1/ Includes expenditure cuts equivalent to 0.3 percent of GDP, other cuts in transfers, a partial hiring freeze, broadening of the VAT base from the second half of 2015, a move towards global income tax, miscellaneous cuts in exemptions, and moderate gains from improvements in tax evasion.
2/ The consolidated public sector balance comprises the central government, decentralized government entities, public enterprises, and the central bank, but excludes the Instituto Costarricense de Electricidad (ICE). 3/ The consolidated public debt nets out central government and central bank debt held by the Caja Costarricense del Seguro Social (social security agency) and other entities of the nonfinancial public sector.
Statement by Mr. Jimenez Latorre and Mr. Pacheco on Costa Rica Executive Board Meeting
January 27, 2015
The Costa Rican authorities thank staff for a very constructive dialogue during the Article IV consultation and concur with the report´s main findings and recommendations.
A new government took office last May after a second round presidential election, marking a first time win for the Citizens’ Action Party. The government plans to boost economic growth and reduce unemployment by addressing infrastructure bottlenecks, supporting SME, fighting red tape and other reforms. The authorities´ agenda also contemplates reduction of poverty and income inequality, both high for the country’s standards. Since its inception the government has been dealing with a high fiscal deficit and has put in place many measures to tackle it.
Recent Developments
Thanks to the authorities´ efforts the fiscal deficit, previously projected at 6.3 percent of GDP, closed 2014 at 5.6 percent. Upon enactment of a decree to freeze 85 percent of vacancies in July 2014 and other measures, the government has managed to reduce the growth of spending from 14 percent in 2013 to 9.3 percent in 2014. Moreover, as capital spending grew at 16 percent, the burden of the adjustment fell on current spending that grew at 8.71 percent compare with 13.4 percent in 2013.
As stated in the report, authorities and staff concur on the size, pace and composition of the fiscal adjustment. The Finance Minister has presented a 3.8 percent of GDP fiscal consolidation plan that includes reform of current taxes, rates2 and spending measures, as well as a freeze on real salaries.
1 This is the lowest current spending growth rate in 6 years.
2 Gradually from 2016 onwards.
The macroeconomic context is positive. Inflation, at 5.1 percent, closed near its target range even after a considerable depreciation during the first semester. Growth would be only partially affected by the proposed fiscal consolidation and is expected to return to potential in the medium term. Stronger growth in the U.S., Cost Rica’s main trade partner, and prolonged lower oil prices would improve growth prospects.
Despite the closure of Intel manufacturing plant, external accounts are healthy and FDI remains high. Reserves are within IMF adequacy metric.
Fiscal Policy
Revenues
Tax avoidance and tax evasion accounted for 7.75 percent of GDP3 while exemptions account for 6 percent of GDP. Together they exceed the current tax revenue. Since May 2014, the government has put in place a number of administrative initiatives to fight tax evasion and tax avoidance, one of the most relevant being the obligation by every firm to withhold 2 percent of each sale as a corporate income tax presumption4. The electronic invoice is expected to become mandatory this year and will join the set of tools to fight evasion.
These measures are being complemented by two law initiatives already under congress review, the anti-tax evasion law and the anti-smuggling law5. While the former strengthens tax controls and enforces collection, the latter fights smuggling by overhauling the legal framework and increasing sanctions and penalties.
The authorities are aware that all these measures account for a small portion of the needed fiscal consolidation. The broad part of the adjustment is expected to come from the reform to the VAT and income tax. In the current VAT setup, services, the most dynamic sector of the economy, are exempted. The reform will include them into the taxable base exempting basic goods6, education and health services.
In the case of income tax, the government is working to change the current schedular system for a global determination of the tax liability. At the time of the Article IV mission in November, the VAT reform and the income tax reform were to be sent for Congress approval
3 2012 estimations.
4 This measure was initially appealed in the administrative court but it has been recently affirmed.
5 These law initiatives were sent to congress in July and November 2014 respectively.
6 In the case of basic goods the authorities plan to eliminate the exoneration as soon as the subsidy system works. They will subsidize the first 3 deciles.
2
in December 2014 and February 2015, respectively. However, to compensate some of the regressive effects of the VAT reform some members of Congress opted to approve both reforms together. This makes March the new date to present both initiatives.
During the first semester of 2015, the authorities plan to present another exemptions related reform. It will streamline the current setup, incorporate sanctions and regulate the creation of exemptions, for instance by setting an expiration date.
Expenditure and Financing
On the expenditure side, the government cut the 2015 budget in 0.4 percent of GDP and will maintain the partial hiring freeze. Salaries are going to be frozen in real terms. Those are tangible actions that will impact the 2015 expenditure invoice. A number of law initiatives will be also sent to congress during 2015 and will have a permanent effect on the fiscal accounts, such as a cap on pensions paid out of the budget and a strengthening of the system, a cap on high salaries and the public employment law.
While fiscal measures begin to yield, the government will use external financing in order to avoid crowding out domestic market and pressure interest rates. It is expected to place one billion dollars in international markets during 2015 and contingent credit lines with World Bank and IADB for 2016 are being negotiated.
Monetary and Exchange Rate Policy
Inflation ended 2014 close to the target range despite an important depreciation of the Colon during the first semester. The authorities agree with the importance of allowing for more XR flexibility and concur that the elimination of the band could be the next step. However, we would like to provide more details regarding the FX market in Costa Rica and the Central Bank´s (BCCR) rational behind maintaining veiled some aspects of the intervention rule. As the report states, the main objective of the rules is to avoid excessive short-term fluctuations without interfering with the medium-term trends. BCCR intervention is framed into a robust set of regulations approved by the Board of Directors and a special committee7. Daily when market closes BCCR publishes the balance negotiated in the market as well as the amount of the intervention, if any. The intervention trigger, the amounts allowed and other elements were approved by the Board based on technical advice. BCCR´s staff is in charge of the execution with no discretion allowed and under the constant scrutiny of the audit department. The BCCR’s Board of directors has decided to maintain specific intervention criteria private since Costa Rica FX market is small and dominated by few banks, thus disclosure of those specific details would facilitate speculation against small agents. The system works in a very transparent way.
7 The Financial Stability Committee is formed by the central bank´s president, manager and relevant directors.
3
Financial system
The financial system is sound and as the report recognizes “…only a few banks are not yet in full compliance with Basel III standards…” The pending reforms have been delayed by an overwhelming fiscal and trade agenda in congress over the last years. Notwithstanding, the authorities have requested the IMF for TA on conglomerate supervision in order to expedite the reform process.
Structural reforms
We concur competitiveness needs to be improved. The country ranks 51th (third in Latin-American region) in the Global Competitiveness Index 2014-2015. Infrastructure bottlenecks, excessive regulatory environment, ease of doing business and concerns on the efficiency and efficacy of education spending are among the diagnosed problems being addressed by the authorities. The government has secured more than USD 1.5 billion coming from multilateral and bilateral sources to overhaul road infrastructure and a comprehensive strategy has been put into place to launch execution. The environmental agency has just granted final approval to begin the construction of a USD 1 billion mega-port in the Caribbean coast by APM Terminals8.
With regard to electricity tariffs, they are relatively well-positioned against different benchmarks, more so taking into account that 80 percent of the electricity comes from renewable sources.
The recent withdrawal of Intel, more than signaling competitiveness problems in Costa Rica, was the result of changes in the personal computers global market. Due to this fact the company is closing or downsizing microprocessor chip manufacturing lines, also in other markets. But it is not exiting the country; an important division of R&D is going to be upgraded.
Thanks to its well- educated work force, the country continues attracting foreign corporations from the technology and services sectors. In fact, FDI was in line with the authorities’ projection, totaling USD 2.2 billion in 2014. The medical sector, mainly manufacturing technological devices, is booming with 63 firms already operating and new investments in the pipeline. This technology industry is less sensitive to economic downturns than other sectors.
With regard to trade integration, Costa Rica began the process of joining the Pacific Alliance9 on February 10, 2014. This bloc not only will boost trade among members but also may serve
8 APM Terminals is part of the MAERSK Group.
9 The founding members are Chile, Colombia, Peru and Mexico. If counted as a single country this group of
4
as a platform toward the Asia-Pacific region. The authorities are also fully committed with the action plan to become a member of OECD.
nations would be the sixth largest economy in the world
5