Embed Size (px)
Citation preview
Cost Saving Strategies for Engineering: Using Simulation to Make Better Decisions
April 2010
Michelle Boucher
Cost Saving Strategies for Engineering: Using Simulation to Make Better Decisions Page 2
© 2010 Aberdeen Group. Telephone: 617 854 5200
Executive Summary Research Benchmark
Aberdeen’s Research Benchmarks provide an in-depth and comprehensive look into process, procedure, methodologies, and technologies with best practice identification and actionable recommendations
As the economy heads into a recovery, returning to profitability is top of mind for many companies. This is driving them to look for ways to reduce costs. The design decisions engineers make have a significant impact on the final cost of a product. When armed with the right resources, engineers are empowered to make better decisions that enable them to take cost out of products, without sacrificing quality, thus improving profitability for the company. This report offers guidance for successful cost saving strategies during the design process.
Best-in-Class Performance Aberdeen used the following five key performance criteria to distinguish Best-in-Class companies. Best-in-Class companies achieve the following results:
• 86% of products meet product cost targets
• 6% decrease in product cost
• 86% of products launch on time
• 91% of products meet quality targets at design release
• 14.8% increase in profit margins for products less than two years old
Competitive Maturity Assessment When compared to competitors, firms enjoying Best-in-Class performance shared several common characteristics that support product design including:
"The use of simulation has enabled the prediction of uncharacterized design innovation. It has also lowered our product cost and sped up development time."
~ Chun Eng Loke, Component Design Engineer, Intel
Microelectronics
• 71% more likely to use virtual/digital prototypes to evaluate product performance
• 64% more likely to evaluate different materials to optimize product
• 82% more likely to document safety margins/quality guidelines and make them readily available to design engineers
Required Actions In addition to the specific recommendations in Chapter Three of this report, to achieve Best-in-Class performance, companies must:
• Support better engineering decisions by leveraging virtual/digital prototypes while providing engineers with access to company guidelines for acceptable safety margins/quality guidelines
• Provide management with real time visibility into the status of product performance
• Support continuous improvement by tracking failures missed in simulations
www.aberdeen.com Fax: 617 723 7897
Cost Saving Strategies for Engineering: Using Simulation to Make Better Decisions Page 3
© 2010 Aberdeen Group. Telephone: 617 854 5200 www.aberdeen.com Fax: 617 723 7897
Table of Contents Executive Summary....................................................................................................... 2
Best-in-Class Performance..................................................................................... 2 Competitive Maturity Assessment....................................................................... 2 Required Actions...................................................................................................... 2
Chapter One: Benchmarking the Best-in-Class.................................................... 4 The Business Needs for Improving Product Design........................................ 4 The Maturity Class Framework............................................................................ 6 The Best-in-Class PACE Model ............................................................................ 8 Best-in-Class Strategies........................................................................................... 8
Chapter Two: Benchmarking Requirements for Success.................................13 Competitive Assessment......................................................................................13 Capabilities and Enablers ......................................................................................15
Chapter Three: Required Actions .........................................................................20 Laggard Steps to Success......................................................................................20 Industry Average Steps to Success ....................................................................20 Best-in-Class Steps to Success ............................................................................21
Appendix A: Research Methodology.....................................................................22 Appendix B: Related Aberdeen Research............................................................24 Figures Figure 1: Top Business Pressures Driving Product Design Improvements .....4 Figure 2: Top Product Design Challenges ............................................................... 5 Figure 3: Top Objectives for Improving Product Design .................................... 6 Figure 4: Best-in-Class Strategies to Improve Product Design .......................... 9 Figure 5: Best-in-Class Provide Management Visibility.......................................11 Figure 6: Best-in-Class Design Processes ..............................................................15 Figure 7: How the Best-in-Class Manage Knowledge.........................................16 Figure 8: How the Best-in-Class Manage Performance......................................17 Figure 9: Technologies Used by the Best-in-Class ..............................................18 Figure 10: When Simulation Is Used ......................................................................19 Tables Table 1: Top Performers Earn Best-in-Class Status.............................................. 7 Table 2: The Best-in-Class PACE Framework ....................................................... 8 Table 3: Additional Best-in-Class Benefits Leading to Cost Savings ...............10 Table 4: The Competitive Framework...................................................................14 Table 5: The PACE Framework Key ......................................................................23 Table 6: The Competitive Framework Key ..........................................................23 Table 7: The Relationship Between PACE and the Competitive Framework.........................................................................................................................................23

Cost Saving Strategies for Engineering: Using Simulation to Make Better Decisions Page 4
© 2010 Aberdeen Group. Telephone: 617 854 5200
Chapter One: Benchmarking the Best-in-Class
Fast Facts
Best-in-Class companies enjoy:
√ 6% decrease in product cost
√ 7% decrease in warranty costs
√ 4% decrease in ECOs after design release
The current economic climate has forced many companies to re-evaluate what they are doing to improve their ability to be profitable. One of the ways to accomplish that is to look for new ways to take cost out of products. What are the best ways to accomplish this? How can engineers be armed with methods for taking cost out without sacrificing quality? Can simulation help? To answer these questions, Aberdeen studied the experiences of 157 companies in March and April 2010 through a survey and interviews.
The Business Needs for Improving Product Design To understand the external factors driving companies to improve their design processes, survey respondents were asked to pick the top two pressures driving that improvement. The top pressure clearly demonstrates that reducing product cost is currently the most important factor driving improvements in product design (Figure 1).
Figure 1: Top Business Pressures Driving Product Design Improvements
50%
45%
26%
22%
16%
0% 10% 20% 30% 40% 50% 60%
Customer demand for lower cost products
Shortened product development schedules
Competitive pressures to differentiate withbetter quality/reliability
Need for greater innovation for new marketopportunities
Competitive pressures to differentiate withsmarter/feature rich products
Percentage of Respondents (n=157)
All Respondents
Source: Aberdeen Group, April 2010
Much of the final cost of a product is determined by the decisions engineering makes during the design phase. When armed with the right information, engineers can make even better decisions that will boost the overall profitability of the entire product. In an economic climate where all expenditures are closely scrutinized and customers are more price sensitive than ever, it makes sense that the need to lower product cost is now a top pressure driving improvements to the design process. By successfully
www.aberdeen.com Fax: 617 723 7897
Cost Saving Strategies for Engineering: Using Simulation to Make Better Decisions Page 5
© 2010 Aberdeen Group. Telephone: 617 854 5200
addressing this pressure, engineering will have a significant impact on the bottom line of the company.
While taking cost out of the product is the top pressure driving improvements, the need to get products to market as quickly as possible is still an important pressure. This means that engineers must find ways to take cost out of the product without adding a lot of additional time to the overall development process.
Although cost and time are the two primary pressures driving improvements, it is still important that engineering is developing products that meet customer expectations. This means that taking cost out of products can not be done at the expense of quality. While customers may be looking for lower cost products, they still expect them to be of high quality. High quality offers a way for a company to competitively differentiate its products and may even enable the company to realize a price premium on the product that will yield higher margins in ways that a "price war" will not. Greater innovation and smarter, more feature rich products also offer opportunities to provide customers with compelling products that influence buying behavior.
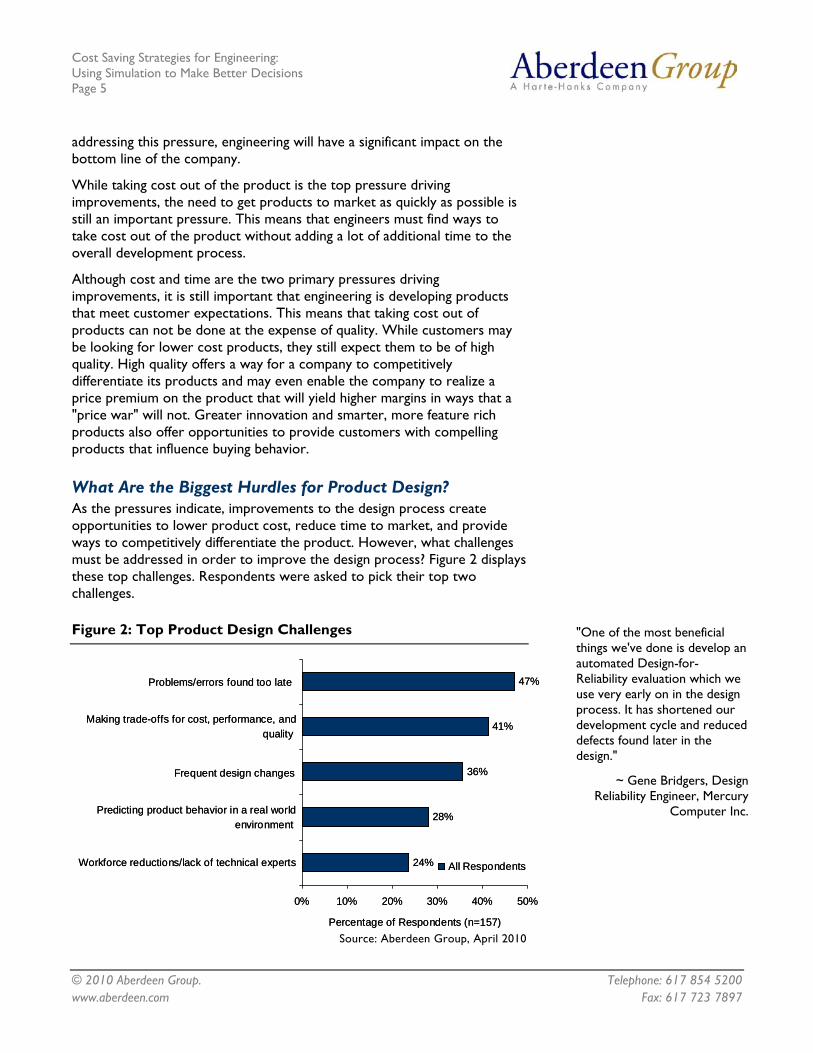
What Are the Biggest Hurdles for Product Design? As the pressures indicate, improvements to the design process create opportunities to lower product cost, reduce time to market, and provide ways to competitively differentiate the product. However, what challenges must be addressed in order to improve the design process? Figure 2 displays these top challenges. Respondents were asked to pick their top two challenges.
"One of the most beneficial things we've done is develop an automated Design-for-Reliability evaluation which we use very early on in the design process. It has shortened our development cycle and reduced defects found later in the design."
~ Gene Bridgers, Design Reliability Engineer, Mercury
Computer Inc.
Figure 2: Top Product Design Challenges
47%
41%
36%
28%
24%
0% 10% 20% 30% 40% 50%
Problems/errors found too late
Making trade-offs for cost, performance, andquality
Frequent design changes
Predicting product behavior in a real worldenvironment
Workforce reductions/lack of technical experts
Percentage of Respondents (n=157)
All Respondents
Source: Aberdeen Group, April 2010
www.aberdeen.com Fax: 617 723 7897
Cost Saving Strategies for Engineering: Using Simulation to Make Better Decisions Page 6
© 2010 Aberdeen Group. Telephone: 617 854 5200
The top challenges reveal the top obstacles to addressing the top pressure to lower product cost. They point to the need for better insight into product behavior. The later a problem is found in the design process, the more expensive it is to address. More of the design has been solidified meaning there are more design constraints to work around. As a result, the solution is what will work best given the constraints, not what is most economical or best for the design and thus, the solution often drives up cost. These problems are a consequence of not being able to accurately predict product behavior and result in more design changes.
"Through the use of simulation, we are able to understand behavior phenomena prior to even building prototypes.
~ Manager, Engineering Services
In order to successfully take cost out of products, engineers must be able to understand the trade-offs for performance and quality. This means that not only do engineers need insight into how the product will behave, but also need to understand the impact of their decisions on design parameters.
Finally, the loss of technical expertise through workforce reductions, retirements, and employee turnover means there are fewer resources to provide expert knowledge. This means engineers need access to other resources and tools that will provide them with the knowledge they need to make the best decisions for the product in terms of profitability, quality, and performance.
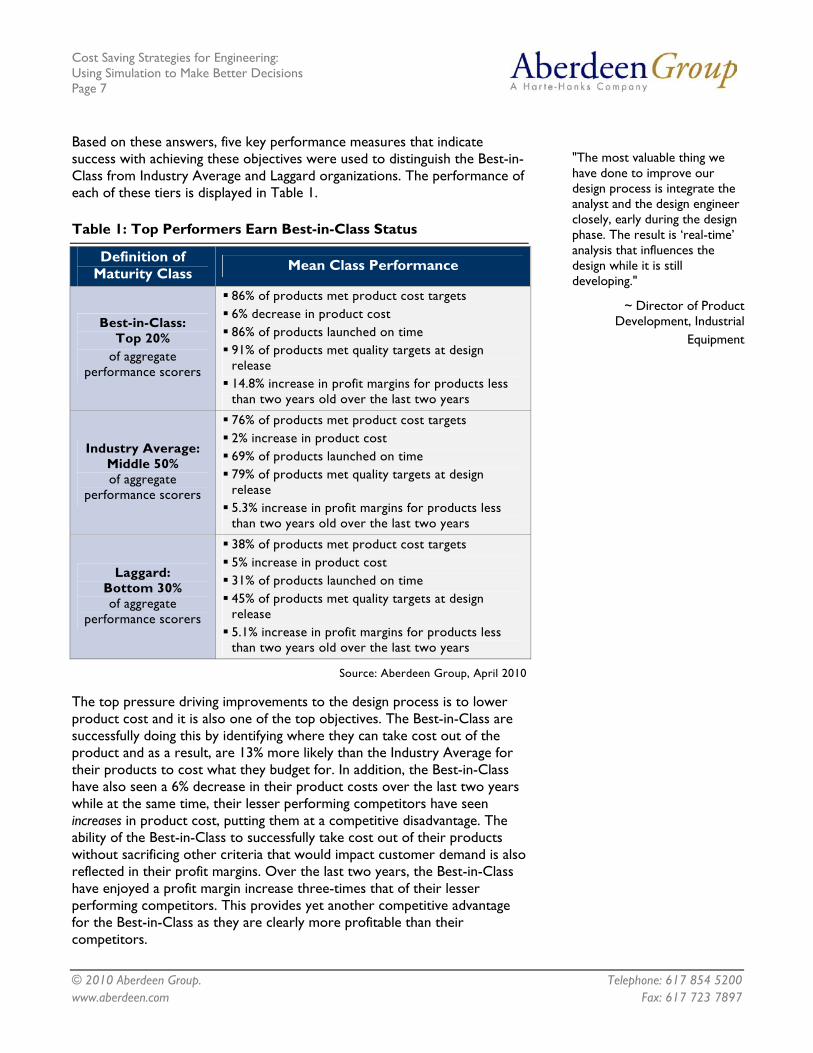
The Maturity Class Framework To understand successful approaches to product design and the business impact it has upon companies, Aberdeen benchmarked the performance of study participants and categorized them as either Best-in-Class (top 20% of performers), Industry Average (mid 50%), or Laggard (bottom 30%). To ensure that organizations are categorized according to the criterion that most accurately represents what organizations are trying to accomplish, Aberdeen first identified the top business objectives for improving product design (Figure 3).
Figure 3: Top Objectives for Improving Product Design
71%65%
57% 54%
0%
20%
40%
60%
80%
Decrease length ofdevelopment time
Improve productquality
Increase profitmargins
Lower product costPer
cent
age
of R
espo
nden
ts (n
=157
)
All Respondents
71%65%
57% 54%
0%
20%
40%
60%
80%
Decrease length ofdevelopment time
Improve productquality
Increase profitmargins
Lower product costPer
cent
age
of R
espo
nden
ts (n
=157
)
All Respondents Source: Aberdeen Group, April 2010
www.aberdeen.com Fax: 617 723 7897
Cost Saving Strategies for Engineering: Using Simulation to Make Better Decisions Page 7
© 2010 Aberdeen Group. Telephone: 617 854 5200
Based on these answers, five key performance measures that indicate success with achieving these objectives were used to distinguish the Best-in-Class from Industry Average and Laggard organizations. The performance of each of these tiers is displayed in Table 1.
"The most valuable thing we have done to improve our design process is integrate the analyst and the design engineer closely, early during the design phase. The result is ‘real-time’ analysis that influences the design while it is still developing."
~ Director of Product Development, Industrial
Equipment
Table 1: Top Performers Earn Best-in-Class Status
Definition of Maturity Class Mean Class Performance
Best-in-Class: Top 20%
of aggregate performance scorers
86% of products met product cost targets 6% decrease in product cost 86% of products launched on time 91% of products met quality targets at design release 14.8% increase in profit margins for products less than two years old over the last two years
Industry Average: Middle 50% of aggregate
performance scorers
76% of products met product cost targets 2% increase in product cost 69% of products launched on time 79% of products met quality targets at design release 5.3% increase in profit margins for products less than two years old over the last two years
Laggard: Bottom 30% of aggregate
performance scorers
38% of products met product cost targets 5% increase in product cost 31% of products launched on time 45% of products met quality targets at design release 5.1% increase in profit margins for products less than two years old over the last two years
Source: Aberdeen Group, April 2010
The top pressure driving improvements to the design process is to lower product cost and it is also one of the top objectives. The Best-in-Class are successfully doing this by identifying where they can take cost out of the product and as a result, are 13% more likely than the Industry Average for their products to cost what they budget for. In addition, the Best-in-Class have also seen a 6% decrease in their product costs over the last two years while at the same time, their lesser performing competitors have seen increases in product cost, putting them at a competitive disadvantage. The ability of the Best-in-Class to successfully take cost out of their products without sacrificing other criteria that would impact customer demand is also reflected in their profit margins. Over the last two years, the Best-in-Class have enjoyed a profit margin increase three-times that of their lesser performing competitors. This provides yet another competitive advantage for the Best-in-Class as they are clearly more profitable than their competitors.
www.aberdeen.com Fax: 617 723 7897
Cost Saving Strategies for Engineering: Using Simulation to Make Better Decisions Page 8
© 2010 Aberdeen Group. Telephone: 617 854 5200 www.aberdeen.com Fax: 617 723 7897
An example of their ability to satisfy multiple conflicting design criteria is their ability to meet their quality objectives. It is not always easy to take cost out of a product without sacrificing quality. However, the Best-in Class have achieved this balance and as a result are two-times more likely than Laggards to meet their quality targets.
Looking for ways to take cost out of a product can add time to the design process, making it difficult to address the second pressure driving improvements to the design process. However, the Best-in-Class have accomplished this better than their peers as they are 26% more likely than the Industry Average to meet their scheduled launch date. This also means they are also addressing top challenges by finding design problems early in the design process when they are less likely to cause delays that put release dates at risk. By launching products on time, the Best-in-Class are better positioned to be first to market allowing them to capture market share and bring in more revenue.
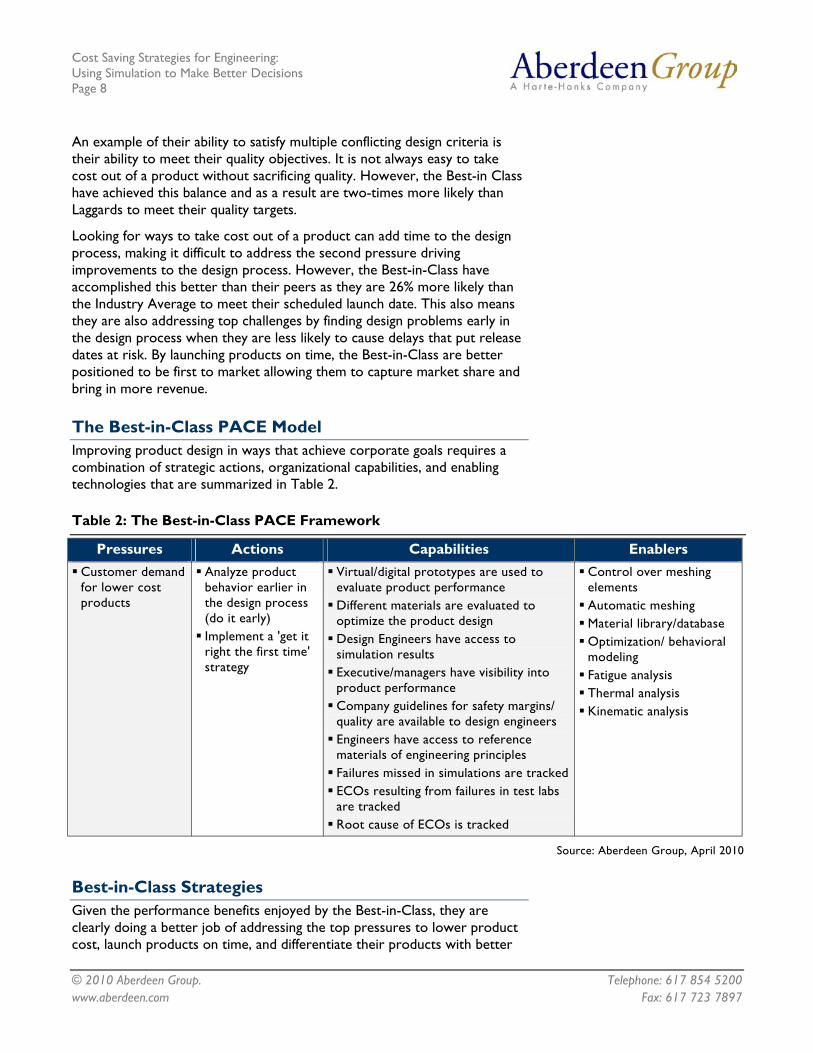
The Best-in-Class PACE Model Improving product design in ways that achieve corporate goals requires a combination of strategic actions, organizational capabilities, and enabling technologies that are summarized in Table 2.
Table 2: The Best-in-Class PACE Framework
Pressures Actions Capabilities Enablers Customer demand for lower cost products
Analyze product behavior earlier in the design process (do it early) Implement a 'get it right the first time' strategy
Virtual/digital prototypes are used to evaluate product performance Different materials are evaluated to optimize the product design Design Engineers have access to simulation results Executive/managers have visibility into product performance Company guidelines for safety margins/ quality are available to design engineers Engineers have access to reference materials of engineering principles Failures missed in simulations are tracked ECOs resulting from failures in test labs are tracked Root cause of ECOs is tracked
Control over meshing elements Automatic meshing Material library/database Optimization/ behavioral modeling Fatigue analysis Thermal analysis Kinematic analysis
Source: Aberdeen Group, April 2010
Best-in-Class Strategies Given the performance benefits enjoyed by the Best-in-Class, they are clearly doing a better job of addressing the top pressures to lower product cost, launch products on time, and differentiate their products with better

Cost Saving Strategies for Engineering: Using Simulation to Make Better Decisions Page 9
© 2010 Aberdeen Group. Telephone: 617 854 5200
quality and more features. They are doing this by getting better insight into product behavior that is allowing them to take cost out of their products, without causing schedule delays or sacrificing quality. The top strategies implemented by the Best-in-Class are shown in Figure 4.
Figure 4: Best-in-Class Strategies to Improve Product Design
70%
67%
52%
52%
49%
42%
56%
39%
38%
43%
36%
34%
25% 50% 75%
Analyze product behavior earlier
Implement a 'get it right the first time' strategy
Promote collaboration between analysis experts/design engineers
Evaluate more design iterations in the concept/design stage
Define best practices for assessing productbehavior
Reduce number of unique parts in product
Percentage of Respondents (n=157)
Best-in-ClassAll Others
70%
67%
52%
52%
49%
42%
56%
39%
38%
43%
36%
34%
25% 50% 75%
Analyze product behavior earlier
Implement a 'get it right the first time' strategy
Promote collaboration between analysis experts/design engineers
Evaluate more design iterations in the concept/design stage
Define best practices for assessing productbehavior
Reduce number of unique parts in product
Percentage of Respondents (n=157)
Best-in-Class
70%
67%
52%
52%
49%
42%
56%
39%
38%
43%
36%
34%
25% 50% 75%
Analyze product behavior earlier
Implement a 'get it right the first time' strategy
Promote collaboration between analysis experts/design engineers
Evaluate more design iterations in the concept/design stage
Define best practices for assessing productbehavior
Reduce number of unique parts in product
Percentage of Respondents (n=157)
Best-in-ClassAll Others
Source: Aberdeen Group, April 2010
The most differentiating strategies deployed by the Best-in-Class take cost out of their products and fall into the following three categories:
• Embed performance assessment in the design process, starting as early as possible "The thing that has improved
our design process the most has been to let product designers play with the simulation models by themselves. It is more motivating for them and results in more creativity."
~ Engineering Laboratory Manager, Telecommunications
Company
• Promote collaboration and the sharing of knowledge to assess product behavior
• Evaluate design alternatives to arrive at the most cost effective, best performing design
The Best-in-Class are 70% more likely to implement a "get it right the first time" strategy, as well as analyze product behavior earlier in the design process. This means they are looking at ways to understand product behavior as early as possible and throughout the design process. With this insight, they can make better decisions about the design that will keep cost down while still ensuring that product performance is met. In addition, the design is higher quality which means lower warranty costs. Because they are catching problems earlier in the process, they also avoid late engineering change orders. Problems caught at the end of the design cost significantly more to address. Late change orders mean additional cost from: avoid
• Scrap, rework, and additional material and production costs
www.aberdeen.com Fax: 617 723 7897

Cost Saving Strategies for Engineering: Using Simulation to Make Better Decisions Page 10
© 2010 Aberdeen Group. Telephone: 617 854 5200
• Added development cost because engineers must stop what they are doing on new designs to find a solution
• Higher product cost because the design is more constrained which limits the number of available solutions as results in a more costly fix
Finally, because they are evaluating performance throughout the design process, they need fewer physical prototypes which also saves cost. Physical prototypes add scrap plus take time to produce, further driving up cost.
The advantages the Best-in-Class enjoy as a result of these cost savings strategies are shown in Table 3.
Table 3: Additional Best-in-Class Benefits Leading to Cost Savings
Performance Change over Last 2 Years
Best-in-Class
Industry Average Laggards
Change in Development Cost 3% Decrease 7% Increase 11% Increase
Change in Warranty Costs 7% Decrease 1% Decrease 6% Increase
Change in Number of Physical Prototypes 3% Decrease No Change 7% Increase
Change in Number of Change Orders after Design Release 4% Decrease 3% Increase 6% Increase
Source: Aberdeen Group, April 2010
Another cost saving strategy is to make sure the product development team can leverage the existing knowledge of experts to enable them to make better design decisions. The Best-in-Class accomplish this by promoting collaboration between design engineers and analysis experts as well as capturing and documenting best practices. This provides design engineers with guidance for methods to safely cut product cost without sacrificing quality. It also provides the support to make sure analyses are conducted correctly which leads to greater confidence in the results and leads to fewer physical prototypes.
"The most helpful thing we have done is pull in experts early in the process so that we get the basic model set up correctly. Then the design engineers work on the iterations. This has reduced errors in set up and lowered the overall cost. It also trains the design engineers so they learn more from the experts."
~ Director of Operations, Industrial Equipment Company
Finally, the last cost saving tip is to evaluate design alternatives to arrive at a lower cost solution. The Best-in-Class accomplish this by looking at different alternatives throughout the entire design process from concept design all the way until the design is complete. One way to accomplish this is to reduce the number of unique parts in the product. For example, five individual parts could be combined into one molded part. This means fewer part numbers to manage, fewer parts to produce, fewer parts in inventory, and fewer parts to assemble. These elements all lead to greater cost savings. When this strategy is combined with an analysis to confirm that one part will perform at the same quality levels when five parts were used, it is a very powerful cost reducing strategy.
www.aberdeen.com Fax: 617 723 7897
Cost Saving Strategies for Engineering: Using Simulation to Make Better Decisions Page 11
© 2010 Aberdeen Group. Telephone: 617 854 5200
Aberdeen Insights — Strategy
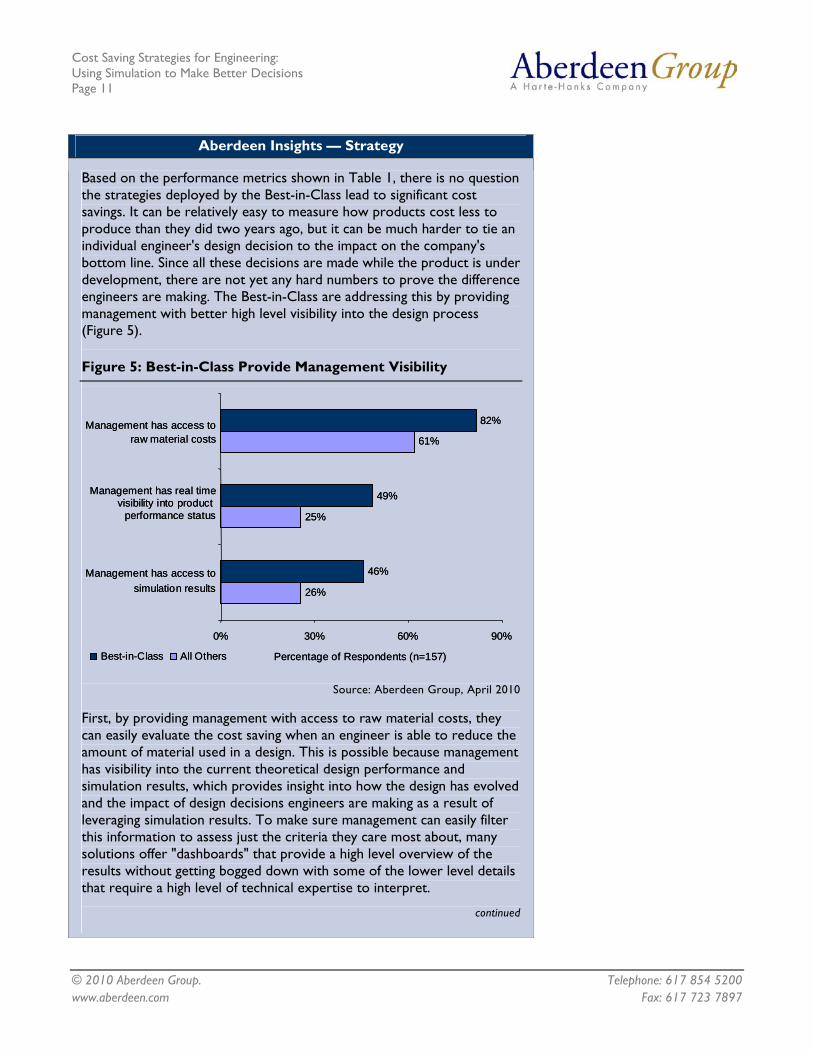
Based on the performance metrics shown in Table 1, there is no question the strategies deployed by the Best-in-Class lead to significant cost savings. It can be relatively easy to measure how products cost less to produce than they did two years ago, but it can be much harder to tie an individual engineer's design decision to the impact on the company's bottom line. Since all these decisions are made while the product is under development, there are not yet any hard numbers to prove the difference engineers are making. The Best-in-Class are addressing this by providing management with better high level visibility into the design process (Figure 5).
Figure 5: Best-in-Class Provide Management Visibility
82%
49%
46%
61%
25%
26%
0% 30% 60% 90%
Management has access toraw material costs
Management has real timevisibility into product
performance status
Management has access tosimulation results
Percentage of Respondents (n=157)Best-in-Class
www.aberdeen.com Fax: 617 723 7897
All Others
82%
49%
46%
61%
25%
26%
0% 30% 60% 90%
Management has access toraw material costs
Management has real timevisibility into product
performance status
Management has access tosimulation results
Percentage of Respondents (n=157)Best-in-Class All Others
Source: Aberdeen Group, April 2010
First, by providing management with access to raw material costs, they can easily evaluate the cost saving when an engineer is able to reduce the amount of material used in a design. This is possible because management has visibility into the current theoretical design performance and simulation results, which provides insight into how the design has evolved and the impact of design decisions engineers are making as a result of leveraging simulation results. To make sure management can easily filter this information to assess just the criteria they care most about, many solutions offer "dashboards" that provide a high level overview of the results without getting bogged down with some of the lower level details that require a high level of technical expertise to interpret.
continued
Cost Saving Strategies for Engineering: Using Simulation to Make Better Decisions Page 12
© 2010 Aberdeen Group. Telephone: 617 854 5200 www.aberdeen.com Fax: 617 723 7897
Aberdeen Insights — Strategy
Visibility into product performance also enables management to provide oversight into making sure quality and safety guidelines are met so as to avoid late change orders and increases in warranty costs.
The end result of this is that management has better visibility into the impact the engineering department is making on the bottom line for the company. With hard numbers to support the difference engineers are making, the manager is better positioned to win support from upper management to support new strategies that will further improve the design process.
In the next chapter, we will see what the top performers are doing to achieve their success.

Cost Saving Strategies for Engineering: Using Simulation to Make Better Decisions Page 13
© 2010 Aberdeen Group. Telephone: 617 854 5200
Chapter Two: Benchmarking Requirements for Success
Fast Facts
Compared to all competitors, the Best-in-Class are:
√ 71% more likely to use virtual/digital prototypes to evaluate product performance
√ 64% more likely to evaluate different materials to optimize product
√ 82% more likely to document safety margins/quality guidelines and make them readily available to design engineers
Chapter One demonstrated the pressures driving product design improvement. It also described the business opportunities offered by successful execution of strategies to improve product design. Chapter Two explores the capabilities and enabling technologies the Best-in-Class use to execute those strategies, allowing them to enjoy a competitive advantage.
Case Study — Simulation Makes it Possible
For one manufacturer, simulation is credited with making it possible to release a major new product line. This manufacturer builds complex food processing equipment. The equipment is so costly to produce that only one physical prototype is feasible. The team was tasked with developing this new product line, but had to get it right the first time. They knew that simulation was going to be key to making this project a success and they integrated it with the design process starting early at the conceptual stage.
The equipment consisted of many different subsystems, each with different physical phenomena and design requirements that had to be considered. To address this complexity, the team developed one full virtual model which interacted with 15 different sub models. This enabled them to focus on different functions such as filling or sterilization. As the design evolved, there were many different aspects of design criteria that needed to be balanced such as cost, performance, manufacturability, and serviceability. The team was able to leverage simulation for trade off analyses that enabled them to come up with the optimal solutions for the product.
While the project was going very well, they noticed that communication between the many designers and analysts was a bit of a challenge. To address this, the analyst team created specifications for the models that defined which parameters were critical. Then for a given design change, the design engineers could easily identify if a critical parameter was affected. If so, a revalidation of the model was required and a new simulation was conducted. This process greatly reduced the number of physical tests that had to be performed for revalidation, thus saving time.
The end result? Comments one of the technology specialists on the team, “The project has been extremely successful and it just wouldn’t have been possible to do without simulation.”
Competitive Assessment Aberdeen Group analyzed the aggregated metrics of surveyed companies to determine whether their performance ranked as Best-in-Class, Industry Average, or Laggard. In addition to having common performance levels, each class also shared characteristics in five key categories: (1) process (the
www.aberdeen.com Fax: 617 723 7897
Cost Saving Strategies for Engineering: Using Simulation to Make Better Decisions Page 14
© 2010 Aberdeen Group. Telephone: 617 854 5200 www.aberdeen.com Fax: 617 723 7897
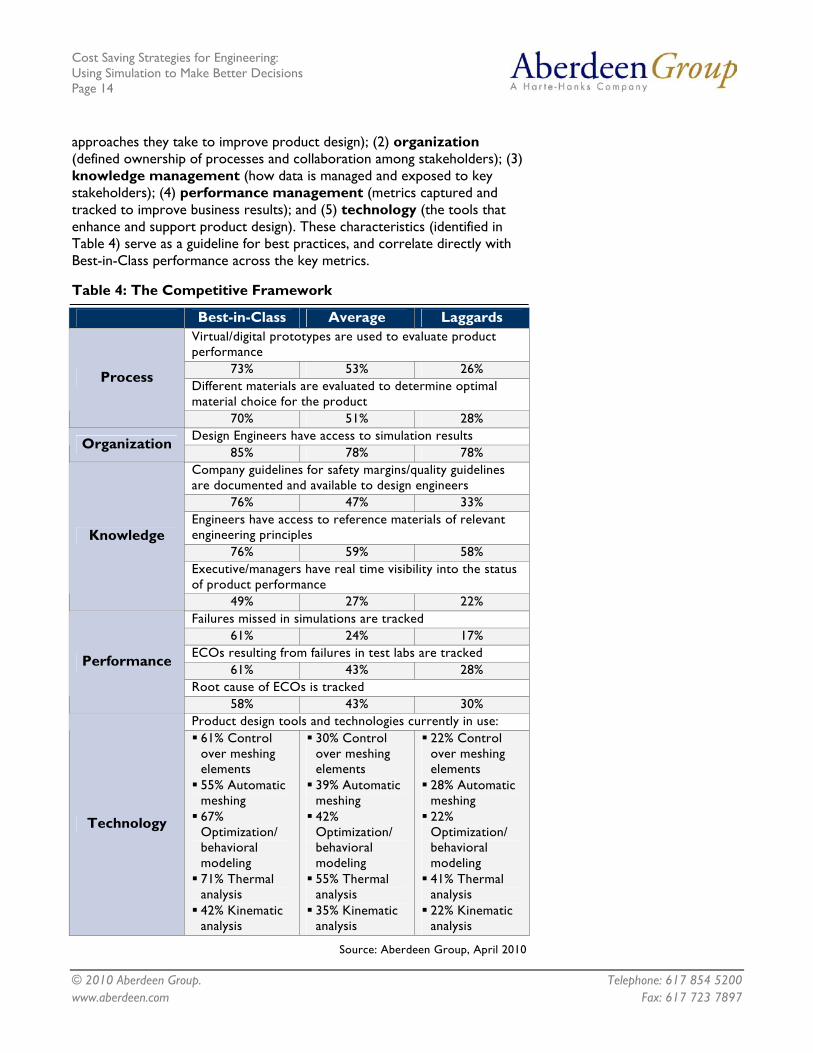
approaches they take to improve product design); (2) organization (defined ownership of processes and collaboration among stakeholders); (3) knowledge management (how data is managed and exposed to key stakeholders); (4) performance management (metrics captured and tracked to improve business results); and (5) technology (the tools that enhance and support product design). These characteristics (identified in Table 4) serve as a guideline for best practices, and correlate directly with Best-in-Class performance across the key metrics.
Table 4: The Competitive Framework
Best-in-Class Average Laggards Virtual/digital prototypes are used to evaluate product performance
73% 53% 26% Different materials are evaluated to determine optimal material choice for the product
Process
70% 51% 28% Design Engineers have access to simulation results Organization
85% 78% 78% Company guidelines for safety margins/quality guidelines are documented and available to design engineers
76% 47% 33% Engineers have access to reference materials of relevant engineering principles
76% 59% 58% Executive/managers have real time visibility into the status of product performance
Knowledge
49% 27% 22% Failures missed in simulations are tracked
61% 24% 17% ECOs resulting from failures in test labs are tracked
61% 43% 28% Root cause of ECOs is tracked
Performance
58% 43% 30% Product design tools and technologies currently in use:
Technology
61% Control over meshing elements 55% Automatic meshing 67% Optimization/ behavioral modeling 71% Thermal analysis 42% Kinematic analysis
30% Control over meshing elements 39% Automatic meshing 42% Optimization/ behavioral modeling 55% Thermal analysis 35% Kinematic analysis
22% Control over meshing elements 28% Automatic meshing 22% Optimization/ behavioral modeling 41% Thermal analysis 22% Kinematic analysis
Source: Aberdeen Group, April 2010
Cost Saving Strategies for Engineering: Using Simulation to Make Better Decisions Page 15
© 2010 Aberdeen Group. Telephone: 617 854 5200
Capabilities and Enablers "Simulation has enabled us to do a better job of determining the ‘weak links’ of our designs so we can focus our resources better. It also helps to manage risks of alternative designs."
~ Design Engineer, A&D Company
Based on the strategies deployed to support product design, the findings of the Competitive Framework and interviews with end users, Aberdeen’s analysis of the Best-in-Class reveals where companies must focus to optimize their product design process in ways that will lower product cost while still releasing products on time and without sacrificing quality. Processes, organizational responsibility, knowledge management, performance management, and technology all play a role in supporting this.
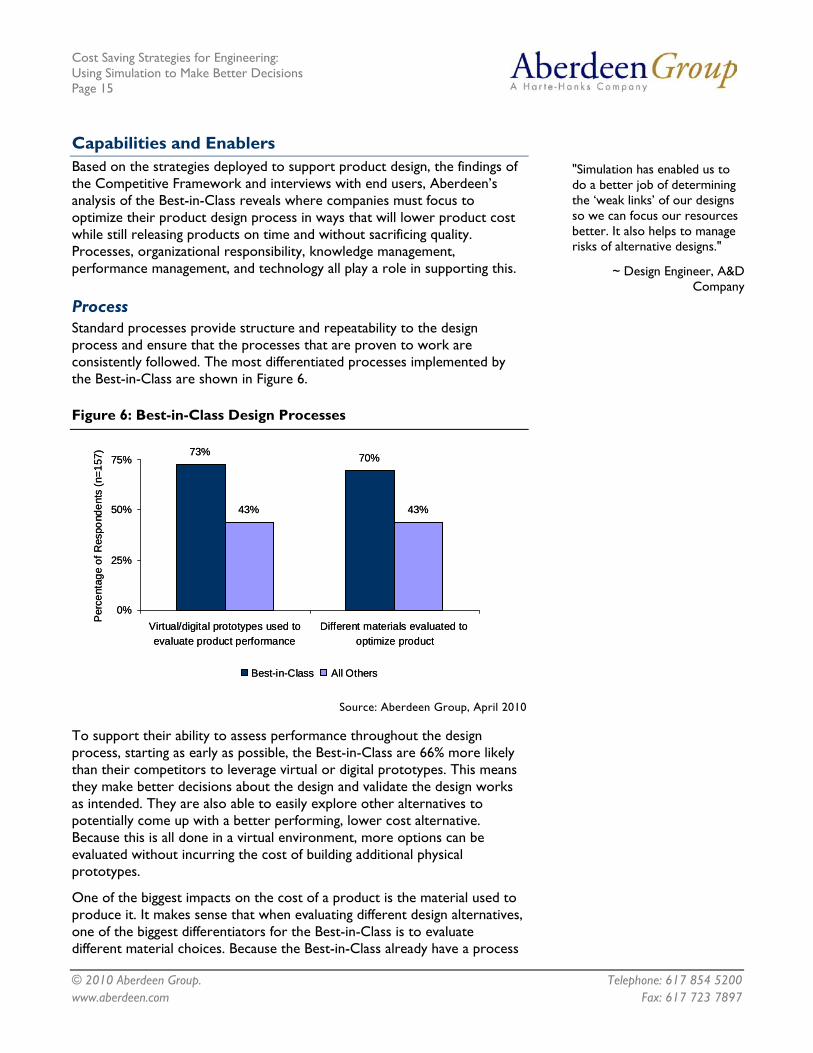
Process Standard processes provide structure and repeatability to the design process and ensure that the processes that are proven to work are consistently followed. The most differentiated processes implemented by the Best-in-Class are shown in Figure 6.
Figure 6: Best-in-Class Design Processes
73% 70%
43% 43%
0%
25%
50%
75%
Virtual/digital prototypes used toevaluate product performance
Different materials evaluated tooptimize product
Per
cent
age
of R
espo
nden
ts (n
=157
)
Best-in-Class All Others
73% 70%
43% 43%
0%
25%
50%
75%
Virtual/digital prototypes used toevaluate product performance
Different materials evaluated tooptimize product
Per
cent
age
of R
espo
nden
ts (n
=157
)
Best-in-Class All Others
Source: Aberdeen Group, April 2010
To support their ability to assess performance throughout the design process, starting as early as possible, the Best-in-Class are 66% more likely than their competitors to leverage virtual or digital prototypes. This means they make better decisions about the design and validate the design works as intended. They are also able to easily explore other alternatives to potentially come up with a better performing, lower cost alternative. Because this is all done in a virtual environment, more options can be evaluated without incurring the cost of building additional physical prototypes.
One of the biggest impacts on the cost of a product is the material used to produce it. It makes sense that when evaluating different design alternatives, one of the biggest differentiators for the Best-in-Class is to evaluate different material choices. Because the Best-in-Class already have a process
www.aberdeen.com Fax: 617 723 7897

Cost Saving Strategies for Engineering: Using Simulation to Make Better Decisions Page 16
© 2010 Aberdeen Group. Telephone: 617 854 5200
in place to use virtual prototypes, it is very easy for them to evaluate different, lower cost materials while assessing product behavior to verify performance, quality, and safety criteria are still met.
Organization "Broader use of simulation at earlier stages of the plant design cycle and across component and modular design levels has reduced rework and delays that used to be experienced near the end of the full plant design and simulation."
~ Manager, Automotive Company
To support their ability to leverage simulation results throughout the design process, the Best-in-Class ensure design engineers have access to the results. This includes simulations other design engineers have performed as well as simulations conducted by analyst experts. This makes is possible to leverage the knowledge of others and enables design engineers to make well informed design decisions as the design evolves.
Knowledge Management While having the organization structure in place to support processes is important, it is also necessary to have the capabilities in place to capture, manage, and share the knowledge available within the organization (Figure 7).
Figure 7: How the Best-in-Class Manage Knowledge
76% 76%
49%42%
58%
25%
0%
20%
40%
60%
80%
Safety margins/qualityguidelines are
documented andavailable to design
engineers
Engineers haveaccess to referencematerials of relevant
engineering principles
Management hasvisibility into productperformance statusPe
rcen
tage
of R
espo
nden
ts (n
=157
)
Best-in-Class All Others Source: Aberdeen Group, April 2010
While taking cost out of products is important to the bottom line for the company, it can not be done at the expense of product safety or quality. To address this, the Best-in-Class are 82% more likely than their competitors to not only document safety margins and quality guidelines, but often also make them available to design engineers. This provides an easy reference to design engineers as they evaluate design alternatives so that they can be making the best decisions for the product and the company.
To support design engineers who are regularly evaluating performance with virtual prototypes, the Best-in-Class are 30% more likely than their competitors to support engineers with access to reference materials of
www.aberdeen.com Fax: 617 723 7897
Cost Saving Strategies for Engineering: Using Simulation to Make Better Decisions Page 17
© 2010 Aberdeen Group. Telephone: 617 854 5200
relevant engineering principles. This further empowers design engineers to take advantage of accurate digital prototypes during the design process.
The Best-in-Class are 94% more likely than their competitors to provide management with visibility into the performance status of the product. This provides a level of oversight to ensure high level corporate goals are achieved such as cost objectives, quality guidelines, safety criteria, and customer requirements.
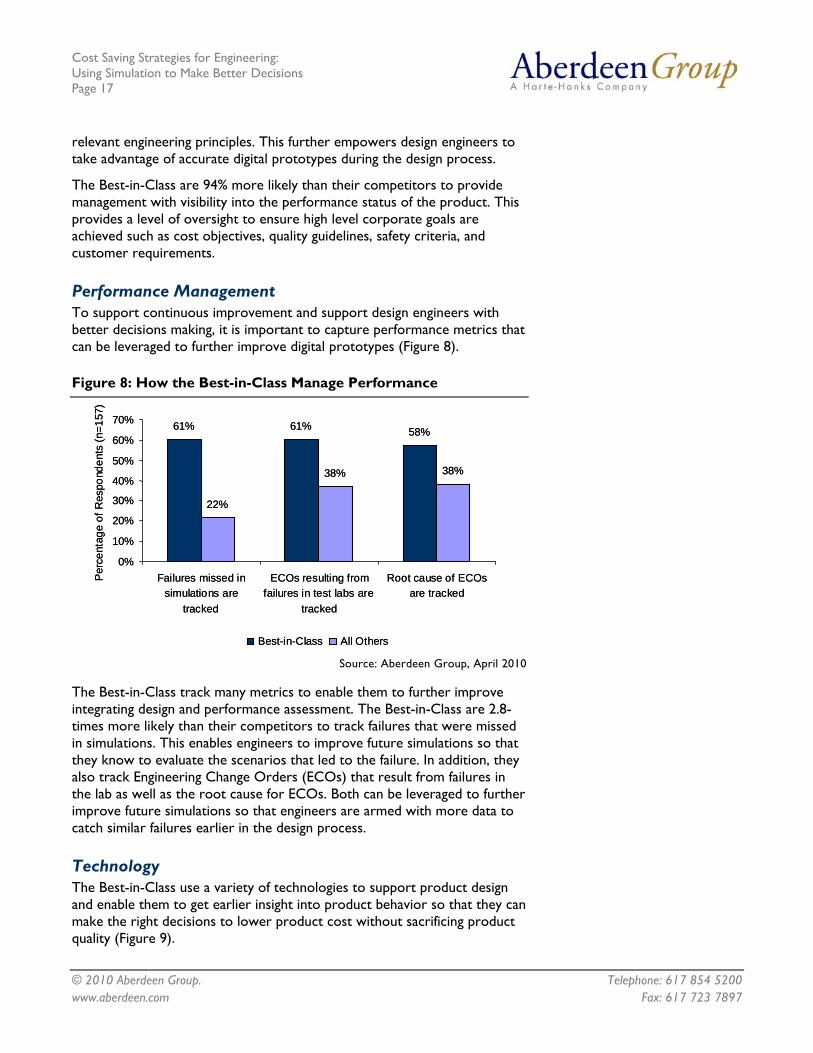
Performance Management To support continuous improvement and support design engineers with better decisions making, it is important to capture performance metrics that can be leveraged to further improve digital prototypes (Figure 8).
Figure 8: How the Best-in-Class Manage Performance
61% 61% 58%
22%
38% 38%
0%
10%
20%
30%
40%
50%
60%
70%
Failures missed insimulations are
tracked
ECOs resulting fromfailures in test labs are
tracked
Root cause of ECOsare tracked
Per
cent
age
of R
espo
nden
ts (n
=157
)
Best-in-Class All Others
61% 61% 58%
22%
38% 38%
0%
10%
20%
30%
40%
50%
60%
70%
Failures missed insimulations are
tracked
ECOs resulting fromfailures in test labs are
tracked
Root cause of ECOsare tracked
Per
cent
age
of R
espo
nden
ts (n
=157
)
Best-in-Class All Others Source: Aberdeen Group, April 2010
The Best-in-Class track many metrics to enable them to further improve integrating design and performance assessment. The Best-in-Class are 2.8-times more likely than their competitors to track failures that were missed in simulations. This enables engineers to improve future simulations so that they know to evaluate the scenarios that led to the failure. In addition, they also track Engineering Change Orders (ECOs) that result from failures in the lab as well as the root cause for ECOs. Both can be leveraged to further improve future simulations so that engineers are armed with more data to catch similar failures earlier in the design process.
Technology The Best-in-Class use a variety of technologies to support product design and enable them to get earlier insight into product behavior so that they can make the right decisions to lower product cost without sacrificing product quality (Figure 9).
www.aberdeen.com Fax: 617 723 7897

Cost Saving Strategies for Engineering: Using Simulation to Make Better Decisions Page 18
© 2010 Aberdeen Group. Telephone: 617 854 5200
Figure 9: Technologies Used by the Best-in-Class
71%
67%
67%
61%
61%
55%
42%
50%
46%
35%
45%
27%
35%
31%
0% 20% 40% 60% 80%
Thermal Analysis
Fatigue Analysis
Optimization/behavioral modeling
Material properties library/database
Control over meshing elements forsimulation
Automatic meshing for simulations
Kinematic Analysis
Percentage of Respondents (n=157)Best-in-Class All Others
Source: Aberdeen Group, April 2010
The technologies used by the Best-in-Class fall into two categories. One is the type of analyses they use. The other is the technology they use to support those analyses.
"Structural analysis simulation tools improve our ability to optimize component design with fewer physical prototype test iterations."
~ Design Engineer, Consumer and Metal Products
The Best-in-Class run many different types of analyses. The multiple types and combinations of analyses they conduct bring the product closer to a real world environment. Three of the most differentiated analyses are Thermal, Fatigue, and Kinematic. Another type of analysis that the Best-in-Class are 88% more likely than their competitors to conduct is an optimization or behavioral modeling analysis. This type of analysis enables the user to enter different, perhaps conflicting, design parameters, such as weight and strength, and then let the computer come up with the optimal solution that will best satisfy the design constraints.
To enable engineers to evaluate different materials, the Best-in-Class are 35% more likely than their competitors to leverage a materials library or database. These libraries already have all the material properties defined so that the engineer can simply swap out materials to understand the impact of different materials on product performance. Other supporting technologies support ease of use with meshing technology. In order to conduct an analysis, the part must first be meshed or broken down into smaller "elements" to simplify the calculations required to conduct the analysis. Many simulation tools provide automatic meshing that reduces the amount of time needed to prepare a model for analysis. While the automatic mesh created by the software is appropriate for most simulations, some more experienced users may want more control over how the model is meshed. For example, they may want to tweak some areas to create larger mesh
www.aberdeen.com Fax: 617 723 7897

Cost Saving Strategies for Engineering: Using Simulation to Make Better Decisions Page 19
© 2010 Aberdeen Group. Telephone: 617 854 5200
elements in less critical areas so that it will take less time to process and therefore accelerate the time required for the analysis.
Aberdeen Insights — Technology
Simulation tools and technologies are extremely powerful and can provide great benefit to a company, enabling engineers to make better design decisions. However, just having a tool will not necessarily improve the process or the design. The trick is in when and how the technology is used (Figure 10).
Figure 10: When Simulation Is Used
"Simulation gives us an idea of where our current design stands using a baseline simulation. That gives us a very good idea of where to start. Multiple iterations during the design keep us where we want to be and give us a very good idea of expected performance before the physical models are built. Correlating test data with simulation results also lets us know how close we can expect to be in the future."
~ Design Engineer, Oil and Gas Equipment
28%
48%
49%
16%
0% 25% 50%
Occasionally, 1-3 times duringthe design process
Systematically, regular intervalsthroughout design process
Percentage of Respondents (n=157)Best-in-Class
www.aberdeen.com Fax: 617 723 7897
All Others
28%
48%
49%
16%
0% 25% 50%
Occasionally, 1-3 times duringthe design process
Systematically, regular intervalsthroughout design process
Percentage of Respondents (n=157)Best-in-Class All Others
Source: Aberdeen Group, April 2010
The Best-in-Class are 3.1 times more likely to take a systematic approach to simulation. They use it regularly throughout the design process from concept through design and leverage it to support critical design decisions. On the other hand, while their less successful competitors are likely to use simulation, they are far more likely to use it on occasion and thus are missing out on the full benefit.
Because the Best-in-Class integrate the use simulation throughout the entire design process, they get more out of it. Engineers are able to make better informed decisions on an ongoing basis throughout the design process which leads to fewer engineering change orders later on in addition to lower cost, higher quality products.
Cost Saving Strategies for Engineering: Using Simulation to Make Better Decisions Page 20
© 2010 Aberdeen Group. Telephone: 617 854 5200
Chapter Three: Required Actions
Fast Facts
√ Embed performance assessment in the design process, starting as early as possible
√ Promote collaboration and the sharing of knowledge to assess product behavior
√ Evaluate design alternatives to arrive at the most cost effective, best performing design
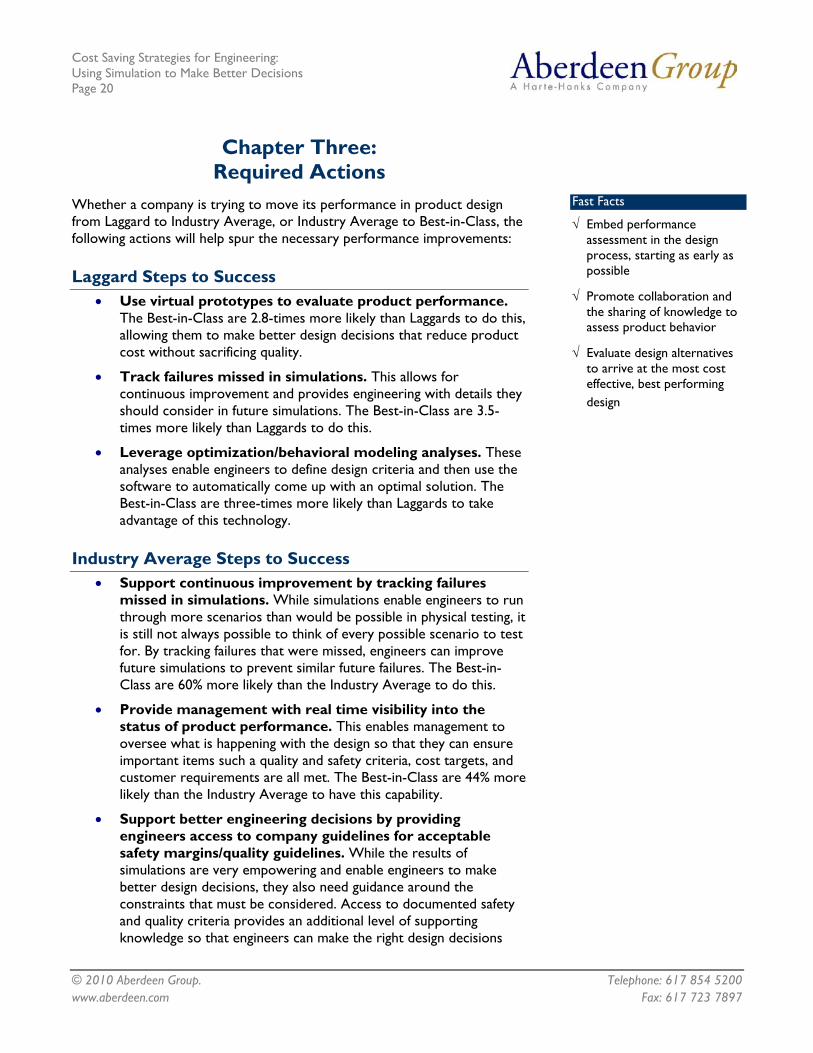
Whether a company is trying to move its performance in product design from Laggard to Industry Average, or Industry Average to Best-in-Class, the following actions will help spur the necessary performance improvements:
Laggard Steps to Success • Use virtual prototypes to evaluate product performance.
The Best-in-Class are 2.8-times more likely than Laggards to do this, allowing them to make better design decisions that reduce product cost without sacrificing quality.
• Track failures missed in simulations. This allows for continuous improvement and provides engineering with details they should consider in future simulations. The Best-in-Class are 3.5-times more likely than Laggards to do this.
• Leverage optimization/behavioral modeling analyses. These analyses enable engineers to define design criteria and then use the software to automatically come up with an optimal solution. The Best-in-Class are three-times more likely than Laggards to take advantage of this technology.
Industry Average Steps to Success • Support continuous improvement by tracking failures
missed in simulations. While simulations enable engineers to run through more scenarios than would be possible in physical testing, it is still not always possible to think of every possible scenario to test for. By tracking failures that were missed, engineers can improve future simulations to prevent similar future failures. The Best-in-Class are 60% more likely than the Industry Average to do this.
• Provide management with real time visibility into the status of product performance. This enables management to oversee what is happening with the design so that they can ensure important items such a quality and safety criteria, cost targets, and customer requirements are all met. The Best-in-Class are 44% more likely than the Industry Average to have this capability.
• Support better engineering decisions by providing engineers access to company guidelines for acceptable safety margins/quality guidelines. While the results of simulations are very empowering and enable engineers to make better design decisions, they also need guidance around the constraints that must be considered. Access to documented safety and quality criteria provides an additional level of supporting knowledge so that engineers can make the right design decisions
www.aberdeen.com Fax: 617 723 7897
Cost Saving Strategies for Engineering: Using Simulation to Make Better Decisions Page 21
© 2010 Aberdeen Group. Telephone: 617 854 5200 www.aberdeen.com Fax: 617 723 7897
with confidence. The Best-in-Class are 38% more likely to support their engineers with this resource.
Best-in-Class Steps to Success • Adopt a simulation data management solution. Simulation is
a very powerful tool, but is even more powerful when leveraging the collective expertise of others. Simulation data management enables central access to previously conducted simulations so that it is easier for others to access and leverage them in the future. Forty-nine percent (49%) of the Best-in-Class already use this technology, 2.2-times more than all other competitors, but more could take advantage of it.
• Take advantage of multi-physics simulations. Multi-physics enables engineers to evaluate multiple physical phenomena simultaneously, making the model even more realistic. The more realistic the model, the better the results. Currently, 22% of the Best-in-Class are using it and those who do will be able to realize even greater results with their simulations.
• Adopt a systematic approach with simulation. The Best-in-Class are already 3.1-times more likely than all other competitors to take this approach. A systematic approach means simulation is more integrated into the design process and can be leveraged to support key design decisions. Forty-eight percent (48%) of the Best-in-Class are doing this, but even more should adopt it.
Aberdeen Insights — Summary
Good engineering decisions are at the root of great designs. The decisions engineers make impact product cost, performance, quality, and safety. As seen by the success of the Best-in-Class, the best way to empower engineers to make the right decisions is to implement strategies, capabilities, and technology enablers to support the following:
• Embed performance assessment in the design process, starting as early as possible
• Promote collaboration and the sharing of knowledge to assess product behavior
• Evaluate design alternatives to arrive at the most cost effective, best performing design
This will enable engineers to take cost out of products, without sacrificing quality, thereby leading to greater company profitability.
Cost Saving Strategies for Engineering: Using Simulation to Make Better Decisions Page 22
© 2010 Aberdeen Group. Telephone: 617 854 5200
Appendix A: Research Methodology
Between March and April 2010, Aberdeen examined the use, the experiences, and the intentions of 157 enterprises in a diverse set of industries. Aberdeen supplemented this online survey effort with interviews with select survey respondents, gathering additional information on their strategies, experiences, and results.
Study Focus
Respondents completed an online survey that included questions designed to determine the following:
√ What is driving companies to improve product design
√ The challenges of product design
√ The actions these companies are taking to improve product design
√ The capabilities and technology enablers they have in place to support product
The study identifies emerging best practices to support product design and to provide a framework by which readers could assess their own capabilities.
Responding enterprises included the following:
• Job title: The research sample included respondents with the following job titles: Executive level manager (10%); VP/Director (21%); Manager (31%); Engineers (33%); and other (5%).
• Industry: The research sample included respondents from a wide cross section of industries. The sectors that saw the largest representation in the sample were: industrial equipment (28%), high tech (21%), automotive (20%), aerospace and defense (14%), medical devices (10%), and telecommunications (7%).
• Geography: The majority of respondents (66%) were from North America. Remaining respondents were from Europe (19%), the Asia / Pacific region (12%), and from the rest of the world (4%).
• Company size: Twenty-five percent (25%) of respondents were from large enterprises (annual revenues above US $1 billion); 40% were from midsize enterprises (annual revenues between $50 million and $1 billion); and 35% of respondents were from small businesses (annual revenues of $50 million or less).
• Headcount: Twenty-two percent (22%) of respondents were from small enterprises (headcount between 1 and 99 employees); 33% were from midsize enterprises (headcount between 100 and 999 employees); and 45% of respondents were from large businesses (headcount greater than 1,000 employees).
www.aberdeen.com Fax: 617 723 7897
Cost Saving Strategies for Engineering: Using Simulation to Make Better Decisions Page 23
© 2010 Aberdeen Group. Telephone: 617 854 5200
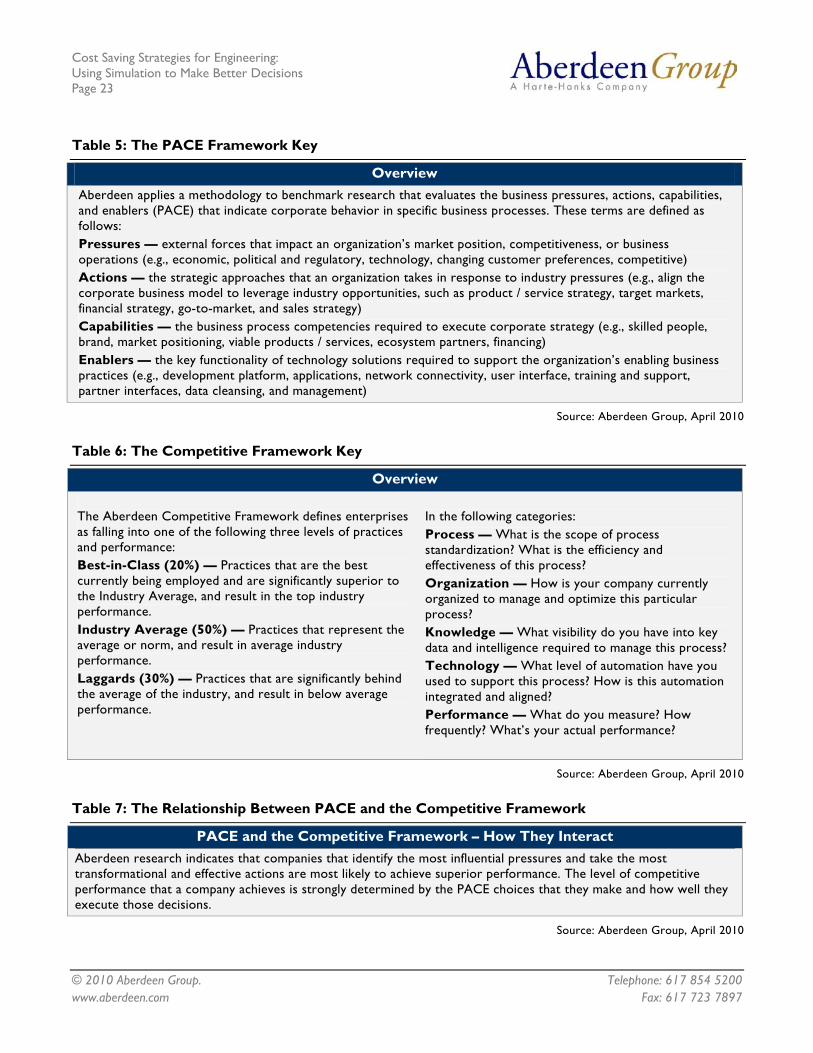
Table 5: The PACE Framework Key
Overview Aberdeen applies a methodology to benchmark research that evaluates the business pressures, actions, capabilities, and enablers (PACE) that indicate corporate behavior in specific business processes. These terms are defined as follows: Pressures — external forces that impact an organization’s market position, competitiveness, or business operations (e.g., economic, political and regulatory, technology, changing customer preferences, competitive) Actions — the strategic approaches that an organization takes in response to industry pressures (e.g., align the corporate business model to leverage industry opportunities, such as product / service strategy, target markets, financial strategy, go-to-market, and sales strategy) Capabilities — the business process competencies required to execute corporate strategy (e.g., skilled people, brand, market positioning, viable products / services, ecosystem partners, financing) Enablers — the key functionality of technology solutions required to support the organization’s enabling business practices (e.g., development platform, applications, network connectivity, user interface, training and support, partner interfaces, data cleansing, and management)
Source: Aberdeen Group, April 2010
Table 6: The Competitive Framework Key
Overview The Aberdeen Competitive Framework defines enterprises as falling into one of the following three levels of practices and performance: Best-in-Class (20%) — Practices that are the best currently being employed and are significantly superior to the Industry Average, and result in the top industry performance. Industry Average (50%) — Practices that represent the average or norm, and result in average industry performance. Laggards (30%) — Practices that are significantly behind the average of the industry, and result in below average performance.
In the following categories: Process — What is the scope of process standardization? What is the efficiency and effectiveness of this process? Organization — How is your company currently organized to manage and optimize this particular process? Knowledge — What visibility do you have into key data and intelligence required to manage this process? Technology — What level of automation have you used to support this process? How is this automation integrated and aligned? Performance — What do you measure? How frequently? What’s your actual performance?
Source: Aberdeen Group, April 2010
Table 7: The Relationship Between PACE and the Competitive Framework
PACE and the Competitive Framework – How They Interact Aberdeen research indicates that companies that identify the most influential pressures and take the most transformational and effective actions are most likely to achieve superior performance. The level of competitive performance that a company achieves is strongly determined by the PACE choices that they make and how well they execute those decisions.
Source: Aberdeen Group, April 2010
www.aberdeen.com Fax: 617 723 7897

Cost Saving Strategies for Engineering: Using Simulation to Make Better Decisions Page 24
© 2010 Aberdeen Group. Telephone: 617 854 5200 www.aberdeen.com Fax: 617 723 7897
Appendix B: Related Aberdeen Research
Related Aberdeen research that forms a companion or reference to this report includes:
• Engineering Evolved: Getting Mechatronics Performance Right the First Time; November 2008
• Engineering Executive's Strategic Agenda; June 2008
• Complementary Digital and Physical Prototyping Strategies: Avoiding the Product Development Crunch; February 2008
• System Design: New Product Development for Mechatronics; January 2008
• Engineering Decision Support; September 2007
• Simulation-Driven Design: Getting it Right the First Time; October 2006
Information on these and any other Aberdeen publications can be found at www.aberdeen.com.
Author: Michelle Boucher, Research Analyst, Product Innovation & Engineering Practice, ([email protected])
Since 1988, Aberdeen's research has been helping corporations worldwide become Best-in-Class. Having benchmarked the performance of more than 644,000 companies, Aberdeen is uniquely positioned to provide organizations with the facts that matter — the facts that enable companies to get ahead and drive results. That's why our research is relied on by more than 2.2 million readers in over 40 countries, 90% of the Fortune 1,000, and 93% of the Technology 500.
As a Harte-Hanks Company, Aberdeen plays a key role of putting content in context for the global direct and targeted marketing company. Aberdeen's analytical and independent view of the "customer optimization" process of Harte-Hanks (Information – Opportunity – Insight – Engagement – Interaction) extends the client value and accentuates the strategic role Harte-Hanks brings to the market. For additional information, visit Aberdeen http://www.aberdeen.com or call (617) 723-7890, or to learn more about Harte-Hanks, call (800) 456-9748 or go to http://www.harte-hanks.com.
This document is the result of primary research performed by Aberdeen Group. Aberdeen Group's methodologies provide for objective fact-based research and represent the best analysis available at the time of publication. Unless otherwise noted, the entire contents of this publication are copyrighted by Aberdeen Group, Inc. and may not be reproduced, distributed, archived, or transmitted in any form or by any means without prior written consent by Aberdeen Group, Inc. (071309b)