Embed Size (px)
Citation preview
c o m e . c o n n e c t . c r e a t e
Cost-effectiveness of Remote Sensing for Agricultural Statistics
Results from the research studies by the Global Strategy to Improve Agricultural and Rural Statistics
Yakob M. SeidStatistician
Food and Agriculture Organization of the United Nations
2
Outline/Content
Copyright ISIWSC2019
• Introduction
• The Issue of Cost
• Relative Gains:
• Optimization of Sampling Design• Crop Monitoring and Yield Forecasting
• Remaining Challenges: Sensor Suitability
• Conclusion
3
Introduction
Copyright ISIWSC2019
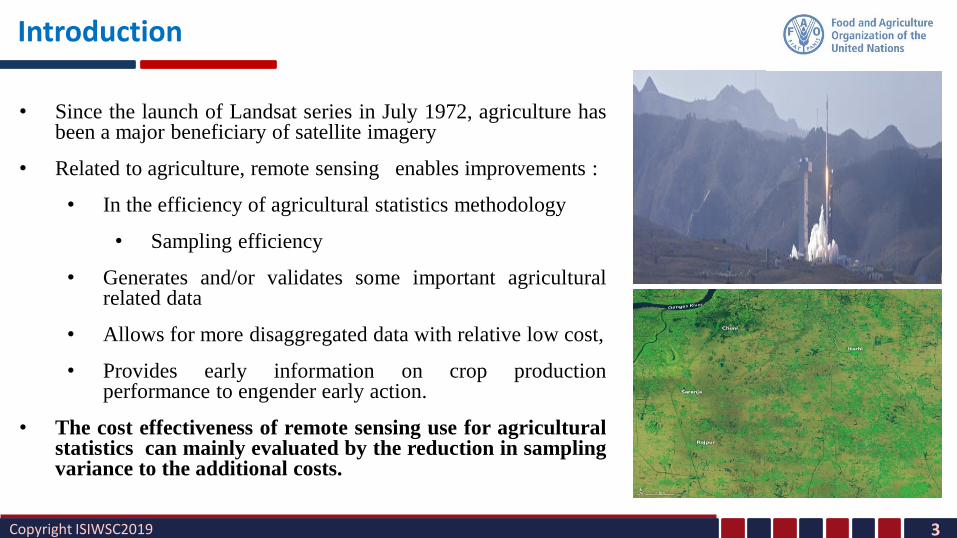
• Since the launch of Landsat series in July 1972, agriculture hasbeen a major beneficiary of satellite imagery
• Related to agriculture, remote sensing enables improvements :
• In the efficiency of agricultural statistics methodology
• Sampling efficiency
• Generates and/or validates some important agriculturalrelated data
• Allows for more disaggregated data with relative low cost,
• Provides early information on crop productionperformance to engender early action.
• The cost effectiveness of remote sensing use for agriculturalstatistics can mainly evaluated by the reduction in samplingvariance to the additional costs.
4
The Issue of Cost
Copyright ISIWSC2019
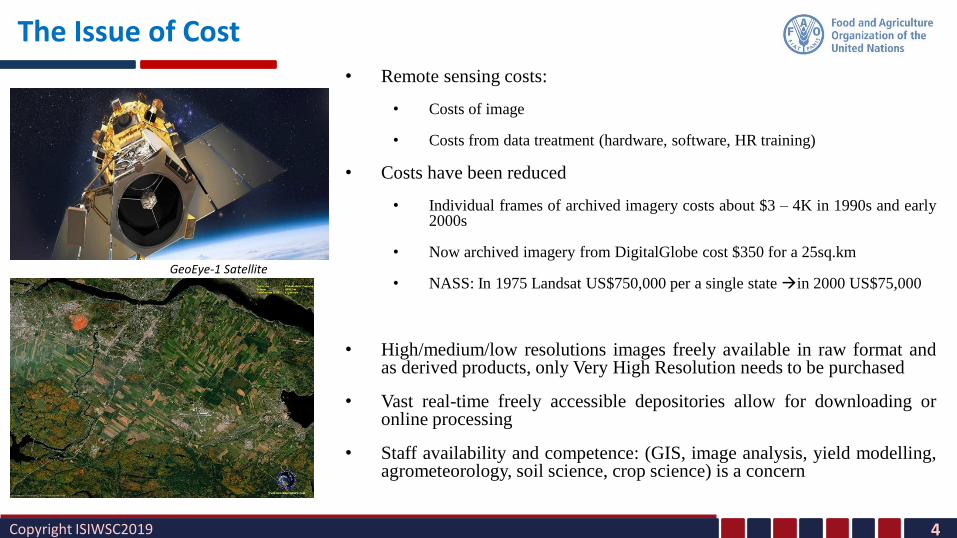
• Remote sensing costs:
• Costs of image
• Costs from data treatment (hardware, software, HR training)
• Costs have been reduced
• Individual frames of archived imagery costs about $3 – 4K in 1990s and early2000s
• Now archived imagery from DigitalGlobe cost $350 for a 25sq.km
• NASS: In 1975 Landsat US$750,000 per a single state →in 2000 US$75,000
• High/medium/low resolutions images freely available in raw format andas derived products, only Very High Resolution needs to be purchased
• Vast real-time freely accessible depositories allow for downloading oronline processing
• Staff availability and competence: (GIS, image analysis, yield modelling,agrometeorology, soil science, crop science) is a concern
GeoEye-1 Satellite
5Copyright ISIWSC2019
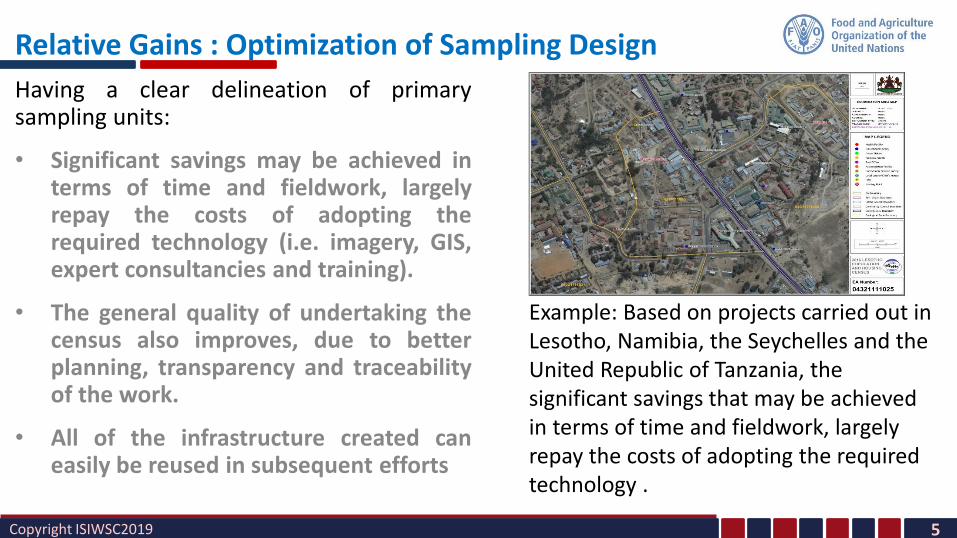
Having a clear delineation of primarysampling units:
• Significant savings may be achieved interms of time and fieldwork, largelyrepay the costs of adopting therequired technology (i.e. imagery, GIS,expert consultancies and training).
• The general quality of undertaking thecensus also improves, due to betterplanning, transparency and traceabilityof the work.
• All of the infrastructure created caneasily be reused in subsequent efforts
Example: Based on projects carried out in Lesotho, Namibia, the Seychelles and the United Republic of Tanzania, the significant savings that may be achieved in terms of time and fieldwork, largely repay the costs of adopting the required technology .
Relative Gains : Optimization of Sampling Design
6Copyright ISIWSC2019
Relative Gains : Optimization of Sampling Design
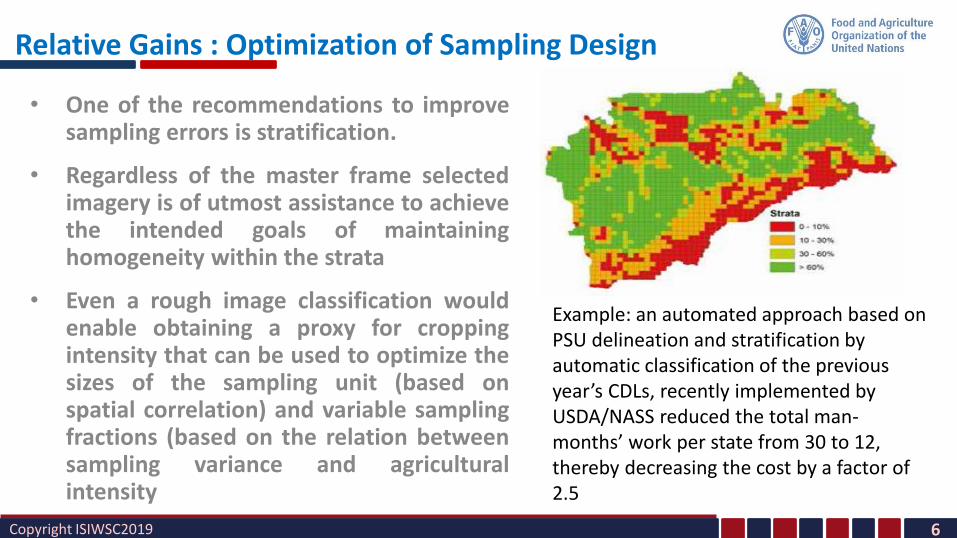
• One of the recommendations to improvesampling errors is stratification.
• Regardless of the master frame selectedimagery is of utmost assistance to achievethe intended goals of maintaininghomogeneity within the strata
• Even a rough image classification wouldenable obtaining a proxy for croppingintensity that can be used to optimize thesizes of the sampling unit (based onspatial correlation) and variable samplingfractions (based on the relation betweensampling variance and agriculturalintensity
Example: an automated approach based on PSU delineation and stratification by automatic classification of the previous year’s CDLs, recently implemented by USDA/NASS reduced the total man-months’ work per state from 30 to 12, thereby decreasing the cost by a factor of 2.5
7Copyright ISIWSC2019
Relative Gains : Optimization of Sampling Design
▪ Haïti, Point Area Frame
• Use of a 50-cm resolution archive aerial photographs for establishing apoint area frame.
• Approximately 1.7 million points located on a 125-m grid photo
• interpreted (in 3 400 working days),
• enabling the creation of a stratified sample of 25 000 points (eachrepresenting approximately 1 km2).
• Conceived to be used for ten years, the additional cost of using imagery-based stratification amounted to 2 percent.
• It provided a decrease in variance by 8 to 38 percent for major crops
8Copyright ISIWSC2019
Relative Gains : Optimization of Sampling Design
▪ China, Area Frame of the China’s Bureau of Statistics in 10 provinces (1.6 M km2)
• A stratified two stage sampling :
• Villages were selected as PSUs in the first stage using PPS (the size of each PSU ranging between 1km2 and 5 km2)
• Segments were selected randomly as SSU in the second stage having a size between 2 ha and 5 ha,with a total sampling fraction in the order of 0.2 percent).
• For Anhui province (139 400 km2), a sample size of 6 000 segments leads to a CV of
• 1.3 percent for wheat (2 200 000 ha),
• 0.9 percent for middle rice (1 900 000 ha)
• 3 percent for corn (1 000 000 ha).
• The good level of precision obtained from the stratification and from the PPS sampling, based on theclassification of GF1 and ZY3 Chinese satellite imagery (with a resolution of 2 m).
• The associated costs amount to US$75 000 per province, and therefore approximately US$0.5/km2.
9Copyright ISIWSC2019
Relative Gains : Crop Monitoring and Yield Forecasting
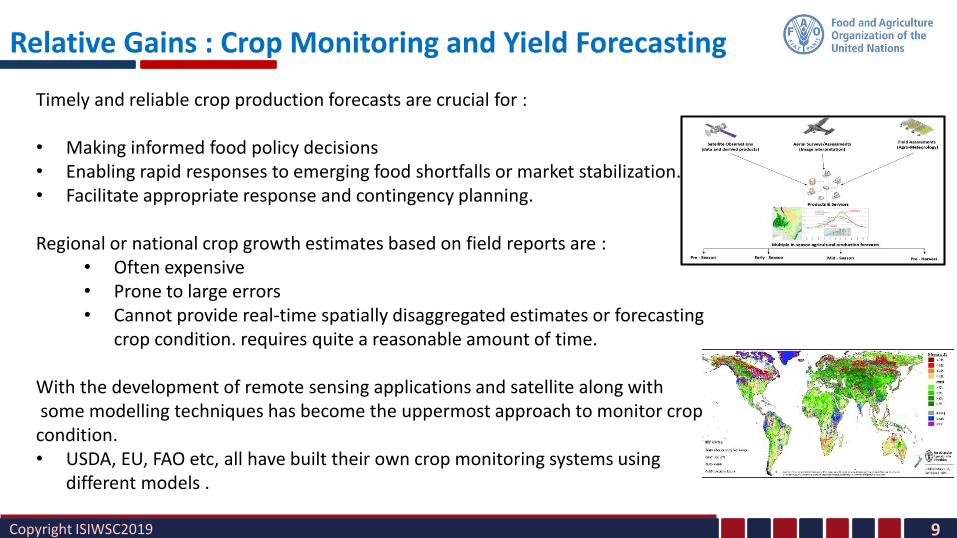
Timely and reliable crop production forecasts are crucial for :
• Making informed food policy decisions • Enabling rapid responses to emerging food shortfalls or market stabilization.• Facilitate appropriate response and contingency planning.
Regional or national crop growth estimates based on field reports are :• Often expensive• Prone to large errors• Cannot provide real-time spatially disaggregated estimates or forecasting
crop condition. requires quite a reasonable amount of time.
With the development of remote sensing applications and satellite along with some modelling techniques has become the uppermost approach to monitor crop condition. • USDA, EU, FAO etc, all have built their own crop monitoring systems using
different models .
10Copyright ISIWSC2019
Relative Gains : Crop Monitoring and Yield Forecasting
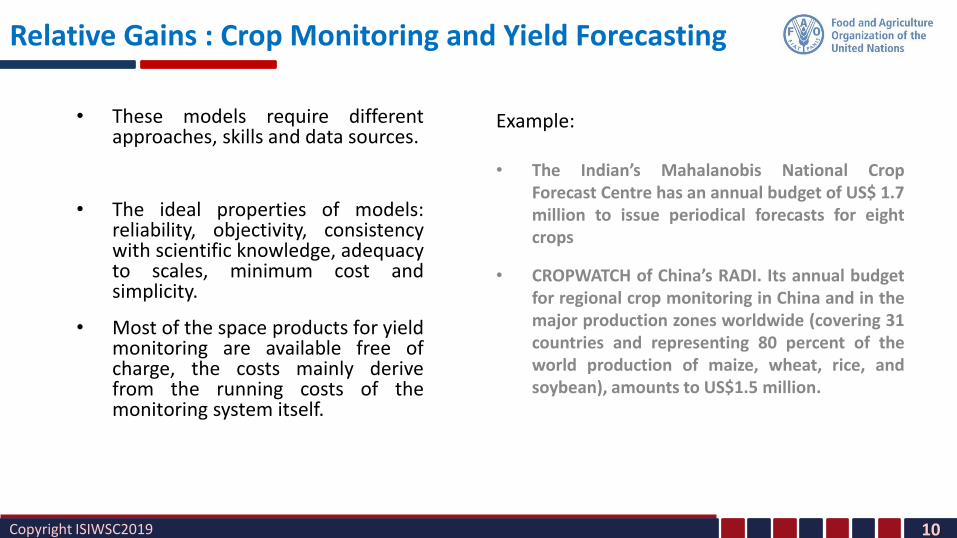
• These models require differentapproaches, skills and data sources.
• The ideal properties of models:reliability, objectivity, consistencywith scientific knowledge, adequacyto scales, minimum cost andsimplicity.
• Most of the space products for yieldmonitoring are available free ofcharge, the costs mainly derivefrom the running costs of themonitoring system itself.
Example:
• The Indian’s Mahalanobis National CropForecast Centre has an annual budget of US$ 1.7million to issue periodical forecasts for eightcrops
• CROPWATCH of China’s RADI. Its annual budgetfor regional crop monitoring in China and in themajor production zones worldwide (covering 31countries and representing 80 percent of theworld production of maize, wheat, rice, andsoybean), amounts to US$1.5 million.
11Copyright ISIWSC2019
Sensor Suitability
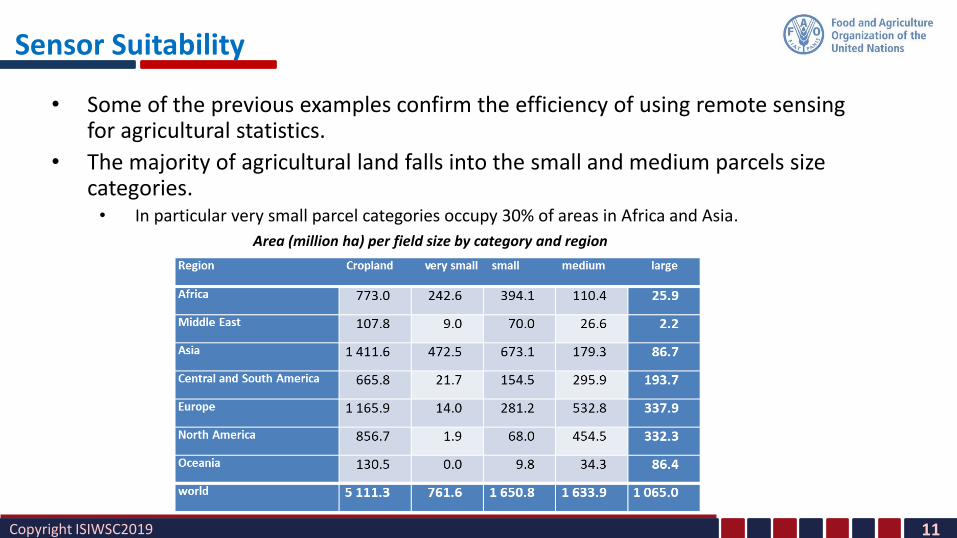
• Some of the previous examples confirm the efficiency of using remote sensing for agricultural statistics.
• The majority of agricultural land falls into the small and medium parcels size categories. • In particular very small parcel categories occupy 30% of areas in Africa and Asia.
Area (million ha) per field size by category and region
12Copyright ISIWSC2019
Sensor Suitability
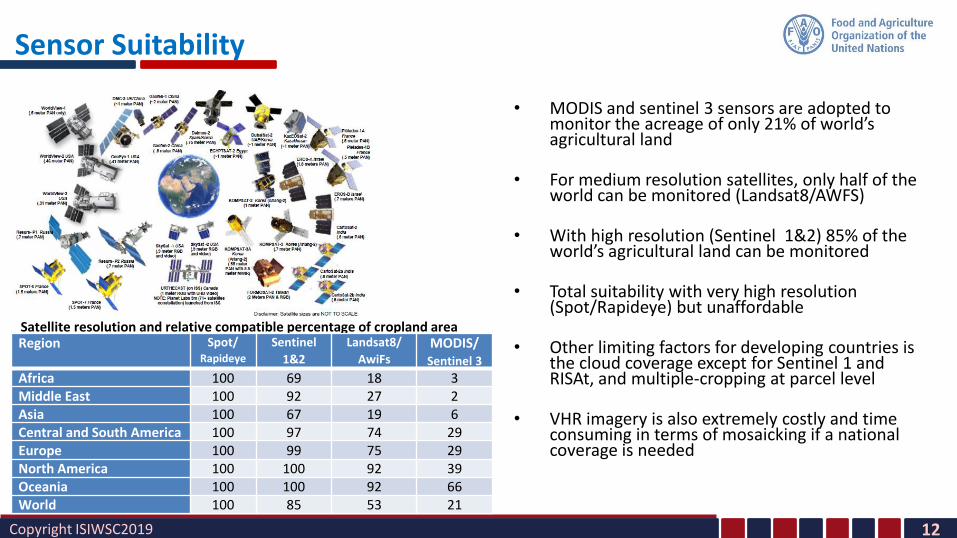
Satellite resolution and relative compatible percentage of cropland areaRegion Spot/
Rapideye
Sentinel
1&2
Landsat8/
AwiFsMODIS/Sentinel 3
Africa 100 69 18 3Middle East 100 92 27 2Asia 100 67 19 6Central and South America 100 97 74 29Europe 100 99 75 29North America 100 100 92 39Oceania 100 100 92 66World 100 85 53 21
• MODIS and sentinel 3 sensors are adopted to monitor the acreage of only 21% of world’s agricultural land
• For medium resolution satellites, only half of the world can be monitored (Landsat8/AWFS)
• With high resolution (Sentinel 1&2) 85% of the world’s agricultural land can be monitored
• Total suitability with very high resolution (Spot/Rapideye) but unaffordable
• Other limiting factors for developing countries is the cloud coverage except for Sentinel 1 and RISAt, and multiple-cropping at parcel level
• VHR imagery is also extremely costly and time consuming in terms of mosaicking if a national coverage is needed
13Copyright ISIWSC2019
Conclusion
Three main factors supporting the cost-effectiveness of remote sensing:
• Decrease of image prices (particularly important for crop yield monitoring) and free-of-charge long terms systems
• Quality improving: image resolution, revisiting time, radiometric channels
• Open-source software available
Some Conclusions:
• Conclusion 1: Crop acreage estimation has attained some cost-efficiency. However field size, multiple-cropping remain strong issues for about 70 developing countries
• Conclusion 2: use of archive imagery/ land cover maps in sampling design optimization is a key enabling factor for improving agricultural statistics
• Conclusion 3: Crop yield monitoring, essential to food security and market monitoring, is best served by remote sensing
14Copyright ISIWSC2019
References
• Gallego, F.J., Kussulb, N., Skakunb, S., Kravchenkob, O., Shelestov, A. & Kussuld, O. 2014. Efficiency assessment of using satellite data for crop area estimation in Ukraine. International Journal of Applied Earth Observation and Geoinformation, 29: 22–30.
• Global Strategy to improve Agricultural and Rural Statistics (GSARS). 2015a. Spatial Disaggregation and Small-Area Estimation Methods for Agricultural Surveys: Solutions and Perspectives. Technical Report Series GO-07-2015. GSARS Technical Report: Rome.
• ____________ 2015b. Handbook on Master Sampling Frames for Agricultural Statistics: Frame Development, Sample Design and Estimation. GSARS Handbook: Rome.
• Global Strategy to improve Agricultural and Rural Statistics (GSARS). 2017. Handbook on Remote Sensing for Agricultural Statistics. GSARS Handbook: Rome
• Latham, J. 2017. Organization, resources and competences. In Delincé, J. (ed.), Handbook on Remote Sensing for Agricultural Statistics (chapter 8). Global Strategy Handbook: Rome.
• Loots, H. 2015. The use of Hexagon’s Smart Client for Census software for the demarcation of census enumeration areas for the 2016 Population and housing census in Lesotho. Paper prepared for Geomatics Indaba: Conference and exhibition of surveying, geospatial information, GIS, mapping, remote sensing and location-based business, 11–13 August 2015. Gauteng, South Africa.

c o m e . c o n n e c t . c r e a t e
THANK YOU