Embed Size (px)
Citation preview
ORIGINAL RESEARCH
Cost-Effectiveness Analysis of Sensor-AugmentedInsulin Pump Therapy with Automated InsulinSuspension Versus Standard Insulin Pump Therapyin Patients with Type 1 Diabetes in Sweden
Johan Jendle . Jayne Smith-Palmer . Alexis Delbaere .
Simona de Portu . Natalie Papo . William Valentine . Stephane Roze
Received: June 29, 2017 / Published online: September 4, 2017� The Author(s) 2017. This article is an open access publication
ABSTRACT
Introduction: In Sweden an estimated 10,000people with type 1 diabetes use continuoussubcutaneous insulin infusion (CSII). Sen-sor-augmented pump therapy (SAP) is associ-ated with higher acquisition costs but providesadditional clinical benefits (e.g. reduced rate ofhypoglycemic events) over and above that ofCSII alone. The aim of the analysis was to assessthe cost-effectiveness of SAP with automatedinsulin suspension relative to CSII alone in twodifferent groups of patients with type 1 diabetesin Sweden.Methods: Cost-effectiveness analyses were per-formed using the QuintilesIMS CORE DiabetesModel, with clinical and economic input data
derived from published literature. Separateanalyses were performed for patients atincreased risk of hypoglycemia and for patientswith uncontrolled glycated hemoglobin(HbA1c) at baseline. Analyses were performedfrom a societal perspective over a lifetime timehorizon. Future costs and clinical outcomeswere discounted at 3% per annum.Results: SAP with automated insulin suspen-sion was associated with an incremental gain inquality-adjusted life expectancy versus the CSIIof 1.88 quality-adjusted life years (QALYs) inpatients at high risk of hypoglycemia and of1.07 QALYs in patients with uncontrolledHbA1c at baseline. Higher lifetime costs for SAPwith automated insulin suspension resulted inprojected incremental cost-effectiveness ratiosfor the SAP with automated insulin suspensionversus CSII of Swedish Krona (SEK) 139,795[euros (EUR) 14,648] per QALY gained forpatients at increased risk for hypoglycemia andSEK 251,896 (EUR 26,395) per QALY gained forpatients with uncontrolled HbA1c. In bothgroups, SAP with automated insulin suspensionalso reduced the incidence of diabetes-relatedcomplications relative to CSII.Conclusions: In Sweden, SAP with automatedinsulin suspension likely represents a cost-ef-fective treatment option relative to CSII for themanagement of patients with type 1 diabeteswith a history of severe hypoglycemic events or
Enhanced content To view enhanced content for thisarticle go to http://www.medengine.com/Redeem/62FBF06076C858FE.
J. JendleOrebro University, Orebro, Sweden
J. Smith-Palmer (&) � W. ValentineOssian Health Economics and Communications,Basel, Switzerlande-mail: [email protected]
A. Delbaere � S. de Portu � N. PapoMedtronic International Trading Sarl, Tolochenaz,Switzerland
S. RozeHEVA HEOR, Lyon, France
Diabetes Ther (2017) 8:1015–1030
DOI 10.1007/s13300-017-0294-z
patients who struggle to achieve good glycemiccontrol despite the use of CSII.Funding: Medtronic International Trading Sarl.
Keywords: Cost; Cost-effectiveness; Type 1diabetes; Sensor-augmented pump therapy
INTRODUCTION
Data from the Swedish National DiabetesRegister (NDR) indicate that in Sweden in 2013,there were approximately 36,000 people withtype 1 diabetes being treated in specialist clinics[1], of whom an estimated 21% were usinginsulin pumps [continuous subcutaneous insu-lin infusion (CSII)]. Notably, the proportion ofadults using CSII was reported to vary consid-erably with age, with CSII use being morecommon in younger and in female patients [1].
CSII represents an important treatmentoption for type 1 diabetes patients and is aparticularly valuable alternative for severalsubgroups of patients, including those whocannot achieve good glycemic control withmultiple daily injections (MDI) of insulin,patients with frequent or severe hypoglycemicevents and young children with a fear of nee-dles. There are also several other potential rea-sons why CSII may be preferable, such as erraticlifestyles with irregular shiftwork or travelacross time zones that may complicate diseasemanagement. Indeed, in a study of routineclinical practice by Jendle et al. the most com-mon indications for CSII were glucose excur-sions (35.8%), elevated glycated hemogloblin(HbA1c; 33.0%), patient preference (11.5%),frequent hypoglycemic events (7.9%) andfacilitation of glycemic control (6.4%) [2]. Manypatients may also prefer CSII to MDI, withpatient satisfaction having been reported to besignificantly higher in patients using CSII thanin those receiving MDI [3].
In terms of clinical benefits, CSII has beenshown to improve glycemic control and reducethe incidence of severe hypoglycemic eventsrelative to MDI, particularly in patients withvery poor baseline glycemic control [4–7]. Datafrom the Swedish NDR has also shown that CSIIis associated with a significantly lower hazard
ratio for fatal coronary heart disease, fatal car-diovascular disease and all-cause mortality rel-ative to MDI [8].
Sensor-augmented pump therapy (SAP)combines real time continuous glucose moni-toring (CGM) with CSII and provides additionalbenefits beyond those provided by CSII alone.Studies conducted to date have shown that SAPis associated with improved glycemic controland a reduced frequency of hypoglycemicevents compared with CSII [9–11]. Moreover,SAP-related technology is continually evolving,and SAP with automated insulin suspensionincludes devices incorporating features such aslow glucose suspend (LGS) or predictive lowglucose suspend (SmartGuardTM technology),both of which are features designed to minimizethe risk of hypoglycemia. With the LGS feature,insulin delivery is temporarily suspended ifglucose levels drop below a pre-defined thresh-old level. Predictive low glucose suspend is themost recently introduced feature and a moresophisticated feature, whereby insulin deliverycan be suspended based on the prediction oflow glucose levels within the next 30 min andinsulin delivery is automatically resumed onceblood glucose levels start to recover [12].Recently published findings from the ASPIREstudy report that SAP with LGS, compared withno LGS, was associated with a reduction in boththe rate and severity of hypoglycemia, particu-larly nocturnal hypoglycemic events [13–15].
One of the main barriers to wider uptake ofSAP is the higher device costs relative to CSII.Therefore, the additional clinical benefit mustbe weighed against the increased acquisitioncosts. There is a widespread acceptance thattechnologies including CSII, CGM and SAPimprove patient outcomes; indeed the Ameri-can Association of Clinical Endocrinologistsconsensus statement on CGM states that ‘‘ex-panding CGM coverage and utilization is likelyto improve the health outcomes of people withdiabetes’’ (page 1009) [16]. CSII with CGM wasalso recommended in the Endocrine SocietyClinical Practice guidelines for type 1 diabetespatients failing to achieve HbA1c targets as wellas for well-controlled patients willing to useCGM on an almost daily basis [17]. Long-termhealth economic analyses are required to assist
1016 Diabetes Ther (2017) 8:1015–1030
policy-makers and payers in the decision-mak-ing process with regard to the uptake andreimbursement of technologies such as SAP.The aim of the current analysis was to assess thecost-effectiveness of the latest generation of SAPwith automated insulin suspension (Mini-MedTM 640G insulin pump; Medtronic Inter-national Trading Sarl, Tolochenaz, Switzerland)versus CSII alone in two different populations oftype 1 diabetes patients in Sweden.
METHODS
Model Description
Cost-effectiveness analysis was performed usingthe QuintilesIMS CORE Diabetes Model (re-ferred to hereafter in text as CDM; Quin-tilesIMS, Basel, Switzerland). The CDM is anon-product-specific policy analysis tool forcost-effectiveness analysis in type 1 or type 2diabetes. Details of the model structure andvalidation have been published elsewhere[18–20]. The CDM is based on a series ofinter-dependent sub-models that simulate dis-ease progression and the incidence of dia-betes-related complications. The sub-modelshave a semi-Markov structure and use time,time-in-state and diabetes type-dependentprobabilities derived from published sources tosimulate disease progression. Monte Carlo sim-ulation using tracker variables is used to over-come the memory-less properties of a standardMarkov model and allows for interconnectivityand interaction between individual sub-models.
Simulation Cohorts and Treatment Effects
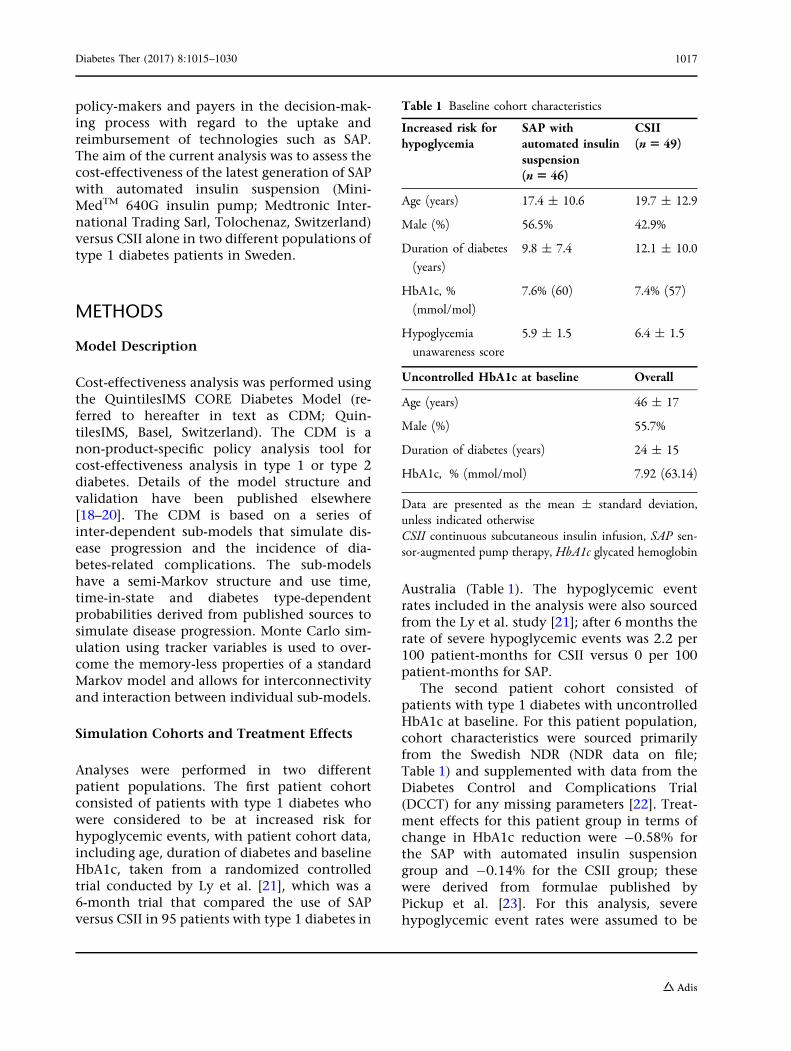
Analyses were performed in two differentpatient populations. The first patient cohortconsisted of patients with type 1 diabetes whowere considered to be at increased risk forhypoglycemic events, with patient cohort data,including age, duration of diabetes and baselineHbA1c, taken from a randomized controlledtrial conducted by Ly et al. [21], which was a6-month trial that compared the use of SAPversus CSII in 95 patients with type 1 diabetes in
Australia (Table 1). The hypoglycemic eventrates included in the analysis were also sourcedfrom the Ly et al. study [21]; after 6 months therate of severe hypoglycemic events was 2.2 per100 patient-months for CSII versus 0 per 100patient-months for SAP.
The second patient cohort consisted ofpatients with type 1 diabetes with uncontrolledHbA1c at baseline. For this patient population,cohort characteristics were sourced primarilyfrom the Swedish NDR (NDR data on file;Table 1) and supplemented with data from theDiabetes Control and Complications Trial(DCCT) for any missing parameters [22]. Treat-ment effects for this patient group in terms ofchange in HbA1c reduction were -0.58% forthe SAP with automated insulin suspensiongroup and -0.14% for the CSII group; thesewere derived from formulae published byPickup et al. [23]. For this analysis, severehypoglycemic event rates were assumed to be
Table 1 Baseline cohort characteristics
Increased risk forhypoglycemia
SAP withautomated insulinsuspension(n5 46)
CSII(n5 49)
Age (years) 17.4 ± 10.6 19.7 ± 12.9
Male (%) 56.5% 42.9%
Duration of diabetes
(years)
9.8 ± 7.4 12.1 ± 10.0
HbA1c, %
(mmol/mol)
7.6% (60) 7.4% (57)
Hypoglycemia
unawareness score
5.9 ± 1.5 6.4 ± 1.5
Uncontrolled HbA1c at baseline Overall
Age (years) 46 ± 17
Male (%) 55.7%
Duration of diabetes (years) 24 ± 15
HbA1c, % (mmol/mol) 7.92 (63.14)
Data are presented as the mean ± standard deviation,unless indicated otherwiseCSII continuous subcutaneous insulin infusion, SAP sen-sor-augmented pump therapy, HbA1c glycated hemoglobin
Diabetes Ther (2017) 8:1015–1030 1017
equal in both treatment arms (a rate of 2.6severe hypoglycemic events per 100 patient-months was assumed, based on data fromPickup et al. [23]). In both analyses a sensor useof 49 sensors per year (corresponding to 80% of
the time) was assumed for the SAP with auto-mated insulin suspension arm (based on theassumption of each sensor lasting 6 days andpatients using CGM for an average of 5.64 daysper week) [21].
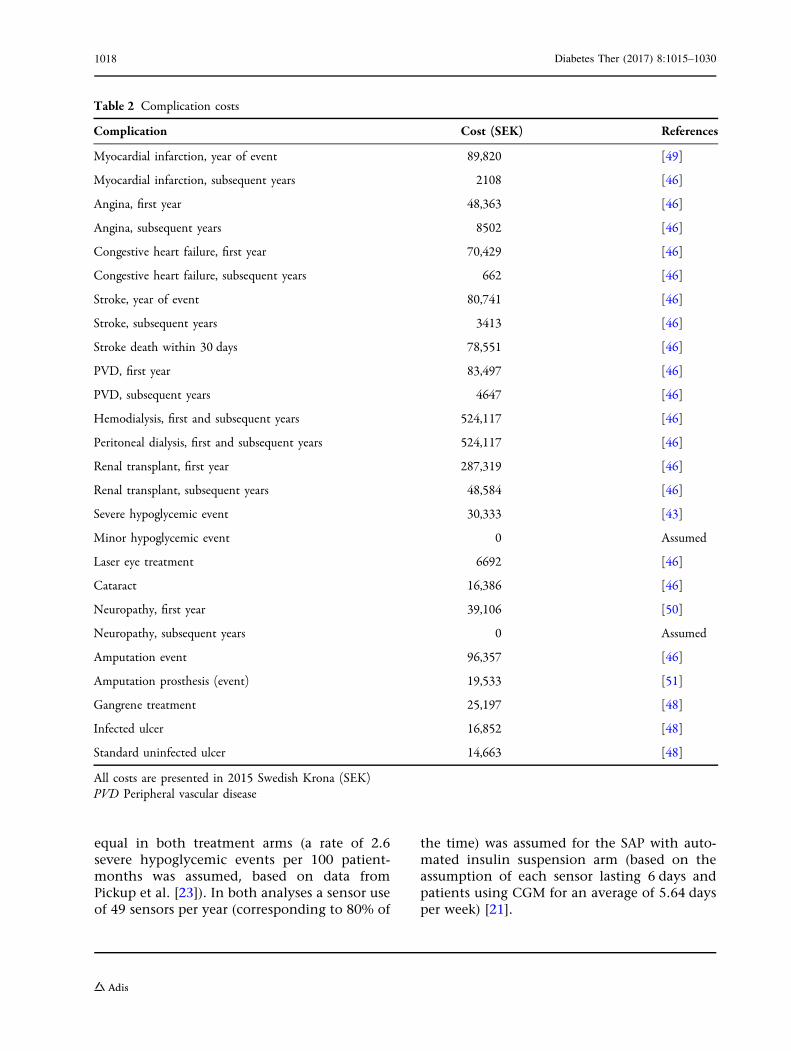
Table 2 Complication costs
Complication Cost (SEK) References
Myocardial infarction, year of event 89,820 [49]
Myocardial infarction, subsequent years 2108 [46]
Angina, first year 48,363 [46]
Angina, subsequent years 8502 [46]
Congestive heart failure, first year 70,429 [46]
Congestive heart failure, subsequent years 662 [46]
Stroke, year of event 80,741 [46]
Stroke, subsequent years 3413 [46]
Stroke death within 30 days 78,551 [46]
PVD, first year 83,497 [46]
PVD, subsequent years 4647 [46]
Hemodialysis, first and subsequent years 524,117 [46]
Peritoneal dialysis, first and subsequent years 524,117 [46]
Renal transplant, first year 287,319 [46]
Renal transplant, subsequent years 48,584 [46]
Severe hypoglycemic event 30,333 [43]
Minor hypoglycemic event 0 Assumed
Laser eye treatment 6692 [46]
Cataract 16,386 [46]
Neuropathy, first year 39,106 [50]
Neuropathy, subsequent years 0 Assumed
Amputation event 96,357 [46]
Amputation prosthesis (event) 19,533 [51]
Gangrene treatment 25,197 [48]
Infected ulcer 16,852 [48]
Standard uninfected ulcer 14,663 [48]
All costs are presented in 2015 Swedish Krona (SEK)PVD Peripheral vascular disease
1018 Diabetes Ther (2017) 8:1015–1030

This analysis does not contain data from anynew studies with human or animal subjects per-formed by any of the authors and therefore didnot require Institutional Review Board approval.
Intervention and Complication Costs
With regard to treatment cost, only the incre-mental cost of SAP with automated insulin
suspension relative to CSII was included in theanalysis. This included the cost (list price) forthe sensor, assuming a usage of 49 sensors peryear, corresponding to 80% usage, inserter,batteries and transmitter. Costs of self-moni-toring of blood glucose (SMBG) strips and lan-cets were also included. In both analyses anSMBG use of 7.11 strips/day was assumed for theCSII group and 4.35 strips/day for the SAP with
Table 3 Summary of base-case cost-effectiveness results
Effectiveness components SAP with automated insulinsuspension arm
CSII-alone arm Difference
Cohort at increased risk for hypoglycemia
Total costs, SEK (EUR) 2,671,858 (279,969) 2,409,462 (252,473) 262,396 (27,495)
Direct costs, SEK (EUR) 865,183 (90,657) 491,287 (51,479) 373,896 (39,178)
Treatment 659,570 (69,112) 141,864 (14,865) 517,706 (54,247)
Management 19,125 (2004) 18,969 (1988) 156 (16)
Cardiovascular disease 37,066 (3884) 36,360 (3810) 706 (74)
Renal complications 92,031 (9643) 89,539 (9382) 2492 (261)
Ulcer/amputation/neuropathy 50,803 (5323) 50,224 (5263) 579 (61)
Ophthalmic complications 6588 (690) 6532 (684) 56 (6)
Quality-adjusted life expectancy (QALY) 13.110 11.233 1.877
ICER, SEK (EUR) per QALY gained 139,795 (14,648)
Cohort with uncontrolled HbA1c at baseline
Total costs, SEK (EUR) 1,925,040 (201,713) 1,656,141 (173,537) 268,899 (28,176)
Direct costs, SEK (EUR) 742,442 (77,796) 391,958 (41,071) 350,484 (36,725)
Treatment 467,551 (48,992) 99,090 (10,383) 368,461 (38,609)
Management 13,438 (1399) 13,133 (1376) 305 (32)
Cardiovascular disease 72,406 (7587) 72,508 (7598) -102 (-11)
Renal complications 137,527 (14,410) 153,457 (16,080) -15,930 (-1,669)
Ulcer/amputation/neuropathy 34,722 (3638) 37,238 (3911) -2516 (-264)
Ophthalmic complications 5149 (539) 5190 (544) -41 (4)
Quality-adjusted life expectancy, QALYs 9.224 8.157 1.067
ICER, SEK (EUR) per QALY gained 251,896 (26,395)
Costs are presented in SEK with the equivalent value in euros (EUR) given in parenthesis. The exchange rate for theconversion from SEK to EUR was 1 SEK 1 = 0.10478 EUR (date 1 August 2017)ICER Incremental cost-effectiveness ratio, QALY quality-adjusted life year
Diabetes Ther (2017) 8:1015–1030 1019

automated insulin suspension group, based onfindings of an observational analysis conductedin Sweden [24]. The total incremental treatmentcost for SAP with automated insulin suspensionversus CSII was SEK (Swedish Krona) 24,174.69per year.
Costs of diabetes-related complications weresourced from published literature and, wherenecessary, inflated to 2015 SEK (Table 2). Indi-rect costs were calculated using the humancapital approach [25].
Utility Values
Utilities/disutilities for diabetes-related compli-cations were sourced from Beaudet et al. [26].For the cohort at increased risk of hypoglycemiaa utility adjustment was made that combinedfear of hypoglycemia (FoH) with the reductionin hypoglycemic event rate, based on ratesreported by Ly et al. [21] and on publishedfindings on the impact of SAP on health-relatedquality of life by McBride et al. [27]. A utilitydecrement of -0.035 was applied to the CSIIarm and a utility benefit of 0.038 was applied tothe SAP with automated insulin suspensionarm; no specific disutilities for individual severehypoglycemic events were applied.
A utility benefit associated with reduced FoHwas also applied to the SAP with automatedinsulin suspension arm of the cohort withuncontrolled HbA1c at baseline. A utility ben-efit of 0.0552 was applied, which was based onthe findings of the INTERPRET study. Here, SAPwas associated with a decrease in FoH; patientsusing SAP had a mean decrease of 6.9 units inthe Hypoglycemia Fear Survey (HFS) [28, 29].Currie et al. [30] had reported earlier that a 1unit increase in the HFS corresponds to a 0.008increase in the EQ-5D health status question-naire (EuroQoL-5 dimensions); therefore, a 6.9unit reduction in HFS corresponds to a utilitybenefit of 0.0552.
Perspective, Time Horizonand Discounting
The base case analysis was performed from thesocietal perspective (incorporating indirect
costs and lost productivity) in line with rec-ommendations for the Swedish setting. Forindirect costs, an average of 233 working daysper year, age at first income of 24 years andretirement age of 65 years were assumed. Anaverage salary of SEK 403,200 per year for malesand SEK 350,400 per year for females wasassumed based on data from Statistics Sweden[31]. The number of days off work for dia-betes-related complications were sourced from astudy by Sørensen et al. conducted in Denmark[32]. The analysis was performed over a lifetimetime horizon, and future costs and clinicaloutcomes were discounted at a rate of 3% perannum in line with Swedish recommendations[33].
Sensitivity Analyses
To establish the principal drivers of cost-ef-fectiveness outcomes we performed a series ofone-way sensitivity analyses. For the cohortat increased risk for hypoglycemia sensitivityanalyses were performed in which the utilitybenefit for reduced FoH was negated, and ananalysis in which the benefit was reduced to0.0184, based on a 2.3 unit reduction in FoHreported by Yeh et al. [34]. Also for thecohort at increased risk for hypoglycemia,sensitivity analyses were performed in whichthe severe hypoglycemia event rate in theCSII arm was altered to 1 and 8 events,respectively, per 100 patient-months. Othersensitivity analyses conducted in this popu-lation included changes in time horizon anddiscount rate.
In the cohort with uncontrolled HbA1c thesensitivity analyses included both increasingand decreasing baseline HbA1c, increasing anddecreasing sensor use to 61 and 43 sensors peryear, respectively (vs. 49 per year in the basecase analyses), changes in SAP with automatedinsulin suspension costs (-20, -10 and ?10%relative to the base case), change in SMBGreduction (no reduction and SMBG use of 6.11per day and 2.11 per day in the SAP withautomated insulin suspension arm) and chan-ges in time horizon, perspective and discountrate.
1020 Diabetes Ther (2017) 8:1015–1030
RESULTS
Cohort at Increased Risk of HypoglycemicEvents
In the cohort at increased risk for hypoglycemiaSAP with automated insulin suspension wasassociated with higher overall lifetime costs butalso with a substantial gain in quality-adjustedlife expectancy in the base-case analysis(Table 3). Total mean lifetime costs1 were
SEK 2,671,858 [euro (EUR) 279,968] per patientin the SAP with automated insulin suspensionarm versus SEK 2,409,462 (EUR 252,473) perpatient in the CSII arm. Direct costs were higherin the SAP with automated insulin suspensionarm, but indirect costs were lower in this arm,likely driven by lower levels of lost productivitydue to a lower cumulative incidence of dia-betes-related complications. Mean quality-ad-justed life expectancy was 13.11quality-adjusted life years (QALYs) in the SAPwith automated insulin suspension arm versus
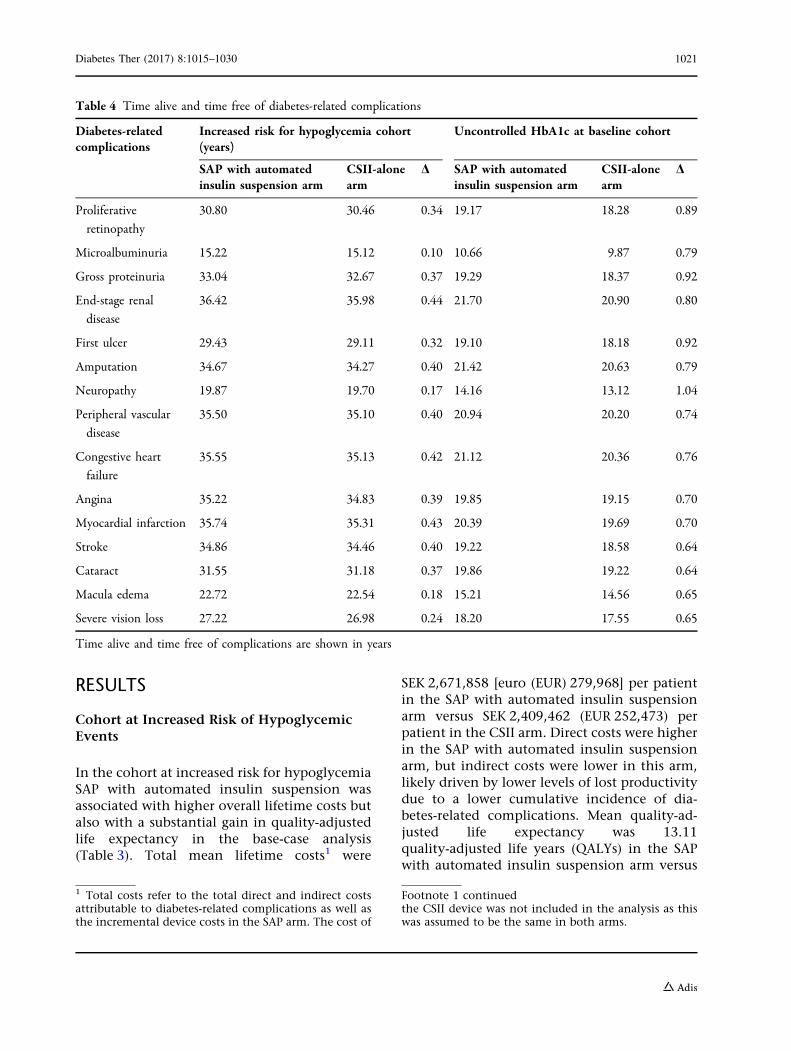
Table 4 Time alive and time free of diabetes-related complications
Diabetes-relatedcomplications
Increased risk for hypoglycemia cohort(years)
Uncontrolled HbA1c at baseline cohort
SAP with automatedinsulin suspension arm
CSII-alonearm
D SAP with automatedinsulin suspension arm
CSII-alonearm
D
Proliferative
retinopathy
30.80 30.46 0.34 19.17 18.28 0.89
Microalbuminuria 15.22 15.12 0.10 10.66 9.87 0.79
Gross proteinuria 33.04 32.67 0.37 19.29 18.37 0.92
End-stage renal
disease
36.42 35.98 0.44 21.70 20.90 0.80
First ulcer 29.43 29.11 0.32 19.10 18.18 0.92
Amputation 34.67 34.27 0.40 21.42 20.63 0.79
Neuropathy 19.87 19.70 0.17 14.16 13.12 1.04
Peripheral vascular
disease
35.50 35.10 0.40 20.94 20.20 0.74
Congestive heart
failure
35.55 35.13 0.42 21.12 20.36 0.76
Angina 35.22 34.83 0.39 19.85 19.15 0.70
Myocardial infarction 35.74 35.31 0.43 20.39 19.69 0.70
Stroke 34.86 34.46 0.40 19.22 18.58 0.64
Cataract 31.55 31.18 0.37 19.86 19.22 0.64
Macula edema 22.72 22.54 0.18 15.21 14.56 0.65
Severe vision loss 27.22 26.98 0.24 18.20 17.55 0.65
Time alive and time free of complications are shown in years
1 Total costs refer to the total direct and indirect costsattributable to diabetes-related complications as well asthe incremental device costs in the SAP arm. The cost of
Footnote 1 continuedthe CSII device was not included in the analysis as thiswas assumed to be the same in both arms.
Diabetes Ther (2017) 8:1015–1030 1021
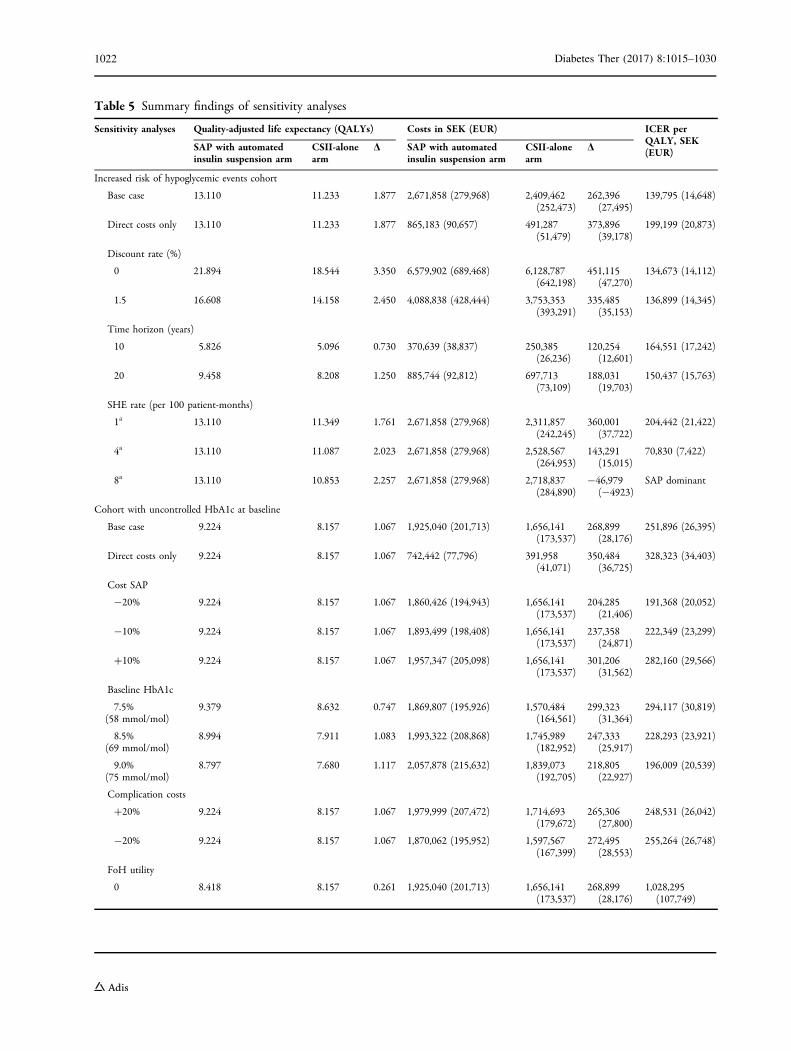
Table 5 Summary findings of sensitivity analyses
Sensitivity analyses Quality-adjusted life expectancy (QALYs) Costs in SEK (EUR) ICER perQALY, SEK(EUR)SAP with automated
insulin suspension armCSII-alonearm
D SAP with automatedinsulin suspension arm
CSII-alonearm
D
Increased risk of hypoglycemic events cohort
Base case 13.110 11.233 1.877 2,671,858 (279,968) 2,409,462(252,473)
262,396(27,495)
139,795 (14,648)
Direct costs only 13.110 11.233 1.877 865,183 (90,657) 491,287(51,479)
373,896(39,178)
199,199 (20,873)
Discount rate (%)
0 21.894 18.544 3.350 6,579,902 (689,468) 6,128,787(642,198)
451,115(47,270)
134,673 (14,112)
1.5 16.608 14.158 2.450 4,088,838 (428,444) 3,753,353(393,291)
335,485(35,153)
136,899 (14,345)
Time horizon (years)
10 5.826 5.096 0.730 370,639 (38,837) 250,385(26,236)
120,254(12,601)
164,551 (17,242)
20 9.458 8.208 1.250 885,744 (92,812) 697,713(73,109)
188,031(19,703)
150,437 (15,763)
SHE rate (per 100 patient-months)
1a 13.110 11.349 1.761 2,671,858 (279,968) 2,311,857(242,245)
360,001(37,722)
204,442 (21,422)
4a 13.110 11.087 2.023 2,671,858 (279,968) 2,528,567(264,953)
143,291(15,015)
70,830 (7,422)
8a 13.110 10.853 2.257 2,671,858 (279,968) 2,718,837(284,890)
-46,979(-4923)
SAP dominant
Cohort with uncontrolled HbA1c at baseline
Base case 9.224 8.157 1.067 1,925,040 (201,713) 1,656,141(173,537)
268,899(28,176)
251,896 (26,395)
Direct costs only 9.224 8.157 1.067 742,442 (77,796) 391,958(41,071)
350,484(36,725)
328,323 (34,403)
Cost SAP
-20% 9.224 8.157 1.067 1,860,426 (194,943) 1,656,141(173,537)
204,285(21,406)
191,368 (20,052)
-10% 9.224 8.157 1.067 1,893,499 (198,408) 1,656,141(173,537)
237,358(24,871)
222,349 (23,299)
?10% 9.224 8.157 1.067 1,957,347 (205,098) 1,656,141(173,537)
301,206(31,562)
282,160 (29,566)
Baseline HbA1c
7.5%(58 mmol/mol)
9.379 8.632 0.747 1,869,807 (195,926) 1,570,484(164,561)
299,323(31,364)
294,117 (30,819)
8.5%(69 mmol/mol)
8.994 7.911 1.083 1,993,322 (208,868) 1,745,989(182,952)
247,333(25,917)
228,293 (23,921)
9.0%(75 mmol/mol)
8.797 7.680 1.117 2,057,878 (215,632) 1,839,073(192,705)
218,805(22,927)
196,009 (20,539)
Complication costs
?20% 9.224 8.157 1.067 1,979,999 (207,472) 1,714,693(179,672)
265,306(27,800)
248,531 (26,042)
-20% 9.224 8.157 1.067 1,870,062 (195,952) 1,597,567(167,399)
272,495(28,553)
255,264 (26,748)
FoH utility
0 8.418 8.157 0.261 1,925,040 (201,713) 1,656,141(173,537)
268,899(28,176)
1,028,295(107,749)
1022 Diabetes Ther (2017) 8:1015–1030
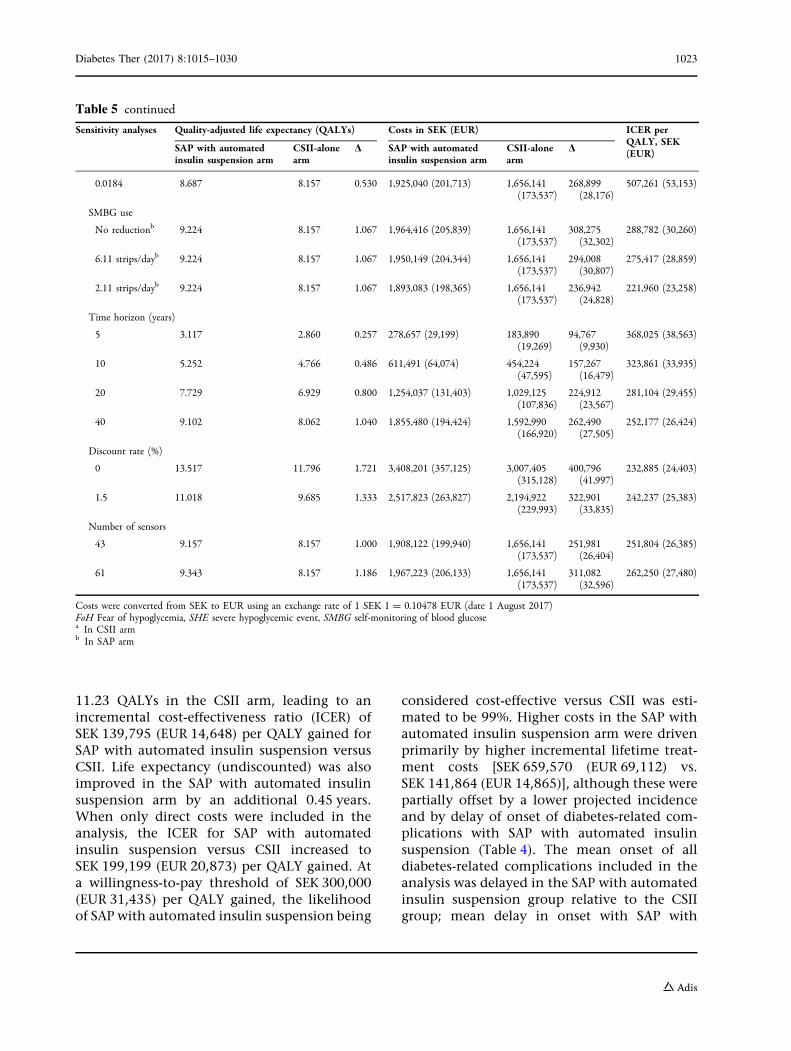
11.23 QALYs in the CSII arm, leading to anincremental cost-effectiveness ratio (ICER) ofSEK 139,795 (EUR 14,648) per QALY gained forSAP with automated insulin suspension versusCSII. Life expectancy (undiscounted) was alsoimproved in the SAP with automated insulinsuspension arm by an additional 0.45 years.When only direct costs were included in theanalysis, the ICER for SAP with automatedinsulin suspension versus CSII increased toSEK 199,199 (EUR 20,873) per QALY gained. Ata willingness-to-pay threshold of SEK 300,000(EUR 31,435) per QALY gained, the likelihoodof SAP with automated insulin suspension being
considered cost-effective versus CSII was esti-mated to be 99%. Higher costs in the SAP withautomated insulin suspension arm were drivenprimarily by higher incremental lifetime treat-ment costs [SEK 659,570 (EUR 69,112) vs.SEK 141,864 (EUR 14,865)], although these werepartially offset by a lower projected incidenceand by delay of onset of diabetes-related com-plications with SAP with automated insulinsuspension (Table 4). The mean onset of alldiabetes-related complications included in theanalysis was delayed in the SAP with automatedinsulin suspension group relative to the CSIIgroup; mean delay in onset with SAP with
Table 5 continued
Sensitivity analyses Quality-adjusted life expectancy (QALYs) Costs in SEK (EUR) ICER perQALY, SEK(EUR)SAP with automated
insulin suspension armCSII-alonearm
D SAP with automatedinsulin suspension arm
CSII-alonearm
D
0.0184 8.687 8.157 0.530 1,925,040 (201,713) 1,656,141(173,537)
268,899(28,176)
507,261 (53,153)
SMBG use
No reductionb 9.224 8.157 1.067 1,964,416 (205,839) 1,656,141(173,537)
308,275(32,302)
288,782 (30,260)
6.11 strips/dayb 9.224 8.157 1.067 1,950,149 (204,344) 1,656,141(173,537)
294,008(30,807)
275,417 (28,859)
2.11 strips/dayb 9.224 8.157 1.067 1,893,083 (198,365) 1,656,141(173,537)
236,942(24,828)
221,960 (23,258)
Time horizon (years)
5 3.117 2.860 0.257 278,657 (29,199) 183,890(19,269)
94,767(9,930)
368,025 (38,563)
10 5.252 4.766 0.486 611,491 (64,074) 454,224(47,595)
157,267(16,479)
323,861 (33,935)
20 7.729 6.929 0.800 1,254,037 (131,403) 1,029,125(107,836)
224,912(23,567)
281,104 (29,455)
40 9.102 8.062 1.040 1,855,480 (194,424) 1,592,990(166,920)
262,490(27,505)
252,177 (26,424)
Discount rate (%)
0 13.517 11.796 1.721 3,408,201 (357,125) 3,007,405(315,128)
400,796(41,997)
232,885 (24,403)
1.5 11.018 9.685 1.333 2,517,823 (263,827) 2,194,922(229,993)
322,901(33,835)
242,237 (25,383)
Number of sensors
43 9.157 8.157 1.000 1,908,122 (199,940) 1,656,141(173,537)
251,981(26,404)
251,804 (26,385)
61 9.343 8.157 1.186 1,967,223 (206,133) 1,656,141(173,537)
311,082(32,596)
262,250 (27,480)
Costs were converted from SEK to EUR using an exchange rate of 1 SEK 1 = 0.10478 EUR (date 1 August 2017)FoH Fear of hypoglycemia, SHE severe hypoglycemic event, SMBG self-monitoring of blood glucosea In CSII armb In SAP arm
Diabetes Ther (2017) 8:1015–1030 1023
automated insulin suspension ranged from0.1 years for microalbuminuria to 0.44 years forend-stage renal disease.
Sensitivity analysis showed that for thispatient group the ICER was most sensitive tochanges in severe hypoglycemic event rate inthe CSII arm as such events can be associatedwith substantial medical resource use and highdirect costs (Table 5). When the severe hypo-glycemic event rate in the CSII arm was reducedto 1 per 100 patient-months the ICER increasedto SEK 204,442 (EUR 21,422) per QALY gained.However, when the event rate for CSII wasincreased to 8 severe hypoglycemic events per100 patient-months SAP with automated insu-lin suspension was dominant relative to CSII.
Cohort with Uncontrolled HbA1cat Baseline
In the base-case analysis for this patient group,SAP with automated insulin suspension wasassociated with higher total lifetime costs thanCSII [SEK 1,925,040 (EUR 201,713) vs.SEK 1,656,141 (EUR 173,537)] and higher qual-ity-adjusted life expectancy (9.22 vs. 8.16QALYs), resulting in an ICER of SEK 251,896(EUR 26,395) per QALY gained for SAP withautomated insulin suspension versus CSII(Table 3). If only direct costs were included inthe analysis, the ICER increased to SEK 328,323(EUR 34,403) per QALY gained. The higher costsin the SAP with automated insulin suspensionarm were driven by higher lifetime treatmentcosts [SEK 467,551 (EUR 48,992) vs. SEK 99,090(EUR 10,383)], which were partially offset bylower complication costs due to a delay in onsetand reduced cumulative incidence of dia-betes-related complications in the SAP withautomated insulin suspension arm. For thispatient group, at a willingness-to-pay thresholdof SEK 300,000 (EUR 31,435), the likelihood ofSAP with automated insulin suspension beingconsidered cost-effective compared with CSIIwas 58%, which increased to 74% at a willing-ness-to-pay threshold of SEK 360,000(EUR 37,722) per QALY gained and to 84% at athreshold of SEK 420,000 (EUR 44,009) perQALY gained. In the SAP with automated
insulin suspension arm the mean onset of dia-betes-related complications included in theanalysis was delayed by at least 0.6 years(Table 4). The most pronounced delays in onsetof a long-term diabetes-related complicationwas for neuropathy, with an onset delay of amean of 1.04 years in the SAP with automatedinsulin suspension arm relative to the CSII arm.
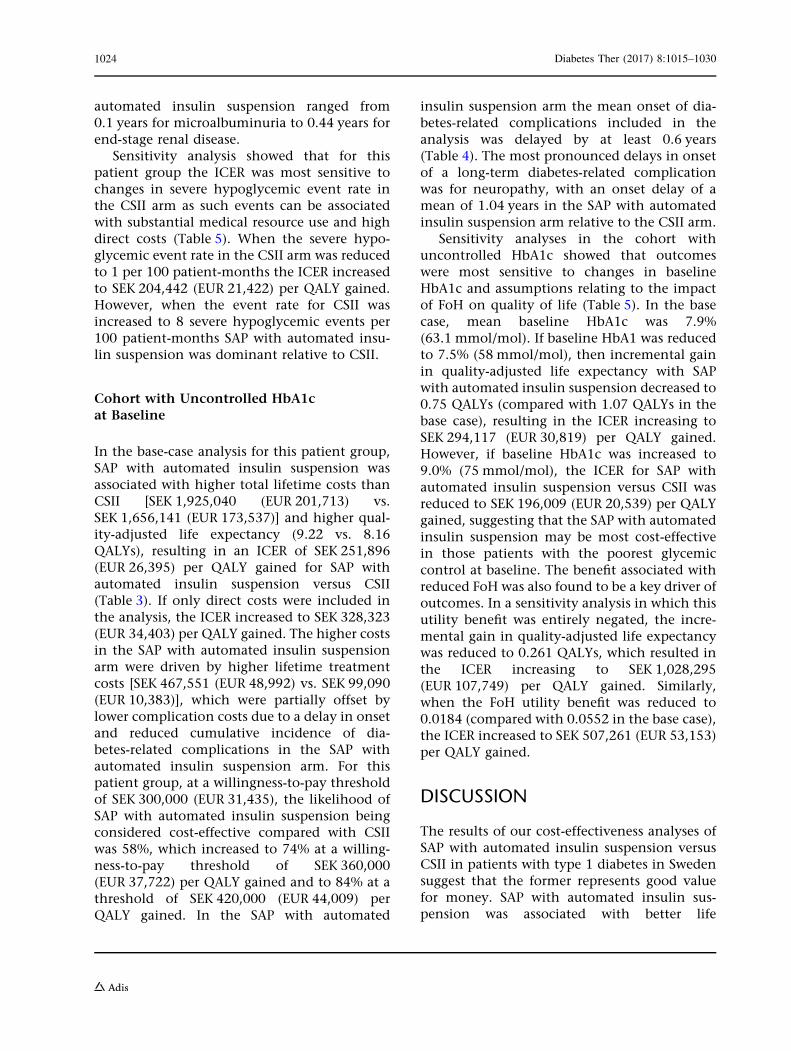
Sensitivity analyses in the cohort withuncontrolled HbA1c showed that outcomeswere most sensitive to changes in baselineHbA1c and assumptions relating to the impactof FoH on quality of life (Table 5). In the basecase, mean baseline HbA1c was 7.9%(63.1 mmol/mol). If baseline HbA1 was reducedto 7.5% (58 mmol/mol), then incremental gainin quality-adjusted life expectancy with SAPwith automated insulin suspension decreased to0.75 QALYs (compared with 1.07 QALYs in thebase case), resulting in the ICER increasing toSEK 294,117 (EUR 30,819) per QALY gained.However, if baseline HbA1c was increased to9.0% (75 mmol/mol), the ICER for SAP withautomated insulin suspension versus CSII wasreduced to SEK 196,009 (EUR 20,539) per QALYgained, suggesting that the SAP with automatedinsulin suspension may be most cost-effectivein those patients with the poorest glycemiccontrol at baseline. The benefit associated withreduced FoH was also found to be a key driver ofoutcomes. In a sensitivity analysis in which thisutility benefit was entirely negated, the incre-mental gain in quality-adjusted life expectancywas reduced to 0.261 QALYs, which resulted inthe ICER increasing to SEK 1,028,295(EUR 107,749) per QALY gained. Similarly,when the FoH utility benefit was reduced to0.0184 (compared with 0.0552 in the base case),the ICER increased to SEK 507,261 (EUR 53,153)per QALY gained.
DISCUSSION
The results of our cost-effectiveness analyses ofSAP with automated insulin suspension versusCSII in patients with type 1 diabetes in Swedensuggest that the former represents good valuefor money. SAP with automated insulin sus-pension was associated with better life
1024 Diabetes Ther (2017) 8:1015–1030

expectancy and quality-adjusted life expectancybut higher costs relative to CSII, leading toICERs of SEK 139,795 (EUR 14,648) per QALYgained for patients at increased risk for hypo-glycemia and SEK 251,896 (EUR 26,395) perQALY gained for patients with uncontrolledHbA1c at baseline. It should also be noted thatin analyses such as those presented here, forinterventions that improve life expectancy thislonger life expectancy can contribute to a ‘‘sur-vival paradox’’ whereby patients accrue directcosts and experience complications over alonger period of time owing to higher lifeexpectancy. Although there is no official will-ingness-to-pay threshold in Sweden, for bothpatient groups the ICERs estimated in the pre-sent analysis fall below a willingness-to-paythreshold of SEK 500,000 (EUR 52,392) perQALY gained. Indeed, at this threshold theprobability of SAP with automated insulin sus-pension being considered cost-effective versusCSII exceeds 98% in both patient populations inthe current analysis.
CSII is widely used in Sweden relative tomany other European settings; in 2013, therewere an estimated 10,000 patients using CSII,although figures on the proportion using SAPare lacking [35]. Further, the assessment of CSIIby the Swedish Council on Health TechnologyAssessment (SBU) reported that CSII is the firstchoice treatment modality for young childrenwith recently diagnosed type 1 diabetes. Use ofCSII in adults is typically limited to thosepatients who cannot achieve adequate glycemiccontrol on MDI, although data from the Swed-ish NDR suggest that this may be a sizable pro-portion of the overall type 1 diabetespopulation. Additionally, the SBU assessment ofCGM, despite noting high levels of patient sat-isfaction with SAP, acknowledged that there is ageneral reluctance to offer CGM to adults inSweden, even though short-term use has beenshown to improve HbA1c [36]. The SBU reporton CGM also highlighted uncertainty aroundthe effect of CGM on rates of severe hypo-glycemic events and ketoacidosis. However,since publication of that report, clinical evi-dence has accrued which suggests that SAP withautomated insulin suspension contributes to areduced incidence of hypoglycemic events,
particularly nocturnal hypoglycemic events[12, 13, 16, 21].
Sensitivity analyses in the cohort withuncontrolled HbA1c showed that SAP withautomated insulin suspension was mostcost-effective in those patients with poorestglycemic control at baseline. This is likely dri-ven by the fact that the incremental benefits ofSAP with automated insulin suspension (interms of improved HbA1c) are likely to be mostpronounced in those patients with the worstglycemic control at baseline. Indeed, the treat-ment effect in terms of HbA1c reduction wassourced from formulae published by Pickupet al. [23] that take into account baselineHbA1c, in that patients with higher baselineHbA1c values have greater reductions in HbA1cthat those with lower baseline HbA1c values.The resultant improvement in glycemic controlwith SAP with automated insulin suspension isa key driver of long-term outcomes. Patientswith poor glycemic control are known to be atincreased risk of diabetes-related complications.Data from the Swedish setting indicate thatrelative to the general population, type 1 dia-betes patients with HbA1c levels of [7.8%(62 mmol/mol) have a more than threefoldhigher hazard ratio (HR) for all-cause mortalityand a more than fourfold HR for cardiovascularmortality [37]. Additionally, data from the NDRsuggest that the proportion of type 1 diabetespatients in Sweden not achieving good gly-cemic control, particularly in the younger agegroups, may be substantial. For example, in onesingle-center retrospective longitudinal study inpatients aged 18–24 years in Sweden, less than10% patients had a mean HbA1c of B7.0%(53 mmol/mol) during the study period. Fur-ther, 22% of 24-year-olds and [50% of 18-year-olds had mean HbA1c values C9.1%(76 mmol/mol) [38]. In another analysis, alsousing NDR data from a total of 7454 patientsaged 20–65 years, a total of 3268 (44%) patientshad HbA1c levels of 8.0–11.9% (64–107 mmol/mol) at the start of the study [37].Additionally, in Sweden, patients with poorglycemic control are also more likely to initiateinsulin pump therapy, with this likelihoodincreasing in a non-linear fashion with higherHbA1c. For example, in one large-scale study
Diabetes Ther (2017) 8:1015–1030 1025

involving [7000 patients, the HR for CSII ini-tiation in patients with HbA1c values of C9.8%(83 mmol/mol) relative to those with HbA1cvalues of\6.0% (\42 mmol/mol) was 5.65 (95%confidence interval 2.98–10.72) [39]. Takentogether, these figures suggest that, in Sweden,there is potentially a substantial number ofpatients with type 1 diabetes for whom switch-ing to SAP with automated insulin suspensioncould be both clinically beneficial and cost-ef-fective. In this patient cohort the impact of SAPwith automated insulin suspension in terms ofreduced FoH was also a key driver of outcomes.FoH has been shown to be particularly pro-nounced at night, and it also influences manyaspects of disease management including diet,physical activity and insulin dosing, to theextent that some patients may deliberately tol-erate higher blood glucose levels in order tolessen the risk of hypoglycemia [40]. For thesepatients, switching to SAP, especially advancedSAP devices with an automated insulin suspen-sion feature, may help to alleviate the consid-erable burden associated with FoH whilesimultaneously enabling better glycemiccontrol.
Sensitivity analysis in the cohort withuncontrolled HbA1c at baseline showed thatoutcomes were also influenced by the frequencyof sensor use. Quality-adjusted life expectancywas 9.34 QALYs when a sensor use of 61 per yearwas assumed (compared with 9.22 QALYs with49 sensors per year in the base-case analysis),but total costs in the SAP with automatedinsulin suspension arm also increased toSEK 1,967,223 (EUR 206,133). These projectedoutcomes are in line with findings from theSTAR 3 trial, which reported that the magnitudeof clinical benefit associated with SAP wasinfluenced by the frequency of sensor use, withhigher rates of sensor use being associated withbetter glycemic control [41]. In the STAR 3 trial,patients who used the sensor 0–20% of the timehad a HbA1c reduction (from baseline to 1 year)of -0.43%, whereas for patients who used thesensor 81–100% of the time the reduction inHbA1c was -1.21%.
In the cohort at increased risk for hypo-glycemic events the projected incidence of sev-ere hypoglycemic events was a key driver of
outcomes. Severe hypoglycemic events,although rare for most patients, can havepotentially catastrophic consequences, includ-ing coma and even death; recent data have alsoindicated that a history of severe hypoglycemicevents may lead to an elevated risk of mortalityfollowing cardiovascular events [42]. Theseevents may also be associated with extensivemedical resource use and high direct medicalcosts. In the current analysis, the direct cost of asevere hypoglycemic event was SEK 30,333(EUR 3,178), based on published data fromJonsson et al. [43]. However, the current anal-ysis did not take into account any potentialbenefit in terms of minor hypoglycemic eventsor indirect costs associated with severe hypo-glycemic events. Indirect costs of non-severehypoglycemic events are often overlooked butcan be substantial, with estimates of lost worktime ranging from 8.3 to 15.9 h per month [44].
There are a number of limitations associatedwith the findings of the analysis presented here.Notably, a fundamental limitation common toall health economic modeling analyses is theuse of short-term clinical data to project long--term outcomes. For the analysis in patients atincreased risk of hypoglycemic events, datafrom a clinical trial of 6 months duration inpatients aged 5–49 years were utilized. TheCORE diabetes model was developed using datafrom adult type 1 diabetes populations; as such,the inclusion of clinical input data from chil-dren and adolescents may limit the accuracy ofprojected long-term clinical outcomes for suchpatients. A further limitation is the relativelysmall-scale nature of the trial, which enrolledfewer than 100 patients. However, long-term,large-scale studies comparing SAP with auto-mated insulin suspension versus CSII are lack-ing; therefore, the use of short-term clinicaldata represents the best available proxy forprojecting long-term outcomes.
The findings of the current analysis concurwith those of a previous cost-effectivenessanalysis conducted in Sweden, which reportedan ICER of SEK 367,571 (EUR 38,516) per QALYgained for SAP versus CSII [45]. However, SAPtechnology has advanced since the publicationof this earlier analysis, with new features, suchas predictive low glucose suspension, improving
1026 Diabetes Ther (2017) 8:1015–1030
clinical benefits and, therefore, the cost-effec-tiveness of SAP. More recent analyses of SAPwith automated insulin suspension versus CSIIhave been conducted in type 1 diabetes patientsin other settings, including the UK [46], France[47] and Denmark [48]. The findings of theseanalyses concur with those of the presentanalysis in suggesting that SAP with automatedinsulin suspension is cost-effective comparedwith CSII in particular groups of type 1 diabetespatients in the UK, France and Denmark as wellas Sweden.
Overall, the findings of our analysis suggestthat in Sweden, for type 1 diabetes patients whocontinue to experience poor glycemic control,or severe hypoglycemic events despite CSII use,switching to SAP with automated insulin sus-pension is likely to represent a cost-effectivetreatment alternative.
ACKNOWLEDGEMENTS
The study was funded by Medtronic Interna-tional Trading Sarl, Tolochenaz, Switzerland.Medtronic International Trading Sarl also fun-ded the article processing charges for thismanuscript. All authors had full access to all ofthe data in this analysis and take completeresponsibility for the integrity of the data andaccuracy of the data analysis.All named authors meet the International
Committee of Medical Journal Editors (ICMJE)criteria for authorship for this manuscript, takeresponsibility for the integrity of the work as awhole, and have given final approval for theversion to be published.Simona de Portu, Alexis Delbaere, Natalie
Papo, Johan Jendle and Stephane Roze con-tributed to the design of the analysis, StephaneRoze performed the analysis, Jayne Smith-Pal-mer prepared the first draft of the manuscript.William Valentine, Simona de Portu, AlexisDelbaere, Natalie Papo and Johan Jendle con-tributed to, reviewed and revised the first draftand subsequent drafts.
Disclosures. Stephane Roze is a currentemployee of HEVA HEOR, which has received
consulting fees from Medtronic. JayneSmith-Palmer is a current employee of OssianHealth Economics and Communications,which has received consulting fees fromMedtronic. William Valentine is a currentemployee of Ossian Health Economics andCommunications, which has received con-sulting fees from Medtronic. Simona de Portuowns shares in and is a current employee ofMedtronic International Trading Sarl. AlexisDelbaere is a current employee of MedtronicInternational Trading Sarl. Natalie Papo ownsshares in and is a current employee of Med-tronic International Trading Sarl. Johan Jen-dle has received honoraria from Medtronicfor lectures and participating in advisoryboards.
Compliance with Ethics Guidelines. Thisanalysis does not contain data from any newstudies with human or animal subjects per-formed by any of the authors.
Data Availability. The datasets analyzedduring the current study are available from thecorresponding author on request.
Open Access. This article is distributedunder the terms of the Creative CommonsAttribution-Non Commercial 4.0 InternationalLicense (http://creativecommons.org/licenses/by-nc/4.0/), which permits any non-commercial use, distribution, and reproductionin any medium, provided you give appropriatecredit to the original author(s) and the source,provide a link to the Creative Commons license,and indicate if changes were made.
REFERENCES
1. Swedish National Diabetes Register. Annual report2013. https://www.ndr.nu/pdfs/Annual_Report_NDR_2013.pdf. Accessed 19 Oct 2016.
2. Jendle JH, Rawshani A, Svensson AM, Avdic T,Gudbjornsdottir S. Indications for insulin pumptherapy in type 1 diabetes and associations withglycemic control. J Diabetes Sci Technol.2016;10:1027–33.
Diabetes Ther (2017) 8:1015–1030 1027

3. Skogsberg L, Fors H, Hanas R, Chaplin JE, LindmanE, Skogsberg J. Improved treatment satisfaction butno difference in metabolic control when usingcontinuous subcutaneous insulin infusion vs. mul-tiple daily injections in children at onset of type 1diabetes mellitus. Pediatr Diabetes. 2008;9:472–9.
4. Fredheim S, Johansen A, Thorsen SU, et al.Nationwide reduction in the frequency of severehypoglycemia by half. Acta Diabetol.2014;52:591–9.
5. Jeitler K, Horvath K, Berghold A, et al. Continuoussubcutaneous insulin infusion versus multiple dailyinsulin injections in patients with diabetes mellitus:systematic review and meta-analysis. Diabetologia.2008;51:941–51.
6. Monami M, Lamanna C, Marchionni N, MannucciE. Continuous subcutaneous insulin infusion versusmultiple daily insulin injections in type 1 diabetes:a meta-analysis. Acta Diabetol. 2010;47(Suppl1):77–81.
7. Misso ML, Egberts KJ, Page M, O’Connor D, Shaw J(2010) Continuous subcutaneous insulin infusion(CSII) versus multiple insulin injections for type 1diabetes mellitus. Cochrane Database Syst Rev.20(1):CD005103.
8. Steineck I, Cederholm J, Eliasson B, Register Swed-ish National Diabetes, et al. Insulin pump therapy,multiple daily injections, and cardiovascular mor-tality in 18,168 people with type 1 diabetes: obser-vational study. BMJ. 2015;350:h3234.
9. Battelino T, Conget I, Olsen B, et al., and theSWITCH Study Group (2012) The use and efficacyof continuous glucose monitoring in type 1 dia-betes treated with insulin pump therapy: a ran-domised controlled trial. Diabetologia. 55:3155–62.
10. O’Connell MA, Donath S, O’Neal DN, et al. Gly-caemic impact of patient-led use of sensor-guidedpump therapy in type 1 diabetes: a randomisedcontrolled trial. Diabetologia. 2009;52:1250–7.
11. Leelarathna L, Thabit H, Hartnell S, et al.;AP@home Consortium (2016) Rapid benefits ofstructured optimization and sensor-augmentedinsulin pump therapy in adults with type 1 dia-betes. J Diabetes Sci Technol1(1):180-181.
12. Medtronic Inc. MNMiniMed 640G insulin pumpwithSmartGuard�. Medtronic Inc., Minneapolis, MN.https://www.medtronic-diabetes.co.uk/minimed-system/minimed-640g-insulin-pump. Accessed 20July 2017.
13. Choudhary P, Shin J, Wang Y, et al. Insulin pumptherapy with automated insulin suspension inresponse to hypoglycemia: reduction in nocturnal
hypoglycemia in those at greatest risk. DiabetesCare. 2011;34:2023–5.
14. Agrawal P, Zhong A, Welsh JB, Shah R, Kaufman FR.Retrospective analysis of the real-world use of thethreshold suspend feature of sensor-augmentedinsulin pumps. Diabetes Technol Ther.2015;17:316–9.
15. Weiss R, Garg SK, Bode BW, et al. Hypoglycemiareduction and changes in hemoglobin A1c in theASPIRE in-home study. Diabetes Technol Ther.2015;17:542–7.
16. Fonseca VA, Grunberger G, Anhalt H, CommitteeConsensus Conference Writing, et al. Continuousglucose monitoring: a consensus conference of theAmerican Association of Clinical Endocrinologistsand American College of Endocrinology. EndocrPract. 2016;22:1008–21.
17. Peters AL, Ahmann AJ, Battelino T, et al. Diabetestechnology-continuous subcutaneous insulin infu-sion therapy and continuous glucose monitoring inadults: an endocrine society clinical practiceguideline. J Clin Endocrinol Metab.2016;101:3922–37.
18. Palmer AJ, Roze S, Valentine WJ, et al. The COREDiabetes Model: projecting long-term clinical out-comes, costs and cost-effectiveness of interventionsin diabetes mellitus (types 1 and 2) to supportclinical and reimbursement decision-making. CurrMed Res Opin. 2004;20(Suppl 1):S5–26.
19. Palmer AJ, Roze S, Valentine WJ, et al. Validation ofthe CORE diabetes model against epidemiologicaland clinical studies. Curr Med Res Opin.2004;20[Suppl 1]:S27–40.
20. McEwan P, Foos V, Palmer JL, Lamotte M, Lloyd A,Grant D. Validation of the IMS CORE diabetesmodel. Value Health. 2014;17:714–24.
21. Ly TT, Nicholas JA, Retterath A, Lim EM, Davis EA,Jones TW. Effect of sensor-augmented insulinpump therapy and automated insulin suspension vsstandard insulin pump therapy on hypoglycemia inpatients with type 1 diabetes: a randomized clinicaltrial. JAMA. 2013;310:1240–7.
22. Nathan DM, Cleary PA, Backlund JY, Genuth SM,Lachin JM, Orchard TJ, Raskin P, Zinman B. Dia-betes control and complications trial/epidemiologyof diabetes interventions and complications(DCCT/EDIC) study research group. intensive dia-betes treatment and cardiovascular disease inpatients with type 1 diabetes. N Engl J Med.2005;353(25):2643–53.
23. Pickup JC, Freeman SC, Sutton AJ. Glycaemic con-trol in type 1 diabetes during real time continuous
1028 Diabetes Ther (2017) 8:1015–1030
glucose monitoring compared with self monitoringof blood glucose: meta-analysis of randomisedcontrolled trials using individual patient data. BMJ.2011;343:d3805.
24. Lynch P, Attvall S, Persson S, Barsoe C, GerdthamU. Routine use of personal continuous glucosemonitoring system with insulin pump in Sweden[abstract 1052]. Diabetologia. 2012;55[Suppl1]:S432.
25. Statistics Sweden. Salary structures, whole econ-omy. http://www.scb.se/en/finding-statistics/statistics-by-subject-area/labour-market/wages-salaries-and-labour-costs/salary-structures-whole-economy/.Accessed 19 Aug 2016.
26. Beaudet A, Clegg J, Thuresson PO, Lloyd A, McEwanP. Review of utility values for economic modelingin type 2 diabetes. Value Health. 2014;17:462–70.
27. McBride M, Eggleston A, Jones T, Ly T. PDB98—health-related quality of life in patients with type 1diabetes and impaired hypoglycaemia awareness:the role of sensor-augmented insulin pump therapywith automated insulin suspension. Value Health.2013;16(7):A448.
28. Nørgaard K, Scaramuzza A, Bratina N, et al. Sen-sor-augmented pump therapy in real-life: patientsreported outcomes results of the INTERPRETobservational study. Abstract 1058. EuropeanAssociation for the Study of Diabetes, Berlin 2012.
29. Nørgaard K, Scaramuzza A, Bratina N, et al. Routinesensor-augmented pump therapy in type 1 diabetes:the INTERPRET study. Diabetes Technol Ther.2013;15:273–80.
30. Currie CJ, Morgan CL, Poole CD, et al. Multivariatemodels of health-related utility and the fear ofhypoglycaemia in people with diabetes. Curr MedRes Opin. 2006;22:1523–34.
31. Statistics Sweden. Average monthly salary by sector1992–2015. http://www.scb.se/en_/Finding-statistics/Statistics-by-subject-area/Labour-market/Wages-salaries-and-labour-costs/Salary-structures-whole-economy/Aktuell-Pong/14374/149087/. Accessed4 Nov 2016.
32. Sørensen J, Ploug, Uffe J (2013) The cost of dia-betes-related complications: registry-based analysisof days Absent from Work. Econ Res Int.2013:e618039. doi:10.1155/2013/618039
33. Tandvards-Och Lakemedelsformansverket 2003.General guidelines for economic evaluations fromthe Pharmaceutical Benefits Board (LFNAR 2003:2).http://www.tlv.se/Upload/English/Guidelines-for-economic-evaluations-LFNAR-2003-2.pdf. Accessed20 Oct 2016.
34. Yeh HC, Brown TT, Maruthur N, et al. Comparativeeffectiveness and safety of methods of insulindelivery and glucose monitoring for diabetes mel-litus: a systematic review and meta-analysis. AnnIntern Med. 2012;157:336–47.
35. Swedish Council on Health Technology Assess-ment. Insulin pumps for diabetes [Internet]. Stock-holm: Swedish Council on Health TechnologyAssessment (SBU); 22 Oct 2013. https://www.ncbi.nlm.nih.gov/books/NBK316443/pdf/Bookshelf_NBK316443.pdf. Accessed 21 Oct 2016.
36. Swedish Council on Health Technology Assess-ment. Continuous subcutaneous glucose monitor-ing for diabetes [Internet]. Stockholm: SwedishCouncil on Health Technology Assessment (SBU);2013. https://www.ncbi.nlm.nih.gov/pubmedhealth/PMH0084407/pdf/PubMedHealth_PMH0084407.pdf. Accessed 21 Oct 2016.
37. Lind M, Svensson AM, Kosiborod M, et al. Glycemiccontrol and excess mortality in type 1 diabetes.N Engl J Med. 2014;371:1972–82.
38. Sparud-Lundin C, Ohrn I, Danielson E, ForsanderG. Glycaemic control and diabetes care utilizationin young adults with Type 1 diabetes. Diabet Med.2008;25:968–73.
39. Carlsson BM, Andersson PN, Alnervik J, CarstensenJ, Lind M. Availability of insulin pump therapy inclinical practice. Diabet Med. 2012;29:1055–9.
40. Martyn-Nemeth P, Schwarz Farabi S, Mihailescu D,Nemeth J, Quinn L. Fear of hypoglycemia in adultswith type 1 diabetes: impact of therapeutic advan-ces and strategies for prevention—a review. J Dia-betes Complications. 2016;30:167–77.
41. Bergenstal RM, Tamborlane WV, Ahmann A et al.STAR 3 Study Group (2010) Effectiveness of sen-sor-augmented insulin-pump therapy in type 1diabetes. N Engl J Med. 363:311–20.
42. Lung TW, Petrie D, Herman WH, et al. Severehypoglycemia and mortality after cardiovascularevents for type 1 diabetic patients in Sweden. Dia-betes Care. 2014;37:2974–81.
43. Jonsson L, Bolinder B, Lundkvist J. Cost of hypo-glycemia in patients with Type 2 diabetes in Swe-den. Value Health. 2006;9:193–8.
44. Brod M, Christensen T, Thomsen TL, Bushnell DM.The impact of non-severe hypoglycemic events onwork productivity and diabetes management. ValueHealth. 2011;14:665–71.
45. Roze S, Saunders R, Brandt AS, de Portu S, Papo NL,Jendle J. Health-economic analysis of real-time
Diabetes Ther (2017) 8:1015–1030 1029
continuous glucose monitoring in people withType 1 diabetes. Diabet Med. 2015;32:618–26.
46. Roze S, Smith-Palmer J, Valentine WJ, Cook M,Jethwa M, de Portu S, Pickup JC. Long-term healtheconomic benefits of sensor-augmented pumptherapy vs continuous subcutaneous insulin infu-sion alone in type 1 diabetes: a UK perspective.J Med Econ. 2016;19(3):236–42.
47. Roze S, Smith-Palmer J, Valentine W, Payet V, dePortu S, Papo N, Cucherat M, Hanaire H. Cost-ef-fectiveness of sensor-augmented pump therapywith low glucose suspend versus standard insulinpump therapy in two different patient populationswith type 1 diabetes in France. Diabetes TechnolTher. 2016;18(2):75–84.
48. Roze S, de Portu S, Smith-Palmer J, Delbaere A,Valentine W, Ridderstrale M. Cost-effectiveness of
sensor-augmented pump therapy versus standardinsulin pump therapy in patients with type 1 dia-betes in Denmark. Diabetes Res Clin Pract.2017;128:6–14.
49. Henriksson F. Applications of economic models inhealthcare: the introduction of pioglitazone inSweden. Pharmacoeconomics. 2002;20(Suppl1):43–53.
50. DRG costs for Sweden. http://sas.lf.se/kppprod/rap_vikt_tot_2004.htm.
51. Ghatnekar O, Persson U, Willis M, Odegaard K.Cost effectiveness of Becaplermin in the treatmentof diabetic foot ulcers in four European countries.Pharmacoeconomics. 2001;19:767–78.
1030 Diabetes Ther (2017) 8:1015–1030