Embed Size (px)
Citation preview

1
Cost-effective Trace Element Analysis with TXRF

2
Welcome
Your HostAlexander Seyfarth Product Manager XRFElemental & Process AnalysisBruker AXS
Today’s Topics• Introduction to XRF and
TXRF• The S2 PICOFOX
benchtop TXRF system• Why wait for sample
prep?• Application studies
• Environment• Medical/Pharma• Mining
• Summary• Interactive Q & A
Speakers
Dr. Michael Rider, Applications Scientist XRF, Madison, WI, USA
Dr. Armin Gross, Global Product Manager TXRF, Berlin, Germany

3
Introduction to XRF and TXRF Michael Rider

4
Principles of X-ray Fluorescence (XRF) Spectroscopy
1
2
3 3
2
11. An X-ray quantum hits an inner
shell electron in a (sample) atom.The electron is removed leaving the atom in an excited state.
2. The missing inner shell electron is replaced by an electron from an outer shell.
3. The energy difference between the inner and outer shell is balanced by the emission of a photon quantum (fluorescence radiation).

5
Principles of X-ray Fluorescence Spectroscopy
■ The energy, and therefore the wavelength, of the X-ray fluorescence radiation is characteristic for the different chemical elements.
QUALITATIVE ANALYSIS
■ The intensity of the X-ray fluorescence radiation is, in first approximation, proportional to the element concentration.
QUANTITATIVE ANALYSIS
Low z High z

6
Principles of X-ray Fluorescence Spectroscopy
“Common” XRF optics
Beam angle: 45o / 45o
X-ray tube
Sample
Detector
7
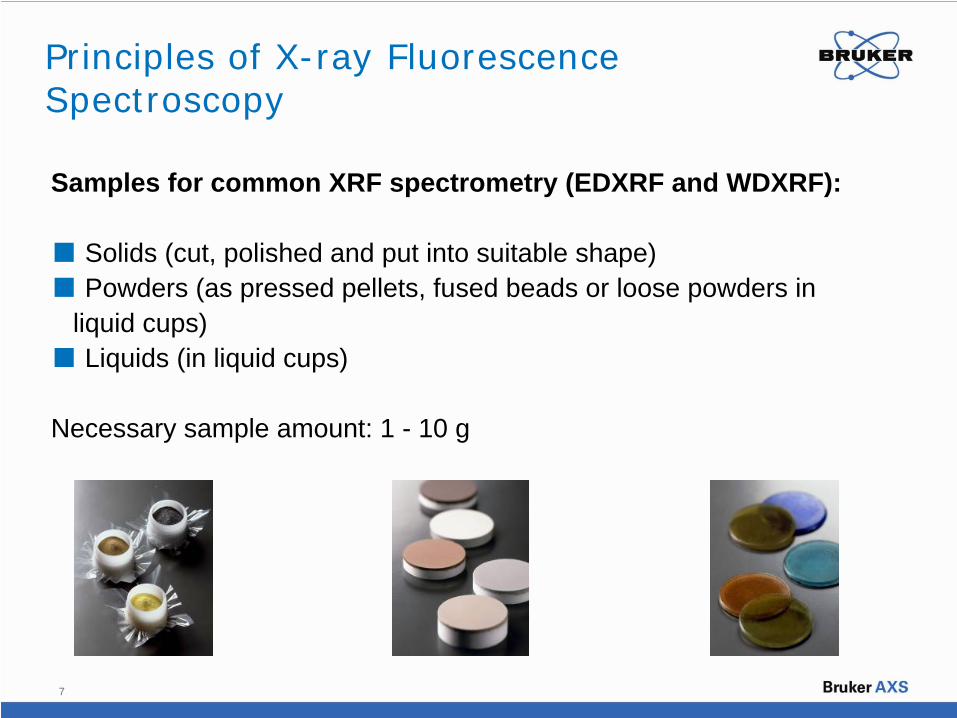
Principles of X-ray Fluorescence Spectroscopy
Samples for common XRF spectrometry (EDXRF and WDXRF):
■ Solids (cut, polished and put into suitable shape)■ Powders (as pressed pellets, fused beads or loose powders in
liquid cups)■ Liquids (in liquid cups)
Necessary sample amount: 1 - 10 g

8
Principles of Total Reflection X-ray Fluorescence (TXRF) Spectroscopy
Total reflection X-ray fluorescence spectroscopy
Beam angle: 0o / 90o
X-ray tube
Detector
Sample carrier

9
Principles of Total Reflection X-ray Fluorescence Spectroscopy
Samples:
Powders: direct preparation or as a suspension
Liquids: direct preparationAlways as a thin film, micro fragment
or suspension of a powderNecessary sample amount: Low µg /
µl range

10
absorption of primary beamand fluorescence radiation
secondary fluorescenceenhancement
Quantification in common X-ray fluorescence spectroscopy
Ii = f ( ci , cj) and ci = f ( Ii , cj)
Principles of X-ray Fluorescence Spectroscopy

11
Principles of Total Reflection X-ray Fluorescence Spectroscopy
Quantification in total reflection X-ray fluorescence spectroscopy
In TXRF the samples are prepared as thin films or layers.Therefore matrix effects are negligible
QUANTIFICATION IS POSSIBLE BY :■ Known concentration and net intensity of an internal standard element ■ Net intensity of element lines■ Sensitivity of the instrument for element lines (energy-dependent)

12
Negligible absorption of primary beamand fluorescence radiation
Negligible secondary fluorescenceenhancement
Ii = f ( ci ) ci = f ( Ii )
Principles of X-ray Fluorescence Spectroscopy

13
Setup and Working Principle of the S2 PICOFOX
X-ray source
MonochromatorDetector
SampleSample carrierSample changer

14
The S2 PICOFOX

15
Why Wait for Sample Prep! Michael Rider

16
Please use your mouse to answer the question on your screen:
How do you currently treat your samples before analysis? (Check all that apply.)
No treatmentGrindingDissolvingDilutionExtractionDigestion
Audience Poll

17
TXRF Sample Preparation Liquid Sample
Pipette 100 – 1000 µl of sample. Dilute if needed. Add single-element standard solution Homogenize
Transfer to sample carrierDry

18
TXRF Sample Preparation Solid Sample −
Micro-particle
Grind if needed Use Q-tip to deposit on substrate
Add single-element internal standard solution (or skip if one element is known)Dry

19
TXRF Sample Preparation Solid Sample −
Suspension
GrindWeigh out 20 – 50 mg Suspend in about 2.5 ml of suspension solution
Add single-element internal standard solutionPipette 10 µl of the suspension and dry

20
TXRF Sample Preparation Digested Sample
Grind if neededWeigh out 20 – 50 mg
Digest sampleTransfer aliquot of sample Dilute if very high in mineral content

21
TXRF Sample Preparation Digested Sample
Transfer to sample carrierDry
Pipette 100 – 1000 µl of sampleAdd single-element standard solutionHomogenize

22
Environmental, Medical and Pharmaceutical Applications
Dr. Armin Gross

23
S2 PICOFOX Application Overview
Environmental research and monitoring
Description of the application Benefit by TXRF
Sewage & fresh water analysis on-site analysisppb detection limitsfast and simple sample preparation
Aerosol analysis direct sampling on sample carrierdetection limits < 1 ng/m³
Filter analysis direct measurements (qualitatively)simple extraction for quantification
Contaminated soils on-site analysisscreening for contaminated hot spots

24
Analytical task: Control of threshold values for heavy metals in:
raw and digested sewage samplesfresh water
Sample preparationdilution (raw sewage)remark: filtration and separate analysis of filtrate is possibleinternal standardizationpreparation (homogenization, vacuum drying) of 10 µl sample solution
Measurementmeasurement time: 1000 s
Application Sewage & Fresh Water Analysis

25
0
0
1
10
100
1000
10000
0 0 1 10 100 1000 10000
ICP-OES values (mg/l)
TXR
F va
lues
(mg/
l)
digestedraw (undiluted)raw (diluted)
Results
Application Sewage & Fresh Water Analysis
Hg
Pb
Ni
Cu
Cr,Mn,Fe
S,P,K
Ca

26
Detection limits
1000 s measurement time
standard configuration
Application Sewage & Fresh Water Analysis
ppb
1
10
100
1000
0 10 20 30 40 50 60 70 80 90
Atomic number
Det
ectio
n lim
it (µ
g/l)
digestedraw
PITTCON 2008!PITTCON 2008!
“high efficiency module” for higher sensitivity 30 mm2 XFlash®

27
S2 PICOFOX Application Overview
Medical and pharmaceutical
Description of the application Benefit by TXRF
Blood, serum and urine ppb detection limitsfast and simple sample preparation
Impurities in nutrients/pharma comparable results than AAS simultaneous analysis
Authenticity element fingerprint ease of sample prep
“Heavy Metals” Analysis USP requirements (10 ppm) readily achievablemobile use
USP = US Pharmacopia
28
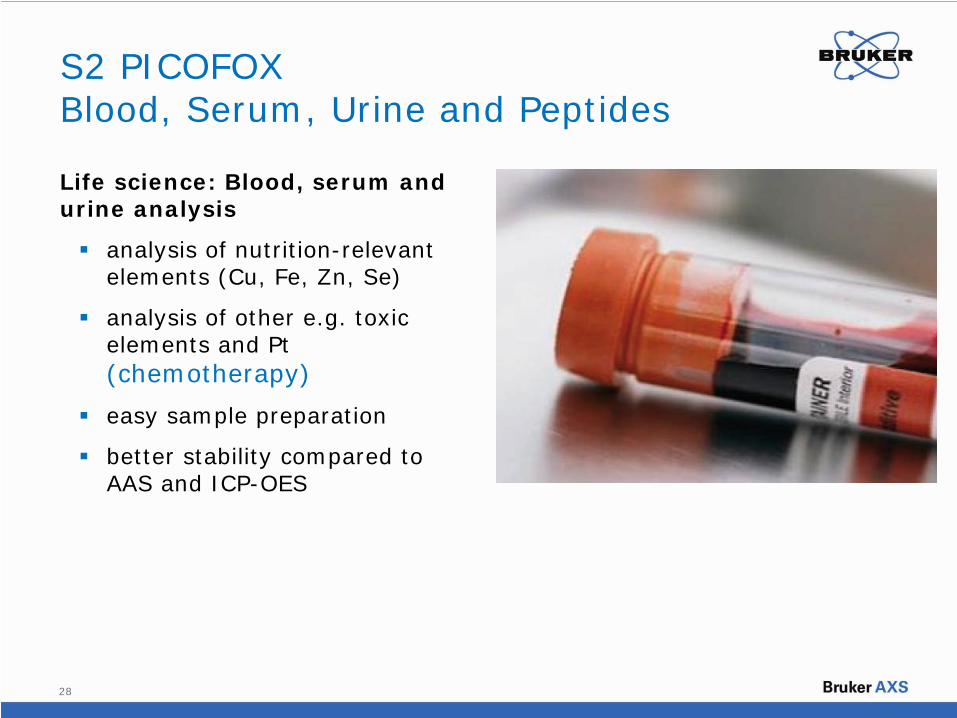
S2 PICOFOX Blood, Serum, Urine and Peptides
Life science: Blood, serum and urine analysis
analysis of nutrition-relevant elements (Cu, Fe, Zn, Se)
analysis of other e.g. toxic elements and Pt (chemotherapy)
easy sample preparation
better stability compared to AAS and ICP-OES

29
S2 PICOFOX Blood Analysis
Sample preparation:
Serum1:10 dilution with water (p.a. grade)Addition of Ga for internal standardization
Full blood1:1 dilution with water (p.a. grade)Addition of Ga for internal standardization

30
S2 PICOFOX Blood Analysis
Serum reference standards, diluted, measurement time: 600 s
10
100
1000
10000
10 100 1000 10000
TXRF values (µg/l)
Ref
eren
ce v
alue
s (µ
g/l)
FeCuZnSe
good correlation for Cu, Zn and Seoverestimation of Feimproved calibration curve required*
Remark: Confidence level of reference values is up to 35 % (!)
31
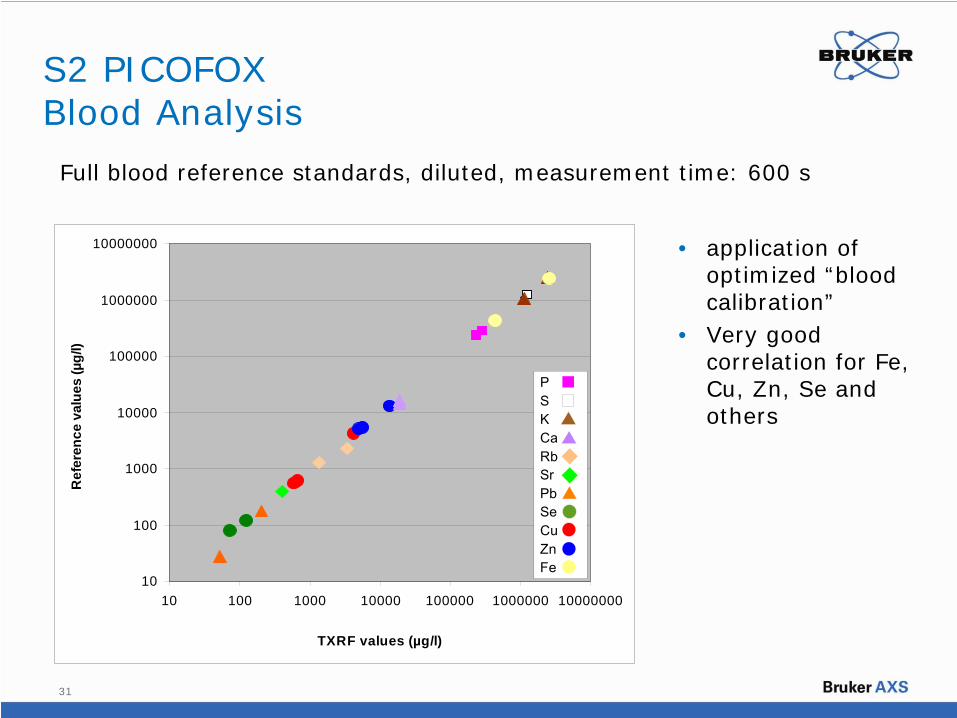
S2 PICOFOX Blood Analysis
Full blood reference standards, diluted, measurement time: 600 s
• application of optimized “blood calibration”
• Very good correlation for Fe, Cu, Zn, Se and others
10
100
1000
10000
100000
1000000
10000000
10 100 1000 10000 100000 1000000 10000000
TXRF values (µg/l)
Ref
eren
ce v
alue
s (µ
g/l)
PSKCaRbSrPbSeCuZnFe

32
S2 PICOFOX Blood Analysis
Reproducibility
1): Sector-Field Inductively-Coupled Plasma Mass Spectroscopy2): Atomic Adsorption Spectroscopy
Serum (ClinCheck L2) Whole blood (Seronorm L2)
Element Unit TXRF s (n=5) Reference 1) s TXRF s (n=5) Reference 2) s
Fe mg/l 440 7,4 435 12 2,9 0,09 1,964 0,20
Cu µg/l 66 2,2 62 2,1 1685 43 1562 312
Zn µg/l 501 4,9 504 6,9 2194 118 2225 334
Se µg/l 12 0,29 12 1,0 97 18 102 26
33
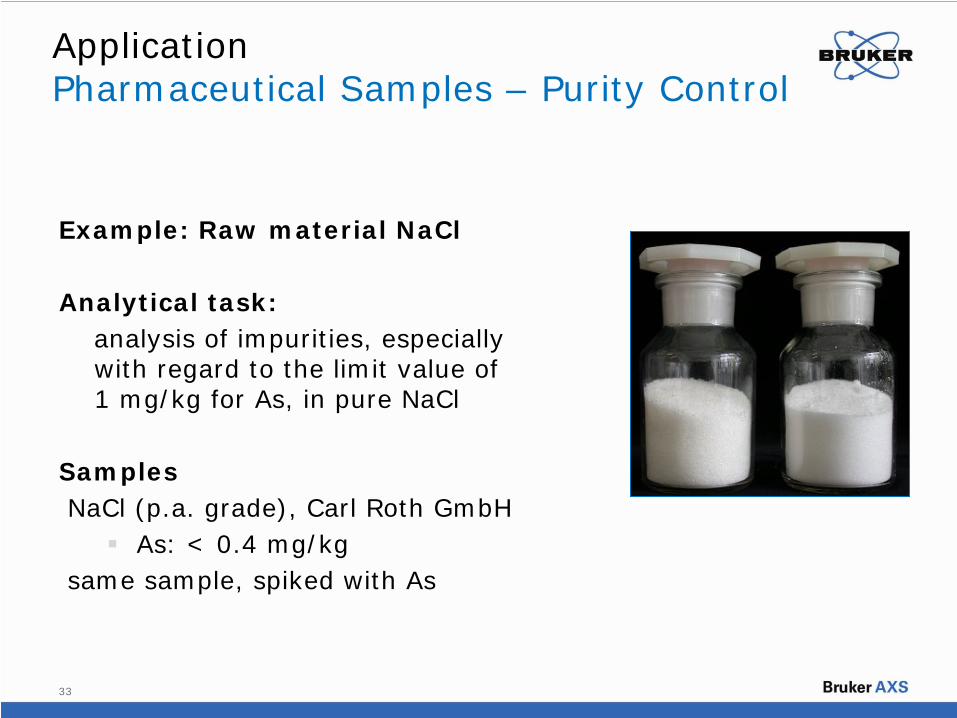
Example: Raw material NaCl
Analytical task: analysis of impurities, especially with regard to the limit value of 1 mg/kg for As, in pure NaCl
SamplesNaCl (p.a. grade), Carl Roth GmbH
As: < 0.4 mg/kgsame sample, spiked with As
Application Pharmaceutical Samples – Purity Control

34
Application Pharmaceuticals - Purity Control
Recovery results:
y = 1,1157x + 0,0986R2 = 0,9972
0,0
1,0
2,0
3,0
4,0
5,0
0,0 1,0 2,0 3,0 4,0 5,0
Spiked As (mg/kg)
Mea
sure
d va
lues
As
(mg/
kg)
Trace element concentrations of Ca, Ti, Cr, Fe, Ni, Cu, Zn and Br were determined simultaneously

35
Application Pharmaceuticals – Purity Control
Detection limits
600 sec
Conc. LLD
(mg/l)
Ca 2,4 0,57
Ti 1,8 0,25
Cr 0,85 0,17
Fe 11 0,13
Ni 0,29 0,09
Cu 0,34 0,08
Zn 0,33 0,07
As 1,2 0,07
Se (i.s.) 20 0,07
Br 19 0,08

36
More Applications Alexander Seyfarth

37
Application Reading Tea Leaves
Elemental content such as Pb, Tl, As and Cd is regulated to be less than 10 ppm
“organic” labeling might also imply that no preservation (fumigation) was performed
Inspection of the leaves by
a) Screening of pulverized materialb) Precision analysis on digested
material

38
Application Food/Nutrients – Tea Leaves
Precision analysis on “hot” samples:Microwave digestion, digested solution measured both on TXRF and Graphite Furnace AAS
identical results for Pb with both techniquesTXRF found Br as well, indication of fumigated by methyl bromide
Screening for more than one element More determinations per sample for a service lab No calibration needed!

39
Fortunes are made using exploration techniques:
Description of the application Benefit by TXRF
PGE and indicator elements simple qualitative analysis direct or digested sample quantification ppb levels
mobile use in trailer
simultaneous determination
faster than AAS/ICP
S2 PICOFOX Digging for Gold

40
S2 PICOFOX Exploration Samples
Analytical task: Check for trace elements in directly prepared sediment samples
Sample preparationfine grinding to less than 10 μm
internal standardizationmixingslurry prep on substrate
Measurementmeasurement time: 600 s

41
S2 PICOFOX Exploration Samples

42
S2 PICOFOX Au and Pt in Exploration
Good correlation between digested diluted, digested and raw samples
“Fit for purpose” choiceAqua regia or HNO3 digestions can be directly applied on the substrate and measured after drying
High loaded solutions can be diluted and measured“Fit for purpose” choice
Preparation can yield clues about the dissemination of the elements

43
S2 PICOFOX CRM SARM7-B
Spike: 0 mg/kg
Spike: 10 mg/kg
Spike: 20 mg/kg
Spike: 30 mg/kg
Spike: 40 mg/kg
Ref.
(mg/kg) Conc.
(mg/kg) Conc.
(mg/kg) Conc.
(mg/kg) Conc.
(mg/kg) Conc.
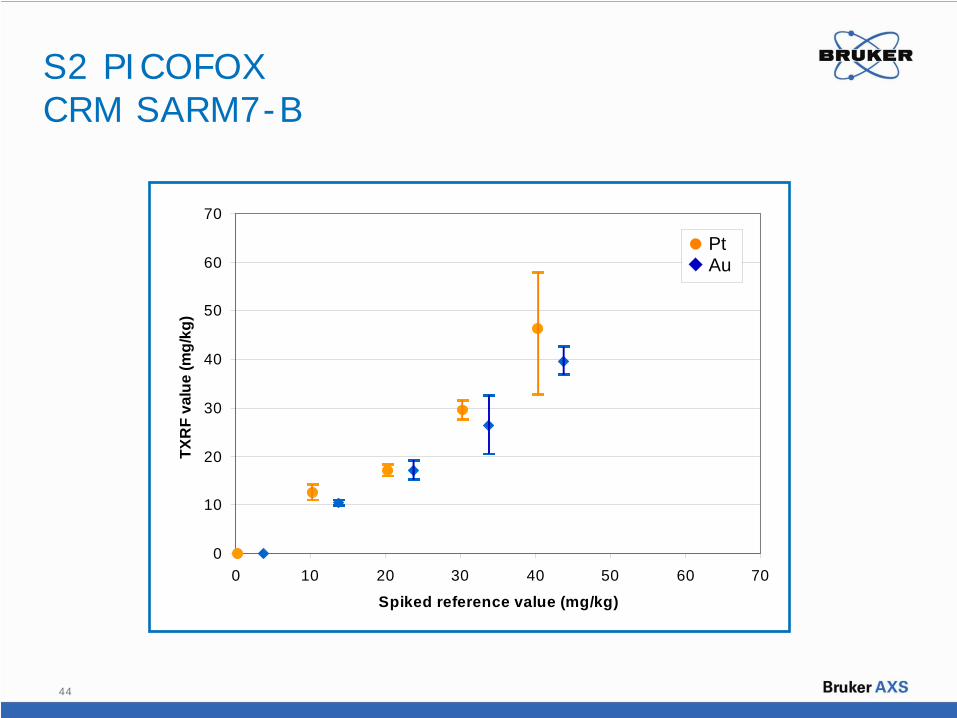
(mg/kg) Pt 3.74 not det. 10.4 +/- 0.6 17.2 +/- 2.0 26.5 +/- 6.0 39.7 +/- 2.8 Au 0.27 not det. 12.6 +/- 1.5 17.2 +/- 1.2 29.6 +/- 1.9 46.3 +/- 11.6
Pt 3σ LLD 2.8 mg/kgAu 3σ LLD 1.5 mg/kg
Higher LLD due to high Zn matrix interference
44
S2 PICOFOX CRM SARM7-B
0
10
20
30
40
50
60
70
0 10 20 30 40 50 60 70
Spiked reference value (mg/kg)
TXR
F va
lue
(mg/
kg)
PtAu

45
PGE Analysis After NiS Melt-Digestion
0,1
1
10
100
1000
10000
100000
0,1 1 10 100 1000 10000 100000
ICP-MS [µg/kg]
TXR
F [µ
g/kg
]
RhIrPtAu
geologicalsamples
automotivecatalysts
46
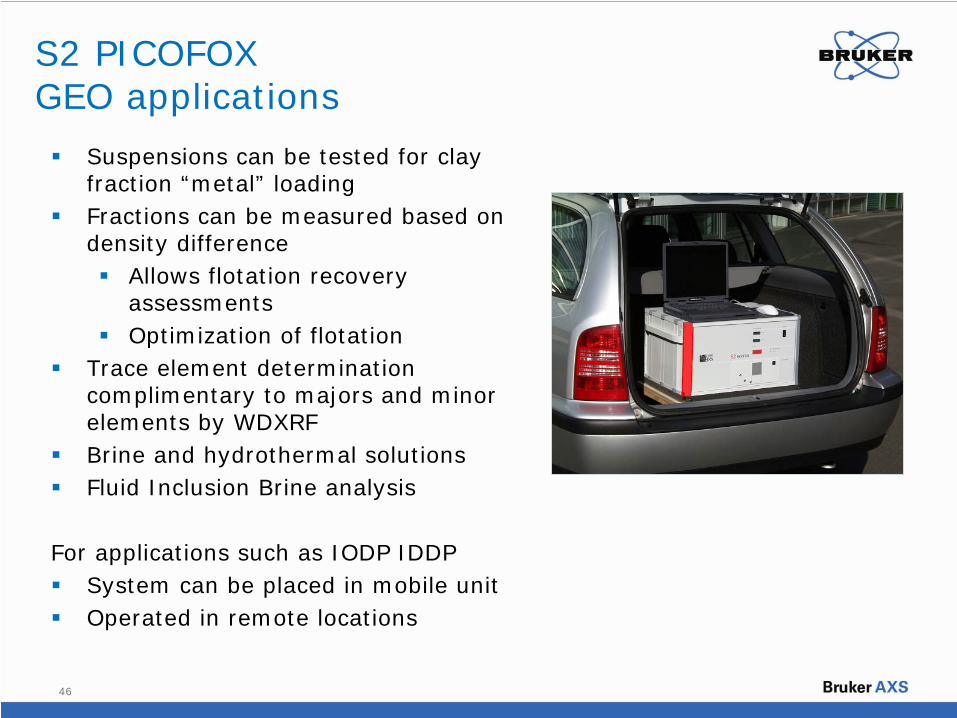
S2 PICOFOX GEO applications
Suspensions can be tested for clay fraction “metal” loadingFractions can be measured based on density difference
Allows flotation recovery assessmentsOptimization of flotation
Trace element determination complimentary to majors and minor elements by WDXRFBrine and hydrothermal solutionsFluid Inclusion Brine analysis
For applications such as IODP IDDP System can be placed in mobile unit Operated in remote locations

47
Task
determination of the element ratios inZnS-coated CdSe nanoparticles
Analytical challenges
R&D → only smallest (µg-range) sample amounts available need to reused!
demand for non-destructive analysis
sample material is almost insoluble: NO DIGESTION was possible
Application possible with TXRF!
No reference material!
Applications From Geo to Nano

48
Results
Measured ratios of 3 samples versus target value ( )
S2 PICOFOX “Standardless” analysis
Application Characterization of Nanoparticles
Element Ratios of Nano Particles
Sample 2Sample 1
Sample 3
10
1
4
0
2
4
6
8
10
12
Zn/S Cd/Se Zn/Cd
Rat
io (w
t.-%
)
49
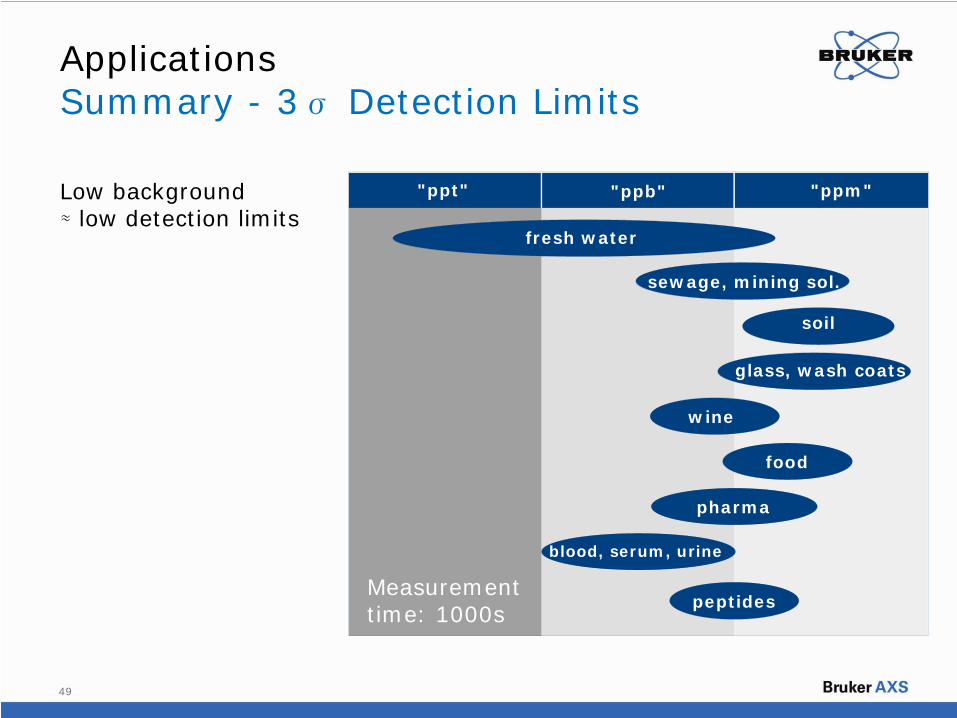
Applications Summary - 3σ
Detection Limits
Low background ≈
low detection limits"ppt" "ppb" "ppm"
fresh water
sewage, mining sol.
soil
glass, wash coats
wine
food
pharma
blood, serum, urine
peptidesMeasurement time: 1000s

50
Let’s Compare. . . Armin Gross
51
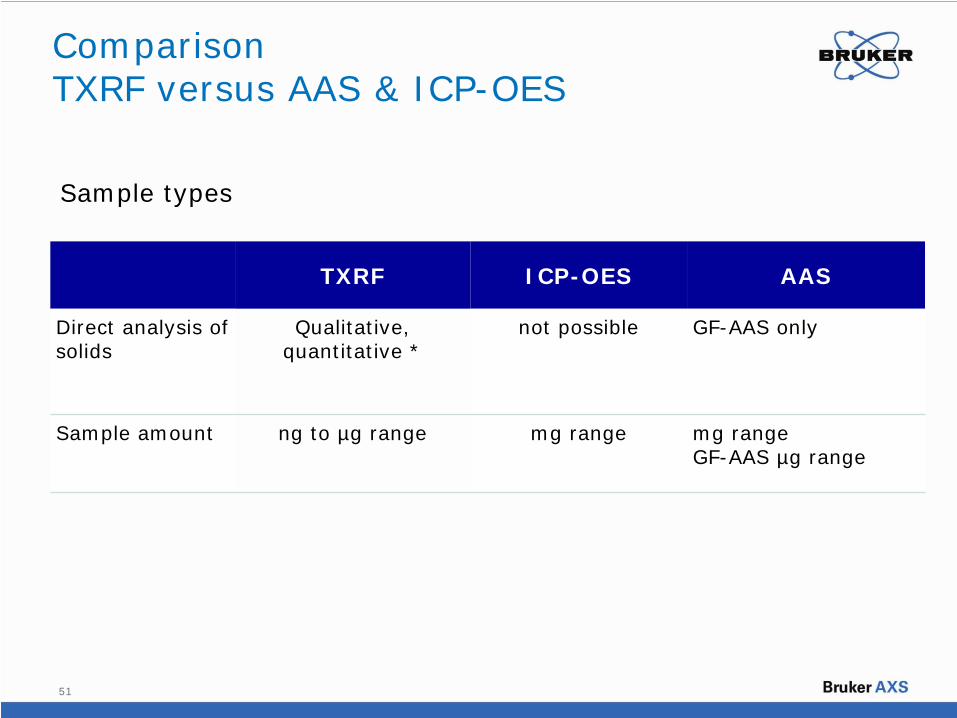
Comparison TXRF versus AAS & ICP-OES
TXRF ICP-OES AAS
Direct analysis of solids
Qualitative, quantitative *
not possible GF-AAS only
Sample amount ng to µg range mg range mg range GF-AAS µg range
Sample types

52
TXRF ICP-OES AAS
Multielement analysis
Yes Yes Sequential only
Standardless Yes (with restrictions)
Yes No
Meas. time 300 – 1000 s <10 s per element <10 s per element
Calibration Internal standardization
External, element- specific, to be
updated
External, element- specific, to be
updated
Comparison TXRF versus AAS & ICP-OES
During operation

53
TXRF ICP-OES AAS
Consumables (X-ray tube) (Nebulizer parts) Cathode lamps
Power consumption
Low (150 W) High (HF generator 2.5 – 3.6 kW)
Low
Water consumption
none > 0,5 l/min ~1.5 l/min (GF only)
Gas consumption
none Carrier/burning gas (Ar, N2 ), 15-20 l/min
FAAS: burning gas (C2 H2 ), 1.5-8 l/min
GF: Carrier gas (Ar,N2 )
Comparison TXRF versus AAS & ICP-OES
Cost of operation

54
The S2 PICOFOX can be an alternative to AAS and/or a
complement for existing ICP-OES systems
Major benefits of the S2 PICOFOX
flexibility with regard to sample types
easy multi-element analysis without external calibration
low maintenance and operating costs
small size of the system (mobile and remote location use)
Comparison TXRF versus AAS & ICP-OES

55
Any Questions?
Please type any questions you may have for any of our speakers in the Q&A box and then
click Send.

56
Thank you for attending!
Please take a moment to complete the brief survey on your screen. Your feedback is very important to us.
Copies of this presentation and related TXRF resource materials will be emailed to you.

57 www.bruker-axs.com
Meet us at:SME: Feb.24-27 in Salt Lake City, UT
PITTCON: Mar 1-7 in New Orleans LA
TMS: Mar. 9-13 in New Orleans LA
IFT: June 28th-Jul 1st in New Orleans, LADenver X-ray Conference: Aug 4-8 in Denver, CO
XRF for YOU Seminar – NorthwestSeattle, Washington, Apr 25
A free 1-day seminar on theory, instrumentation, preparation and application of EDXRF and WDXRF