Embed Size (px)
Citation preview

Cost-Effective Manufacturing of Compact TDLAS Sensors for
Hazardous Area Applications Michael B. Frish∗a, Matthew C. Laderera, Clinton J. Smitha, Ryan Ehidb, Joseph Dallasb
aPhysical Sciences Inc., 20 New England Business Center, Andover, MA, USA 01810-1077 bAvo Photonics Inc., 700 Business Center Drive, Suite 125, Horsham, PA 19044
ABSTRACT
Tunable Diode Laser Absorption Spectroscopy (TDLAS) is finding ever increasing utility for industrial process measurement and control. The technique’s sensitivity and selectivity benefit continuous concentration measurements of specific gas components in complex gas mixtures which are often laden with liquids or solid particulates. Tradeoff options among optical path length, absorption linestrength, linewidth, cross-interferences, and sampling methodology enable sensor designers to optimize detection for specific applications. Emerging applications are demanding increasing numbers of distributed miniaturized sensors at diminishing costs. In these applications, the TDLAS specificity is a key attribute, and its high sensitivity enables novel sampling package designs with short optical pathlengths. This paper describes a miniature hermetically-sealed backscatter TDLAS transceiver package designed for high-volume production at acceptable cost. Occupying a volume less than 1in3 and weighing less than 0.06 lb, the transceiver is a key component of TDLAS sensors intended for in-situ measurements of potentially explosive gas mixtures.
Keywords: TDLAS, Laser Sensing, Gas Analysis, Optical Design, Optics Packaging, Optics Manufacturing
1. INTRODUCTION
The optical spectroscopic technology known as Tunable Diode Laser Absorption Spectroscopy (TDLAS) is a robust configurable trace gas sensing technique deployed for industrial process monitoring and control, quality assurance, environmental sensing, plant safety, and infrastructure security.1-12 Unlike spectroscopic analyzers that probe spectral bands (e.g. NDIR), TDLAS capitalizes on the ~100 MHz spectral resolution of Distributed Feedback (DFB) lasers to probe individual spectral lines, thus limiting cross-sensitivities among vapor species in spectrally-complex mixtures. Utilizing sensitive detection techniques such as Wavelength Modulation Spectroscopy (WMS)13-16, industrial quality TDLAS sensors generally provide excellent accuracy and linearity over three orders of magnitude dynamic range for spectral absorbances of less than 10-3 with precision, expressed as noise-equivalent absorbance, usually better than 10-5/Hz½, limited generally by coherent optical effects rather than electronic noise. TDLAS sensors thus offer a combination of sensitivity, specificity (i.e. freedom from cross-sensitivity to non-target gases), fast response, dynamic range, linearity, ease of operation and calibration, ruggedness, and portability not usually available in alternative sensor technologies.
While TDLAS is commonly perceived as a trace gas detection technique, novel adaptations of mature TDLAS platforms address applications that demand continuous accurate and precise measurement of specific analytes, but not necessarily trace concentrations, in complex gas mixtures, often laden with liquids or solid particulates, in harsh environments. Examples include measuring the moisture content of natural gas within pipelines or in the airflow of heat treatment furnaces, and oxygen content in hydrocarbon vapors such as oil, liquid fuel, and natural gas storage tanks. Since TDLAS is a “non-contact” technique, wherein only the low-power laser beam needs to probe the sample, the analyte need not contact electrical components, making the technique suitable for use in potentially explosive hazardous area installations. Particularly useful is the backscatter configuration, wherein the laser beam projects from a transceiver into the sampling area and scatters from a non-cooperative surface within the area (Figure 1). The portion of the scattered light returned to the transceiver contains information from which analyte concentration is deduced. Enabled by the state-of-the-art low-cost low-power TDLAS platforms, like that of Figure 2, handheld standoff leak detectors based on
∗[email protected]; phone 1 978 689-0003; fax 1 978 689-3232; psicorp.com

backscatter TDLAS are now in use worldwide for walking surveys of natural gas transmission and distribution pipeline networks.17
Emerging applications for this technology, e.g., measuring oxygen in hydrocarbon storage tanks or processing facilities, demand high-volume manufacturing of low-cost, compact and lightweight sensor packages. This paper describes the design of such a hermetically-sealed package, Estimated costs for this critical system component are less than $1000 per unit when produced in lots of 500, approximately a 5x reduction compared to the current state-of-the-art.
Controller, Processor,and Interface
LaserDetector
Transceiver
CO2 Plume
Backscatterat Surface
Figure 1. Backscatter TDLAS.
Figure 2. Battery-powered TDLAS sensor in a 6” x 7” x 1.5” package, consumes < 1W for continuous operation at a 10 Hz data reporting rate, and provides digital interfaces.
2. TECHNOLOGY BACKGROUND
TDLAS sensors rely on well-known absorption spectroscopy principles and sensitive detection techniques. Smaller gaseous molecules absorb energy in narrow bands of wavelengths centered upon specific wavelengths in the electromagnetic spectrum. At wavelengths slightly different than these “absorption lines”, there is little absorption. Figure 3 presents, for example, the absorbance spectra for gaseous CO2 and H2O across a 1 m path at standard temperature and pressure, calculated using the HITRAN database. Upon transmitting the laser beam through a path bearing the analyte, the laser beam is partially attenuated according to the Beer-Lambert relation:
(1)
where:
I0(ν(t)) = launched laser power of wavenumber ν (W)
I(ν(t)) = received laser power after propagation through the absorbing analyte (W)
ν(t) = laser wavenumber (reciprocal of wavelength, cm-1) in time l = optical pathlength through the analyte (m)
α(ν,T,P) = analyte absorption coeff (atm-1m-1) Pg = analyte partial pressure (atm)

2008 2009 2010 2011 2012 2013 2014 2015 2016 2017 2018-0.001
0.000
0.001
0.002
0.003
0.004
0.005
0.006
0.007
Wavelength (nm)
CO2
Water
296 K, 1 atm
Atmospheric Absorption (1 meter path length)
Figure 3. Absorbance versus wavelength for 1 m paths of gaseous CO2 (300ppm) and H2O (10,000ppm).
Figure 4 shows the basic layout and signal analysis of a TDLAS sensor. The simple layout consists of 1) a Laser Transmitter, bearing a DFB laser that repetitively scans its wavelength across the width of a specific target analyte gas absorption line by modulation of the current; 2) an optical Measurement Path; and 3) a photodetector. An optical fiber may conduct the laser beam from its origin at the Laser Transmitter to the Measurement Path. At the beginning of the Measurement Path, the laser beam launches into the gas mixture. At the opposite end the photodetector converts received laser power, attenuated by target gas absorption, into an electrical signal. The Signal Processor unit interprets the electrical signal and outputs information. WMS is the chosen signal processing technique for achieving very high sensitivity, or equivalently very low-noise. Modulated laser current at a frequency (fm) results in intensity modulation at the detector, creating a detector signal component at frequency fm, called F1. As laser current modulates, the laser wavelength also modulates over a specified spectral absorption line. The modulation spans a range of wavelengths, called the modulation depth δ, that is comparable to the analyte’s linewidth. During a single current modulation cycle, the laser wavelength passes through the spectral absorption feature twice, resulting in a component of the detector signal amplitude modulation at 2*fm, called F2. The signal processor demodulates the periodic signal to measure the RMS amplitudes of F1 and F2, and these components are used to calculate the analyte concentration. F1 is a measure of the laser power received at the detector; it is generally free of influences from other sources of optical power, such as sunlight, that are also sensed by the detector. F2 is proportional to the product of received laser power and path-integrated concentration. Thus, the ratio F2/F1 provides a measurement that is directly proportional to analyte abundance and is independent of received laser power (see Fig. 10 below). This feature enables the sensors to correctly track concentrations despite changes in laser power transmitted across the optical path. Such changes can occur for example due to variability in reflectance of illuminated backscatter surfaces, precipitation in the optical path, or thermally-induced movements of optical components affecting alignment. The proportionality constant that converts the measured F2/F1 to concentration is generally determined by calibrating the sensor with a known amount of analyte in the laser path.
=
νo
Wavelength
δ
δ
MolecularTransmission Spectrum
νo+ δ
νo+ δ
νo
Wavelength Modulation
π 2π 3π
Phase
2.6
2.4
2.0
1.8
1.6
2.2
WMS Signal @ 10KHz Modulation
π 2π 3π
Phase
F1
F2
No Analyte
With Analyte
Laser
Control
Signals
Signal
Processing
Electronics
Output
Detector
Focusing
OpticsAbsorbing Gas
Optional Reference Signal
(a)
(b)
Figure 4. (a) TDLAS analyzer components; (b) wavelength modulation spectroscopy (WMS) signal processing: Laser wavenumber (ν) modulates across a spectral absorption line with modulation depth (δ) creating a modulated transmitted signal at the detector.
3. TDLAS EXAMPLE
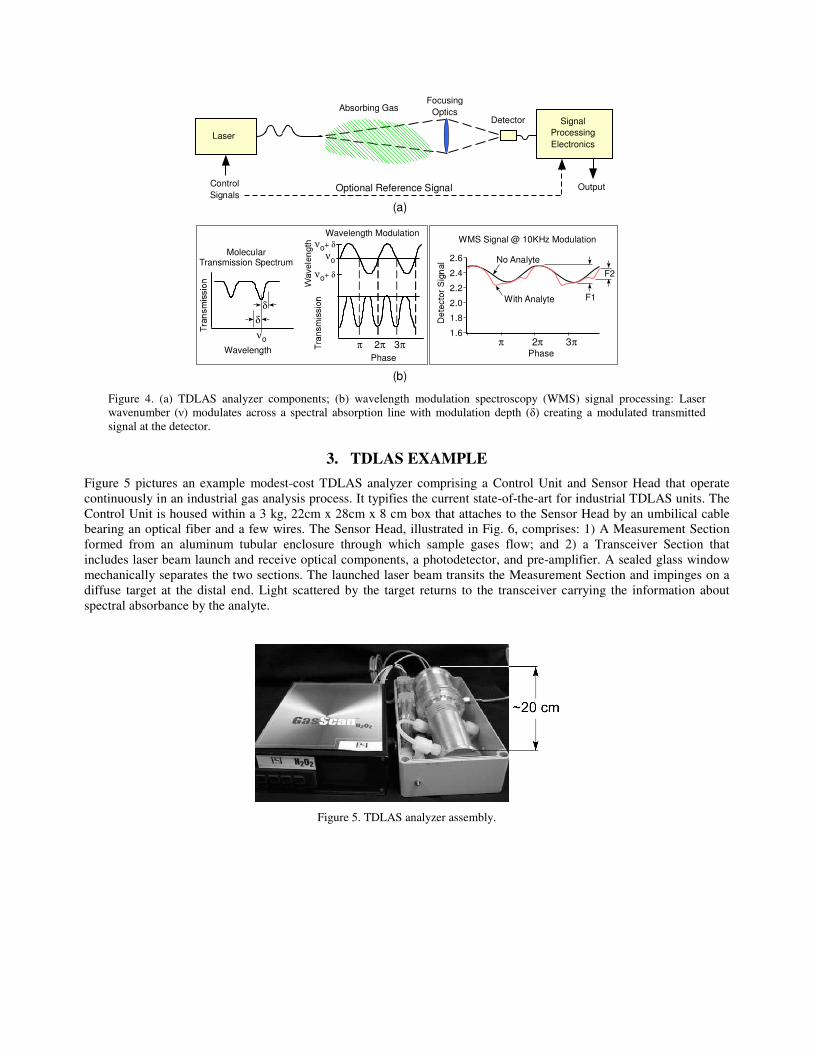
Figure 5 pictures an example modest-cost TDLAS analyzer comprising a Control Unit and Sensor Head that operate continuously in an industrial gas analysis process. It typifies the current state-of-the-art for industrial TDLAS units. The Control Unit is housed within a 3 kg, 22cm x 28cm x 8 cm box that attaches to the Sensor Head by an umbilical cable bearing an optical fiber and a few wires. The Sensor Head, illustrated in Fig. 6, comprises: 1) A Measurement Section formed from an aluminum tubular enclosure through which sample gases flow; and 2) a Transceiver Section that includes laser beam launch and receive optical components, a photodetector, and pre-amplifier. A sealed glass window mechanically separates the two sections. The launched laser beam transits the Measurement Section and impinges on a diffuse target at the distal end. Light scattered by the target returns to the transceiver carrying the information about spectral absorbance by the analyte.
Figure 5. TDLAS analyzer assembly.
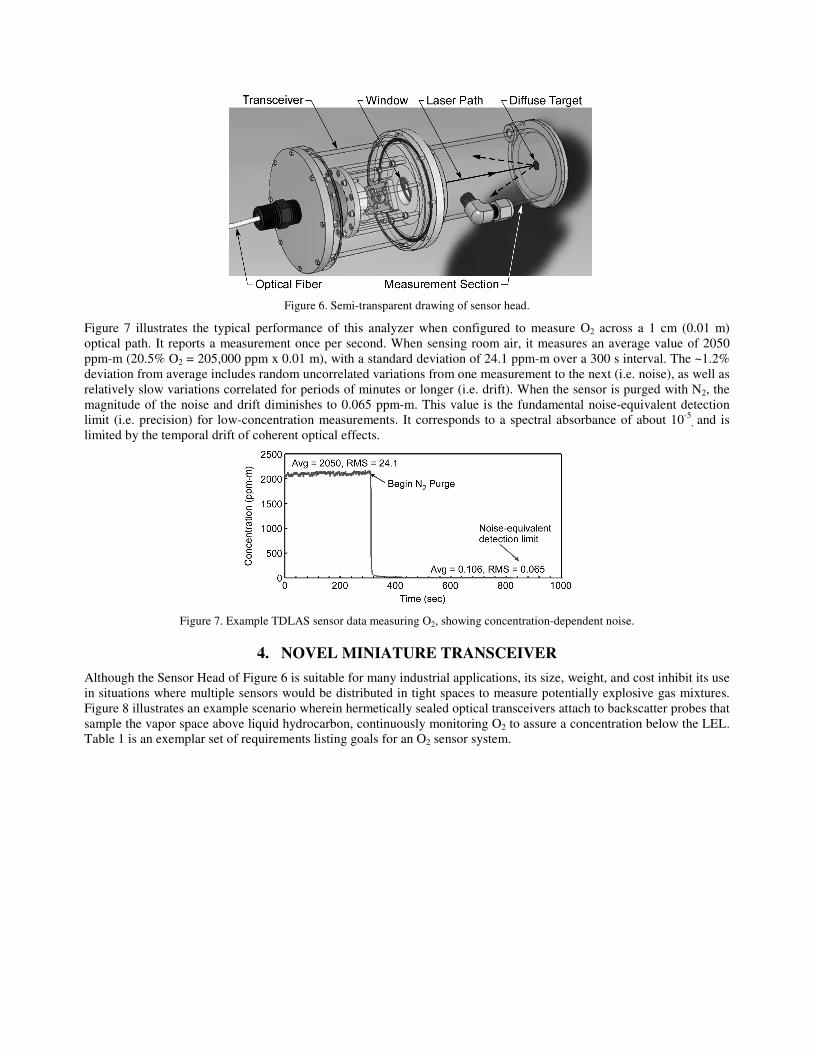
Figure 6. Semi-transparent drawing of sensor head.
Figure 7 illustrates the typical performance of this analyzer when configured to measure O2 across a 1 cm (0.01 m) optical path. It reports a measurement once per second. When sensing room air, it measures an average value of 2050 ppm-m (20.5% O2 = 205,000 ppm x 0.01 m), with a standard deviation of 24.1 ppm-m over a 300 s interval. The ~1.2% deviation from average includes random uncorrelated variations from one measurement to the next (i.e. noise), as well as relatively slow variations correlated for periods of minutes or longer (i.e. drift). When the sensor is purged with N2, the magnitude of the noise and drift diminishes to 0.065 ppm-m. This value is the fundamental noise-equivalent detection limit (i.e. precision) for low-concentration measurements. It corresponds to a spectral absorbance of about 10-5
, and is limited by the temporal drift of coherent optical effects.
Figure 7. Example TDLAS sensor data measuring O2, showing concentration-dependent noise.
4. NOVEL MINIATURE TRANSCEIVER
Although the Sensor Head of Figure 6 is suitable for many industrial applications, its size, weight, and cost inhibit its use in situations where multiple sensors would be distributed in tight spaces to measure potentially explosive gas mixtures. Figure 8 illustrates an example scenario wherein hermetically sealed optical transceivers attach to backscatter probes that sample the vapor space above liquid hydrocarbon, continuously monitoring O2 to assure a concentration below the LEL. Table 1 is an exemplar set of requirements listing goals for an O2 sensor system.

Sensor HeadOptical Module
Sensor HeadSupport Module
ProcessControl
Unit
10%
10"
2"
8"
10%
UserDisplay
CentralizedElectronics Unit
Power(~2W)
SensorHead
InterfaceCable
LaserControl
Electronics
Fiber Optics
1
2 5
6
3
4
Figure 8. Distributed TDLAS sensor system for monitoring hydrocarbon vapor space.
Table 1. Example O2 monitoring system Sensor Head requirements.
Parameter Description
System Configuration • Opto-electronic sensor system comprising multiple Sensor Heads with local electronic support, interfacing with a Centralized Electronics Unit
• Each Sensor Head installs at a process reservoir
Operating Measurement
Range: 0-40% O
2
Accuracy Greater of 1% O2 or 5% of measurement
Precision Greater of 0.5% O2 or 2.5% of measurement
Response Time 1 s
Reliability Self-monitoring; warns of degraded signal due to optical beam blockage or transceiver seal failure
Operating Temp -40 C to 65 C
Sensor Head A sealed transceiver section external to the reservoir, separated by a window from a probe section that inserts into the reservoir
Weight < 0.2 lb
Transceiver
Dimensions <1” diameter x 1.5” length
Probe Length <4” from reservoir wall to probe tip
Probe Diameter < 1”
Power < 2W
Safety Intrinsically Safe; compatible with hydrocarbon vapors
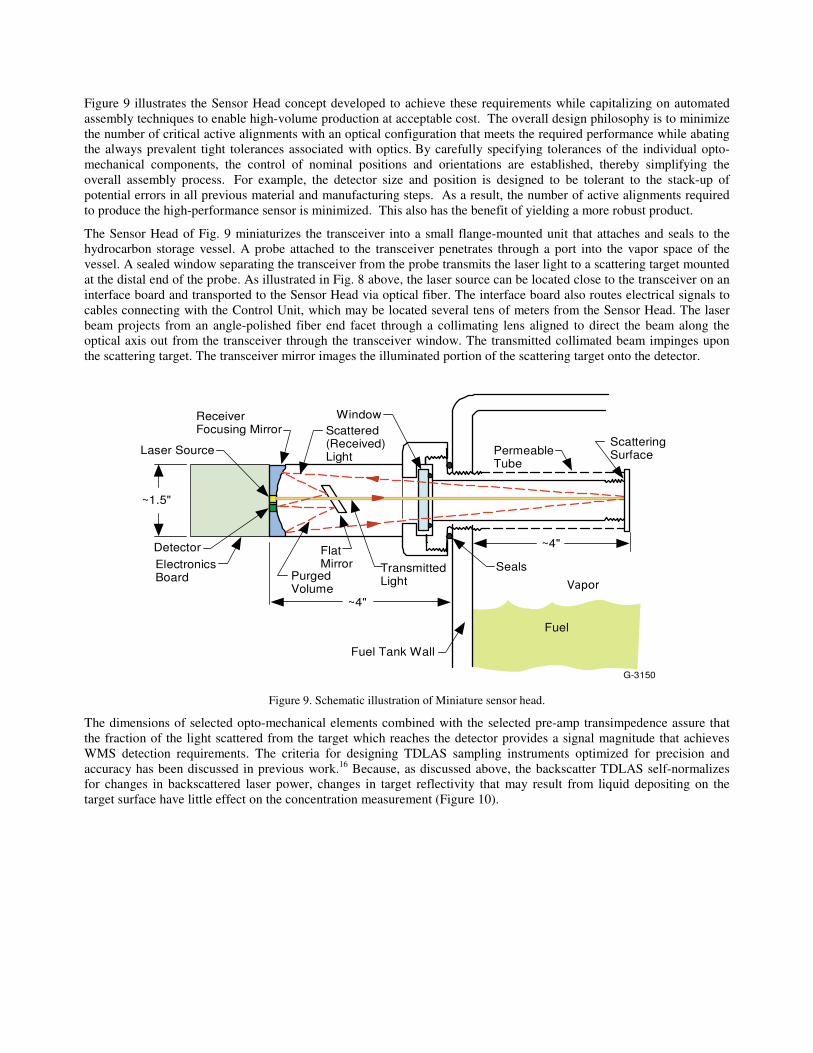
Figure 9 illustrates the Sensor Head concept developed to achieve these requirements while capitalizing on automated assembly techniques to enable high-volume production at acceptable cost. The overall design philosophy is to minimize the number of critical active alignments with an optical configuration that meets the required performance while abating the always prevalent tight tolerances associated with optics. By carefully specifying tolerances of the individual opto-mechanical components, the control of nominal positions and orientations are established, thereby simplifying the overall assembly process. For example, the detector size and position is designed to be tolerant to the stack-up of potential errors in all previous material and manufacturing steps. As a result, the number of active alignments required to produce the high-performance sensor is minimized. This also has the benefit of yielding a more robust product.
The Sensor Head of Fig. 9 miniaturizes the transceiver into a small flange-mounted unit that attaches and seals to the hydrocarbon storage vessel. A probe attached to the transceiver penetrates through a port into the vapor space of the vessel. A sealed window separating the transceiver from the probe transmits the laser light to a scattering target mounted at the distal end of the probe. As illustrated in Fig. 8 above, the laser source can be located close to the transceiver on an interface board and transported to the Sensor Head via optical fiber. The interface board also routes electrical signals to cables connecting with the Control Unit, which may be located several tens of meters from the Sensor Head. The laser beam projects from an angle-polished fiber end facet through a collimating lens aligned to direct the beam along the optical axis out from the transceiver through the transceiver window. The transmitted collimated beam impinges upon the scattering target. The transceiver mirror images the illuminated portion of the scattering target onto the detector.
Fuel
Fuel Tank Wall
ElectronicsBoard
Laser Source
Detector
~1.5"
FlatMirror
ReceiverFocusing Mirror Scattered
(Received)Light
TransmittedLight
Window
Seals
~4"
Ullage
~4"
PermeableTube
ScatteringSurface
G-3150
PurgedVolume
Figure 9. Schematic illustration of Miniature sensor head.
The dimensions of selected opto-mechanical elements combined with the selected pre-amp transimpedence assure that the fraction of the light scattered from the target which reaches the detector provides a signal magnitude that achieves WMS detection requirements. The criteria for designing TDLAS sampling instruments optimized for precision and accuracy has been discussed in previous work.16 Because, as discussed above, the backscatter TDLAS self-normalizes for changes in backscattered laser power, changes in target reflectivity that may result from liquid depositing on the target surface have little effect on the concentration measurement (Figure 10).
Vapor

15
16
17
18
19
20
21
22
23
24
25
0 100 200 300
Time (sec)
% O
2
0
2
4
6
8
10
12
14
f1 R
ece
ived
Po
wer
(RM
S n
W)
concf1
Figure 10. Data demonstrating accurate O2 concentration measurement using a Sensor Head and probe configuration like that of Fig. 9. Spraying the scattering target with liquid contaminant diminishes received laser power represented by the f1 signal while having no effect on the concentration measurement.
To assemble and seal the sensor head, the various optical elements are preferably installed in a Kovar housing. Assembly and alignment is facilitated by means of a precision machined Kovar shuttle element that slides into the housing and, with the aid of an alignment jig, is properly positioned prior to bonding in place in a dry-nitrogen environment. Critical subassemblies are fabricated and tested prior to integration to the whole assembly, e.g the fiber, detector, and lens subassemblies are placed passively in the housing and locked into place. The shuttle is actively aligned to achieve the required centering and pointing of the transmitted beam. The total mass of a hermetically sealed nitrogen-filled Kovar transceiver is approximately 30g.
5. CONCLUSION
The paper has described a miniature hermetically-sealed optical transceiver for Tunable Diode Laser Absorption Spectroscopy applications. The transceiver is intended for use in hazardous areas to monitor potentially explosive gas mixtures. It is designed for cost-effective high-volume production using automated manufacturing processes. Data acquired using initial prototypes demonstrated measurement of ambient oxygen.
REFERENCES
[1] Cooper, D. E. and Martinelli R. U., “Near-infrared diode lasers monitor molecular species,” Laser Focus World, (November 1992)
[2] Bomse, D. S., “Diode Lasers: Finding Trace Gases in the Lab and the Plant,” Photonics Spectra, 29(6) (1995). [3] Frish, M. B. and F. Klein, F., “Trace Gas Monitors based on Tunable Diode Laser Technology: An Introduction and
Description of Applications,” 5th International Symposium on Gas Analysis by Tunable Diode Lasers, Freiburg, Germany, VDI Berichte 1366 (1998).
[4] Druy, M., Frish, M. B. and Kessler, W.J., “From Laboratory Technique to Process Gas Sensor - The Maturation of Tunable Diode Laser Absorption Spectroscopy,” Spectroscopy 21(3), 14-18 (2006).
[5] Frish, M. B., Wainner, R. T., Stafford-Evans, J., Green, B. D., Allen, M. G., Chancey, S., Rutherford, J., Midgley, G. and Wehnert, P., “Standoff Sensing of Natural Gas Leaks: Evolution of the Remote Methane Leak Detector (RMLD),” Invited Paper in Conference on Lasers and Electro-optics/Quantum Electronics and Laser Science and Photonic Applications, Systems and Technologies 2005, Optical Society of America, Washington DC (2005).
[6] Zimmerman, J. W., Locke II, R. A., Blakley, C. S., Frish, M. B., Laderer, M. C. and Wainner, R. T., “Initial testing of prototype tunable diode laser absorption spectrometers for CO2 monitoring applications at the Illinois Basin - Decatur Project”, Energy Procedia 63, 4083-4094 (2014).
[7] Picciaia, D., Zazzeri, G., Gimberini, M. S., and Andreussi, P., “A New Remote Sensing Method for Landfill Emissions Quantification”, Proceedings Sardinia 2011, Thirteenth International Waste Management and Landfill Symposium, S. Margherita di Pula, Cagliari, Italy; 3-7 (October 2011).

[8] Frish, M.B. and Cummings, B. A., “Laser Sensors for Gas Pipeline Explosion Protection,” Final Report prepared for the California Energy Commission under Grant No 57238A/11-01G, PSI-1802/TR-2926, November 2013.
[9] Frish, M. B. and Sonnenfroh, D. M., “TDLAS Analyzers for Energy Production, Transmission, and Storage,” Field Applications in Industry and Research (FLAIR) 2011 Industry Session, Murnau, Germany, PSI VG11-154. (September, 2011).
[10] Frish, M. B., Wehnert, P., Rutherford, J. and Rongere, F., “Continual 24/7 Pipeline Monitoring System for Leakage,” Presentation to American Gas Association Operations Conference, Pittsburgh, PA (May 2014).
[11] Frish, M. B., “Methane Leak Surveying with Small Unmanned Aerial Systems,” Presentation to Gas Technology Institute CH4 Connections 2015 Workshop, The Woodlands, TX (October 2015). http://www.gastechnology.org/CH4/Documents/17-Mickey-Frish-CH4-Presentation-Oct2015.pdf
[12] http://cosaxentaur.com/page/594/xentaur-optical-dew-point [13] Bjorklund, G. C., “Frequency modulation spectroscopy: a new method for measuring weak absorptions and
dispersions,” Opt. Lett. 5(1), 15 (1980). [14] Bomse, D. S., Stanton, A. C. and Silver, J. A., “Frequency Modulation and Wavelength Modulation Spectroscopies:
Comparison of Experimental Methods Using a Lead-Salt Diode Laser,” Applied Optics 31(6), 718-731 (1992). [15] Werle, P.W., Mazzinghi, P., D’Amato, F., De Rosa, M., Maurer, K. and Slemr, F., “Signal processing and
calibration procedures for in situ diode-laser absorption spectroscopy”, Spectrochimica Acta Part A 60, 1685–1705 (2004).
[16] Frish, M. B., Wainner, R. T., Laderer, M. C., Parameswaran, K. R., Sonnenfroh, D. M. and Druy, M. A., “Precision and Accuracy of Miniature Tunable Diode Laser Absorption Spectrometers,” Proc. of SPIE, Vol. 8032, Next-generation Spectroscopic Technologies IV, M.A. Druy and R.A. Crocombe, eds., p.803209-1 (2011)
[17] http://heathus.com/products/methane-leak-detector