Embed Size (px)
Citation preview

This paper is included in the Proceedings of the 18th USENIX Symposium on
Networked Systems Design and Implementation.April 12–14, 2021
978-1-939133-21-2
Open access to the Proceedings of the 18th USENIX Symposium on Networked
Systems Design and Implementation is sponsored by
Cost-effective Cloud Edge Traffic Engineering with CasCara
Rachee Singh, Sharad Agarwal, Matt Calder, and Paramvir Bahl, Microsofthttps://www.usenix.org/conference/nsdi21/presentation/singh

Cost-Effective Cloud Edge Traffic Engineering with CASCARA
Rachee Singh Sharad Agarwal Matt Calder Paramvir BahlMicrosoft
AbstractInter-domain bandwidth costs comprise a significant amountof the operating expenditure of cloud providers. Traffic engi-neering systems at the cloud edge must strike a fine balancebetween minimizing costs and maintaining the latency ex-pected by clients. The nature of this tradeoff is complex dueto non-linear pricing schemes prevalent in the market forinter-domain bandwidth. We quantify this tradeoff and un-cover several key insights from the link-utilization betweena large cloud provider and Internet service providers. Basedon these insights, we propose CASCARA, a cloud edge trafficengineering framework to optimize inter-domain bandwidthallocations with non-linear pricing schemes. CASCARA lever-ages the abundance of latency-equivalent peer links on thecloud edge to minimize costs without impacting latency sig-nificantly. Extensive evaluation on production traffic demandsof a commercial cloud provider shows that CASCARA saves11–50% in bandwidth costs per cloud PoP, while boundingthe increase in client latency by 3 milliseconds1.
1 Introduction
Cloud wide-area networks (WANs) play a key role in enablinghigh performance applications on the Internet. The rapid risein traffic demands from cloud networks has led to widespreadadoption of centralized, software-defined traffic engineering(TE) systems by Google [19] and Microsoft [17] to maximizetraffic flow within the cloud network.
In the quest to overcome BGP’s shortcomings, recent ef-forts have focused on engineering inter-domain traffic, whichis exchanged between the cloud WAN and other networkson the Internet [27, 33]. These systems can override BGP’sbest-path selection, to steer egress traffic to better performingnext-hops. However, this focus on performance overlooks acrucial operating expenditure of cloud providers: the cost ofinter-domain traffic determined by complex pricing schemes.While the prices of inter-domain bandwidth have declinedin the past decade, the decrease has been outpaced by expo-nential growth in demand [29] from cloud networks servinghigh-definition video, music and gaming content. In fact, theinter-domain bandwidth costs incurred by the cloud providerwe analyze increased by 40% in the March 2020 billing cycleas a consequence of the increase in demand fueled by workfrom home guidelines in various parts of the world. 2
1Code and experiments at: http://cascara-network.github.io.2We do not disclose the fraction of total cloud operation expenditure
contributed by inter-domain bandwidth costs due to confidentiality reasons.
Figure 1: Present-day and CASCARA-optimized bandwidth allo-cation distributions for one week, across a pair of links between alarge cloud provider and tier-1 North American ISPs. Costs dependon the 95th-percentile of the allocation distributions (vertical lines).CASCARA-optimized allocations reduce total costs by 35% over thepresent-day allocations while satisfying the same demand.
In this work, we show that recent increases in interconnec-tion and infrastructure scale enable significant potential to re-duce the costs of inter-domain traffic. These advances includethe deployment of several new cloud points of presence (PoP)near clients and direct peering with an increasing fractionof the Internet’s autonomous systems [5]. As a result, mostclients are reachable over several short and latency-equivalentpaths from the cloud provider [26]. We illustrate the cost sav-ing potential due to latency-equivalent links with an examplein Figure 1. We plot the distributions of bandwidth allocatedover one week to links A and B, which connect a large cloudprovider to tier-1 North American ISPs. Both links are locatedat inter-connection points within 30 km of each other, andoffer comparable latency due to their geographical proximity.In this example, the bandwidth price per Mbps of Link B is33% higher than that of Link A. Link costs are a functionof the 95th percentile of the bandwidth allocations to eachlink. The present-day allocations (in blue) represent the cur-rent bandwidth assigned to the links by the cloud providerunder study. In contrast, the CASCARA-optimized allocations(in red) meet the same or higher demand as the present-dayallocations, while reducing total bandwidth costs by 35%.
Bandwidth allocations at the cloud edge impact both theclient latency and inter-domain bandwidth costs to the cloudprovider. At one extreme, traffic allocations may disregard thelatency impact to drive bandwidth costs to near-zero whileat the other extreme, allocations may incur very high band-width costs by greedily assigning traffic to the lowest latencypeers. Balancing this cost-latency tradeoff is central to ourwork. However, it is made challenging by industry-standardpricing schemes that use 95th percentile of the bandwidth dis-
USENIX Association 18th USENIX Symposium on Networked Systems Design and Implementation 201
tribution over monthly time-periods. Complex relationshipsbetween bandwidth allocations, costs and client latency leadto computationally hard optimization problems.
We tackle these challenges by first analyzing the utilizationof edge links from a large commercial cloud provider. Wefind that the majority of traffic from the cloud is exchangedwith transit ISPs, with outbound traffic being twice in volumecompared to inbound traffic. Thus, outbound traffic to transitISPs dominates the inter-domain bandwidth costs of the cloud.Three such North American ISPs incur a majority of the totalexpenditure on inter-domain bandwidth in the continent (§3).Using these insights, we make three main contributions:1. Quantify the opportunity of saving bandwidth cost. Weformulate cloud edge TE as an optimization with the goalof minimizing percentile bandwidth costs. Despite the non-convex nature of the objective, the optimization is tractablein engineering outbound traffic to peer links with only thesmall number of ISPs that contribute majority of the costs. Weshow that cost-optimal allocations can save up to 65% of thecloud provider’s inter-domain bandwidth costs, quantify-ing the upper bound on savings (§3) and offering a significantimprovement over related approaches in [12, 20, 35].2. Practical and cost-efficient online edge TE. Since op-timizing percentile costs is NP-Hard [20], finding optimalsolutions can take several hours. We leverage insights fromthe offline optimal solution to design an efficient, heuristic-based online TE framework, CASCARA. CASCARA leveragesthe cloud provider’s rich diversity of latency-equivalent BGPpeers to offer cheaper options to outbound traffic. Throughextensive experiments we demonstrate that CASCARA pro-vides near-optimal cost saving in practice and can be deployedsafely and incrementally in cloud WANs (§4).3. Flexibility to balance the cost-latency tradeoff. CAS-CARA incorporates the latency of primary and alternate peerpaths from the cloud [4, 27] to strike a balance between band-width cost savings and client latency. CASCARA provides theflexibility to pick the operating point on this tradeoff and findsallocations that bound the increase in client latency by 3 mswhile saving 11-50% of bandwidth costs per cloud PoP (§5).
Client latency requirements vary based on the types ofapplication traffic, e.g., software updates and large file trans-fers are more delay tolerant than live video. In fact, majorityof all outbound traffic from the cloud provider is marked asbest-effort, making it tolerant to small changes in latency. Weconclude this study by discussing the generalizability of ourresults, the implications of CASCARA on peering contractsand bandwidth pricing models on the Internet (§6).
2 CASCARA controller overview
CASCARA’s goal is to engineer outbound traffic allocationsfrom the cloud edge to achieve near-optimal saving in inter-domain bandwidth costs. It does so by providing operationalsafety knobs to the operator: configurable variation in the
,63
&ORXG�(GJH
%03�5287(&2//(&7256
,3),;�)/2:&2//(&7256�
3((5,1*&2175$&76���0%36�
&/,(17�3(5)250$1&(�0($685(0(17
&$6&$5$�:$1�&21752//(5
&267�237,0,=('�$//2&$7,21�;�W�
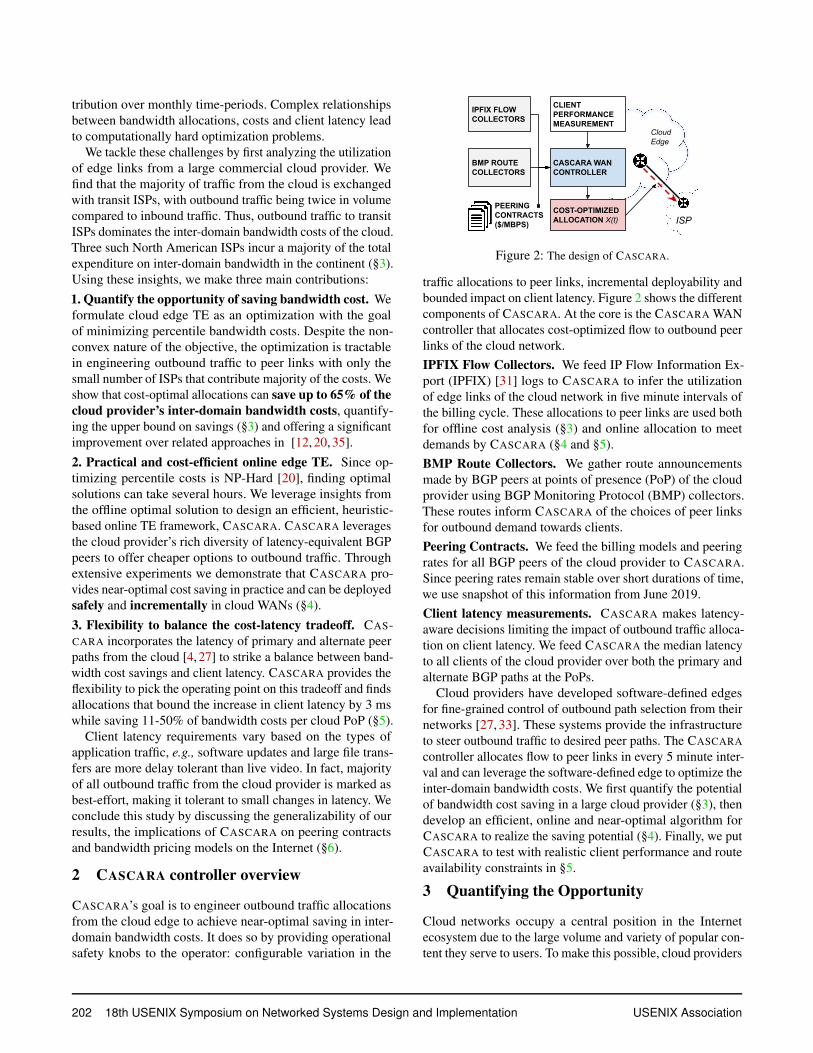
Figure 2: The design of CASCARA.
traffic allocations to peer links, incremental deployability andbounded impact on client latency. Figure 2 shows the differentcomponents of CASCARA. At the core is the CASCARA WANcontroller that allocates cost-optimized flow to outbound peerlinks of the cloud network.IPFIX Flow Collectors. We feed IP Flow Information Ex-port (IPFIX) [31] logs to CASCARA to infer the utilizationof edge links of the cloud network in five minute intervals ofthe billing cycle. These allocations to peer links are used bothfor offline cost analysis (§3) and online allocation to meetdemands by CASCARA (§4 and §5).BMP Route Collectors. We gather route announcementsmade by BGP peers at points of presence (PoP) of the cloudprovider using BGP Monitoring Protocol (BMP) collectors.These routes inform CASCARA of the choices of peer linksfor outbound demand towards clients.Peering Contracts. We feed the billing models and peeringrates for all BGP peers of the cloud provider to CASCARA.Since peering rates remain stable over short durations of time,we use snapshot of this information from June 2019.Client latency measurements. CASCARA makes latency-aware decisions limiting the impact of outbound traffic alloca-tion on client latency. We feed CASCARA the median latencyto all clients of the cloud provider over both the primary andalternate BGP paths at the PoPs.
Cloud providers have developed software-defined edgesfor fine-grained control of outbound path selection from theirnetworks [27, 33]. These systems provide the infrastructureto steer outbound traffic to desired peer paths. The CASCARAcontroller allocates flow to peer links in every 5 minute inter-val and can leverage the software-defined edge to optimize theinter-domain bandwidth costs. We first quantify the potentialof bandwidth cost saving in a large cloud provider (§3), thendevelop an efficient, online and near-optimal algorithm forCASCARA to realize the saving potential (§4). Finally, we putCASCARA to test with realistic client performance and routeavailability constraints in §5.
3 Quantifying the Opportunity
Cloud networks occupy a central position in the Internetecosystem due to the large volume and variety of popular con-tent they serve to users. To make this possible, cloud providers
202 18th USENIX Symposium on Networked Systems Design and Implementation USENIX Association

0.00
0.25
0.50
0.75
1.00
03−June 10−June 17−June 24−JuneTime
Scal
ed E
gres
s Tr
affic
Vol
ume
Content Enterprise Transit/Access UNKNOWN
(a) Outbound traffic types.
0.0
0.2
0.4
0.6
0.8
1.0
06−June 11−June 16−June 21−June 26−JuneTime
Tota
l Dem
and
(sca
led)
inbound outbound
(b) Inbound vs. Outbound traffic.
0.001
0.010
0.100
1.000
AS EU NA OC SAContinent
Nor
mal
ized
peer
ing
rate
($/M
bps)
(c) Norm. peering rates by continent.
Figure 3: (a) Outbound traffic from a large cloud provider towards BGP peers of different types; majority of outbound traffic is towardstransit/access networks. (b) The distribution of inbound vs. outbound traffic volume from the cloud network. (c) Large differences in the costper unit bandwidth in different parts of the world e.g., the median peering cost in Asia is over 10X the median peering cost in North America.
peer with a large number of networks or Autonomous Sys-tems (ASes) on the Internet, including transit ISPs and eyeballnetworks. The cloud provider we analyze has over 7,000 BGPpeers, including transit networks, access networks, contentproviders and Internet Exchange Points (IXPs). These linksspan over one hundred geographical locations, collectivelycarrying terabits of traffic per second. We analyze the uti-lization and bandwidth costs incurred at the peering edge ofthe commercial cloud provider using IPFIX flow records col-lected from June 2018 to July 2019. Aggregated across alledge links, Figure 3a shows the outbound traffic volume perfive minute interval from the cloud towards transit/access net-works, cloud providers and enterprise networks, categorizedby CAIDA’s AS types classification [3].
3.1 Dominant contributors to bandwidth costA BGP peer of the cloud network charges for the traffic ex-changed between them according to the billing model ne-gotiated in their peering contract. There are three billingmodels for inter-domain traffic prevalent on the Internet to-day: (1) Settlement-free (2) Per-port and (3) Per-Megabit [9].Settlement-free peers (SFP) agree to exchange traffic witheach other at no cost (e.g., between cloud providers). In per-port peering, a peer bills another for each network port usedat their facility (e.g., connections at IXPs). Per-Megabit isa utilization-based model where a network charges its peerbased on the utilization of the link between them over monthlybilling cycles. There can be a commit clause in this contracti.e., regardless of the actual usage, the customer commits topay at least some pre-arranged amount to the provider.
Utilization-based, per-megabit billing is the industry stan-dard for paid peer and transit ISP contracts and it is the focusof our work. Our goal is to minimize bandwidth costs ac-crued on peering links billed by their utilization. To translatenetwork utilization into the corresponding inter-domain band-width cost, ISPs measure the average utilization of peeringlinks in five minute intervals in both inbound and outbounddirections. Let the edge link from peer p1 to peer p2 haveaverage outbound utilizations of B = {B1,B2, ..,Bn} megabits
in 5-minute intervals of a given month. Let Bout be the 95th
percentile of the outbound utilizations, B. Similarly, Bin isthe 95th percentile of average inbound utilizations of thep1 � p2 link. The link cost for a billing cycle is given by,B = ci · MAX{Bout ,Bin}, where ci is the peering rate negoti-ated by p1 and p2 as part of their peering agreement. Thismodel of billing bandwidth, also called burstable billing, hasevolved as an industry standard on the Internet [9].
Bulk of the traffic is exchanged with Transit/Access ISPs.The large majority of traffic at the cloud edge is outboundto Transit/Access networks (Figure 3a). Therefore, traffic ex-changed with transit ISPs is the main contributor to bandwidthcosts incurred by the cloud provider.
Outbound traffic is twice the inbound. For the cloud WAN,outbound traffic volume is nearly twice the inbound (Fig-ure 3b), highlighting that the cost computation based on linkutilizations can be simplified to ci ·Bout for clouds networks.
Links with only three ISPs contribute majority of costs.Due to the large variance in peering rates (seen in Figure 3c)and skewed distribution of traffic towards a few large ISPsin the North American region of the cloud, edge links tothree large networks incur a majority of the total spend oninter-domain bandwidth in North America.
3.2 Optimal inter-domain bandwidth costsIn this section we formalize the task of optimizing inter-domain bandwidth costs of a cloud network. As outboundtraffic to paid peers is significantly higher than inbound (Fig-ure 3b), we focus on engineering outbound traffic to minimizethe overall inter-domain bandwidth cost. To quantify the po-tential cost savings, we formulate the offline version of theproblem where traffic demands are known in advance.
Let L = {l1, l2, ..lm} be the set of all edge links from theWAN. Edge links to the same peer at different points of pres-ence (PoP) are billed individually according to their percentileutilization. Let a five-minute interval in the monthly billingperiod be t j where j 2 {1,2, ..,n}. For instance, the month ofJanuary has 8,928 five-minute intervals.
USENIX Association 18th USENIX Symposium on Networked Systems Design and Implementation 203
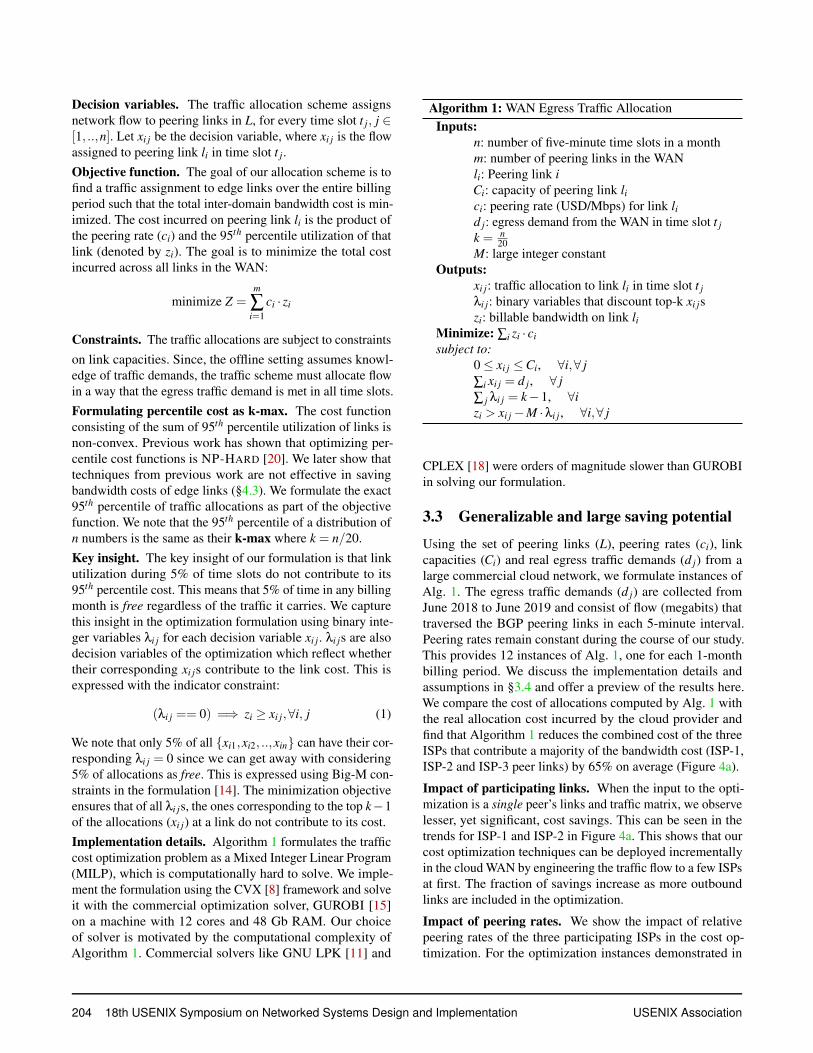
Decision variables. The traffic allocation scheme assignsnetwork flow to peering links in L, for every time slot t j, j 2[1, ..,n]. Let xi j be the decision variable, where xi j is the flowassigned to peering link li in time slot t j.Objective function. The goal of our allocation scheme is tofind a traffic assignment to edge links over the entire billingperiod such that the total inter-domain bandwidth cost is min-imized. The cost incurred on peering link li is the product ofthe peering rate (ci) and the 95th percentile utilization of thatlink (denoted by zi). The goal is to minimize the total costincurred across all links in the WAN:
minimize Z =m
Âi=1
ci · zi
Constraints. The traffic allocations are subject to constraintson link capacities. Since, the offline setting assumes knowl-edge of traffic demands, the traffic scheme must allocate flowin a way that the egress traffic demand is met in all time slots.Formulating percentile cost as k-max. The cost functionconsisting of the sum of 95th percentile utilization of links isnon-convex. Previous work has shown that optimizing per-centile cost functions is NP-HARD [20]. We later show thattechniques from previous work are not effective in savingbandwidth costs of edge links (§4.3). We formulate the exact95th percentile of traffic allocations as part of the objectivefunction. We note that the 95th percentile of a distribution ofn numbers is the same as their k-max where k = n/20.Key insight. The key insight of our formulation is that linkutilization during 5% of time slots do not contribute to its95th percentile cost. This means that 5% of time in any billingmonth is free regardless of the traffic it carries. We capturethis insight in the optimization formulation using binary inte-ger variables li j for each decision variable xi j. li js are alsodecision variables of the optimization which reflect whethertheir corresponding xi js contribute to the link cost. This isexpressed with the indicator constraint:
(li j == 0) =) zi � xi j,8i, j (1)
We note that only 5% of all {xi1,xi2, ..,xin} can have their cor-responding li j = 0 since we can get away with considering5% of allocations as free. This is expressed using Big-M con-straints in the formulation [14]. The minimization objectiveensures that of all li js, the ones corresponding to the top k�1of the allocations (xi j) at a link do not contribute to its cost.Implementation details. Algorithm 1 formulates the trafficcost optimization problem as a Mixed Integer Linear Program(MILP), which is computationally hard to solve. We imple-ment the formulation using the CVX [8] framework and solveit with the commercial optimization solver, GUROBI [15]on a machine with 12 cores and 48 Gb RAM. Our choiceof solver is motivated by the computational complexity ofAlgorithm 1. Commercial solvers like GNU LPK [11] and
Algorithm 1: WAN Egress Traffic AllocationInputs:
n: number of five-minute time slots in a monthm: number of peering links in the WANli: Peering link iCi: capacity of peering link lici: peering rate (USD/Mbps) for link lid j: egress demand from the WAN in time slot t jk = n
20M: large integer constant
Outputs:xi j: traffic allocation to link li in time slot t jli j: binary variables that discount top-k xi jszi: billable bandwidth on link li
Minimize: Âi zi · cisubject to:
0 xi j Ci, 8i,8 jÂi xi j = d j, 8 j j li j = k�1, 8izi > xi j �M ·li j, 8i,8 j
CPLEX [18] were orders of magnitude slower than GUROBIin solving our formulation.
3.3 Generalizable and large saving potentialUsing the set of peering links (L), peering rates (ci), linkcapacities (Ci) and real egress traffic demands (d j) from alarge commercial cloud network, we formulate instances ofAlg. 1. The egress traffic demands (d j) are collected fromJune 2018 to June 2019 and consist of flow (megabits) thattraversed the BGP peering links in each 5-minute interval.Peering rates remain constant during the course of our study.This provides 12 instances of Alg. 1, one for each 1-monthbilling period. We discuss the implementation details andassumptions in §3.4 and offer a preview of the results here.We compare the cost of allocations computed by Alg. 1 withthe real allocation cost incurred by the cloud provider andfind that Algorithm 1 reduces the combined cost of the threeISPs that contribute a majority of the bandwidth cost (ISP-1,ISP-2 and ISP-3 peer links) by 65% on average (Figure 4a).
Impact of participating links. When the input to the opti-mization is a single peer’s links and traffic matrix, we observelesser, yet significant, cost savings. This can be seen in thetrends for ISP-1 and ISP-2 in Figure 4a. This shows that ourcost optimization techniques can be deployed incrementallyin the cloud WAN by engineering the traffic flow to a few ISPsat first. The fraction of savings increase as more outboundlinks are included in the optimization.
Impact of peering rates. We show the impact of relativepeering rates of the three participating ISPs in the cost op-timization. For the optimization instances demonstrated in
204 18th USENIX Symposium on Networked Systems Design and Implementation USENIX Association

●
●●
● ●
●●
●
●
●
●
● ●
●●
●●
●●
●●
●●
●●
●●
●
●●
●
●●
●●
●
●
●●
●●
●
●
●●
●●
●●
●
010203040506070
6−2018
7−2018
8−2018
9−201810−2
01811−2
01812−2
0181−2
0192−2
0193−2
0194−2
0195−2
0196−2
019
Month
Perc
ent c
ost s
avin
g ● ● ● ●ISP−1 ISP−2 ISP−1_ISP−2 ISP−1_ISP−2_ISP−3
(a) Cost savings with different sets of participating links.
●
●
●
●
●●
● ●
●
●
●
●● ●
● ●
●
●
●
●
●
● ●●●
●
●● ● ● ● ● ● ● ●
●●
● ●
010203040506070
6−2018
7−2018
8−2018
9−201810−2
01811−2
01812−2
0181−2
0192−2
0193−2
0194−2
0195−2
0196−2
019
Month
Perc
ent c
ost s
avin
g ● ● ●1:1:1 1:1:2 2:2:3
(b) Impact of peering rates on cost saving.
Figure 4: (a) Cost savings for 12 billing cycles using traffic matrices of ISP-1, ISP-2, ISP-3 and their combinations. (b) Cost saving withISP-1, ISP-2 and ISP-3 for different peering rate ratios.
Figure 4a, the ratio of peering rates of the ISPs is 2:2:3. Whilethe exact peering rates are confidential, their ratio shows thatlinks belonging to two ISPs cost less than the third ISP. Toensure that the cost savings are not simply a function of thisspecific cost ratio, we compare the savings from the optimiza-tion when the peering rates are in 1:1:1 and 1:1:2 ratios anddemands are the same as before. Figure 4b shows that savingsare significant (⇡ 40%) even when all links have the samepeering rate. Significant cost savings with different peeringratios demonstrate the generality of our results.Impact of engineered traffic volume It may not be desir-able to allow all traffic from edge links to be engineered forsaving network costs. For instance, it may be important toegress some portion of the traffic on the same edge link wherethe client request entered the cloud for performance or geo-political reasons. We find the impact of the fraction of trafficthat can be engineered on a per-link basis by computing thecost gains for the month of June 2018 when the fraction ofengineered outbound traffic on the edge links of ISP-1, ISP-2and ISP-3 is 50%. We find that the resulting cost savings are37.5%. We note that the solution took longer than our timelimit for the solver and therefore the LP gap was higher than15%. Similarly, when the fraction of traffic engineered on alink is reduced to 40%, the overall cost saving is 28.6%.
3.4 Computing optimal traffic allocationsWe now discuss the details of our implementation of Alg. 1.Managing the scale of the problem. Due to the non-convexnature of the problem, even state-of-the art optimizationsolvers can take an impractical amount of time to approx-imately solve Algorithm 1. We take advantage of our findingsfrom §3.1 and only engineer peer links to the three NorthAmerican ISPs (ISP-1, ISP-2 and ISP-3, anonymized for con-fidentiality) which incur a majority of the inter-domain band-width costs to the cloud. Each of the 3 ISPs peers with thecloud provider at tens of locations in North America, con-tributing 56 peer links between the cloud network and thethree ISPs. We solve Algorithm 1 for different sets of peer-ing links: first considering links with ISP-1 and the egressdemand (d j) that gets served over links with ISP-1. Similarly,
we solve problem instances with links and demands of ISP-2,ISP-3, ISP-1 and ISP-2 and ISP-1, ISP-2 and ISP-3 as input.
Efficient computation of the lower-bound. Cutting-edgeoptimization solvers use a combination of techniques to solvegeneral Mixed Integer Programs (MIPs). At a high level, thefirst step is relaxing the MIP to an efficiently solvable Lin-ear Program (LP) by removing the integral constraints. If afeasible solution to the LP is not found, the MIP, in turn, isalso infeasible. If a feasible solution is found, the solutionof the LP is a lower bound to the solution of the originalMIP. Therefore, in a minimization problem like Algorithm 1,the LP solution provides the lower bound on bandwidth costwithout having to solve the MILP.
Running time of the optimization solver. We note that Al-gorithm 1 has O(mn) Real decision variables and just as manybinary variables. Predicting the difficulty of Integer programsin terms of the number of variables and constraints is hard. In-deed, increasing the number of links (size of set L) reduces thealgorithm’s running time. The rationale behind this counter-intuitive behavior is that higher number of peering links makeit easier for the optimization to meet demands without raisingthe 95th percentile utilization of the links.
Once the LP relaxation has been solved, MIP solvers usea branch-and-bound strategy to find feasible solutions to theMIP from an exponential number of possibilities. As a result,some instances of the optimization can take several hoursto solve. We use two techniques to bound the time of thesolver. First, using the efficiently computable LP relaxation,we compute the proximity of the MIP solution to the theoreti-cal lower bound. Second, we configure the branch-and-boundalgorithm to return the current-best feasible solution after afixed amount of time has elapsed. We configure the solver tostop if the current best feasible solution to the MIP is within15% of the LP optimal or if the solver has run for 15 hours.
Some instances of the optimization problem took 1-2 hoursto find solutions while for others, the solution space had to beexplored for 15 hours. On average, instances of Algorithm 1took 6 hours to finish. The variance in run-time is due todifferences in traffic demands of months. One strategy thatwas effective in speeding the optimization involved using
USENIX Association 18th USENIX Symposium on Networked Systems Design and Implementation 205
the values of decision variables from the previous month asinitial values of the corresponding decision variables for nextmonth’s model. We found that using this warm-start strategyreduced the running time by 3X with instances taking 2 hoursto solve on average. We describe other approaches that didnot reduce the running time in Appendix (§A.1).Gap from LP optimal. While the optimal solution to theLP relaxation provides a lower bound on the minimum costof allocations, this lower bound is not always feasible. Toimprove the run time, we set a break condition while solvingthe problem instances to either reach within 15% of the LPoptimal or spend 15 hours in solving the MIP using branch-and-bound. For the instances we solved, the average gap ofthe final MIP solution from the LP optimal is 9% i.e., thesolutions are very close to the theoretical lower bound.
4 Online cost-optimization with CASCARA
Results of the offline allocation scheme (3.2) show that thereis significant potential for optimizing bandwidth cost at thecloud edge. There are two caveats to the scheme’s use: first,it assumes knowledge of outbound demand for every timeslot of the billing cycle. In practice, an online algorithm thatcan allocate network flow to peer links without the knowl-edge of future demands is required. Second, the optimizationformulation (Algorithm 1) takes two hours on average to pro-vide optimal traffic allocations for the entire month. However,state-of-the-art TE controllers compute traffic allocations ev-ery 5-10 minutes, making it crucial to have an online solutionthat is efficient and effective. In this section we develop aheuristic-based online traffic allocation framework that usesinsights from the offline optimal solutions to Algorithm 1.Despite the complexity of the cost optimization problem, weshow that a simple and efficient algorithm with few hyperpa-rameters governs the closeness of the heuristic solution to theoffline optimal. The heuristic allocations achieve bandwidthcosts savings within 5% of the optimal.
Consider the set of edge links from the cloud, L ={l1, l2, ..lm}. Let Li be a subset of L, such that links in Liare each priced at pi per Mbps. For example, the setup in(3.2) has two such subsets, L1 and L2 where links in L1 arepriced at p1 and those in L2 are priced at p2. Since the peeringrates of links to ISP-1, ISP-2 and ISP-3 are in the ratio 3:2:2,p1 =
32 p2. From the results of Section 3.4, we derive three
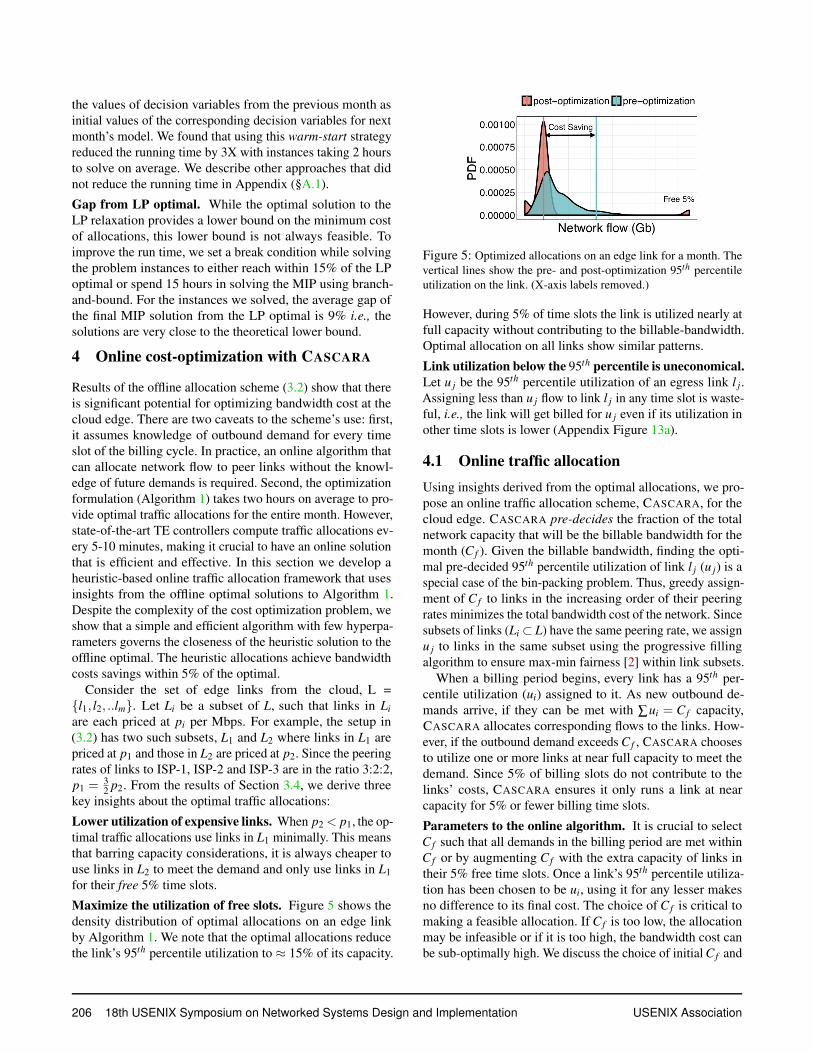
key insights about the optimal traffic allocations:Lower utilization of expensive links. When p2 < p1, the op-timal traffic allocations use links in L1 minimally. This meansthat barring capacity considerations, it is always cheaper touse links in L2 to meet the demand and only use links in L1for their free 5% time slots.Maximize the utilization of free slots. Figure 5 shows thedensity distribution of optimal allocations on an edge linkby Algorithm 1. We note that the optimal allocations reducethe link’s 95th percentile utilization to ⇡ 15% of its capacity.
Figure 5: Optimized allocations on an edge link for a month. Thevertical lines show the pre- and post-optimization 95th percentileutilization on the link. (X-axis labels removed.)
However, during 5% of time slots the link is utilized nearly atfull capacity without contributing to the billable-bandwidth.Optimal allocation on all links show similar patterns.Link utilization below the 95th percentile is uneconomical.Let u j be the 95th percentile utilization of an egress link l j.Assigning less than u j flow to link l j in any time slot is waste-ful, i.e., the link will get billed for u j even if its utilization inother time slots is lower (Appendix Figure 13a).
4.1 Online traffic allocationUsing insights derived from the optimal allocations, we pro-pose an online traffic allocation scheme, CASCARA, for thecloud edge. CASCARA pre-decides the fraction of the totalnetwork capacity that will be the billable bandwidth for themonth (Cf ). Given the billable bandwidth, finding the opti-mal pre-decided 95th percentile utilization of link l j (u j) is aspecial case of the bin-packing problem. Thus, greedy assign-ment of Cf to links in the increasing order of their peeringrates minimizes the total bandwidth cost of the network. Sincesubsets of links (Li ⇢ L) have the same peering rate, we assignu j to links in the same subset using the progressive fillingalgorithm to ensure max-min fairness [2] within link subsets.
When a billing period begins, every link has a 95th per-centile utilization (ui) assigned to it. As new outbound de-mands arrive, if they can be met with Âui = Cf capacity,CASCARA allocates corresponding flows to the links. How-ever, if the outbound demand exceeds Cf , CASCARA choosesto utilize one or more links at near full capacity to meet thedemand. Since 5% of billing slots do not contribute to thelinks’ costs, CASCARA ensures it only runs a link at nearcapacity for 5% or fewer billing time slots.Parameters to the online algorithm. It is crucial to selectCf such that all demands in the billing period are met withinCf or by augmenting Cf with the extra capacity of links intheir 5% free time slots. Once a link’s 95th percentile utiliza-tion has been chosen to be ui, using it for any lesser makesno difference to its final cost. The choice of Cf is critical tomaking a feasible allocation. If Cf is too low, the allocationmay be infeasible or if it is too high, the bandwidth cost canbe sub-optimally high. We discuss the choice of initial Cf and
206 18th USENIX Symposium on Networked Systems Design and Implementation USENIX Association

how CASCARA improvises when the chosen Cf is too smallto meet the demand during the billing cycle.
Order of choosing peer links. CASCARA decides the orderof links to be augmented above their allocation ui to meet5-minute demands higher than Cf . Using a configurable pa-rameter, CASCARA can allocate how close the augmentedallocation is to the link’s capacity to prevent sudden link per-formance degradation. The time slots in which CASCARAaugments the allocation to a link are called augmented slots.The augmented slots are limited to 5% for each link, makingthe order in which links are augmented relevant to the fea-sibility of an allocation. CASCARA uses a priority queue ofall edge links where a link’s priority is a combination of thetime since it was last augmented and its capacity. If a link wasaugmented in the previous slot, it must also be augmented inthe following slot, if required, so that the allocations do notchange sharply. By prioritizing links with lesser capacity foraugmentation, CASCARA ensures that free slots of links withhigher capacity are not used pre-maturely.
Link augmentation order does not impact feasibility. IfCASCARA’s assignment of uis and the order of link augmen-tation leads to an infeasible allocation problem, any change tothe order of link augmentation does not render the allocationfeasible (Proof in Appendix A.2). Since uis are derived fromCf , the key input parameter to CASCARA is Cf . Algorithm 2shows the online traffic allocation scheme of CASCARA inbrief (details in Appendix Algorithm 3).
Insufficient Cf and infeasible allocation. If the initial ca-pacity fraction assigned by CASCARA ends up being insuffi-cient to meet the demand in a time slot, despite augmentingthe allocations to all edge links that have free slots remaining,we consider the allocation infeasible. This means that it is nolonger possible to limit the billable bandwidth of this month toCf and the Cf value must be increased. CASCARA increasesthe value of Cf by step size (b) to meet the demand. Until it be-comes necessary to increase Cf in a billing cycle, CASCARAhas under-utilized the links stay under Cf . Increasing Cf toCf +b renders the past efforts to keep Cf low, futile. Indeedthese efforts may have wasted the augmentation slots of linksbefore Cf is incremented. However, there is no choice but toincrease Cf as traffic demands must always be met. In theideal case, initial value of Cf is just enough to meet demandsin the entire billing period using augmentation slots whenneeded. On the other hand, starting the billing cycle with aCf that is higher than required leads to sub-optimally highbandwidth costs. We show that the ideal Cf value is sufficientin ensuring that CASCARA finds optimal cost allocations.
Improvising billable bandwidth preemptively. WhenCASCARA finds that the demand is too high to accommo-date in the current Cf , it increases Cf by b. Increasing thebillable bandwidth estimate, Cf is a tradeoff – increasing toolate in the billing cycle leads to wasteful use of links’ freeslots until the increase and increasing it too early reduces the
Algorithm 2: Online Traffic Allocation Per-TimestepFunction allocate_timestep(d, f):
if d Cf thenallocate Cf to links in Lreturn true
elsed = d �Cfwhile linkqueue do
l = pop(linkqueue)augment ldecrement l’s priority and free slotsdecrement d by l’s augmented capacityif d 0 then
return truereturn false
cost saving potential. We capture this tradeoff by introduc-ing the third and final parameter of CASCARA: a. a is theincrease in Cf during the monthly billing cycle before an in-feasible allocation is encountered. The goal is to preemptivelyincrease Cf if such an increase is inevitable later in the month.
4.2 Finding CASCARA’s hyperparametersWe show that by setting Cf effectively, CASCARA’s onlinetraffic allocation (Algorithm 2) can be nearly as effective asthe offline solutions of Algorithm 1. We set Cf to differentfractions of the total network capacity, ranging from 0 to 1, insteps of 0.01. We compare the cost saving from the feasibleallocation using the smallest Cf with the optimal cost saving3
and find that on average, CASCARA with the optimal initial Cfachieves savings within 2% of the offline optimal allocation.Setting Cf . CASCARA with the optimal Cf is called CAS-CARA-offline since it has prior knowledge of the lowest Cffor feasible allocations. CASCARA-online assumes no suchknowledge and uses the optimal Cf of the previous billingcycle as the current month’s initial Cf . This choice is moti-vated by strong daily, weekly and monthly seasonality in theoutbound traffic demands. Previous month’s Cf is the optimalvalue for the next month 64% of the time. For the rest, theaverage difference between optimal Cf and its initial settingis of the network capacity. When the initial Cf is not opti-mal, the allocation becomes infeasible and CASCARA has toincrease the Cf to meet the traffic demands.Finding a and b with grid search. Increase in Cf is a defi-nite increase in the bandwidth cost for the billing cycle. Thestep size by with Cf is increased (b) is also important: toohigh and it would wastefully increase the cost, too low and itwould mean having to increase Cf again in the future. Onceincreased, there is no cost saving advantage to reducing Cf .Incrementing Cf later is worse than having started with the
3For confidentiality reasons, we cannot not share the capacity fractions.
USENIX Association 18th USENIX Symposium on Networked Systems Design and Implementation 207

PretiumEntact
GFA−onlineCascara−onlineCascara−offline
0 20 40 60Bandwidth cost saving (%)
TE s
chem
e
Figure 6: Costs savings from CASCARA and related approaches.Bars show the mean and wiskers show the standard deviation.
optimal Cf since links’ augmentation slots are wasted beforethe increment is made. Thus, preemptively increasing Cf bya during the billing cycle mitigates the issue of wasteful useof link augmentation slots. The hyperparameters, a and b areimportant to select. We perform a grid search to find the onesbest suited for the cloud network. Details of the grid searchare in Appendix A.5. The best values of a and b are used tofor the following discussion.
4.3 Comparison with previous workWe now discuss the cost savings enabled by CASCARA-onlineover twelve billing months from June 2018 to June 2019 (Fig-ure 6). As before, we use the production network’s traffic de-mands, topology and peering rates to measure the cost savingsthat CASCARA-online would provide. We first show that CAS-CARA-online achieves 55% cost saving, within 10% of thesavings from CASCARA-offline which knows the optimal Cfin advance. Then, we evaluate existing approaches that havefocused on similar objective functions as CASCARA. We ex-clude approaches that delay traffic to future time slots [13,21]as these are not viable for the cloud provider we study (§7).The three main systems from related work are:Pretium for dynamic file transfers in the WAN [20].Pretium focuses on optimizing percentile costs of internalWAN links for dynamic transfers within the WAN [20]. Theyproposed to use the average of top 10% utilizations as a proxyfor 95th percentile cost of links. We find that Pretium offersmodest cost saving of 11% on average compared to CAS-CARA’s 55% savings for egress WAN traffic. Pretium assumesthat the 95th percentile of a link’s utilization is linearly corre-lated with the average of top k utilizations [20]. We evaluatethis assumption using the utilizations of over 50 peering linksfrom the cloud WAN to large ISPs in N. America. Figure 13bshows the Pearson correlation coefficient to measure the ex-tent to which the average of top 10% utilizations can be usedas a proxy for 95th percentile utilization of inter-domain links.We find that the correlation coefficient for over 25% of thelinks is less than 0.5. Since previous work’s hypothesis wasderived from the data of a single WAN link measured a fewyears ago, the correlation between average of top 10% and95th percentile utilization may exist for some links but notall. Ever-changing traffic patterns from WANs due to newservices like gaming also explain this difference.
●
●
●●
●
●● ● ● ●
● ● ●●
● ● ● ●
010203040506070
25 50 75Ramp−up rate of traffic allocation (Gbps)Ba
ndw
idth
cos
t sav
ing
(%)
Figure 7: The impact of ramp-up rate on cost saving potential (meanand std. deviation calculated over 12 billing cycles).
Entact for cost minimization in clouds [35]. Entact sharesa lot of the goals with CASCARA, including finding cost opti-mal traffic allocations constrained by client latency. However,Entact chose to optimize linear bandwidth prices since per-centile pricing is hard to optimize [35]. In a linear pricingscheme, greedy traffic allocation to cheapest links is optimal.However, the greedy algorithm does not fare well in percentilepricing schemes, as show in Figure 6’s comparison betweenCASCARA and Entact. The reason is that allocations in everytime slot contribute towards the billable bandwidth in linearpricing schemes (e.g., average and sum of allocations) but inpercentile pricing, some percent of the allocations are free.Greedy allocations fail to take advantage of this phenomenon.Global Fractional Allocation (GFA) for multihoming [12].Finally, authors of [12] analyzed cost optimizations in thesetting of multi-homed users. GFA comes closest in its ap-proach to CASCARA and this is also reflected in the costsaving comparison in Figure 6. However, CASCARA outper-forms GFA by 17% in the average case. There are two mainreasons for this: GFA assumes a much smaller scale of theproblem where the options for allocations are 3 to 4 upstreamISPs. This makes their naive estimation of cost lower boundineffective: by using only 5% of the timeslots of peer links tomeet demands was a viable option, traffic allocation would befree. Secondly, when GFA runs into an infeasible allocation,it assigns all remaining flow to a single link. This is oftenimpractical at the cloud scale where the demand is too highfor one peer link to handle the slack.
And finally, there are several realistic factors that needcareful consideration: latency from peer links to clients andexistence of routes at the peering router to engineer traffic.CASCARA not only performs better in idealized environmentsby achieving higher cost saving that existing systems, it alsotakes real-world constraints of a large production WAN intoaccount. We describe these in further details in §5.
4.4 Operational safety checks in CASCARA
We discuss the safety checks built into the CASCARA algo-rithm to ease the process of operating it in production.Stable traffic allocation. One concern with algorithms as-
208 18th USENIX Symposium on Networked Systems Design and Implementation USENIX Association

all cluster−1 cluster−2 cluster−3 cluster−4
0 20 40 60 0 20 40 60 0 20 40 60 0 20 40 60 0 20 40 600.00
0.25
0.50
0.75
1.00
Percent cost saving
CD
F
cascara−offline cascara−online oracle
Figure 8: shows distributions of percent cost saving by CASCARA-offline, CASCARA-online and the oracle (Algorithm 1) over 12 billingcycles. CASCARA-online achieves near-optimal saving with different sets of links and corresponding demands as input.
signing traffic flows on peer links is that the allocation mustbe mindful of the performance impact on the inter-domainpaths. CASCARA ensures that allocation to backup BGP pathsdoes not change too rapidly by using a maximum ramp-uprate parameter that controls the maximum increase in the al-location to any peer link in the network. This ramp-up ratepaces traffic allocation to links and allows CASCARA to incor-porate path performance feedback into its decision making.We discuss how CASCARA incorporates performance metricsin its control loop in the next section. Figure 7 shows the costsaving potential of CASCARA as a function of the ramp-uprate. Very slow shifts which use a maximum ramp-up rate of10 Gbps restrict the cost savings of CASCARA. However, at30 Gbps ramp-up rate, CASCARA has reached its full savingpotential and more rapid shifts of traffic do not offer muchimprovement in cost savings percentage.
Predictable traffic allocations on edge links. CASCARA’straffic allocation to edge links are more stable than present-day allocations which are driven by user-facing demands.There are two reasons for this. First, CASCARA selects a pre-decided fraction of a link’s capacity as the utilization on thelink for 95% of billing slots and changes are made to thisfraction only when it is essential for meeting demand overCf . Secondly, even when the allocation to a link has to beaugmented, CASCARA ensures that a link, once augmented,is used until its free slots have been exhausted. Predictableallocations on edge links allow network peers to provisioncapacity appropriately in place of being prepared for arbitraryspikes in traffic demands.
Incremental deployability. CASCARA can be incrementallydeployed across edge link groups in the cloud. To show this,we divide the peer links of ISP-1, ISP-2 and ISP-3 into fourgeographical clusters based on their PoP. These four clusterscorrespond to links at PoPs in north-central, south-central,East Coast and West Coast regions of North America. Wecompute the cost savings within each cluster by engineeringthe demands of the cluster onto its links. Figure 8 shows thatCASCARA-online can achieve near-optimal cost (CASCARA-offline) savings across all peer links (cluster all) and alsowithin the 4 geographical clusters. We note that in some casesCASCARA-offline achieves higher cost saving than the oracle(Alg. 1) due to the LP gap in the solution of the MILP (§3.4).
0.00
0.25
0.50
0.75
1.00
0.00 0.25 0.50 0.75 1.00Similarity between routing tables
CD
F
common−peer−AS diff−peer−AS
Figure 9: shows the distribution of address space similarity betweenpeer links of ISP-1, ISP-2 and ISP-3 at different PoPs of the cloud.Each ISP announces nearly the same address space at different PoPsbut the overlap in address space across ISPs is very small.
5 Performance-aware cost saving
We have demonstrated that there is significant potential ofsaving inter-domain bandwidth costs in a cloud network (§3)and CASCARA’s efficient online algorithm can realize thispotential by achieving near-optimal cost saving (§4). In thissection we discuss practical aspects of achieving cost savings,namely, feasibility of engineering egress traffic in a WAN andthe impact of CASCARA on client latency.
5.1 Availability of client routes at peer linksCASCARA engineers outbound traffic demand to peer linksto achieve cost optimality over the billing cycle. However, itmust ensure that peer links have the routes required for trafficshifted onto them. Otherwise, traffic to clients could get black-holed at the peering edge router. Using the routes announcedby the three ISPs we focus on, we measure the address spaceoverlap between peer links and find that ISPs announce thesame address space across different peering locations (e.g.,Dallas vs. Seattle) but the overlap of address space acrosspeers (e.g., ISP-1 vs. ISP-2), even at the same PoP is minimal(Figure 9). Thus, CASCARA needs a mechanism to track theexistence of relevant routes at peer links.
Tracking prefix route announcements by ISPs at differ-ent cloud PoPs in CASCARA leads to an explosion of theproblem size since there are over 600,000 prefixes on the In-ternet. Aggregating clients to their corresponding geographicmetropolitan area (metro) and autonomous system (AS) pair
USENIX Association 18th USENIX Symposium on Networked Systems Design and Implementation 209

Figure 10: The difference in median latencies between primaryand alternate BGP paths calculated from client measurements. Thedifference between latencies of primary and alternate paths is small.
significantly reduces the scale of the problem. This groupingof client prefixes within the same AS and small geographi-cal locality has been used effectively in previous work [4].We find that the points of presence where the cloud providerpeers with ISP-1, ISP-2 and ISP-3 serve approximately 40,000(metro, AS) pairs, reducing the scale of the mapping requiredto capture the existence of relevant BGP routes at peer links.Thus, we construct a bi-partite mapping between clients andpeer links i.e., an edge between client c to peer link p impliesp has the relevant routes to c. We then constrain the trafficallocation in each timestep by the client to peer link mapping.We compute this allocation efficiently with a linear program(LP) within Alg. 2 that maps clients demands to peer links.
5.2 Bounded impact on client performanceNext, we tackle the challenge of limiting the performanceimpact of CASCARA’s cost optimization. For this, we continu-ously measure the performance of alternate BGP egress pathsto destination prefixes by directing a small amount of trafficover alternate peer links at eight PoPs [26,27,35]. We selectedthese PoPs as they carry high traffic volume – approximately47% of all the cloud provider’s North American traffic, andhave high capacity alternate links.
Links at the same PoP have equivalent client latency. Weanalyze over 300 million measurements to the cloud PoPs forthe month of August 2020, spanning 40,000 client metro andAS pairs, each with thousands of latency measurements to-wards the cloud on any given day. We first show the existenceof latency equivalent peer links at the same PoP. Borrowingfrom existing methodology [26], we measure the differencein median latency between the BGP best path (primary) andthe alternate BGP path for all clients that are served by thePoPs over 15 minute time buckets. Figure 10 shows that 80%of the time the difference in the latency is less than 3 ms. Thisimplies that shifting client traffic to links at the same PoP,impacts the client latency by 3 ms or less.
Shifting traffic to peer links at a PoP different than theone where it ingressed introduces two challenges. First, itcan inflate latency as the traffic would traverse the cloudbackbone to reach the second PoP. The second PoP could be
further from the client than the original, also inflating PoPto client latency. Second, traversal of the cloud backbonecan congest backbone links but cloud providers often over-provision backbone capacity [6] and manage intra-WAN linkutilizations with centralized controllers like SWAN [17] andB4 [19] to mitigate hot spots. Thus, we focus on the latencyimpact of CASCARA in this work. We find the primary PoPand peer ISP which historically has been the preferred egressfor a client. This primary link defines the baseline for ourexperiments – any changes in client latency are measured incomparison with the primary peer and PoP.
Bound the latency impact in egress link selection. To limitthe degradation to client latency, we inform CASCARA’s allo-cation (Algorithm 2) of the most recent latency from a peerlink to the client. In every timestep, while fulfilling demandsto a client, CASCARA enforces that traffic is allocated alongthe primary and other sets of links. We select the set of links toempirically construct the relationship between latency impactand saving of CASCARA. We consider the set of links for eachclient to include ISPs with route towards the client – includ-ing a transit ISP, at the client’s primary PoP. This means thatalong with the links to its primary ISP, the client’s demandcould be carried over the transit ISP link at the same PoP. Thiscan increase the set of outbound link options for a client bytwo links in the best case. Since, links at the same PoP haveequivalent latency, this configuration of CASCARA does notcause significant latency degradation (Figure 10).
We use CASCARA to engineer traffic at each PoP and com-pute the offline cost optimal solutions (Figure 11) for com-parison. At some PoPs (PoPs 0, 2 and 13), there are up tofive latency-equivalent peer links to most clients. e.g., twointerconnections with ISP-1, one with ISP-2 and two with thetransit ISP. CASCARA-offline shows the potential to save upto 50% of bandwidth costs at such PoPs. At other PoPs (PoPs4, 5, 11), there are only 2 latency-equivalent peer links to mostclients e.g., one interconnection with ISP-1 and one with thetransit ISP. Moreover, high diversity in demands across PoPsdue to client population density leads to differing opportuni-ties of cost savings across PoPs. We use CASCARA-online toengineer traffic in an online manner with route and latencyconstraints. In each five minute timeslot, CASCARA allocatedtraffic to clients on latency equivalent links at the client’sprimary PoP. On average, each iteration of CASCARA takesapproximately 3 seconds to compute traffic allocations, in-cluding the construction of the LP and extraction of trafficallocations on links. We note that our implementation usesPython 2.7 and could be further optimized for running time.However, TE systems typically perform allocations once ev-ery 5-10 minutes, thus CASCARA’s runtime of 3 seconds isreasonable. Across all PoPs, CASCARA achieves the overallcost saving of 21% while ensuring that client latency remainsunaffected. The per-PoP configuration we have evaluatedenforces the strictest possible latency bound on CASCARA.CASCARA allows cloud providers to configure the acceptable
210 18th USENIX Symposium on Networked Systems Design and Implementation USENIX Association

Figure 11: shows cost savings with CASCARA when engineeringtraffic on a per-PoP basis while limiting the impact on client latencyto 3 ms in the worst case (mean and standard deviation computedover three runs of CASCARA).
worst-case latency degradation while saving bandwidth costs.
6 Discussion
In this section, we investigate the source of CASCARA’s costsavings. We discuss implications of our findings on peeringcontracts with ISPs and bandwidth pricing on the Internet.
6.1 Where do the cost savings come from?Network operators have historically used heuristics to limittheir bandwidth costs. These include, load balancing trafficover equivalent links and preferring cheaper peer links in theBGP best path selection by setting localpref appropriately.Localpref based cost saving is sub-optimal. We illustratethe cost savings from CASCARA with a small example using2 links and 3 billing slots. There are two egress links froma network (Link 1 and Link 2), each of capacity 5 trafficunits and unit peering rate. The traffic demand is assignedto Link 1 and 2 in any time slot (Figure 12). Traffic mustnot be dropped if there is enough capacity on the outboundlinks. For simplicity, the links are billed using the median(50th percentile) utilization over three time slots. Since thepeering rate of both links is the same, localpref-based costminimization will simply balance traffic on the two links.Under this scheme, the link utilizations are : 1,2.5,1.5 intime slots 1, 2 and 3 respectively (shown in red in Figure 12)for both links. The median utilization is 1.5 for both, the totalcost of the links is 3 units. An alternate traffic assignment tothe links is shown in blue in Figure 12, where the utilizationsof link 1 and 2 are {1, 5, 0} and {1, 0, 3} respectively. Themedian cost in this case is 1 for both links, total cost being2 units. This scheme saves one third of the traffic cost whilemeeting the same demand. We note that by extension, sendingall traffic to a link that is cheaper would also be sub-optimal.Free time slots for saving cost. The example shows thatin case of median billing, one of the three time slots doesnot contribute towards the final cost of the link. Each linkhas one free slot that can absorb peaks in demands to reduce
post−optimization pre−optimization
1 2 3 1 2 3012345
Time slots
Traf
fic u
nits
Link 1 Link 2
Figure 12: A toy example comparing CASCARA’s cost-optimizedallocations vs. load-balanced allocations.
costs. Similarly, bandwidth on the Internet is billed using 95th
percentile billing, meaning that 5% of 5-minute time slots ina month are free for each link. This implies that for roughly36 hours in a month, traffic allocation on any link does notcontribute to the final billed cost. While it may seem that thefree slots provide little wriggle room for saving cost, cloudproviders have a rich diversity of network peers in severalPoPs. These peer links provide free slots in the billing contextand enable multiple latency-equivalent ways to reach clients.
6.2 Do the findings generalize?We believe our results generalize to any large global cloud,content provider, or content delivery network. The first rea-son is that the cloud provider network is not unique. Thesenetworks all share several critical properties in common witheach other: (1) presence in hundreds of PoPs around the worldto deliver traffic very close to users and (2) extensive peeringand short AS paths [5, 32]. The second reason is that otherlarge networks have shown that given such large deploymentsand peering, many of the alternate paths to users have simi-lar latency [1, 26]; also allowing these networks to optimizebandwidth costs with stable performance.
Cost optimization is not a one-time effort. Traffic pat-terns across billing slots change – demands have been risingsteadily at 30-40% per year. The surge in demand [7] fromthe COVID-19 pandemic has made traffic patterns more dy-namic. We have evaluated CASCARA using over a year worthof demands, including evaluation in August 2020 to capturethe post-pandemic traffic growth. Our findings show smallmonth-to-month variation in saving but overall, the savingsare significant and consistent. We note that cost savings com-pound over time as demand continues to rise exponentially.
6.3 How practical is CASCARA?While CASCARA benefits from large sets of latency-equivalent peer links, it can be deployed incrementally overpeer links (§5), allowing cloud operators to choose to expandCASCARA’s purview over time. CASCARA can bound theamount by which allocations to links can change across timeslots to prevent sudden changes in traffic (§4.4). Moreover,we foresee CASCARA as a component of a larger software-defined edge [27, 33] that already prioritizes successful traffic
USENIX Association 18th USENIX Symposium on Networked Systems Design and Implementation 211

delivery based on the capacity and availability of the down-stream path. During demand surges or outages, the high prior-ity components of the TE system may take action to mitigatecustomer impact, putting CASCARA on hold for some types oftraffic for short periods of time. Automated network build-outalerts limit the duration of persistent capacity crunches, en-abling cost savings from CASCARA in the long term. Wherecost-optimization falls among second-order priorities willvary across cloud providers and their business needs.
6.4 Implications for existing peering contractsAn important concern in optimizing the cost of inter-domaintraffic is the long-term impact it may have on peering con-tracts. For instance, if free peers observe higher traffic volumefrom the cloud, they may reconsider their peering agreementor lean towards paid exchange of traffic [22]. Due to thesefactors, we evaluated CASCARA only on links with paid NorthAmerican peers. We argue that the peering rate captures thevalue of the interconnection to both networks involved andthus optimizing the outbound allocations for cost, not ex-ceeding the peering port capacity at the edge, is a reasonablestrategy. Additionally, peering rates in certain regions of theworld are disproportionately high due to monopolistic transitISPs and complicated socio-political factors, making highbandwidth rates the cost of operating in the market.
6.5 Implications for bandwidth pricingCASCARA shows that the abundance of latency-equivalentpeer links has enabled networks to significantly reduce theirexpenditure on inter-domain bandwidth. With the findings ofCASCARA, we encourage the community to revisit the classicproblem of pricing inter-domain traffic effectively. A sub-ject studied since the dawn of the Internet [24], inter-domainbandwidth pricing models and rates determine paths takenby traffic and subsequently the end-user performance. Withthe emergence of cloud and content providers as the sourceof disproportionately large volume of Internet traffic, currentpricing models may not suffice in ensuring the harmonious ex-istence of networks on the Internet [10, 30]. Today, a handfulof networks (cloud and content providers) can take advan-tage of their rich connectivity to save inter-domain bandwidthcosts, potentially taking a portion from the profits of ISPs.Some recent proposals suggest ways to better align the cost ofInternet transit and the revenue gained by networks [16, 34].
7 Related Work
In this section, we discuss important pieces of work related toCASCARA and set them in the context of our contributions.Intra-WAN traffic engineering. Large cloud providers haveembraced software-defined, centralized traffic engineeringcontrollers to assign flow within their private WAN to maxi-mize their utilization, guarantee fairness and prevent conges-tion [17,19,23]. Bandwidth costs in the context of WANs were
considered in Pretium [20] (comparison with CASCARA inSection 3.4). Stanojevic et al. used Shapley values to quantifythe value of individual flows under percentile pricing [28].Engineering the WAN egress. Recent work has proposed asoftware-defined edge to manage outbound flows from theirnetworks [27, 33]. The goal of these efforts has been to reactto poor client performance by switching to better perform-ing BGP next hops. The allocation decisions made by CAS-CARA can be implemented using a software defined edge likeEspresso or EdgeFabric. The subject of TE in multi-hoped net-works has been studied [12, 25] and we compare CASCARAwith a representative set of work from this space (§3.4).Engineering delay tolerant traffic. Previous work has ex-plored the potential of delaying traffic across timeslots to savebandwidth costs at the end of the billing cycle [21]. However,the cloud provider we analyze does not consider delayingclient traffic by several minutes as a viable option.Performance-based routing on the Internet. Google’sEspresso [33] implements performance-based routing on theInternet to improve client performance. Recently, other largeglobal networks have shown limited potential in optimizinglatency by routing [1, 26]. Our work effectively exploits thisrealization by optimizing cost while keeping latency stable.Bandwidth pricing schemes. In the early years of the Inter-net, economists studied potential mechanisms to price band-width [24]. Congestion pricing was proposed to bill based onthe use of network resources at times when they are scarce.These pricing schemes incentivize users to reduce consump-tion of network resources during peak utilization by pricingbandwidth higher when the network is congested.
8 Conclusion
In this work, we quantify the potential of saving inter-domainbandwidth costs in a large commercial cloud provider and findthat optimal allocations can save up to 60% of current inter-domain bandwidth costs while meeting all traffic demands asthey arrive. Inspired by this, we develop an efficient onlineTE framework, CASCARA, that achieves cost savings within10% of the optimal. CASCARA’s cost savings are robust tochanges in traffic patterns and peering rates. Finally, we showthat CASCARA can balance the cost-performance tradeoffby achieving 11-50% cost savings per cloud PoP withoutdegrading client latency significantly.
9 Acknowledgements
We thank our shepherd, Srikanth Sundaresan and the anony-mous reviewers for helping improve this work. We are gratefulto Anuj Kalia, Akshay Narayan, Arvind Krishnamurthy, DanCrankshaw, Emaad Manzoor and Phillipa Gill for their feed-back. We thank Ingrid Erkman, Brett Lewan and the AzureWAN team for their feedback on CASCARA’s design.
212 18th USENIX Symposium on Networked Systems Design and Implementation USENIX Association

References
[1] Todd Arnold, Matt Calder, Italo Cunha, Arpit Gupta,Harsha V. Madhyastha, Michael Schapira, and EthanKatz-Bassett. Beating bgp is harder than we thought. InProceedings of the 18th ACM Workshop on Hot Topicsin Networks, HotNets 2019, page 9?16, New York, NY,USA, 2019. Association for Computing Machinery.
[2] Dimitri P Bertsekas and Robert G Gallager. Data net-works, volume 2.
[3] CAIDA. CAIDA AS Classification. http://
data.caida.org/datasets/as-classification/,(Accessed on 2020-01-15).
[4] Matt Calder, Ryan Gao, Manuel Schröder, Ryan Stew-art, Jitendra Padhye, Ratul Mahajan, Ganesh Anantha-narayanan, and Ethan Katz-Bassett. Odin: Microsoft’sscalable fault-tolerant CDN measurement system. In15th USENIX Symposium on Networked Systems Designand Implementation (NSDI 18), pages 501–517, Renton,WA, April 2018. USENIX Association.
[5] Yi-Ching Chiu, Brandon Schlinker, Abhishek BalajiRadhakrishnan, Ethan Katz-Bassett, and Ramesh Govin-dan. Are we one hop away from a better internet? InProceedings of the 2015 Internet Measurement Confer-ence, pages 523–529, 2015.
[6] David Chou, Tianyin Xu, Kaushik Veeraraghavan, An-drew Newell, Sonia Margulis, Lin Xiao, Pol Mauri Ruiz,Justin Meza, Kiryong Ha, Shruti Padmanabha, et al.Taiji: managing global user traffic for large-scale inter-net services at the edge. In Proceedings of the 27th ACMSymposium on Operating Systems Principles, pages 430–446, 2019.
[7] Cloudflare. Cloudflare During the CoronavirusEmergency. https://blog.cloudflare.com/
cloudflare-during-the-coronavirus-emergency,(Accessed on 2020-03-12).
[8] CVX Research. Software for Disciplined Convex Pro-gramming. http://cvxr.com/, (Accessed on 2019-10-02).
[9] Dr. Peering. The Art of Peering: The Peering Play-book. http://drpeering.net/white-papers/
Art-Of-Peering-The-Peering-Playbook.html,(Accessed on 2020-08-01).
[10] Free Press. Net Neutrality. https://www.
freepress.net/issues/free-open-internet/
net-neutrality, (Accessed on 2020-01-19).
[11] GNU. GNU Linear Programming Kit. https://
www.gnu.org/software/glpk/, (Accessed on 2019-10-02).
[12] David K Goldenberg, Lili Qiuy, Haiyong Xie,Yang Richard Yang, and Yin Zhang. Optimizing costand performance for multihoming. ACM SIGCOMMComputer Communication Review, 34(4):79–92, 2004.
[13] L. Golubchik, S. Khuller, K. Mukherjee, and Y. Yao.To send or not to send: Reducing the cost of data trans-mission. In 2013 Proceedings IEEE INFOCOM, pages2472–2478, 2013.
[14] Igor Griva, S Nash, and Ariela Sofer. Linear and Non-linear Optimization: Second Edition. 01 2009.
[15] Gurobi. GUROBI Optimization. https://www.
gurobi.com/, (Accessed on 2019-10-02).
[16] Yotam Harchol, Dirk Bergemann, Nick Feamster, EricFriedman, Arvind Krishnamurthy, Aurojit Panda, SylviaRatnasamy, Michael Schapira, and Scott Shenker. A pub-lic option for the core. SIGCOMM ’20, page 377–389,New York, NY, USA, 2020. Association for ComputingMachinery.
[17] Chi-Yao Hong, Srikanth Kandula, Ratul Mahajan, MingZhang, Vijay Gill, Mohan Nanduri, and Roger Watten-hofer. Achieving high utilization with Software-drivenWAN. SIGCOMM, 2013.
[18] IBM. CPLEX Optimizer. https://www.ibm.com/
analytics/cplex-optimizer, (Accessed on 2019-10-02).
[19] Sushant Jain, Alok Kumar, Subhasree Mandal, JoonOng, Leon Poutievski, Arjun Singh, Subbaiah Venkata,Jim Wanderer, Junlan Zhou, Min Zhu, Jon Zolla, UrsHölzle, Stephen Stuart, and Amin Vahdat. B4: Experi-ence with a Globally-deployed Software Defined Wan.SIGCOMM, 2013.
[20] Virajith Jalaparti, Ivan Bliznets, Srikanth Kandula, Bren-dan Lucier, and Ishai Menache. Dynamic Pricing andTraffic Engineering for Timely Inter-Datacenter Trans-fers. In SIGCOMM’16, 2016.
[21] Nikolaos Laoutaris, Georgios Smaragdakis, Pablo Ro-driguez, and Ravi Sundaram. Delay tolerant bulk datatransfers on the internet. In Proceedings of the eleventhinternational joint conference on Measurement and mod-eling of computer systems, pages 229–238, 2009.
[22] Steven Levy. In the plex: How Google thinks, works,and shapes our lives. Simon and Schuster, 2011.
[23] Wenxin Li, Xiaobo Zhou, Keqiu Li, Heng Qi, and DekeGuo. Trafficshaper: shaping inter-datacenter traffic toreduce the transmission cost. IEEE/ACM Transactionson Networking, 26(3):1193–1206, 2018.
USENIX Association 18th USENIX Symposium on Networked Systems Design and Implementation 213

[24] Jeffrey K MacKie-Mason and Hal R Varian. Pricing con-gestible network resources. IEEE journal on SelectedAreas in Communications, 13(7):1141–1149, 1995.
[25] B. Quoitin, C. Pelsser, L. Swinnen, O. Bonaventure,and S. Uhlig. Interdomain traffic engineering with bgp.Comm. Mag., 41(5):122?128, May 2003.
[26] Brandon Schlinker, Italo Cunha, Yi-Ching Chiu,Srikanth Sundaresan, and Ethan Katz-Bassett. Inter-net performance from facebook?s edge. In Proceedingsof the Internet Measurement Conference, IMC ?19, page179?194, New York, NY, USA, 2019. Association forComputing Machinery.
[27] Brandon Schlinker, Hyojeong Kim, Timothy Cui, EthanKatz-Bassett, Harsha V Madhyastha, Italo Cunha, JamesQuinn, Saif Hasan, Petr Lapukhov, and Hongyi Zeng.Engineering egress with Edge Fabric: Steering oceans ofcontent to the world. In Proceedings of the Conferenceof the ACM Special Interest Group on Data Communi-cation, pages 418–431. ACM, 2017.
[28] Rade Stanojevic, Nikolaos Laoutaris, and Pablo Ro-driguez. On economic heavy hitters: shapley valueanalysis of 95th-percentile pricing. In Proceedings ofthe 10th ACM SIGCOMM conference on Internet mea-surement, pages 75–80, 2010.
[29] TeleGeography. The State of the Network. https:
//www2.telegeography.com/hubfs/assets/
Ebooks/state-of-the-network-2019.pdf, (Ac-cessed on 2020-01-19).
[30] TIME. Netflix’s Disputes With Verizon, ComcastUnder Investigation. https://time.com/2871498/
fcc-investigates-netflix-verizon-comcast/,(Accessed on 2020-01-19).
[31] Brian Trammell and Benoit Claise. Specification ofthe IP flow information export (IPFIX) protocol for theexchange of flow information. RFC7011, 2013.
[32] Florian Wohlfart, Nikolaos Chatzis, Caglar Dabanoglu,Georg Carle, and Walter Willinger. Leveraging intercon-nections for performance: the serving infrastructure of alarge cdn. In SIGCOMM, pages 206–220, 2018.
[33] KK Yap, Murtaza Motiwala, Jeremy Rahe, Steve Pad-gett, Matthew Holliman, Gary Baldus, Marcus Hines,TaeEun Kim, Ashok Narayanan, Ankur Jain, Victor Lin,Colin Rice, Brian Rogan, Arjun Singh, Bert Tanaka,Manish Verma, Puneet Sood, Mukarram Tariq, Matt Tier-ney, Dzevad Trumic, Vytautas Valancius, Calvin Ying,Mahesh Kallahalla, Bikash Koley, and Amin Vahdat.Taking the Edge off with Espresso: Scale, Reliabilityand Programmability for Global Internet Peering. InSIGCOMM’17, 2017.
[34] Doron Zarchy, Amogh Dhamdhere, Constantine Dovro-lis, and Michael Schapira. Nash-peering: A new techno-economic framework for internet interconnections. InIEEE INFOCOM 2018-IEEE Conference on ComputerCommunications Workshops (INFOCOM WKSHPS),pages 403–408. IEEE, 2018.
[35] Zheng Zhang, Ming Zhang, Albert Greenberg, Y. Char-lie Hu, Ratul Mahajan, and Blaine Christian. Optimiz-ing cost and performance in online service providernetworks. In Proceedings of the 7th USENIX Confer-ence on Networked Systems Design and Implementation,NSDI’10, page 3, USA, 2010. USENIX Association.
A Appendix
A.1 Speeding the MIP solutionIn this section we briefly describe the intuitive but ineffectivemethods we employed to speed the execution of the MILP.The methods did not yield a reduction in running time but wedocument these for completeness.
Solving the MILP in smaller time slices. Since link utiliza-tions at the edge exhibit strong daily and weekly seasonality,we hypothesized that solving the cost optimization in smallerchunks of time, say, one week at a time, and then stitchingtogether the resulting solutions would find the entire month’soptimal allocations. While the smaller problems of weeklyallocations could be solved in approximately ten minutes,when stitched together, the overall solution is very far fromoptimal. In fact, the allocations obtained via this process didnot show any significant reduction in inter-domain bandwidthcost over the present-day traffic allocations. On investigatingthe reason why this approach does not work, we found thatwhile there are regular trends in the traffic demand, bursts oftraffic are not spread uniformly across all weeks of a month.Accommodating these bursts with a local, week-long viewleads to overall poor cost saving from the stitched allocations.
Automated parameter tuning. The commercial solver weused (Gurobi), provides a tool for automatically tuning theparameters of the solver for a given optimization model. Weattempted to use this tool to find parameters which gave thebest performance in terms of running time and closeness tothe optimal. However, our model was too large for the auto-tune to deliver any results. Thus, we selected the appropriateparameter values manually by several runs of the optimization.These parameters are documented in the code repository wehave released.
A.2 CASCARA’s link augmentation orderWe show that changing the order of links that CASCARA aug-ments during the billing cycle does not make an unfeasible
214 18th USENIX Symposium on Networked Systems Design and Implementation USENIX Association

allocation, feasible. We take the example of an unfeasible or-dering, Oun f easible where the demand in timeslot k cannot bemet even after augmenting the capacity of all links. Considerthe following change in the position of link li in the ordering:if li is picked for augmenting in timestamp k in place of times-tamp j where j k. If this were possible, then CAPACITY(li)would be available for use in timestamp k. However, this isnot possible since li had to be the smallest capacity link thatmet the excess demand of timeslot j, any other link that takesits place has to have a higher capacity. This means that by us-ing another link in place of li, we would reduce the availablecapacity in timeslot k. Thus, a change in ordering of links foraugmentation would not make a problem instance feasible.
A.3 Traffic allocation with CASCARA
In this section we discuss details of the CASCARA allocationalgorithm which were omitted in Section 4 for brevity. Thecomplete algorithm, Algorithm 3, expands on Algorithm 2. Lis the set of links in the network in the increasing order of theipeering rate. The algorithm shows how CASCARA allocatesflow to links in every timestamp of the billing period. Thesolution to this algorithm are link allocations in all time steps.CASCARA maintains a priority queue of links and the priorityof a link is decided based on two factors:
• Initial priority: all links have their initial priority set tothe number of free time slots they have in the currentbilling cycle. We update the priority after augmenting thelink. In any subsequent billing timeslots, if the demand ishigher than Cf , links with lower priority i.e., ones whichwere used in the previous slots are re-used again. Thisensures that the link augmentation is not spread acrossmany links.
• Link capacity: We prefer to augment lower capacity linksto save the higher capacity links for the remaining billingcycle. If the demand is too high, high capacity links aremore likely to absorb it with augmentation.
We also kep track of the remaining free slots for each link.When all links have exhausted their free slots, allocation inthat timestep fails and we have to increment Cf . Let O be theorder in which links got augmented. An example ordering ofaugmented links, O is like so:
O = {[l1, l2, l3], [l1, l2, ], ..[lk, lk+1, lk+2,..]}In timestamp 1, CASCARA augmented allocations to links
l1, l2 and l3. The starting priority of links is the same, sothe priority queue returns links in ascending order of theircapacity. In the next timeslot, CASCARA attempts to meetthe demand by augmenting the same set of links to keepallocations stable.
CASCARA initializes Cf to the minimum value that pro-duced a feasible traffic allocation for the previous month. If
Cf is too low for the current month’s demands, despite aug-menting allocation to links, the traffic demand would not bemet and Cf will be incremented by b. The augmented linkordering of an infeasible allocation would be like so:
Oun f easible = {[l1, l2..], ..., [lk, lk+1, .., lm]}
where Âmk CAPACITY(li) demand �Cf .
Additionally, CASCARA has a provision to proactively in-crement Cf by a (not shown in the algorithm). The goal isto proactively perform an inevitable increase in Cf to avoidwasting free slots of links. To do this, CASCARA checks ifthe number of links with free slots remaining is proportionalto the amount of time left in the billing cycle. If the numberof burstable links are too few„ Cf is incremented proactively.
Algorithm 3: Online Traffic Allocation (long version)Result: Allocation of demand d in every timestamp tInput: L,n,k, f ,CAPACITY,C,a,bInitialization:freeslots = k
100 ⇤nprio = freeslots . Initial priority of all links
linkq = PRIORITYQUEUE()for link 2 L do
linkq.insert(link, CAPACITY(link), freeslots, prio)
Function allocate_timestep(d, f):link_alloc = {}augmented_links = []Cf = f ⇤C . Fraction f of total capacity Cif d Cf then
link_alloc = bin_pack(L,Cf )else
d = d �Cfwhile d � 0 do
b_link = linkq.pop()if !b_link then
return {}augmented_links.add(b_link)if b_link 2 L1 then
d = d � (1 - f)⇤ CAPACITY(b_link)else
d = d � CAPACITY(b_link)link_alloc [b_link]= CAPACITY(b_link)
for link 2 augmented_links dolink.prio = link.prio �1link.free_slots = link.free_slots �1
return link_allocEnd Functionwhile not allocate_timestep(d, f ) do
f = f +d
USENIX Association 18th USENIX Symposium on Networked Systems Design and Implementation 215

A.3.1 Link utilization below the billable bandwidth
CASCARA chooses the target billable bandwidth (Cf ) for amonth. Given the billable bandwidth, it can be packed on tolinks by greedily assigning traffic ot cheaper links. 4 Giventhe minimum feasible Cf , this strategy is optimal. In fact,utilizing any link below its 95th percentile utilization is uneco-nomical – the link gets charged at the 95th percentile anyway.Figure 13a shows that while the utilization in some billingslots was below the 95th percentile (shaded red), yet, the linkwas billed for 15% of its capacity, making the period of uti-lization below 15%, wasteful.
(a) Link utilizations.
0.00
0.25
0.50
0.75
1.00
0.25 0.50 0.75 1.00Pearson Correlation Coefficient
CD
F
(b) Pearson’s correlation.
●
●●
●● ● ●
●●
●●
● ●
●● ● ● ● ● ● ● ●
●●
● ●
010203040506070
6−2018
7−2018
8−2018
9−201810−2
01811−2
01812−2
0181−2
0192−2
0193−2
0194−2
0195−2
0196−2
019
Month
Perc
ent c
ost s
avin
g ● ●Optimal Pretium
(c) Pretium vs. Optimal saving
Figure 13: (a) Utilization of a link as fraction of its capacity, sortedfrom high to low across billing slots in a month. (b) 95th %-ileand avg. of top 10% correlation.(c) Cost saving by CASCARA vs.Pretium [20] on a month-by-month basis.
A.4 Details on the implementation of previoussystems
We implement the optimization formulation from previouswork using top 10% of utilizations in a month as the band-width cost of a link. We use CVXPY’s implementation ofsum of largest decision variables for this purpose. Since this
4We have discussed the additional routing and client latency constraintson CASCARA in §5.
0.025
0.050
0.075
0.025 0.050 0.075alpha
beta
50.052.555.057.5
Figure 14: Average monthly bandwidth cost saving with CASCARAas a function of the parameters a and b. We choose the best valuesof a and b for the evaluation in §5.
formulation is a linear program, GUROBI solves it in lessthan a minute. While fast to compute, the allocations from thisformulation are ineffective in saving the 95th percentile cost.Figure 13c compares the cost savings per-month between oursolutions from Algorithm 1 and previous work. We note thatthe cost saving from the sum of top-k formulation are modest,11% on average for all instances. We believe this is becauseof two assumptions made by previous work:
Assumption 1: 95th percentile of a link’s utilization is lin-early correlated with the average of top k utilizations [20].We evaluate this assumption using the utilizations of over50 peering links in a cloud WAN. These links connect thecloud WAN to large ISPs in N. America. We compute thePearson correlation coefficient to measure the extent to whichthe average of top 10% utilizations can be used as a proxy for95th percentile utilization of inter-domain links. We find thatthe correlation coefficient for over 25% of the links is lessthan 0.5. Since previous work’s hypothesis was derived fromthe data of a single WAN link measured a few years ago, thecorrelation between average of top 10% and 95th percentileutilization may exist for some links but not all. Ever-changingtraffic patterns from WANs due to the advent of new serviceslike gaming also explain this difference.
Assumption 2: The correlation between average of top-k and95th percentile of a link’s utilization holds even after a newtraffic allocation scheme replaces the current one. There isno guarantee that assumptions about allocation distributionshold in a newly proposed traffic engineering scheme. In fact,traffic engineering schemes change the allocation of flowalong network links, modifying how links are utilized.
A.5 Selecting CASCARA’s hyperparametersWe sweep through potential values of a and b to find the onesthat fit CASCARA the best. The range of values for a and bis [0,1] since they represent increments to fraction of totalnetwork capacity. We sweep the space in steps of 0.01 to findthe parameters that lead to the highest cost savings in theaverage case across all billing cycles (Figure 14).
216 18th USENIX Symposium on Networked Systems Design and Implementation USENIX Association