Embed Size (px)
Citation preview

Report prepared for Health Quality & Safety Commission
Cost benefit analysis of the surgical safety checklist Final draft
Martin Hefford and Gary Blick
18 June 2012

Surgical safety checklist Page i Privileged and Confidential
About Sapere Research Group Limited Sapere Research Group is one of the largest expert consulting firms in Australasia and a leader in provision of independent economic, forensic accounting and public policy services. Sapere provides independent expert testimony, strategic advisory services, data analytics and other advice to Australasia’s private sector corporate clients, major law firms, government agencies, and regulatory bodies.
Wellington Level 9, 1 Willeston St PO Box 587 Wellington 6140 Ph: +64 4 915 7590 Fax: +64 4 915 7596
Auckland Level 17, 3-5 Albert St PO Box 2475 Auckland 1140 Ph: +64 9 913 6240 Fax: +64 9 913 6241
Sydney Level 14, 68 Pitt St GPO Box 220 NSW 2001 Ph: + 61 2 9234 0200 Fax: + 61 2 9234 0201
Canberra Level 6, 39 London Circuit PO Box 266 Canberra City ACT 2601 Ph: +61 2 6263 5941 Fax: +61 2 6230 5269
Melbourne Level 2, 65 Southbank Boulevard GPO Box 3179 Melbourne, VIC 3001 Ph: + 61 3 9626 4333 Fax: + 61 3 9626 4231
For information on this report please contact:
Name: Gary Blick
Telephone: 09 281 2130
Mobile: 021 107 1141
Email: [email protected]

Surgical safety checklist Page i Privileged and Confidential
Contents Executive summary ....................................................................................................... 3
Our task and approach taken ........................................................................................ 4 A framework for costs and benefits 4
Studies that assess the checklist .................................................................................... 6 Improved clinical outcomes 6 Evidence of financial impacts is more limited 8 Securing ongoing benefits requires a sustained commitment 8
Implementation in New Zealand ................................................................................ 10 Reporting to the National Minimum Dataset 10 An insight into avoidable resource use 11 District health board perspectives 13
Estimating the costs .................................................................................................... 15 Start-up costs 15 Ongoing costs 15 Summary of cost scenarios 16 Potential costs considered but not included 16
Estimating the benefits ............................................................................................... 17 Estimating the rate of complications 17 Estimating the efficacy of the checklist 18 Adjusting for current use of the checklist 18 Determining the marginal cost 19 Summary of avoided hospital cost scenarios 19 Summary of avoided ACC claims 20
Is systematic use of the surgical checklist a worthwhile investment? ........................ 21 Ten-year costs and benefits 21 Estimating net present value 22 Limitations 23 Conclusions 24
References ................................................................................................................... 25
Page ii Surgical safety checklist Privileged and Confidential
Tables Table 1: Clinical impact of surgical safety checklist – evidence 6
Table 2: Estimating resource use in removing a foreign body, 2007/08-2010/11 12
Table 3: District health board personnel interviews – selected responses 14
Table 4: Assumptions for the use of prophylactic antibiotics 16
Table 5: Summary of estimated costs 16
Table 6: Assumptions for the rate of surgical complications 17
Table 7 : Assumptions for checklist impact on the incidence of complications 18
Table 8: Summary of benefit assumptions and avoided hospital costs 19
Table 9: Accepted ACC claims of retained equipment and wrong surgery 20
Table 10: Summary of costs and benefits over a ten-year period 22
Table 11: Net present value over ten years and cost-benefit ratios 22
Figures Figure 1: A cost-benefit framework 5
Figure 2: Events reported to the National Minimum Dataset, 2007/08-2010/11 11
Figure 3: Costs, benefits, and net benefits over ten years – base case scenario 21
Surgical safety checklist Page 3 Privileged and Confidential
Executive summary This report concludes that more systematic use of the surgical safety checklist is likely to lead to reductions in avoidable complications resulting from surgery. We formed this view after reviewing the international literature on use of the checklist, analysing the available hospital data and claims to the Accident Compensation Corporation, and interviewing a selection of district health board personnel responsible for quality and safety initiatives.
We modelled the expected costs and benefits associated with systematic use of the checklist and found that we could be expect a net financial benefit to the public-funded health system in New Zealand under all credible assumptions examined. Our base case scenario suggests that the publicly-funded health sector would be $43.0 million better off financially over a ten-year period. Our credible range is relatively wide; being between $91.4 million (best case) and $4.4 million (worst case). The wide range arises from uncertainty about the size of some of the assumptions used to model the range of potential benefits; for example, a lack of reliable information about the current use of the checklist by surgical teams, and uncertainty as to the marginal additional cost of an adverse event.
The steady state annual benefit to the health system is estimated to be $5.7 million, with the plausible range being $1.3 million to $14.5 million. We roughly estimate that the base case benefits could be up to $250,000 per year for a district health board with a small to medium hospital, and up to $750,000 per year for those boards with a medium to large hospital.
The financial benefits to the health system arise primarily from reduced hospital costs per episode from avoided complications of surgical care. Such additional costs can take the form of a longer length of stay and additional surgical or medical procedures in response to the adverse event. The benefit from avoiding these costs may not result in immediately bankable savings, but would free up resources to be used for treating other patients.
An economic analysis that looks at the wider societal benefits, such as avoided harm and associated time off from employment, is also likely to be positive. The key surgical safety checklist studies suggest that reductions in mortality associated with surgery is possible.
Many of the interview responses were consistent with themes in published reports about checklist use elsewhere. Those themes include:
• the costs of implementing the checklist were minimal and absorbed in existing budgets; • no observed negative impact on theatre productivity or surgical throughput; • clinical staff are usually supportive of implementation, but routine use of a simple
checklist comes with a risk of it being treated as a compliance exercise; • internal audits show the checklist is not currently being completed on a consistent basis; • the teamwork module of the Productive Operating Theatre programme provides a way
to get more focus on the checklist and on communication within surgical teams.
Our overall conclusion is that there is scope to make more consistent use of the checklist within the New Zealand health system, and that the cost of the intervention is likely to be low, which means that only small volumes of avoided complications would be required to make it worthwhile. An initiative aimed at securing systematic checklist use is therefore likely to provide a net financial benefit to the health system, as well as saving lives.
Page 4 Surgical safety checklist Privileged and Confidential
Our task and approach taken 1. The Health Quality & Safety Commission engaged Sapere Research Group to
undertake a cost benefit analysis of more systematic use of the World Health Organisation’s surgical safety checklist in New Zealand. The Commission acknowledged, that due to a lack of readily available information relating to current use of the checklist, that some degree of estimation would be required.
2. In outlining this project, the Commission advised that although most district health boards and some private hospitals use the checklist in some or all of their operating theatres, it is not yet considered to be fully and consistently implemented.
3. The approach adopted here is a financial cost benefit analysis from the perspective of the publicly-funded health system. This involves weighing up plausible costs and benefits to determine if the health system would financially benefit from more systematic use of the checklist. This financial approach has been pursued, rather than an economic analysis, partly for feasibility reasons and partly because a positive result for the health system would likely be accompanied by societal benefits, such as improvements in the quality and length of life.
4. Our approach to estimating the costs and benefits of the systematic use of the checklist relied on information sourced via the following methods:
(a) published literature featuring the results of peer-reviewed studies to determine plausible ranges for key variables. We were also able to gain access to pre-publication versions of soon-to-be-released journal articles;
(b) using readily available New Zealand data as a cross-check on the plausibility of the values determined in (a); and
(c) interviews with sector experts. We conducted interviews with staff involved in implementing the checklist at three district health boards – Auckland, Waitemata and Whanganui. This provided a qualitative ‘frontline’ perspective to inform our assumptions. We also interviewed experts within the Ministry of Health to determine available data and the scope for further analysis.
A framework for costs and benefits 5. To help think through the potential costs and benefits of the checklist we developed
a simple framework, shown below in Figure 1. It breaks down the potential costs of systematic use of checklist into start-up costs (the initial one-off costs of checklist implementation within district health boards) and ongoing costs (per use costs, such as additional prophylactic antibiotics and theatre time taken to complete the checklist).
6. Quantifying the benefits of systematic use of the checklist involves estimating avoidable hospital costs by looking at the number of the adverse events and the average cost that such events add to a discharge. It also involves looking at claims to the Accident Compensation Corporation that result from avoidable surgical error, such as those involving the wrong patient/site/procedure and retained items.

Surgical safety checklist Page 5 Privileged and Confidential
Figure 1: A cost-benefit framework
Source: Sapere Research Group
7. Our approach has been to form assumptions for each of these components using
information sourced from the New Zealand health system, where possible, and validating those values with findings in the international literature and debate.
8. We have focused on the marginal costs and marginal benefits of more systematic use of the checklist. This means the additional costs involved beyond those already incurred in district health board implementation programmes and the benefits beyond those already being secured by partial use of the checklist.
Start-up costs• Programme coordination • Clinical staff training
Ongoing costs• Per-use costs, e.g. additional
antibiotic prophylaxis• Lost theatre time
Avoided hospital costs• Estimated rate of adverse
events multiplied by current volume of discharges
x• Marginal cost of adverse
event on the total dischargex
• % amendable to checklist impact given estimate of current uptake of checklist
Potential Costs Potential Benefits
Avoided ACC claims• Average event cost of
assocaited claims
Net benefitBenefits less costs
Page 6 Surgical safety checklist Privileged and Confidential
Studies that assess the checklist 9. Published peer-reviewed research provides clear evidence that full and consistent use
of a surgical safety checklist has been associated with improved clinical outcomes. Research into the associated financial costs and benefits is much more limited, although the key study found that the checklist to be a cost saving quality improvement strategy.
Improved clinical outcomes 10. The World Health Organisation advocates the use of the surgical safety checklist as a
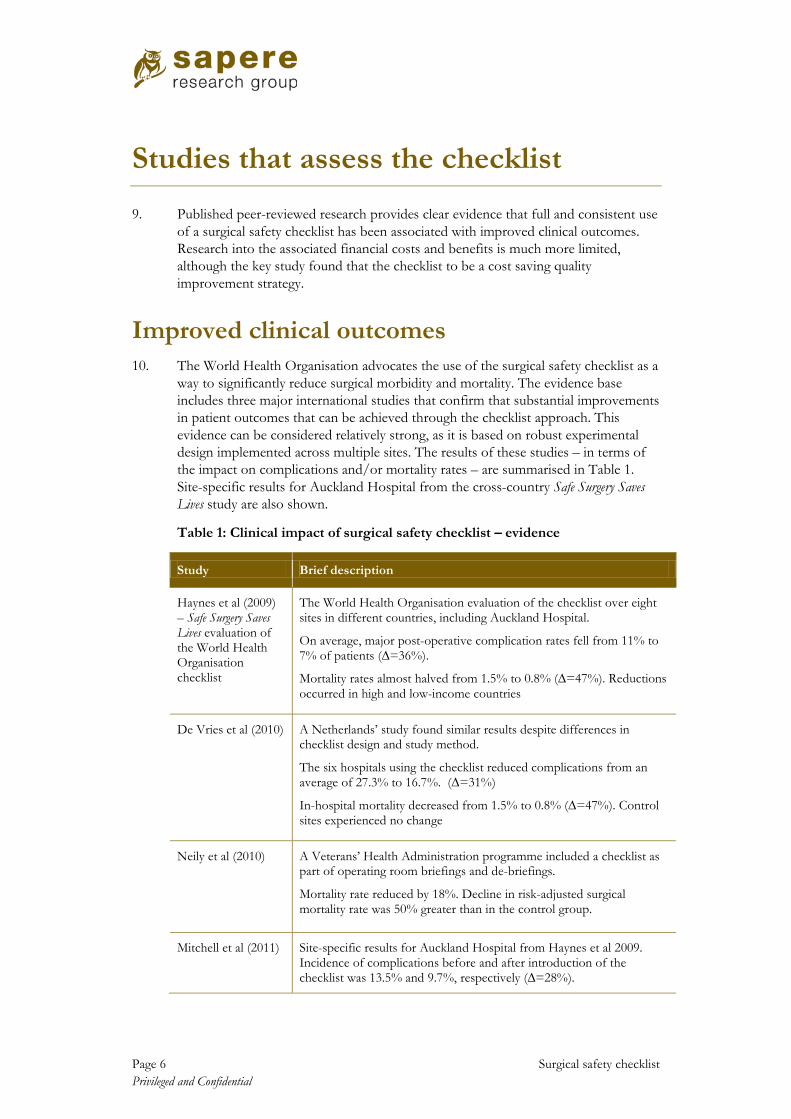
way to significantly reduce surgical morbidity and mortality. The evidence base includes three major international studies that confirm that substantial improvements in patient outcomes that can be achieved through the checklist approach. This evidence can be considered relatively strong, as it is based on robust experimental design implemented across multiple sites. The results of these studies – in terms of the impact on complications and/or mortality rates – are summarised in Table 1. Site-specific results for Auckland Hospital from the cross-country Safe Surgery Saves Lives study are also shown.
Table 1: Clinical impact of surgical safety checklist – evidence
Study Brief description
Haynes et al (2009) – Safe Surgery Saves Lives evaluation of the World Health Organisation checklist
The World Health Organisation evaluation of the checklist over eight sites in different countries, including Auckland Hospital.
On average, major post-operative complication rates fell from 11% to 7% of patients (∆=36%).
Mortality rates almost halved from 1.5% to 0.8% (∆=47%). Reductions occurred in high and low-income countries
De Vries et al (2010) A Netherlands’ study found similar results despite differences in checklist design and study method.
The six hospitals using the checklist reduced complications from an average of 27.3% to 16.7%. (∆=31%)
In-hospital mortality decreased from 1.5% to 0.8% (∆=47%). Control sites experienced no change
Neily et al (2010) A Veterans’ Health Administration programme included a checklist as part of operating room briefings and de-briefings.
Mortality rate reduced by 18%. Decline in risk-adjusted surgical mortality rate was 50% greater than in the control group.
Mitchell et al (2011) Site-specific results for Auckland Hospital from Haynes et al 2009. Incidence of complications before and after introduction of the checklist was 13.5% and 9.7%, respectively (∆=28%).

Surgical safety checklist Page 7 Privileged and Confidential
11. The reduction in post-operative complications following the introduction of the checklist ranges from 28.1% at Auckland Hospital (Mitchell et al, 2011) to 31.2% in the Netherlands’ study (De Vries et al, 2010) to 36.4% in the cross-country Safe Surgery Saves Lives study (Haynes et al, 2009).
12. The range of complications under consideration is outlined in Haynes et al (2010). The Safe Surgery Saves Lives study examined patient records for post-operative hospitalisation (up to 30 days), and used definitions of major complications sourced from the American College of Surgeons' Quality Improvement Program, including:
• acute renal failure • bleeding requiring the transfusion of 4 or more units of red cells within the first
72 hours after surgery • cardiac arrest requiring cardiopulmonary resuscitation • coma of 24 hours' duration or more • deep-vein thrombosis • myocardial infarction • unplanned intubation • ventilator use for 48 hours or more • pneumonia • pulmonary embolism • stroke • major disruption of wound • infection of surgical site, sepsis and septic shock • unplanned return to the operating room • vascular graft failure, and • death.
13. Reductions in mortality were wide ranging, from statistically no change at Auckland Hospital, to 18% in the Veterans’ Health Administration study (Neily et al, 2010), to nearly 50% in Haynes et al and De Vries et al. Mortality reductions are clearly of high importance, but given the focus of this report is on health system financial costs and benefits, we do not separate out mortality from the overall burden of complications.
14. The positive effects likely flow from improved communication among members of the surgical team. Haynes et al (2011) used a Safety Attitudes Questionnaire, as part of the Safe Surgery Saves Lives study, to show that improved postoperative outcomes were associated with improved safety awareness within surgical teams. Furthermore, the majority of clinicians surveyed (93%) indicated that they would want the checklist used if they were undergoing surgery themselves.1
1 Haynes AB, et al (2011) “Changes in safety attitude and relationship to decreased postoperative morbidity and mortality following implementation of a checklist...” BMJ Quality & Safety 2011;20;02-107
Page 8 Surgical safety checklist Privileged and Confidential
Evidence of financial impacts is more limited 15. Published research into the financial costs and benefits of the surgical safety checklist
is scarce. The key study is Semel et al (2011), which modelled the cost savings in an American hospital using the World Health Organisation checklist over a year. The study found the checklist was a “cost saving quality improvement strategy”, but noted that the results are dependent on the baseline rate of surgical complications and assumptions about the reduction in complications following checklist use.
16. Semel et al concluded that a hospital would realise a return on investment if at least five major surgical complications are prevented within the first year of using the checklist – assuming that the hospital has a baseline complication rate of 3%.2
17. Of note, is the authors’ assumption that the checklist does not, on average, lead to a net increase in theatre time per procedure. This assumption is based on evidence that their hospital throughput did not experience a decline associated with use of the checklist. This is consistent with the World Health Organisation guidance, which notes that completion of the checklist should not take more than three minutes in total per surgery. We note that this assumption is also consistent with New Zealand experience – as confirmed by talking with experts at selected district health boards.
Securing ongoing benefits requires a sustained commitment 18. Implementing the checklist is not without challenges. An assessment of the pilot
programme in the United Kingdom summarised these challenges, many of which are recurrent themes in other commentaries, and include:
• Incomplete – although the sign-in and time-out phases were usually completed, the sign-out phase was rarely completed;
• Hurried – surgeons and anaesthetists can give the impression that the checklist is delaying workflow, putting pressure on nurses to cover items quickly;
• Dismissive replies – answers that are in the affirmative but may be inaccurate often go unchallenged without a request for clarification by others;
• Absenteeism – the checklist being done when key people are absent, either not yet having arrived or having already departed the operating room.3
19. All of this can mean that the checklist is not always used, may be completed in part, or treated as a compliance burden or “tick-box” exercise. Other published works contain similar themes, as do the perspectives gleaned from our interviews with quality improvement experts at small sample of district health boards.
2 Semel ME et al (2011) “Adopting a surgical safety checklist could save money and improve the quality of care in U.S. hospitals” in Health Affairs, 2010 September 29(9)
3 Vats A, et al (2010) “Practical challenges of introducing WHO surgical checklist: UK pilot experience” British Medical Journal 2010;340:b5433
Surgical safety checklist Page 9 Privileged and Confidential
20. Qualitative research in five Washington state hospitals emphasises the importance of the implementation phase. The study found the effectiveness of the checklist hinges on the ability of implementation leaders to persuasively explain why, and show how, to use the checklist. Without adequate preparation and education, the checklist can lead to frustration, disinterest and abandonment – despite a mandate for its use.4
21. A follow-up study looked at the use of the checklist in Auckland Hospital, two years after participation in the cross-country Safe Surgery Saves Lives study.
5
22. Nevertheless, emerging evidence suggests that full and consistent completion of the checklist matters for clinical outcomes. In a recently published study, Van Klei et al (2012) looked at checklist completion and clinical outcomes in a study at a tertiary hospital in the Netherlands. The study found that in-hospital mortality decreased from 3.13% to 2.85% (∆=9.8%) following checklist implementation. Although this effect is smaller than previously reported, the study found that it was statistically significant. The study also found the effect was strongly related to full checklist compliance, with a much lower impact associated with partial compliance.
The checklist was “invariably utilised but often incompletely” with high rates of completion for the Sign In (99%) and Time Out (94%) domains. The Sign Out domain was usually omitted, with the rate of completion being 2%. The study noted that a potential reason may be confusion around the timing of this domain – which should be before the surgeons leave the operating room. This is consistent with other UK pilot assessments, which found that administration of checklist items declined after the initial introduction period – possibly due to the routine nature of the checklist.
6
4 Conley DM, et al (2011) “Effective Surgical Safety Checklist Implementation” in Journal of the American College of Surgeons, 2011, Vol. 212, Issue. 5
5 Vogts N, JA Hannam, AF Merry, and SJ Mitchell (2011) “Compliance and quality in administration of a surgical safety checklist in a tertiary New Zealand hospital”, New Zealand Medical Journal Vol. 123 No. 1342
6 Van Klei W, et al (2010) “Effects of the Introduction of the WHO “Surgical Safety Checklist” on In-Hospital Mortality: A Cohort Study” in Annals of Surgery January 2012 - Volume 255 – Issue 1

Page 10 Surgical safety checklist Privileged and Confidential
Implementation in New Zealand 23. Following an official launch in New Zealand by the Minister of Health in 2009, the
surgical safety checklist list was adopted by district health boards. The launch was accompanied by a public awareness campaign, endorsement of the professional Colleges, and implementation programmes developed and carried out by individual boards. Auckland District Health Board was already familiar with the checklist, having participated in the World Health Organisation’s Safe Surgery Saves Lives study.
24. The Health Quality & Safety Commission has noted that the checklist has been used with varying application. The Commission’s report on serious and sentinel events in 2010/11 shows that district health boards reported seven events involving retained items such as instruments or swabs and 11 events of wrong patient, site or procedure and in 2010/11 – although we understand that some of the latter group occurred in hospital settings other than the surgical operating theatre.
25. As noted above, research at Auckland Hospital found that, two years after implementing the checklist via the Safe Surgery Saves Lives study, it was not being wholly completed on a consistent basis.
Reporting to the National Minimum Dataset 26. As a further check on use of the surgical safety checklist, we asked the Ministry of
Health to look at events reported to the National Minimum Dataset – the national collection of hospital discharge information. Our focus was on adverse events that are relatively straightforward to identify, such as those relating to retained items and cases of wrong patient, site or procedure. If the checklist is being used consistently, the number of these events should be close to zero, or at least on a downward trend.
27. Relevant discharge records were identified using the presence of the following external cause codes:
• Y61.0 – Foreign object accidentally left in body... – during a surgical operation; and • Y65.5 – Performance of inappropriate operation.7
28. Figure 2 presents the results for the four years between 2007/08 and 2010/11. The number of records that included a coding of Y65.5 “performance of inappropriate operation” declined from seven in 2007/08 and 2008/09 to four in 2010/11. The number of records that included a coding of Y61.0 “foreign object accidentally left in body – during surgical operation” ranged from 46 in 2007/08 to 19 in 2008/09 to 61 in 2010/11. These events occurred in 16 of the 20 district heath boards. The fact that these sorts of avoidable adverse events are still occurring, following the launch and implementation of the surgical safety checklist, suggests that the checklist is not yet being used to its full potential.
7 ICD-10-AM 6th Edition

Surgical safety checklist Page 11 Privileged and Confidential
Figure 2: Events reported to the National Minimum Dataset, 2007/08-2010/11
Source: National Collections and Reporting, Ministry of Health
29. There are valid reasons why the number of discharge records with a code that relates to a retained item or an inappropriate operation differs from those reported in the Health Quality & Safety Commission’s reports on serious and sentinel events.
• The Commission relies on providers to determine, and report on, the severity of incidents that could have, or did, cause harm to a patient. Serious events are those that have led to significant additional treatment and sentinel events are those that have been life threatening, or have led to an unexpected death or major loss of function. In contrast, the National Minimum Dataset may include adverse events that were not judged to be serious or sentinel.
• The Commission’s reporting may capture events in hospital settings other than an inpatient setting. In contrast, reporting to the National Minimum Dataset relates to the clinical coding of events in an inpatient setting.
An insight into avoidable resource use 30. We examined the National Minimum Dataset records identified above for a marginal
impact on resource use. Records coded with an external cause code of Y61.0 (Foreign object accidentally left in body...) can be grouped into cases where this code represents the primary reason for admission to hospital (i.e. a patient recalled to hospital) and cases where it is a secondary diagnosis (i.e. event identified alongside primary treatment).
31. Table 2 shows that there were 31 discharge records between 2007/08 and 2010/11 with a primary diagnosis of a foreign object left in the body during a (previous) surgical episode and where a procedure was then performed to remove it. These records had an average cost of $4,540 and an average length of stay of 2.5 bed days.
32. In a further 65 cases, the presence of a foreign object was not the primary diagnosis, implying that the removal occurred soon after the initial surgery. These records had an average cost of $20,780 and an average length of stay of 9.9 days, part of which was incurred in removing the object (potentially up to 2.5 bed days at $4,450).
0
10
20
30
40
50
60
70
2007/08 2008/09 2009/10 2010/11
Number of events
(Y61.0) Foreign object accidentally left in body - during surgical operation
(Y65.5) Performance of inappropriate operation
Page 12 Surgical safety checklist Privileged and Confidential
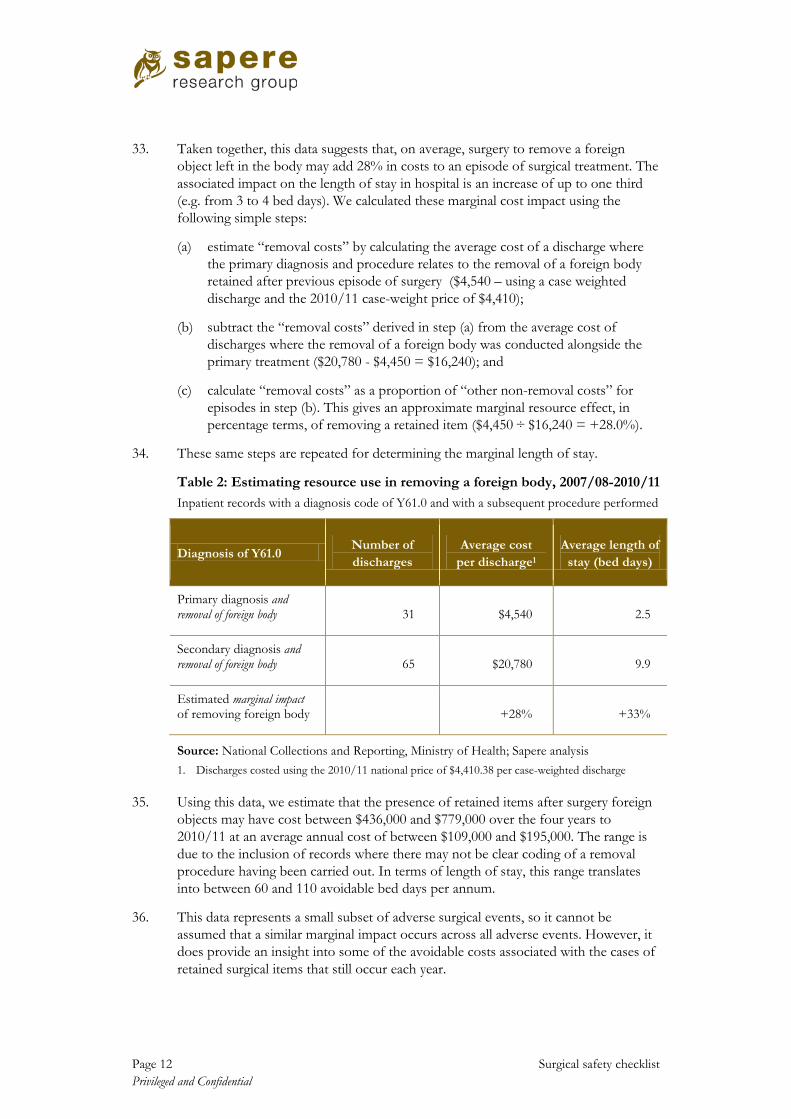
33. Taken together, this data suggests that, on average, surgery to remove a foreign object left in the body may add 28% in costs to an episode of surgical treatment. The associated impact on the length of stay in hospital is an increase of up to one third (e.g. from 3 to 4 bed days). We calculated these marginal cost impact using the following simple steps:
(a) estimate “removal costs” by calculating the average cost of a discharge where the primary diagnosis and procedure relates to the removal of a foreign body retained after previous episode of surgery ($4,540 – using a case weighted discharge and the 2010/11 case-weight price of $4,410);
(b) subtract the “removal costs” derived in step (a) from the average cost of discharges where the removal of a foreign body was conducted alongside the primary treatment ($20,780 - $4,450 = $16,240); and
(c) calculate “removal costs” as a proportion of “other non-removal costs” for episodes in step (b). This gives an approximate marginal resource effect, in percentage terms, of removing a retained item ($4,450 ÷ $16,240 = +28.0%).
34. These same steps are repeated for determining the marginal length of stay.
Table 2: Estimating resource use in removing a foreign body, 2007/08-2010/11 Inpatient records with a diagnosis code of Y61.0 and with a subsequent procedure performed
Diagnosis of Y61.0 Number of discharges
Average cost per discharge1
Average length of stay (bed days)
Primary diagnosis and removal of foreign body 31 $4,540 2.5
Secondary diagnosis and removal of foreign body 65 $20,780 9.9
Estimated marginal impact of removing foreign body
+28%
+33%
Source: National Collections and Reporting, Ministry of Health; Sapere analysis 1. Discharges costed using the 2010/11 national price of $4,410.38 per case-weighted discharge
35. Using this data, we estimate that the presence of retained items after surgery foreign objects may have cost between $436,000 and $779,000 over the four years to 2010/11 at an average annual cost of between $109,000 and $195,000. The range is due to the inclusion of records where there may not be clear coding of a removal procedure having been carried out. In terms of length of stay, this range translates into between 60 and 110 avoidable bed days per annum.
36. This data represents a small subset of adverse surgical events, so it cannot be assumed that a similar marginal impact occurs across all adverse events. However, it does provide an insight into some of the avoidable costs associated with the cases of retained surgical items that still occur each year.
Surgical safety checklist Page 13 Privileged and Confidential
District health board perspectives 37. We conducted interviews with personnel responsible for quality and safety initiatives
at three district health boards – Auckland, Waitemata and Whanganui. Each board is implementing the teamwork module of the Productive Operating Theatre programme, which recommends that briefings and debriefings be held among each the surgical team at the beginning and end of each day in addition to checklist use.
38. We asked about each board’s approach to implementing the checklist, the extent of its use, any barriers to wider use, evidence of benefits, and general reflections. Table 3 presents a selection of the responses. Although this approach provides a qualitative and often personal snapshot, many of the responses were consistent with themes in published reports about checklist use elsewhere. Those themes include:
(a) the costs of implementing the checklist were either seen as minimal and/or absorbed within existing budgets;
(b) no observed negative impact on theatre productivity or surgical throughput;
(c) clinical staff are usually supportive of implementation, but routine use of a simple checklist comes with a risk of it being treated as a compliance exercise;
(d) internal audits show the checklist is not being completed on a consistent basis;
(e) a serious event can be a catalyst for renewing commitment to the checklist; and
(f) the teamwork module of the Productive Operating Theatre programme can be a way to get more focus on the checklist and on surgical team communication.

Page 14 Surgical safety checklist Privileged and Confidential
Table 3: District health board personnel interviews – selected responses
Checklist implementation
Checklist use and impact
Reflections on the checklist
DHB ‘A’ • Quality coordinator prepared own materials in July 2010 – slides for meetings, newsletter items.
• Coordinator spent two months to prepare for the rollout of a trial, run over six weeks in three theatres.
• Heads of surgery, nursing and anaesthesia agreed to be checklist champions.
• Info sessions for nurses and anaesthetic technicians. DVD was helpful.
• A tendency to treat the questions as too simple to bother with, whereas better teamwork is the aim.
• Overall, a frustrating lack of buy-in from medical people. Circulating nurse usually leads the checklist.
• Checklist has helped catch some things in time, such as a potential wrong site.
• Have still had two incidents of retained items.
• Probably not seeing the full benefit of the checklist, as overall, it’s not done as well as it could be.
• No pre-assigned role to lead the checklist. Nurses usually do so, but can be intimidated. Doctors could lead more instead of waiting for nurses.
• Keen to move to the next stage in terms of getting more consistent use. This may be through TPOT.
DHB ‘B’ • Initial roll-out was two years ago, handled by the theatre coordinator, no special position established.
• Roll-out was worked into existing routine of theatre staff meetings. It becomes part of what has to be fitted in.
• Later, when the DHB launched the TPOT teamwork module, the operating theatres were closed for an afternoon so all staff could attend.
• No observed loss in throughput despite initial concerns being raised.
• Sign In was being skipped as patients were asked details on both sides of theatre door, as stay unit is directly attached. Checklist was adapted for this layout.
• An audit prior to TPOT found that anaesthetists and surgeons were patchy in their involvement.
• Checklist being treated as a tick-box exercise, with no incidents to drive its use.
• An evidence base helps motivate people. Checklist got more internal attention after the DHB had a ‘near miss’ for wrong-site surgery that it discussed as a case.
• The TPOT teamwork module was a chance to re-boot use of the checklist.
• Improvements in use now, also using it for procedures with local anaesthesia.
• Have not kept a systematic record of positive experiences or avoided incidents.
DHB ‘C’ • Received funding for two coordinators to roll-out the checklist (via WHO study).
• Clinical departments had a clinical champion – this was managed within business as usual budgets and processes.
• Checklist often conducted by the junior nurse. The surgeon may not be present at the opening stages.
• Sign Out stage is almost never done, partly because the surgeon tends to leave after the main part of the surgery with others closing the wound.
• Focus is now on TPOT’s teamwork module. Pre-briefings have had quite a positive response from teams – as helping communication and shared understanding of approach.
• The briefing is about how the team will work and the list of patients, whereas the checklist more about specifics of the patient in front of the team.
Source: Sapere Research Group – from semi-structured telephone interviews, February 2012 Interviews were conducted with quality and safety personnel at three district health boards involved in the teamwork module of the Productive Operating Theatre programme (TPOT).
Surgical safety checklist Page 15 Privileged and Confidential
Estimating the costs 39. We estimated the costs of the surgical safety checklist being consistently used in full
for surgical operations within district health boards. Our estimates are informed by the available literature and interviews with selected district health boards. The costs are grouped into the start-up costs of securing systematic use and ongoing costs.
Start-up costs 40. The base case of start-up costs assumes the following staff time commitments at
each district health board within the first year of an initiative aimed at securing systematic use of the checklist:
• 120 hours for an implementation coordinator; and • 40 hours for three clinical champions (a surgeon, an anaesthetist, and a nurse).
41. These costs reflect the opportunity cost of usual business and training work that would otherwise have been carried out in district health boards. The time and wage rate estimates were derived from Semel et al (2010) and converted to New Zealand dollars using an OECD purchasing power parity rate. As a sensitivity check, high-cost and low-cost scenarios were developed with values of 200% and 50% of the base case estimate for these district health board costs.
42. These estimates were cross–checked with an approach employed at a district health board, which involved a project coordinator being committed, part time, over the course of two months to prepare for the roll-out of an initial trial of the checklist. That approach also involved the time of three clinical champions drawn from surgeons, anaesthetists, and nurses. The coordination role and associated meetings with the champions were carried out within existing staff levels and budgets. Costs associated with training, education materials and publicity were seen as negligible.
43. We also factored a full-time national coordinator role for the first year of an initiative aimed at securing systematic checklist use. This role was included in the base case and retained for the high-cost and low-cost scenarios.
Ongoing costs 44. Semel et al (2011) cite the key ‘per-use’ input as being increased use of prophylactic
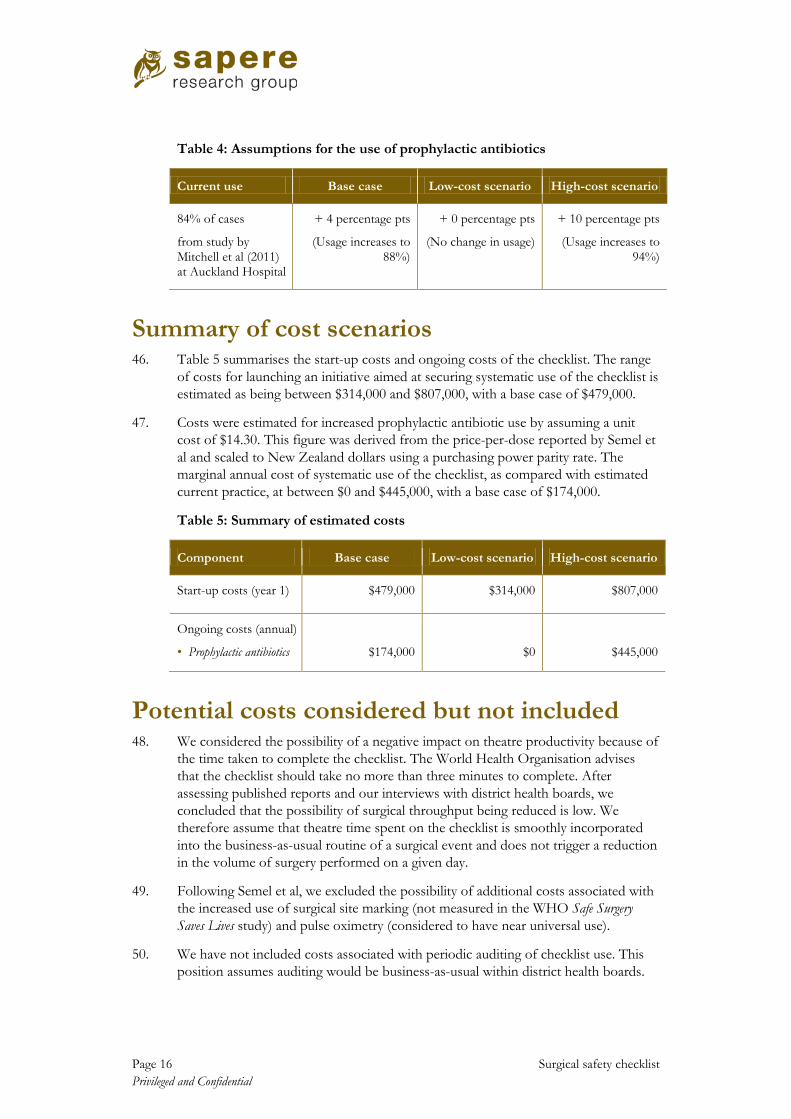
antibiotics – aimed at preventing complications for infections. We draw on the results from Mitchell et al (2011) for prophylactic antibiotics being “given appropriately” at Auckland Hospital. Prior to checklist use, antibiotics were given in 84% of cases. That figure increased to 88% following the introduction of the checklist. We use this 4 percentage point increase as our base case effect. Although we model this increase use as a cost, it would also likely contribute to the clinical benefits associated with the checklist. The timing of when prophylactic antibiotics are administered is also important and the checklist can help with this.
45. As a high-cost scenario, we used an upper bound of a 10 percentage point increase, allowing for antibiotics to be given in 94% of cases. For the low cost scenario, we assumed no change in prophylactic antibiotic use. This range is presented in Table 4.
Page 16 Surgical safety checklist Privileged and Confidential
Table 4: Assumptions for the use of prophylactic antibiotics
Current use Base case Low-cost scenario High-cost scenario
84% of cases
from study by Mitchell et al (2011) at Auckland Hospital
+ 4 percentage pts
(Usage increases to 88%)
+ 0 percentage pts
(No change in usage)
+ 10 percentage pts
(Usage increases to 94%)
Summary of cost scenarios 46. Table 5 summarises the start-up costs and ongoing costs of the checklist. The range
of costs for launching an initiative aimed at securing systematic use of the checklist is estimated as being between $314,000 and $807,000, with a base case of $479,000.
47. Costs were estimated for increased prophylactic antibiotic use by assuming a unit cost of $14.30. This figure was derived from the price-per-dose reported by Semel et al and scaled to New Zealand dollars using a purchasing power parity rate. The marginal annual cost of systematic use of the checklist, as compared with estimated current practice, at between $0 and $445,000, with a base case of $174,000.
Table 5: Summary of estimated costs
Component Base case Low-cost scenario High-cost scenario
Start-up costs (year 1) $479,000 $314,000 $807,000
Ongoing costs (annual)
• Prophylactic antibiotics
$174,000
$0
$445,000
Potential costs considered but not included 48. We considered the possibility of a negative impact on theatre productivity because of
the time taken to complete the checklist. The World Health Organisation advises that the checklist should take no more than three minutes to complete. After assessing published reports and our interviews with district health boards, we concluded that the possibility of surgical throughput being reduced is low. We therefore assume that theatre time spent on the checklist is smoothly incorporated into the business-as-usual routine of a surgical event and does not trigger a reduction in the volume of surgery performed on a given day.
49. Following Semel et al, we excluded the possibility of additional costs associated with the increased use of surgical site marking (not measured in the WHO Safe Surgery Saves Lives study) and pulse oximetry (considered to have near universal use).
50. We have not included costs associated with periodic auditing of checklist use. This position assumes auditing would be business-as-usual within district health boards.
Surgical safety checklist Page 17 Privileged and Confidential
Estimating the benefits 51. The financial benefits to the health system are assumed to primarily arise from
reduced hospital costs per episode from avoided complications of care, as a result of surgery. Intuitively, the additional costs can take the form of a longer length of stay (additional bed days) and additional surgical or medical procedures in response to the adverse event. The benefit from avoiding these costs does not manifest itself in reduced expenditure per se, but in a lower length of stay and avoided follow-up care – allowing those resources to be freed up for treating other patients sooner.
52. We used the following steps to estimate a plausible range for these benefits.
• Step 1 – estimate the rate of complications arising from surgery.
• Step 2 – apply that rate of complications to total surgical volumes (inpatient discharges) to derive a notional volume of discharges with an adverse event.
• Step 3 – estimate the efficacy of the surgical checklist in reducing those adverse events (i.e. the volume of adverse events amenable to the checklist).
• Step 4 – adjust the volume of events amenable to the checklist downwards, to factor in current use of the checklist among district health boards.
• Step 5 – apply an estimate of the marginal cost of the ‘adverse’ event portion of the remaining estimate of discharge records with adverse events.
53. We also looked at the average annual cost of claims accepted by ACC for personal injury due to surgical error. We focused on payments from the Treatment Injury Account that involved surgical equipment or a case of wrong site, patient or procedure. The logic is that avoiding such events would result in a cost saving.
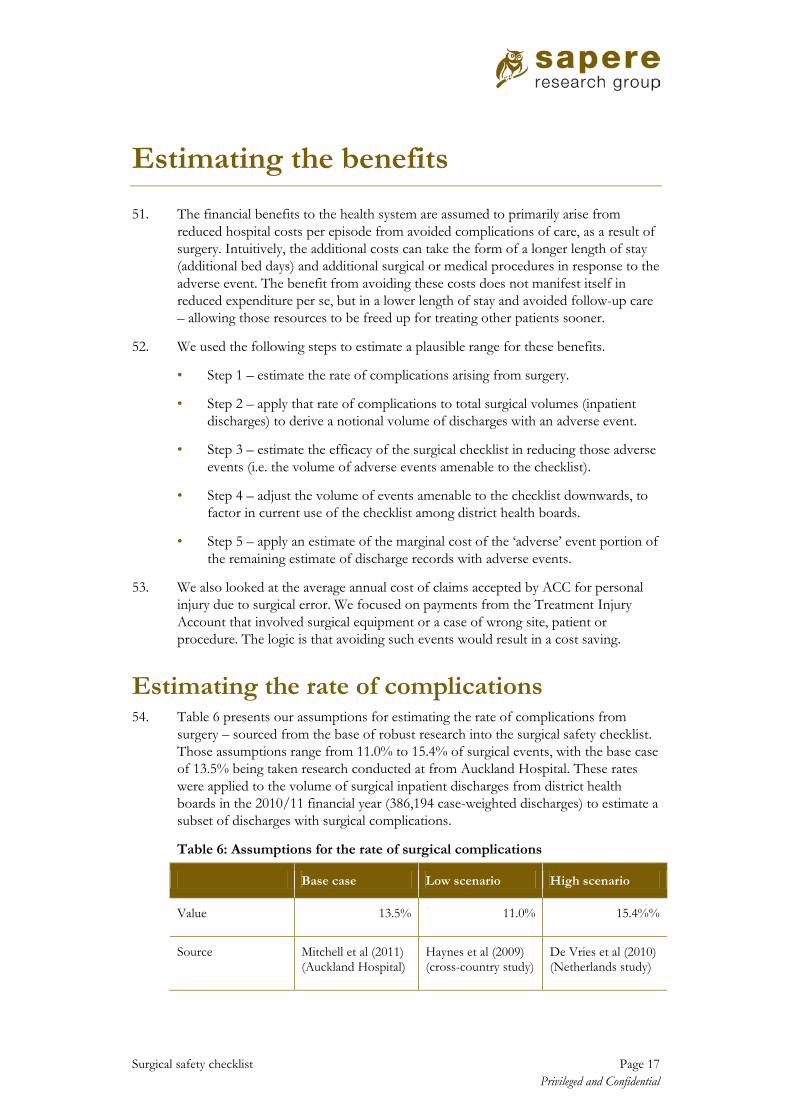
Estimating the rate of complications 54. Table 6 presents our assumptions for estimating the rate of complications from
surgery – sourced from the base of robust research into the surgical safety checklist. Those assumptions range from 11.0% to 15.4% of surgical events, with the base case of 13.5% being taken research conducted at from Auckland Hospital. These rates were applied to the volume of surgical inpatient discharges from district health boards in the 2010/11 financial year (386,194 case-weighted discharges) to estimate a subset of discharges with surgical complications.
Table 6: Assumptions for the rate of surgical complications
Base case Low scenario High scenario
Value 13.5% 11.0% 15.4%%
Source Mitchell et al (2011) (Auckland Hospital)
Haynes et al (2009) (cross-country study)
De Vries et al (2010) (Netherlands study)

Page 18 Surgical safety checklist Privileged and Confidential
55. These rates are comparable with other studies of adverse events, despite differences in method. Jackson et al (2011) examined hospital-acquired conditions in surgical and medical discharges in hospitals in Queensland and Victoria. This study used the Classification of Hospital-Acquired Diagnoses to estimate a rate of 10.9%.8, 9 A study of adverse events in New Zealand hospitals by Davis et al (2003) estimated that 6.3% of admissions were associated with preventable events of in-hospital origin.10
56. Taken together, this body of evidence suggests a plausible range for New Zealand of potentially avoidable complications arising from surgery is likely to lie between 10% and 15% – subject to differences in research methods and definitions of such events. We note that many of these complications will be of a minor nature, but that a few may be life threatening.
Estimating the efficacy of the checklist 57. The impact of the checklist on surgical complications does not vary greatly across
the key studies. For our base case, we used a reduction in complications of 28.1% – taken from the Auckland Hospital component of the cross-country study. We preferred to use this New Zealand-derived figure as our starting point, noting that the rate from De Vries et al was similar at 31.2%. For the high-benefit scenario we used a rate of 36.4% from Haynes et al, implying higher benefits from the checklist. The rate for the low-benefit scenario was set at 75% of our base case (i.e. 21.1%).
Table 7: Assumptions for checklist impact on the incidence of complications
Base case Low scenario High scenario
Reduction in complication rate
28.1% 21.1% 36.4%
Source Mitchell et a (201l) (Auckland Hospital)
Set at 75% of the base case rate
Haynes et al (2009) (cross-country study)
Adjusting for current use of the checklist 58. Current use of the checklist also needs to be taken into account. We assume current
use is less than 100%, given our look at national data and expert interviews. In the absence of a clear picture, our base case assumes the checklist is being used at 50% of its potential. For the high-benefit scenario, we assume current use is at 25%, implying more scope to secure further benefit. For the low-benefit scenario, we assumed current take up is at 75% – implying less scope to secure further benefit.
8 Jackson T, HS Nghiem, D Rowell, C Jorm, and J Wakefield (2011) “Marginal costs of hospital-acquired conditions...” in Journal of Health Services Research and Policy Vol. 6 No. 13
9 The Classification of Hospital-Acquired Diagnoses (CHADx) is designed to enable coded inpatient data to be routinely used to monitor a range of hospital-acquired diagnoses (complications) and support quality improvement efforts. CHADx was developed by researchers at the University of Queensland with funding from the Australian Commission on Safety and Quality in Health Care.
10 Davis, P et al (2003) “Adverse events in New Zealand public hospitals...” in NZMJ Vol. 116 No. 1183

Surgical safety checklist Page 19 Privileged and Confidential
Determining the marginal cost 59. This step estimates the cost associated with an avoidable surgical complication. We
calculate the total cost of discharges estimated to contain an avoidable complication by applying the 2010/11 national price of $4,410 per case weight. We then apply a flat rate to estimate the additional costs incurred due to the complication.
60. Our base case assumption is 17.3%, which means that, on average, a discharge with a complication amenable to the checklist costs 17.3% more than an equivalent discharge without a complication. This figure was derived from the study by Jackson et al (2011) which looked at marginal costs of hospital-acquired conditions in inpatient discharges in Queensland and Victoria. We used this study because it is from a health care system that is similar to that in New Zealand.
61. For a lower bound we assumed a marginal cost of 11.8%, derived from a study of surgical records in the Netherlands by Hoonhout et al (2009).11
Summary of avoided hospital cost scenarios
For an upper bound we use 20.0% – a slightly more conservative figure than our analysis of the marginal cost of removing a foreign object, which suggested 28.0% for such events (see p.12).
62. Table 8 summarises key assumptions in the base case, low-benefit and high-benefit scenarios. Under those assumptions, the potential annual benefit of avoided hospital costs ranges from $1.171 million to $14.307 million, with a base case of $5.599 million. This wide range – approximately $13 million – partly reflects the uncertainty around current use of the checklist, with our assumptions ranging from 25% to 75%. To illustrate this, if we were able to assume the base case assumption of 50% use of the low and high-benefit scenarios, the range of annual benefits would almost halve to between $2.493 million and $9.690 million (a range of approximately $7 million).
Table 8: Summary of benefit assumptions and avoided hospital costs
Component Base case Low scenario High scenario
Rate of surgical complications
13.5% 11.0% 15.4%%
Checklist reduction in complication rate
28.1% 21.1% 36.4%
Rate of current use of the checklist
50% 75% 25%
Marginal cost of a complication
17.3% 11.8% 20.0%
Annual benefit – avoided hospital costs
$5,599,000 $1,171,000 $14,307,000
11 Hoonhout, L et al (2009) “Direct medical costs of adverse events in Dutch hospitals” in BMC HSR
Page 20 Surgical safety checklist Privileged and Confidential
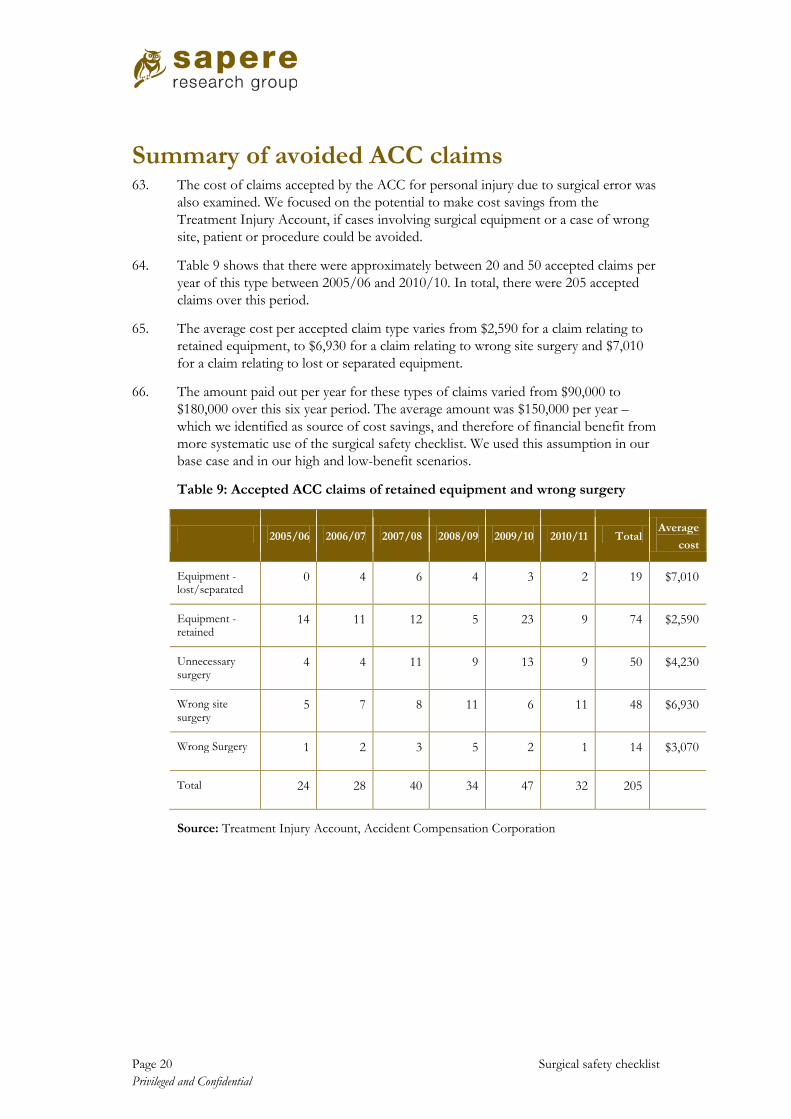
Summary of avoided ACC claims 63. The cost of claims accepted by the ACC for personal injury due to surgical error was
also examined. We focused on the potential to make cost savings from the Treatment Injury Account, if cases involving surgical equipment or a case of wrong site, patient or procedure could be avoided.
64. Table 9 shows that there were approximately between 20 and 50 accepted claims per year of this type between 2005/06 and 2010/10. In total, there were 205 accepted claims over this period.
65. The average cost per accepted claim type varies from $2,590 for a claim relating to retained equipment, to $6,930 for a claim relating to wrong site surgery and $7,010 for a claim relating to lost or separated equipment.
66. The amount paid out per year for these types of claims varied from $90,000 to $180,000 over this six year period. The average amount was $150,000 per year – which we identified as source of cost savings, and therefore of financial benefit from more systematic use of the surgical safety checklist. We used this assumption in our base case and in our high and low-benefit scenarios.
Table 9: Accepted ACC claims of retained equipment and wrong surgery
2005/06 2006/07 2007/08 2008/09 2009/10 2010/11 Total Average
cost
Equipment - lost/separated
0 4 6 4 3 2 19 $7,010
Equipment - retained
14 11 12 5 23 9 74 $2,590
Unnecessary surgery
4 4 11 9 13 9 50 $4,230
Wrong site surgery
5 7 8 11 6 11 48 $6,930
Wrong Surgery 1 2 3 5 2 1 14 $3,070
Total 24 28 40 34 47 32 205
Source: Treatment Injury Account, Accident Compensation Corporation

Surgical safety checklist Page 21 Privileged and Confidential
Is systematic use of the surgical checklist a worthwhile investment?
Ten-year costs and benefits 67. We estimated the cost and benefits of systematic use of the surgical safety checklist
across a ten-year horizon, as shown in Figure 3. The benefits were set at 50% in year 1 and 75% in year 2 – reflecting our assumption that more systematic use would not immediately become embedded at the launch of an initiative in year 1.
Figure 3: Costs, benefits, and net benefits over ten years – base case scenario
Note that the figures are nominal and not discounted to present values
68. The annual costs and benefits for the base case and the credible range are shown below in Table 10. It appears unlikely that circumstances would eventuate where the costs would outweigh the benefits over a ten year period.
69. Our credible range for costs over ten years is $0.314 million to $3,956 million, with a base case of $1,966 million. Our credible range for benefits over ten years is $8,386 million to $91,675 million, with a base case of $44,982 million.
70. The steady state annual net benefit to the health system is estimated to be $5.7 million, with the plausible range being $1.3 million to $14.5 million
0
1,000
2,000
3,000
4,000
5,000
6,000
7,000
1 2 3 4 5 6 7 8 9 10
$000s
Year
Benefits
Costs
Net benefit

Page 22 Surgical safety checklist Privileged and Confidential
Table 10: Summary of costs and benefits over a ten-year period
Base case Credible range
Start-up costs $479,000 $314,000 - $807,000
Ongoing costs (annual) $174,000 $0 - $445,000
Cumulative ten-year costs (discounted to present value)
$1,966,000 $314,000 - $3,956,000
Benefits – annual avoided hospital costs (steady state)
$5,751,000 $1,323,000 - $14,459,000
Benefits – annual avoided ACC payments
$150,000 Assumption not varied
Cumulative ten-year benefits (discounted to present value)
44,982,000 $8,386,000 - $91,675,000
Estimating net present value 71. We estimate a net present value of $43.0 million in the base case scenario, meaning
that the publicly-funded health sector would be better off financially over a ten-year period. In obtaining this figure, costs and benefits were discounted using a discount rate of 3.5%. As table 11 shows, this result varies considerably across the high and low scenarios, from a best case of $91.4 million to a worst case of $4.4 million.
72. This is a wide range, due to the size uncertainty about many of the assumptions used to determine the range of potential benefits. Nevertheless, more systematic use of the surgical safety checklist appears to have a positive net benefit under the plausible assumptions identified in this analysis.
73. Under the base case, the ratio of discounted costs to benefits is 1: 22.9 which implies a relatively high return for the cost of securing systematic use of the surgical safety checklist. Under the worst case scenario, the ratio remains positive at 1: 2.1
Table 11: Net present value over ten years and cost-benefit ratios
Case Net present value Cost – benefit ratio
Base case $43.016 million 1 : 22.9
Best case $91.361 million 1 : 291.7
Worst case $4.430 million 1 : 2.1

Surgical safety checklist Page 23 Privileged and Confidential
Limitations 74. There are a number of caveats that should be kept in mind when interpreting the
results of this cost benefit analysis. These are listed below.
• Some of data and assumptions used to model the costs and benefits have been adapted from other health care systems and may not be wholly suitable for the New Zealand situation. A lack of comprehensive data on the marginal cost of adverse surgical events in New Zealand is one such limitation.
• The parameter with the most uncertainty relates to current checklist utilisation within district health board surgical teams. Our range of 25% to 75% with a base case of 50% is wide. Varying this assumption about current use can make a substantial difference to the range of potential benefits, although we find that systematic use of the checklist would still have net benefits under the relatively generous assumption of 75% current use.
• The structure and potential effectiveness of an initiative aimed at securing systematic use of the surgical safety checklist remains uncertain.
75. Furthermore, identifying potentially avoidable adverse surgical events within national data is currently not straightforward, although this situation is likely to improve. The adoption of a ‘condition onset flag’ in the National Minimum Dataset from 1 July 2012 will enable conditions arising during a hospital admission to be differentiated from those present at admission. This will assist with analysis of avoidable complications from surgical and medical procedures, and with the monitoring of the effectiveness of prevention strategies such as the checklist.
76. Opportunities for this sort of analysis could be enhanced from July 2013, when New Zealand adopts a new version of the inpatient coding framework.12
This would enable use of the Australian Classification of Hospital-Acquired Diagnoses (CHADx). This tool is designed to allow hospitals to routinely identify, count and track adverse events using the codes already recorded for each discharge.
12 Version 7 of the International Classification of Diseases, 10th Revision, Australian Modification (ICD10-AM)

Page 24 Surgical safety checklist Privileged and Confidential
Conclusions 77. We have drawn the following conclusions from this analysis of the costs and benefits
of systematic use of the surgical safety checklist.
(a) More systematic use of the surgical safety checklist is likely to lead to observable reductions in avoidable complications resulting from surgery. Despite current use of the checklist, there is scope to make more consistent use of the checklist within the New Zealand health care system. This can be seen in hospital data, in ACC claims, and in perspectives gained from the interviews.
(b) Overall, the cost of the intervention is low under all scenarios, which means that only small volumes of avoided complications would be required to make it worthwhile. This suggests that an initiative aimed at securing systematic checklist use is likely to provide a net financial benefit to the health system under all credible assumptions.
(c) The steady state annual benefit to the health system is estimated to be $5.7 million, with the plausible range being $1.3 million to $14.5 million. We roughly estimate that the base case benefits could be up to $250,000 per year for a district health board with a small to medium hospital, and up to $750,000 per year for those boards with a medium to large hospital.
(d) The approach adopted here is a financial cost benefit analysis from the perspective of the publicly-funded health system, partly for feasibility reasons. However, an economic analysis that looks at the wider societal benefits, such as avoided harm and associated time off from employment, is also likely to be positive. The pre-checklist mortality rates, as estimated by Haynes et al and De Vries et al, imply 4,000-5,000 deaths associated with surgery each year – although it must be noted that these do not represent ‘avoidable’ deaths. This is consistent with the range cited by the Perioperative Mortality Review Committee.13
13 The Committee’s 2011 inaugural report, Perioperative Mortality in New Zealand, noted that “...between 4000 and 5000 patients die following an operative procedure in New Zealand each year. In many of these cases the procedure was a small factor in a complex episode of care and played no part in the later death of the patient, whilst in a small number there are important lessons to learn.”
While we do not feel confident that we have sufficient information to model any impact of the surgical safety checklist on mortality rates, we note that the key checklist studies suggest a reduction in mortality of up to 50% is possible, but even securing a reduction of 1% would imply 40-50 fewer deaths per year in New Zealand.
Surgical safety checklist Page 25 Privileged and Confidential
References Conley DM, S Singer, L Edmondson, WR Berry and AA Gawande (2011) “Effective Surgical Safety Checklist Implementation” in Journal of the American College of Surgeons, 2011, Vol. 212, No 5
Davis P et al (2003) “Adverse events in New Zealand public hospitals II: preventability and clinical context” in New Zealand Medical Journal Vol. 116 No. 1183
De Vries et al, 2010 “Effect of a Comprehensive Surgical Safety System on Patient Outcomes” in New England Journal of Medicine, 2010
Haynes AB et al (2009) “A Surgical Safety Checklist to Reduce Morbidity and Mortality in a Global Population” in New England Journal of Medicine, 2009
Haynes AB, et al (2011) “Changes in safety attitude and relationship to decreased postoperative morbidity and mortality following implementation of a checklist...-based surgical safety intervention.” BMJ Quality & and Safety 2011;20;02-107
Health Quality & Safety Commission. (2012) Making Our Hospitals Safer: Serious and Sentinel Events reported by District Health Boards in 2010/11. Wellington: HQSC
Health Quality & Safety Commission. (2012) New Zealand Health and Disability Services – National Reportable Events Policy 2012. Wellington: HQSC
Hoonhout L, et al (2009) “Direct medical costs of adverse events in Dutch hospitals” BMC Health Services Research 2009, 9:27
Jackson T, HS Nghiem, D Rowell, C Jorm, and J Wakefield (2011) “Marginal costs of hospital-acquired conditions...” in Journal of Health Services Research and Policy Vol. 6 No. 13
Lewis G, R Vaithianathan, P Hockey, G Hirst, and J Bagian (2011) “Counterheroism, Common Knowledge, and Ergonomics: Concepts from Aviation That Could Improve Patient Safety” The Milbank Quarterly, Vol. 89, No. 1, 2011
Mitchell, S, J et al (2011) “Potential Benefits Of A Surgical Safety Checklist In A New Zealand Tertiary Hospital”. Unpublished draft of 1 June 2011 supplied by co-author Professor Alan Merry.
National Health Service (2011) “The WHO Surgical Safety Checklist: to reduce harm by consistent use of best practice” NHS Evidence. National Patient Safety Agency, August 2011 Perioperative Mortality Review Committee (2011) Perioperative Mortality in New Zealand: Inaugural report of the Perioperative Mortality Review Committee. Wellington: Health Quality & Safety Commission
Semel ME, S Resch, AB Haynes, LM Funk, A Bader, WR Berry, TG Weiser and AA Gawande (2011) “Adopting a surgical safety checklist could save money and improve the quality of care in U.S. hospitals” in Health Affairs, 2010 September 29(9)
Van Klei W, et al (2010) “Effects of the Introduction of the WHO “Surgical Safety Checklist” on In-Hospital Mortality: A Cohort Study” in Annals of Surgery January 2012 – Volume 255 – Issue 1
Vats A et al (2010) “Practical challenges of introducing WHO surgical checklist: UK pilot experience” British Medical Journal 2010;340:b5433
Vogts N, JA Hannam, AF Merry, and SJ Mitchell (2011) “Compliance and quality in administration of a surgical safety checklist in a tertiary New Zealand hospital”, New Zealand Medical Journal 9 September 2011, Vol. 123 No. 1342