Embed Size (px)
Citation preview

Cost Benefit Analysis in the Context of the Energy Infrastructure Package
http://think.eui.eu
Final ReportJanuary 2013
THINK is financially supported by
the EU’s 7th framework programme
Topic 10
Project Leader: Nils-Henrik M. von der FehrResearch Team Leader: Leonardo MeeusResearch Team: Isabel Azevedo
Xian He Luis Olmos
Jean-Michel Glachant
Project Advisors: Władysław Mielczarski François Lévêque

This project has been funded with support from the European Commission. This publication reflects the views only of the authors, and the Commission cannot be held responsible for any use which may be made of the information contained therein.
More information on the THINK Project is available on the Internet (http://think.eui.eu)
ISBN: 978-92-9084-116-6doi:10.2870/60065
© European University Institute, 2013© Leonardo Meeus, Nils-Henrik M. von der Fehr, Isabel Azevedo, Xian He, Luis Olmos, and Jean-Michel Glachant
This text may be downloaded only for personal research purposes. Any additional reproduction for other purposes, whether in hard copies or electronically, requires the consent of the authors. Source should be acknowledged. If cited or quoted, reference should be made to the full name of the authors, the title, the year and the publisher.
Front cover images: from top to bottom © iStockPhoto – 15760057, Pics-xl; 12663838, Trout55; 13147999, Deepblue4you; 13820604, Manfredxy; 11507732, En-viromantic; 14619224, Phototropic
THINK is financially supported by the EU’s 7th Framework Programme

http://think.eui.eu i
Cost Benefit Analysis in the Context of the Energy Infrastructure Package
Contents
Acknowledgements .................................................................................................................................................................................................................................................... iii
Executive summary ..................................................................................................................................................................................................................................................... v
Introduction ................................................................................................................................................................................................................................................................... 1
1. Scope of the CBA ................................................................................................................................................................................................................................................ 31.1 Methodological implication of the process .................................................................................................................................................................................. 31.2 Project definition .................................................................................................................................................................................................................................... 51.3 Baseline definition .................................................................................................................................................................................................................................. 81.4 Effect mapping ........................................................................................................................................................................................................................................ 101.5 Distributional effects ............................................................................................................................................................................................................................ 13
2. Calculation of net benefit ................................................................................................................................................................................................................................ 142.1 Monetization ............................................................................................................................................................................................................................................ 142.2 Inter-temporal discounting of costs and benefits ...................................................................................................................................................................... 202.3 Uncertainty ............................................................................................................................................................................................................................................... 21
3. Ranking projects ................................................................................................................................................................................................................................................ 23
4. Methodological implications of using CBA for cost allocation .......................................................................................................................................................... 25
Recommendations ....................................................................................................................................................................................................................................................... 26
References ....................................................................................................................................................................................................................................................................... 29
Annex 1: Cost benefit analysis as proposed by ENTSO-E ............................................................................................................................................................................... 34
Annex 2: Outline of the Regulation ....................................................................................................................................................................................................................... 36
Annex 3: Mapping costs and benefits of electricity infrastructure projects ........................................................................................................................................... 37
Annex 4: Conclusions of Industrial Council Meeting (based on report version “V0”, September 2012) ....................................................................................... 38
Annex 5: Comments from project advisors ........................................................................................................................................................................................................ 40
Annex 6: Response ENTSO-E to public consultation ....................................................................................................................................................................................... 43


http://think.eui.eu iii
Cost Benefit Analysis in the Context of the Energy Infrastructure Package
Acknowledgements
This work has been funded by the European Commission FP7 project THINK. This report went through the THINK project quality process (http://think.eui.eu). Conclusions and remaining errors are the full responsibility of the authors.
The authors acknowledge the contributions by the chairmen and participants of the two meetings where preliminary results of the research were discussed:
• First, the Expert Hearing, 14th of September 2012 in Brussels, chaired by Ronnie Belmans, where the robustness of the preliminary results was tested (Annex 4), with special thanks to the expert panel consisting of the invited experts Catharina SikowMagny, Riccardo Vailati, Gro Waeraas de Saint Martin, and Stef Proost, as well as project advisors Władysław Mielczarski and François Lévêque. The authors also thank the members of the industrial council, and other participants of the hearing: Geert Fostier, Serge Galant, J.G. Martin, Christine Materazzi Wagner, Andrei Nekrassov, Jorge Núñez Ferrer, Ignacio PérezArriaga, Mai Riche, Peter Taylor, and Klaus Wewering.
• Second, the Scientific Council Meeting, 13th of November 2012 in Brussels, chaired by William D’haeseleer, where the first draft of this report was discussed (Annex 5). The authors are grateful for the comments of Ronnie Belmans, Eduardo Oliveira Fernandes, Dörte Fouquet, Serge Galant, JeanMichel Glachant, Leigh Hancher, Péter Kaderják, François Lévêque, Wladyslaw Mielczarski, Peter Mombaur, Kitti Nyitrai, Ignacio PérezArriaga, Pippo Ranci, Matti Supponen, and Jorge Vasconcelos.
Special thanks go to Kitti Nyitrai (European Commission) and Gro Waeraas de SaintMartin (ENTSOE) for sharing their expertise on this topic, and for giving feedback at each stage of our report production process. The authors would also like to thank to ENTSOE (Annex 6) for their response to an earlier draft of the report that was publicly available at the end of 2012.
Finally, the authors have greatly benefited from the comments by Patrik Buijs, Jerome Dejaegher, Samson Hadush, Arthur Henriot, Adeline Lassource, Maarten Noeninckx, Konrad Purchala, Vincent Rious, Sophia Ruester, Marcelo Saguan, Sebastian Schwenen, Christophe Schramm, and Miguel Vazquez.


http://think.eui.eu v
Cost Benefit Analysis in the Context of the Energy Infrastructure Package
Executive summary
In order to accelerate the infrastructure investments that are important for the achievement of the EU energy policy objectives, the European Commission has proposed an Energy Infrastructure package. The package includes a new Regulation on guidelines for transEuropean energy infrastructure (EC, 2011a) (hereafter “the Regulation”) on which a political agreement between the European Parliament and the Council has recently been reached. The Regulation requires the development of CostBenefit Analysis (CBA) methods (one for electricity, and one for gas) to facilitate the selection of Projects of Common Interest (PCI). In this report, we concentrate on electricity infrastructure (transmission and storage).
Chapter 1 defines the scope of the CBA. We first discuss the PCI selection process in the context of the Regulation, as it preconditions the way that the CBA method can be conceived. Then, we discuss the issues regarding project and baseline definition, as well as the distributional effects that these projects typically have. Next, the chapter maps the possibly relevant costs and benefits, proposing a reduced list of effects that should be used for all projects. We nonetheless recognize that there might be other effects that need to be considered for specific projects, and thus the chapter identifies indicators that can be used to detect these specific projects.
Chapter 2 is dedicated to the calculation of the net benefit of a project, starting from the CBA scope defined in Chapter 1. We first propose how the most relevant effects can be monetized, i.e. which inputs and model to use. We then discuss how the monetized effects can be discounted to the present, arguing that a single discount rate should be used for all projects. Finally, the chapter considers uncertainty, and proposes a stochastic approach that is consistent with the scenarios of the Energy Roadmap 2050. This would then imply that a net
benefit distribution is calculated for each project.
Chapter 3 concentrates on how to rank projects based on a net benefit distribution that has been calculated following Chapter 2. We argue that the initial ranking of projects should be done based on the mean value of their net benefit distribution. This ranking might need to be adjusted for uncertainties and for competitive projects.
Chapter 4 observes that the methodological implications of using CBA for cost allocation are limited. Therefore, the method recommended for ranking projects in this report could also be used as a basis for cost allocation. The only additional requirement is that the output should be disaggregated per TSO area. Note however that this report does not enter into the discussion of how the CBA method should be used for cost allocation.
The report concludes with the following recommendations: (1) interaction between projects must be taken into account in the project and baseline definition; (2) data consistency and quality should be ensured; (3) the conventional time horizon is 2025 years; (4) CBA should concentrate on a reduced list of effects and those should be monetized; (5) distributional concerns should not be addressed in the calculation of net benefits; (6) infrastructure costs need to be disaggregated; (7) the model used to monetize the production cost savings and gross consumer surplus needs to be explicitly stated; (8) a common discount factor should be used for all projects; (9) a stochastic approach that is consistent with the Energy Roadmap 2050 should be used to address uncertainty; (10) the ranking should be primarily based on the monetized net benefit.
Throughout the report, we discuss to what extent the draft CBA method proposed by ENTSOE (2012a) is already in line with these recommendations.

http://think.eui.eu 1
Cost Benefit Analysis in the Context of the Energy Infrastructure Package
Introduction
Why an Energy Infrastructure Package?
The European Commission has recently estimated the investment needs in energy (electricity and gas) infrastructure of European importance to be about €200 billion up to 20201. The Commission has also stressed that, under a business as usual scenario, almost half of these investments are at risk of not being delivered in time or at all, leaving a gap of about €100 billion (EC, 2011b). The main identified obstacles are problems related to permit granting, regulatory issues and financing; and those cannot be fully overcome by the recently introduced measures, such as the Ten Year Network Development Plan (TYNDP).
In this context, the European Commission has proposed an Energy Infrastructure package that includes a new Regulation on guidelines for transEuropean energy infrastructure (EC, 2011a) (hereafter “the Regulation”) on which a political agreement between the European Parliament and the Council has recently been reached. The Regulation establishes a process to identify Projects of Common Interest (PCIs) in priority corridors and areas2. Projects under this label will have a facilitated permit granting process and enhanced regulatory treatment. The proposed Connecting Europe Facility sets aside a €9 billion budget for energy infrastructure projects to provide EU financial assistance for both studies and
1 Energy infrastructure categories are specified in Annex II of the Regulation on guidelines for transEuropean energy infrastructure. Production assets are not considered as infrastructure. 2 The priority electricity corridors include Northern Sea offshore grid, NorthSouth electricity interconnections in Western Europe, NorthSouth electricity interconnections in Central Eastern and South Eastern Europe, and the Baltic Energy Market Interconnection Plan in electricity.
implementation of projects that are not commercially viable.
It should be noted that the PCIs can be commercially viable, which is why having the label, according to the Regulation, does not necessarily lead to financial assistance. The selection of PCIs and provision of financial assistance are then two separate processes. Note also that not only EU TSOs, but also third parties, including both TSOs from neighboring countries and other relevant stakeholders, can propose projects to the Regional Groups3 to be labeled as PCIs, while the final list is established by the European Commission.
Why CBA in this package?
Previous energy infrastructure policies at EU level have been made based on a list of priority projects that resulted from negotiation between EU institutions and Member States. In order to facilitate the selection of PCIs, the Regulation instead asks for the development of a costbenefit analysis (CBA) method.
The proposal includes a procedure (Article 12) and terms of reference (Annexes IV and V), providing common guidelines to design a CBA method. The procedure is that the ENTSOs propose the method; ACER, the European Commission and Member States will give their opinion; the ENTSOs will review the methods taking into account the opinions provided;
3 Regional Groups will be established by the Regulation based on each priority corridor and area and their respective geographical coverage. For electricity infrastructure projects, each Group shall be composed of representatives of the Member States, National Regulatory Authorities, Transmission System Operators and project promoters for each of the relevant priorities, as well as the EC, ACER and ENTSOE; while the decision making powers in the Groups shall be restricted to Member States and the EC only.
2
Final Report – January 2013
http://think.eui.eu
and finally the European Commission will approve it. This method will be used by the Regional Groups in their assessment and proposition of candidate projects.
Why a THINK report on this topic?
The Regulation requires the development of a CBA method for electricity and gas infrastructure.4
The aim of this report is to support the European Commission, as well as the other concerned entities (ENTSOE and ACER), in the development of the CBA method to be used for electricity infrastructure projects, including transmission and storage projects. Thus, this report provides recommendations on how to implement an appropriate CBA for electricity infrastructure projects.
CBA is more than a concept of comparing costs with benefits. Many choices need to be made when developing such a method in this context. Throughout the report, we discuss to what extent the draft CBA method proposed by ENTSOE (2012a) is already in line with what we recommend. This allows us to conclude the report with our main recommendations for the improvement of the ENTSOE draft method.
4 The Joint Research Centre, in collaboration with DG Energy, has recently released guidelines for the development of a costbenefit analysis for smartgrid projects (JRC, 2012). Note that the development of such a method for smart grid projects was foreseen by the third package.
Structure of the report
In this report, we first present the scope of the CBA (Chapter 1) and how to calculate the net benefit (Chapter 2). Afterwards, we discuss how to use the CBA output to compare and rank projects (Chapter 3), and last, we present the methodological implications of using CBA for cost allocation (Chapter 4).

http://think.eui.eu 3
Cost Benefit Analysis in the Context of the Energy Infrastructure Package
1. Scope of the CBA
This chapter starts with Section 1.1 discussing the methodological implications of the process of selecting Projects of Common Interest. The process specifies the order of selecting steps, the responsible actors and their tasks. This process could precondition the way that the CBA method is conceived, including the scoping of the CBA. Therefore, the awareness of the methodological implication of the process is a prerequisite to discuss the choices to be made regarding project definition (Section 1.2), baseline definition (Section 1.3), effect mapping (Section 1.4) and distributional effects (Section 1.5).
1.1 Methodological implication of the process
The process of selecting Projects of Common Interest consists of 6 steps, as illustrated in Figure 1. In what follows, we discuss the implication of this process for the CBA method.
First, the fact that the project promoters submit projects together with a CBA implies that each project is evaluated individually, not as a group. This means that the way projects will be evaluated in this context is different from transmission planning (Box 1). A
shortcoming of an individual evaluation is that this approach might not fully take into account interactions between infrastructure projects in network industries. As a result, selecting projects based on individual evaluation results might not necessarily lead to the optimal set of projects. However, one should notice that this is not a feature of the CBA method per se, but rather due to the decentralized process of project proposition and evaluation. This shortcoming of the individual evaluation approach can be remedied, at least partly, by considering the interactions between projects in the project definition (Section 1.2) and baseline definition (Section 1.3).
Second, the fact that projects are ranked within the region has two implications. First, there should be a minimum of harmonization, at least at the regional level, in terms of definition of scope (Chapter 1) and the method to calculate the net benefit (Chapter 2). Also, consensus must be achieved at the regional level on how to consider in the ranking the factors that have not been included in the calculation of the net benefit (Chapter 3).
Third, the elaboration of a Unionwide list of Projects of Common Interest without ranking implies that the European Commission would draw a line in the lists submitted by the Regional Groups. Indeed, as the Projects of Common Interest will receive the
Figure 1: Process of selection (Nyitrai, 2012; Sikow-Magny, 2012)

4
Final Report – January 2013
http://think.eui.eu
same priority treatment – the accelerated permit granting process there is no need to do the ranking at the European level. Distributive concerns (as will be discussed in Section 1.5) might play a role in producing a balanced list of Projects of Common
Interest over all regions. Moreover, this list is to be updated every two years. This implies that the CBA is applied every two years to evaluate both the projects which have received the PCI label and those applying for it.
Box 1: Electricity transmission planning
Transmission planning refers to the process of finding the investments required to achieve a reliable and economically efficient network in the face of an uncertain future. The aim of transmission planning is then to achieve or select the optimal set of investments.
Current practices are diverse, not only in terms of time frame but also regarding the geographical scope, which is also related to regulatory framework (see table below). Moreover, there are different planning models, where we can distinguish two main groups: mathematical optimization models (techniques that find an optimum expansion plan by using a calculation procedure that solves a mathematical formulation of the problem); and heuristic models (techniques that go step-by-step generating, evaluating, and selecting expansion options, with or without the user’s help) (Pérez-Arriaga et al. 1987). For a more recent overview of transmission planning methods see Latorre et al. (2003), Realisegrid (2009) and MIT (2011).
Entity(ies) responsible Time horizon CBA as a tool Uncertainty
California ISO 10 years Yes Multi-scenario
Nordel Voluntary group 20 years Yes Multi-scenario
Spain TSO and Government 5-20 years Yes Multi-scenario
UK SO and TOs 7 years Limited Monte Carlo method
Main sources: CAISO (2004); Nordel (2007); Barquín (2008); National Grid (2011); Brattle Group (2007)
The need for planning over larger areas has been increasing, due to the development of an EU internal market and due to the integration of large shares of renewable sources in the system. The Ten Year Network Development Plan is a first step towards community-wide transmission planning. The cost benefit analysis that will be developed in the context of the Energy Infrastructure Package will also be used for the Ten Year Network Development Plan. Indeed, the same method could be used for the joint assessment of different combinations of projects in search of an optimal set of investments. Note also that research on transmission planning methods is on-going with projects, such as Realise Grid (Realisegrid, 2012) and E-highways (ENTSO-E, 2012c).

http://think.eui.eu 5
Cost Benefit Analysis in the Context of the Energy Infrastructure Package
1.2 Project definition
The project definition refers to the delineation of the object to be evaluated. Hereafter we discuss transmission and storage projects separately. Due to the strong interactions between different investments, the definition of project boundaries is not straightforward for the former, while easier for the latter.
1.2.1 Transmission investment
In network industries, projects typically interact, i.e. they can be (1) complementary, or (2) competitive.
First, complementary investments refer to the presence of positive interactions between investments. In this case they should be evaluated as a single project. Otherwise, the individual evaluation would lead to underestimation of the potential net benefit of developing the two investments, since the complementarities would not be considered. The project promoters should have incentives to identify and cluster the complementary investments in their project proposition.
Second, when the added value of one investment is decreased by the presence of the other, those investments are competitive. They should be evaluated separately (by the project promoter) and jointly (by the Regional Group or the Ten Year Network Development Plan). The joint evaluation is needed because there is a possibility that both projects show economic viability. However, if they are both built, the overall net benefit will be lower than the sum of the individual net benefits. Therefore, the joint evaluation would allow the evaluator to estimate the potential negative interactions between the competitive projects.
Before performing joint evaluation, it is necessary to anticipate which projects could be potentially competitive. It is worth noting that competitive investments do not only refer to the (1) size of the projects, but also to the (2) location and even (3) design of the project:
First, projects can compete in terms of size. For instance, for developing the Norned HVDC project connecting Norway and Netherland, DTe (2004) has compared two different capacities (600 MW and 1200 MW).
Second, in terms of location, different paths might exist to develop a new transmission line. They need to be evaluated in order to find the solution that maximises net benefit. For instance, for the new interconnection between Spain and France several alternatives were studied including through the Pyrenees, or partly offshore (Monti, 2008).
Third, a variety of options might exist in terms of de-sign of the project, especially in case of green field type of investment. For instance, the feasibility study of offshore grid connection at Kriegers Flak (Energinet.dk, 2009) compares different structures (standalone lines versus combined solutions), and among combined solutions different technology choices are compared (ACbased, VSCbased and hybrid).
What is given by the Energy Infrastructure Package
The Regulation defines the minimum criteria for project eligibility (Annex2). Projects of Common Interest must, first of all, contribute significantly to at least one of the following EU energy objectives: “(i) market integration, inter alia through lifting the isolation of at least one Member state and reducing energy infrastruc-ture bottlenecks; competition and system flexibility; (ii) sustainability, inter alia through the integration of re-

6
Final Report – January 2013
http://think.eui.eu
newable energy into the grid and the transmission of renewable generation to major consumption centres and storage sites; and (iii) security of supply, inter alia through interoperability, appropriate connections and secure and reliable system operation”. Moreover, they shall also involve at least two Member States, either by directly crossing the border or by fulfilling the defined thresholds. Indeed, in order to qualify, a transmission project located in only one Member State, shall be a project that “changes the grid transfer ca-pacity at the border of that Member State with one or several other Member States or at any other relevant cross-section of the same transmission corridor by at least 500 Megawatt compared to the situation without commissioning of the project.”
Despite allowing for consideration of the complementarity between different investments, defining the projects by threshold might entail a risk that projects are grouped in order to reach the transfer capacity threshold.
What is proposed by ENTSO-E
The ENTSOE draft proposal (2012a) defines an additional threshold for project clustering: “The influ-ence of the investment on the increase of Grid Trans-fer Capacity must be substantial; otherwise it should not be a part of the cluster. Hence, if the influence is lower than 20%, the investment will not be considered as a part of the project.”
This approach therefore ensures that only projects that significantly contribute to this common goal of increasing the capacity on a certain border can be grouped. However, the objective should rather be to group projects which are complementary in terms of their net benefit, i.e. the net benefit of both projects together is higher than the sum of the net benefit of the individual projects.
Recommendation
First, projects should only be grouped when strong complementarities are present. It should be the responsibility of the project promoter to provide evidence on the complementarities between investments that are proposed as a single project.
Second, competitive projects should be evaluated both individually and together, which can also be considered as using a different baseline to evaluate the project (see Section 1.3.2).
1.2.2 Storage investment
Regarding storage facilities, the project definition is rather clear. However, it is worth noting that in specific cases, storage could be an alternative solution to transmission reinforcement (Box 2). If so, the storage and transmission reinforcement projects should be evaluated as competitive projects.
What is given by the Energy Infrastructure Package
The Regulation defines that, for storage facilities, the project must “provide 225 MW installed capacity and to have a storage capacity that allows a net annual electricity generation of at least 250 Gigawatt hours”. These minimum criteria imply that only largescale storage facilities are concerned. The Regulation requires a common input data set for transmission and storage projects (Annex V of the Regulation) and prescribes a minimum effect mapping: “For electricity transmission and storage, the cost-benefit analysis shall at least take into account the impacts on the indicators defined in Annex III”.

http://think.eui.eu 7
Cost Benefit Analysis in the Context of the Energy Infrastructure Package
What is proposed by ENTSO-E
In the ENTSOE draft proposal (2012a) was initially only for transmission lines, but has been revised to also include electricity storage.
Recommendation
It is important to have the same CBA method for transmission and storage projects because they can be competitive projects that need to be considered as alternatives (Box 2).
Box 2: Storage could be an alternative to transmission reinforcement.
As widely discussed, transmission lines do not necessarily need to be rated at the peak wind power generation
(Keuhoff et al., 2007; Pattanariyankool and Lave, 2010; Phillips and Middleton, 2012). Given the relatively low
capacity factor of wind generation (typically between 20-50%), downsizing the transmission line at the cost of
some wind curtailment could be more economical. In fact, storage can also help in downsizing the transmission
line, or defer the need of transmission investment, by smoothing the wind (or other intermittent renewable
energy sources) generation profile, as illustrated in the Figure below.
Storage could defer or downsize the transmission investment by smoothing the wind output
(ΔX represents the deferred or reduced transmission capacity).
The benefit of electricity storage to defer transmission and distribution upgrade has been discussed in numerous
papers. Eyer et al. (2005) provides guidelines on how to identify favorable sites for storage as transmission and
distribution capacity deferral. Deholm and Sioshansi (2009) show the trade-off between transmission and storage
as a function of transmission investment costs. He et al. (2011) studies a case in which a compressed air energy
storage unit provide congestion management services to the transmission system operator in France. Pieper and
Rubel (2010) also show that transmission and distribution deferral could be a viable business case for storage
operators in the current US power system.

8
Final Report – January 2013
http://think.eui.eu
1.3 Baseline definition
In CBA, all investments are evaluated against a common baseline. In this section, we discuss three key issues for the definition of the baseline, which are how to decide on the time horizon of the analysis (Section 1.3.1), how to take into account interaction between proposed projects (Section 1.3.2), and how to ensure consistency and quality of the data underlying the parameters of the baseline (Section 1.3.3).
1.3.1 Time horizon
When defining the time horizon of the analysis, there is always a tradeoff between capturing longerterm effects and increased uncertainty. Therefore, the timeframe of the analysis should be limited to the point where the assessment is still meaningful. The convention is 2025 years, even for electricity projects that can have a lifetime of over fifty years EC (2008).
What is given by the Energy Infrastructure Package
The Regulation mentions that “The methodology shall be based on a common input data set representing the Union’s electricity and gas systems in the years n+5, n+10, n+15, and n+20, where n is the year in which the analysis is performed”.
Bearing in mind that projects that will be built at n+20 can be included in the baseline, 20 years is implicitly the minimum timeframe that the Regulation requires to be analyzed.
What is proposed by ENTSO-E
In the ENTSOE draft proposal (2012a), several options are presented: midterm (510 years), longterm (1020 years), and very long term (3040 years).
The draft also refers to the longterm horizon as a bridge between midterm and very longterm analysis. Moreover, it is mentioned that while other time horizons are optional, the longterm (1020) horizon is to be used systematically.
Recommendation
We agree that a 2025 year time horizon is in line with good practice.
1.3.2 Interaction between proposed projects
The interaction between projects can be shown by the divergence of the CBA results under two baselines, one with all proposed projects and one without any of the proposed projects. A significant divergence would signal the need for additional analysis.
What is given by the Energy Infrastructure Package
The Regulation requires that the baseline includes “scenarios for demand, generation capacities by fuel type (…) and their geographical location, fuel prices (…), carbon dioxide prices, the composition of the transmission and, if relevant, the distribution network, and its evolution, taking into account all new significant generation (…), storage and transmission projects for which a final investment decision has been taken and that are due to be commissioned by the end of year n+5”.
This provision in combination with the one quoted in the previous section, implies that the baseline should include as a minimum the projects that are to be commissioned by the end of n+5 and for which a final investment decision has been taken and could include as a maximum the projects that are to be commissioned in n+20. Note that the Regulation does

http://think.eui.eu 9
Cost Benefit Analysis in the Context of the Energy Infrastructure Package
however not specify whether candidate Projects of Common Interest should be included in the baseline.
What is proposed by ENTSO-E
The ENTSOE draft proposal (2012a) discusses two options to treat the candidate Projects of Common Interest in the baseline, namely the Take Out One at the Time (TOOT) method and the Put IN one at the Time (PINT). To put it simply, TOOT implies that each project is evaluated against the baseline featuring the whole forecasted network, which consists of the existing network plus the projects to be evaluated, while with PINT the forecasted network does not include any of the projects to be evaluated. ENTSOE favors the TOOT method: “The advantage of this analysis is that it immediately appreciates every benefit brought by each investment item, without considering the order of investment.”
Note that in the application of the TOOT method, ENTSOE proposes to include the TYNDP projects in the baseline: “The TYNDP network is then considered as the reference grid.” From 2015 onwards, this is fine because the TYNDP will have to include thirdparty projects so that the ENTSOE proposal implies to evaluate projects against a baseline that includes all candidate Projects of Common Interest.
Recommendation
The proposed projects should be evaluated against two baselines, one including and the other excluding all other proposed projects. In case of significant inconsistencies between results under the two baselines, further analysis is warranted.
1.3.3 Data consistency and quality
As the baseline refers to a forecasted future, it needs to be consistent with the EU energy policy objectives. In the context of the Energy Roadmap 2050 (EC, 2011c; EC, 2011d; Meeus et al 2011; Meeus, 2012), scenarios that achieve these objectives have already been developed that can now also be used in the context of the Energy Infrastructure Package.
The Roadmap contains many if not most of the parameters needed in the CBA analysis, including demand, generation and storage capacities, network characteristics, fuel prices and carbon prices. This data has already been validated, while there may of course be the need to revisit some of the parameters. Public consultation is a good way to ensure the quality of the data that will be used in the baseline.
What is given by the Energy Infrastructure Package
The Regulation mentions the need to ensure transparency for all stakeholders concerned. In Annex V of the Regulation, the Commission requires that the “data set shall be elaborated after formally consulting Member States and the organizations representing all relevant stakeholders”.
Moreover, the Regulation also requires the analysis to be updated every two years, providing also an opportunity to update the data used to build the baseline scenarios.
What is proposed by ENTSO-E
The ENTSOE draft proposal (2012a) states that the reference scenario “should be the one that best reflects the official European energy politics and goals.” For this reason, ENTSOE proposes the use of a topdown scenario, considering that it better represents one harmonized European energy policy.

10
Final Report – January 2013
http://think.eui.eu
ENTSOE also includes generation flexibility in the baseline, such as efficiency rate, flexibility and mustrun obligations. A public consultation process is proposed to validate the data, following the current practice in the context of the Ten Year Network Development Plan (ENTSOE, 2012b).
Recommendation
ENTSOE has taken the necessary measures to ensure data quality. It is however also important to ensure that the topdown scenario ENTSOE proposes to use is consistent with the scenarios in the Energy Roadmap 2050 (in Section 2.3 we discuss how this can be done).
1.4 Effect mapping
In this section, the objective is to deduct the most relevant effects to be considered in the CBA. We first draw a comprehensive list capturing all possible effects of electricity infrastructure projects (Section 1.4.1), and then reduce it to a list that includes the most relevant effects only (Section 1.4.2). This proposed reduced list is then checked with the Regulation and the draft of ENTSOE.
1.4.1 Comprehensive list
The existing literature provides limited guidance (Annex 3), but a comprehensive list of possible effects basically includes (1) the impact within the power system, and also the impact beyond, i.e. (2) externalities as well as (3) macroeconomic effects (Figure 2).
(1) Within the power system, we distinguish the different effects according to activities, which can be
classified into infrastructure (transmission), production (generation), consumption and other activities.
Figure 2: Three layers of effects generated by infrastructure projects
Infrastructure costs include capital costs of construction (capex) as well as operation and maintenance costs (opex) over the lifetime of the infrastructure.
Production cost savings refers to the benefits associated with a more efficient dispatching and a more efficient use of ancillary and balancing services, consisting of the reduction in variable costs of production (opex) and the avoided investment cost (capex).
Gross consumer surplus or willingness to pay refers to the benefits resulting from changes in consumption volume.
Finally, there are other market benefits resulting from
http://think.eui.eu 11
Cost Benefit Analysis in the Context of the Energy Infrastructure Package
electricity infrastructure investments, such as those due to changes in market liquidity and competition (Borenstein et al., 2000).
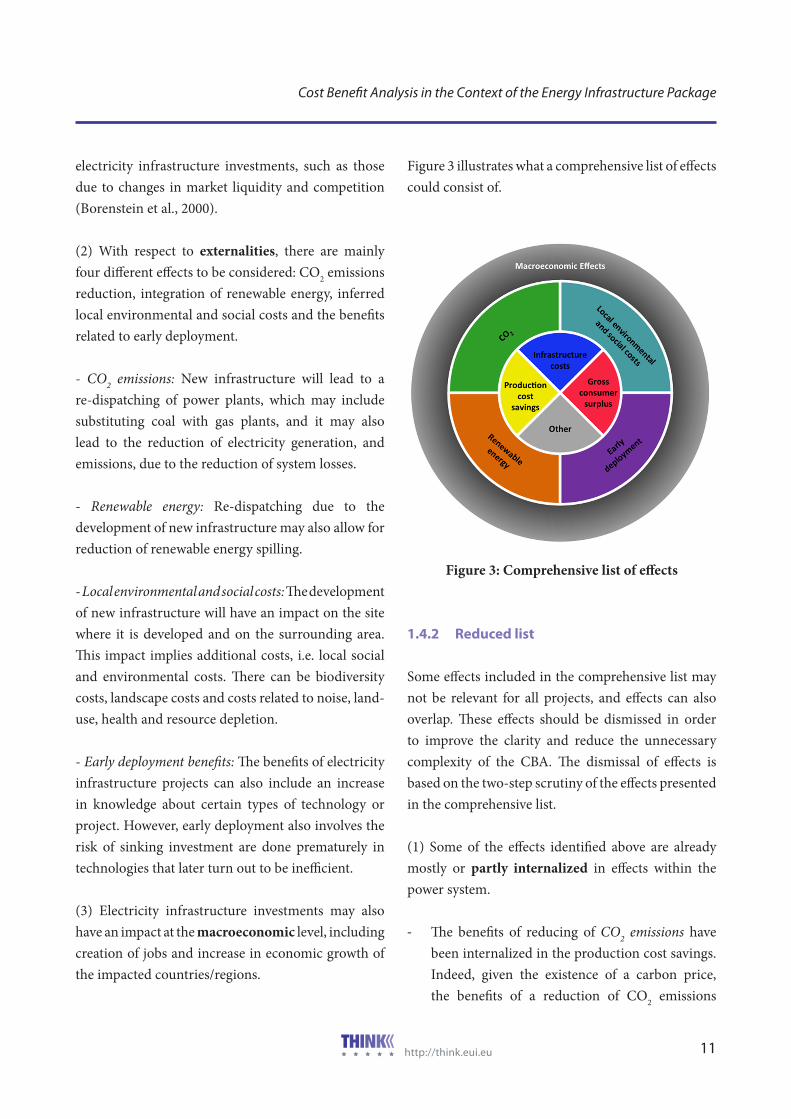
(2) With respect to externalities, there are mainly four different effects to be considered: CO2 emissions reduction, integration of renewable energy, inferred local environmental and social costs and the benefits related to early deployment.
CO2 emissions: New infrastructure will lead to a redispatching of power plants, which may include substituting coal with gas plants, and it may also lead to the reduction of electricity generation, and emissions, due to the reduction of system losses.
Renewable energy: Redispatching due to the development of new infrastructure may also allow for reduction of renewable energy spilling.
Local environmental and social costs: The development of new infrastructure will have an impact on the site where it is developed and on the surrounding area. This impact implies additional costs, i.e. local social and environmental costs. There can be biodiversity costs, landscape costs and costs related to noise, landuse, health and resource depletion.
Early deployment benefits: The benefits of electricity infrastructure projects can also include an increase in knowledge about certain types of technology or project. However, early deployment also involves the risk of sinking investment are done prematurely in technologies that later turn out to be inefficient.
(3) Electricity infrastructure investments may also have an impact at the macroeconomic level, including creation of jobs and increase in economic growth of the impacted countries/regions.
Figure 3 illustrates what a comprehensive list of effects could consist of.
Figure 3: Comprehensive list of effects
1.4.2 Reduced list
Some effects included in the comprehensive list may not be relevant for all projects, and effects can also overlap. These effects should be dismissed in order to improve the clarity and reduce the unnecessary complexity of the CBA. The dismissal of effects is based on the twostep scrutiny of the effects presented in the comprehensive list.
(1) Some of the effects identified above are already mostly or partly internalized in effects within the power system.
- The benefits of reducing of CO2 emissions have been internalized in the production cost savings. Indeed, given the existence of a carbon price, the benefits of a reduction of CO2 emissions

12
Final Report – January 2013
http://think.eui.eu
will be captured by a decrease in production costs. Therefore, if we would also consider the emissions as a separate effect, this would imply double counting.5 Note that one could argue that the current carbon price does not adequately reflect the externality cost of emissions, but this should then be dealt with in the setup of the baseline scenario that includes the carbon price.
- Similarly, the benefits related to a better integration of renewable energy have also been internalized in the production cost savings. Indeed, given the existence of the 2020 target for renewable energy, infrastructure that reduces the spilling of renewable energy will not necessarily increase the renewable energy that will be produced by 2020. Infrastructure investments will rather reduce the renewable energy capacity that needs to be installed to achieve the renewable energy target.
- Local and environmental costs have been internalized in the infrastructure costs. The Environmental Impact Assessment (Directive 85/337/EEC) indeed includes requirements for the impact on human beings, on the local fauna and flora, on material assets, and on cultural heritage. The costs of the necessary measures to meet these requirements are therefore included in the infrastructure costs. However, requirements for visual impact do not yet exist at EU level so that it might be necessary to consider this effect separately for projects with an exceptional visual impact (e.g. projects in densely populated, protected, or tourist areas).
- Early deployment benefits have also been
5 For example, in the business case study of EastWest HVDC interconnector (Eirgrid, 2008), the economic value of reduced CO2 emission and reduced wind curtailment are presented as benefit whilst they should already be counted in the production cost saving.
internalized in the infrastructure costs. EU innovation policies indeed include specific funds for demonstration. For most projects this effect should therefore not be considered separately, while exceptions could be made for first of a kind projects.
(2) Furthermore, there are effects that are likely to be similar across different projects so that they will not affect the ranking.
- Other market benefits are relatively similar for most projects, and are usually very small compared to other relevant effects. This is because the effect on competition and liquidity is usually limited. Exceptions can be projects that significantly change the structure of a market, such as projects in isolated areas.
- Macroeconomic effects are relatively similar for most projects. Infrastructure investments are commonly mentioned as an important pillar of economic growth (EC, 2010), but the impact of individual projects is likely to be similar.
To sum up, the CBA method can concentrate on three main effects, i.e. infrastructure costs, production cost saving and gross consumer surplus, as illustrated in Figure 4. These are the effects that will need to be considered for all projects.
What is given by the Energy Infrastructure Package
The Regulation provides guidelines concerning the effect mapping in both the Annex IV (criteria for PCI) and Annex V (guidelines on CBA). The list of criteria provided by the referred documents is not intended to be comprehensive, i.e. it refers to effects that should be included while it does not state that those are all the relevant effects.

http://think.eui.eu 13
Cost Benefit Analysis in the Context of the Energy Infrastructure Package
Figure 4: Reduced effect mapping
What is proposed by ENTSO-E
The ENTSOE draft proposal (2012a) lists seven benefits to be considered (Annex1). It is noted that ENTSOE distinguishes the benefits to be monetized and those to be quantified as additional indicators. The “Social-economic welfare” and “Variation in losses” belong to the first category, while other five benefits (“Improved security of supply, RES integration, Variation in CO2 emissions, Technical resilience/system safety, and Flexibility”) belong to the second category.
Recommendation
Start the analysis from the reduced list (Figure 4): (1) It avoids double counting; (2) it significantly simplifies the CBA method so that the results are more transparent; (3) it does not exclude that additional analysis is made for specific projects for which indicators show that the effects that have been initially dismissed are significant (Section 2.1.4).
1.5 Distributional effects
Infrastructure projects that fulfill the eligibility criteria mentioned in Section 1.2 will typically involve more than two zones. In most cases, the effects will be located in a relatively small area with similar economic development, but for specific projects the situation might be different so that distributional effects need to be considered.
Options
There are two possible ways of considering the distributional effects of a project, i.e. (1) outside and (2) inside the CBA.
First, the distributional effects could be treated out-side the CBA analysis via a redistribution. For instance, taxes are usually defined to address this issue; by applying different taxes to different groups of society, distributional effects can be corrected. The ex post redistribution allows for a separation between the pure efficiency analysis and redistribution decisions. The application of such method at the European level may however be complicated, due to the absence of a common tax scheme under the current institutional setting. Note however that there are other compensating measures, such as EU funds, that could fulfill the same purpose; indeed, the European Regional Development Fund was developed with a similar purpose. Note also that a possible way to deal with distributive concerns could be the definition of regional quotas by the Commission when adopting the Unionwide list of Projects of Common Interest (Section 1.1 provides more detail on this process).
Second, inside the CBA, the distributional effect could be accounted for by applying different distributional weights to different groups of agents or to different countries or zones. The consideration of distri
14
Final Report – January 2013
http://think.eui.eu
butional effects would require defining the different weights (for different agents, countries or zones) in a manner consistent with distributional policies.
What is given by the Energy Infrastructure Package
The Regulation does not specify the necessity or the way to address distributional effects, but the EU Regional Policy guide on CBA does propose the use of social discount rates6. Following this approach, developing countries have a higher discount rate because they have a higher economic growth outlook. This would exacerbate distributive concerns because for two projects with similar benefits, the project in the relatively more developed country would be ranked higher than the project in the relatively less developed country.
What is proposed by ENTSO-E
The ENTSOE draft proposal (2012a) does not explicitly discuss distributional effects, but it does refer to the EU Regional Policy guide. It is said that Regional Group should choose a unique discount rate for projects in the region, except when a project covers both countries that are beneficiary of the Cohesion Fund and countries that are not.
Recommendation
Distributional effects should be dealt with outside of the CBA.
6 Suggested SDR benchmark values: 5.5% for Cohesion and IPA countries, and for convergence regions elsewhere with high growth outlook; 3.5% for Competitiveness regions.
2. Calculation of net benefit
In this chapter, we first discuss how to realize a meaningful monetization of the relevant effects referred to in the previous chapter (Section 2.1), then how to discount the net benefit (Section 2.2), and finally how to deal with uncertainties (Section 2.3).
2.1 Monetization
In this section, we first concentrate on the effects that are relevant for all projects, i.e. infrastructure costs (Section 2.1.1), production cost savings (Section 2.1.2) and gross consumer surplus (Section 2.1.3), and then on effects that we dismissed in the previous chapter, but that could be relevant for specific projects (Section 2.1.4). Note that in this section we do not refer to the Regulation because it does not go into the details of monetization.
2.1.1 Infrastructure costs
Infrastructure costs refer to operational and capital expenditures of the transmission or storage project. Even if the infrastructure costs are typically less uncertain than the benefits, lack of information might still impede achieving a credible and accurate estimation of the costs.
How to remedy the lack of information
The TYNDP already gathers the information of major European electricity infrastructure projects in a single document (ENTSOE, 2012b), but costs are currently represented as a single number.
To allow benchmarking, it is important that promoters provide more detailed information. An

http://think.eui.eu 15
Cost Benefit Analysis in the Context of the Energy Infrastructure Package
interesting example is the National Grid Offshore Information Statement. It provides a detailed account of the assumed costs for each of the technological components used in the offshore transmission plan in the UK (National Grid, 2010a and 2010b).
What is given by the Energy Infrastructure Package
The Regulation requires that “national regulatory authorities cooperating in the framework of the Agency shall establish and make publicly available a set of indicators and corresponding reference values for the comparison of unit investment costs for comparable projects […].” Thus, the Regulation already recognizes the current lack of information regarding investments costs, and facilitates benchmarking by requiring the publication of national standard costs by the national regulatory authorities.
What is proposed by ENTSO-E
The ENTSOE draft proposal (2012a) does specify the items project promoters should take into account in the total project expenditure.7
Moreover, the environmental and social impact of projects is considered as a Key Performance Indicator (KPI) instead of a cost item, namely the “social and environmental sensibility”. This indicator is established through an expert assessment, supported by preliminary environmental studies.
7 They include costs for materials and assembly costs; for temporary solutions that are necessary to realize a project; costs for approval procedure; costs for devices that have to be replaced within a given period; dismantling costs at the end of the life cycle; other lifecycle costs. Residual value will be included in the last year of the analysis representing other costs that are expected after the horizon of the analysis, using a standard depreciation formula.
Recommendation
Infrastructure costs need to be reported disaggregated. There should be a predefined list of cost components that promoters are required to report separately. The list of items proposed by ENTSOE can be the starting point, but the costs incurred for mitigating environmental or social impact of the project should also be presented separately and included in the total project expenditure.
2.1.2 Production cost savings
Infrastructure investments can lead to a more efficient dispatch of production units, resulting in both short and longterm production cost savings (Box 3). The estimation of these savings is essentially a modeling issue.
What model to use
The modeling choices that need to be made include: (1) the geographic scope of the model; (2) to what extent the operational constraints of power plants are represented; (3) whether or not power plant investments are taken as given. There are different models that could be used, but there is no perfect model. It is important that the assumptions of the model are explicitly stated so that its imperfections can be corrected with additional analysis for projects where these imperfections are significant.
For instance, if the model assumes that power plant investments are given, and if the output of the CBA shows that a certain project causes significant price changes in a certain zone, this is a clear indication that for this project that assumption should be revisited in that zone. Indeed, longterm production cost savings can be significant for some projects (Box 3).

16
Final Report – January 2013
http://think.eui.eu
What is proposed by ENTSO-E
The ENTSOE draft proposal (2012a) refers to the importance of explicitly mentioning the model used by the different regions. The choice of the model is left to the ENTSOE regions, while ENTSOE does propose a minimum consideration of technical characteristics of power plants (“efficiency rate and CO2 emission rate”) and a minimum geographic scope (“all Member States and third countries on whose territory the project shall be built, all directly neighbouring Member States and all other Member States impacted by the project”).
Recommendation
The model and assumptions used to calculate productioncost savings should be clearly explained and published. It is also important that the choice of the model is coordinated with the data validation process of the baseline. If a region would for instance decide to use a model with a more detailed representation of the operational constraints of power plants, the
corresponding data should be validated, just like the other parameters of the baseline (Section 1.3.3).
2.1.3 Gross consumer surplus
Infrastructure investments, both transmission lines and storage units, could influence gross consumer surplus in three different ways: (1) reaction of demand to price changes; (2) reduction of lost load during contingency periods; and (3) improved system reliability. In what follows, we discuss the issues related to each of these three effects.
How to deal with demand elasticity
The reaction of demand to prices is the socall demand elasticity. As illustrated in Figure 5, the volume effect of price reduction (the solid black triangle) is typically small in comparison to the price effect (the dashed part). In other words, the main effect of a price reduction is a transfer of surplus from producers to consumers, while the increase in total surplus could
Box 3: Production cost savings due to infrastructure investments
The re-dispatch resulting from investment in both transmission and storage projects may imply savings on both short and long-term production costs (i.e. opex and capex).
Short-term benefits of re-dispatch are mostly resulting from allowing higher cost generation units to be replaced by lower cost generation units, as well as from reducing operational costs within a specific generation unit, due to enhanced efficiency related to a flattened production profile of each generation unit (for both energy supply and ancillary services provision). The former benefit should account for the main part of production cost saving. Nevertheless, the non-consideration of the efficiency-related operational cost savings would certainly lead to an underestimation of the benefits of infrastructure investments.
Short-term re-dispatch also has an implication for long-term production costs, as it may reduce the need for new generation by enhancing the utilization rate of existing assets. Indeed, if the network would be reinforced, less renewable energy would be curtailed; consequently, less capacity would be needed to reach the decarbonisation target. The same applies to conven-tional generation; the elimination of transmission bottlenecks could also avoid conventional generation investment, especially the peak load capacity. This long-term effect on investment costs could be relevant, especially when the infrastructure projects would induce significant price changes and, consequently, a substantial change in producer surplus.
For instance, in the CBA evaluation of the East-West interconnector, Eirgrid has considered that by investing in the interconnec-tor, the investment in a new peak plant at a cost of about €40 million annually could be avoided (approximately 7% of the overall estimated benefits) (Nooij, 2011).

http://think.eui.eu 17
Cost Benefit Analysis in the Context of the Energy Infrastructure Package
be neglected, unless the demand elasticity is very high or the price change is very significant.
Quantity
Price
p1
q1
Elastic demand
p2
q2
Inelastic demand
Figure 5: The effect of demand elasticity on consumer surplus
What is proposed by ENTSO-E
The ENTSOE draft proposal (2012a) refers to two ways of taking into account the greater flexibility of demand when assessing the socioeconomic welfare, and leaves the choice of the method to the regions.
Recommendation
Demand elasticity can be neglected for its relative small effect on consumers’ surplus for most projects. For projects where large and consistent price changes are expected, it may be necessary to consider demand response in more detail in order to capture the full benefits of the project.
Lack of reference value for lost load
To monetize the effect of reducing lost load during contingency periods, we need to know the Value Of Lost Load (VOLL). The VOLL depends on the regional and sectorial composition and the role of
electricity in the economy. The VOLL also differs as a function of time, location of the interruption, notification and frequency of interruption. The literature review by Van der Welle and van der Zwaan (2007) finds estimates of VOLL between 4 and 40 $/kWh for developed countries and between 1 and 10 $/kWh for developing countries. In other words, this is a relevant effect that needs to be monetized.
Currently, only some member states have an validated reference value, and there is no European reference value. Moreover, there are different methods to estimate the value of lost load, which can be roughly categorized into two sets: one is based on market behavior extrapolation and the other on surveys of individual electricity consumers8. CEER (2010) gives guidelines on how to consider country specificities when estimating the VOLL (Box 4).
What is proposed by ENTSO-E
In the ENTSOE draft proposal (2012a), changes in the volume of energy nonserved during contingency periods are estimated separately as an indicator for improved “security of supply”. ENTSOE also refers to the lack of reliable data throughout Europe as the reason not to monetize this effect.
Recommendation
A consented approach to calculate the VOLL at national level should be established, following the guidelines of CEER (2010). An intermediate solution could be that a value is agreed upon as part of the data validation process for the baseline (Section 1.3.3), for
8 The former extrapolates consumers’ willingness to pay out of the observation of market behaviour, such as power curtailment contracts and investment in backup generation, while the latter refers to conduct a survey asking individuals to elicit their intended willingness to pay in constructed situations. SINTEF (2010) gives recommendations on the most appropriate approach for different sets of users.

18
Final Report – January 2013
http://think.eui.eu
example based on values in those countries where specific studies have already been undertaken. How to deal with extreme events
Most projects contribute to the reliability of the system, but this is not necessarily what differentiates them for ranking. An exception could be a project that targets a crucial weakness of the system to help avoid extreme events, like a black out. In all other cases, this issue could be ignored for ranking projects.
What is proposed by ENTSO-E
In the ENTSOE draft proposal (2012a), the project’s ability to improve the system response during contingencies and extreme scenarios is assessed through the evaluation of KPIs. The scoring of three KPIs is summed to provide the total score of the project in terms of “Technical resilience/system safety margin”. The evaluation of each individual indicator would be based on professional power engineering judgment rather than only on algorithmic calculation.
Recommendation
The impact of the project on the avoidance of extreme events can be disregarded from the calculation of the net benefit. But, when a project shows to be relevant in the reinforcement of a crucial weakness of the system, this effect should be monetized and included in the net benefit calculation.
2.1.4 Project-specific effects
As discussed in Section 1.4.2, to arrive to our reduced list of effects that are relevant for all projects, we dismissed some effects that could be relevant for specific projects. These projects then require additional analysis. The key issue is to have indicators to detect when additional analysis is warranted.
Box 4: CEER guidelines on VOLL
The Council of European Energy Regulators (CEER) has issued Guidelines of Good Practice on the Estimation of Costs due to Electricity Interruptions and Voltage Disturbances in December 2010. One high-level conclusion is that National Regulatory Au-thorities should perform nationwide cost-estimation studies regarding electricity interruptions and voltage disturbances. It also recommends the cost-estimation studies should be adapted to country-specific characteristics in the following aspects:
• Objective of the cost-estimation study;
• Choice of customer groups and standard industrial classification;
• Data available for the normalization factor(s);
• Worst case scenarios and use of electricity;
• Choice of interruption scenarios and voltage disturbance phenomena; and
• Conduction method (response rates and sample size).
The report gives the examples of Italy and Norway. From 2012 on, the Italian NRA has set a transmission reliability incentive at 40 Eur/MWh, based on the weighted average for household and for business consumers of willingness to pay for avoiding lost load and willingness to accept compensation for it. In Norway, the values of lost load are in the range 5 - 205 NOK/kWh (8 NOK = 1 €).

http://think.eui.eu 19
Cost Benefit Analysis in the Context of the Energy Infrastructure Package
How to detect that additional analysis could be needed
Table 2 lists the indicators that can be used to detect whether additional analysis could be needed to monetize the other market benefits, early deployment benefits and local environmental and social costs. For other market benefits, such as competition and liquidity, there are wellestablished market concentration indicators (Hauteclocque and Glachant, 2009). For early deployment, the technology that is used can be an indication, but also whether a project is a first of a kind (e.g. offshore versus onshore). For local environmental and social costs, is mainly about the visual impact of a project so that possible indicators include population density whether the affected area is populated, touristic, or protected.
Note also that the type of analysis that is needed to capture these effects that we initially dismissed is generally complex. Indeed, to capture the other market benefits, the strategic behavior of power plants needs to be modeled (so that equilibrium models9 and agentbased models10 need to be used); for early deployment benefits, the noninternalized benefits
9 Equilibrium models can be divided into different categories: Cournot competition where firms compete in quantity (Hogan, 1997; Neuhoff et al., 2005; Ivanic et al., 2004); the supply function equilibrium approach where firms compete both in quantity and price (Green and Newbery, 1992; Baldick and Hogan, 2001); and the multipleunit auction approach (von der Fehr and Harbord, 1994).
10 Weidlich and Veit (2008) present a survey on agentbased wholesale electricity market models. Veit et al. (2009) applies this approach to assess market power with transmission capacity constraint.
of being a fist mover should be weighed against the option value of waiting (Pennings and Lint, 1997; Olmos et al., 2011); for local environmental and social costs, the “Externalities of Energy” (ExternE) project provides guidance11. The complexity of the required analysis and the uncertainty inherent in the results reinforces our argument that these effects should not be considered for all projects, but only for projects where indicators show that it could be justified to perform additional analyses.
11 ExternE is a research project of the European Commission which aim is to attach a monetary value to all external effects originating from energy related activities (ExternE, 2005). Here, a specific method to attribute a value to the impact on visual amenities has been developed, which could be used for this purpose. The benchmark values resulting from this research project are publicly available and are currently used by the European Commission (DG Environment) to value external costs of public and private investments.
Table 2: Example of indicators to evaluate the relevance of project-specific effects
Other market benefits Early deployment benefits Local environmental andsocial costs
Indicators Market concentration indica-tors, Isolated areas
Technology,First of a kind
Population density, protected area, touristic area

20
Final Report – January 2013
http://think.eui.eu
2.2 Inter-temporal discounting of costs and benefits
Intertemporal discounting is about enabling the comparison between effects that occur at different points in time. The main issues are: (1) Low or high discount rate; (2) single or multiple discount rates; and (3) reference point. Note that in this section we do not refer to the Regulation because it does not go into the details of discounting.
Low or high discount rate
Fundamentally, the discount rate reflects the opportunity cost of capital, i.e. by investing in one project we sacrifice the return from investing in another project.
- A lower bound for the discount factor is therefore a riskfree, social discount rate, assuming a perfectly functioning financial market. This value may be country specific, since it is supposed to reflect the longterm rate of growth in the economy.
- A higher bound can then be obtained by incorporating the risk related to the financial assets12, the financial portfolio of the specific actor13, and the risk related to the underlying project14. Note that a discount rate can also include inflation (nominal rate) or not (real rate).
12 The rates of return of different financial assets differ. For example, a governmental bond is often considered a financial asset with lower risk than other financial derivatives.13 It means the proportion of equity, debt and financing leverage of the investor. 14 Capital Asset Pricing Model (CAPM) is a tool to estimate the cost of capital, which expresses the cost of equity for a project as the sum of a riskfree rate and a risk premium. The size of the risk premium depends on the risk of an asset relative to the market as a whole (Brattle, 2004).
A higher discount rate means that the welfare of the current users is prioritized over the welfare of future users. Note also that the discount rate tends to be a critical factor for electricity infrastructure projects. For instance in the case of the CBA performed for the NorNed interconnector (de Nooij, 2011), increasing the discount rate from 6% to 9% more than halved the net benefit from 448 to 213 M Euro.
What is proposed by ENTSO-E
The ENTSOE draft proposal (2012a) says that the value of the discount rate to be used in the CBA should lay between a lower and a higher bound, without constraining the choice on how to calculate the discount rate and which factors to take into account.
Moreover, ENTSOE requires consistency between the discount rate used and the valuation of costs and benefits, i.e. real prices implies real rate, nominal prices imply nominal rate.
Recommendation
As these projects are candidates to receive the PCI label, they are likely to receive higher confidence from potential investors and, consequently, a facilitated access to capital. Thus, the lower rather than the higher bound discount rate should be used. Most important is that this parameter is validated, just like the parameters of the baseline (Section 1.3.3).
Single or multiple discount rate
Electricity infrastructure projects in Europe are likely to have similar access to capital, considering that they will be subject to similar regulatory treatment and/or will be eligible for EU financial support. A single rate should therefore be used. Using multiple rates would

http://think.eui.eu 21
Cost Benefit Analysis in the Context of the Energy Infrastructure Package
imply that we would not only compare the European added value of these projects, but for instance also the financial strength of the project promoters.
Note also that if we apply different discount rates to different countries based on expected growth prospects projects in more developed countries would be discounted at a lower rate than those in the less developed ones. This would imply that we would rank projects from less developed countries lower than projects from more developed countries, while from a distributional point of view we should rather do the opposite.
What is proposed by ENTSO-E
The ENTSOE draft proposal (2012a) refers to a single discount rate per region, as given by the regional policy: “Moreover, for comparison purposes and simplicity, following the EC guide on CBA (page 208-210), each Regional Group should choose a unique discount rate for the projects in the region, except when the project covers both countries that are beneficiary of the Cohesion Fund and countries that are not.”
Recommendation
A common EUwide discount factor should be used and agreed upon through an open consultation process.
Reference point
The reference point should be the same for all projects to enable the comparison of the net benefit of these projects.
What is proposed by ENTSO-E
In the ENTSOE draft proposal (2012a), the reference point is the present.
Recommendation
The ENTSOE proposal is fine, as it allows projects to be compared.
2.3 Uncertainty
In this section, we distinguish between (1) uncertainties in the baseline and (2) project uncertainties, as they require a different analytical approach.
2.3.1 Uncertainties in the baseline
When performing a CBA analysis, uncertainties are unavoidable, since several assumptions need to be made regarding the parameters of the baseline scenario.
There are three methods to deal with uncertainties in the baseline. (1) Sensitivity analysis (Nguyen et al., 2002; Sun and Zhang, 2002; Hamby, 1994) checks how the net benefit is affected by changes in the different parameters to identify the critical ones. (2) Multi-scenario analysis (Heydinger and Zentner, 2006; Schnaars, 1987) tests the robustness of the net benefit of a project across possible scenarios of the future. By attributing a probability to the different scenarios, multiscenario analysis can also make a first approximation of the net benefit distribution of a project. (3) Stochastic analysis (Birge and Louveaux, 1997; Wallace and Fleten, 2003; Maggioni and Wallace, 2011) goes a step further in approximating the net benefit distribution of a project. This approach
22
Final Report – January 2013
http://think.eui.eu
requires assigning probabilities to the different parameters in the baseline.
Note that these three methods are complementary because stochastic analysis can be done based on sensitivity analysis (to know the critical parameters) and multiscenario analysis (to know the ranges for these parameters). Indeed, once we have identified the range of the critical parameters, we can assume a probability function over this range and apply Monte Carlo techniques to calculate the distribution of the net benefit of the project. Eirgrid (2009), for instance, applied this technique to the production cost savings of the EastWest interconnector.
What is given by the Energy Infrastructure Package
The Regulation requires sensitivity analysis: “Each cost-benefit analysis shall include sensitivity analyses concerning the input data set, the commissioning date of different projects in the same area of analysis and other relevant parameters…”
What is proposed by ENTSO-E
In the ENTSOE draft (2012a), the use of multiscenario analysis is proposed: “At least one other scenario [besides the reference scenario] should be analysed”, complementing the topdown scenario used as baseline with a bottomup scenario. This analysis is supplemented with sensitivity analysis, which is translated into KPIs that intend altogether to evaluate the ability of the project to ensure that the needs of the system are met in a future scenario that differs from the present projections, i.e. Robustness/Flexibility criterion.
Recommendation
The three methods should be combined: (1) sensitivity
analysis to identify critical parameters; (2) ranges for these critical parameters can then be determined based on their values in the scenarios of the Energy Roadmap 2050; (3) stochastic modeling can then be used to calculate the net benefit distribution of the project, by assuming a probability function over the ranges of each critical parameter.
2.3.2 Project uncertainties
Projects themselves are also uncertain, both in terms of their (1) development timeline and their (2) infrastructure costs. Many infrastructure projects have indeed been severely delayed. For instance, in the specific case of the PolandLithuania link, the project was under discussion for over fifteen years before moving ahead (Mielczarski, 2008). This motivated the appointment of European Coordinators for some of these projects. Infrastructure costs are uncertain because not many projects have been developed, but also because new technologies are being used or new territories are covered, like offshore.
Project uncertainties are by definition project specific so they are not captured by the uncertainties in the baseline. To the extent that they cannot be avoided, they will therefore need to be considered separately. Eirgrid (2009) for instance considered that the infrastructure costs for the EastWest Interconnector (500 MW) are between been 36 and 43 M Euro per year.
What is given by the Energy Infrastructure Package
There are several provisions that can reduce the uncertainties of the project development timeline. Moreover, the above quote already referred to the commissioning data as one of the relevant parameters for sensitivity analysis.
http://think.eui.eu 23
Cost Benefit Analysis in the Context of the Energy Infrastructure Package
What is proposed in ENTSO-E
The ENTSOE draft proposal (2012a) says that: “The uncertainty in the commissioning date of some future assets could nevertheless require a conservative approach when building the planning cases.” .. “A case without one or some reinforcements foreseen, as well as cases including less conservative approaches, could be analysed. ” ENTSOE also proposes to use ranges for infrastructure costs rather than single values.
Recommendation
The ENTSOE proposal already addresses the issue of project uncertainties.
3. Ranking projects
As previously mentioned, the CBA method will be used to rank projects that are proposed to be selected as a Project of Common Interest (PCI). In what follows, we argue that the mean value of the net benefit distribution should be used to rank projects, with a possible adjustment for competitive projects, and uncertainty in some cases.
The net benefit of CBA should already contain
all relevant effects
One could argue that certain effects are so difficult to quantify that they should not be included in the calculation of the net benefit. Instead, they could then be provided as an indicator so that projects can be ranked based on their net benefit and a set of indicators. As illustrated in the previous chapter and summarized in Annex 1, the ENTSOE draft proposal (2012a) is indeed to monetize some effects, and to provide indicators for others.
If projects are then ranked based on the monetized net benefit in combination with these indicators, it implies an implicit monetization of effects that have not been monetized explicitly. Such an implicit approach is less transparent and allows for subjective judgment. Therefore, even the difficult to quantify effects should be monetized when they are relevant, as discussed in Section 2.1.
There is a need to adjust the ranking of competi-
tive projects
In section 1.3.2, we recommended that projects should be evaluated against two baselines, one including and the other excluding all other proposed projects. For the initial ranking one of the two baselines would need to be chosen.
If the ENTSOE proposal would be followed, the initial ranking would be based on the baseline with all proposed projects included. When two competitive projects are proposed and ranked against this baseline, they will be ranked low and both could even exhibit a negative net benefit, while developing one of them could be strongly beneficial. To detect this kind of cases, the other baseline could be used, and the ranking of these projects then might need to be adjusted based on additional analysis.
Note also that if the ranking would instead be based on the baseline excluding all other proposed projects, we would have the opposite problem. Competitive projects would both be ranked high, even in cases where it is only beneficial to develop one of them. In other words, there is no perfect baseline, and adjustments to the initial ranking will anyway be needed for competitive projects.

24
Final Report – January 2013
http://think.eui.eu
There is a need to adjust the ranking for uncer-
tainties
In Section 2.3, we recommended a stochastic analysis in order to assess how uncertainties may affect the net benefit. Such an approach would provide a net benefit distribution, containing information on the mean value as well as the possible variation of the net benefit from the mean value. This variation is an indication of the project risk.
There might be specific projects with a significantly different risk profile than the average project so that policy makers might want to adjust the ranking of these projects, depending on their risk averseness. For instance, in the case illustrated by Figure 6, even if the mean value of B is higher than the one of A, one could consider to rank A higher since the risk of the project is lower, i.e. the deviation from the mean value is lower than for project B.
Figure 6: Graphic illustration of distribution curves for two different projects, A and B.
Legend – A has a lower mean value than B; and A has a lower risk than B (since the deviation from the mean value is lower)

http://think.eui.eu 25
Cost Benefit Analysis in the Context of the Energy Infrastructure Package
4. Methodological implications of using CBA for cost allocation
The Regulation considers CBA as a tool to enable crossborder cost allocation (Box 5). It means that the CBA method also needs to identify where the effects are localized.
Infrastructure costs by definition have a geographical dimension. The model used to monetize the other two main effects (i.e. production cost savings and gross consumer surplus) can also provide disaggregated output for each zone because it needs a minimum network representation with more than one node
per TSO area. Note only that some of the effects that can be relevant for specific projects have public good characteristics so that they cannot be easily assigned to zones. This is for instance the case for other market benefits, early deployment benefits and system reliability. For these effects, there could be a simple rule of thumb, like allocating them equally among zones.
The method recommended for ranking projects in this report could therefore also be used for cost allocation. It only additional requirement is that the output is disaggregated per TSO area.
Box 5: CBA for cost allocation in the Regulation
Projects of Common Interest will have an enhanced regulatory treatment (Article 13). It includes using CBA for cost allocation:
- Under normal circumstances, the project promoter(s) must provide to all the concerned national regulatory authorities a cost-benefit analysis of the infrastructure project, while the final decision on the allocation of costs shall be taken by the na-tional regulatory authorities.
- In case the national regulatory authorities have not reached an agreement within six months or upon a joint request from the national regulatory authorities concerned, the Regulation states that the decision regarding cross-border cost allocation shall be taken by ACER that may use CBA output as a decision tool

26
Final Report – January 2013
http://think.eui.eu
Recommendations
The draft method proposed by ENTSOE is an important step in the right direction, but improvements can still be done, as we recommend below.
Recommendations for the scope of the analysis
1. Interaction between projects must be taken into account in the project and baseline definition
The ENTSOE proposal ensures that only projects that significantly contribute to the common goal of increasing the capacity on a certain border can be grouped. However, the objective should be to group together projects which are complementary in terms of their net benefit, i.e. the net benefit of both projects together is higher than the sum of the net benefit of the individual projects. Project promoters should be made responsible for providing evidence on the complementarities between investments that are proposed as a single project.
2. Data consistency and quality should be ensured
A public consultation is a good way to ensure the quality of the data that will be used in the baseline. ENTSOE has already proposed such a consultation to validate the data, following the current practice in the context of the Ten Year Network Development Plan. It is also important to ensure the consistency of the scenarios with the Energy Roadmap 2050.
3. Conventional time horizon is 20-25 years
There is a tradeoff between capturing longerterm effects and increased uncertainty. The ENTSOE proposal is already in line with the conventional time horizon.
4. CBA should concentrate on a reduced list of effects and those should be monetized
There are three effects that should be monetized for all projects, i.e. (1) infrastructure costs, (2) production cost savings and (3) gross consumer surplus. There are additional effects which may be relevant to specific projects and indicators should be used to identify these projects and to justify additional analysis to monetize also these effects. This can be the case for projects with an exceptional visual impact (e.g. projects in densely populated, protected or tourist areas) or for projects that significantly change the structure of a market (e.g. projects in isolated areas) or for projects that are exceptionally innovative (e.g. first of a kind projects, such as offshore infrastructures).
The ENTSOE draft proposal lists seven benefits to be considered for all projects. A distinction is made between effects that are to be monetized, i.e. “social-economic welfare” and “variation in losses”, and effects that are to be quantified as additional indicators, i.e. “improved security of supply, RES integration, Variation in CO2 emissions, Technical resilience/system safety and flexibility”. If projects are then ranked based on the monetized net benefit in combination with these indicators, it implies an implicit monetization of effects that have not been monetized explicitly. Such an implicit approach is less transparent and allows for subjective judgment.
5. Distributional concerns should not be addressed in the calculation of net benefits
The economic analysis of efficiency gains from infrastructure projects should be done without consideration of distributional effects. If there are concerns, they should be resolved with explicit political decisions by relevant authorities. The European Commission could for instance use

http://think.eui.eu 27
Cost Benefit Analysis in the Context of the Energy Infrastructure Package
regional quotas when defining the EUwide list based on the regional lists.
The ENTSOE draft proposal does not explicitly discuss distributional effects, but it does refer to the EU Regional Policy Guide. The guide proposes the use of social discount rates, which implies that the rates of developing countries are higher because they have a higher economic growth outlook. As a result, the projects of these countries will be ranked lower than projects with similar benefits in developed countries, which exacerbates distributional concerns. Below, we argue in favor of using a common discount factor for all projects.
Recommendations for the calculation of the net
benefit
6. Infrastructure costs need to be disaggregated
There should be a predefined list of cost components that promoters are required to report separately. The list of items proposed by ENTSOE can be the starting point, but the costs incurred for mitigating environmental or social impact of the project should also be presented separately and included in the total project expenditure.
7. The model used to monetize the benefits needs to be explicitly stated
The draft ENTSOE proposal leaves certain modeling choices to the Regional Groups, while also providing some model specifications. There is indeed no single model that adequately captures all the production cost savings and gross consumer surplus of all transmission and storage projects. It is therefore important that the assumptions of the model are clearly explained to allow for a proper interpretation
of the CBA results. The choice of the model should also be coordinated with the data validation process of the baseline.
8. A common discount factor should be used for all projects
Projects of Common Interest will have a similar regulatory treatment and might also be eligible for EU financial support. The label can also improve the confidence of potential investors and thereby facilitate access to capital. These projects are therefore likely to have similar access to capital so that a common discount factor should be used for all projects. The factor should be agreed upon through open consultation, together with the parameters of the baseline. The ENTSOE draft proposal is partially in line with this recommendation because there is a single discount rate for every region.
9. A stochastic approach that is consistent with the Energy Roadmap 2050 should be used to address uncertainty
The Energy Roadmap 2050 already provides possible extreme scenarios for the future that are consistent with the EU energy and climate objectives. Based on these scenarios, a stochastic approach should be followed to capture the robustness of projects across these possible futures, which would result in a net benefit distribution.
The ENTSOE draft proposal already refers to the use of multiple scenarios and the use of sensitivity analysis, but not yet a stochastic approach. Nevertheless, it has already been implemented by several TSOs in Europe for electricity infrastructure projects. We argue that this approach should be adopted at EU level and be consistent with the scenarios of the Energy Roadmap 2050.

28
Final Report – January 2013
http://think.eui.eu
Recommendation for ranking
10. The ranking should be primarily based on the monetized net benefit
The method we recommend above is a stochastic approach that calculates a net benefit distribution against two baselines, i.e. one with and one without all proposed projects. However, to rank projects we need a single monetized value. This value could be obtained by taking the mean value of the net benefit distribution of a project against one of the baselines, but adjustments might then be needed for (1) competitive projects and (2) uncertainty. For these projects, the ranking could be adjusted by the decision making body of the Regional Groups (i.e. Member States and European Commission).
Observation regarding cost allocation
11. Methodologically, CBA can be used for cost allocation
The method recommended for ranking projects in this report, could also be used as a basis for cost allocation. The only additional requirement is that the output is disaggregated per TSO area.

http://think.eui.eu 29
Cost Benefit Analysis in the Context of the Energy Infrastructure Package
References
Adamowitsch, G.W., 2010. European Coordinator’s Third Annual Report on Baltic and North Sea offshore wind connections.
Amundsen, E.S., Nese, G., 2009. Integration of tradable green certificate markets: what can be expected? Journal of Policy Modeling 31, 903922.
Barquín, J., 2008. Comparativa internacional de elaboración de planes de expansión de la red de transporte. Comillas University, Madrid.
Birge, J.R., Louveaux, F., 1997. Introduction to Stochastic Programming, Springer. New York, NY.
Borenstein, S., Bushnell, J. and Stoft, S., 2000. The competitive effects of transmission capacity in a deregulated electricity industry. The RAND Journal of Economics, 31(2), 294 325.
Brattle Group, 2004. The cost of capital for the Norned cable. June 2004.
Brattle Group, 2007. International Review of Transmission Planning Arrangements – a report for the Australian Energy Market Commission. October 2007.
Brattle Group, 2010. Transmission Planning and Cost Benefit Analysis. Presented at: EUCI Web Conference, by Johannes Pfeifenberger & Delphine Hou, September 22, 2010.
CAISO, 2004. California Independent System Operator. Transmission Economic Assessment Methodology (TEAM)
CEER, 2010. Council of European Energy Regulators. Guidelines of Good Practice on Estimation of Costs due to Electricity Interruptions and Voltage Disturbances. December 2010.
Denholm, P. and R. Sioshansi, 2009. The value of compressed air energy storage with wind in transmissionconstrained electric power systems. Energy Policy, Vol. 37, pp. 3149–58.EC, 2008. European Commission Directorate General Regional Policy. Guide to Cost Benefit analysis of investment projects.
EC, 2011a. European Commission. Proposal for a Regulation of the European Parliament and of the Council on guidelines for a transEuropean energy infrastructure and repealing Decision No 1364/2006/EC.
EC, 2011b. European Commission. Commission Staff Working Paper – Energy infrastructure investment needs and financing requirements, SEC(2011) 755 final.
EC, 2011c. European Commission. Communication from the Commission to the European Parliament, the Council, the European Economic and Social Committee and the Committee of the Regions: Energy Roadmap 2050. Brussels, XXX COM(2011) 885/2.
EC, 2011d. European Commission. Communication from the Commission to the European Parliament, the Council, the European Economic and Social Committee and the Committee of the Regions: A Roadmap for moving to a competitive low carbon economy in 2050. Brussels, 8.3.2011 COM(2011) 112 final.
Egerer, J., von Hirschhausen, C., Kunz, F., 2011.

30
Final Report – January 2013
http://think.eui.eu
Planning the Offshore North and Baltic Sea Grid: A study on Design drivers, Welfare Aspects and the impact on the National Electricity Markets. Electricity Markets Working Papers, WPEM47, TU Dresden and TU Berlim.
EirGrid, 2008. Business case. The development of an East West Electricity Inter connector.
EirGrid, 2009. Interconnection Economic Feasibility Report.
Energinet.dk, 2009. Joint Prefeasibility Study by Energinet.dk, Svenska Kraftnät, Vatenfall Europe Transmission, An Analysis of Offshore Grid Connection at Kriegers Flak in the Baltic Sea, May 2009.
ENTSOE, 2012a. Guideline for Cost Benefit Analysis of Grid Development Projects. September 2012; updated in November 2012; updated further in December 2012.
ENTSOE, 2012b. ENTSOE TenYear Network Development Plan 2012. July 2012.
ENTSOE, 2012c. EHighway 2050 Project – Preparing the electricity grid of the future. https://www.entsoe.eu/systemdevelopment/2050electricityhighways/
ExternE, 2005. ExternE – External Costs of Energy. Official website. http://www.externe.info/externe_d7/
Eyer, J., Iannucci, J., Butler, P.C., 2005. Estimating Electricity Storage Power Rating and Discharge Duration for Utility Transmission and Distribution Deferral. A Study for the DOE Energy Storage Program.
Green and Newbery, 1992. Competition in the British electricity spot market. Journal of Political Economy, 100 (5) (1992), pp. 929–953
Hadush, S. Y., Belmans, R., 2012. Offshore wind power generation and transmission tariff design options. 9th International Conference on the European Energy Market (EEM 2012), Florence, Italy.
Hamby, D. M., 1994. A review of techniques for parameter sensitivity analysis of environmental models. Environmental Monitoring Assessment, 32(1994), 135154
de Hauteclocque, A. and Glachant. J.M,. 2009. Longterm energy supply contracts in European competition policy: Fuzzy not crazy Energy Policy, Volume 37, Issue 12, December 2009, Pages 53995407.
He, X., R. Lecomte, A. Nekrassov, E. Delarue, and E. MercierAllart, 2011c. Compressed Air Energy Storage multistream value assessment on the French energy market. IEEE Powertech 2011, Trondheim, 19 23 June 2011.
Heydinger, R.B., Zentner, R.D., 1983. Multiple scenario analysis : Introducing uncertainty into the planning process. New Directions for Institutional Research. 1983(39), 5168. September 1983.
Hogan, William W., 1997. A Market Power Model with Strategic Interaction in Electricity Networks. The Energy Journal, Vol. 18, n. 4, pp. 107141.
JRC IET, 2012. Giordano, V., Onyeji, I., Fulli, G., Sánchez Jiménez, M. (DG ENER), Filiou, C. (DG ENER). Guidelines for conducting a costbenefit

http://think.eui.eu 31
Cost Benefit Analysis in the Context of the Energy Infrastructure Package
analysis of Smart Grid projects. JRC Reference Reports, 2012.
Joskow, P.L., 2005. Patterns of transmission investment. Mimeo, Department of Economics, MITLatorre, G., Cruz, R.D., Student Member, IEEE, Areiza, J.M., Villegas, A., 2003. Classification of Publications and Models on Transmission Expansion Planning. IEEE Transactions on Power Systems, vol. 18, No 2(2003), 938946.
Latorre, G., Cruz, R.D., Areiza, J.M., Villegas, A., 2003. Classification of Publications and Models on Transmission Expansion Planning. IEEE Transactions on Power Systems, vol. 18, No 2(2003), 938946.
London Economics, 2011. Estimating Value of Lost Load (VoLL)
Maggioni, F., Wallace, S.W., 2011. Analyzing the quality of the expected value solution in stochastic programming. Annals of Operation Research,.
Meeus, L., Hafner, M., Azevedo, I., Marcantonini, C., Glachant, J.M., 2011b. Transition Towards a Low Carbon Energy System by 2050: What Role for the EU?. Final report of the EU FP7 Funded Research project THINK (Topic n° 3/12: http://think.eui.eu). ISBN:9789290840701; doi:10.2870/35290.
Meeus, L., 2012. Appraisal of the European Commission’s Energy Roadmap 2050, European Energy Journal, Issue 3, pp. 4854.
Mielczarski, W., 2008. Annual Activity Report September 2007 – September 2008 of the European Coordinator Prof. Wladyslaw
Mielczarski: Project of European Interest Poland – Lithuania link including reinforcement of the Polish electricity network and the PolandGermany profile. Brussels, 23 September 2008.
MIT, 2011. The Future of the electric grid – an interdisciplinary MIT study. Copyright © 2011 Massachusetts Institute of Technology. ISBN 9780982800867
Monti, M., 2008. Rapport du Coordonnateur Europeen Mario Monti – Projet d’Interet Europeen EL3. « Interconnexion électrique France – Espagne » rédigé à la demand du Président de la République Française et du Président du Gouvernement Espagnol. Brussels, June 2008.
National Grid, 2011. National Electricity Transmission System Seven Year Statement. May 2011.
National Grid, 2010. Offshore development Information Statement Appendices – Appendix One
Neuhoff, K., Barquin, J., Boots, M.G., Ehrenmann, A., Hobbs, B.F., Rijkers, F.A.M., Vázquez, M., 2005. Networkconstrained Cournot models of liberalized electricity markets: the devil is in the details. Energy Economics, 27 (2005), pp. 495–525.
Neuhoff, K., Ehrenmann, A., Butler, L, Cust, J., Hoexter,H., Keats, K., Kreczko,A., Sinden, G., 2007. Space and time: Wind in an investment planning model. Energy Economics, Volume 30, Issue 4, July 2008, Pages 19902008.
Nguyen, T.B., Pai, M.A., Hiskens, I.A., 2002. Sensitivity analysis for direct computation of critical
32
Final Report – January 2013
http://think.eui.eu
parameters in a power system. International Journal of Electrical Power and Energy Systems. 24(5), 337343, June 2002.
de Nooij, M., 2011. Social costbenefit analysis of electricity interconnector investment: A critical appraisal. Energy Policy, 39 (2011) 30963105.
Nordel, 2007. Nordic Grid Code 2007 (Nordic collection of rules).
Nyitrai. K., 2012. Energy Infrastructure Package: the role of the costbenefit analysis. ENTSOE workshop “Assessing the future projects of European interest – Cost Benefit Analysis Methodology”. Brussels, 19 November 2012.
Olmos, L., Newbery, D., Ruester, S., Liong, S.J., Glachant, J.M., 2011b. Public Support for the Financing of RD&D Activities in New Clean Energy Technologies.. Final report of the EU FP7 Funded Research project THINK (Topic n° 1/12: http://think.eui.eu). ISBN:9789290840664; doi:10.2870/34121.
Olmos, L., PérezArriaga, I., 2009. A comprehensive approach for computation and implementation of efficient electricity transmission network charges. Energy Policy, 37(12), 52855295, December, 2009.
Pattanariyankool, S and Lave, L. B., 2010. Optimizing transmission from distant wind farms. Energy Policy, Volume 38, Issue 6, June 2010, Pages 28062815.
Pennings, E., Lint, O., 1997. The option value of R&D. European Journal of Operational Research, 103(1), 8394, November 1997.
PérezArriaga, I.J., Gómez, T., Ramos, A., 1987. StateoftheArt Status on Transmission Networks Planning (in Spanish), Instituto de Investigación Tecnológica, Madrid, Spain.
Pieper, C. and H. Rubel, 2010. Electricity storage: Making largescale adoption of wind and solar energies a reality. Report 3/10, Boston Consulting Group.
Phillips, B.R., Middleton, R. S., 2012. SimWIND: A geospatial infrastructure model for optimizing wind power generation and transmission. Energy Policy, Volume 43, April 2012, Pages 291302
Purchala, K., Meeus, L., Belmans, R., 2005. Zonal network model of European interconnected electricity network. Working paper KU Leuven, 08.09.2005.
Ray, A., 1984. CostBenefit Analysis – Issues and methodologies. John Hopkins University Press. World Bank Publication.
REALISEGRID, 2010. D3.3.1 – Possible criteria to asses technicaleconomic and strategic benefits of specific transmission projects.
REALISEGRID, 2009. D3.1.1 – Review of existing methods for transmission planning and for grid connection of wind power plants. June 2009.
Ruester, S., Vasconcelos, J., He, X., Chong, E., Glachant, J.M., 2012. Electricity storage: How to facilitate its deployment and operation in the EU. Final report of the EU FP7 Funded Research project THINK (Topic n° 8/12: http://think.eui.eu). ISBN: 9789290840879; doi:10.2870/41846

http://think.eui.eu 33
Cost Benefit Analysis in the Context of the Energy Infrastructure Package
Sauma, E.E., Oren, S.S., 2007. Economic Criteria for Planning Transmission Investment in Restructured Electricity Markets. Power Systems IEEE Transactions on (2007), Vol. 22, Issue 4, IEEE, pp. 13941405.
Schnaars, S.P., 1987. How to develop and use scenarios. Long Range Planning, 20(1), 105114, February 1987.
SikowMagny, C., 2012. The PCI identification process and implementing measures. European Commission, Energy. Presented on 9th October 2012.
SINTEF, 2010. “Study on Estimation of Costs due to Electricity Interruptions and Voltage Disturbances”. SINTEF Energy Research (www.sintef.no), October 2010, Ref. TR F6978, available through http://www.energyregulators.eu
Sun, H.B., Zhang, B.M., 2002. A systematic analytical method for quasisteadystate sensitivity. Electric Power Systems Research. 63(2), 141147, September 2002.
UN, 2006. United Nations. MultiDimensional Issues in International Electric Power Grid Interconnections. Department of Economic and Social Affairs, United Nation.
Van der Welle, A., van der Zwaan, B., 2007. An Overview of Selected Studies on the Value of Lost Load (VOLL).
Veit, D.J, Weidlich, A., Krafft, J.A., 2009. An agentbased analysis of the German electricity market with transmission capacity constraints. Energy Policy, Volume 37, Issue 10, October 2009, Pages
41324144
von der Fehr, N.H. and David Harbord, 1993. Spot market competition in the UK electricity industry. The Economic Journal 103, 531546.
von der Fehr, N.H., Sandbraten, L., 1997. Water on fire: gains from electricity trade. Scandinavia Journal of Economics 99(2), 281–297.
Wallace, S.W., Fleten, S., 2003. Stochastic programming models in energy. Stochastic Programming (Handbooks in Operations Research and Management Science), Elsevier, London, New York and Amsterdam, 637677.
Weidlich,A., Veit,D., 2008. A critical survey of agentbased wholesale electricity market models. Energy Economics, Volume 30, Issue 4, July 2008, Pages 1728175

34
Final Report – January 2013
http://think.eui.eu
Cat
ego
ries
Met
ho
d fo
r as
sess
ing
the
crit
eria
Ass
essm
ent
Qu
anti
tati
ve v
s. Q
ual
itat
ive
Thre
sho
lds
1. T
ota
l pro
ject
exp
end
itu
res
To b
e es
timat
ed b
y th
e p
rom
oter
, in
orde
r to
cons
ider
life
-cyc
le c
osts
Qua
ntita
tive
and
Mon
etis
edO
vera
ll co
st (M
€):
(1) C
ost <
300
M€
(2) 3
00 M
€ <
cos
t < 1
000
M€
(3) C
ost >
100
0 M
€
2. S
oci
al a
nd
env
iro
nm
enta
l sen
sib
il-
ity
Exp
ert o
pin
ion,
sup
por
ted
by p
relim
inar
y en
viro
n-
men
tal s
tudi
es
Qua
litat
ive
Sens
ibili
ty a
ssoc
iate
d w
ith th
e p
roje
ct
(1) L
ow s
ensi
bili
ty
(2) M
ediu
m s
ensi
bili
ty
(3) H
igh
sens
ibili
ty
3. S
ecu
rity
of s
up
ply
•W
hen
deal
ing
with
gen
erat
ion
adeq
uacy
:
use
of m
arke
t mod
els
to m
easu
re lo
ss o
f
load
exp
ecta
ncy
(LO
LE)
•W
hen
deal
ing
with
net
wor
k ad
equa
cy: u
se
of n
etw
ork
mod
els
to m
easu
re e
xpec
ted
ener
gy n
ot s
upp
lied
(EN
S)
Qua
litat
ive
Imp
act o
n So
S:
(1) I
t has
no
mea
sura
ble
imp
act
(2) I
t inc
reas
es S
oS fo
r an
area
of a
nnua
l ene
rgy
dem
and
grea
ter t
han
3TW
h by
mor
e th
an 0
.001
% o
f ann
ual c
on-
sum
ptio
n
(3) I
t inc
reas
es S
oS fo
r an
area
of a
nnua
l ene
rgy
dem
and
grea
ter t
han
3TW
h by
mor
e th
an 0
.01%
of a
nnua
l con
-
sum
ptio
n
4. S
oci
al a
nd
eco
no
mic
wel
fare
•C
alcu
late
redu
ctio
n in
tota
l gen
erat
ion
with
gene
ratio
n di
spat
ch m
odel
Or
•C
alcu
late
cha
nges
in to
tal s
urp
lus,
incl
udin
g
pro
duce
r and
con
sum
er s
urp
luse
s as
wel
l as
cong
estio
n re
nts
Qua
ntita
tive
and
Mon
etis
edA
nnua
l ben
efit (
M€)
:
(1) B
enefi
t < 3
0 M
€
(2) 3
0 M
€ <
ben
efit <
100
M€
(3) B
enefi
t ≥ 1
00 M
€
Tab
le A
1: Id
entifi
catio
n an
d qu
antifi
catio
n of
cos
ts a
nd b
enefi
ts p
rop
osed
by
ENTS
O-E
Annex1: Cost benefit analysis as proposed by ENTSO-E

http://think.eui.eu 35
Cost Benefit Analysis in the Context of the Energy Infrastructure Package5.
RES
inte
gra
tio
nC
alcu
late
the
incr
ease
in re
new
able
gen
erat
ion
host
ing
cap
acit
y of
the
grid
with
gen
erat
ion
disp
atch
mod
el (M
W)
Or
Cal
cula
te th
e av
oide
d cu
rtai
lmen
t of R
ES e
lect
ric-
ity
(MW
h)
Qua
ntita
tive
and
Non
-mon
etiz
ed
(alre
ady
par
tialy
incl
uded
in 4
)
Allo
wed
incr
ease
in R
ES c
onne
ctio
n (M
W):
(1) N
o eff
ect o
r not
sig
nific
ant
(2) D
irect
con
nect
ion
incr
ease
of 1
00 to
500
MW
RES
pro
-
duct
ion
or in
crea
ses
RES
gene
ratio
n by
50
to 3
00 G
Wh
(3) D
irect
con
nect
ion
incr
ease
> 5
00 M
W R
ES p
rodu
ctio
n or
incr
ease
s RE
S ge
nera
tion
by >
300
GW
h
6. V
aria
tio
n in
loss
es (E
ner
gy
ef-
fici
ency
)
Cal
cula
te th
erm
al tr
ansm
issi
on lo
sses
with
net
-
wor
k m
odel
Qua
ntita
tive
and
Mon
etis
edLo
sses
redu
ctio
n (M
W):
(1) I
ncre
ase
loss
es
(2) D
epen
ds o
n si
tuat
ion
(3) D
ecre
ases
loss
es
7. V
aria
tio
n in
CO
2 em
issi
on
s•
Cal
cula
te c
hang
e in
em
issi
ons
with
gen
era-
tion
disp
atch
mod
el
•C
alcu
late
redu
ctio
n in
em
issi
ons
due
to
redu
ctio
n of
ther
mal
tran
smis
sion
loss
es
with
net
wor
k m
odel
Qua
ntita
tive
and
Non
-mon
etis
ed
(alre
ady
incl
uded
in 4
)
CO2
redu
ctio
n (k
t/ye
ar):
(1) N
o p
ositi
ve e
ffec
t
(2) C
O2
redu
ctio
n <
500
kt/
year
(3) C
O2
redu
ctio
n >
500
kt/
year
8. T
ech
nic
al r
esili
ence
/ sy
stem
saf
ety
mar
gin
•Si
mul
ate
how
the
elec
tric
ity
syst
em b
ehav
es
dyna
mic
ally
with
net
wor
k m
odel
•Si
mul
atio
n is
onl
y in
put
to q
ualifi
catio
n
deci
sion
by
exp
erts
Qua
litat
ive
(KPI
s)KP
I1. A
ble
to c
omp
ly u
nder
failu
res
com
bin
ed w
ith m
ain-
tena
nce
KPI2
. Ab
le to
com
ply
with
ste
ady
stat
e cr
iteria
KPI3
. Ab
le to
com
ply
with
vol
tage
col
lap
se c
riter
ia
Scor
e of
indi
vidu
al K
PI: +
+/+
/0
Agg
rega
ted
scor
e of
all
the
KPIs
:
(1) S
core
= 0
(2) 0
< S
core
≤ 3
+
(3) S
core
> 3
+
9. R
ob
ust
nes
s/Fl
exib
ility
•Si
mul
ate
how
the
pro
ject
beh
aves
in d
iffer
-
ent s
cena
rios
•Si
mul
atio
n is
onl
y in
put
to q
ualifi
catio
n
deci
sion
by
exp
erts
Qua
litat
ive
(KPI
s)KP
I1. A
ble
to c
omp
ly w
ith a
ll ca
ses
anal
ysed
usi
ng p
rob
abil-
istic
or m
ulti-
case
ap
pro
ach
KPI3
. Ab
le to
com
ply
with
all
case
s ta
king
out
som
e of
the
fore
seen
rein
forc
emen
ts
KPI5
. Ab
ility
to fa
cilit
ate
shar
ing
of b
alan
cing
ser
vice
s on
wid
er g
eogr
aphi
cal a
reas
Scor
e of
indi
vidu
al K
PI: +
+/+
/0
Agg
rega
ted
scor
e of
all
the
KPIs
:
(1) S
core
= 0
(2) 0
< S
core
≤ 3
+
(3) S
core
> 3
+

36
Final Report – January 2013
http://think.eui.eu
Annex 2: Outline of the Regulation
Proposal for a REGULATION OF THE EUROPEAN PARLIAMENT AND OF THE COUNCIL on guidelines for transEuropean energy infrastructure and repealing Decision No 1364/2006/EC
Chapter I – General provisions
Article 1 Subject matter and scope
Article 2 Definitions
Chapter II – Project of common interest
Article 3 Identification of Project of Common Interest
Article 4 Criteria for Project of Common Interest
Article 5 Implementation and monitoring
Article 6 European coordinators
Chapter III – Permit granting and public participa-tion
Article 7 Regime of common interest
Article 8 ‘Priority status’ of Project of Common Interest
Article 9 Organisation of the permit granting process
Article 10 Transparency and public participation
Article 11 Duration and implementation of the permit granting process
Chapter IV – Regulatory treatment
Article 12 Energy system wide costbenefit analysis
Article 13 Enabling investments with crossborder impacts
Article 14 Incentives
Chapter V – Financing
Article 15 Eligibility of projects for Union financial assistance
Chapter VI – Final provisions
Article 16 Reporting and evaluation
Article 17 Information and publicity
Article 18 Transitional provisions
Article 19 Repeal
Article 20 Entry into force
Annex I – Energy infrastructure priority corri-dors and areas
Annex II – Energy infrastructure categories
Annex III – Regional identification of Project of Common Interest
Annex IV – Rules and indicators concerning cri-teria for Project of Common Interest
Annex V – Energy system-wide cost-benefit analysis
Annex VI – Guidelines for transparency and public participation

http://think.eui.eu 37
Cost Benefit Analysis in the Context of the Energy Infrastructure Package
Annex 3: Mapping costs and benefits of electricity infrastructure projects
Sources Categories of costs and ben-efits
Effects within each category
CAISO (2004) Social welfare Consumer surplusProducer surplusTSO surplus
Additional benefits Reliability benefitsBenefits from increased operational flexibilityStrategic environmental benefitsCapacity benefits of transmission upgrade
Nordel (2007) Technical costs Investment costsO&M costsEnvironmental costs
System costs Bottleneck costsLoss costsOutage costsSystem costs
Realizegrid (2010) Competitiveness Congestion reductionMarket competitiveness increase
Security of supply Reliability increaseLosses reduction
Environmental sustainability Emissions savingsRES exploitationFossil fuel costs reductionExternal costs reduction
UN (2006) Benefits for power system Avoided fuel costsAvoided generation capacity costsAvoided operation costAvoided costs for transmission system improvementsIncome from power sales
Benefits for national economy Stimulation of local economies from construction and operation of infrastructureStimulation of local economies through improved power supplyIncreased competition in electricity generationBenefits related to structure of transmission capacity
Brattle (2010)often overlooked benefits
Additional market benefits
Enhanced market competitivenessEnhanced market liquidity
Reliability/operational ben-efits
Economic value of reliability benefitsAdded operational and A/S benefitsInsurance and risk mitigation benefits
Investment and resource cost benefits
Capacity benefitsLong-term resource cost advantageSynergies with other transmission projects
External benefits Impacts on fuel marketsEnvironmental and renewable access benefitsEconomic benefits from construction and taxes
Table A2: Examples of effect mapping

38
Final Report – January 2013
http://think.eui.eu
Annex 4: Conclusions of Industrial Council Meeting (based on report version “V0”, September 2012)
Serge GalantTechnofiSubmision date: 21 September 2012
1. Background
The present annex aims at shedding light on the first round of discussions about the first draft report on « Cost benefit analysis in the context of the Energy Infrastructure Package ».
2. The issue
The issue raised by the present work deals with methodologies for cost benefit analysis of transnational investment projects required by the European Commission (DG Energy and Competition) when examining the proposals made, network operations and Member States.
3. What lacks in the first draft report: complete-
ness issues?
There are several basic items which must be included in the second version of the report:
1. The European background of the study
ACER has published a position paper1 on January 2012 (with CEER) on the regulatory issues of the energy infrastructure package.
CEER has published a position paper2 on 2010 about the evaluation of outage costs (risk components of the CBA).
The EC demands are linked with the Directives on infrastructure in preparation. Thus, the recommendations from the report should: accompany the analysis of the TYNDP results provided by ENTSOE within its legal obligations, identify the project of common interests, support crossborder cost allocation
2. The main benefits brought by CBA Analysis
There should be several types of benefits brought by CBA analysis to be performed at EC level: limit the potential influence for decisions on infrastructure investments, by focusing on network reliability or economydriven motivations, show the robustness of projects to extend scenarios and the changes (thus allowed by sensitivity analysis); cover all types of benefits beyond the ones already tested: capacity investment deferral; the creation of ancillary/balancing services; the overall network reliability (which requires valuing the cost of outages); favoring the feedback between project holders and the EC, by questioning data results and ranking of projects
3. The time dimension of CBA
Infrastructures are decided for very long (very often more than 40 years). There is a need to detail cost and benefits over time for a manageable period of time (20 years?) which makes scenario analysis plausible.
4. The CBA implementation process
Beyond the methodology itself, it must be recalled that it involves multi stakeholder opinions and people interactions. Thus the implementation process of CBA is also of major importance. Several interesting implementation options have been discussed including: the second opinion obligation in

http://think.eui.eu 39
Cost Benefit Analysis in the Context of the Energy Infrastructure Package
The Netherlands, the vote when defining and using ranking criteria
4. What is still fuzzy and must be clarified?
Clarification must lean on the above solved completeness issues and address the following issues:
1. Put the demand of the EC into a dynamic perspective at EU level where a lot of research and development has been or is being performed on CBA analysis for energy infrastructures: past EC funding, ongoing EC funding, uses by the EC for infrastructure.
2. Detail the features of the CBA recommendations which allow taking into account the above three enduses by EC (see Section 3).
3. Several methodology issues must be addressed in modeling costs and benefits: How to account for uncertainty? How to account for local environment impacts? How to account for the pricing of scarce capacity?
4. For EC applications, the following specific issues must be clearly addressed: What are the assumptions requested to make CBA analysis useful and coherent for the three enduses? What are the limits of monetization of costs and benefits? What are the underlying reasons for using or not using a multi criteria analysis? What are the most critical parameters which condition the result quality?
5. Can CBA analysis shed light on the project clustering observed when the TYNDP study is delivered by ENTSOE: How are cluster needs explained? How is the clustering performed?
5. What are the potential incoherencies in the
first draft which must be addressed?
CBA is first and foremost used to avoid the double counting on costs and benefits: it is of paramount importance for the electricity sector which has specificities when it comes to CBA. However, CBA have a time dimension over 50 years for which limitations ought to be underlined: what is the duration for which CBA for EU use can be taken?
Due to the intrinsic uncertainty of the input data for such CBA4, the proposed answers (costs and benefits) must be provided in terms of expected value, linking with the modeling of the uncertainties.
Such CBA are used to prepare ranking and decisions: what is more critical to ensure the quality of a CBA (overestimate benefits or underestimate costs)?
The difficulty of valuing benefits must be underlined (delaying generation capacity, extra benefits for increasing the reliability of the pan European system, etc…).
While reviewing the existing practices by ENTSOE, it is finally important to underline the need for the high quality data (with probably the needs for standardization): this will avoid the “Garbage In, Garbage Out” syndrome, and simplify the comparison of CBA analysis results for a cluster of projects or competing projects.

40
Final Report – January 2013
http://think.eui.eu
Annex 5: Comments from project advisors
Władysław Mielczarski Professor at Department of Engineering, University of LodzSubmission date: 6 February 2013
Scope of the Report
The project deals with the development of methodologies to support the implementation of the Energy Infrastructure package proposed by European Commission. The package contains guidelines for transEuropean energy infrastructure resulting from the agreement between the European Parliament and the Council. The Regulation requires the development of CostBenefit Analysis (CBA) methods (one for electricity, and one for gas) to facilitate the selection of Projects of Common Interest (PCI).
The evaluated report has the following structure. Chapter 1 describes the scope of the CBA discussing the PCI selection process in the context of the Regulation. The chapter also maps relevant costs and benefits, proposing a reduced list of effects. The second chapter is dedicated to the calculation of the net benefit of a project, starting from the CBA as defined in previous chapter. It indicates that the most relevant effects can be monetized and that a single discount rate should be used for all projects. In the conclusion the chapter proposes a stochastic approach to deal with uncertainties. The next chapter concentrates on project ranking based on a net benefit distribution indicating that the initial ranking of projects should be done based on the mean value of their net benefit distribution. Chapter 4 analyses the methodological implications and points out that the implementation of CBA for cost allocation can be limited in some
cases. This leads to the conclusions that ranking of projects can also be used for cost allocation.
The report provides ten main recommendations, stating that:
§ the interaction between projects must be taken into account in the project and baseline definition;
§ data consistency and quality should be ensured;
§ a conventional time horizon is 2025 years; § a CBA should concentrate on a reduced list of
effects and those should be monetized; § distributional concerns should not be
addressed in the calculation of net benefits; § infrastructure costs need to be disaggregated; § the model used to monetize the production
cost savings and gross consumer surplus needs to be explicitly stated;
§ a common discount factor should be used for all projects;
§ a stochastic approach that is consistent with the Energy Roadmap 2050 should be used to address uncertainty;
§ the ranking should be primarily based on the monetized net benefit.
Position of the advisor
The opinion of the advisor provided below is based not only on theoretical evaluation of the methods proposed but also on the practical experience when dealing with the international cross border power lines as the crucial element of the power infrastructure allowing for the development of the common European energy market. Between September 2007 and September 2011, the advisor served as European Energy Coordinator responsible for the facilitation of the development

http://think.eui.eu 41
Cost Benefit Analysis in the Context of the Energy Infrastructure Package
of cross border power lines in Northern Europe. He activities were defined by DECISION No 1364/2006/EC OF THE EUROPEAN PARLIAMENT AND OF THE COUNCIL of 6 September 2006 laying down guidelines for transEuropean energy networks. This Decision defined the nature and scope of Community action to establish guidelines for transEuropean energy networks. It establishes a series of guidelines covering the objectives, priorities and broad lines of action by the Community in respect of transEuropean energy networks. These guidelines identify projects of common interest and priority projects, including those of European interest, among transEuropean electricity and gas networks.
Former guidelines
The decision 1364 set up the criteria of the projects priority requiring that the project should meet the following criteria:
§ they shall have a significant impact on the competitive operation of the internal market;
§ they shall strengthen security of supply in the Community;
§ they shall result in an increase in the use of renewable energies.
From the list presented above is visible that criteria of infrastructure projects were very general not providing the adequate tools for the selection of the best project from a long list of priority projects.
Evaluation of the project presented
The project entitled “Cost benefit analysis in the context of the energy infrastructure package” is very welcome. It provide the precise methodologies how to evaluate the infrastructure project taking into account cost – benefit analysis. From my theoretical knowledge and
practical experience when dealing with international infrastructure project I appreciate both: theoretical tools provided and possible practical application of the project presented.
In particular I appreciate the finding that a CBA should concentrate on a reduced list of effects and those should be monetized and the model used to monetize the production cost savings and gross consumer surplus should to be explicitly stated and analyze as well as the indication that a common discount factor should be used for all projects.
I also appreciate and support the findings of the project that stochastic approach should be implemented and that it is consistent with the Energy Roadmap 2050 when addressing. It is also important to indicates that the ranking of the projects should be primarily based on the monetized net benefit.
François Lévêque Professor at Department of Economics, Mines ParisTechSubmission date: 20 January 2013
This report on costbenefit analysis (CBA, hereafter) in the context of the energy infrastructure package is especially welcome. It delivers both a didactic analysis and detailed and practical recommendations on the application of CBA to energy networks’ extension. My initial remarks have been fourfold. Firstly, the conclusions must be more clearcut and normative. Secondly, a key variable, the discount rate plays a critical role. Choosing a low or a high one can completely reversed the net difference between the costs and benefits. Investing in infrastructure is associated with upfront costs and future gains. Therefore, ceteris paribus, a new line may be beneficial

42
Final Report – January 2013
http://think.eui.eu
for society with a low discount factor while incurring a net cost if a high discount factor is chosen. Thirdly, the authors must put more emphasis on uncertainty. CBA does not result in a unique and definite number. Many parameters the costs and benefits are based on have an uncertain value (e.g., the future price of oil or the future cost of lines and breakers). Therefore, it is important not to only give the mean of the estimates but their standard deviation. Fourthly, CBA in the context of the energy infrastructure package aims at comparing different projects to know which one are the most worthwhile to undertake for society. To make this comparison possible, the proponents and supporters of the different projects should use the same hypothesis regarding external parameters such as the price of carbon or the discount rate. The report could contribute to this need for standardization. I am pleased that the final report has taken these remarks into account as well as remarks from other parties. The quality achieved in this study is impressive.

ENTSO-E answer to the consultation on “Cost Benefit Analysis in the Context of the Energy Infrastructure Package” Final - 21 December 2012
The European Network of Transmission System Operators for Electricity (ENTSO-E) is the result of the 2009 EU Third Energy Package legislation. Its mandate is to be at the forefront of the European electricity transmission system planning, developing market rules and ensuring security of supply in order to deliver Europe’s energy policy objectives. This it is reflected in the ENTSO-E deliverables, i.e. network codes - in market, operation and development area - , biennially Ten Year Network Development Plans, system adequacy outlooks.
Additionally, the new EC draft Regulation on "Guidelines for trans-European energy infrastructure" which is to be adopted in spring 2013, requests ENTSO-E to daft a Cost and Benefit Analysis methodology applicable to all projects of common interest in the electricity field. Based on the above, ENTSO-E has put forward a draft CBA methodology, which was and continues to be intensely consulted with the EC, ACER and interested stakeholders, either through bilateral meetings or workshops. Under the EC auspices the European University Institute has prepared a report currently under consultation in which it summarizes the institute’s view on the CBA, its opinion on the ENTSO-E’s methodology and recommendations of further improvements. The present document represents ENTSO-E’s answer to the European University Institute consultation of the “Cost Benefit Analysis in the Context of the Energy Infrastructure Package” document.

1. Specific comments
TOPIC THINK RECOMMENDATION ENTSO-E COMMENT
Project definition
Grouping of investments should only be allowed when strong synergies are present. Instead of an additional threshold to sort out complementary investments (as proposed in the ENTSO-E draft), an alternative way to do this could be to increase transparency within the project proposal. Thereby, the project promoter would have to justify the presence in the cluster of each individual investment. The burden of proof to ensure that complementarities are real should be on the promoter.
Since the ENTSO-E CBA will be applicable to both TYNDP and PCI project assessment, ENTSO-E recommends keeping the current clustering rule for all TYNDP projects (which have a larger scope compared to the new regulation PCIs) and further requesting the additional details (“burden of proof”) only for the candidates Projects of Common Interest.
Baseline definition
Competitive projects should not be included
in each other’s’ baseline CBA could be performed under two distinct
network baselines Both TOOT and PINT should be applied to
all candidate PCIs
ENTSO-E agrees with this comment and will improve the CBA accordingly. However, adopting both TOOT and PINT methods for the PCIs would entail doubling the number of simulations with little added value for the decision process.
Effect
mapping
In order to provide more transparency to the public and decision-makers ENTSO-E recommends to keep mapping and displaying all the relevant indicators, including the local social and environmental costs (partially internalised), RES and CO2 (fully internalised) for all the projects.
Distributional effects
If distributional effects are dealt with outside the CBA analysis, one should make sure that the implementation of the compensating measures is feasible. If they are incorporated into the CBA, this should be done by using different distributional weights for different agents, countries or zones, not by using different discount rates.
ENTSO-E agrees with the implementation of the suggested analysis, but solely at the regional level since the distributive effects are more visible and have a higher effect at that level.

Monetisation
The cost items identified by ENTSO-E could be used to enable a disaggregated cost presentation of the infrastructure projects. Costs incurred for mitigating environmental or social impact of the project should also be presented separately and included in the total project expenditure.
It also needs to be clarified whether the technical or financial life-cycle costs are entered in the CBA. In the latter case, the method used to calculate the financial life-cycle costs also needs to be specified.
Considering the stakeholders’ need ENTSO-E CBA incorporates an indicator taking into account residual effects on the environment. However, presenting separately the costs incurred for mitigating environmental or social impact of the project may be very difficult to implement. This may be considered as an additional requirement for candidate PCIs. Related to the technical life cycle costs ENTSO-E has already incorporated them in the CBA.
Monetisation- uncertainty on costs
The uncertain cost elements should be explicitly presented within the CBA (either in the monetization of investment costs or in the early deployment additional effects). It is recommended to make an as accurate as possible estimation of these cost elements, while making explicit the assumptions underlying the estimation.
Cost estimation is always uncertain for large projects, especially using new technologies and/or with lack of social acceptance. Specific estimations of assumptions for each project are not possible for all TYNDP projects, but may be requested for PCIs.
Monetisation- production costs savings, short term
The parameters required by the ENTSO-E are not sufficient to properly model short-term re-dispatch; indeed, the provision of minimum up- and down-time, ramping and start-up costs is not required by the ENTSO-E.
Due to the low impact of the short-term re-dispatch parameters on the CBA outcomes, ENTSO-E will not include in the present methodology the suggested parameters.
Monetisation- production costs savings, long term
The method used to calculate production cost savings should be explicitly explained (« ENTSO-E considers that RG should decide which effects to be included in production cost savings »), including, for instance, what are the effects captured by the model and how they are modelled. Moreover, we consider that, in case short-term effects deriving from a better balancing of generation are relevant, these benefits should be calculated and monetized, instead of being qualitatively evaluated through indicators, as proposed by ENTSO-E.
The main effects are detailed in the CBA methodology. However, ENTSO-E favours the use, when available, of several different models in order check the robustness of the obtained results. Related to the consideration of ancillary services, ENTSO-E has updated its procedure (annex 5). The annex notably explains that monetisation of ancillary services can only be carried out in certain conditions, not fulfilled for the moment in a consistent way in Europe.
Monetisation- gross consumer surplus for SoS
As security of supply is one of the most important reasons for infrastructure investment, estimating the level of value of lost load is essential to reveal the value of the infrastructure project […]. Until proper
ENTSO-E considers that VOLL should only be used if proper surveys - following the CEER guidelines - have been carried out in a consistent way all over Europe (see annex 4 of updated CBA). Otherwise, the risk of non-consistency of

valuations have been undertaken, we recommend that values of lost load are set for relevant groups and regions as part of the baseline setting and public validation process, building on existing studies and values for other countries or regions.
assessments and/or even false results is high, leading to a less credible the CBA method.
Monetisation- gross consumer surplus for demand elasticity
ENTSO-E considers that short-term demand elasticity can be disregarded, since consumers do not respond directly to real-time market prices, and so the estimation of the effect on consumers could be based on the price change considering a constant volume. » The demand elasticity could be neglected for its relative small impact on consumers’ surplus. For projects where large and consistent changes in prices are expected, it may be necessary to consider demand responses in more detail in order to capture the full benefits of the project.
ENTSO-E already considers these assumptions in the price elasticity, used in the regional groups’ assessments.
Discounting of costs and benefits
We recommend that projects be evaluated by a common, EU-wide discount factor, agreed upon through an open consultation process. The value of the discount factor should be based on the conditions for financing of such projects. In cases in which financing costs are expected to differ substantially between projects, and where this is considered relevant for the evaluation and ranking of projects, discount factors should differ correspondingly.
ENTSO-E considers that the choice of assumptions on discount rate should be left to the regional groups (one single rate per region, except the case of high intra-regional discrepancies).
Uncertainty If a stochastic approach would be taken, it would not be necessary to distinguish scenarios and cases as proposed by ENTSO-E, as all scenarios are randomly generated by selecting the value of each parameter according to the predefined range and the probability distribution. We recommend that a sensitivity analysis to identify critical parameters be undertaken. In addition, we recommend that the distribution of net benefit be characterised and quantified by some form of stochastic analysis
ENTSO-E distinguishes between macro-economic scenarios (which cannot be probabilistic because of lack of data), and planning scenarios (which may indeed be randomly generated). ENTSO-E considers that a stochastic approach is not possible for the macro-economic scenarios, and that ranges of values provide more reliable information to the stakeholders. Sensitivity analysis is recommended by ENTSO-E. The extent of and the share of these stochastic analysis are left to regional groups.

Ranking
Ranking implies comparing single values. The mean value of CBA should be used to establish the initial ranking.
ENTSO-E considers that ranking may be carried out on the basis of a multi-criteria approach, leaving room for bottom-up identification with an innovative governance approach, and for different priorities from one regional group to another.
Ranking – adjustment for uncertainty
There is no scientific basis for deciding how to do this, and so adjustments of the initial ranking due to uncertainty will have to be at the discretion of the European Commission. However, in to order make this trade off, it is necessary that the risk or uncertainty of projects is quantified.
In this sense ENTSO-E suggests a flexibility indicator with a scoring on how the project behaves across several scenarios.
Ranking – adjustment for non-monetised effects
Whenever there are project specific effects that are significant enough to impact on the overall rank of the project, these should be monetized and included into the CBA net benefit calculation. The monetary value of the effect is determined by some ad hoc procedure and reported in sufficient detail that it is possible to evaluate the analysis.
ENTSO-E considers that ad hoc monetisation processes are not robust enough. ENTSO-E suggests a multi-criteria approach quantifying additional indicators in a consistent way, when this is possible. Otherwise the quantification may be achieved through a common scoring system. Both of the methods deliver consistent and robust information to the stakeholders and decision-makers.
Ranking – adjustment for distributional effects
Considering that the relevant distributional concerns have been addressed by the quotas defined for the elaboration of the list of Projects of Common Interest, additional adjustments would not be necessary
ENTSO-E agrees.
Ranking – adjustment for baseline
If the TOOT approach is used to calculate net benefit, there is no need for an ex-post evaluation, since the negative interactions have already been taken into account.
ENTSO-E agrees.
Cost allocation
The use of CBA for cost allocation does not bring additional complication on CBA as this level of detail is already required in the baseline definition. The only requirement would be that the output shall be disaggregated per TSO area
The impact of any project in a meshed network normally reaches across a large number of member states. A rigid use of the split of CBA per Member State implies that every TSO within a meshed network could potentially get involved in the cost allocation process. This increase of participants in the process would complicate rather than simplify the negotiations associated with a project and could lead to significant delay

in its delivery. Moreover, one should pay attention to the identified risks of double accounting; to the higher volatility of results with regard to changes in assumptions and to second-order effects (tax policies, ownership of generators and consumers).

http://think.eui.eu 49
Cost Benefit Analysis in the Context of the Energy Infrastructure Package
Authors
Nils-Henrik M. von der Fehr
NilsHenrik M. von der Fehr is Professor of Economics and Head of Department at the Department of Economics at the University of Oslo, Norway. He holds a PhD in Economics from the University of Oslo. Professor von der Fehr specialises in auctions, industrial economics, energy and environmental economics, regulation and antitrust and has published extensively in these fields. He has wide experience as Consultant and Advisor to governments, organisations and private companies around the world, including Australia, Brazil, Colombia, Denmark, Guatemala,
Honduras, Iceland, Italy, The Netherlands, New Zealand, Norway, Sweden and the UK, as well as for international organisations like the European Commission, InterAmerican Development Bank and the World Bank. He was a member of the Dutch Electricity Market Surveillance Committee and has been a member and/or chaired a number of government commissions in his native Norway.
Leonardo Meeus
Leonardo Meeus is parttime Professor at the European University Institute in Florence, Italy, and Professor of Energy Markets at the Vlerick Business School in Brussels, Belgium. He is also a Visiting Professor at the KU Leuven. Leonardo is a Commercial Engineer with a PhD in Electrical Engineering, both from the KU Leuven. During his PhD, he was involved in setting up the first international electricity market on the European continent. He also studied electricity highways,
which led him to Ireland to work for a project developer. By working with the relevant authorities in Ireland and the UK, he gained expertise in infrastructure regulation. In 2008, he then joined the Florence School of Regulation at the European University Institute. In Florence, he broadened his knowledge on regulatory issues, and led a team of researchers that advised the European Commission (DG ENER) on diverse energy policy topics (FP7 project THINK). Since 2012, he combines his position at the Vlerick Business School with the Florence School of Regulation.
Isabel Azevedo
Isabel Azevedo is Research Assistant at the Florence School of Regulation. Isabel has obtained an degree in Physics / Applied Mathematics (Astronomy) at the University of Porto, in Portugal. She has also spent one year of her studies at Lund University, in Sweden, under the Erasmus program. She has done postgraduation studies on sustainable development and energy systems, both at the New University of Lisbon and at the University of Porto. Isabel completed the Sustainable Energy
Systems Advanced Studies course, within the MIT Portugal program, also at the University of Porto. In 2010, she worked in the Faculty of Engineering from the University of Porto as a research assistant. Isabel joined the Florence School of Regulation in January 2011.
Xian He
Xian He is Research Assistant at the Florence School of Regulation. She holds an MSc in Economics and Management of Network Industries from University of Pontificia Comillas of Madrid, Spain, and from University of Paris Sud XI, France, where she studied in the Erasmus Mundus Master program during 20062008. Xian did her PhD research on Electric Energy Storage between 20082011 in the framework of collaboration between University of Paris Sud XI and EDF R&D, where she also worked as a PhD engineer. She defended her thesis on “Designing the Market for Bulk
Electric Energy Storage: Theoretical Perspectives and Empirical Analysis” in September 2011. Xian joined the Florence School of Regulation in October 2011. She holds a PhD in Economics from University Paris Sud XI.

50
Final Report – January 2013
http://think.eui.eu
Luis Olmos
Comillas University, Spain. Luis currently is a senior researcher in the regulation and modeling areas of the Institute for Research in Technology at the same university, where he has worked on more than thirty research and consultancy projects for main electric and gas utilities and public entities like the European Commission. He has also been a research fellow at the Florence School of Regulation of the European University Institute, where he has advised the European Commission
on energy technology policy issues (FP7 program project THINK). Luis’ main research interests include the regulation and modeling of the electricity transmission activity, the integration of renewable generation and the development and deployment of clean technologies. He has written more than 20 research articles in international peerreviewed journals and book chapters.
Jean-Michel Glachant
JeanMichel Glachant is Director of the Florence School of Regulation and Holder of the Loyola de Palacio Chair at the European University Institute, Florence. He is Professor in Economics and holds a PhD from La Sorbonne University, Paris. JeanMichel Glachant is Member of the EURussia Gas Advisory Council of Commissioner Oettinger (EC), he is or has been Advisor to DG TREN, DG COMP, DG RESEARCH and DG ENERGY of the European Commission and
Coordinator/Scientific Advisor of several European research projects like THINK, SESSA, CESSA, Reliance, EUDEEP, RefGov, TradeWind, Secure and Optimate. He is member of the Advisory Board of the EPrice project and Research Partner of CEEPR, (MIT, USA), EPRG (Cambridge University, UK), and ChiefEditor of the EEEP: Economics of Energy & Environmental Policy, a new journal of the International Association for Energy Economics.

http://think.eui.eu 51
Cost Benefit Analysis in the Context of the Energy Infrastructure Package
THINK Published Reports
THINK Mid-term Booklet (June 2010 – January 2012)
THINK half-way and beyondA booklet gathering all the research results of the first three semesters of the THINK project
ISBN: 9789290840633, doi: 10.2870/32466 (paper)ISBN: 9789290840640, doi: 10.2870/32569 (pdf)
THINK Reports
Topic 1 · Public Support for the Financing of RD&D Activities in New Clean Energy Technologies Luis Olmos, David Newbery, Sophia Ruester, Siok Jen Liong and JeanMichel Glachant
ISBN: 9789290840657, doi: 10.2870/33575 (paper)ISBN: 9789290840664, doi: 10.2870/34121 (pdf)
Topic 2 · Smart Cities: Fostering a Quick Transition Towards Local Sustainable Energy SystemsLeonardo Meeus, Eduardo de Oliviera Fernandes, Vitor Leal, Isabel Azevedo, Erik Delarue and JeanMichel Glachant
ISBN: 9789290840671, doi: 10.2870/34173 (paper)ISBN: 9789290840688, doi: 10.2870/34539 (pdf)
Topic 3 · Transition Towards a Low Carbon Energy System by 2050: What Role for the EU?Leonardo Meeus, Manfred Hafner, Isabel Azevedo, Claudio Marcantonini and JeanMichel Glachant
ISBN: 9789290840695, doi: 10.2870/34986 (paper)ISBN: 9789290840701, doi: 10.2870/35290 (pdf)
Topic 4 · The Impact of Climate and Energy Policies on the Public Budget of EU Member StatesLuis Olmos, Pippo Ranci, Maria Grazia Pazienza, Sophia Ruester, Martina Sartori, Marzio Galeotti and JeanMichel Glachant
ISBN: 9789290840718, doi: 10.2870/35311 (paper)ISBN: 9789290840725, doi: 10.2870/35351 (pdf)

52
Final Report – January 2013
http://think.eui.eu
Topic 5 · Offshore Grids: Towards a Least Regret EU PolicyLeonardo Meeus, François Lévêque, Isabel Azevedo, Marcelo Saguan and JeanMichel Glachant
ISBN: 9789290840732, doi: 10.2870/35425 (paper)ISBN: 9789290840749, doi: 10.2870/35516 (pdf)
Topic 6 · EU Involvement in Electricity and Natural Gas Transmission Grid TarificationSophia Ruester, Christian von Hirschhausen, Claudio Marcantonini, Xian He, Jonas Egerer and JeanMichel Glachant
ISBN: 9789290840756, doi: 10.2870/35561 (paper)ISBN: 9789290840763, doi: 10.2870/35676 (pdf)
Topic 7 · How to Refurbish All Buildings by 2050Leonardo Meeus, Péter Kaderják, Isabel Azevedo, Péter Kotek, Zsuzsanna Pató, László Szabó, JeanMichel Glachant
ISBN: 9789290840848, doi: 10.2870/4119 (paper)ISBN: 9789290840855, doi: 10.2870/41596 (pdf)
Topic 8 · Electricity Storage: How to Facilitate its Deployment and Operation in the EUSophia Ruester, Jorge Vasconcelos, Xian He, Eshien Chong, JeanMichel Glachant
ISBN: 9789290840862, doi: 10.2870/41627 (paper)ISBN: 9789290840879, doi: 10.2870/41846 (pdf)
Download all Reports and the related Policy Briefs from the THINK website or find them in the EU Bookshop http://bookshop.europa.eu/

http://think.eui.eu 53
Cost Benefit Analysis in the Context of the Energy Infrastructure Package
THINKTHINK is a project funded by the 7th Framework Programme. It provides knowledge support to policy making by the European Commission in the context of the Strategic Energy Technology Plan. The project is organized around a multidisciplinary group of 23 experts from 14 countries covering five dimensions of energy policy: science and technology, market and network economics, regulation, law, and policy implementation. Each semester, the permanent research team based in Florence works on two reports, going through the quality process of the THINK Tank. This includes an Expert Hearing to test the robustness of the work, a discussion meeting with the Scientific Council of the THINK Tank, and a Public Consultation to test the public acceptance of different policy options by involving the broader community.
EC project officers: Sven Dammann and Norela Constantinescu (DG ENER; C2: Head of Unit Magdalena Andrea Strachinescu Olteanu)Project coordination: JeanMichel Glachant and Leonardo MeeusSteering board: Ronnie Belmans, William D’haeseleer, JeanMichel Glachant, Ignacio PérezArriagaAdvisory board: Chaired by Pippo Ranci
Coordinating Institution
European University Institute Robert Schuman Centre for Advanced StudiesFlorence School of Regulation
Partner Institutions
KU LeuvenBelgium
Comillas University MadridSpain
TechnofiFrance
Fondazione Eni Enrico MatteiItaly
Technical University of BerlinGermany
Inst. of Communication and Computer Systems - Greece
Ecole Polytechnique Fédérale Lausanne - Switzerland
Potsdam Institute for Climate Impact Research - Germany
University of PortoPortugal
University of BocconiItaly
Becker Büttner HeldGermany/Belgium
Lund University Sweden
University of BudapestHungary
University of OsloNorway
Ricerca sul Sistema Elettrico SpAItaly
Technical University of LodzPoland
54
Final Report – January 2013
http://think.eui.eu
Contact
THINKAdvising the EC (DG ENERGY) on Energy Policyhttp://think.eui.eu
FSR coordinator: [email protected] School of Regulation
RSCAS – European University InstituteVilla MalafrascaVia Boccaccio 15150133 FirenzeItaly

HOW TO OBTAIN EU PUBLICATIONSFree publications:• viaEUBookshop(http://bookshop.europa.eu)• attheEuropeanUnion’srepresentationsanddelegations.Youcanobtaintheircontact
detailsontheInternet(http://ec.europa.eu)orbysendingafaxto+3522929-42758Priced publications:• viaEUBookshop(http://bookshop.europa.eu)
Priced subscriptions (e.g. annual series of the Official Journal of the European Union and reports of cases before the Court of Justice of the European Union):• viaoneofthesalesagentsofthePublicationsOfficeoftheEuropeanUnion
(http://publications.europa.eu/others/agents/index_en.htm)

QM
-31-
12-3
04-E
N-N
doi: 10.2870/60065