Embed Size (px)
DESCRIPTION
Southeast vs Southwest vs North-Central vs 17th Ave SE vs... the numbers don't look good for the transit-starved southeast.
Citation preview

TT2013-0290 ATTACHMENT
TT2013-0290 Investing in Mobility: Transit Corridor Cost/Bene�t Analysis - Att.pdf ISC: Unrestricted
Page 1 of 10
Summary of Cost-Bene�t Analysis for 10-year Rapid Transit Corridors
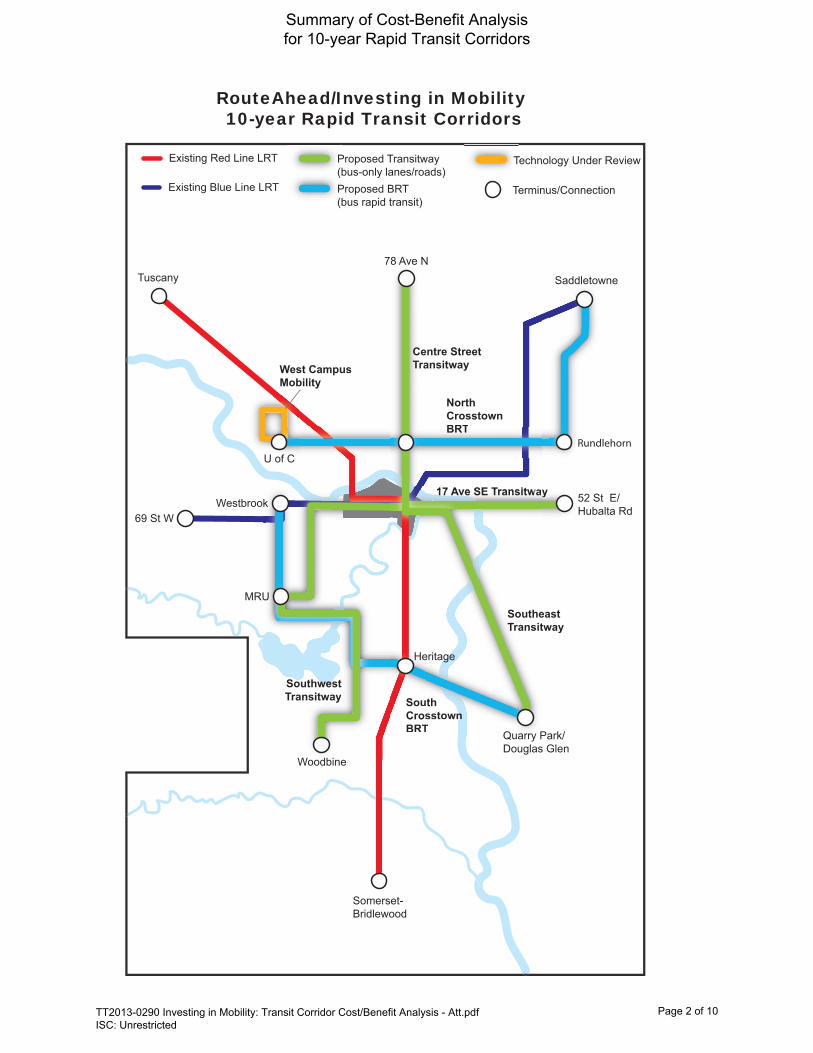
RouteAhead/Investing in Mobility 10-year Rapid Transit Corridors
Terminus/Connection
Existing Red Line LRT
Proposed BRT(bus rapid transit)
Proposed Transitway (bus-only lanes/roads)
Technology Under Review
Existing Blue Line LRT
South Crosstown BRT
SouthwestTransitway
NorthCrosstownBRT
17 Ave SE Transitwayy
uth SousstownnCro
TTBRTBRT
NorthCrosstownBRTBRT
wa17 Ave SE Transitwwa17 Ave SE Transitw17 Ave
Centre StreetTransitway
Southeast Transitway
Tuscany Saddletowne
U of C
69 St WWestbrook
MRU
Heritage
Somerset-Bridlewood
Quarry Park/Douglas Glen
West CampusMobility
Woodbine
52 St E/Hubalta Rd
Rundlehorn
78 Ave N
TT2013-0290 Investing in Mobility: Transit Corridor Cost/Benefit Analysis - Att.pdf ISC: Unrestricted
Page 2 of 10
Summary of Cost-Benefit Analysis for 10-year Rapid Transit Corridors
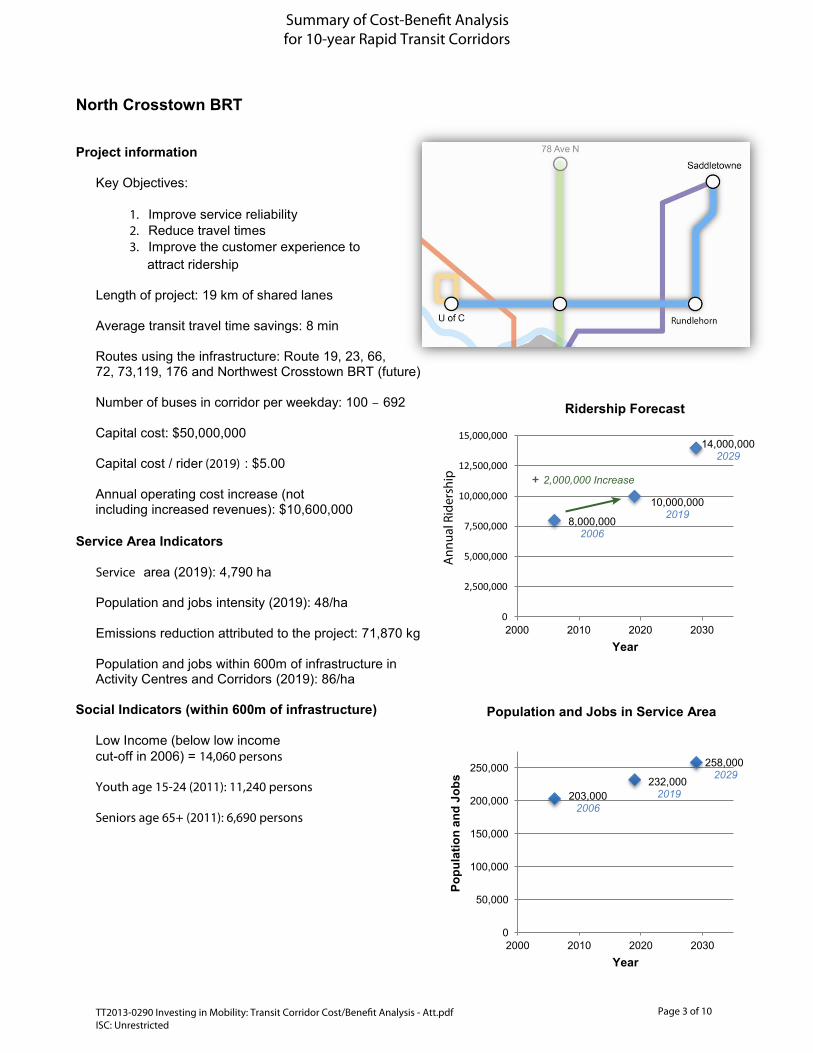
North Crosstown BRT
Project information
Key Objectives:
1. Improve service reliability 2. Reduce travel times 3. Improve the customer experience to
attract ridership
Length of project: 19 km of shared lanes Average transit travel time savings: 8 min Routes using the infrastructure: Route 19, 23, 66, 72, 73,119, 176 and Northwest Crosstown BRT (future) Number of buses in corridor per weekday: 100 – 692 Capital cost: $50,000,000 Capital cost / rider (2019) : $5.00 Annual operating cost increase (not including increased revenues): $10,600,000
Service Area Indicators Service area (2019): 4,790 ha Population and jobs intensity (2019): 48/ha Emissions reduction attributed to the project: 71,870 kg Population and jobs within 600m of infrastructure in Activity Centres and Corridors (2019): 86/ha
Social Indicators (within 600m of infrastructure)
Low Income (below low income cut-off in 2006) = 14,060 persons
Youth age 15-24 (2011): 11,240 persons
Seniors age 65+ (2011): 6,690 persons
8,000,000 2006
2,000,000 Increase
10,000,000 2019
14,000,000 2029
0
2,500,000
5,000,000
7,500,000
10,000,000
12,500,000
15,000,000
2000 2010 2020 2030
Ann
ual R
ider
ship
Year
Ridership Forecast
203,000 2006
232,000 2019
258,000 2029
0
50,000
100,000
150,000
200,000
250,000
2000 2010 2020 2030
Popu
latio
n an
d Jo
bs
Year
Population and Jobs in Service Area
TT2013-0290 Investing in Mobility: Transit Corridor Cost/Bene�t Analysis - Att.pdf ISC: Unrestricted
Page 3 of 10
Summary of Cost-Bene�t Analysis for 10-year Rapid Transit Corridors

Centre Street Transitway
Project information Key Objectives:
1. Increase capacity to handle high passenger volumes 2. Encourage transit oriented development 3. Improve service reliability
Length of project: 9 km (78 Ave N to 9 Ave S) Average transit travel time savings: 6 min Routes using the infrastructure: Route 2, 3, 17, 300 BRT, 30 BRT and the North Central Express Routes Number of buses in corridor per weekday: 966 – 1304 Capital cost: $120,000,000 Capital cost / rider (2019) : $11.43 Annual operating cost increase (not including increased revenues): $925,000
Service Area Indicators Service area (2019): 4,180 ha (excluding downtown: 3,600 ha) Population and jobs intensity (2019): 87/ha (excluding downtown: 41/ha) Emissions reduction attributed to the project: 75,470 kg Population and jobs within 600m of infrastructure in Activity Centres and Corridors (2019, excluding downtown): 62/ha
Social Indicators (within 600m of infrastructure) Low Income (below low income cut-o� in 2006) = 13,960 persons
Youth age 15-24 (2011): 7,370 persons
Seniors age 65+ (2011): 6,900 persons
8,400,000 2006
10,500,000 2019
14,000,000 2029
0
2,500,000
5,000,000
7,500,000
10,000,000
12,500,000
15,000,000
2000 2010 2020 2030
Ann
ual R
ider
ship
Year
Ridership Forecast
125,000 2006
148,000 2019
152,000 2029
0
50,000
100,000
150,000
200,000
250,000
2000 2010 2020 2030
Popu
latio
n an
d Jo
bs
Year
Population and Jobs in Service Area (excluding downtown)
TT2013-0290 Investing in Mobility: Transit Corridor Cost/Bene�t Analysis - Att.pdf ISC: Unrestricted
Page 4 of 10
Summary of Cost-Bene�t Analysis for 10-year Rapid Transit Corridors
2,100,000 Increase

17 Avenue SE Transitway
Project information
Key Objectives:
1. Reduce travel times2. Encourage transit oriented development3. Improve the customer experience to attract
ridership
Length of project: 3 km from 52 Street/Hubalta Road to 26 Street SE(8 km from 52 Street/Hubalta Road to Macleod Trail SE)
Average transit travel time savings: 3 min
Routes using the infrastructure: Routes 1, 126, 440305 BRT
Number of buses in corridor per weekday: 296 – 520
Capital cost: $98,000,000
Capital cost / rider (2019) : $42.61
Annual operating cost increase (not including increased revenues): $600,000
Service Area Indicators
Service area (2019): 3,460 ha (excluding downtown: 2,890 ha)
Population and jobs intensity (2019): 86/ha(excluding downtown: 29/ha)
Emissions reduction attributed to the project: 16,530 kg
Population and jobs within 600m of infrastructure in Activity Centres and Corridors (2019, excluding downtown): 69/ha
Social Indicators (within 600m of infrastructure)
Low Income (below low income cut-off in 2006) = 12,220 persons
Youth age 15-24 (2011): 5,600 persons
Seniors age 65+ (2011): 5,210 persons
1,800,0002006
2,300,0002019
3,000,0002029
0
2,500,000
5,000,000
7,500,000
10,000,000
12,500,000
15,000,000
2000 2010 2020 2030
Ann
ual R
ider
ship
Year
Ridership Forecast
76,000 2006
83,000 2019
85,000 2029
0
50,000
100,000
150,000
200,000
250,000
2000 2010 2020 2030
Popu
latio
n an
d Jo
bs
Year
Population and Jobs in Service Area
TT2013-0290 Investing in Mobility: Transit Corridor ISC: Unrestricted
Page 5 of 10
for 10-year Rapid Transit Corridors
(Excluding Downtown)
500,000 Increase

Southeast Transitway
Project information Key Objectives:
1. Reduce travel times 2. Encourage transit oriented development 3. Improve the customer experience to attract ridership
Length of project: 16 km (4 St SE to Douglas Glen Station) Average transit travel time savings: 13 min Routes using the infrastructure: Route 24, 302 BRT, Southeast Express Routes Number of buses in corridor per weekday: 240 – 540 Capital cost: $642,000,000 Capital cost / rider (2019) : $109 Annual operating cost increase (not including increased revenues): $5,200,000 Service Area Indicators Service area (2019): 9,760 ha (excluding downtown: 9,180 ha) Population and jobs intensity (2019): 44/ha (excluding downtown: 23/ha) Emissions reduction attributed to the project: 42,400 kg Population and jobs within 600m of infrastructure in Activity Centres and Corridors (2019, excluding downtown): 29/ha
Social Indicators (within 600m of infrastructure) Low Income (below low incomecut-o� in 2006) = 9,290 persons
Youth age 15-24 (2011): 7,600 persons
Seniors age 65+ (2011): 4,450 persons
4,700,000 2006
5,900,000 2019
7,600,000 2029
0
2,500,000
5,000,000
7,500,000
10,000,000
12,500,000
15,000,000
2000 2010 2020 2030
Ann
ual R
ider
ship
Year
Ridership Forecast
118,000 2006
213,000 2019
238,000 2029
0
50,000
100,000
150,000
200,000
250,000
2000 2010 2020 2030
Popu
latio
n an
d Jo
bs
Year
Population and Jobs in Service Area (excluding downtown)
TT2013-0290 Investing in Mobility: Transit Corridor Cost/Bene�t Analysis - Att.pdf ISC: Unrestricted
Page 6 of 10
Summary of Cost-Bene�t Analysis for 10-year Rapid Transit Corridors
1,200,000 Increase
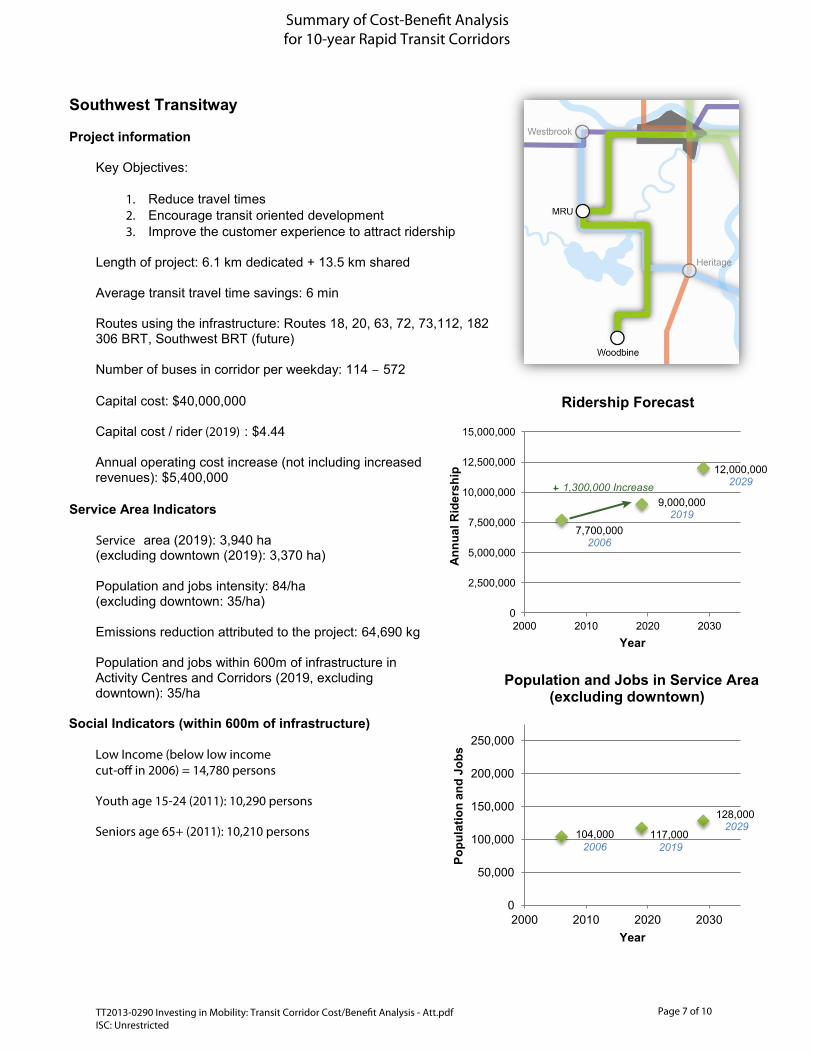
Southwest Transitway
Project information Key Objectives:
1. Reduce travel times 2. Encourage transit oriented development 3. Improve the customer experience to attract ridership
Length of project: 6.1 km dedicated + 13.5 km shared Average transit travel time savings: 6 min Routes using the infrastructure: Routes 18, 20, 63, 72, 73,112, 182 306 BRT, Southwest BRT (future) Number of buses in corridor per weekday: 114 – 572 Capital cost: $40,000,000 Capital cost / rider (2019) : $4.44 Annual operating cost increase (not including increased revenues): $5,400,000
Service Area Indicators Service area (2019): 3,940 ha (excluding downtown (2019): 3,370 ha) Population and jobs intensity: 84/ha (excluding downtown: 35/ha) Emissions reduction attributed to the project: 64,690 kg Population and jobs within 600m of infrastructure in Activity Centres and Corridors (2019, excluding downtown): 35/ha
Social Indicators (within 600m of infrastructure) Low Income (below low incomecut-o� in 2006) = 14,780 persons
Youth age 15-24 (2011): 10,290 persons
Seniors age 65+ (2011): 10,210 persons
7,700,000 2006
9,000,000 2019
12,000,000 2029
0
2,500,000
5,000,000
7,500,000
10,000,000
12,500,000
15,000,000
2000 2010 2020 2030
Ann
ual R
ider
ship
Year
Ridership Forecast
104,000 2006
117,000 2019
128,000 2029
0
50,000
100,000
150,000
200,000
250,000
2000 2010 2020 2030
Popu
latio
n an
d Jo
bs
Year
Population and Jobs in Service Area (excluding downtown)
TT2013-0290 Investing in Mobility: Transit Corridor Cost/Bene�t Analysis - Att.pdf ISC: Unrestricted
Page 7 of 10
Summary of Cost-Bene�t Analysis for 10-year Rapid Transit Corridors
1,300,000 Increase

South Crosstown BRT
Project information Key Objectives:
1. Reduce travel times 2. Encourage transit oriented development 3. Improve the customer experience to attract
ridership
Length of project: 17.6 km of shared lanes Average transit travel time savings: 8 min Routes using the infrastructure: Routes 20, 23, 36, 41, 72, 73, 136, 306 BRT Number of buses in corridor per weekday: 0 – 538 Capital cost: $20,000,000 Capital cost / rider (2019) : $2.86 Annual operating cost increase (not including increased revenues): $1,500,000 500,000 Increase
Service Area Indicators Service Area (2019): 4,440 ha Population and jobs intensity (2019): 32/ha Emissions reduction attributed to the project: 50,310 kg Population and jobs within 600m of infrastructure in Activity Centres and Corridors (2019): 60/ha
Social Indicators (within 600m of infrastructure) Low Income (below low income cut-o� in 2006) = 6,280 persons
Youth age 15-24 (2011): 6,850 persons
Seniors age 65+ (2011): 6,520 persons
5,300,000 2006
7,000,000 2019
9,000,000 2029
0
2,500,000
5,000,000
7,500,000
10,000,000
12,500,000
15,000,000
2000 2010 2020 2030
Ann
ual R
ider
ship
Year
Ridership Forecast
109,000 2006
140,000 2019
160,000 2029
0
50,000
100,000
150,000
200,000
250,000
2000 2010 2020 2030
Popu
latio
n an
d Jo
bs
Year
Population and Jobs in Service Area
TT2013-0290 Investing in Mobility: Transit Corridor Cost/Bene�t Analysis - Att.pdf ISC: Unrestricted
Page 8 of 10
Summary of Cost-Bene�t Analysis for 10-year Rapid Transit Corridors
1,700,000 Increase

West Campus Mobility Project
Project information
Key Objectives:
1. Reduce travel times2. Encourage transit oriented development3. Improve the customer experience to attract
ridership
Length of project: 5 km
Average transit travel time savings: 9 min
Routes using the infrastructure: 9, 72, 73, 91
Number of buses in corridor per weekday: 0 -1140
Capital cost: $30,000,000
Capital cost / rider (2019) : $21.43
Annual operating cost increase (not including increased revenues): $2,000,000
Service Area Indicators
Service area (2019): 810 ha
Population and jobs intensity (2019): 61/ha
Emissions reduction attributed to the project: 10,060 kg
Population and jobs within 600m of infrastructure in Activity Centres and Corridors (2019): 83/ha
Social Indicators (within 600m of infrastructure)
Low Income (below low incomecut-off in 2006) = 2,110 persons
Youth age 15-24 (2011): 3,280 persons
Seniors age 65+ (2011): 1,140 persons
1,200,0002006
1,400,0002019
2,000,0002029
0
2,500,000
5,000,000
7,500,000
10,000,000
12,500,000
15,000,000
2000 2010 2020 2030
Ann
ual R
ider
ship
Year
Ridership Forecast
41,000 2006
49,000 2019
60,000 2029
0
50,000
100,000
150,000
200,000
250,000
2000 2010 2020 2030
Popu
latio
n an
d Jo
bs
Year
Population and Jobs in Service Area
TT2013-0290 Investing in Mobility: Transit Corridor Cost/Bene�t Analysis - Att.pdf ISC: Unrestricted
Page 9 of 10
Summary of Cost-Bene�t Analysis for 10-year Rapid Transit Corridors
200,000 Increase

Scoring Summary and Evaluation of Costs and Benefits
Criteria Description of assessment of benefit scoring
Cen
tre
Stre
et
Tran
sitw
ay
Sout
hwes
t Tr
ansi
tway
Sout
h C
ross
tow
n B
RT
17 A
venu
e SE
Tr
ansi
tway
Nor
th
Cro
ssto
wn
BR
T
Sout
heas
t Tr
ansi
tway
Wes
t C
ampu
s M
obili
ty
1 Operating & Capital Cost Value
Operating cost per rider divided by capital cost per rider.
$0.09/ $11.43
$0.60/ $4.44
$0.21/ $2.86
$0.26/ $42.61
$1.06/ $5.00
$0.88/ $108.81
$1.43/ $21.43
3 3 3 2 2 1 1
2
Transit Travel Time Savings
Estimated time saved on each trip divided by capital cost per rider.
6 min/ $11.43
8 min/ $4.44
8 min/ $2.86
3 min/ $42.61
8 min/ $5.00
13 min/ $108.81
9 min/ $21.43
1 2 3 1 2 1 1
3
Auto Travel Time Savings
Estimated time saved on each auto trip divided by capital cost per rider.
No significant change to peak period auto travel times due to latent demand in peak period in forecasts.
1 1 1 1 1 1 1
4 Transit ServiceArea
2019 population and jobs per hectare divided by capital cost per rider.
87/ $11.43
84/ $4.44
32/ $2.86
86/ $42.61
48/ $5.00
44/ $108.81
61/ $21.43
2 3 2 1 2 1 1
5
Support for TOD Develop-ment
2019 population and jobs per hectare in Activity Centres and Corridors divided by capital cost per rider.
264/ $11.43
287/ $4.44
61/ $2.86
315/ $42.61
86/ $5.00
310/ $108.81
84/ $21.43
2 3 2 1 1 1 1
6
Support for Asset Manage-ment
Cost of programmed or anticipated 10-year lifecycle improvements divided by capital cost per rider.
$25 million $0 $0 $12
million $0 $0 $0
3 1 1 3 1 1 1
7 Environ-mental Benefit
Total emissions reduction in kg attributed to the improvements.
75,500 64,700 50,300 16,500 71,900 42,400 10,100
3 2 2 1 2 1 1
8 Socio-Economic Benefit
Number of youth, seniors and low income per hectare.
20.4 14.5 7.9 19.0 12.4 11.4 10.1
3 2 1 3 1 1 1
Total Score 18 17 15 13 12 8 8
TT2013-0290 Investing in Mobility: Transit Corridor Cost/Benefit Analysis - Att.pdf ISC: Unrestricted
Page 10 of 10
Summary of Cost-Benefit Analysis for 10-year Rapid Transit Corridors