Embed Size (px)
Citation preview
Cost and Coverage Differences For California’s Workers’ Compensation Benefits:A Comparison of Benefits and Qualification Criteria For California And Selected
States
Presented At:The Western Risk & Insurance Association Meeting
January 2002San Diego
by Patricia Cheshier, Ph.D.California State University, Sacramento
2
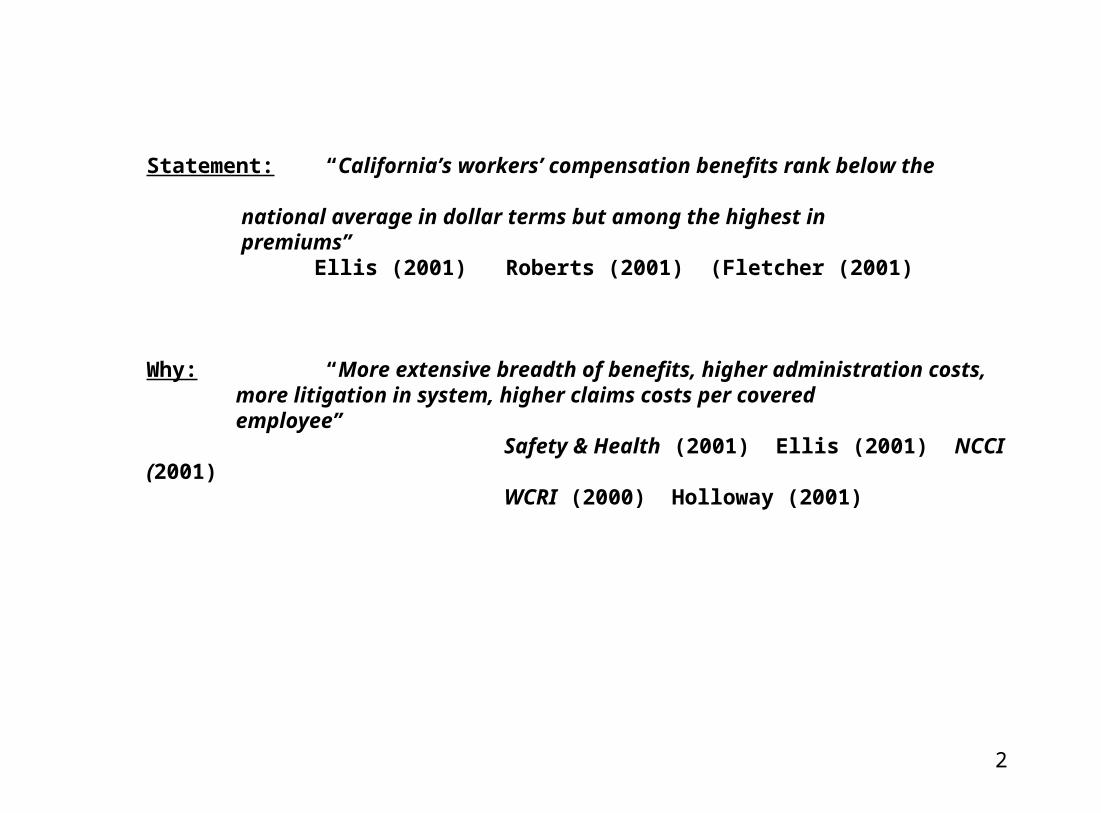
Statement: “California’s workers’ compensation benefits rank below the national average in dollar terms but among the highest in premiums” Ellis (2001) Roberts (2001) (Fletcher (2001)
Why: “More extensive breadth of benefits, higher administration costs, more litigation in system, higher claims costs per covered employee” Safety & Health (2001) Ellis (2001) NCCI (2001) WCRI (2000) Holloway (2001)
3
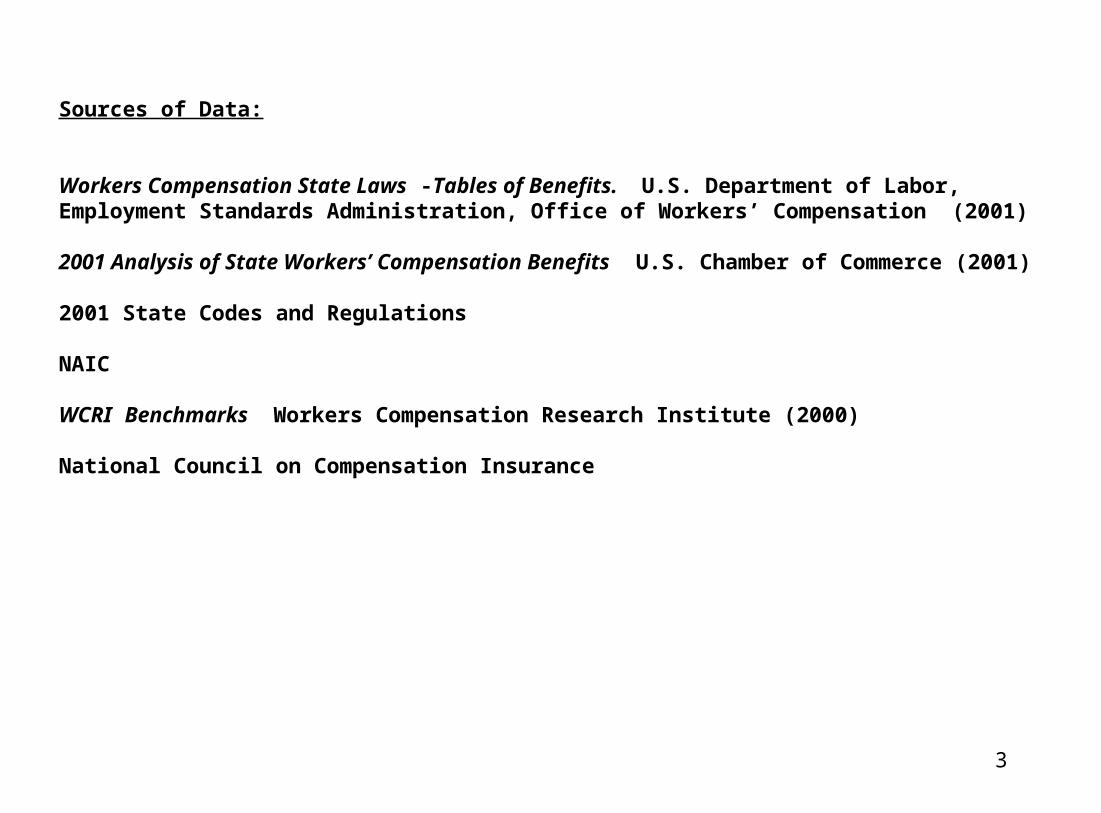
Sources of Data:
Workers Compensation State Laws -Tables of Benefits. U.S. Department of Labor, Employment Standards Administration, Office of Workers’ Compensation (2001)
2001 Analysis of State Workers’ Compensation Benefits U.S. Chamber of Commerce (2001)
2001 State Codes and Regulations
NAIC
WCRI Benchmarks Workers Compensation Research Institute (2000)
National Council on Compensation Insurance
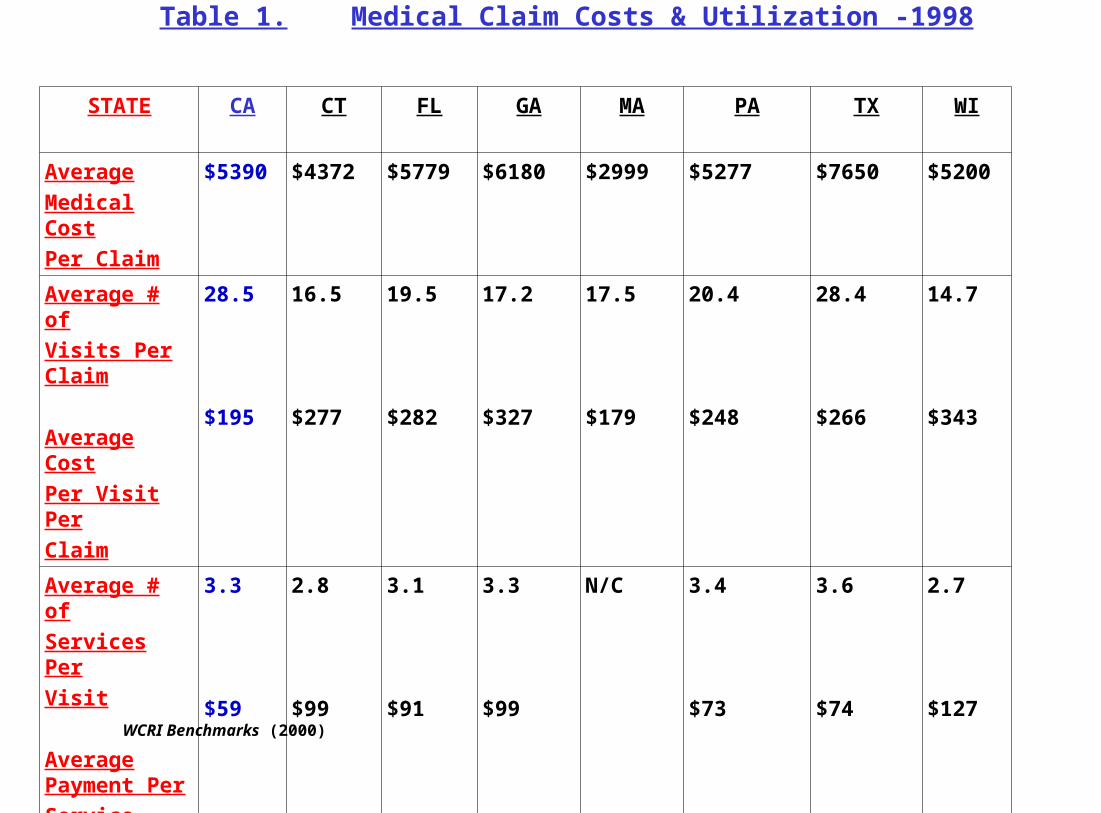
STATE CA CT FL GA MA PA TX WI
AverageMedical CostPer Claim
$5390 $4372 $5779 $6180 $2999 $5277 $7650 $5200
Average # ofVisits Per Claim
Average CostPer Visit PerClaim
28.5
$195
16.5
$277
19.5
$282
17.2
$327
17.5
$179
20.4
$248
28.4
$266
14.7
$343
Average # ofServices PerVisit
Average Payment PerService
3.3
$59
2.8
$99
3.1
$91
3.3
$99
N/C 3.4
$73
3.6
$74
2.7
$127
Table 1. Medical Claim Costs & Utilization -1998
WCRI Benchmarks (2000)
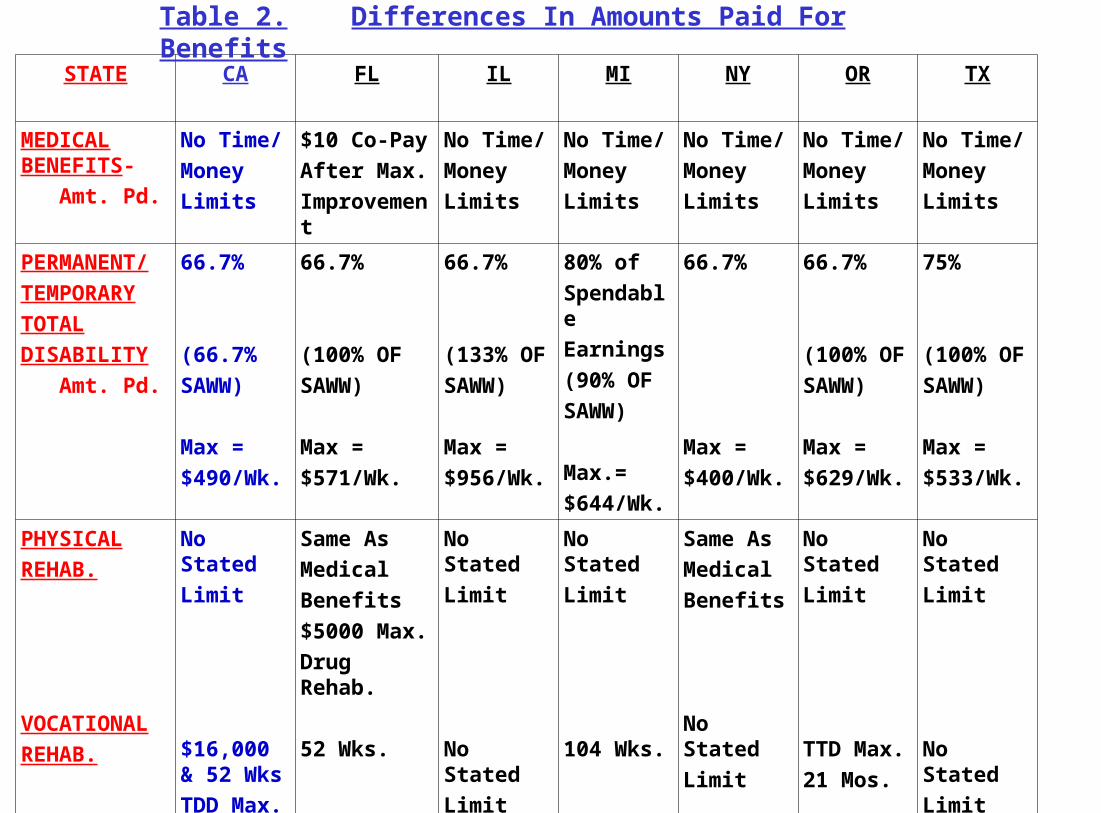
STATE CA FL IL MI NY OR TX
MEDICAL BENEFITS- Amt. Pd.
No Time/MoneyLimits
$10 Co-Pay After Max.Improvement
No Time/ MoneyLimits
No Time/Money Limits
No Time/ Money Limits
No Time/ Money Limits
No Time/MoneyLimits
PERMANENT/TEMPORARYTOTALDISABILITY Amt. Pd.
66.7%
(66.7%SAWW)
Max =$490/Wk.
66.7%
(100% OFSAWW)
Max =$571/Wk.
66.7%
(133% OFSAWW)
Max =$956/Wk.
80% ofSpendableEarnings(90% OFSAWW)
Max.=$644/Wk.
66.7%
Max =$400/Wk.
66.7%
(100% OFSAWW)
Max =$629/Wk.
75%
(100% OFSAWW)
Max =$533/Wk.
PHYSICALREHAB.
VOCATIONALREHAB.
No StatedLimit
$16,000 & 52 WksTDD Max.
Same AsMedicalBenefits$5000 Max.Drug Rehab.
52 Wks.
No StatedLimit
No StatedLimit
No StatedLimit
104 Wks.
Same AsMedicalBenefits
No StatedLimit
No StatedLimit
TTD Max.21 Mos.
No StatedLimit
No StatedLimit
Table 2. Differences In Amounts Paid For Benefits
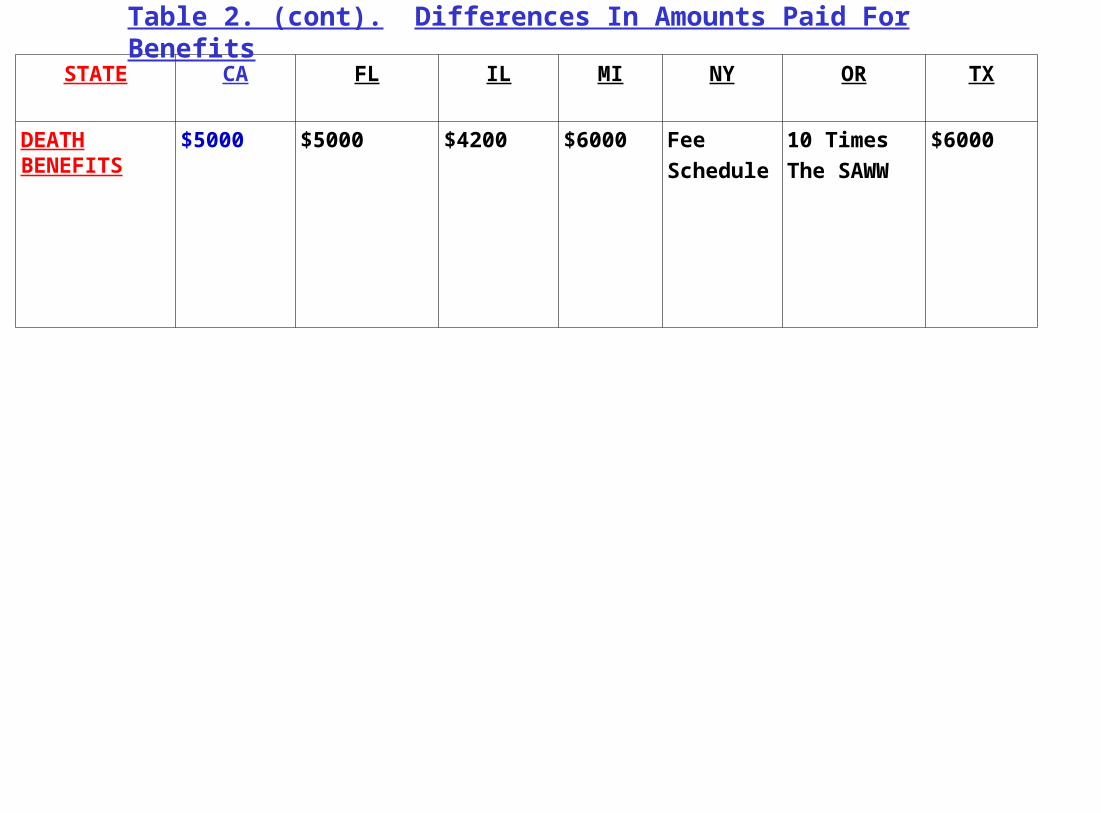
STATE CA FL IL MI NY OR TX
DEATH BENEFITS
$5000 $5000 $4200 $6000 Fee Schedule
10 Times The SAWW
$6000
Table 2. (cont). Differences In Amounts Paid For Benefits
Differences In State Statutes That May Affect Qualifying For
Workers’ Compensation Benefits
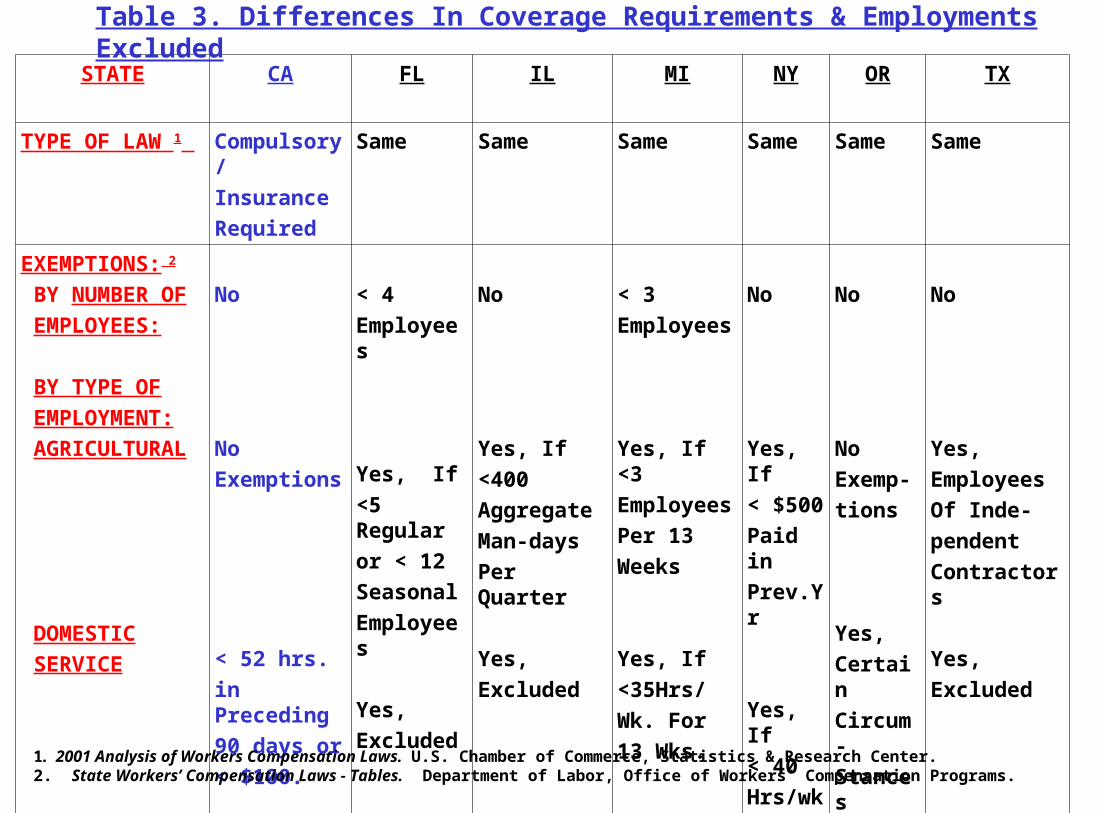
STATE CA FL IL MI NY OR TX
TYPE OF LAW 1 Compulsory/ InsuranceRequired
Same Same Same Same Same Same
EXEMPTIONS: 2
BY NUMBER OF EMPLOYEES:
BY TYPE OF EMPLOYMENT: AGRICULTURAL
DOMESTIC SERVICE
No
No Exemptions
< 52 hrs.in Preceding 90 days or< $100.
< 4Employees
Yes, If<5 Regularor < 12SeasonalEmployees
Yes, Excluded
No
Yes, If<400AggregateMan-daysPer Quarter
Yes, Excluded
< 3 Employees
Yes, If <3EmployeesPer 13Weeks
Yes, If <35Hrs/Wk. For13 Wks.
No
Yes, If< $500Paid inPrev.Yr
Yes, If< 40Hrs/wk
No
NoExemp-tions
Yes, CertainCircum-Stances
No
Yes, EmployeesOf Inde-pendentContractors
Yes, Excluded
1. 2001 Analysis of Workers Compensation Laws. U.S. Chamber of Commerce, Statistics & Research Center.2. State Workers’ Compensation Laws - Tables. Department of Labor, Office of Workers’ Compensation Programs.
Table 3. Differences In Coverage Requirements & Employments Excluded
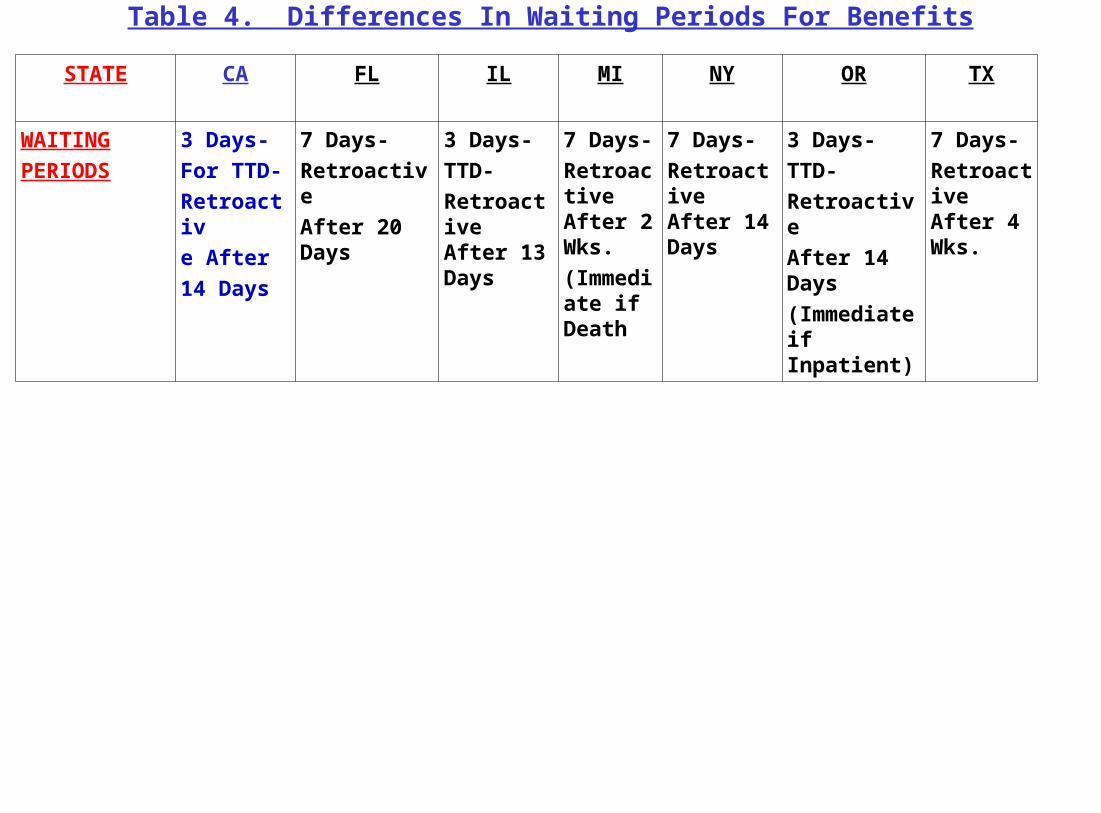
STATE CA FL IL MI NY OR TX
WAITINGPERIODS
3 Days-For TTD-Retroactive After14 Days
7 Days-RetroactiveAfter 20 Days
3 Days-TTD-Retroactive After 13 Days
7 Days-Retroactive After 2 Wks.(Immediate if Death
7 Days-Retroactive After 14 Days
3 Days-TTD-RetroactiveAfter 14 Days (Immediate if Inpatient)
7 Days-Retroactive After 4 Wks.
Table 4. Differences In Waiting Periods For Benefits
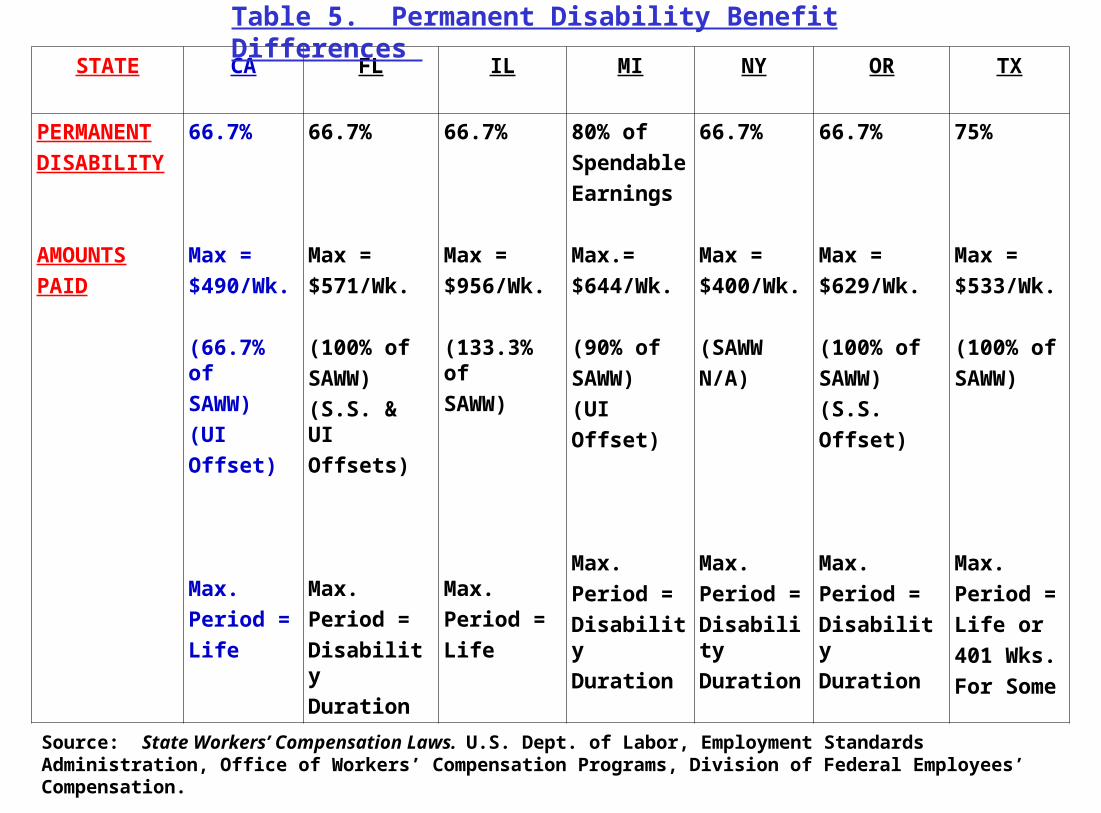
STATE CA FL IL MI NY OR TX
PERMANENTDISABILITY
AMOUNTSPAID
66.7%
Max =$490/Wk.
(66.7% ofSAWW)(UI Offset)
Max.Period =Life
66.7%
Max =$571/Wk.
(100% ofSAWW)(S.S. & UIOffsets)
Max.Period =DisabilityDuration
66.7%
Max =$956/Wk.
(133.3% ofSAWW)
Max.Period =Life
80% ofSpendableEarnings
Max.=$644/Wk.
(90% ofSAWW)(UI Offset)
Max.Period =DisabilityDuration
66.7%
Max =$400/Wk.
(SAWWN/A)
Max.Period =DisabilityDuration
66.7%
Max =$629/Wk.
(100% ofSAWW)(S.S.Offset)
Max.Period =DisabilityDuration
75%
Max =$533/Wk.
(100% ofSAWW)
Max.Period =Life or401 Wks.For Some
Table 5. Permanent Disability Benefit Differences
Source: State Workers’ Compensation Laws. U.S. Dept. of Labor, Employment Standards Administration, Office of Workers’ Compensation Programs, Division of Federal Employees’ Compensation.
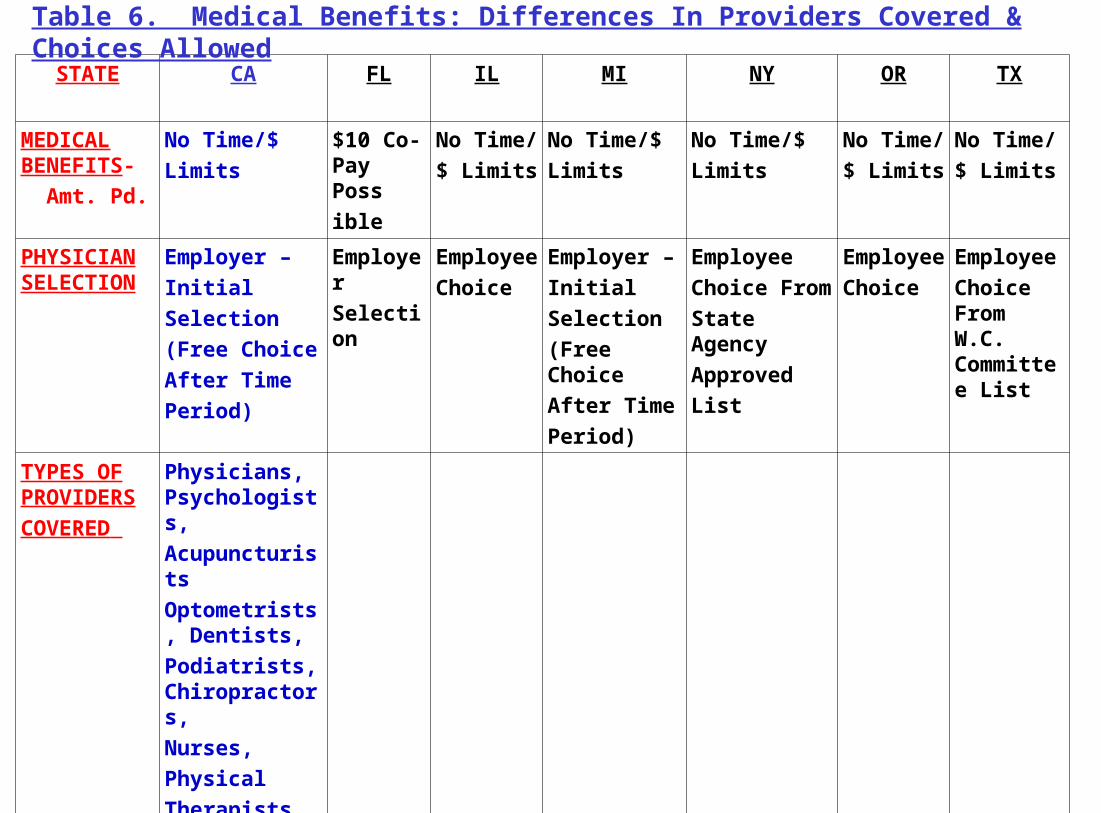
STATE CA FL IL MI NY OR TX
MEDICAL BENEFITS- Amt. Pd.
No Time/$Limits
$10 Co-Pay Possible
No Time/$ Limits
No Time/$Limits
No Time/$Limits
No Time/$ Limits
No Time/$ Limits
PHYSICIAN SELECTION
Employer –Initial Selection(Free ChoiceAfter TimePeriod)
EmployerSelection
EmployeeChoice
Employer –Initial Selection(Free ChoiceAfter TimePeriod)
EmployeeChoice FromState AgencyApprovedList
EmployeeChoice
EmployeeChoice From W.C. Committee List
TYPES OF PROVIDERSCOVERED
Physicians, Psychologists, Acupuncturists Optometrists, Dentists, Podiatrists, Chiropractors, Nurses,PhysicalTherapists,MFC’s, CSW’s
Table 6. Medical Benefits: Differences In Providers Covered & Choices Allowed
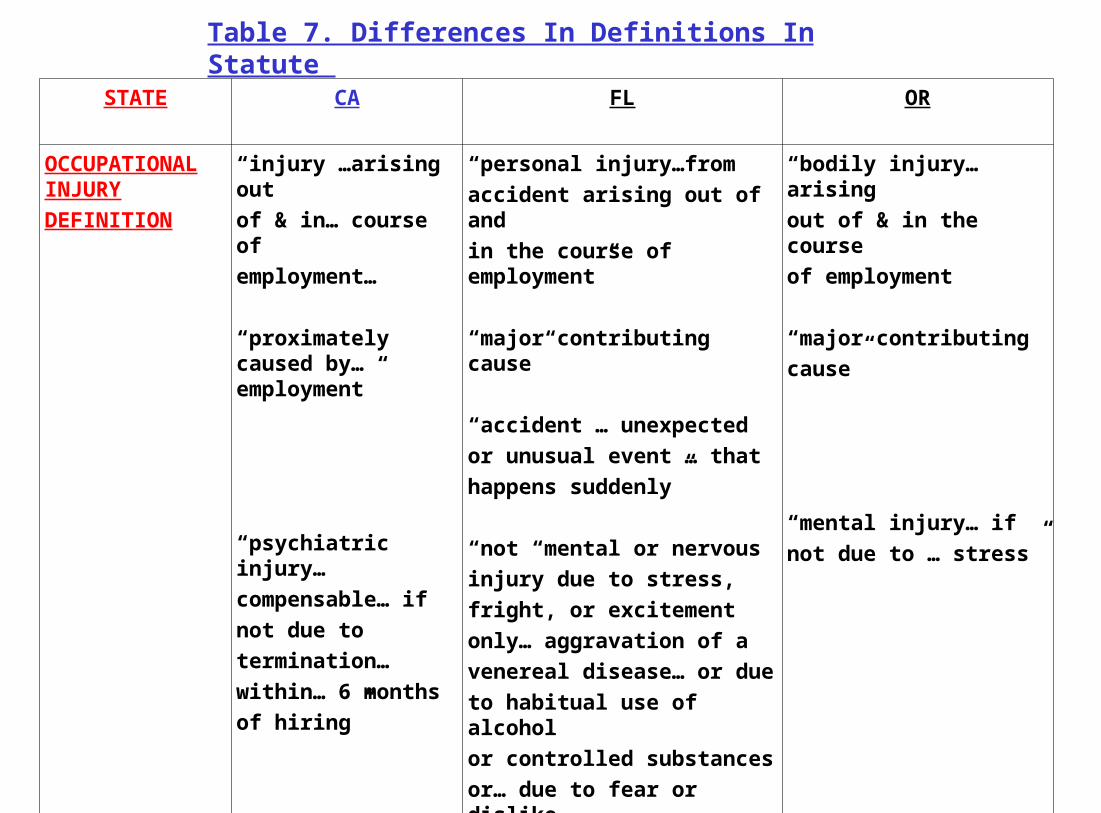
STATE CA FL OR
OCCUPATIONAL INJURYDEFINITION
“injury …arising outof & in… course ofemployment…
“proximately caused by… employment”
“psychiatric injury… compensable… ifnot due totermination…within… 6 monthsof hiring”
“personal injury…fromaccident arising out of andin the course of employment”
“major contributing cause”
“accident … unexpectedor unusual event … thathappens suddenly”
“not “mental or nervousinjury due to stress,fright, or excitementonly… aggravation of avenereal disease… or dueto habitual use of alcoholor controlled substancesor… due to fear or dislikefor an individual becauseof race, color, ….”
“bodily injury… arisingout of & in the courseof employment
“major contributingcause”
“mental injury… ifnot due to … stress”
Table 7. Differences In Definitions In Statute
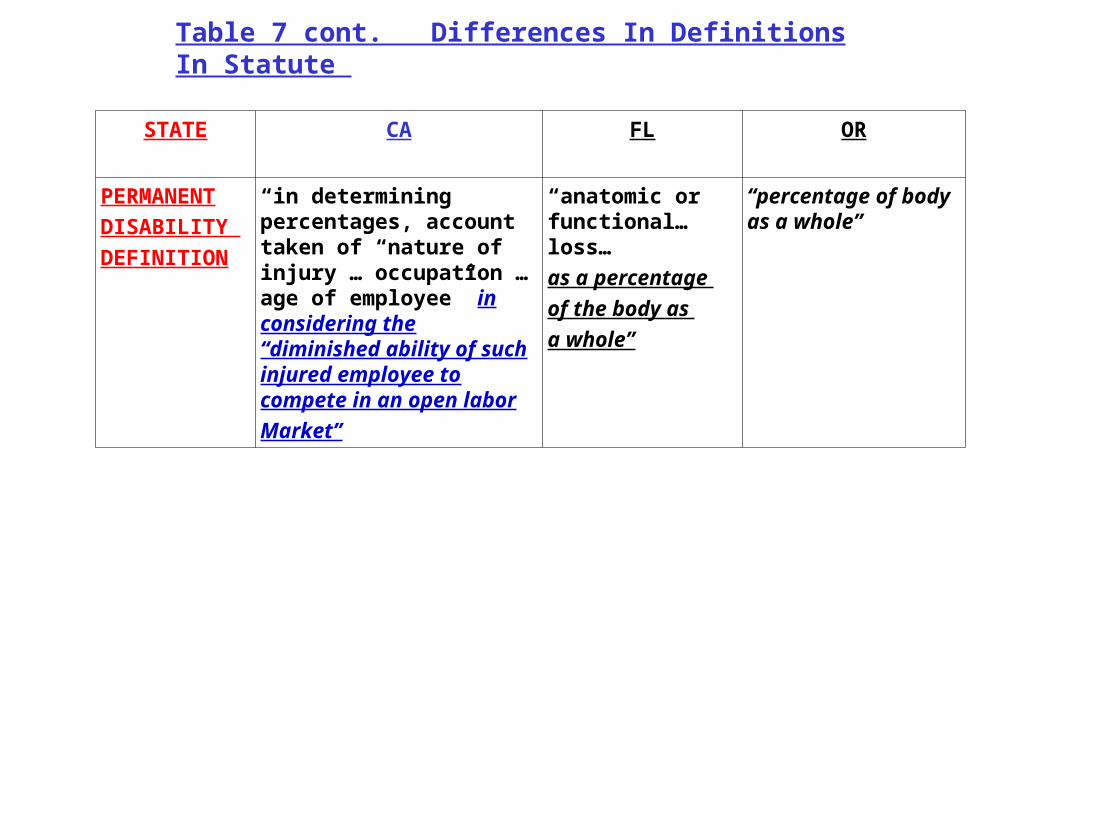
STATE CA FL OR
PERMANENTDISABILITY DEFINITION
“in determining percentages, account taken of “nature of injury … occupation … age of employee” in considering the “diminished ability of such injured employee to compete in an open laborMarket”
“anatomic or functional…loss…as a percentage of the body as a whole”
“percentage of body as a whole”
Table 7 cont. Differences In Definitions In Statute
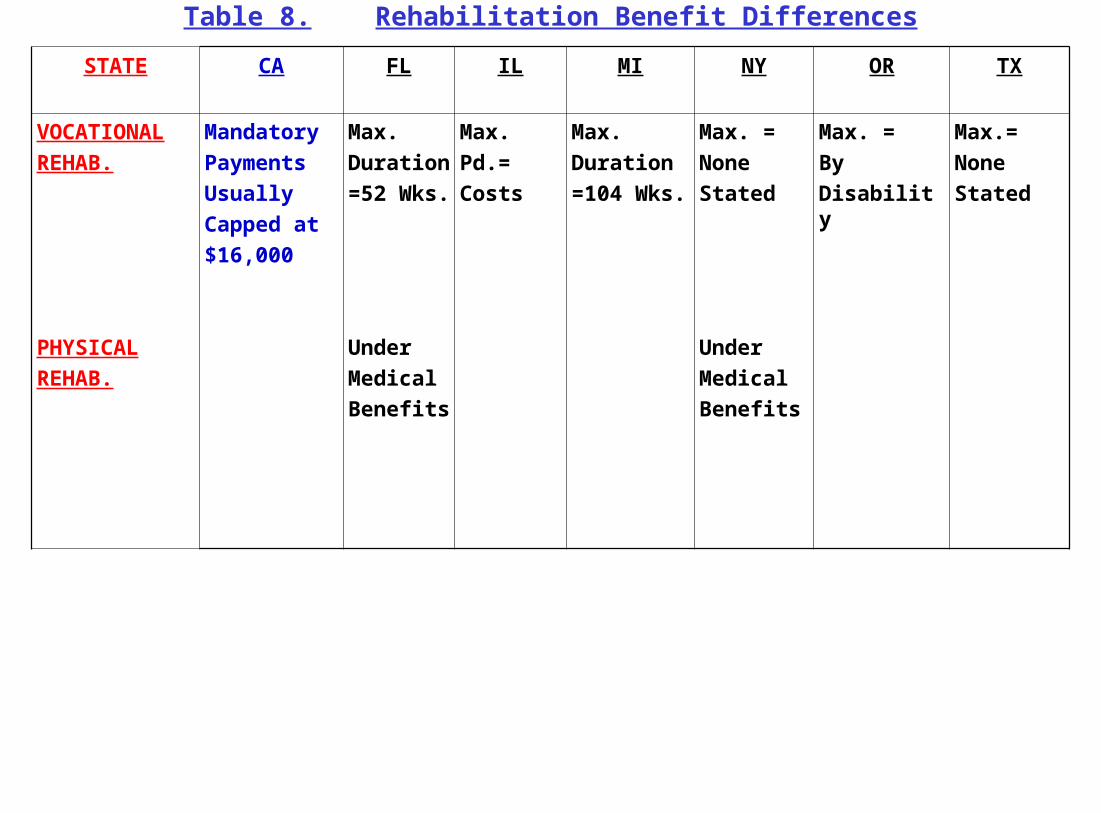
STATE CA FL IL MI NY OR TX
VOCATIONALREHAB.
PHYSICALREHAB.
MandatoryPaymentsUsuallyCapped at$16,000
Max.Duration=52 Wks.
UnderMedicalBenefits
Max.Pd.=Costs
Max. Duration=104 Wks.
Max. =NoneStated
UnderMedicalBenefits
Max. =By Disability
Max.=NoneStated
Table 8. Rehabilitation Benefit Differences
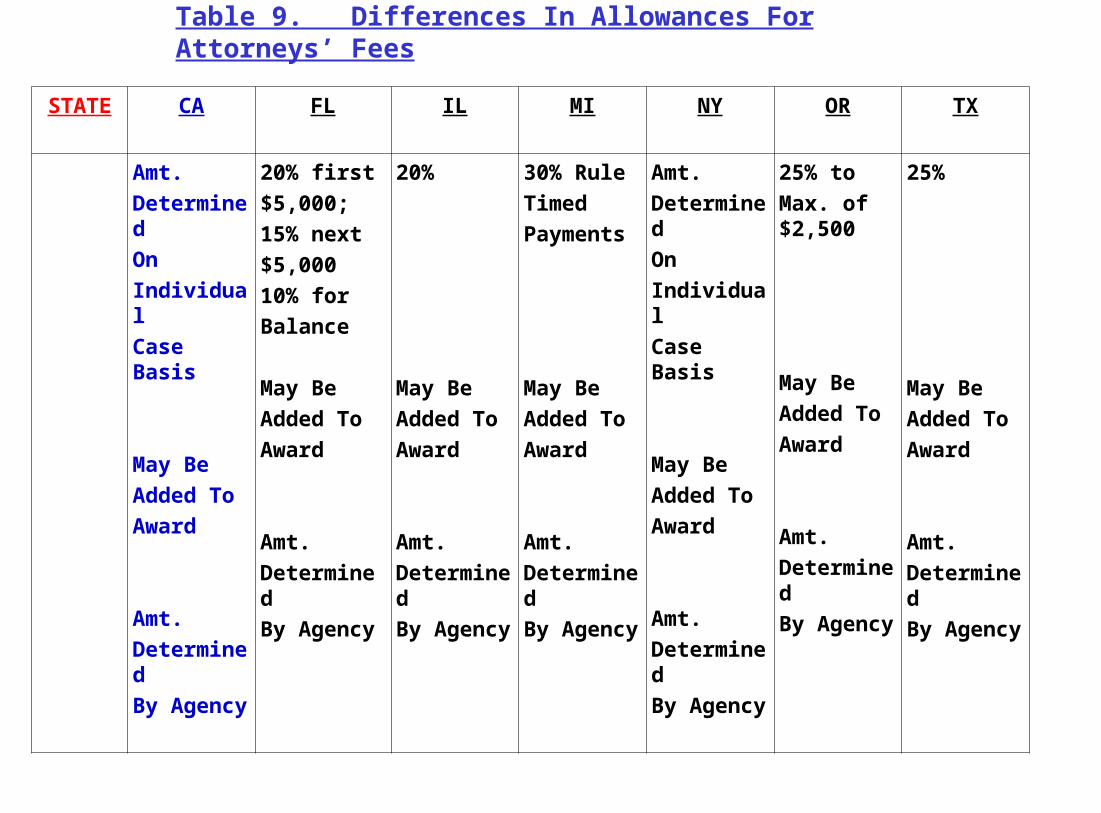
STATE CA FL IL MI NY OR TX
Amt. DeterminedOnIndividualCase Basis
May BeAdded ToAward
Amt.DeterminedBy Agency
20% first$5,000;15% next$5,00010% forBalance
May BeAdded ToAward
Amt.DeterminedBy Agency
20%
May BeAdded ToAward
Amt.DeterminedBy Agency
30% RuleTimedPayments
May BeAdded ToAward
Amt.DeterminedBy Agency
Amt. DeterminedOnIndividualCase Basis
May BeAdded ToAward
Amt.DeterminedBy Agency
25% toMax. of $2,500
May BeAdded ToAward
Amt.DeterminedBy Agency
25%
May BeAdded ToAward
Amt.DeterminedBy Agency
Table 9. Differences In Allowances For Attorneys’ Fees
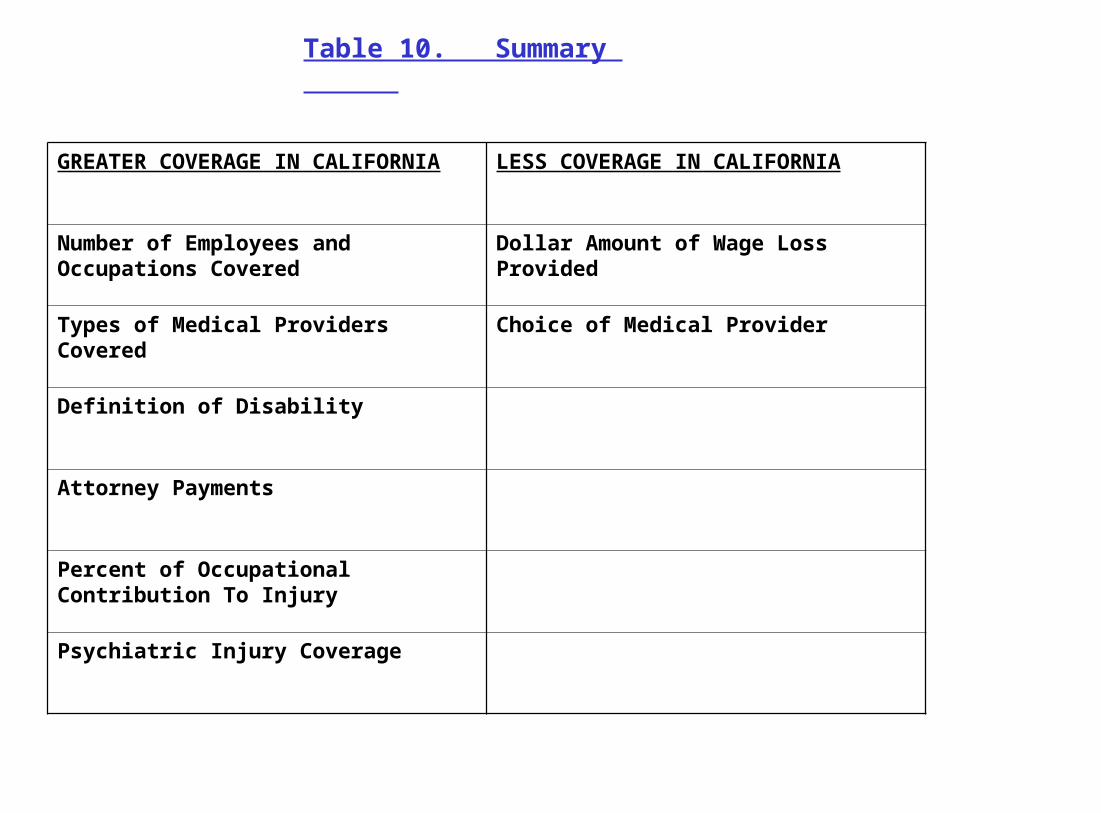
Table 10. Summary
GREATER COVERAGE IN CALIFORNIA
LESS COVERAGE IN CALIFORNIA
Number of Employees and Occupations Covered
Dollar Amount of Wage Loss Provided
Types of Medical Providers Covered
Choice of Medical Provider
Definition of Disability
Attorney Payments
Percent of Occupational Contribution To Injury
Psychiatric Injury Coverage