Embed Size (px)
Citation preview
COST AND BENEFIT ANALYSIS OF PROPOSED CHANGES FOR ENERGY EFFICIENCY IN
HOUSING AND SMALL BUILDING IN THE NATIONAL BUILDING CODE
REPORT PREPARED FOR FRANK LOHMANN, SENIOR TECHNICAL ADVISOR
CANADIAN CODES CENTRE INSTITUTE FOR RESEARCH IN CONSTRUCTION NATIONAL RESEARCH COUNCIL OF CANADA
BY GARY PROSKIW, P. Eng.
PROSKIW ENGINEERING Ltd.
November 30, 2011
1
COST AND BENEFIT ANALYSIS OF PROPOSED CHANGES FOR ENERGY EFFICIENCY IN
HOUSING AND SMALL BUILDING IN THE NATIONAL BUILDING CODE
SECTION 1
INTRODUCTION 1.1 INTRODUCTION This report provides a summary of the cost analysis and benefit analysis carried out for the proposed changes to the National Building Code of Canada (NBCC) for Section 9.36. These proposed changes include detailed specifications for thermal insulation levels, glazing requirements, airtightness and mechanical system performance and represent the first inclusion of designated energy efficiency requirements in the NBCC. To reflect the wide variations in climate which exist across Canada, the proposed Section 9.36. defines six climate zones with specific energy efficiency requirements tailored for each zone. The objective of the analysis described in this report was to estimate a) the incremental construction costs of the proposed changes and b) the energy savings which these changes would produce for a typical, Canadian new home. 1.2 BENEFIT ANALYSIS During development of Section 9.36., a validation analysis was carried out to determine the energy performance of a group of representative house designs which complied with the proposed requirements (Proskiw, 2011). Eleven different house designs were used for the analysis. One of these, House #4, was selected for use in the cost and benefit analysis described in this report. This house was judged as the most representative of the 11 designs and was used to estimate the energy savings and associated benefits of the various proposed measures. Therefore, using House #4 as a representative archetype for the cost and benefit analysis, the annual energy consumption was estimated using an initial set of Base Case conditions (for RSI values, mechanical system efficiencies, etc.) and assuming the house was constructed in each of the six climate zones identified in Section 9.36. The construction specifications for the Base Case house were established using information from a builder survey of current construction practice in the year 2009 in various regions across Canada (Canadian Codes Centre, 2011). It must be noted that the proposed energy efficiency requirements are unique for each of the six climate zones, but that the Base Case house remained relatively similar across all climate zones (see "Base Case Assumptions" below). As noted above, House #4 was used for the cost and benefit analysis. This house was selected because its annual energy consumption and general performance were judged as the most representative of the 11 Archetypes. As a check, comparisons of the annual energy savings were also prepared for two other houses (#1 and #7) in two zones (Zone #5 and Zone #7a). This
2
found that the savings in Zone #5 for the two other houses were somewhat greater than for House #4 while in Zone 7a, the savings were quite consistent with those of House #4. Given the normal variation in performance which occurs between houses, these variations were judged as reasonable. Additional information on the representativeness of House #4 is in Appendix A. Energy modelling was performed using HOT2000, version 10.51 using the same basic protocols employed for the Final Validation. After the Base Case performance had been established, each of the individual energy efficiency measures described in the proposed Section 9.36. was applied, as applicable, to the Base Case house and the impact on energy consumption calculated. In all cases, except as noted, the measure was applied to the Base Case house in isolation, without any other measures applied so that just the impact of the measure in question could be assessed. The difference between the Base Case energy consumption and the measure-applied energy consumption represented the energy benefit of the measure. Energy consumption was expressed in kilowatt-hours per year, equivalent (kWhe/yr) regardless of the energy sources used in the house. The energy consumption was then multiplied by a blended, national energy rate, for all energy sources, of 6 ₵/kWhe to arrive at an annual benefit expressed in dollars. This rate, which was developed from a survey of Canadian energy utilities, was used for all locations (Kidd, 2011). The proposed Section 9.36. establishes separate thermal insulation requirements for a) houses equipped with Heat Recovery Ventilators (HRV's) and b) houses not equipped with HRV's. Generally, houses with HRV's are permitted to have slightly reduced insulation requirements for the building envelope. Consequently, many of the results in this report are shown separately for houses with and without HRV's. 1.3 COST ANALYSIS To perform the cost analysis, a series of unit construction costs were developed for each of the energy efficiency measures specified in the proposed Section 9.36. For building envelope measures, these were expressed as the cost per unit area of envelope to which the measure was applied (e.g. cost per square metre of exterior wall). Mechanical system measures were typically expressed as a unit cost per item (e.g. dollars per furnace). These unit costs were developed by Hanscomb Consultants and used Ottawa as the reference city (Hanscomb, 2011). Costs were developed based on the incremental change required for a measure. For example, improvements to attic insulation levels were calculated based on the cost of the proposed measure minus the cost for the Base Case condition. Hanscomb then applied a series of location modifiers to the Ottawa data to describe the variation in construction costs for the six locations used in the cost analysis. These modifiers ranged from 1.00 in Toronto and Montreal to 1.38 in Yellowknife. Also note that in Zone 7b, Edmonton was used for the cost analysis while Fort McMurray was used for the energy analysis
3
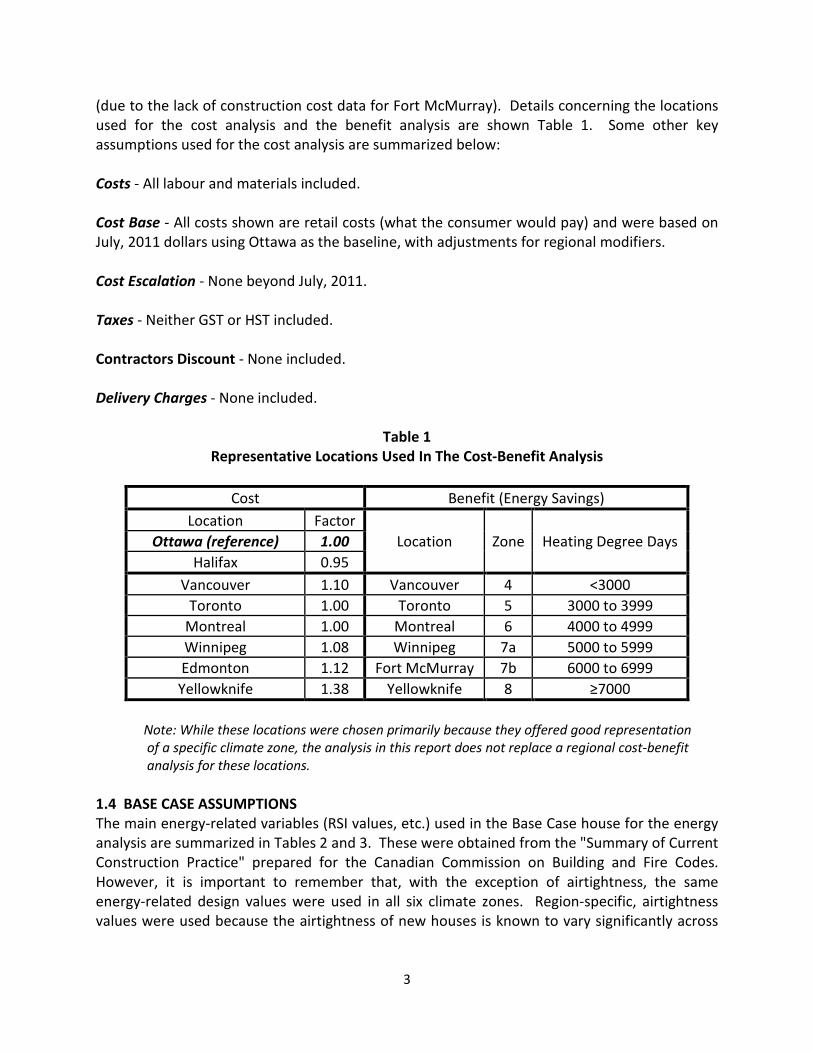
(due to the lack of construction cost data for Fort McMurray). Details concerning the locations used for the cost analysis and the benefit analysis are shown Table 1. Some other key assumptions used for the cost analysis are summarized below: Costs - All labour and materials included. Cost Base - All costs shown are retail costs (what the consumer would pay) and were based on July, 2011 dollars using Ottawa as the baseline, with adjustments for regional modifiers.
Cost Escalation - None beyond July, 2011. Taxes - Neither GST or HST included. Contractors Discount - None included. Delivery Charges - None included.
Table 1
Representative Locations Used In The Cost-Benefit Analysis
Cost Benefit (Energy Savings) Location Factor
Location Zone Heating Degree Days Ottawa (reference) 1.00 Halifax 0.95
Vancouver 1.10 Vancouver 4 <3000 Toronto 1.00 Toronto 5 3000 to 3999
Montreal 1.00 Montreal 6 4000 to 4999 Winnipeg 1.08 Winnipeg 7a 5000 to 5999 Edmonton 1.12 Fort McMurray 7b 6000 to 6999 Yellowknife 1.38 Yellowknife 8 ≥7000
Note: While these locations were chosen primarily because they offered good representation of a specific climate zone, the analysis in this report does not replace a regional cost-benefit analysis for these locations. 1.4 BASE CASE ASSUMPTIONS The main energy-related variables (RSI values, etc.) used in the Base Case house for the energy analysis are summarized in Tables 2 and 3. These were obtained from the "Summary of Current Construction Practice" prepared for the Canadian Commission on Building and Fire Codes. However, it is important to remember that, with the exception of airtightness, the same energy-related design values were used in all six climate zones. Region-specific, airtightness values were used because the airtightness of new houses is known to vary significantly across
4
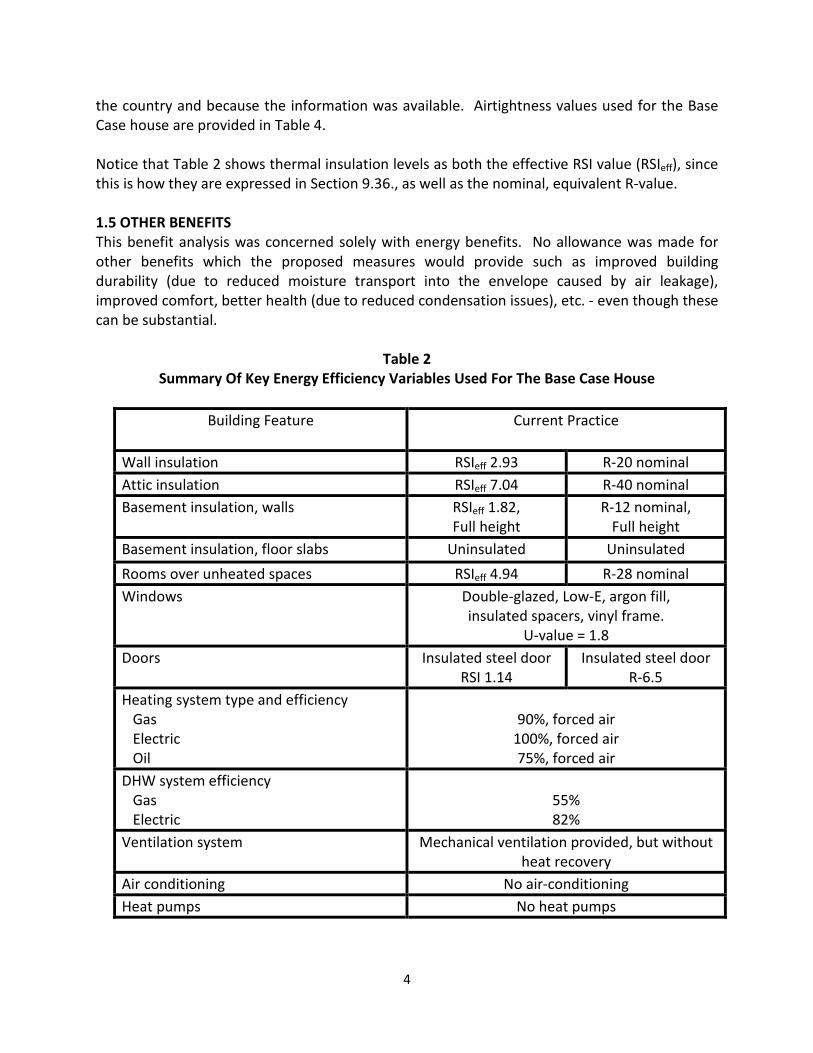
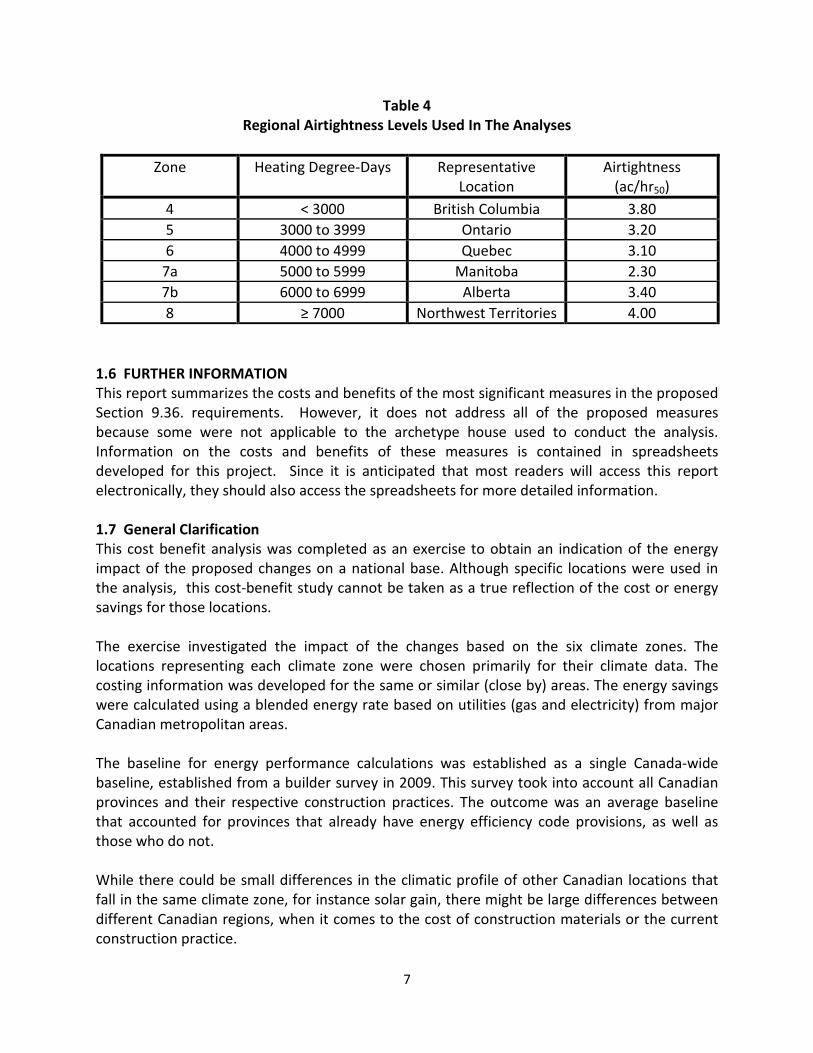
the country and because the information was available. Airtightness values used for the Base Case house are provided in Table 4. Notice that Table 2 shows thermal insulation levels as both the effective RSI value (RSIeff), since this is how they are expressed in Section 9.36., as well as the nominal, equivalent R-value. 1.5 OTHER BENEFITS This benefit analysis was concerned solely with energy benefits. No allowance was made for other benefits which the proposed measures would provide such as improved building durability (due to reduced moisture transport into the envelope caused by air leakage), improved comfort, better health (due to reduced condensation issues), etc. - even though these can be substantial.
Table 2 Summary Of Key Energy Efficiency Variables Used For The Base Case House
Building Feature Current Practice
Wall insulation RSIeff 2.93 R-20 nominal Attic insulation RSIeff 7.04 R-40 nominal Basement insulation, walls RSIeff 1.82,
Full height R-12 nominal,
Full height Basement insulation, floor slabs Uninsulated Uninsulated Rooms over unheated spaces RSIeff 4.94 R-28 nominal Windows Double-glazed, Low-E, argon fill,
insulated spacers, vinyl frame. U-value = 1.8
Doors Insulated steel door RSI 1.14
Insulated steel door R-6.5
Heating system type and efficiency Gas Electric Oil
90%, forced air
100%, forced air 75%, forced air
DHW system efficiency Gas Electric
55% 82%
Ventilation system Mechanical ventilation provided, but without heat recovery
Air conditioning No air-conditioning Heat pumps No heat pumps

5
6
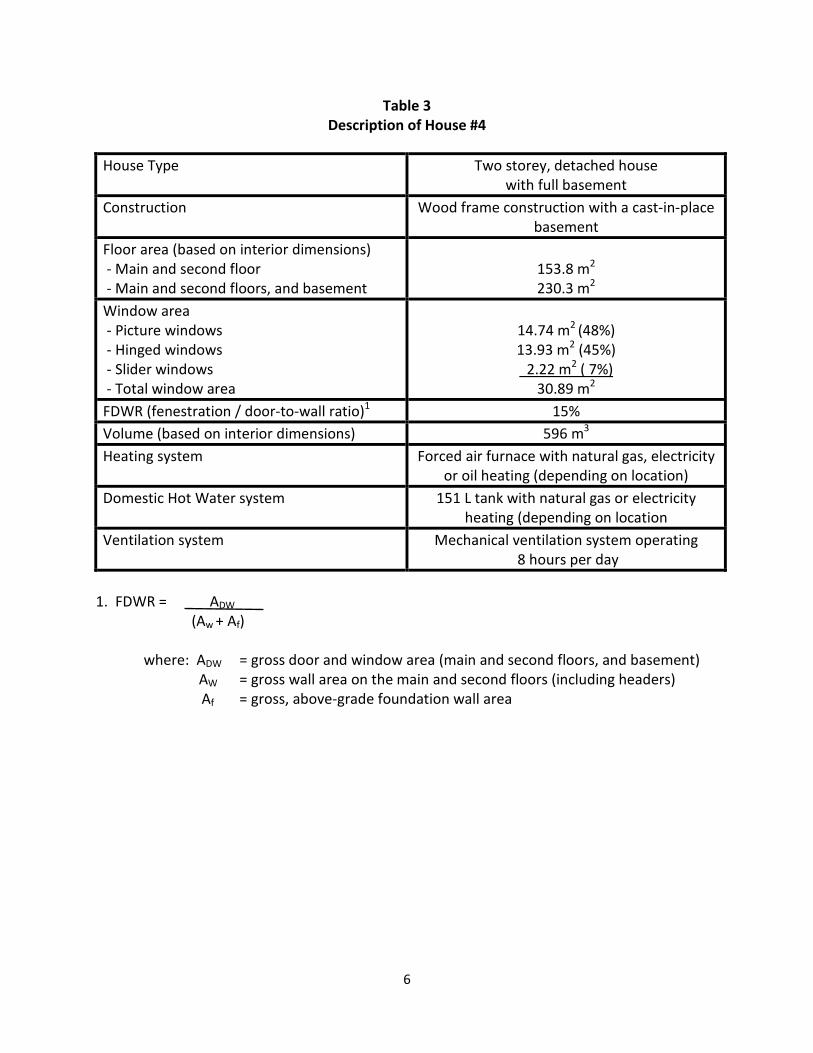
Table 3 Description of House #4
House Type Two storey, detached house
with full basement Construction Wood frame construction with a cast-in-place
basement Floor area (based on interior dimensions) - Main and second floor - Main and second floors, and basement
153.8 m2 230.3 m2
Window area - Picture windows - Hinged windows - Slider windows - Total window area
14.74 m2 (48%) 13.93 m2 (45%) 2.22 m2 ( 7%)
30.89 m2 FDWR (fenestration / door-to-wall ratio)1 15% Volume (based on interior dimensions) 596 m3 Heating system Forced air furnace with natural gas, electricity
or oil heating (depending on location) Domestic Hot Water system 151 L tank with natural gas or electricity
heating (depending on location Ventilation system Mechanical ventilation system operating
8 hours per day 1. FDWR = ADW (Aw + Af) where: ADW = gross door and window area (main and second floors, and basement) AW = gross wall area on the main and second floors (including headers) Af = gross, above-grade foundation wall area
7
Table 4 Regional Airtightness Levels Used In The Analyses
Zone Heating Degree-Days Representative
Location Airtightness
(ac/hr50) 4 < 3000 British Columbia 3.80 5 3000 to 3999 Ontario 3.20 6 4000 to 4999 Quebec 3.10
7a 5000 to 5999 Manitoba 2.30 7b 6000 to 6999 Alberta 3.40 8 ≥ 7000 Northwest Territories 4.00
1.6 FURTHER INFORMATION This report summarizes the costs and benefits of the most significant measures in the proposed Section 9.36. requirements. However, it does not address all of the proposed measures because some were not applicable to the archetype house used to conduct the analysis. Information on the costs and benefits of these measures is contained in spreadsheets developed for this project. Since it is anticipated that most readers will access this report electronically, they should also access the spreadsheets for more detailed information. 1.7 General Clarification This cost benefit analysis was completed as an exercise to obtain an indication of the energy impact of the proposed changes on a national base. Although specific locations were used in the analysis, this cost-benefit study cannot be taken as a true reflection of the cost or energy savings for those locations. The exercise investigated the impact of the changes based on the six climate zones. The locations representing each climate zone were chosen primarily for their climate data. The costing information was developed for the same or similar (close by) areas. The energy savings were calculated using a blended energy rate based on utilities (gas and electricity) from major Canadian metropolitan areas. The baseline for energy performance calculations was established as a single Canada-wide baseline, established from a builder survey in 2009. This survey took into account all Canadian provinces and their respective construction practices. The outcome was an average baseline that accounted for provinces that already have energy efficiency code provisions, as well as those who do not. While there could be small differences in the climatic profile of other Canadian locations that fall in the same climate zone, for instance solar gain, there might be large differences between different Canadian regions, when it comes to the cost of construction materials or the current construction practice.

8
In order to achieve a true representation of the impact of the proposed requirements in a specific region, it would be paramount that the analysis be performed using the respective regional context of current construction baseline, cost of construction materials and utility rates as well as common housing archetypes. The energy target data could then be used to calculate the benefits for an actual region.
9
SECTION 2 BUILDING ENVELOPE
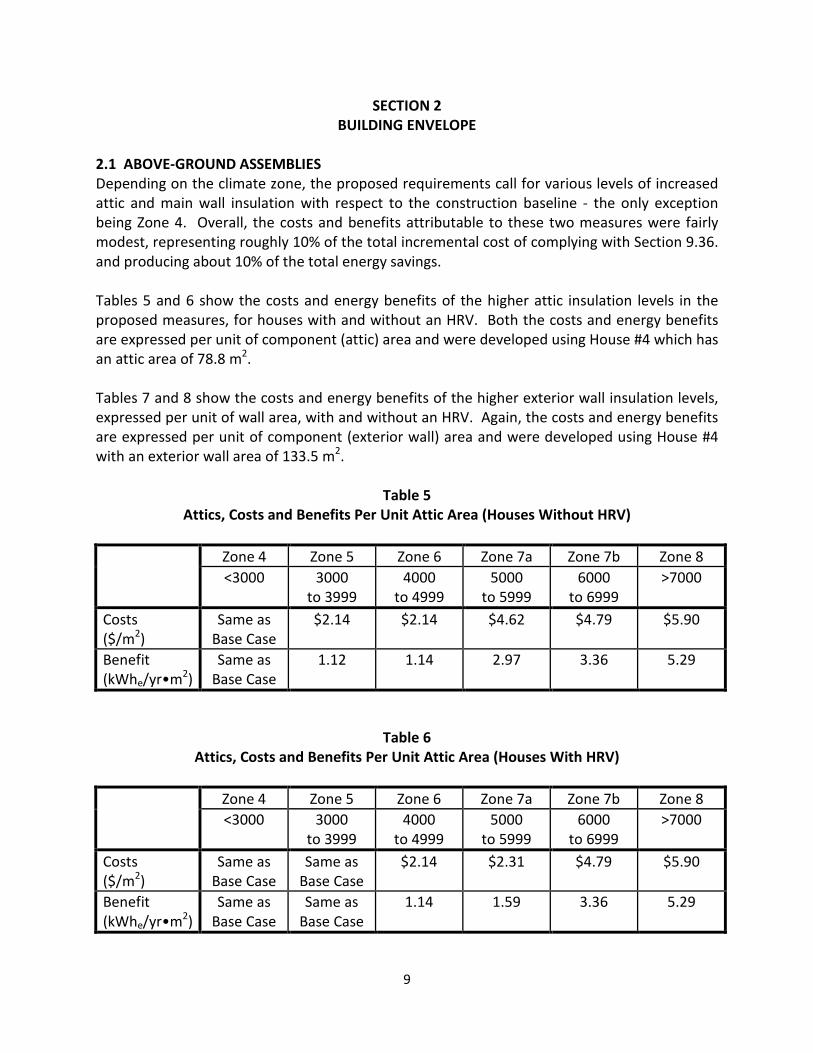
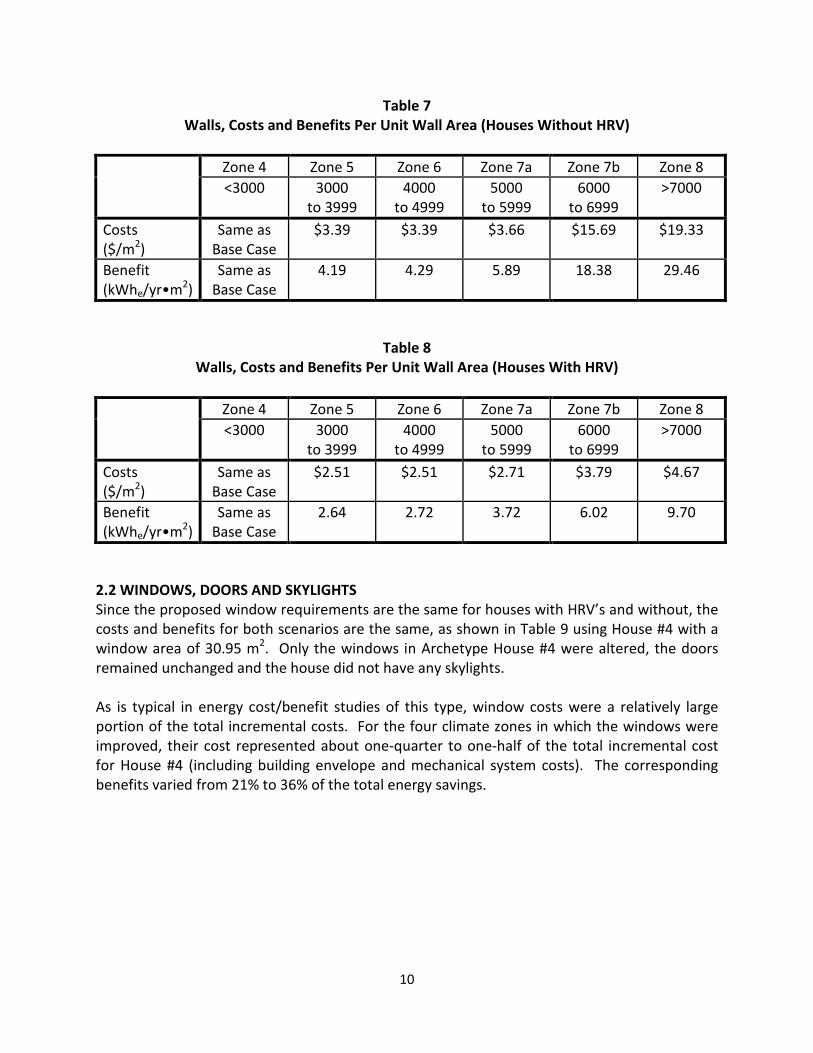
2.1 ABOVE-GROUND ASSEMBLIES Depending on the climate zone, the proposed requirements call for various levels of increased attic and main wall insulation with respect to the construction baseline - the only exception being Zone 4. Overall, the costs and benefits attributable to these two measures were fairly modest, representing roughly 10% of the total incremental cost of complying with Section 9.36. and producing about 10% of the total energy savings. Tables 5 and 6 show the costs and energy benefits of the higher attic insulation levels in the proposed measures, for houses with and without an HRV. Both the costs and energy benefits are expressed per unit of component (attic) area and were developed using House #4 which has an attic area of 78.8 m2. Tables 7 and 8 show the costs and energy benefits of the higher exterior wall insulation levels, expressed per unit of wall area, with and without an HRV. Again, the costs and energy benefits are expressed per unit of component (exterior wall) area and were developed using House #4 with an exterior wall area of 133.5 m2.
Table 5 Attics, Costs and Benefits Per Unit Attic Area (Houses Without HRV)
Zone 4 Zone 5 Zone 6 Zone 7a Zone 7b Zone 8
<3000 3000 to 3999
4000 to 4999
5000 to 5999
6000 to 6999
>7000
Costs ($/m2)
Same as Base Case
$2.14 $2.14 $4.62 $4.79 $5.90
Benefit (kWhe/yr•m2)
Same as Base Case
1.12 1.14 2.97 3.36 5.29
Table 6 Attics, Costs and Benefits Per Unit Attic Area (Houses With HRV)
Zone 4 Zone 5 Zone 6 Zone 7a Zone 7b Zone 8
<3000 3000 to 3999
4000 to 4999
5000 to 5999
6000 to 6999
>7000
Costs ($/m2)
Same as Base Case
Same as Base Case
$2.14 $2.31 $4.79 $5.90
Benefit (kWhe/yr•m2)
Same as Base Case
Same as Base Case
1.14 1.59 3.36 5.29
10
Table 7 Walls, Costs and Benefits Per Unit Wall Area (Houses Without HRV)
Zone 4 Zone 5 Zone 6 Zone 7a Zone 7b Zone 8
<3000 3000 to 3999
4000 to 4999
5000 to 5999
6000 to 6999
>7000
Costs ($/m2)
Same as Base Case
$3.39 $3.39 $3.66 $15.69 $19.33
Benefit (kWhe/yr•m2)
Same as Base Case
4.19 4.29 5.89 18.38 29.46
Table 8 Walls, Costs and Benefits Per Unit Wall Area (Houses With HRV)
Zone 4 Zone 5 Zone 6 Zone 7a Zone 7b Zone 8
<3000 3000 to 3999
4000 to 4999
5000 to 5999
6000 to 6999
>7000
Costs ($/m2)
Same as Base Case
$2.51 $2.51 $2.71 $3.79 $4.67
Benefit (kWhe/yr•m2)
Same as Base Case
2.64 2.72 3.72 6.02 9.70
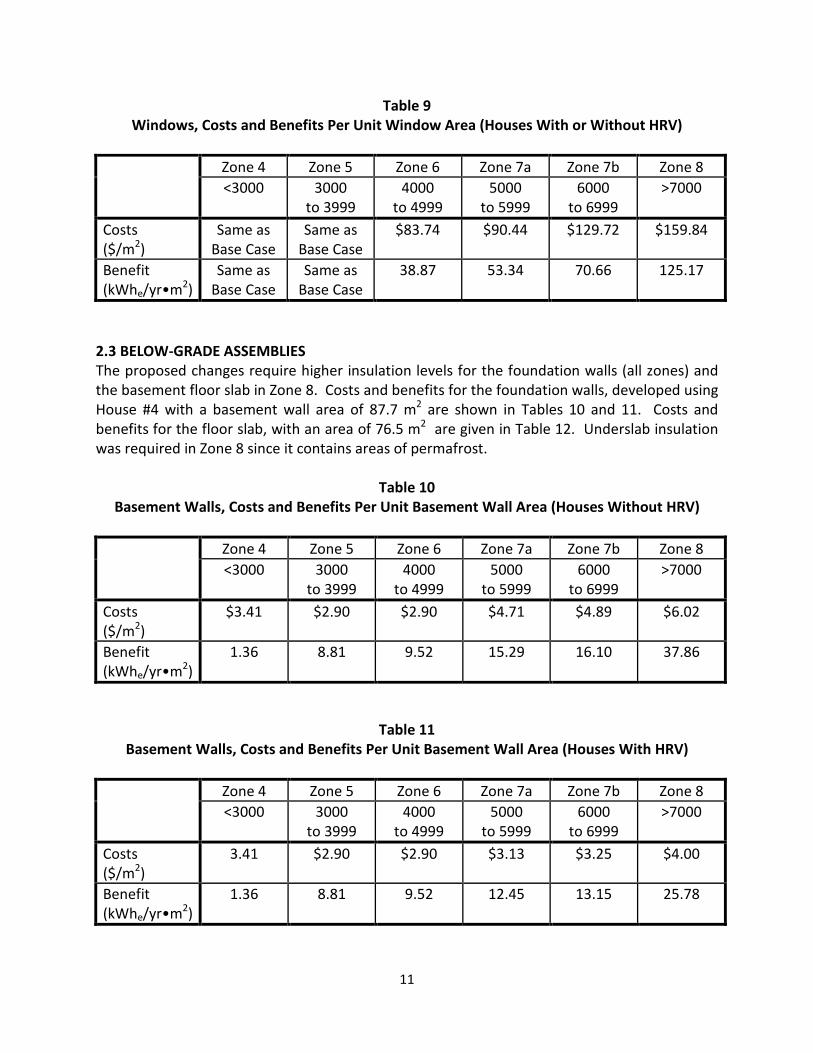
2.2 WINDOWS, DOORS AND SKYLIGHTS Since the proposed window requirements are the same for houses with HRV’s and without, the costs and benefits for both scenarios are the same, as shown in Table 9 using House #4 with a window area of 30.95 m2. Only the windows in Archetype House #4 were altered, the doors remained unchanged and the house did not have any skylights. As is typical in energy cost/benefit studies of this type, window costs were a relatively large portion of the total incremental costs. For the four climate zones in which the windows were improved, their cost represented about one-quarter to one-half of the total incremental cost for House #4 (including building envelope and mechanical system costs). The corresponding benefits varied from 21% to 36% of the total energy savings.
11
Table 9 Windows, Costs and Benefits Per Unit Window Area (Houses With or Without HRV)
Zone 4 Zone 5 Zone 6 Zone 7a Zone 7b Zone 8
<3000 3000 to 3999
4000 to 4999
5000 to 5999
6000 to 6999
>7000
Costs ($/m2)
Same as Base Case
Same as Base Case
$83.74 $90.44 $129.72 $159.84
Benefit (kWhe/yr•m2)
Same as Base Case
Same as Base Case
38.87 53.34 70.66 125.17
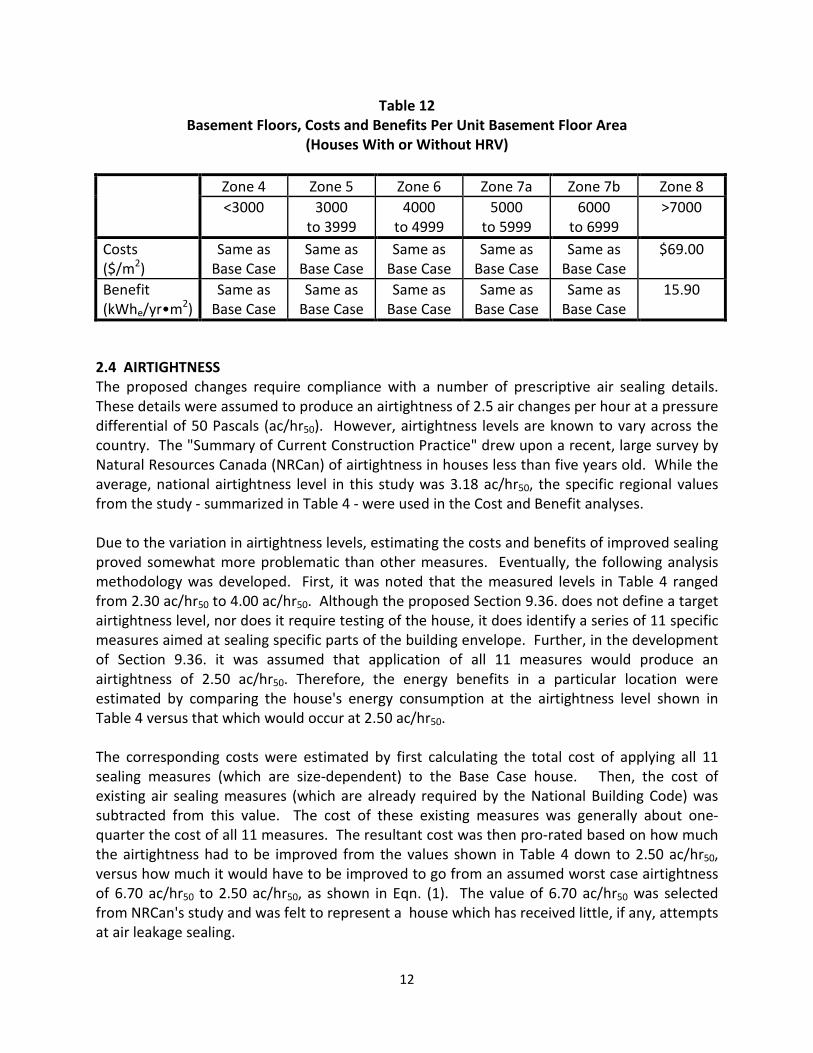
2.3 BELOW-GRADE ASSEMBLIES The proposed changes require higher insulation levels for the foundation walls (all zones) and the basement floor slab in Zone 8. Costs and benefits for the foundation walls, developed using House #4 with a basement wall area of 87.7 m2 are shown in Tables 10 and 11. Costs and benefits for the floor slab, with an area of 76.5 m2 are given in Table 12. Underslab insulation was required in Zone 8 since it contains areas of permafrost.
Table 10
Basement Walls, Costs and Benefits Per Unit Basement Wall Area (Houses Without HRV) Zone 4 Zone 5 Zone 6 Zone 7a Zone 7b Zone 8
<3000 3000 to 3999
4000 to 4999
5000 to 5999
6000 to 6999
>7000
Costs ($/m2)
$3.41 $2.90 $2.90 $4.71 $4.89 $6.02
Benefit (kWhe/yr•m2)
1.36 8.81 9.52 15.29 16.10 37.86
Table 11 Basement Walls, Costs and Benefits Per Unit Basement Wall Area (Houses With HRV)
Zone 4 Zone 5 Zone 6 Zone 7a Zone 7b Zone 8
<3000 3000 to 3999
4000 to 4999
5000 to 5999
6000 to 6999
>7000
Costs ($/m2)
3.41 $2.90 $2.90 $3.13 $3.25 $4.00
Benefit (kWhe/yr•m2)
1.36 8.81 9.52 12.45 13.15 25.78
12
Table 12 Basement Floors, Costs and Benefits Per Unit Basement Floor Area
(Houses With or Without HRV) Zone 4 Zone 5 Zone 6 Zone 7a Zone 7b Zone 8
<3000 3000 to 3999
4000 to 4999
5000 to 5999
6000 to 6999
>7000
Costs ($/m2)
Same as Base Case
Same as Base Case
Same as Base Case
Same as Base Case
Same as Base Case
$69.00
Benefit (kWhe/yr•m2)
Same as Base Case
Same as Base Case
Same as Base Case
Same as Base Case
Same as Base Case
15.90
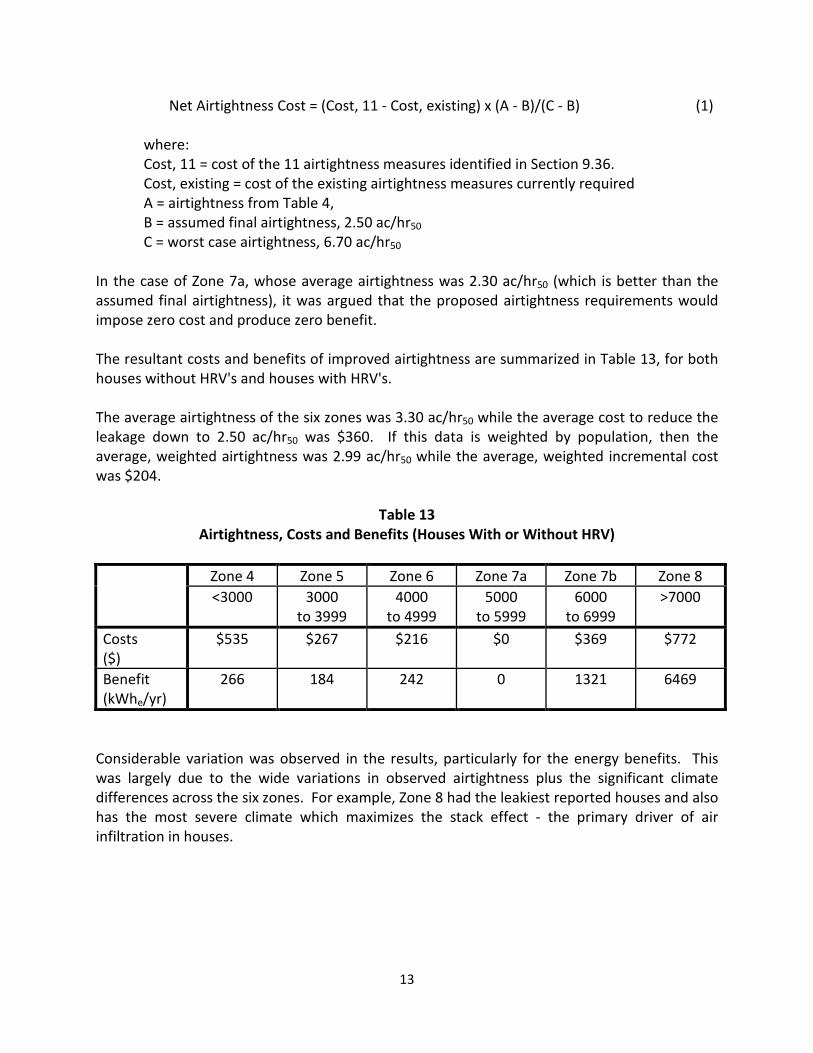
2.4 AIRTIGHTNESS The proposed changes require compliance with a number of prescriptive air sealing details. These details were assumed to produce an airtightness of 2.5 air changes per hour at a pressure differential of 50 Pascals (ac/hr50). However, airtightness levels are known to vary across the country. The "Summary of Current Construction Practice" drew upon a recent, large survey by Natural Resources Canada (NRCan) of airtightness in houses less than five years old. While the average, national airtightness level in this study was 3.18 ac/hr50, the specific regional values from the study - summarized in Table 4 - were used in the Cost and Benefit analyses. Due to the variation in airtightness levels, estimating the costs and benefits of improved sealing proved somewhat more problematic than other measures. Eventually, the following analysis methodology was developed. First, it was noted that the measured levels in Table 4 ranged from 2.30 ac/hr50 to 4.00 ac/hr50. Although the proposed Section 9.36. does not define a target airtightness level, nor does it require testing of the house, it does identify a series of 11 specific measures aimed at sealing specific parts of the building envelope. Further, in the development of Section 9.36. it was assumed that application of all 11 measures would produce an airtightness of 2.50 ac/hr50. Therefore, the energy benefits in a particular location were estimated by comparing the house's energy consumption at the airtightness level shown in Table 4 versus that which would occur at 2.50 ac/hr50. The corresponding costs were estimated by first calculating the total cost of applying all 11 sealing measures (which are size-dependent) to the Base Case house. Then, the cost of existing air sealing measures (which are already required by the National Building Code) was subtracted from this value. The cost of these existing measures was generally about one-quarter the cost of all 11 measures. The resultant cost was then pro-rated based on how much the airtightness had to be improved from the values shown in Table 4 down to 2.50 ac/hr50, versus how much it would have to be improved to go from an assumed worst case airtightness of 6.70 ac/hr50 to 2.50 ac/hr50, as shown in Eqn. (1). The value of 6.70 ac/hr50 was selected from NRCan's study and was felt to represent a house which has received little, if any, attempts at air leakage sealing.
13
Net Airtightness Cost = (Cost, 11 - Cost, existing) x (A - B)/(C - B) (1) where: Cost, 11 = cost of the 11 airtightness measures identified in Section 9.36. Cost, existing = cost of the existing airtightness measures currently required A = airtightness from Table 4, B = assumed final airtightness, 2.50 ac/hr50 C = worst case airtightness, 6.70 ac/hr50 In the case of Zone 7a, whose average airtightness was 2.30 ac/hr50 (which is better than the assumed final airtightness), it was argued that the proposed airtightness requirements would impose zero cost and produce zero benefit. The resultant costs and benefits of improved airtightness are summarized in Table 13, for both houses without HRV's and houses with HRV's. The average airtightness of the six zones was 3.30 ac/hr50 while the average cost to reduce the leakage down to 2.50 ac/hr50 was $360. If this data is weighted by population, then the average, weighted airtightness was 2.99 ac/hr50 while the average, weighted incremental cost was $204.
Table 13 Airtightness, Costs and Benefits (Houses With or Without HRV)
Zone 4 Zone 5 Zone 6 Zone 7a Zone 7b Zone 8
<3000 3000 to 3999
4000 to 4999
5000 to 5999
6000 to 6999
>7000
Costs ($)
$535 $267 $216 $0 $369 $772
Benefit (kWhe/yr)
266 184 242 0 1321 6469
Considerable variation was observed in the results, particularly for the energy benefits. This was largely due to the wide variations in observed airtightness plus the significant climate differences across the six zones. For example, Zone 8 had the leakiest reported houses and also has the most severe climate which maximizes the stack effect - the primary driver of air infiltration in houses.
14
SECTION 3 HEATING, VENTILATION AND AIR-CONDITIONING
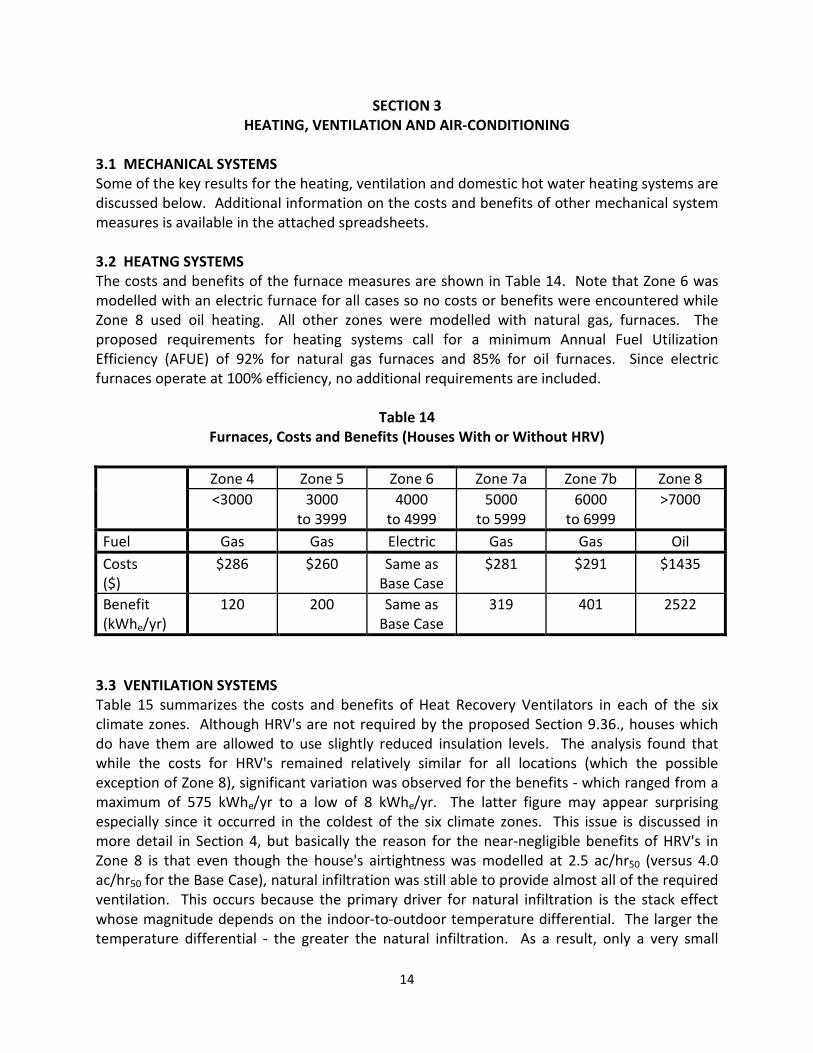
3.1 MECHANICAL SYSTEMS Some of the key results for the heating, ventilation and domestic hot water heating systems are discussed below. Additional information on the costs and benefits of other mechanical system measures is available in the attached spreadsheets. 3.2 HEATNG SYSTEMS The costs and benefits of the furnace measures are shown in Table 14. Note that Zone 6 was modelled with an electric furnace for all cases so no costs or benefits were encountered while Zone 8 used oil heating. All other zones were modelled with natural gas, furnaces. The proposed requirements for heating systems call for a minimum Annual Fuel Utilization Efficiency (AFUE) of 92% for natural gas furnaces and 85% for oil furnaces. Since electric furnaces operate at 100% efficiency, no additional requirements are included.
Table 14
Furnaces, Costs and Benefits (Houses With or Without HRV) Zone 4 Zone 5 Zone 6 Zone 7a Zone 7b Zone 8
<3000 3000 to 3999
4000 to 4999
5000 to 5999
6000 to 6999
>7000
Fuel Gas Gas Electric Gas Gas Oil Costs ($)
$286 $260 Same as Base Case
$281 $291 $1435
Benefit (kWhe/yr)
120 200 Same as Base Case
319 401 2522
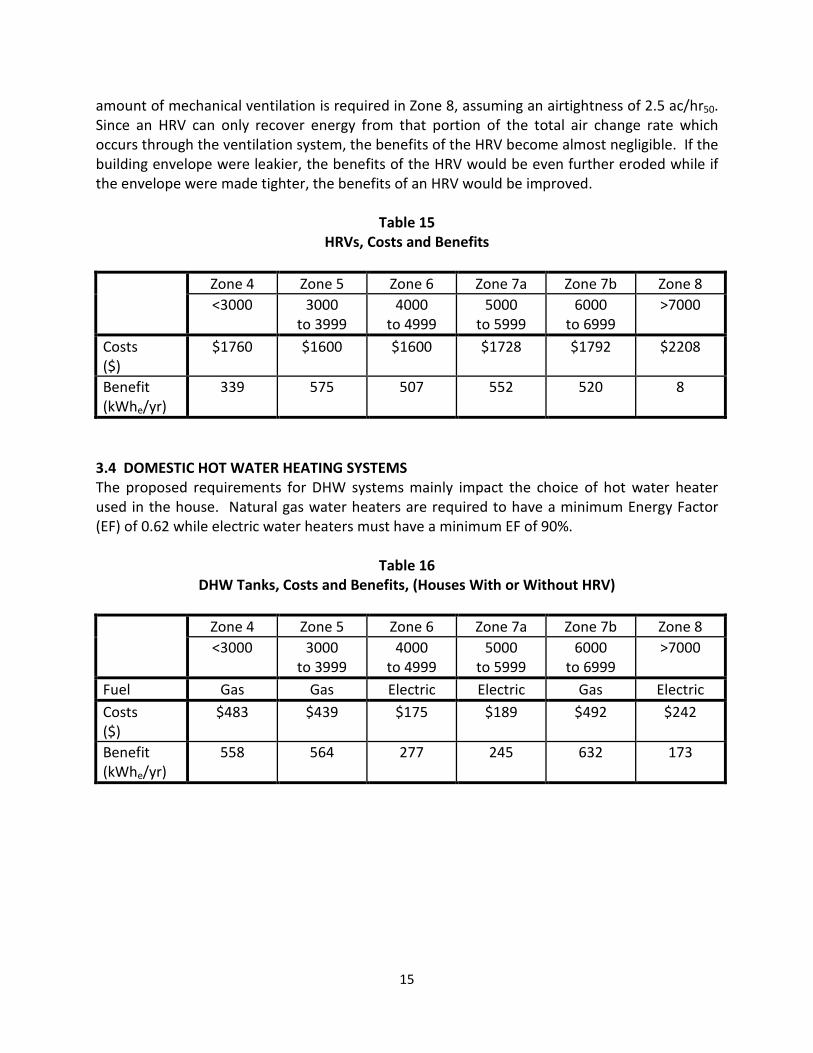
3.3 VENTILATION SYSTEMS Table 15 summarizes the costs and benefits of Heat Recovery Ventilators in each of the six climate zones. Although HRV's are not required by the proposed Section 9.36., houses which do have them are allowed to use slightly reduced insulation levels. The analysis found that while the costs for HRV's remained relatively similar for all locations (which the possible exception of Zone 8), significant variation was observed for the benefits - which ranged from a maximum of 575 kWhe/yr to a low of 8 kWhe/yr. The latter figure may appear surprising especially since it occurred in the coldest of the six climate zones. This issue is discussed in more detail in Section 4, but basically the reason for the near-negligible benefits of HRV's in Zone 8 is that even though the house's airtightness was modelled at 2.5 ac/hr50 (versus 4.0 ac/hr50 for the Base Case), natural infiltration was still able to provide almost all of the required ventilation. This occurs because the primary driver for natural infiltration is the stack effect whose magnitude depends on the indoor-to-outdoor temperature differential. The larger the temperature differential - the greater the natural infiltration. As a result, only a very small
15
amount of mechanical ventilation is required in Zone 8, assuming an airtightness of 2.5 ac/hr50. Since an HRV can only recover energy from that portion of the total air change rate which occurs through the ventilation system, the benefits of the HRV become almost negligible. If the building envelope were leakier, the benefits of the HRV would be even further eroded while if the envelope were made tighter, the benefits of an HRV would be improved.
Table 15 HRVs, Costs and Benefits
Zone 4 Zone 5 Zone 6 Zone 7a Zone 7b Zone 8
<3000 3000 to 3999
4000 to 4999
5000 to 5999
6000 to 6999
>7000
Costs ($)
$1760 $1600 $1600 $1728 $1792 $2208
Benefit (kWhe/yr)
339 575 507 552 520 8
3.4 DOMESTIC HOT WATER HEATING SYSTEMS The proposed requirements for DHW systems mainly impact the choice of hot water heater used in the house. Natural gas water heaters are required to have a minimum Energy Factor (EF) of 0.62 while electric water heaters must have a minimum EF of 90%.
Table 16 DHW Tanks, Costs and Benefits, (Houses With or Without HRV)
Zone 4 Zone 5 Zone 6 Zone 7a Zone 7b Zone 8
<3000 3000 to 3999
4000 to 4999
5000 to 5999
6000 to 6999
>7000
Fuel Gas Gas Electric Electric Gas Electric Costs ($)
$483 $439 $175 $189 $492 $242
Benefit (kWhe/yr)
558 564 277 245 632 173
16
SECTION 4 WHOLE HOUSE IMPACT
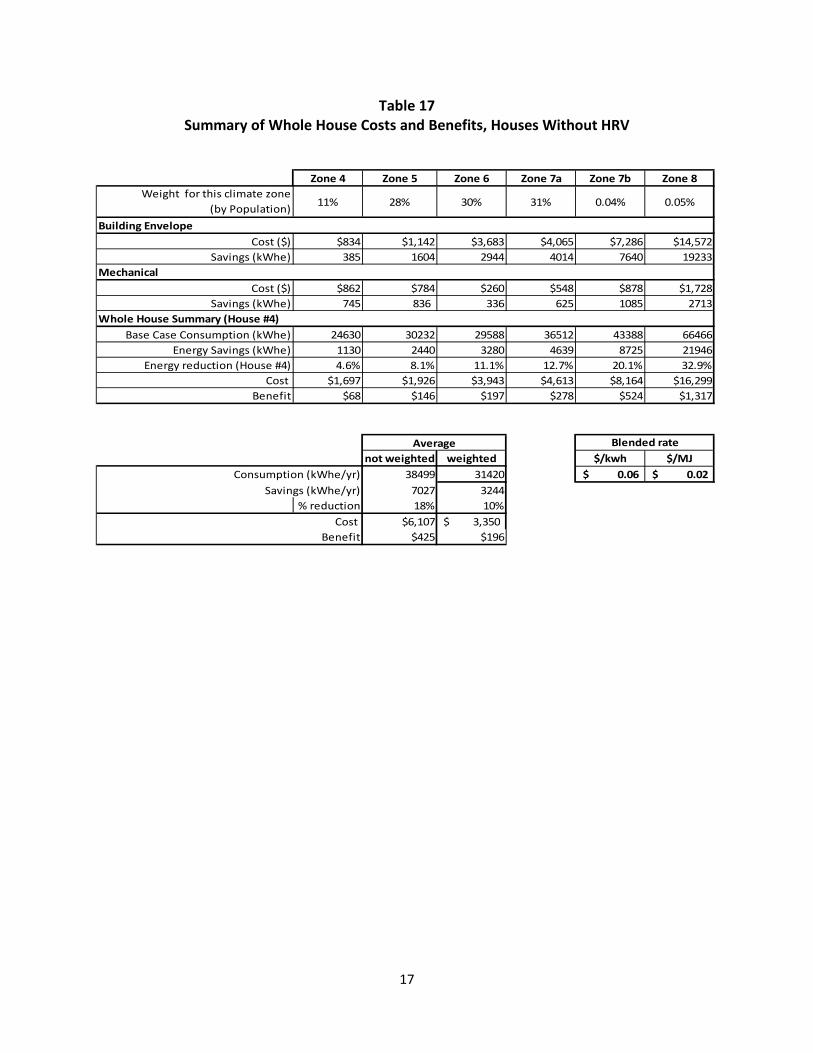
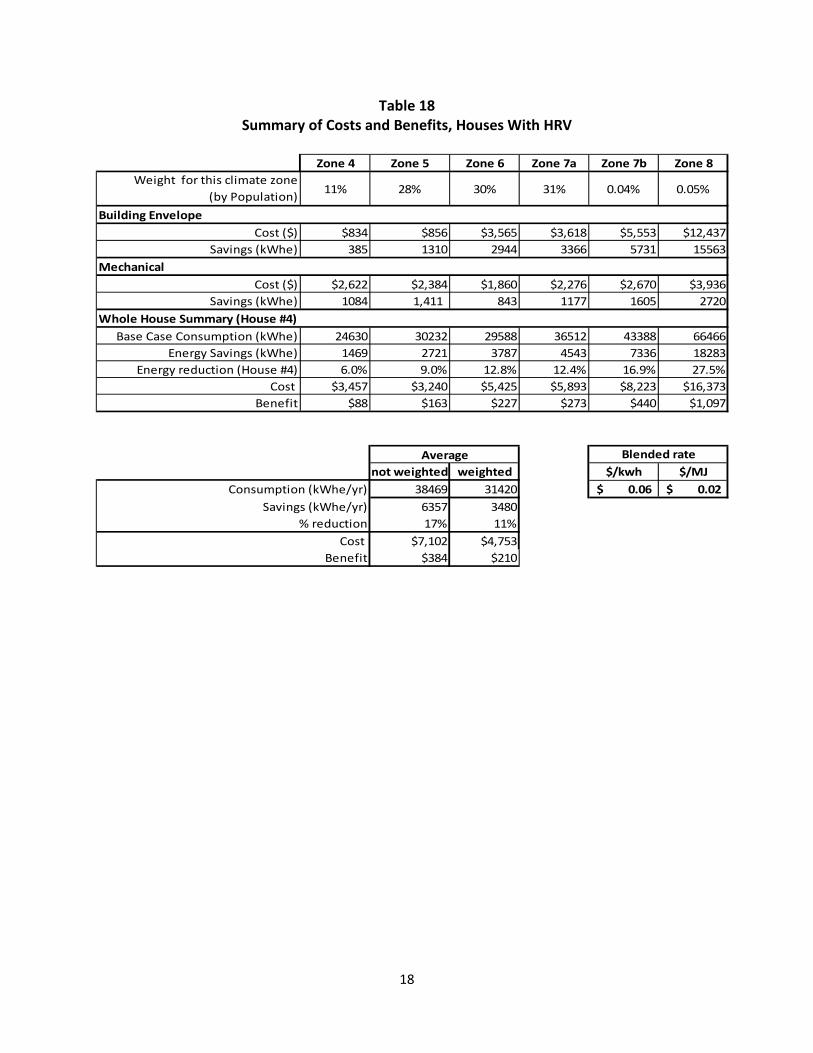
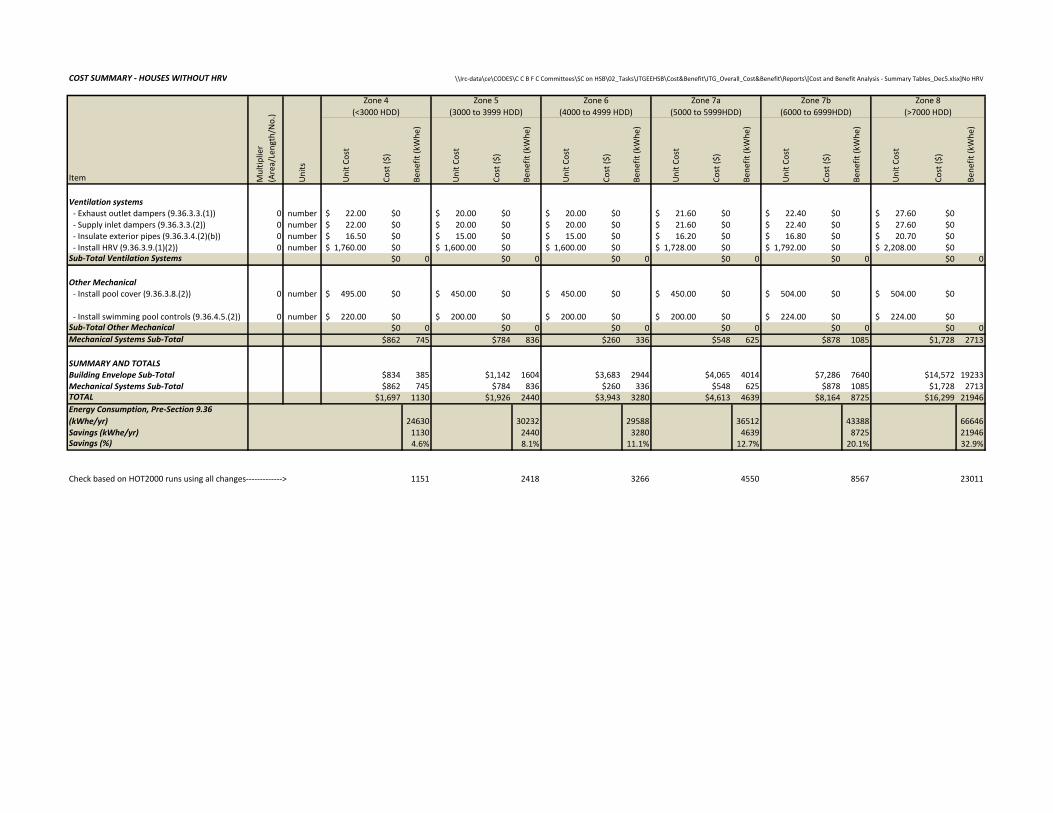
4.1 IMPACT ON WHOLE HOUSE BASIS The previous sections of this report have dealt with the costs and benefits of individual measures applied, in isolation, to House #4. This section addresses the overall costs and corresponding benefits of applying Section 9.36. to a typical, new Canadian home as represented by House #4. As such, it does not include all measures identified in Section 9.36., only those which are applicable to House #4. The results are summarized in Tables 17 and 18. The approximate population weight used to calculate the weighted averages in Tables 17 and 18 was determined based on the population of 24 Canadian Metropolitan areas and their respective populations. This represents about 57% of the Canadian population. Since many of the proposed measures in Section 9.36. only apply in a small or very small percentage of houses (for example, covers for indoor swimming pools), they were not included in the whole house analysis involving House #4. However, the attached spreadsheets contain the estimated costs and energy benefits of these measures. This information can be used to evaluate the impact of such measures on an individual house. If a broader, country-wide assessment is desired, then the impacts described in this report can still be used provided they are multiplied with a suitable "utilization factor" which identifies the percentage of new, Canadian homes which would benefit from the measure.
17
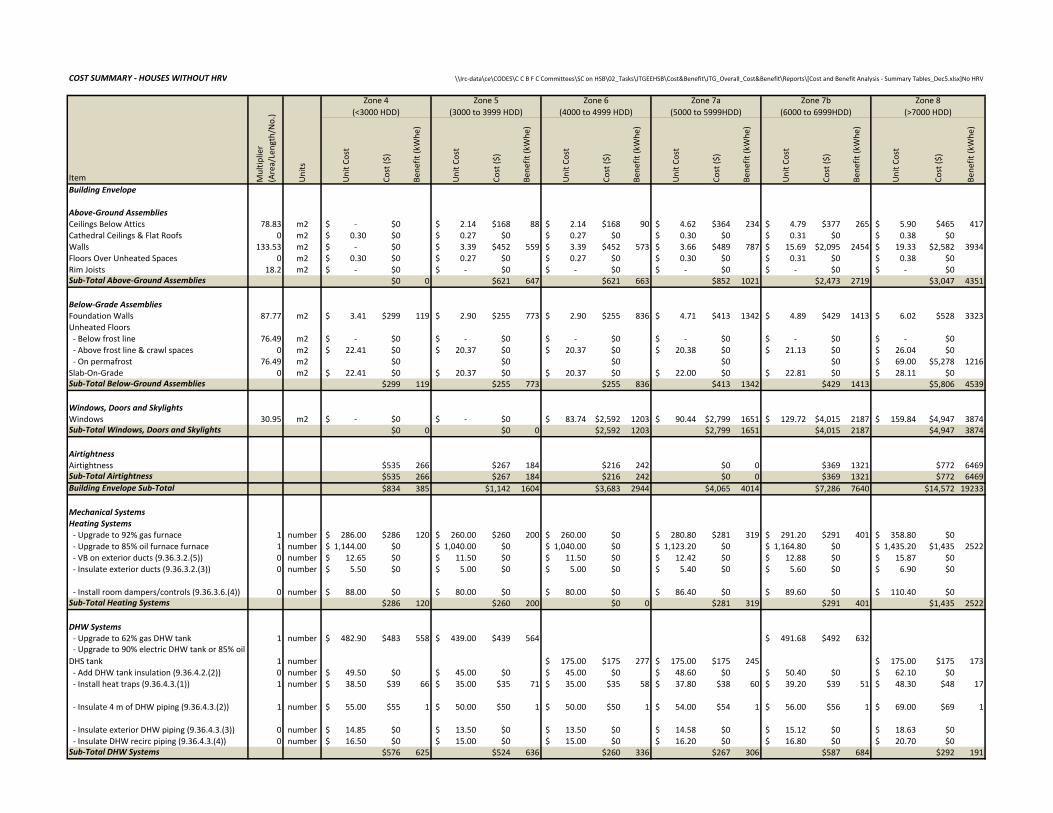
Table 17 Summary of Whole House Costs and Benefits, Houses Without HRV
Zone 4 Zone 5 Zone 6 Zone 7a Zone 7b Zone 8Weight for this climate zone
(by Population) 11% 28% 30% 31% 0.04% 0.05%
Cost ($) $834 $1,142 $3,683 $4,065 $7,286 $14,572Savings (kWhe) 385 1604 2944 4014 7640 19233
Cost ($) $862 $784 $260 $548 $878 $1,728Savings (kWhe) 745 836 336 625 1085 2713
Base Case Consumption (kWhe) 24630 30232 29588 36512 43388 66466Energy Savings (kWhe) 1130 2440 3280 4639 8725 21946
Energy reduction (House #4) 4.6% 8.1% 11.1% 12.7% 20.1% 32.9%Cost $1,697 $1,926 $3,943 $4,613 $8,164 $16,299
Benefit $68 $146 $197 $278 $524 $1,317
not weighted weighted $/kwh $/MJConsumption (kWhe/yr) 38499 31420 0.06$ 0.02$
7027 3244% reduction 18% 10%
$6,107 3,350$ $425 $196
Building Envelope
Cost Benefit
Mechanical
Whole House Summary (House #4)
Average Blended rate
Savings (kWhe/yr)
18
Table 18 Summary of Costs and Benefits, Houses With HRV
Zone 4 Zone 5 Zone 6 Zone 7a Zone 7b Zone 8
Weight for this climate zone (by Population) 11% 28% 30% 31% 0.04% 0.05%
Cost ($) $834 $856 $3,565 $3,618 $5,553 $12,437Savings (kWhe) 385 1310 2944 3366 5731 15563
Cost ($) $2,622 $2,384 $1,860 $2,276 $2,670 $3,936Savings (kWhe) 1084 1,411 843 1177 1605 2720
Base Case Consumption (kWhe) 24630 30232 29588 36512 43388 66466Energy Savings (kWhe) 1469 2721 3787 4543 7336 18283
Energy reduction (House #4) 6.0% 9.0% 12.8% 12.4% 16.9% 27.5%Cost $3,457 $3,240 $5,425 $5,893 $8,223 $16,373
Benefit $88 $163 $227 $273 $440 $1,097
not weighted weighted $/kwh $/MJConsumption (kWhe/yr) 38469 31420 0.06$ 0.02$
6357 3480% reduction 17% 11%
$7,102 $4,753$384 $210
Mechanical
Building Envelope
Benefit
Whole House Summary (House #4)
Average Blended rate
Savings (kWhe/yr)
Cost
19
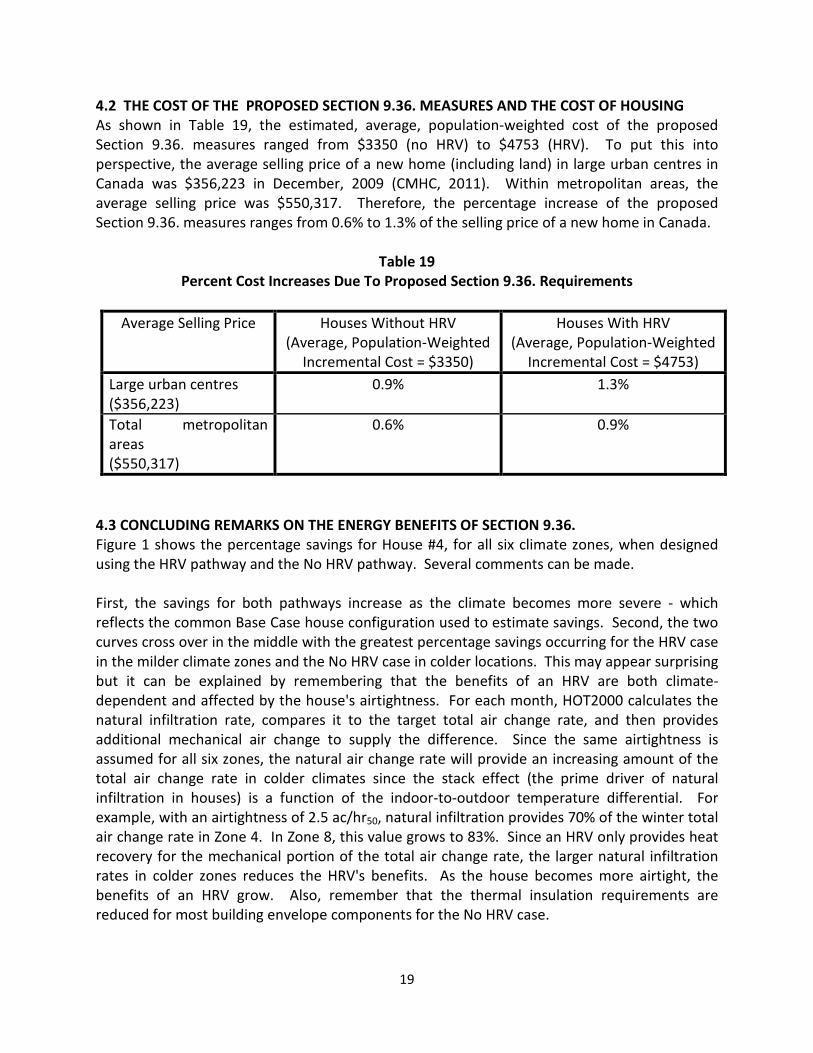
4.2 THE COST OF THE PROPOSED SECTION 9.36. MEASURES AND THE COST OF HOUSING As shown in Table 19, the estimated, average, population-weighted cost of the proposed Section 9.36. measures ranged from $3350 (no HRV) to $4753 (HRV). To put this into perspective, the average selling price of a new home (including land) in large urban centres in Canada was $356,223 in December, 2009 (CMHC, 2011). Within metropolitan areas, the average selling price was $550,317. Therefore, the percentage increase of the proposed Section 9.36. measures ranges from 0.6% to 1.3% of the selling price of a new home in Canada.
Table 19 Percent Cost Increases Due To Proposed Section 9.36. Requirements
Average Selling Price Houses Without HRV
(Average, Population-Weighted Incremental Cost = $3350)
Houses With HRV (Average, Population-Weighted
Incremental Cost = $4753) Large urban centres ($356,223)
0.9% 1.3%
Total metropolitan areas ($550,317)
0.6% 0.9%
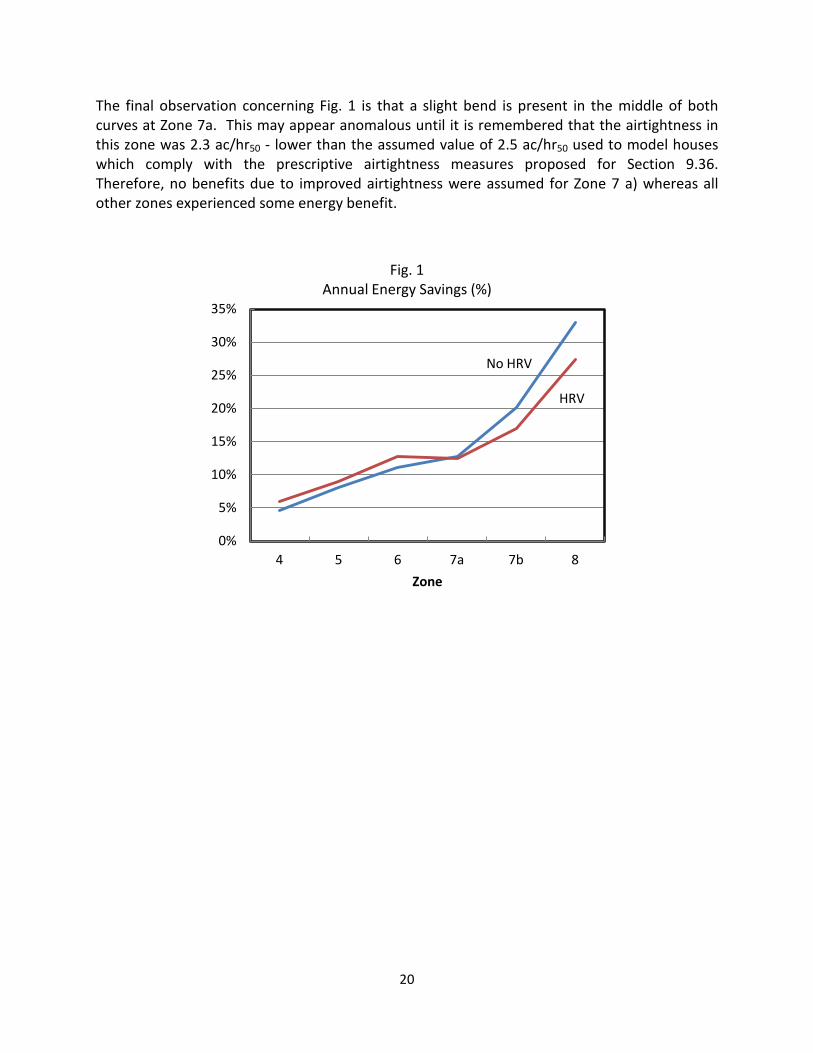
4.3 CONCLUDING REMARKS ON THE ENERGY BENEFITS OF SECTION 9.36. Figure 1 shows the percentage savings for House #4, for all six climate zones, when designed using the HRV pathway and the No HRV pathway. Several comments can be made. First, the savings for both pathways increase as the climate becomes more severe - which reflects the common Base Case house configuration used to estimate savings. Second, the two curves cross over in the middle with the greatest percentage savings occurring for the HRV case in the milder climate zones and the No HRV case in colder locations. This may appear surprising but it can be explained by remembering that the benefits of an HRV are both climate-dependent and affected by the house's airtightness. For each month, HOT2000 calculates the natural infiltration rate, compares it to the target total air change rate, and then provides additional mechanical air change to supply the difference. Since the same airtightness is assumed for all six zones, the natural air change rate will provide an increasing amount of the total air change rate in colder climates since the stack effect (the prime driver of natural infiltration in houses) is a function of the indoor-to-outdoor temperature differential. For example, with an airtightness of 2.5 ac/hr50, natural infiltration provides 70% of the winter total air change rate in Zone 4. In Zone 8, this value grows to 83%. Since an HRV only provides heat recovery for the mechanical portion of the total air change rate, the larger natural infiltration rates in colder zones reduces the HRV's benefits. As the house becomes more airtight, the benefits of an HRV grow. Also, remember that the thermal insulation requirements are reduced for most building envelope components for the No HRV case.
20
The final observation concerning Fig. 1 is that a slight bend is present in the middle of both curves at Zone 7a. This may appear anomalous until it is remembered that the airtightness in this zone was 2.3 ac/hr50 - lower than the assumed value of 2.5 ac/hr50 used to model houses which comply with the prescriptive airtightness measures proposed for Section 9.36. Therefore, no benefits due to improved airtightness were assumed for Zone 7 a) whereas all other zones experienced some energy benefit.
0%
5%
10%
15%
20%
25%
30%
35%
4 5 6 7a 7b 8 Zone
Fig. 1 Annual Energy Savings (%)
HRV
No HRV
21
REFERENCES
Canadian Commission on Building and Fire Codes. March, 2011. "Summary of Current Construction Practices". Canada Mortgage and Housing Corporation. April, 2011. "Dwelling Starts, Completions, Under Construction and Newly Completed and Unabsorbed Dwellings – 2010”. Hanscomb Cost Consultants. 2011. “Proposed Changes For The Energy Efficiency In Housing and Small Buildings In The National Building Code – Building Envelope”. Hanscomb Cost Consultants. 2011. “Proposed Changes For The Energy Efficiency In Housing and Small Buildings In The National Building Code – HVAC and Service Hot Water Systems”. 2011. Kidd, Peter. Manitoba Hydro. 2011. Personal communication. Proskiw, G. September, 2011. "Final Validation of the Proposed Part 9 Prescriptive Requirements For Insulation, Airtightness and Windows, Relative to the Proposed Target of ERS 80. Report prepared for the National Research Council of Canada.
22
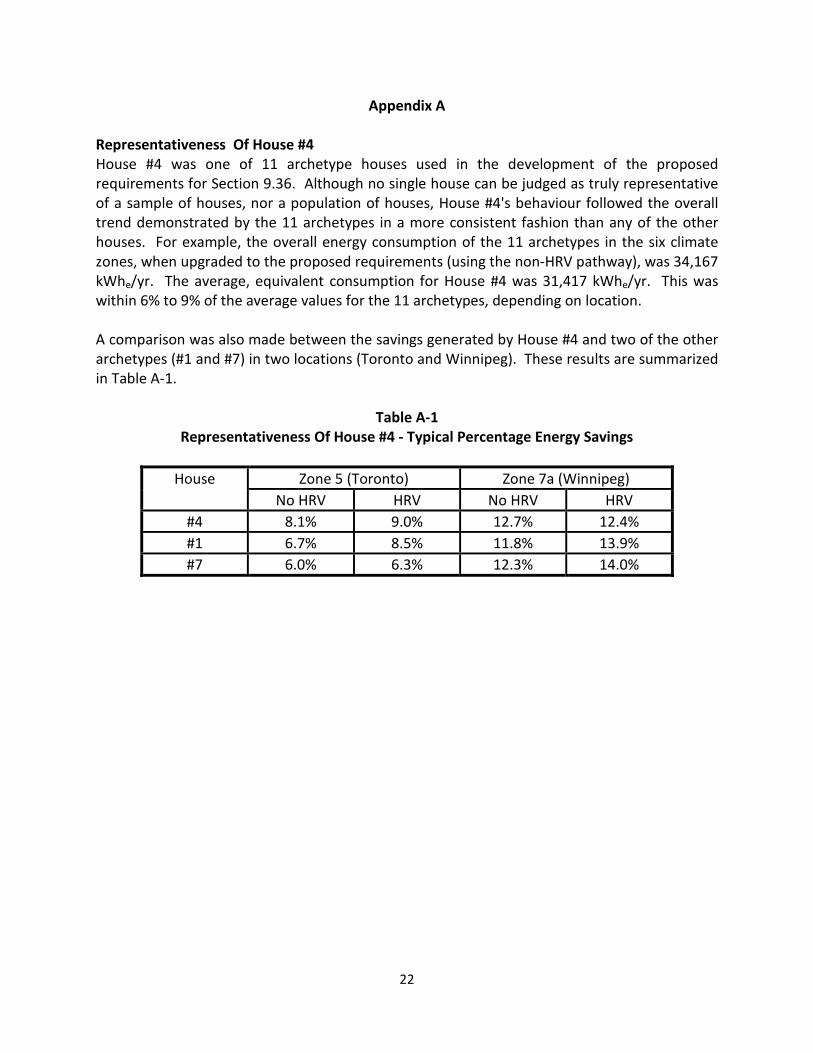
Appendix A Representativeness Of House #4 House #4 was one of 11 archetype houses used in the development of the proposed requirements for Section 9.36. Although no single house can be judged as truly representative of a sample of houses, nor a population of houses, House #4's behaviour followed the overall trend demonstrated by the 11 archetypes in a more consistent fashion than any of the other houses. For example, the overall energy consumption of the 11 archetypes in the six climate zones, when upgraded to the proposed requirements (using the non-HRV pathway), was 34,167 kWhe/yr. The average, equivalent consumption for House #4 was 31,417 kWhe/yr. This was within 6% to 9% of the average values for the 11 archetypes, depending on location. A comparison was also made between the savings generated by House #4 and two of the other archetypes (#1 and #7) in two locations (Toronto and Winnipeg). These results are summarized in Table A-1.
Table A-1 Representativeness Of House #4 - Typical Percentage Energy Savings
House Zone 5 (Toronto) Zone 7a (Winnipeg)
No HRV HRV No HRV HRV #4 8.1% 9.0% 12.7% 12.4% #1 6.7% 8.5% 11.8% 13.9% #7 6.0% 6.3% 12.3% 14.0%
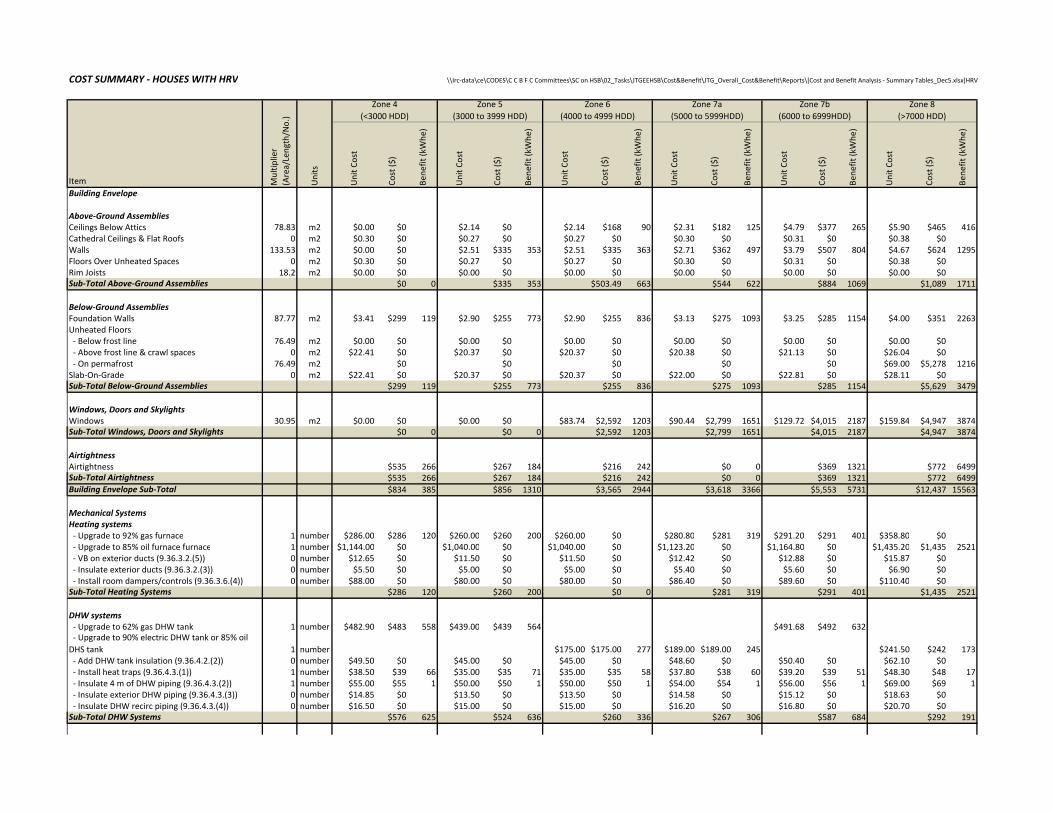
COST SUMMARY ‐ HOUSES WITH HRV \\Irc‐data\ce\CODES\C C B F C Committees\SC on HSB\02_Tasks\JTGEEHSB\Cost&Benefit\JTG_Overall_Cost&Benefit\Reports\[Cost and Benefit Analysis ‐ Summary Tables_Dec5.xlsx]HRV
ItemBuilding Envelope
Above‐Ground AssembliesCeilings Below Attics 78.83 m2 $0.00 $0 $2.14 $0 $2.14 $168 90 $2.31 $182 125 $4.79 $377 265 $5.90 $465 416Cathedral Ceilings & Flat Roofs 0 m2 $0.30 $0 $0.27 $0 $0.27 $0 $0.30 $0 $0.31 $0 $0.38 $0Walls 133.53 m2 $0.00 $0 $2.51 $335 353 $2.51 $335 363 $2.71 $362 497 $3.79 $507 804 $4.67 $624 1295Floors Over Unheated Spaces 0 m2 $0.30 $0 $0.27 $0 $0.27 $0 $0.30 $0 $0.31 $0 $0.38 $0Rim Joists 18.2 m2 $0.00 $0 $0.00 $0 $0.00 $0 $0.00 $0 $0.00 $0 $0.00 $0Sub‐Total Above‐Ground Assemblies $0 0 $335 353 $503.49 663 $544 622 $884 1069 $1,089 1711
Below‐Ground AssembliesFoundation Walls 87.77 m2 $3.41 $299 119 $2.90 $255 773 $2.90 $255 836 $3.13 $275 1093 $3.25 $285 1154 $4.00 $351 2263Unheated Floors ‐ Below frost line 76.49 m2 $0.00 $0 $0.00 $0 $0.00 $0 $0.00 $0 $0.00 $0 $0.00 $0 ‐ Above frost line & crawl spaces 0 m2 $22.41 $0 $20.37 $0 $20.37 $0 $20.38 $0 $21.13 $0 $26.04 $0 ‐ On permafrost 76.49 m2 $0 $0 $0 $0 $0 $69.00 $5,278 1216Slab‐On‐Grade 0 m2 $22.41 $0 $20.37 $0 $20.37 $0 $22.00 $0 $22.81 $0 $28.11 $0Sub‐Total Below‐Ground Assemblies $299 119 $255 773 $255 836 $275 1093 $285 1154 $5,629 3479
Windows, Doors and SkylightsWindows 30.95 m2 $0.00 $0 $0.00 $0 $83.74 $2,592 1203 $90.44 $2,799 1651 $129.72 $4,015 2187 $159.84 $4,947 3874Sub‐Total Windows, Doors and Skylights $0 0 $0 0 $2,592 1203 $2,799 1651 $4,015 2187 $4,947 3874
AirtightnessAirtightness $535 266 $267 184 $216 242 $0 0 $369 1321 $772 6499Sub‐Total Airtightness $535 266 $267 184 $216 242 $0 0 $369 1321 $772 6499Building Envelope Sub‐Total $834 385 $856 1310 $3,565 2944 $3,618 3366 $5,553 5731 $12,437 15563
Mechanical SystemsHeating systems ‐ Upgrade to 92% gas furnace 1 number $286.00 $286 120 $260.00 $260 200 $260.00 $0 $280.80 $281 319 $291.20 $291 401 $358.80 $0 ‐ Upgrade to 85% oil furnace furnace 1 number $1,144.00 $0 $1,040.00 $0 $1,040.00 $0 $1,123.20 $0 $1,164.80 $0 $1,435.20 $1,435 2521 ‐ VB on exterior ducts (9.36.3.2.(5)) 0 number $12.65 $0 $11.50 $0 $11.50 $0 $12.42 $0 $12.88 $0 $15.87 $0 ‐ Insulate exterior ducts (9.36.3.2.(3)) 0 number $5.50 $0 $5.00 $0 $5.00 $0 $5.40 $0 $5.60 $0 $6.90 $0 ‐ Install room dampers/controls (9.36.3.6.(4)) 0 number $88.00 $0 $80.00 $0 $80.00 $0 $86.40 $0 $89.60 $0 $110.40 $0Sub‐Total Heating Systems $286 120 $260 200 $0 0 $281 319 $291 401 $1,435 2521
DHW systems ‐ Upgrade to 62% gas DHW tank 1 number $482.90 $483 558 $439.00 $439 564 $491.68 $492 632 ‐ Upgrade to 90% electric DHW tank or 85% oil DHS tank 1 number $175.00 $175.00 277 $189.00 $189.00 245 $241.50 $242 173 ‐ Add DHW tank insulation (9.36.4.2.(2)) 0 number $49.50 $0 $45.00 $0 $45.00 $0 $48.60 $0 $50.40 $0 $62.10 $0 ‐ Install heat traps (9.36.4.3.(1)) 1 number $38.50 $39 66 $35.00 $35 71 $35.00 $35 58 $37.80 $38 60 $39.20 $39 51 $48.30 $48 17 ‐ Insulate 4 m of DHW piping (9.36.4.3.(2)) 1 number $55.00 $55 1 $50.00 $50 1 $50.00 $50 1 $54.00 $54 1 $56.00 $56 1 $69.00 $69 1 ‐ Insulate exterior DHW piping (9.36.4.3.(3)) 0 number $14.85 $0 $13.50 $0 $13.50 $0 $14.58 $0 $15.12 $0 $18.63 $0 ‐ Insulate DHW recirc piping (9.36.4.3.(4)) 0 number $16.50 $0 $15.00 $0 $15.00 $0 $16.20 $0 $16.80 $0 $20.70 $0Sub‐Total DHW Systems $576 625 $524 636 $260 336 $267 306 $587 684 $292 191
Bene
fit (kWhe
)
Unit C
ost
Cost ($
)
Bene
fit (kWhe
)
Unit C
ost
Cost ($
)
Bene
fit (kWhe
)
Unit C
ost
Cost ($
)
Bene
fit (kWhe
)
Zone 8 (>7000 HDD)
Multip
lier
(Area/Length/N
o.)
Units
Zone 4 (<3000 HDD)
Zone 5 (3000 to 3999 HDD)
Zone 6 (4000 to 4999 HDD)
Zone 7a (5000 to 5999HDD)
Zone 7b (6000 to 6999HDD)
Unit C
ost
Cost ($
)
Bene
fit (kWhe
)
Unit C
ost
Cost ($
)
Bene
fit (kWhe
)
Unit C
ost
Cost ($
)
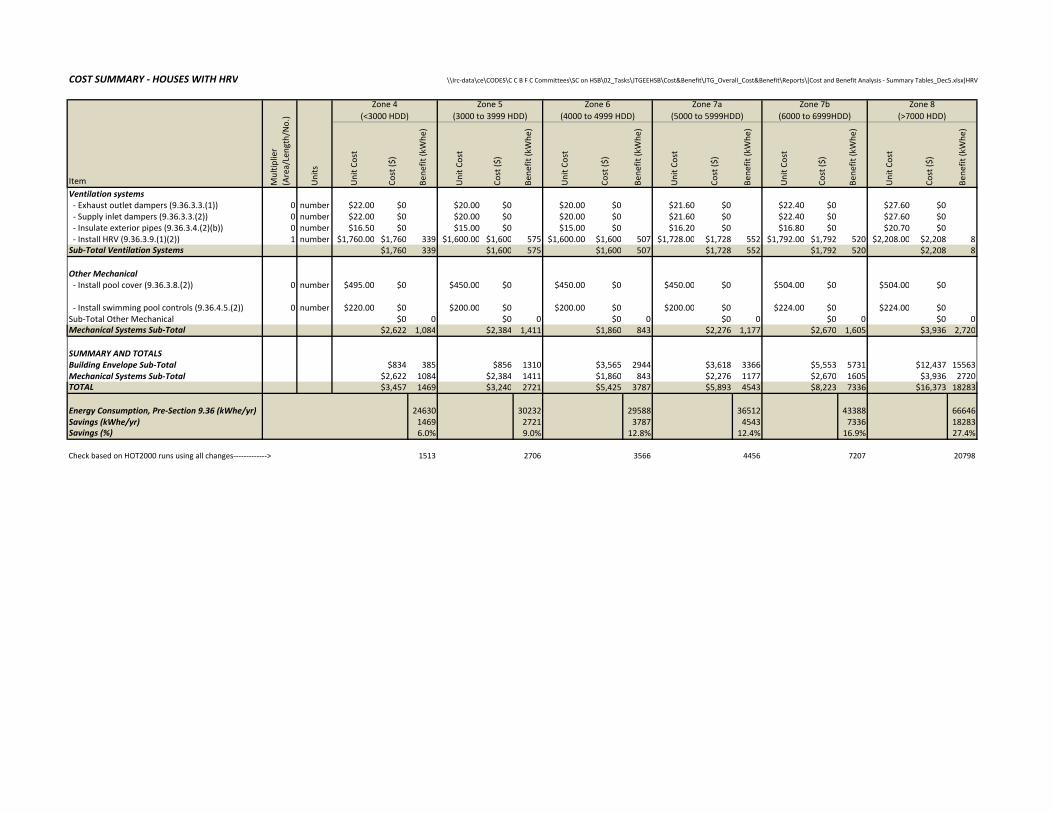
COST SUMMARY ‐ HOUSES WITH HRV \\Irc‐data\ce\CODES\C C B F C Committees\SC on HSB\02_Tasks\JTGEEHSB\Cost&Benefit\JTG_Overall_Cost&Benefit\Reports\[Cost and Benefit Analysis ‐ Summary Tables_Dec5.xlsx]HRV
Item Bene
fit (kWhe
)
Unit C
ost
Cost ($
)
Bene
fit (kWhe
)
Unit C
ost
Cost ($
)
Bene
fit (kWhe
)
Unit C
ost
Cost ($
)
Bene
fit (kWhe
)
Zone 8 (>7000 HDD)
Multip
lier
(Area/Length/N
o.)
Units
Zone 4 (<3000 HDD)
Zone 5 (3000 to 3999 HDD)
Zone 6 (4000 to 4999 HDD)
Zone 7a (5000 to 5999HDD)
Zone 7b (6000 to 6999HDD)
Unit C
ost
Cost ($
)
Bene
fit (kWhe
)
Unit C
ost
Cost ($
)
Bene
fit (kWhe
)
Unit C
ost
Cost ($
)
Ventilation systems ‐ Exhaust outlet dampers (9.36.3.3.(1)) 0 number $22.00 $0 $20.00 $0 $20.00 $0 $21.60 $0 $22.40 $0 $27.60 $0 ‐ Supply inlet dampers (9.36.3.3.(2)) 0 number $22.00 $0 $20.00 $0 $20.00 $0 $21.60 $0 $22.40 $0 $27.60 $0 ‐ Insulate exterior pipes (9.36.3.4.(2)(b)) 0 number $16.50 $0 $15.00 $0 $15.00 $0 $16.20 $0 $16.80 $0 $20.70 $0 ‐ Install HRV (9.36.3.9.(1)(2)) 1 number $1,760.00 $1,760 339 $1,600.00 $1,600 575 $1,600.00 $1,600 507 $1,728.00 $1,728 552 $1,792.00 $1,792 520 $2,208.00 $2,208 8Sub‐Total Ventilation Systems $1,760 339 $1,600 575 $1,600 507 $1,728 552 $1,792 520 $2,208 8
Other Mechanical ‐ Install pool cover (9.36.3.8.(2)) 0 number $495.00 $0 $450.00 $0 $450.00 $0 $450.00 $0 $504.00 $0 $504.00 $0
‐ Install swimming pool controls (9.36.4.5.(2)) 0 number $220.00 $0 $200.00 $0 $200.00 $0 $200.00 $0 $224.00 $0 $224.00 $0Sub‐Total Other Mechanical $0 0 $0 0 $0 0 $0 0 $0 0 $0 0Mechanical Systems Sub‐Total $2,622 1,084 $2,384 1,411 $1,860 843 $2,276 1,177 $2,670 1,605 $3,936 2,720
SUMMARY AND TOTALSBuilding Envelope Sub‐Total $834 385 $856 1310 $3,565 2944 $3,618 3366 $5,553 5731 $12,437 15563Mechanical Systems Sub‐Total $2,622 1084 $2,384 1411 $1,860 843 $2,276 1177 $2,670 1605 $3,936 2720TOTAL $3,457 1469 $3,240 2721 $5,425 3787 $5,893 4543 $8,223 7336 $16,373 18283
Energy Consumption, Pre‐Section 9.36 (kWhe/yr) 24630 30232 29588 36512 43388 66646Savings (kWhe/yr) 1469 2721 3787 4543 7336 18283Savings (%) 6.0% 9.0% 12.8% 12.4% 16.9% 27.4%
Check based on HOT2000 runs using all changes‐‐‐‐‐‐‐‐‐‐‐‐‐> 1513 2706 3566 4456 7207 20798
COST SUMMARY ‐ HOUSES WITHOUT HRV \\Irc‐data\ce\CODES\C C B F C Committees\SC on HSB\02_Tasks\JTGEEHSB\Cost&Benefit\JTG_Overall_Cost&Benefit\Reports\[Cost and Benefit Analysis ‐ Summary Tables_Dec5.xlsx]No HRV
ItemBuilding Envelope
Above‐Ground AssembliesCeilings Below Attics 78.83 m2 ‐$ $0 2.14$ $168 88 2.14$ $168 90 4.62$ $364 234 4.79$ $377 265 5.90$ $465 417Cathedral Ceilings & Flat Roofs 0 m2 0.30$ $0 0.27$ $0 0.27$ $0 0.30$ $0 0.31$ $0 0.38$ $0Walls 133.53 m2 ‐$ $0 3.39$ $452 559 3.39$ $452 573 3.66$ $489 787 15.69$ $2,095 2454 19.33$ $2,582 3934Floors Over Unheated Spaces 0 m2 0.30$ $0 0.27$ $0 0.27$ $0 0.30$ $0 0.31$ $0 0.38$ $0Rim Joists 18.2 m2 ‐$ $0 ‐$ $0 ‐$ $0 ‐$ $0 ‐$ $0 ‐$ $0Sub‐Total Above‐Ground Assemblies $0 0 $621 647 $621 663 $852 1021 $2,473 2719 $3,047 4351
Below‐Grade AssembliesFoundation Walls 87.77 m2 3.41$ $299 119 2.90$ $255 773 2.90$ $255 836 4.71$ $413 1342 4.89$ $429 1413 6.02$ $528 3323Unheated Floors ‐ Below frost line 76.49 m2 ‐$ $0 ‐$ $0 ‐$ $0 ‐$ $0 ‐$ $0 ‐$ $0 ‐ Above frost line & crawl spaces 0 m2 22.41$ $0 20.37$ $0 20.37$ $0 20.38$ $0 21.13$ $0 26.04$ $0 ‐ On permafrost 76.49 m2 $0 $0 $0 $0 $0 69.00$ $5,278 1216Slab‐On‐Grade 0 m2 22.41$ $0 20.37$ $0 20.37$ $0 22.00$ $0 22.81$ $0 28.11$ $0Sub‐Total Below‐Ground Assemblies $299 119 $255 773 $255 836 $413 1342 $429 1413 $5,806 4539
Windows, Doors and SkylightsWindows 30.95 m2 ‐$ $0 ‐$ $0 83.74$ $2,592 1203 90.44$ $2,799 1651 129.72$ $4,015 2187 159.84$ $4,947 3874Sub‐Total Windows, Doors and Skylights $0 0 $0 0 $2,592 1203 $2,799 1651 $4,015 2187 $4,947 3874
AirtightnessAirtightness $535 266 $267 184 $216 242 $0 0 $369 1321 $772 6469Sub‐Total Airtightness $535 266 $267 184 $216 242 $0 0 $369 1321 $772 6469Building Envelope Sub‐Total $834 385 $1,142 1604 $3,683 2944 $4,065 4014 $7,286 7640 $14,572 19233
Mechanical SystemsHeating Systems ‐ Upgrade to 92% gas furnace 1 number 286.00$ $286 120 260.00$ $260 200 260.00$ $0 280.80$ $281 319 291.20$ $291 401 358.80$ $0 ‐ Upgrade to 85% oil furnace furnace 1 number 1,144.00$ $0 1,040.00$ $0 1,040.00$ $0 1,123.20$ $0 1,164.80$ $0 1,435.20$ $1,435 2522 ‐ VB on exterior ducts (9.36.3.2.(5)) 0 number 12.65$ $0 11.50$ $0 11.50$ $0 12.42$ $0 12.88$ $0 15.87$ $0 ‐ Insulate exterior ducts (9.36.3.2.(3)) 0 number 5.50$ $0 5.00$ $0 5.00$ $0 5.40$ $0 5.60$ $0 6.90$ $0
‐ Install room dampers/controls (9.36.3.6.(4)) 0 number 88.00$ $0 80.00$ $0 80.00$ $0 86.40$ $0 89.60$ $0 110.40$ $0Sub‐Total Heating Systems $286 120 $260 200 $0 0 $281 319 $291 401 $1,435 2522
DHW Systems ‐ Upgrade to 62% gas DHW tank 1 number 482.90$ $483 558 439.00$ $439 564 491.68$ $492 632 ‐ Upgrade to 90% electric DHW tank or 85% oil DHS tank 1 number 175.00$ $175 277 175.00$ $175 245 175.00$ $175 173 ‐ Add DHW tank insulation (9.36.4.2.(2)) 0 number 49.50$ $0 45.00$ $0 45.00$ $0 48.60$ $0 50.40$ $0 62.10$ $0 ‐ Install heat traps (9.36.4.3.(1)) 1 number 38.50$ $39 66 35.00$ $35 71 35.00$ $35 58 37.80$ $38 60 39.20$ $39 51 48.30$ $48 17
‐ Insulate 4 m of DHW piping (9.36.4.3.(2)) 1 number 55.00$ $55 1 50.00$ $50 1 50.00$ $50 1 54.00$ $54 1 56.00$ $56 1 69.00$ $69 1
‐ Insulate exterior DHW piping (9.36.4.3.(3)) 0 number 14.85$ $0 13.50$ $0 13.50$ $0 14.58$ $0 15.12$ $0 18.63$ $0 ‐ Insulate DHW recirc piping (9.36.4.3.(4)) 0 number 16.50$ $0 15.00$ $0 15.00$ $0 16.20$ $0 16.80$ $0 20.70$ $0Sub‐Total DHW Systems $576 625 $524 636 $260 336 $267 306 $587 684 $292 191
Multip
lier
(Area/Length/N
o.)
Units
Zone 4 (<3000 HDD)
Zone 5 (3000 to 3999 HDD)
Zone 6 (4000 to 4999 HDD)
Bene
fit (kWhe
)
Bene
fit (kWhe
)
Zone 7b (6000 to 6999HDD)
Zone 8 (>7000 HDD)
Unit C
ost
Cost ($
)
Bene
fit (kWhe
)
Unit C
ost
Cost ($
)
Bene
fit (kWhe
)
Unit C
ost
Cost ($
)
Zone 7a (5000 to 5999HDD)
Unit C
ost
Cost ($
)
Bene
fit (kWhe
)
Unit C
ost
Cost ($
)
Bene
fit (kWhe
)
Unit C
ost
Cost ($
)
COST SUMMARY ‐ HOUSES WITHOUT HRV \\Irc‐data\ce\CODES\C C B F C Committees\SC on HSB\02_Tasks\JTGEEHSB\Cost&Benefit\JTG_Overall_Cost&Benefit\Reports\[Cost and Benefit Analysis ‐ Summary Tables_Dec5.xlsx]No HRV
Item Multip
lier
(Area/Length/N
o.)
Units
Zone 4 (<3000 HDD)
Zone 5 (3000 to 3999 HDD)
Zone 6 (4000 to 4999 HDD)
Bene
fit (kWhe
)
Bene
fit (kWhe
)
Zone 7b (6000 to 6999HDD)
Zone 8 (>7000 HDD)
Unit C
ost
Cost ($
)
Bene
fit (kWhe
)
Unit C
ost
Cost ($
)
Bene
fit (kWhe
)
Unit C
ost
Cost ($
)
Zone 7a (5000 to 5999HDD)
Unit C
ost
Cost ($
)
Bene
fit (kWhe
)
Unit C
ost
Cost ($
)
Bene
fit (kWhe
)
Unit C
ost
Cost ($
)
Ventilation systems ‐ Exhaust outlet dampers (9.36.3.3.(1)) 0 number 22.00$ $0 20.00$ $0 20.00$ $0 21.60$ $0 22.40$ $0 27.60$ $0 ‐ Supply inlet dampers (9.36.3.3.(2)) 0 number 22.00$ $0 20.00$ $0 20.00$ $0 21.60$ $0 22.40$ $0 27.60$ $0 ‐ Insulate exterior pipes (9.36.3.4.(2)(b)) 0 number 16.50$ $0 15.00$ $0 15.00$ $0 16.20$ $0 16.80$ $0 20.70$ $0 ‐ Install HRV (9.36.3.9.(1)(2)) 0 number 1,760.00$ $0 1,600.00$ $0 1,600.00$ $0 1,728.00$ $0 1,792.00$ $0 2,208.00$ $0Sub‐Total Ventilation Systems $0 0 $0 0 $0 0 $0 0 $0 0 $0 0
Other Mechanical ‐ Install pool cover (9.36.3.8.(2)) 0 number 495.00$ $0 450.00$ $0 450.00$ $0 450.00$ $0 504.00$ $0 504.00$ $0
‐ Install swimming pool controls (9.36.4.5.(2)) 0 number 220.00$ $0 200.00$ $0 200.00$ $0 200.00$ $0 224.00$ $0 224.00$ $0Sub‐Total Other Mechanical $0 0 $0 0 $0 0 $0 0 $0 0 $0 0Mechanical Systems Sub‐Total $862 745 $784 836 $260 336 $548 625 $878 1085 $1,728 2713
SUMMARY AND TOTALSBuilding Envelope Sub‐Total $834 385 $1,142 1604 $3,683 2944 $4,065 4014 $7,286 7640 $14,572 19233Mechanical Systems Sub‐Total $862 745 $784 836 $260 336 $548 625 $878 1085 $1,728 2713TOTAL $1,697 1130 $1,926 2440 $3,943 3280 $4,613 4639 $8,164 8725 $16,299 21946Energy Consumption, Pre‐Section 9.36 (kWhe/yr) 24630 30232 29588 36512 43388 66646Savings (kWhe/yr) 1130 2440 3280 4639 8725 21946Savings (%) 4.6% 8.1% 11.1% 12.7% 20.1% 32.9%
Check based on HOT2000 runs using all changes‐‐‐‐‐‐‐‐‐‐‐‐‐> 1151 2418 3266 4550 8567 23011