Embed Size (px)
Citation preview
Cost Analysis of The Code for Sustainable HomesFinal Report
www.communities.gov.ukcommunity, opportunity, prosperity

Cost Analysis of The Code for Sustainable HomesFinal Report
July 2008Department for Communities and Local Government
Communities and Local GovernmentEland HouseBressenden PlaceLondon SW1E 5DUTelephone: 020 7944 4400Website: www.communities.gov.uk
© Crown Copyright, 2008
Copyright in the typographical arrangement rests with the Crown.
This publication, excluding logos, may be reproduced free of charge in any format or medium for research, private study or for internal circulation within an organisation. This is subject to it being reproduced accurately and not used in a misleading context. The material must be acknowledged as Crown copyright and the title of the publication specified.
Any other use of the contents of this publication would require a copyright licence. Please apply for a Click-Use Licence for core material at www.opsi.gov.uk/click-use/system/online/pLogin.asp, or by writing to the Office of Public Sector Information, Information Policy Team, St Clements House, 2-16 Colegate, Norwich, NR3 1BQ. Fax: 01603 723000 or email: [email protected]
If you require this publication in an alternative format please email [email protected]
Communities and Local Government PublicationsPO Box 236WetherbyWest YorkshireLS23 7NBTel: 08701 226 236Fax: 08701 226 237Textphone: 08701 207 405Email: [email protected] online via the Communities and Local Government website: www.communities.gov.uk
75%July 2008
Product Code: 07SB04958
Contents 3
Contents
Chapter 1 Introduction 5
1.1 Limitations of previous work 5
1.2 Aims 5
1.3 Structure of this report 6
1.4 Approach to cost estimation 6
Chapter 2 Revisions to previous cost estimates in light of finalised technical guidance 10
2.1 Areas of change in the new technical guidance 10
2.2 Dwelling emission rate 11
2.3 Cycle storage 17
2.4 Internal potable water consumption 19
2.5 Flood risk 20
2.6 Environmental impact of materials 21
2.7 Sound 24
2.8 Summary of costs for Code credits 24
Chapter 3 Development scenarios against which costs have been considered 29
Chapter 4 Estimated costs 31
Chapter 5 Potential for cost reduction 34
Chapter 6 Conclusions 40

4 Cost Analysis of The Code for Sustainable Homes
Chapter 1. Introduction 5
Chapter 1
Introduction
This report presents the findings of research to update and enhance existing cost benchmarks for achieving different performance levels under the Code for Sustainable Homes1 (the Code). This work builds on an initial cost analysis that was completed prior to the publication of the Code technical guidance document (initially published in April 2007 and revised in September). As a result the initial cost estimates made assumptions about the method for achieving some performance standards based on the summary guidance published in December 2006 and pre-existing Ecohomes standards.
This study was commissioned to refine the cost analysis of the Code in light of the publication of the finalised technical guidance together with other supporting information (e.g. the partial Green Guide to Specification).
1.1 Limitations of previous work
The cost analysis of the Code performed early 2007 required updating because of the changes to the detail of credit requirements arising from the publication of the Code technical guidance (with associated calculation tools) and the release of a revised Green Guide to Specification2. The inclusion within the technical guidance of a formal definition of Zero Carbon housing also enables the costs associated with Code level 6 to be estimated.
In addition, the initial cost estimates to not fully take into account the potential variation in approaches to the Code and the associated costs in different forms of development location (e.g. in areas of high flood risk or with high, medium or low levels of ecological value).
1.2 Aims
This research seeks to:
• UpdatethecostanalysisundertakenbyCyrilSweettforEnglishPartnershipsandtheHousing Corporation in light of the finalised technical guidance on the Code.
1 ‘A cost review of the Code for Sustainable Homes’, English Partnerships and the Housing Corporation, February 2007.2 Although some specification information, notably windows, is still outstanding.
6 Cost Analysis of The Code for Sustainable Homes
• Providegreaterconfidenceintheanalysisofthecostimplicationsofachievingtheenergy standards in Code levels 4, 5 and 6.
• ProvideanalysisoftheoverallcostimplicationsofachievingCodelevel6.
• AssessthepotentialforreductionsinthecostofmeetingdifferentCodelevelsarisingfrom increased uptake of the key technologies.
• ProvideoverarchingcostinformationonachievingeachleveloftheCodetogetherwith a semi-quantitative evaluation of likely trends in cost.
While a few technical matters are still to be resolved, sufficient data is now available to allow robust cost analysis of each Code level for four different house types under different development scenarios, thereby providing reasonable upper and lower bound estimates.
1.3 Structure of this report
The subsequent sections of this report set out:
• RevisionstoCyrilSweett’sinitialcostanalysisforspecificcreditsinlightofthefinalisedtechnical guidance on the Code
• Therangeofdevelopmentscenariosagainstwhichcostshavebeenconsidered(because of the large number of potential development scenarios the analysis is based on a selected number of scenarios believed to illustrate upper and lower cost ranges).
• EstimatedcostsofcompliancewitheachoftheCodelevelsforeachhousetypeunderthe different development scenarios and the savings in terms of utility bills, carbon emissions and consumption of potable water.
• Analysisofthelikelypotentialforfuturecostreductionsarisingfromwidespreaduptake of the Code.
Whilst every effort has been made to develop accurate and representative cost analyses, it is important to remember that these are cost estimates and are not definitive. The actual costs incurred will depend on numerous factors including the developer, their supply chain and circumstances of any specific site (e.g. location, housing mix, etc).
In addition, it is important to remember that there is currently very little established technical or commercial information for some of the performance standards required for the higher Code levels.
1.4 Approach to cost estimation
The implications of meeting each Code level are presented in comparison to the costs of a baseline home (e.g. a Building Regulations compliant home). Costs are presented
Chapter 1. Introduction 7
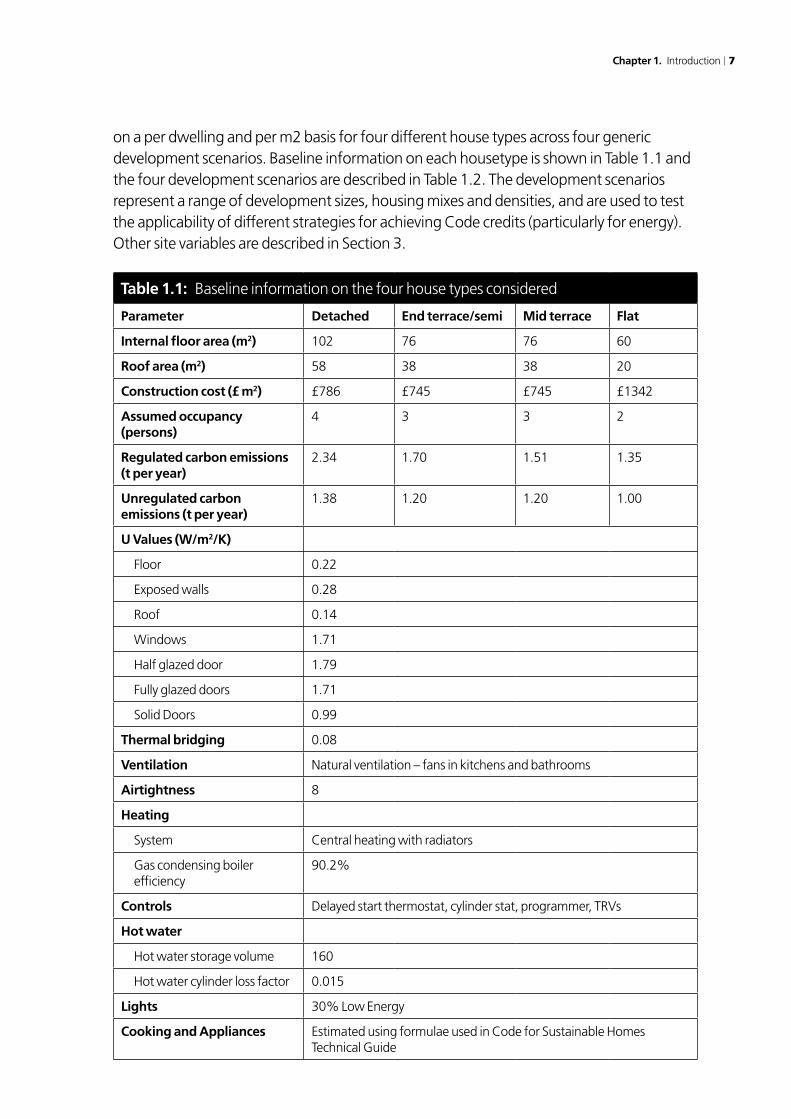
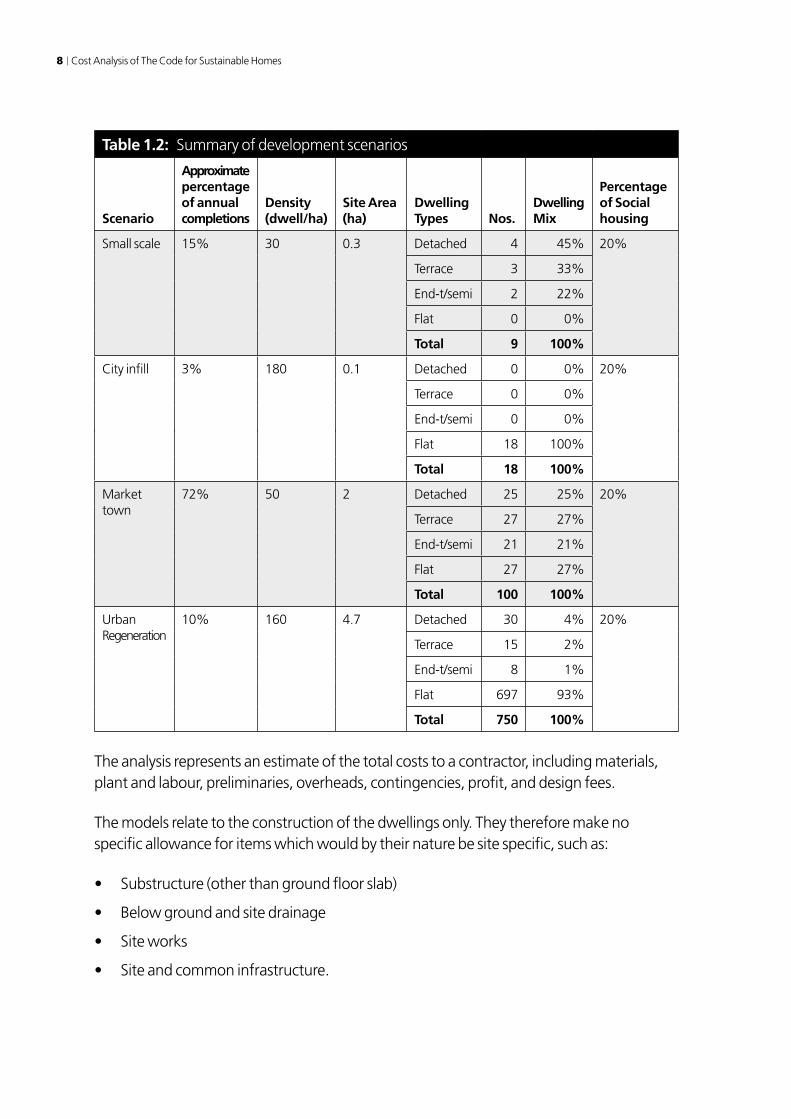
on a per dwelling and per m2 basis for four different house types across four generic development scenarios. Baseline information on each housetype is shown in Table 1.1 and the four development scenarios are described in Table 1.2. The development scenarios represent a range of development sizes, housing mixes and densities, and are used to test the applicability of different strategies for achieving Code credits (particularly for energy). Other site variables are described in Section 3.
Table 1.1: Baseline information on the four house types considered
Parameter Detached End terrace/semi Mid terrace Flat
Internal floor area (m2) 102 76 76 60
Roof area (m2) 58 38 38 20
Construction cost (£ m2) £786 £745 £745 £1342
Assumed occupancy (persons)
4 3 3 2
Regulated carbon emissions (t per year)
2.34 1.70 1.51 1.35
Unregulated carbon emissions (t per year)
1.38 1.20 1.20 1.00
U Values (W/m2/K)
Floor 0.22
Exposed walls 0.28
Roof 0.14
Windows 1.71
Half glazed door 1.79
Fully glazed doors 1.71
Solid Doors 0.99
Thermal bridging 0.08
Ventilation Natural ventilation – fans in kitchens and bathrooms
Airtightness 8
Heating
System Central heating with radiators
Gas condensing boiler efficiency
90.2%
Controls Delayed start thermostat, cylinder stat, programmer, TRVs
Hot water
Hot water storage volume 160
Hot water cylinder loss factor 0.015
Lights 30% Low Energy
Cooking and Appliances Estimated using formulae used in Code for Sustainable Homes Technical Guide
8 Cost Analysis of The Code for Sustainable Homes
Table 1.2: Summary of development scenarios
Scenario
Approximate percentage of annual completions
Density (dwell/ha)
Site Area (ha)
Dwelling Types Nos.
Dwelling Mix
Percentage of Social housing
Small scale 15% 30 0.3 Detached 4 45% 20%
Terrace 3 33%
End-t/semi 2 22%
Flat 0 0%
Total 9 100%
City infill 3% 180 0.1 Detached 0 0% 20%
Terrace 0 0%
End-t/semi 0 0%
Flat 18 100%
Total 18 100%
Market town
72% 50 2 Detached 25 25% 20%
Terrace 27 27%
End-t/semi 21 21%
Flat 27 27%
Total 100 100%
Urban Regeneration
10% 160 4.7 Detached 30 4% 20%
Terrace 15 2%
End-t/semi 8 1%
Flat 697 93%
Total 750 100%
The analysis represents an estimate of the total costs to a contractor, including materials, plant and labour, preliminaries, overheads, contingencies, profit, and design fees.
The models relate to the construction of the dwellings only. They therefore make no specific allowance for items which would by their nature be site specific, such as:
• Substructure(otherthangroundfloorslab)
• Belowgroundandsitedrainage
• Siteworks
• Siteandcommoninfrastructure.
Chapter 1. Introduction 9
It should be noted that compliance with higher levels of the Code may require the introduction or re-specification of common infrastructure, such as use of Combined Heat and Power (CHP) systems and/or sustainable drainage. In these instances, the assessment identifies the estimated net increase in cost on a cost per dwelling basis. The base dwelling costs themselves, however, do not include allowance for infrastructure beyond the demise of the property.
The costings also exclude the following:
• Siteacquisitioncosts
• Professionalfees,otherthandesignfeesincurredbythecontractor
• Partywallawardsandanyworkinconnectiontherewith
• BuildingControlandplanningfees
• AnypaymentswhichmayberequiredunderSection106oftheTownandCountryPlanning Act
• Remediationofsitecontamination
• Surveyworks
• Legalfees
• Financecosts
• Loosefurnitureandfittings,suchascurtains,blinds,shelving,furnitureandkitchenappliances
• Highwaysworks
• ValueAddedTax.
The costings are based on Q4 2007 price levels for homes built by a housing developer with a trading turnover of around 5,000 to 10,000 dwellings per annum. It is appreciated that individual building contracts may vary in size from developments of small sites (around 12 units) to much larger sites accommodating 100 units or more. The estimated costs in this report are assumed to apply equally to these different scenarios on the basis that the type of contractor used would be similar, as would the design and specification of the individual dwellings.
Wherever possible, the costs in this report have been based upon quotations received from contractors and suppliers, with an adjustment made to reflect bulk purchase arrangements that might be applicable for projects of the sizes described. The size and nature of bulk purchase discounts were estimated following discussions with contractors and suppliers.

10 Cost Analysis of The Code for Sustainable Homes
Chapter 2
Revisions to previous cost estimates in light of finalised technical guidance
Cyril Sweett’s initial cost analysis of each Code credit area is detailed in ‘A cost review of the Code for Sustainable Homes’3 and the basis of these costs is not repeated here in detail. Rather, key areas where the detail of published technical guidance document suggests that the initial costing is no longer appropriate are discussed together with proposed updated cost figures. This revised analysis is based on the guidance published in September 2007.
2.1 Areas of change in the new technical guidance
The finalised technical guidance on the Code includes several areas of change from the approaches proposed previously (or those inferred from EcoHomes where detailed information was not available). The most significant overall change between the Code and EcoHomes is that many of the standards in the Code are now applicable to each dwelling in isolation instead of being based on the minimum or average performance of the development as a whole. This impacts compliance costs both positively and negatively. In some instances it means that houses with higher performance standards (e.g. better daylight levels) are not disadvantaged by the poor performance of other homes on a development. However, it also requires each individual home to adopt a measure that if it is to achieve the associated credit. This prevents a developer from providing enhancements (e.g. cycle storage) only to those homes where it is easiest or most cost effective.
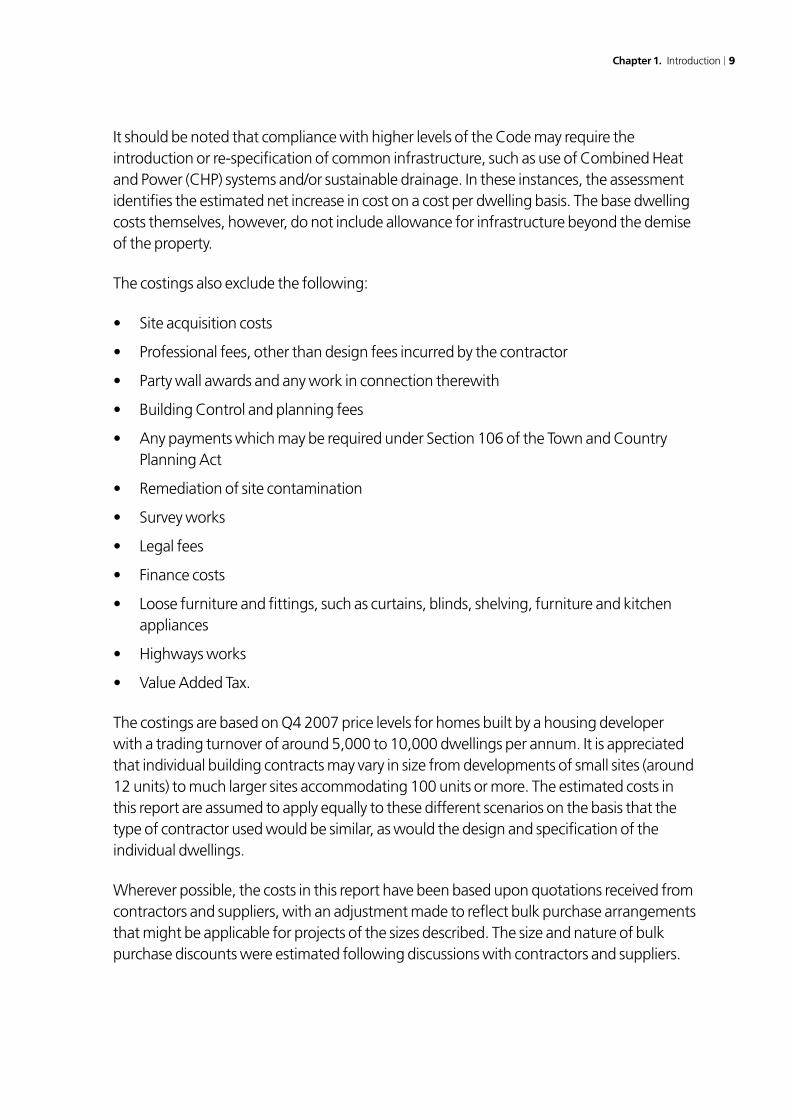
Some changes to the technical guidance have only minor cost impacts (or where these are difficult to quantify) which depend either on the site’s housing mix (e.g. building foot print: floor area ratio) or the site’s location (presence of a Local Authority kerbside recyclables collection scheme). The key changes in the updated technical guidance are detailed in Table 2.1, changes which are considered to have significant and quantifiable cost impact have been highlighted and are analysed in further detail in the remainder of this section.
3 English Partnerships and the Housing Corporation, February 2007.
Chapter 2. Revisions to previous cost estimates in light of finalised technical guidance 11
Table 2.1: Credit areas where the Code Technical Guide may have a cost impact (relative to previous estimates pre April 2007)
Area of change Details of change
Potential impact on
previous cost analysis?
Dwelling Emission Rate
Each individual dwelling must achieve the required improvement on 2006 building regulations Part L1a. A definition of the requirements for a Zero Carbon homes has been included in the technical guidance thereby enabling analysis of Code Level 6.
✔
Cycle storage Change to the number of cycles to be stored. Credits are now allocated on the number of cycle storage spaces per dwelling
✔
Internal Water New Water credit calculation tool with revised calculation method ✔
Flood risk Technical Guidance has changed to allow the allocation of credits for flood resilient construction
✔
Environmental impact of materials
Changes to BRE Green Guide to Housing specification and BRE credit calculator tool
✔
Household waste
Credits are no longer allocated when a site is located within a local authority kerbside recycling area
✘
Sound Recognition of the Robust Details scheme and increase in sound performance for higher credit score
✔
Lifetime homes Updated cost information is being made available by the Housing Corporation
✔
Security Credits are now allocated when advice is sough from an Architectural Liaison Officer or Crime Prevention Design Advisor. A Secure by Design Credit is no longer required and credits are not awarded for the use of LPS or PAS standard products
✘
Building footprint
Measurement of dwelling density has changed from total external building footprint to Net internal ground floor area
✘
In addition to changes to the technical standards shown in Table 2.1, the finalised technical guidance includes slightly different weighting factors for the credit categories, this may have some minor impact on the costs associated with meeting individual performance standards (because achieving the same performance standards results in a different weighted value being achieved), although this is not believed to be a significant influence on overall costs of achieving each Code level. The analysis presented in Section 4 of this report utilises the weighting factors published in the September 2007 technical guidance.
2.2 Dwelling emission rate
Cyril Sweett’s initial cost analysis focused on the development of cost effective solutions to Code level 3 and (to a lesser extent Code level 4). Although options for achieving Code level 5 were identified these did not necessarily represent an optimal combination of measures (for example the analysis did not include the use of biomass CHP or other
12 Cost Analysis of The Code for Sustainable Homes
emerging technologies). In addition, at the time of the initial analysis no definition of a Zero Carbon home was available and as a result it was not possible to assess the different approaches to achieving Code level 6 for energy.
Since completion of the initial cost analysis, further research and modelling of options for achieving the energy requirements of Code levels 3, 4, 5 and 6 has been undertaken based on the most current technical guidance and a broader range of carbon saving technologies. Full detail of the modelling process, data and analysis is contained within the separate publication4 and only the key findings are presented here.
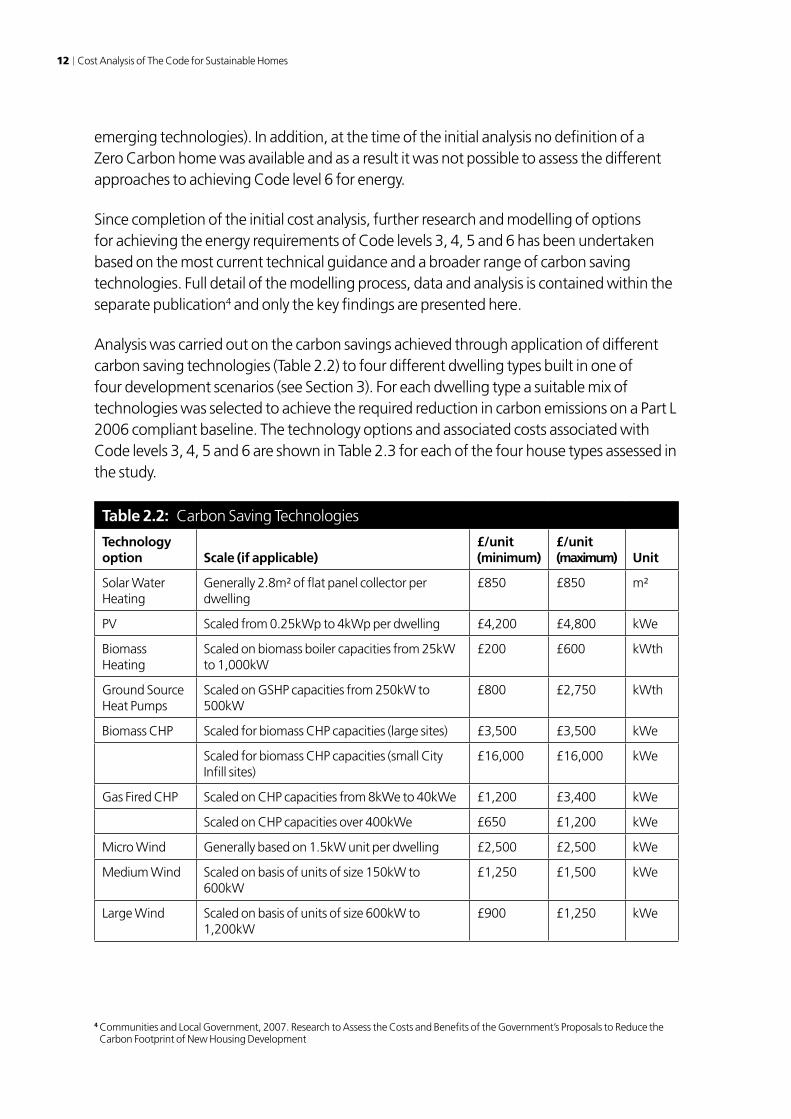
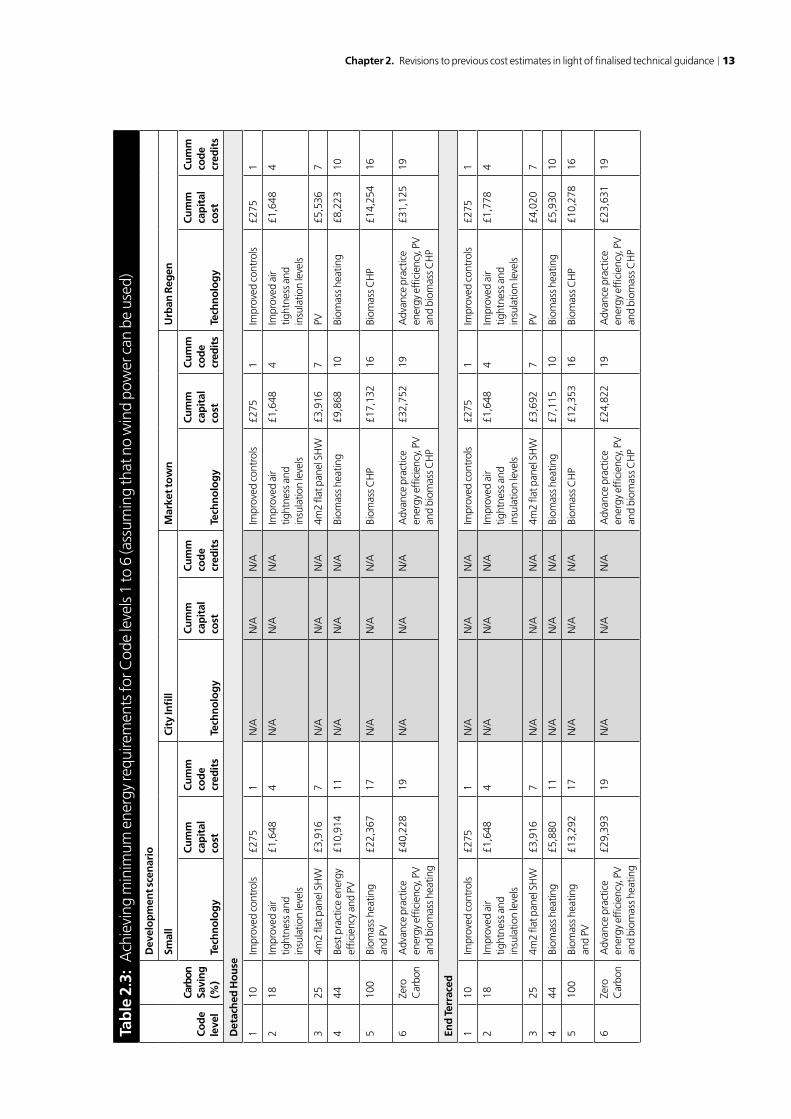
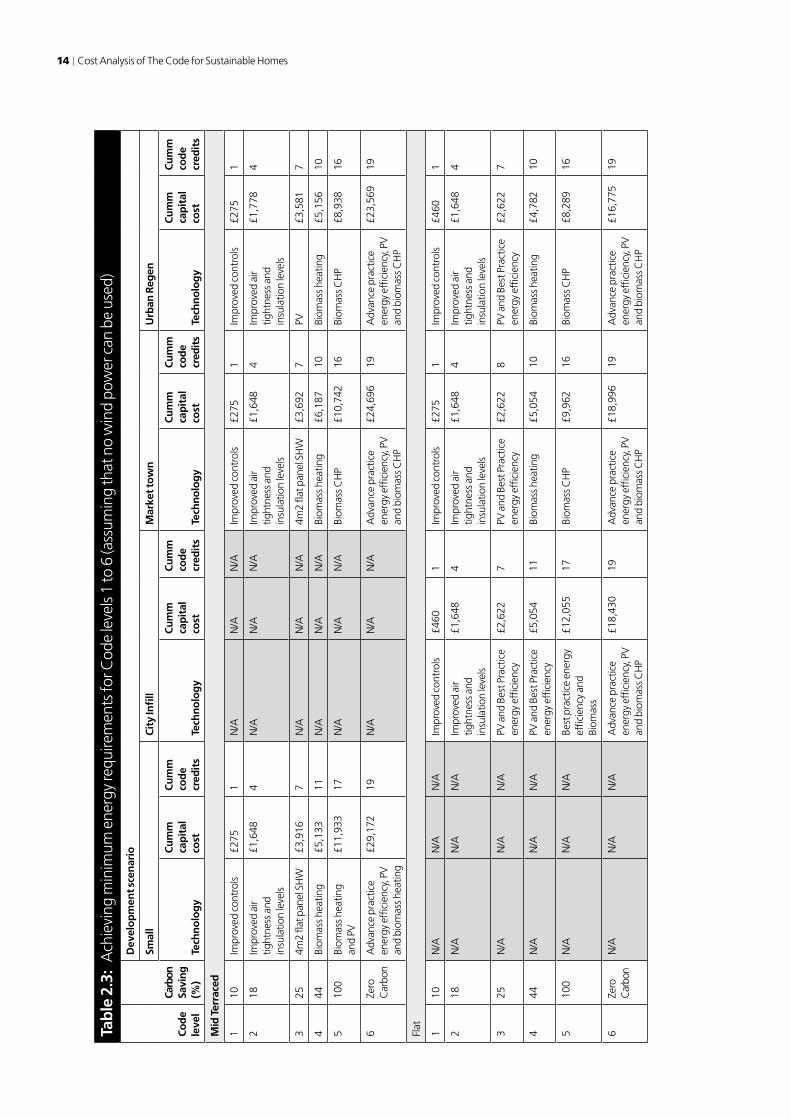
Analysis was carried out on the carbon savings achieved through application of different carbon saving technologies (Table 2.2) to four different dwelling types built in one of four development scenarios (see Section 3). For each dwelling type a suitable mix of technologies was selected to achieve the required reduction in carbon emissions on a Part L 2006 compliant baseline. The technology options and associated costs associated with Code levels 3, 4, 5 and 6 are shown in Table 2.3 for each of the four house types assessed in the study.
Table 2.2: Carbon Saving Technologies
Technology option Scale (if applicable)
£/unit (minimum)
£/unit (maximum) Unit
Solar Water Heating
Generally 2.8m² of flat panel collector per dwelling
£850 £850 m²
PV Scaled from 0.25kWp to 4kWp per dwelling £4,200 £4,800 kWe
Biomass Heating
Scaled on biomass boiler capacities from 25kW to 1,000kW
£200 £600 kWth
Ground Source Heat Pumps
Scaled on GSHP capacities from 250kW to 500kW
£800 £2,750 kWth
Biomass CHP Scaled for biomass CHP capacities (large sites) £3,500 £3,500 kWe
Scaled for biomass CHP capacities (small City Infill sites)
£16,000 £16,000 kWe
Gas Fired CHP Scaled on CHP capacities from 8kWe to 40kWe £1,200 £3,400 kWe
Scaled on CHP capacities over 400kWe £650 £1,200 kWe
Micro Wind Generally based on 1.5kW unit per dwelling £2,500 £2,500 kWe
Medium Wind Scaled on basis of units of size 150kW to 600kW
£1,250 £1,500 kWe
Large Wind Scaled on basis of units of size 600kW to 1,200kW
£900 £1,250 kWe
4 Communities and Local Government, 2007. Research to Assess the Costs and Benefits of the Government’s Proposals to Reduce the Carbon Footprint of New Housing Development
Chapter 2. Revisions to previous cost estimates in light of finalised technical guidance 13
Tab
le 2
.3:
Ach
ievi
ng m
inim
um e
nerg
y re
quire
men
ts fo
r Cod
e le
vels
1 to
6 (a
ssum
ing
that
no
win
d po
wer
can
be
used
)
Co
de
leve
l
Carb
on
Savi
ng
(%)
Dev
elo
pm
ent s
cen
ario
Smal
lC
ity
Infi
llM
arke
t to
wn
Urb
an R
egen
Tech
no
log
y
Cu
mm
ca
pit
al
cost
Cu
mm
co
de
cred
its
Tech
no
log
y
Cu
mm
ca
pit
al
cost
Cu
mm
co
de
cred
its
Tech
no
log
y
Cu
mm
ca
pit
al
cost
Cu
mm
co
de
cred
its
Tech
no
log
y
Cu
mm
ca
pit
al
cost
Cu
mm
co
de
cred
its
Det
ach
ed H
ou
se
110
Impr
oved
con
trol
s £2
751
N/A
N/A
N/A
Impr
oved
con
trol
s £2
751
Impr
oved
con
trol
s £2
751
218
Impr
oved
air
tight
ness
and
in
sula
tion
leve
ls
£1,6
484
N/A
N/A
N/A
Impr
oved
air
tight
ness
and
in
sula
tion
leve
ls
£1,6
484
Impr
oved
air
tight
ness
and
in
sula
tion
leve
ls
£1,6
484
325
4m2
flat p
anel
SH
W£3
,916
7N
/AN
/AN
/A4m
2 fla
t pan
el S
HW
£3,9
167
PV£5
,536
7
444
Best
pra
ctic
e en
ergy
ef
ficie
ncy
and
PV£1
0,91
411
N/A
N/A
N/A
Biom
ass h
eatin
g£9
,868
10Bi
omas
s hea
ting
£8,2
2310
510
0Bi
omas
s hea
ting
and
PV£2
2,36
717
N/A
N/A
N/A
Biom
ass C
HP
£17,
132
16Bi
omas
s CH
P£1
4,25
416
6Ze
ro
Car
bon
Adv
ance
pra
ctic
e en
ergy
effi
cien
cy, P
V
and
biom
ass h
eatin
g
£40,
228
19N
/AN
/AN
/AA
dvan
ce p
ract
ice
ener
gy e
ffici
ency
, PV
an
d bi
omas
s CH
P
£32,
752
19A
dvan
ce p
ract
ice
ener
gy e
ffici
ency
, PV
an
d bi
omas
s CH
P
£31,
125
19
End
Ter
race
d
110
Impr
oved
con
trol
s £2
751
N/A
N/A
N/A
Impr
oved
con
trol
s £2
751
Impr
oved
con
trol
s £2
751
218
Impr
oved
air
tight
ness
and
in
sula
tion
leve
ls
£1,6
484
N/A
N/A
N/A
Impr
oved
air
tight
ness
and
in
sula
tion
leve
ls
£1,6
484
Impr
oved
air
tight
ness
and
in
sula
tion
leve
ls
£1,7
784
325
4m2
flat p
anel
SH
W£3
,916
7N
/AN
/AN
/A4m
2 fla
t pan
el S
HW
£3,6
927
PV£4
,020
7
444
Biom
ass h
eatin
g£5
,880
11N
/AN
/AN
/ABi
omas
s hea
ting
£7,1
1510
Biom
ass h
eatin
g£5
,930
10
510
0Bi
omas
s hea
ting
and
PV£1
3,29
217
N/A
N/A
N/A
Biom
ass C
HP
£12,
353
16Bi
omas
s CH
P£1
0,27
816
6Ze
ro
Car
bon
Adv
ance
pra
ctic
e en
ergy
effi
cien
cy, P
V
and
biom
ass h
eatin
g
£29,
393
19N
/AN
/AN
/AA
dvan
ce p
ract
ice
ener
gy e
ffici
ency
, PV
an
d bi
omas
s CH
P
£24,
822
19A
dvan
ce p
ract
ice
ener
gy e
ffici
ency
, PV
an
d bi
omas
s CH
P
£23,
631
19
14 Cost Analysis of The Code for Sustainable Homes
Tab
le 2
.3:
Ach
ievi
ng m
inim
um e
nerg
y re
quire
men
ts fo
r Cod
e le
vels
1 to
6 (a
ssum
ing
that
no
win
d po
wer
can
be
used
)
Co
de
leve
l
Carb
on
Savi
ng
(%)
Dev
elo
pm
ent s
cen
ario
Smal
lC
ity
Infi
llM
arke
t to
wn
Urb
an R
egen
Tech
no
log
y
Cu
mm
ca
pit
al
cost
Cu
mm
co
de
cred
its
Tech
no
log
y
Cu
mm
ca
pit
al
cost
Cu
mm
co
de
cred
its
Tech
no
log
y
Cu
mm
ca
pit
al
cost
Cu
mm
co
de
cred
its
Tech
no
log
y
Cu
mm
ca
pit
al
cost
Cu
mm
co
de
cred
its
Mid
Ter
race
d
110
Impr
oved
con
trol
s £2
751
N/A
N/A
N/A
Impr
oved
con
trol
s £2
751
Impr
oved
con
trol
s £2
751
218
Impr
oved
air
tight
ness
and
in
sula
tion
leve
ls
£1,6
484
N/A
N/A
N/A
Impr
oved
air
tight
ness
and
in
sula
tion
leve
ls
£1,6
484
Impr
oved
air
tight
ness
and
in
sula
tion
leve
ls
£1,7
784
325
4m2
flat p
anel
SH
W£3
,916
7N
/AN
/AN
/A4m
2 fla
t pan
el S
HW
£3,6
927
PV£3
,581
7
444
Biom
ass h
eatin
g£5
,133
11N
/AN
/AN
/ABi
omas
s hea
ting
£6,1
8710
Biom
ass h
eatin
g£5
,156
10
510
0Bi
omas
s hea
ting
and
PV£1
1,93
317
N/A
N/A
N/A
Biom
ass C
HP
£10,
742
16Bi
omas
s CH
P£8
,938
16
6Ze
ro
Car
bon
Adv
ance
pra
ctic
e en
ergy
effi
cien
cy, P
V
and
biom
ass h
eatin
g
£29,
172
19N
/AN
/AN
/AA
dvan
ce p
ract
ice
ener
gy e
ffici
ency
, PV
an
d bi
omas
s CH
P
£24,
696
19A
dvan
ce p
ract
ice
ener
gy e
ffici
ency
, PV
an
d bi
omas
s CH
P
£23,
569
19
Flat
110
N/A
N/A
N/A
Impr
oved
con
trol
s £4
601
Impr
oved
con
trol
s£2
751
Impr
oved
con
trol
s £4
601
218
N/A
N/A
N/A
Impr
oved
air
tight
ness
and
in
sula
tion
leve
ls
£1,6
484
Impr
oved
air
tight
ness
and
in
sula
tion
leve
ls
£1,6
484
Impr
oved
air
tight
ness
and
in
sula
tion
leve
ls
£1,6
484
325
N/A
N/A
N/A
PV a
nd B
est P
ract
ice
ener
gy e
ffici
ency
£2,6
227
PV a
nd B
est P
ract
ice
ener
gy e
ffici
ency
£2,6
228
PV a
nd B
est P
ract
ice
ener
gy e
ffici
ency
£2,6
227
444
N/A
N/A
N/A
PV a
nd B
est P
ract
ice
ener
gy e
ffici
ency
£5,0
5411
Biom
ass h
eatin
g£5
,054
10Bi
omas
s hea
ting
£4,7
8210
510
0N
/AN
/AN
/ABe
st p
ract
ice
ener
gy
effic
ienc
y an
d Bi
omas
s
£12,
055
17Bi
omas
s CH
P£9
,962
16Bi
omas
s CH
P£8
,289
16
6Ze
ro
Car
bon
N/A
N/A
N/A
Adv
ance
pra
ctic
e en
ergy
effi
cien
cy, P
V
and
biom
ass C
HP
£18,
430
19A
dvan
ce p
ract
ice
ener
gy e
ffici
ency
, PV
an
d bi
omas
s CH
P
£18,
996
19A
dvan
ce p
ract
ice
ener
gy e
ffici
ency
, PV
an
d bi
omas
s CH
P
£16,
775
19
Chapter 2. Revisions to previous cost estimates in light of finalised technical guidance 15
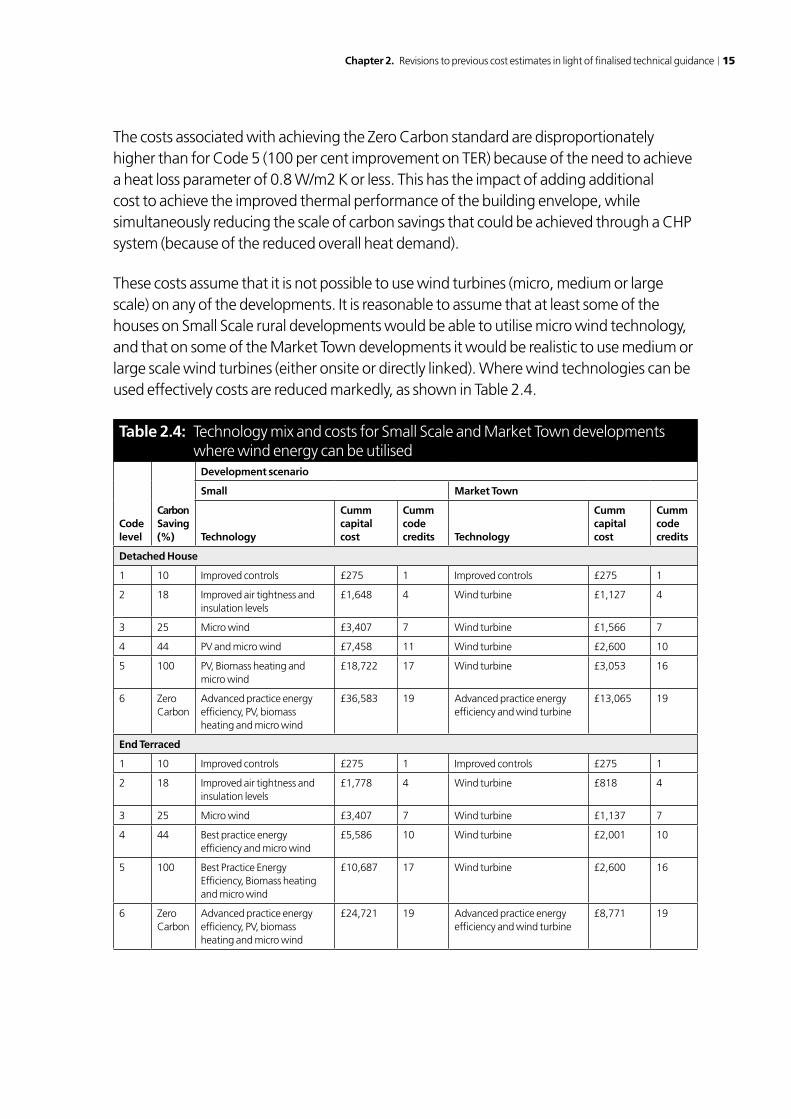
The costs associated with achieving the Zero Carbon standard are disproportionately higher than for Code 5 (100 per cent improvement on TER) because of the need to achieve a heat loss parameter of 0.8 W/m2 K or less. This has the impact of adding additional cost to achieve the improved thermal performance of the building envelope, while simultaneously reducing the scale of carbon savings that could be achieved through a CHP system (because of the reduced overall heat demand).
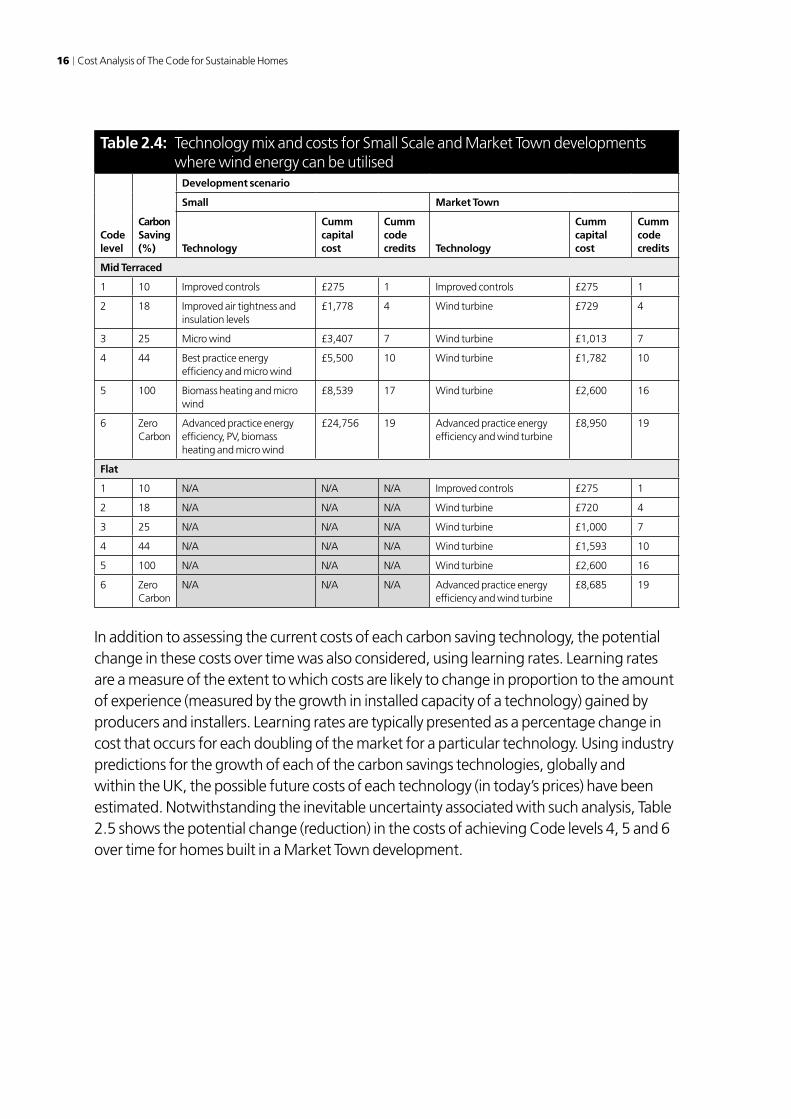
These costs assume that it is not possible to use wind turbines (micro, medium or large scale) on any of the developments. It is reasonable to assume that at least some of the houses on Small Scale rural developments would be able to utilise micro wind technology, and that on some of the Market Town developments it would be realistic to use medium or large scale wind turbines (either onsite or directly linked). Where wind technologies can be used effectively costs are reduced markedly, as shown in Table 2.4.
Table 2.4: Technology mix and costs for Small Scale and Market Town developments where wind energy can be utilised
Code level
Carbon Saving (%)
Development scenario
Small Market Town
Technology
Cumm capital cost
Cumm code credits Technology
Cumm capital cost
Cumm code credits
Detached House
1 10 Improved controls £275 1 Improved controls £275 1
2 18 Improved air tightness and insulation levels
£1,648 4 Wind turbine £1,127 4
3 25 Micro wind £3,407 7 Wind turbine £1,566 7
4 44 PV and micro wind £7,458 11 Wind turbine £2,600 10
5 100 PV, Biomass heating and micro wind
£18,722 17 Wind turbine £3,053 16
6 Zero Carbon
Advanced practice energy efficiency, PV, biomass heating and micro wind
£36,583 19 Advanced practice energy efficiency and wind turbine
£13,065 19
End Terraced
1 10 Improved controls £275 1 Improved controls £275 1
2 18 Improved air tightness and insulation levels
£1,778 4 Wind turbine £818 4
3 25 Micro wind £3,407 7 Wind turbine £1,137 7
4 44 Best practice energy efficiency and micro wind
£5,586 10 Wind turbine £2,001 10
5 100 Best Practice Energy Efficiency, Biomass heating and micro wind
£10,687 17 Wind turbine £2,600 16
6 Zero Carbon
Advanced practice energy efficiency, PV, biomass heating and micro wind
£24,721 19 Advanced practice energy efficiency and wind turbine
£8,771 19
16 Cost Analysis of The Code for Sustainable Homes
Table 2.4: Technology mix and costs for Small Scale and Market Town developments where wind energy can be utilised
Code level
Carbon Saving (%)
Development scenario
Small Market Town
Technology
Cumm capital cost
Cumm code credits Technology
Cumm capital cost
Cumm code credits
Mid Terraced
1 10 Improved controls £275 1 Improved controls £275 1
2 18 Improved air tightness and insulation levels
£1,778 4 Wind turbine £729 4
3 25 Micro wind £3,407 7 Wind turbine £1,013 7
4 44 Best practice energy efficiency and micro wind
£5,500 10 Wind turbine £1,782 10
5 100 Biomass heating and micro wind
£8,539 17 Wind turbine £2,600 16
6 Zero Carbon
Advanced practice energy efficiency, PV, biomass heating and micro wind
£24,756 19 Advanced practice energy efficiency and wind turbine
£8,950 19
Flat
1 10 N/A N/A N/A Improved controls £275 1
2 18 N/A N/A N/A Wind turbine £720 4
3 25 N/A N/A N/A Wind turbine £1,000 7
4 44 N/A N/A N/A Wind turbine £1,593 10
5 100 N/A N/A N/A Wind turbine £2,600 16
6 Zero Carbon
N/A N/A N/A Advanced practice energy efficiency and wind turbine
£8,685 19
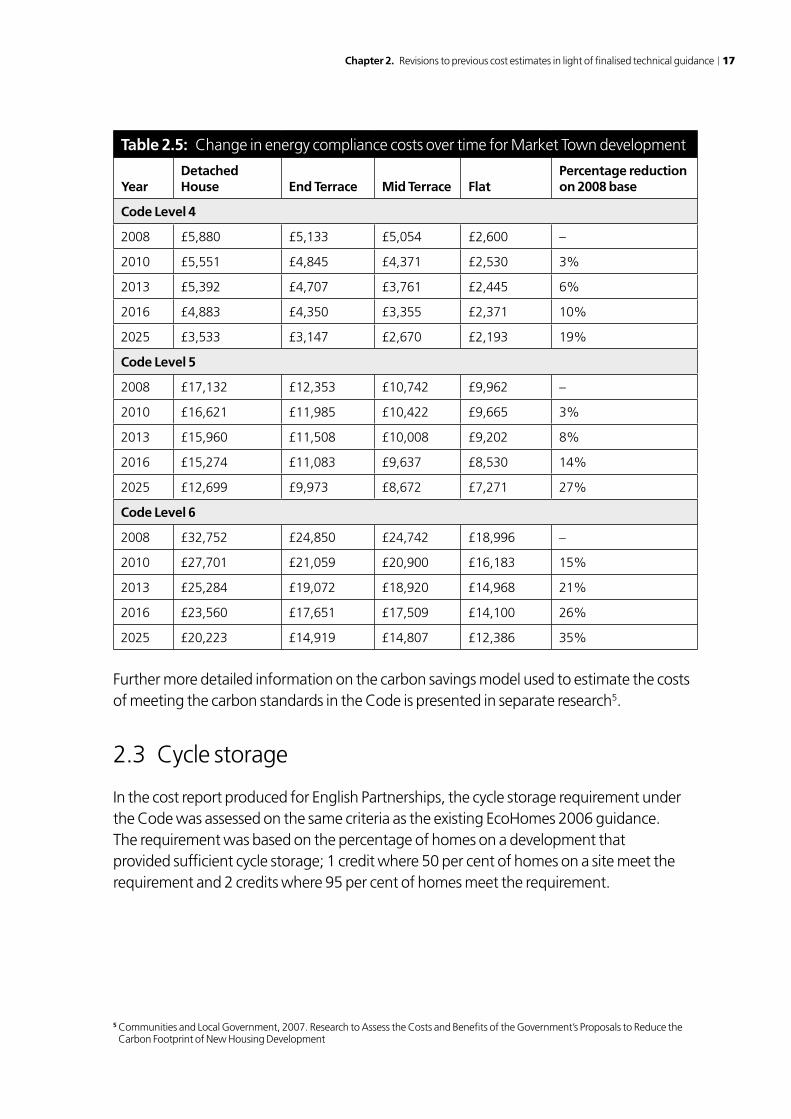
In addition to assessing the current costs of each carbon saving technology, the potential change in these costs over time was also considered, using learning rates. Learning rates are a measure of the extent to which costs are likely to change in proportion to the amount of experience (measured by the growth in installed capacity of a technology) gained by producers and installers. Learning rates are typically presented as a percentage change in cost that occurs for each doubling of the market for a particular technology. Using industry predictions for the growth of each of the carbon savings technologies, globally and within the UK, the possible future costs of each technology (in today’s prices) have been estimated. Notwithstanding the inevitable uncertainty associated with such analysis, Table 2.5 shows the potential change (reduction) in the costs of achieving Code levels 4, 5 and 6 over time for homes built in a Market Town development.
Chapter 2. Revisions to previous cost estimates in light of finalised technical guidance 17
Table 2.5: Change in energy compliance costs over time for Market Town development
YearDetached House End Terrace Mid Terrace Flat
Percentage reduction on 2008 base
Code Level 4
2008 £5,880 £5,133 £5,054 £2,600 –
2010 £5,551 £4,845 £4,371 £2,530 3%
2013 £5,392 £4,707 £3,761 £2,445 6%
2016 £4,883 £4,350 £3,355 £2,371 10%
2025 £3,533 £3,147 £2,670 £2,193 19%
Code Level 5
2008 £17,132 £12,353 £10,742 £9,962 –
2010 £16,621 £11,985 £10,422 £9,665 3%
2013 £15,960 £11,508 £10,008 £9,202 8%
2016 £15,274 £11,083 £9,637 £8,530 14%
2025 £12,699 £9,973 £8,672 £7,271 27%
Code Level 6
2008 £32,752 £24,850 £24,742 £18,996 –
2010 £27,701 £21,059 £20,900 £16,183 15%
2013 £25,284 £19,072 £18,920 £14,968 21%
2016 £23,560 £17,651 £17,509 £14,100 26%
2025 £20,223 £14,919 £14,807 £12,386 35%
Further more detailed information on the carbon savings model used to estimate the costs of meeting the carbon standards in the Code is presented in separate research5.
2.3 Cycle storage
In the cost report produced for English Partnerships, the cycle storage requirement under the Code was assessed on the same criteria as the existing EcoHomes 2006 guidance. The requirement was based on the percentage of homes on a development that provided sufficient cycle storage; 1 credit where 50 per cent of homes on a site meet the requirement and 2 credits where 95 per cent of homes meet the requirement.
5 Communities and Local Government, 2007. Research to Assess the Costs and Benefits of the Government’s Proposals to Reduce the Carbon Footprint of New Housing Development
18 Cost Analysis of The Code for Sustainable Homes
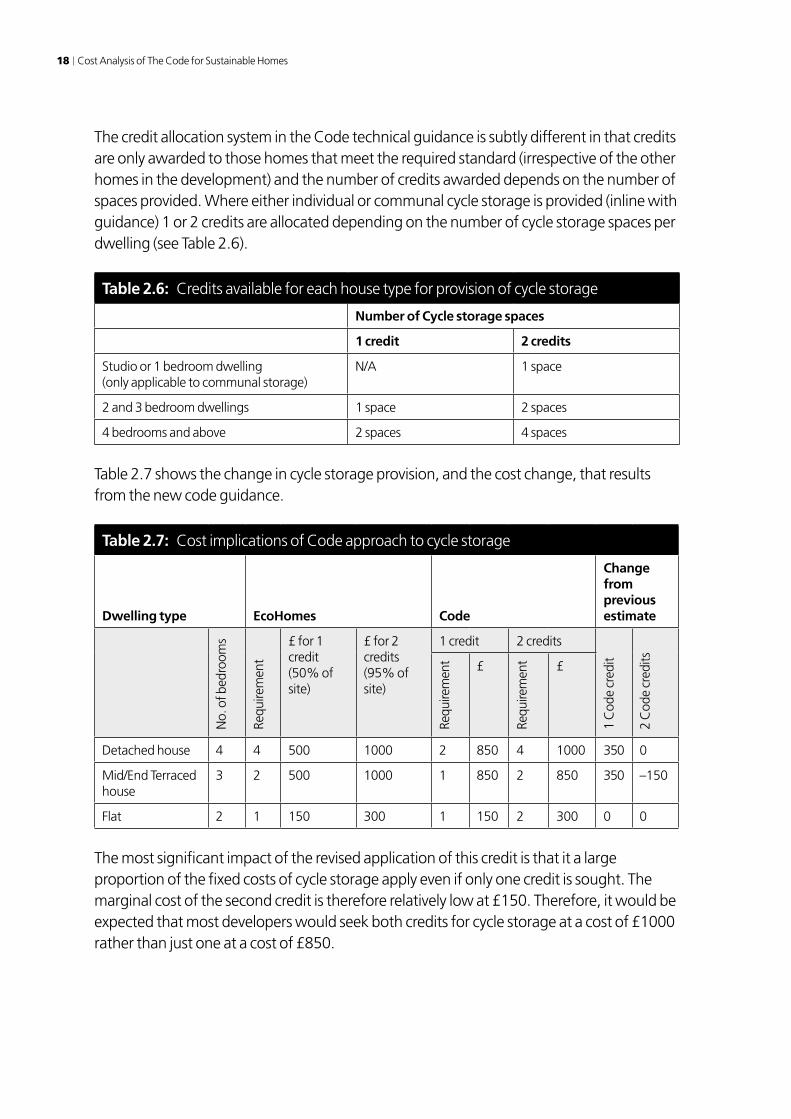
The credit allocation system in the Code technical guidance is subtly different in that credits are only awarded to those homes that meet the required standard (irrespective of the other homes in the development) and the number of credits awarded depends on the number of spaces provided. Where either individual or communal cycle storage is provided (inline with guidance) 1 or 2 credits are allocated depending on the number of cycle storage spaces per dwelling (see Table 2.6).
Table 2.6: Credits available for each house type for provision of cycle storage
Number of Cycle storage spaces
1 credit 2 credits
Studio or 1 bedroom dwelling(only applicable to communal storage)
N/A 1 space
2 and 3 bedroom dwellings 1 space 2 spaces
4 bedrooms and above 2 spaces 4 spaces
Table 2.7 shows the change in cycle storage provision, and the cost change, that results from the new code guidance.
Table 2.7: Cost implications of Code approach to cycle storage
Dwelling type EcoHomes Code
Change from previous estimate
No.
of b
edro
oms
Requ
irem
ent
£ for 1 credit (50% of site)
£ for 2 credits (95% of site)
1 credit 2 credits
1 C
ode
cred
it
2 C
ode
cred
its
Requ
irem
ent £
Requ
irem
ent £
Detached house 4 4 500 1000 2 850 4 1000 350 0
Mid/End Terraced house
3 2 500 1000 1 850 2 850 350 –150
Flat 2 1 150 300 1 150 2 300 0 0
The most significant impact of the revised application of this credit is that it a large proportion of the fixed costs of cycle storage apply even if only one credit is sought. The marginal cost of the second credit is therefore relatively low at £150. Therefore, it would be expected that most developers would seek both credits for cycle storage at a cost of £1000 rather than just one at a cost of £850.
Chapter 2. Revisions to previous cost estimates in light of finalised technical guidance 19
2.4 Internal potable water consumption
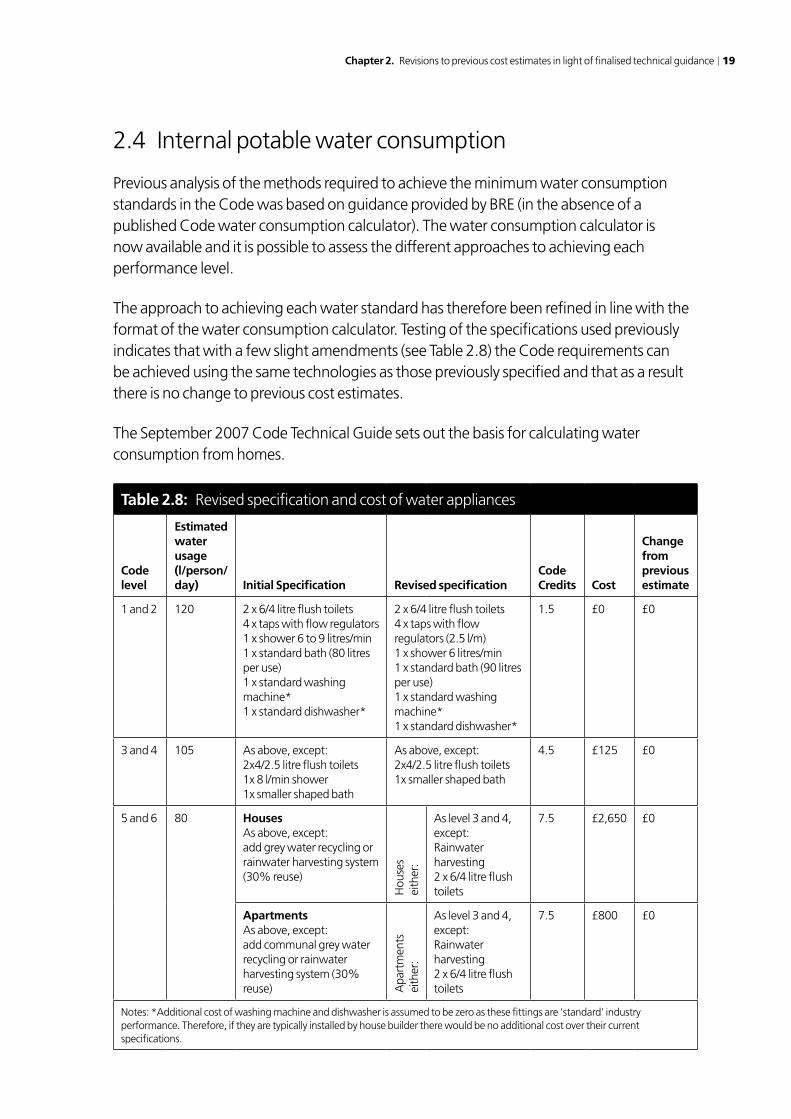
Previous analysis of the methods required to achieve the minimum water consumption standards in the Code was based on guidance provided by BRE (in the absence of a published Code water consumption calculator). The water consumption calculator is now available and it is possible to assess the different approaches to achieving each performance level.
The approach to achieving each water standard has therefore been refined in line with the format of the water consumption calculator. Testing of the specifications used previously indicates that with a few slight amendments (see Table 2.8) the Code requirements can be achieved using the same technologies as those previously specified and that as a result there is no change to previous cost estimates.
The September 2007 Code Technical Guide sets out the basis for calculating water consumption from homes.
Table 2.8: Revised specification and cost of water appliances
Code level
Estimated water usage (l/person/day) Initial Specification Revised specification
Code Credits Cost
Change from previous estimate
1 and 2 120 2 x 6/4 litre flush toilets4 x taps with flow regulators1 x shower 6 to 9 litres/min1 x standard bath (80 litres per use)1 x standard washing machine*1 x standard dishwasher*
2 x 6/4 litre flush toilets4 x taps with flow regulators (2.5 l/m)1 x shower 6 litres/min1 x standard bath (90 litres per use)1 x standard washing machine*1 x standard dishwasher*
1.5 £0 £0
3 and 4 105 As above, except: 2x4/2.5 litre flush toilets1x 8 l/min shower1x smaller shaped bath
As above, except: 2x4/2.5 litre flush toilets1x smaller shaped bath
4.5 £125 £0
5 and 6 80 HousesAs above, except:add grey water recycling or rainwater harvesting system (30% reuse)
Hou
ses
eith
er:
As level 3 and 4, except:Rainwater harvesting 2 x 6/4 litre flush toilets
7.5 £2,650 £0
ApartmentsAs above, except:add communal grey water recycling or rainwater harvesting system (30% reuse) A
part
men
ts
eith
er:
As level 3 and 4, except:Rainwater harvesting 2 x 6/4 litre flush toilets
7.5 £800 £0
Notes: *Additional cost of washing machine and dishwasher is assumed to be zero as these fittings are ‘standard’ industry performance. Therefore, if they are typically installed by house builder there would be no additional cost over their current specifications.
20 Cost Analysis of The Code for Sustainable Homes
2.5 Flood risk
2.5.1 Flood risk credit criteria
Previously the Code credits relating to flood risk were assessed on the same criteria as those within the existing EcoHomes 2006 guidance and with the assumption that most developments would be in areas at low risk from flooding.
This update considers the method set out in the Code technical guidance, and also assesses how Code credits would be achieved for sites where the flood risk is medium to high, on the basis that a substantial proportion of future development be in flood plains and subject to risk of flooding.
Under EcoHomes 2006 credits could only be awarded where either:
• adevelopmentislocatedinazonedefinedashavingalowannualprobabilityofflooding
• thefinishedfloorlevelandaccessroutesare600mmabovethe(mediumrisk)designflood level.
The Code technical guidance allows the allocation of two credits where:
• thedevelopmentislocatedinazonedefinedashavingalowannualprobabilityofflooding
• wherethegroundlevelofalldwellingsandaccessroutesaredesignedtobeatleast600mm above the design flood level of the flood zone in which the development is located
• floodresilientconstructionmethodshavebeenimplementedinadwelling’sdesign
• flooddefencesorothernon-structuralmeasuresareusedtocontrolthefloodrisktoadevelopment.
One-third of the Government’s designated new development sites are located within an area of medium flood risk (as designated by the Code guidance and Environment Agency), further more it is estimated that around 10,000 planned new properties in growth areas may be built in areas of significant flood risk (a probability greater than 1.3 per cent or 1 in 75 years)6.
6 Association of British Insurers, Making Communities Sustainable: Managing flood risks in the Government’s growth areas, Final technical report (Volume 2), February 2005.
Chapter 2. Revisions to previous cost estimates in light of finalised technical guidance 21
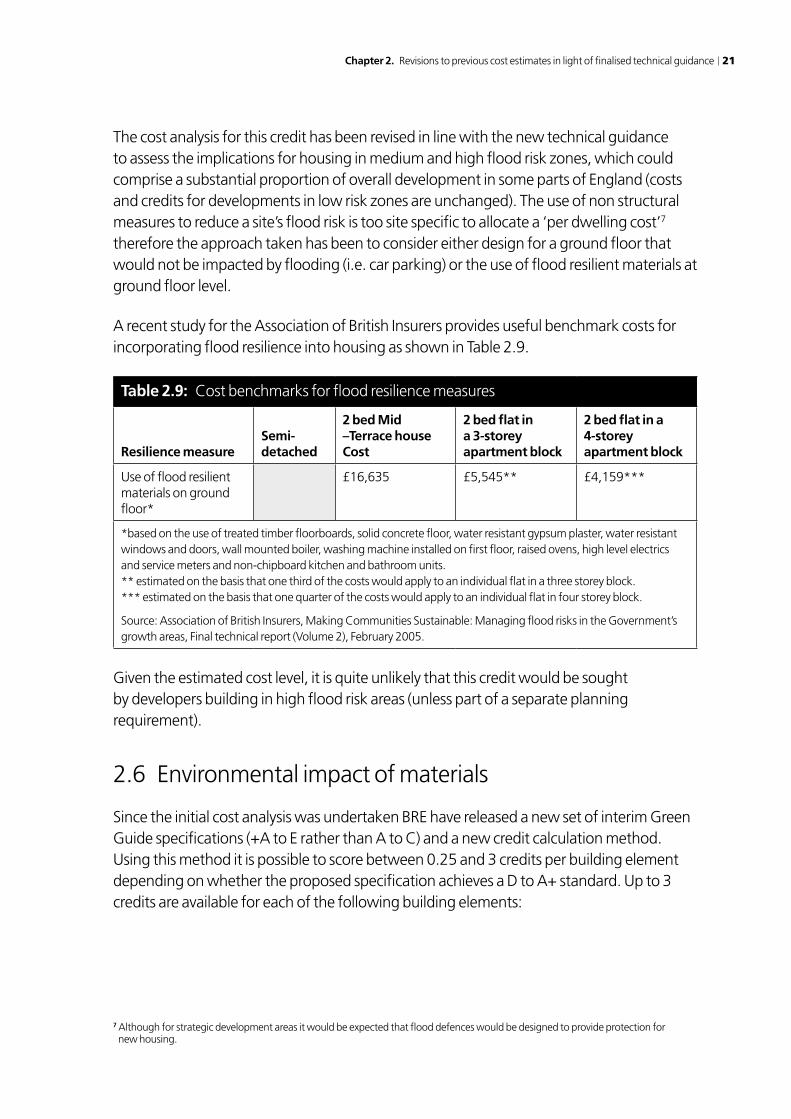
The cost analysis for this credit has been revised in line with the new technical guidance to assess the implications for housing in medium and high flood risk zones, which could comprise a substantial proportion of overall development in some parts of England (costs and credits for developments in low risk zones are unchanged). The use of non structural measures to reduce a site’s flood risk is too site specific to allocate a ‘per dwelling cost’7 therefore the approach taken has been to consider either design for a ground floor that would not be impacted by flooding (i.e. car parking) or the use of flood resilient materials at ground floor level.
A recent study for the Association of British Insurers provides useful benchmark costs for incorporating flood resilience into housing as shown in Table 2.9.
Table 2.9: Cost benchmarks for flood resilience measures
Resilience measureSemi-detached
2 bed Mid –Terrace houseCost
2 bed flat in a 3-storey apartment block
2 bed flat in a4-storey apartment block
Use of flood resilient materials on ground floor*
£16,635 £5,545** £4,159***
*based on the use of treated timber floorboards, solid concrete floor, water resistant gypsum plaster, water resistant windows and doors, wall mounted boiler, washing machine installed on first floor, raised ovens, high level electrics and service meters and non-chipboard kitchen and bathroom units.** estimated on the basis that one third of the costs would apply to an individual flat in a three storey block.*** estimated on the basis that one quarter of the costs would apply to an individual flat in four storey block.
Source: Association of British Insurers, Making Communities Sustainable: Managing flood risks in the Government’s growth areas, Final technical report (Volume 2), February 2005.
Given the estimated cost level, it is quite unlikely that this credit would be sought by developers building in high flood risk areas (unless part of a separate planning requirement).
2.6 Environmental impact of materials
Since the initial cost analysis was undertaken BRE have released a new set of interim Green Guide specifications (+A to E rather than A to C) and a new credit calculation method. Using this method it is possible to score between 0.25 and 3 credits per building element depending on whether the proposed specification achieves a D to A+ standard. Up to 3 credits are available for each of the following building elements:
7 Although for strategic development areas it would be expected that flood defences would be designed to provide protection for new housing.
22 Cost Analysis of The Code for Sustainable Homes
• Externalwalls
• Internalwalls
• Groundandupperfloors
• Roof
• Windows.
A total of 15 credits are therefore available with each credit being valued at 0.3 per cent of the overall score.
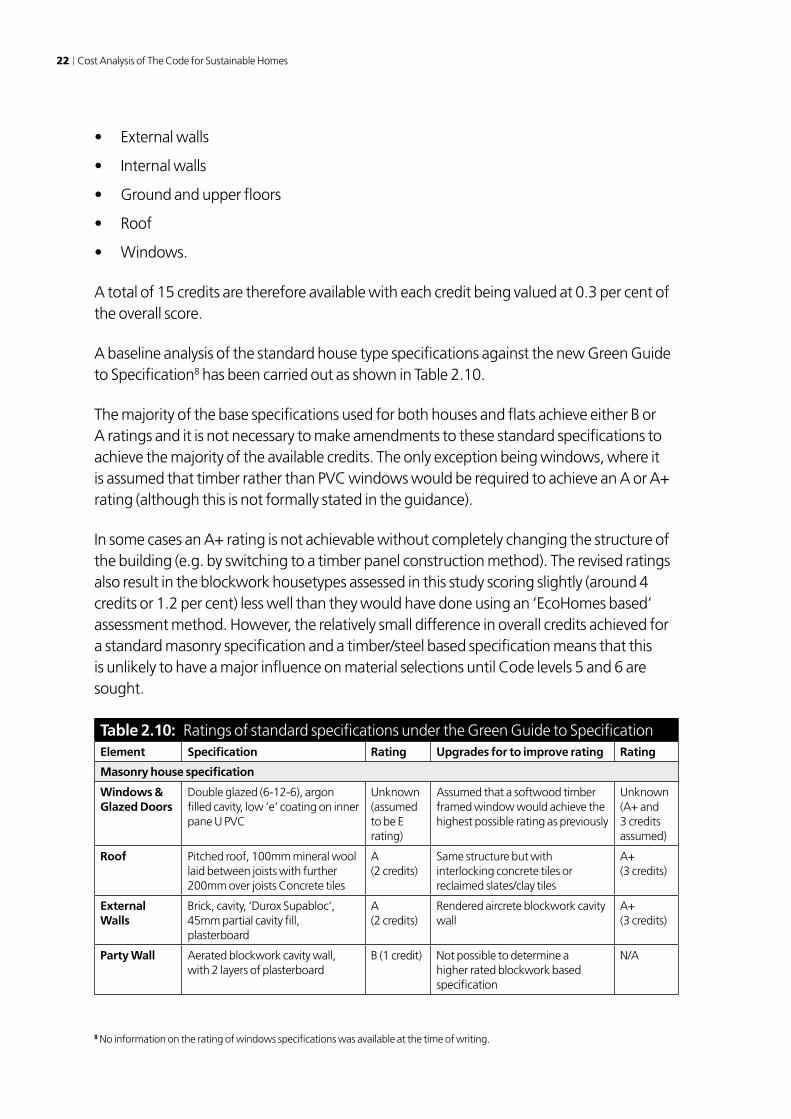
A baseline analysis of the standard house type specifications against the new Green Guide to Specification8 has been carried out as shown in Table 2.10.
The majority of the base specifications used for both houses and flats achieve either B or A ratings and it is not necessary to make amendments to these standard specifications to achieve the majority of the available credits. The only exception being windows, where it is assumed that timber rather than PVC windows would be required to achieve an A or A+ rating (although this is not formally stated in the guidance).
In some cases an A+ rating is not achievable without completely changing the structure of the building (e.g. by switching to a timber panel construction method). The revised ratings also result in the blockwork housetypes assessed in this study scoring slightly (around 4 credits or 1.2 per cent) less well than they would have done using an ‘EcoHomes based’ assessment method. However, the relatively small difference in overall credits achieved for a standard masonry specification and a timber/steel based specification means that this is unlikely to have a major influence on material selections until Code levels 5 and 6 are sought.
Table 2.10: Ratings of standard specifications under the Green Guide to SpecificationElement Specification Rating Upgrades for to improve rating Rating
Masonry house specification
Windows & Glazed Doors
Double glazed (6-12-6), argon filled cavity, low ‘e’ coating on inner pane U PVC
Unknown (assumed to be E rating)
Assumed that a softwood timber framed window would achieve the highest possible rating as previously
Unknown (A+ and 3 credits assumed)
Roof Pitched roof, 100mm mineral wool laid between joists with further 200mm over joists Concrete tiles
A (2 credits)
Same structure but with interlocking concrete tiles or reclaimed slates/clay tiles
A+ (3 credits)
External Walls
Brick, cavity, ‘Durox Supabloc’, 45mm partial cavity fill, plasterboard
A (2 credits)
Rendered aircrete blockwork cavity wall
A+ (3 credits)
Party Wall Aerated blockwork cavity wall, with 2 layers of plasterboard
B (1 credit) Not possible to determine a higher rated blockwork based specification
N/A
8 No information on the rating of windows specifications was available at the time of writing.
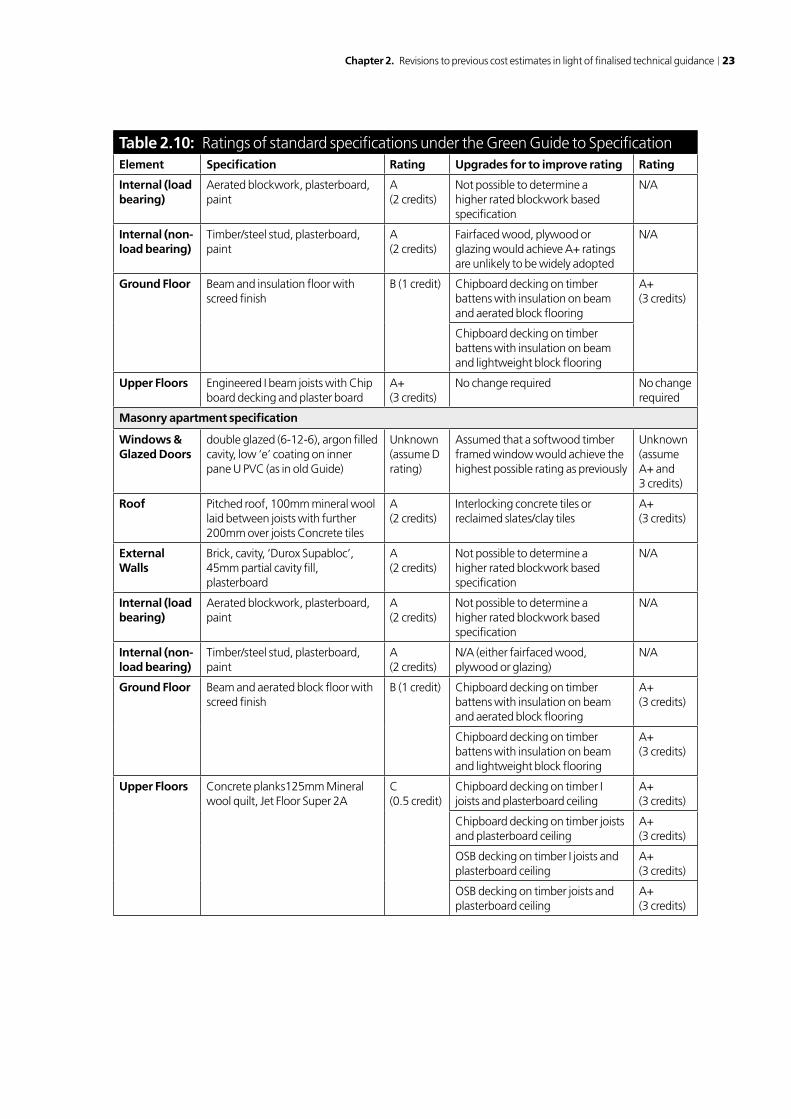
Chapter 2. Revisions to previous cost estimates in light of finalised technical guidance 23
Table 2.10: Ratings of standard specifications under the Green Guide to SpecificationElement Specification Rating Upgrades for to improve rating Rating
Internal (load bearing)
Aerated blockwork, plasterboard, paint
A (2 credits)
Not possible to determine a higher rated blockwork based specification
N/A
Internal (non- load bearing)
Timber/steel stud, plasterboard, paint
A (2 credits)
Fairfaced wood, plywood or glazing would achieve A+ ratings are unlikely to be widely adopted
N/A
Ground Floor Beam and insulation floor with screed finish
B (1 credit) Chipboard decking on timber battens with insulation on beam and aerated block flooring
A+ (3 credits)
Chipboard decking on timber battens with insulation on beam and lightweight block flooring
Upper Floors Engineered I beam joists with Chip board decking and plaster board
A+ (3 credits)
No change required No change required
Masonry apartment specification
Windows & Glazed Doors
double glazed (6-12-6), argon filled cavity, low ‘e’ coating on inner pane U PVC (as in old Guide)
Unknown (assume D rating)
Assumed that a softwood timber framed window would achieve the highest possible rating as previously
Unknown (assume A+ and 3 credits)
Roof Pitched roof, 100mm mineral wool laid between joists with further 200mm over joists Concrete tiles
A (2 credits)
Interlocking concrete tiles or reclaimed slates/clay tiles
A+ (3 credits)
External Walls
Brick, cavity, ‘Durox Supabloc’, 45mm partial cavity fill, plasterboard
A (2 credits)
Not possible to determine a higher rated blockwork based specification
N/A
Internal (load bearing)
Aerated blockwork, plasterboard, paint
A (2 credits)
Not possible to determine a higher rated blockwork based specification
N/A
Internal (non- load bearing)
Timber/steel stud, plasterboard, paint
A (2 credits)
N/A (either fairfaced wood, plywood or glazing)
N/A
Ground Floor Beam and aerated block floor with screed finish
B (1 credit) Chipboard decking on timber battens with insulation on beam and aerated block flooring
A+ (3 credits)
Chipboard decking on timber battens with insulation on beam and lightweight block flooring
A+ (3 credits)
Upper Floors Concrete planks125mm Mineral wool quilt, Jet Floor Super 2A
C (0.5 credit)
Chipboard decking on timber I joists and plasterboard ceiling
A+ (3 credits)
Chipboard decking on timber joists and plasterboard ceiling
A+ (3 credits)
OSB decking on timber I joists and plasterboard ceiling
A+ (3 credits)
OSB decking on timber joists and plasterboard ceiling
A+ (3 credits)
24 Cost Analysis of The Code for Sustainable Homes
2.7 Sound
Following consultations with developers, manufacturers and independent sound consultants it is clear that further work is needed to ascertain whether the standard house types (with minor modification) will be able to achieve the highest levels of sound insulation required to score maximum credits for credit category Hea2 Sound Insulation.
Research has shown that, currently, there is little experience of designing construction specifications to meet the requirements for 3 or 4 credits within the Code (i.e. 5dB or 8dB improvements on Part E of Building Regulations). Manufacturers of construction systems are currently trying to produce and test products that will consistently meet these standards.
Therefore while a detached house type would achieve all four Sound credits by default (as it has no separating walls to consider) the performance of terraced houses and flats is more difficult to determine. It has been assumed that improvements of up to 5dB beyond Part E could be achieved through closer attention to workmanship and improved sealing of separating walls and floors (this is linked to the need for higher levels of airtightness to achieve Code energy standards) although this would need verification through sound testing (as it is not currently possible to guarantee these performance levels through the use of Robust Standard Details alone).
There may be some additional cost associated with achieving these improvements, however in the absence of specific specifications these have been estimated at the cost of conducting the sound testing required to verify performance. The cost of undertaking sound testing varies from site to site (based on the number of units and separating walls/floors) but is typically between £100 and £150 per unit.
At present it is not clear what specifications would be required to achieve the 8dB improvement on Part E and as such it has been assumed that most developers would not seek this fourth credit.
A further consideration when assessing the potential costs associated with improving sound insulation beyond the requirements of Part E is the cost of remediation if the target performance is not achieved. This presents a risk of further costs where confidence in site practices or construction details are low.
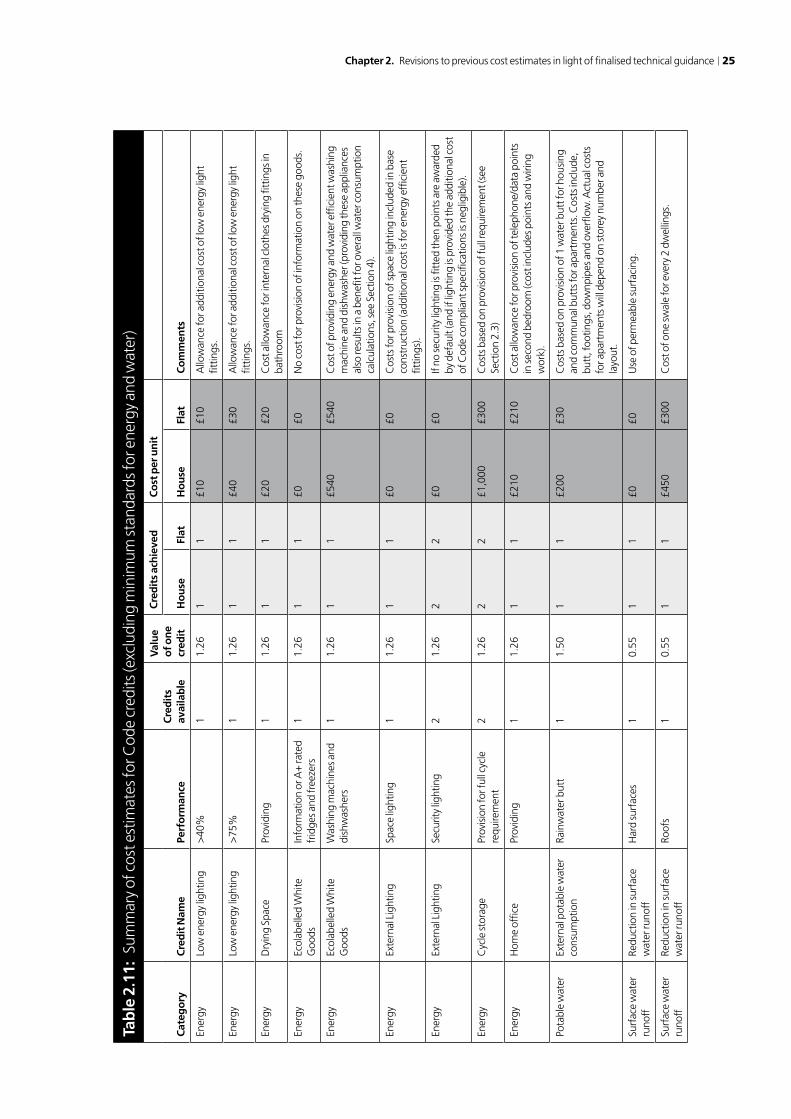
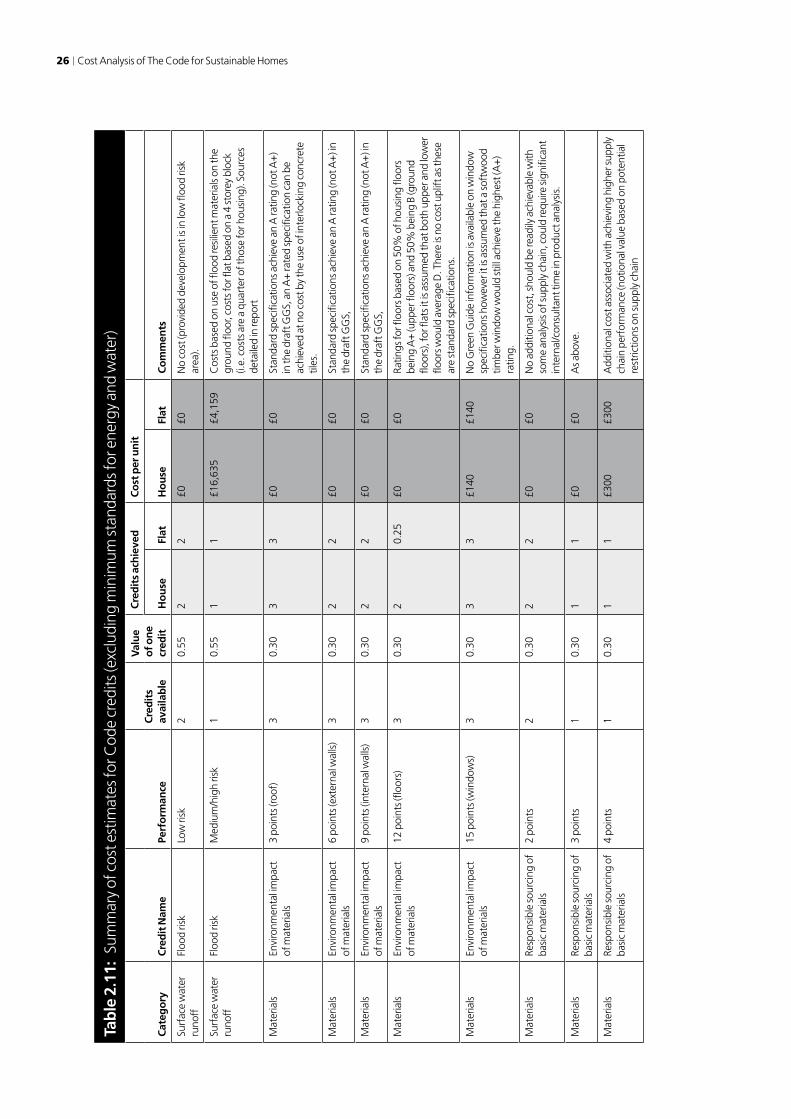
2.8 Summary of costs for Code credits
The predicted costs associated with the minimum performance standards for energy and water are shown in Table 2.3 and 2.8. Table 2.11 below, provides a consolidated list of updated cost estimates based on previous estimates and the revisions described previously.
Chapter 2. Revisions to previous cost estimates in light of finalised technical guidance 25
Tab
le 2
.11:
Sum
mar
y of
cos
t est
imat
es fo
r Cod
e cr
edits
(exc
ludi
ng m
inim
um st
anda
rds f
or e
nerg
y an
d w
ater
)
Cat
ego
ryC
red
it N
ame
Perf
orm
ance
Cre
dit
s av
aila
ble
Val
ue
of o
ne
cred
it
Cre
dit
s ac
hie
ved
Co
st p
er u
nit
Ho
use
Flat
Ho
use
Flat
Co
mm
ents
Ener
gy
Low
ene
rgy
light
ing
>40
%1
1.26
11
£10
£10
Allo
wan
ce fo
r add
ition
al c
ost o
f low
ene
rgy
light
fit
tings
.
Ener
gyLo
w e
nerg
y lig
htin
g >
75%
11.
261
1£4
0£3
0A
llow
ance
for a
dditi
onal
cos
t of l
ow e
nerg
y lig
ht
fittin
gs.
Ener
gyD
ryin
g Sp
ace
Prov
idin
g 1
1.26
11
£20
£20
Cos
t allo
wan
ce fo
r int
erna
l clo
thes
dry
ing
fittin
gs in
ba
thro
om
Ener
gy
Ecol
abel
led
Whi
te
Goo
dsIn
form
atio
n or
A+
rate
d fr
idge
s and
free
zers
11.
261
1£0
£0N
o co
st fo
r pro
visi
on o
f inf
orm
atio
n on
thes
e go
ods.
Ener
gyEc
olab
elle
d W
hite
G
oods
Was
hing
mac
hine
s and
di
shw
ashe
rs1
1.26
11
£540
£540
Cos
t of p
rovi
ding
ene
rgy
and
wat
er e
ffici
ent w
ashi
ng
mac
hine
and
dis
hwas
her (
prov
idin
g th
ese
appl
ianc
es
also
resu
lts in
a b
enefi
t for
ove
rall
wat
er c
onsu
mpt
ion
calc
ulat
ions
, see
Sec
tion
4).
Ener
gyEx
tern
al L
ight
ing
Spac
e lig
htin
g1
1.26
11
£0£0
Cos
ts fo
r pro
visi
on o
f spa
ce li
ghtin
g in
clud
ed in
bas
e co
nstr
uctio
n (a
dditi
onal
cos
t is f
or e
nerg
y ef
ficie
nt
fittin
gs).
Ener
gy
Exte
rnal
Lig
htin
gSe
curit
y lig
htin
g2
1.26
22
£0£0
If no
secu
rity
light
ing
is fi
tted
then
poi
nts a
re a
war
ded
by d
efau
lt (a
nd if
ligh
ting
is p
rovi
ded
the
addi
tiona
l cos
t of
Cod
e co
mpl
iant
spec
ifica
tions
is n
eglig
ible
).
Ener
gyC
ycle
stor
age
Prov
isio
n fo
r ful
l cyc
le
requ
irem
ent
21.
262
2£1
,000
£300
Cos
ts b
ased
on
prov
isio
n of
full
requ
irem
ent (
see
Sect
ion
2.3)
Ener
gyH
ome
offic
ePr
ovid
ing
11.
261
1£2
10£2
10C
ost a
llow
ance
for p
rovi
sion
of t
elep
hone
/dat
a po
ints
in
seco
nd b
edro
om (c
ost i
nclu
des p
oint
s and
wiri
ng
wor
k).
Pota
ble
wat
erEx
tern
al p
otab
le w
ater
co
nsum
ptio
nRa
inw
ater
but
t1
1.50
11
£200
£30
Cos
ts b
ased
on
prov
isio
n of
1 w
ater
but
t for
hou
sing
an
d co
mm
unal
but
ts fo
r apa
rtm
ents
. Cos
ts in
clud
e,
butt
, foo
tings
, dow
npip
es a
nd o
verfl
ow. A
ctua
l cos
ts
for a
part
men
ts w
ill d
epen
d on
stor
ey n
umbe
r and
la
yout
.
Surf
ace
wat
er
runo
ffRe
duct
ion
in su
rfac
e w
ater
runo
ffH
ard
surf
aces
10.
551
1£0
£0U
se o
f per
mea
ble
surf
acin
g.
Surf
ace
wat
er
runo
ffRe
duct
ion
in su
rfac
e w
ater
runo
ffRo
ofs
10.
551
1£4
50£3
00C
ost o
f one
swal
e fo
r eve
ry 2
dw
ellin
gs.
26 Cost Analysis of The Code for Sustainable Homes
Tab
le 2
.11:
Sum
mar
y of
cos
t est
imat
es fo
r Cod
e cr
edits
(exc
ludi
ng m
inim
um st
anda
rds f
or e
nerg
y an
d w
ater
)
Cat
ego
ryC
red
it N
ame
Perf
orm
ance
Cre
dit
s av
aila
ble
Val
ue
of o
ne
cred
it
Cre
dit
s ac
hie
ved
Co
st p
er u
nit
Ho
use
Flat
Ho
use
Flat
Co
mm
ents
Surf
ace
wat
er
runo
ffFl
ood
risk
Low
risk
20.
552
2£0
£0N
o co
st (p
rovi
ded
deve
lopm
ent i
s in
low
floo
d ris
k ar
ea).
Surf
ace
wat
er
runo
ffFl
ood
risk
Med
ium
/hig
h ris
k1
0.55
11
£16,
635
£4,1
59C
osts
bas
ed o
n us
e of
floo
d re
silie
nt m
ater
ials
on
the
grou
nd fl
oor,
cost
s for
flat
bas
ed o
n a
4 st
orey
blo
ck
(i.e.
cos
ts a
re a
qua
rter
of t
hose
for h
ousi
ng).
Sour
ces
deta
iled
in re
port
Mat
eria
ls
Envi
ronm
enta
l im
pact
of
mat
eria
ls3
poin
ts (r
oof)
30.
303
3£0
£0St
anda
rd sp
ecifi
catio
ns a
chie
ve a
n A
ratin
g (n
ot A
+)
in th
e dr
aft G
GS,
an
A+
rate
d sp
ecifi
catio
n ca
n be
ac
hiev
ed a
t no
cost
by
the
use
of in
terlo
ckin
g co
ncre
te
tiles
.
Mat
eria
ls
Envi
ronm
enta
l im
pact
of
mat
eria
ls6
poin
ts (e
xter
nal w
alls
)3
0.30
22
£0£0
Stan
dard
spec
ifica
tions
ach
ieve
an
A ra
ting
(not
A+
) in
the
draf
t GG
S,
Mat
eria
ls
Envi
ronm
enta
l im
pact
of
mat
eria
ls9
poin
ts (i
nter
nal w
alls
)3
0.30
22
£0£0
Stan
dard
spec
ifica
tions
ach
ieve
an
A ra
ting
(not
A+
) in
the
draf
t GG
S,
Mat
eria
ls
Envi
ronm
enta
l im
pact
of
mat
eria
ls12
poi
nts (
floor
s)3
0.30
20.
25£0
£0Ra
tings
for fl
oors
bas
ed o
n 50
% o
f hou
sing
floo
rs
bein
g A
+ (u
pper
floo
rs) a
nd 5
0% b
eing
B (g
roun
d flo
ors)
, for
flat
s it i
s ass
umed
that
bot
h up
per a
nd lo
wer
flo
ors w
ould
ave
rage
D. T
here
is n
o co
st u
plift
as t
hese
ar
e st
anda
rd sp
ecifi
catio
ns.
Mat
eria
ls
Envi
ronm
enta
l im
pact
of
mat
eria
ls15
poi
nts (
win
dow
s)3
0.30
33
£140
£140
No
Gre
en G
uide
info
rmat
ion
is a
vaila
ble
on w
indo
w
spec
ifica
tions
how
ever
it is
ass
umed
that
a so
ftw
ood
timbe
r win
dow
wou
ld st
ill a
chie
ve th
e hi
ghes
t (A
+)
ratin
g.
Mat
eria
ls
Resp
onsi
ble
sour
cing
of
basi
c m
ater
ials
2 po
ints
20.
302
2£0
£0N
o ad
ditio
nal c
ost,
shou
ld b
e re
adily
ach
ieva
ble
with
so
me
anal
ysis
of s
uppl
y ch
ain,
cou
ld re
quire
sign
ifica
nt
inte
rnal
/con
sulta
nt ti
me
in p
rodu
ct a
naly
sis.
Mat
eria
ls
Resp
onsi
ble
sour
cing
of
basi
c m
ater
ials
3 po
ints
10.
301
1£0
£0A
s abo
ve.
Mat
eria
ls
Resp
onsi
ble
sour
cing
of
basi
c m
ater
ials
4 po
ints
10.
301
1£3
00£3
00A
dditi
onal
cos
t ass
ocia
ted
with
ach
ievi
ng h
ighe
r sup
ply
chai
n pe
rfor
man
ce (n
otio
nal v
alue
bas
ed o
n po
tent
ial
rest
rictio
ns o
n su
pply
cha
in

Chapter 2. Revisions to previous cost estimates in light of finalised technical guidance 27
Tab
le 2
.11:
Sum
mar
y of
cos
t est
imat
es fo
r Cod
e cr
edits
(exc
ludi
ng m
inim
um st
anda
rds f
or e
nerg
y an
d w
ater
)
Cat
ego
ryC
red
it N
ame
Perf
orm
ance
Cre
dit
s av
aila
ble
Val
ue
of o
ne
cred
it
Cre
dit
s ac
hie
ved
Co
st p
er u
nit
Ho
use
Flat
Ho
use
Flat
Co
mm
ents
Mat
eria
ls
Resp
onsi
ble
sour
cing
of
basi
c m
ater
ials
6 po
ints
20.
302
2£3
00£3
00A
dditi
onal
cos
t ass
ocia
ted
with
ach
ievi
ng h
ighe
r sup
ply
chai
n pe
rfor
man
ce (n
otio
nal v
alue
bas
ed o
n po
tent
ial
rest
rictio
ns o
n su
pply
cha
in
Mat
eria
ls
Resp
onsi
ble
sour
cing
of
finis
hing
ele
men
ts1
poin
t1
0.30
11
£0£0
No
addi
tiona
l cos
t. S
houl
d be
read
ily a
chie
vabl
e w
ith
som
e an
alys
is o
f sup
ply
chai
n; c
ould
requ
ire si
gnifi
cant
in
tern
al/c
onsu
ltant
tim
e in
pro
duct
ana
lysi
s.
Mat
eria
ls
Resp
onsi
ble
sour
cing
of
finis
hing
ele
men
ts2
poin
ts1
0.30
11
£0£0
As a
bove
Mat
eria
ls
Resp
onsi
ble
sour
cing
of
finis
hing
ele
men
ts3
poin
ts1
0.30
11
£300
£300
Add
ition
al c
ost a
ssoc
iate
d w
ith a
chie
ving
hig
her s
uppl
y ch
ain
perf
orm
ance
(not
iona
l val
ue b
ased
on
pote
ntia
l re
stric
tions
on
supp
ly c
hain
Was
teC
onst
ruct
ion
Was
teM
onito
r, so
rt a
nd re
cycl
e co
nstr
uctio
n w
aste
20.
912
2£1
00£1
00N
o co
st, r
outin
ely
impl
emen
ted
by se
vera
l lar
ge
hous
ebui
lder
s.
Was
teH
ouse
hold
Rec
yclin
g Fa
cilit
ies
2 po
ints
20.
912
2£1
60£1
60C
ost a
llow
ance
for p
rovi
sion
of i
nter
nal b
ins
Was
teH
ouse
hold
Rec
yclin
g Fa
cilit
ies
4 po
ints
20.
912
2£0
£0A
ssum
ed th
at lo
cal a
utho
rity
will
pro
vide
ker
bsid
e co
llect
ion
serv
ice.
Was
teC
ompo
stin
g fa
cilit
ies
hom
e co
mpo
stin
g fa
cilit
ies
10.
911
1£3
0£3
0C
ost b
ased
on
220l
com
post
er
Hea
lth a
nd
wel
lbei
ngD
aylig
htin
g K
itche
n 1
1.17
11
£140
£140
Cos
t allo
wan
ce fo
r add
ition
al g
lazi
ng (b
ased
on
need
s of
typi
cal h
ouse
); co
sts f
or sp
ecifi
c ho
uses
will
var
y ac
cord
ing
to d
esig
n an
d si
ze o
f gla
zed
area
.
Hea
lth a
nd
wel
lbei
ngD
aylig
htin
g Li
ving
room
11.
171
1£1
50£1
50C
ost a
llow
ance
for a
dditi
onal
gla
zing
(bas
ed o
n ne
eds
of ty
pica
l hou
se);
cost
s for
spec
ific
hous
es w
ill v
ary
acco
rdin
g to
des
ign
and
size
of g
laze
d ar
ea.
Hea
lth a
nd
wel
lbei
ngD
aylig
htin
g V
iew
of s
ky1
1.17
11
£0£0
No
addi
tiona
l cos
t, a
lthou
gh a
chie
ving
a v
iew
of t
he
sky
from
all
hom
es re
quire
s car
eful
layo
ut.
Hea
lth a
nd
wel
lbei
ngSo
und
insu
latio
n3d
B1
1.17
11
£0£3
30N
o co
st fo
r det
ache
d pr
oper
ties,
cos
ts fo
r ter
race
d pr
oper
ties a
nd fl
ats b
ased
on
cost
s of t
estin
g ac
tiviti
es.
Hea
lth a
nd
wel
lbei
ngSo
und
insu
latio
n5d
B2
1.17
22
£0 (£
160
for t
erra
ced
prop
ertie
s)
£330
No
cost
for d
etac
hed
prop
ertie
s, c
osts
for t
erra
ced
prop
ertie
s and
flat
s bas
ed o
n co
sts o
f tes
ting
activ
ities
.

28 Cost Analysis of The Code for Sustainable Homes
Tab
le 2
.11:
Sum
mar
y of
cos
t est
imat
es fo
r Cod
e cr
edits
(exc
ludi
ng m
inim
um st
anda
rds f
or e
nerg
y an
d w
ater
)
Cat
ego
ryC
red
it N
ame
Perf
orm
ance
Cre
dit
s av
aila
ble
Val
ue
of o
ne
cred
it
Cre
dit
s ac
hie
ved
Co
st p
er u
nit
Ho
use
Flat
Ho
use
Flat
Co
mm
ents
Hea
lth a
nd
wel
lbei
ngSo
und
insu
latio
n8d
B1
1.17
10
£0£0
No
cost
for d
etac
hed
prop
ertie
s, a
t pre
sent
it is
not
cl
ear h
ow th
is p
erfo
rman
ce st
anda
rd w
ill b
e ac
hiev
ed
(and
if it
can
be
achi
eved
with
the
cons
truc
tion
met
hods
use
d he
re.
Hea
lth a
nd
wel
lbei
ngPr
ivat
e sp
ace
Prov
ide
11.
171
1£0
£0H
ousi
ng h
as p
rivat
e sp
ace,
can
be
desi
gned
into
ap
artm
ent b
lock
s.
Hea
lth a
nd
wel
lbei
ngLi
fetim
e H
omes
all f
eatu
res
41.
174
4£5
50£7
5A
llow
ance
for a
dditi
onal
supp
orts
/fixi
ng p
oint
s with
in
part
ition
s and
dra
inag
e po
int i
n fir
st fl
oor t
oile
ts.
Man
agem
ent
Hom
e us
er g
uide
Prov
ide
for h
ome
21.
112
2£2
0£1
0A
ssum
ing
that
hou
sing
is re
lativ
ely
stan
dard
.
Man
agem
ent
Hom
e us
er g
uide
Prov
ide
for s
urro
undi
ngs
11.
111
1£8
0£4
0C
ost e
stim
ate
for c
omm
issi
onin
g co
nsul
tant
to p
rovi
de
nece
ssar
y lo
catio
n in
form
atio
n (c
osts
low
er fo
r lar
ger
site
s).
Man
agem
ent
Con
side
rate
co
nstr
ucto
rs1
poin
t1
1.11
11
£0£0
No
cost
for c
ompl
ianc
e (o
ther
than
nom
inal
site
re
gist
ratio
n fe
e).
Man
agem
ent
Con
side
rate
co
nstr
ucto
rs2
poin
ts1
1.11
11
£0£0
No
cost
for c
ompl
ianc
e (o
ther
than
nom
inal
site
re
gist
ratio
n fe
e).
Man
agem
ent
Con
stru
ctio
n si
te
impa
cts
1 po
int
11.
111
1£0
£0N
o co
st fo
r com
plia
nce,
alre
ady
impl
emen
ted
by
seve
ral l
arge
hou
se b
uild
ers.
Man
agem
ent
Con
stru
ctio
n si
te
impa
cts
2 po
ints
11.
111
1£1
00£7
5Es
timat
ed c
ost f
or m
onito
ring.
Man
agem
ent
Secu
rity
Secu
re b
y D
esig
n2
1.11
22
£0£0
No
cost
(alth
ough
ther
e m
ay b
e an
impa
ct o
n si
te
layo
ut).
Pollu
tion
Insu
lant
GW
PU
se1
0.70
11
£0£0
No
cost
, min
eral
woo
l, ai
r blo
wn
and
seve
ral t
ypes
of
rigid
insu
latio
n co
mpl
y.
Pollu
tion
NO
x em
issi
ons
<40
mg
kWh
30.
703
3£0
£0N
o co
st; h
igh
effic
ienc
y bo
ilers
mee
t hig
hest
pe
rfor
man
ce st
anda
rds.
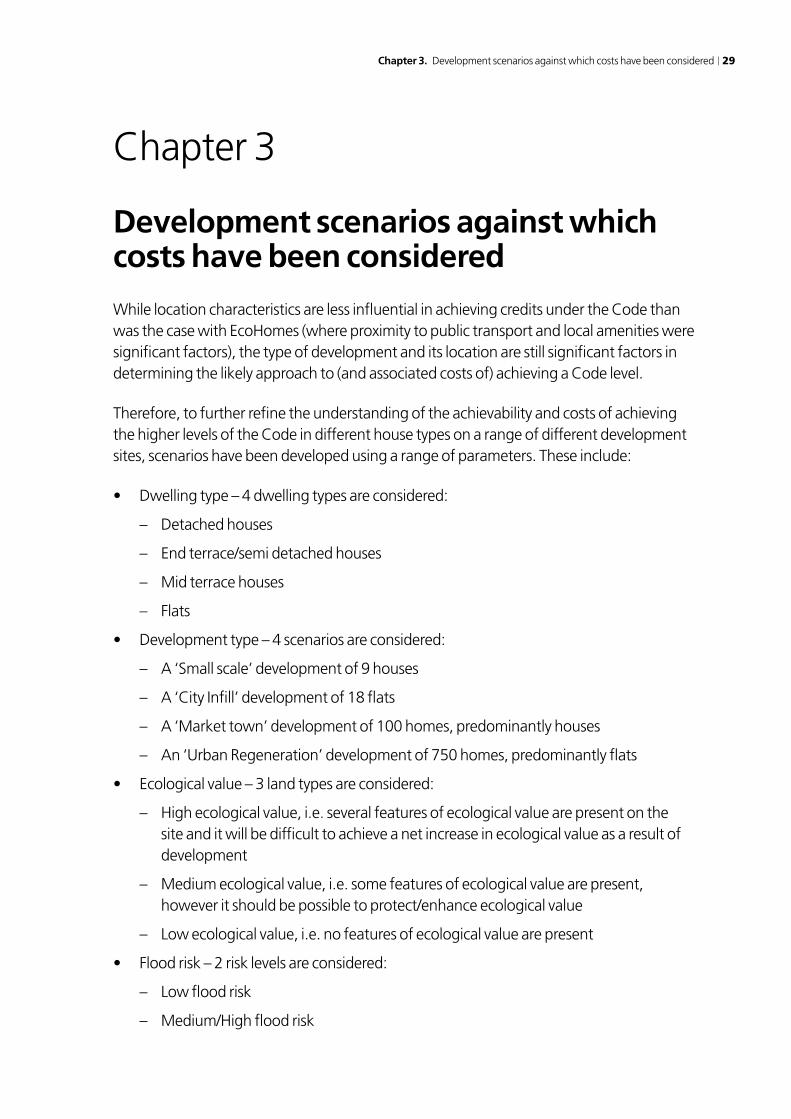
Chapter 3. Development scenarios against which costs have been considered 29
Chapter 3
Development scenarios against which costs have been considered
While location characteristics are less influential in achieving credits under the Code than was the case with EcoHomes (where proximity to public transport and local amenities were significant factors), the type of development and its location are still significant factors in determining the likely approach to (and associated costs of) achieving a Code level.
Therefore, to further refine the understanding of the achievability and costs of achieving the higher levels of the Code in different house types on a range of different development sites, scenarios have been developed using a range of parameters. These include:
• Dwellingtype–4dwellingtypesareconsidered:
– Detached houses
– End terrace/semi detached houses
– Mid terrace houses
– Flats
• Developmenttype–4scenariosareconsidered:
– A ‘Small scale’ development of 9 houses
– A ‘City Infill’ development of 18 flats
– A ‘Market town’ development of 100 homes, predominantly houses
– An ‘Urban Regeneration’ development of 750 homes, predominantly flats
• Ecologicalvalue–3landtypesareconsidered:
– High ecological value, i.e. several features of ecological value are present on the site and it will be difficult to achieve a net increase in ecological value as a result of development
– Medium ecological value, i.e. some features of ecological value are present, however it should be possible to protect/enhance ecological value
– Low ecological value, i.e. no features of ecological value are present
• Floodrisk–2risklevelsareconsidered:
– Low flood risk
– Medium/High flood risk
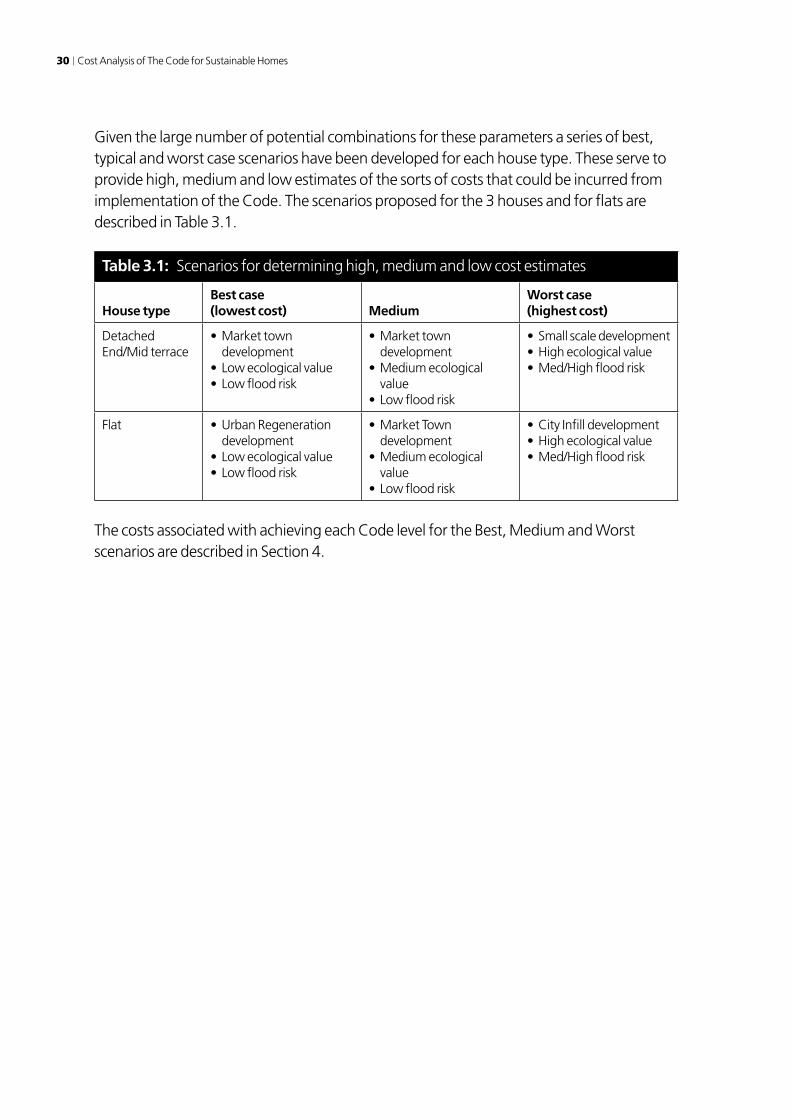
30 Cost Analysis of The Code for Sustainable Homes
Given the large number of potential combinations for these parameters a series of best, typical and worst case scenarios have been developed for each house type. These serve to provide high, medium and low estimates of the sorts of costs that could be incurred from implementation of the Code. The scenarios proposed for the 3 houses and for flats are described in Table 3.1.
Table 3.1: Scenarios for determining high, medium and low cost estimates
House typeBest case (lowest cost) Medium
Worst case (highest cost)
Detached End/Mid terrace
•Markettowndevelopment
•Lowecologicalvalue•Lowfloodrisk
•Markettowndevelopment
•Mediumecologicalvalue
•Lowfloodrisk
•Smallscaledevelopment•Highecologicalvalue•Med/Highfloodrisk
Flat •UrbanRegenerationdevelopment
•Lowecologicalvalue•Lowfloodrisk
•MarketTowndevelopment
•Mediumecologicalvalue
•Lowfloodrisk
•CityInfilldevelopment•Highecologicalvalue•Med/Highfloodrisk
The costs associated with achieving each Code level for the Best, Medium and Worst scenarios are described in Section 4.

Chapter 4. Estimated costs in 2008 31
Chapter 4
Estimated costs in 2008
Tables 4.1 to 4.3 show the estimated 2008 costs of compliance for each level of the Code for the detached house, end terraced house and flat under the best, medium and worst case scenarios described in Section 3, in all cases it is assumed that no electricity generation from wind turbines is possible at any scale9. The results for the mid terrace house are very similar to those for the end terrace and are not presented separately.
As well as presenting the overall costs of compliance, the costs are broken down into the mandatory entry level code requirements, the minimum standards for energy and for water and the remaining flexible credits required to achieve the credits threshold at each Code level.
Table 4.1: Detached house
CSH Level
Mandatory (£)
Energy (£)
Water (£)
Flexible (£)
Total cost (£)
Cost £ per m2
Percentage increase on 2006 Building Regs
Best Case (Market town scenario with low ecological value and low flood risk)
1 £490 £275 £0 £0 £765 £7 1%
2 £490 £1,648 £0 £50 £2,188 £19 2%
3 £490 £3,916 £125 £220 £4,751 £41 5%
4 £490 £9,868 £125 £1,110 £11,593 £100 13%
5 £490 £17,132 £2,625 £1,600 £21,847 £188 24%
6 £490 £32,752 £2,625 £1,950 £37,817 £326 41%
Medium Case (Market town scenario with medium ecological value and low flood risk)
1 £490 £275 £0 £0 £765 £7 1%
2 £490 £1,648 £0 £120 £2,258 £19 2%
3 £490 £3,916 £125 £460 £4,991 £43 5%
4 £490 £9,868 £125 £1,250 £11,733 £101 13%
5 £490 £17,132 £2,625 £1,950 £22,197 £191 24%
6 £490 £32,752 £2,625 £2,950 £38,817 £335 43%
Worst Case (Small scale scenario with high ecological value and medium/high flood risk)
1 £490 £275 £0 £30 £795 £7 1%
2 £490 £1,648 £0 £585 £2,723 £23 3%
3 £490 £3,916 £125 £1,110 £5,641 £49 6%
4 £490 £10,914 £125 £2,000 £13,529 £117 15%
5 £490 £22,367 £2,625 £3,350 £28,832 £249 32%
6 £490 £40,228 £2,625 £4,190 £47,533 £410 52%
9 On sites where medium or large scale wind technologies are suitable overall compliance costs would be expected to be significantly lower.
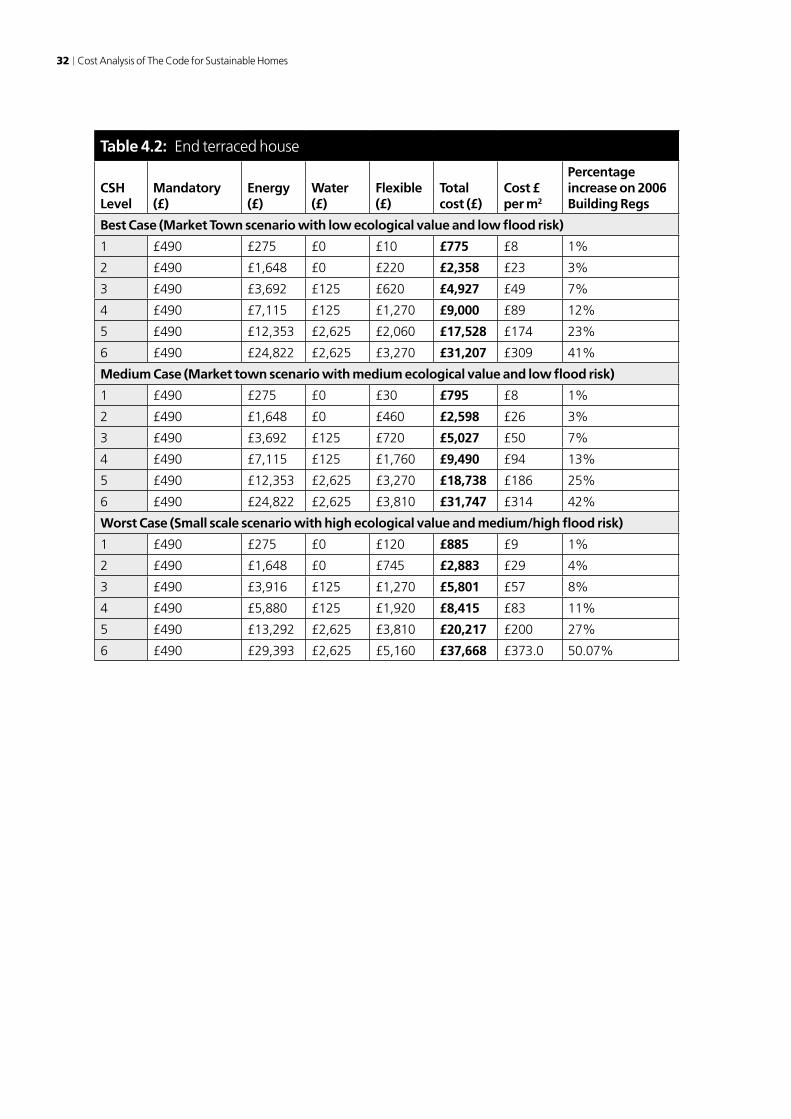
32 Cost Analysis of The Code for Sustainable Homes
Table 4.2: End terraced house
CSH Level
Mandatory (£)
Energy (£)
Water (£)
Flexible (£)
Total cost (£)
Cost £ per m2
Percentage increase on 2006 Building Regs
Best Case (Market Town scenario with low ecological value and low flood risk)
1 £490 £275 £0 £10 £775 £8 1%
2 £490 £1,648 £0 £220 £2,358 £23 3%
3 £490 £3,692 £125 £620 £4,927 £49 7%
4 £490 £7,115 £125 £1,270 £9,000 £89 12%
5 £490 £12,353 £2,625 £2,060 £17,528 £174 23%
6 £490 £24,822 £2,625 £3,270 £31,207 £309 41%
Medium Case (Market town scenario with medium ecological value and low flood risk)
1 £490 £275 £0 £30 £795 £8 1%
2 £490 £1,648 £0 £460 £2,598 £26 3%
3 £490 £3,692 £125 £720 £5,027 £50 7%
4 £490 £7,115 £125 £1,760 £9,490 £94 13%
5 £490 £12,353 £2,625 £3,270 £18,738 £186 25%
6 £490 £24,822 £2,625 £3,810 £31,747 £314 42%
Worst Case (Small scale scenario with high ecological value and medium/high flood risk)
1 £490 £275 £0 £120 £885 £9 1%
2 £490 £1,648 £0 £745 £2,883 £29 4%
3 £490 £3,916 £125 £1,270 £5,801 £57 8%
4 £490 £5,880 £125 £1,920 £8,415 £83 11%
5 £490 £13,292 £2,625 £3,810 £20,217 £200 27%
6 £490 £29,393 £2,625 £5,160 £37,668 £373.0 50.07%
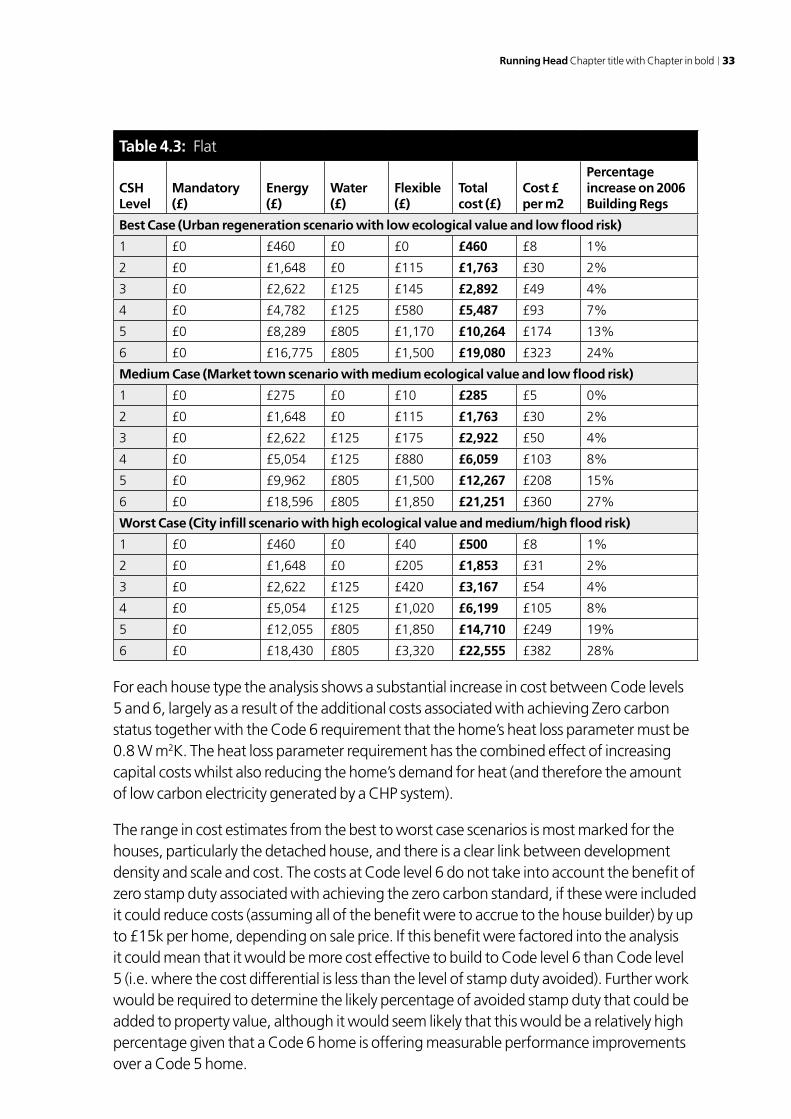
Running Head Chapter title with Chapter in bold 33
Table 4.3: Flat
CSH Level
Mandatory (£)
Energy (£)
Water (£)
Flexible (£)
Total cost (£)
Cost £ per m2
Percentage increase on 2006 Building Regs
Best Case (Urban regeneration scenario with low ecological value and low flood risk)
1 £0 £460 £0 £0 £460 £8 1%
2 £0 £1,648 £0 £115 £1,763 £30 2%
3 £0 £2,622 £125 £145 £2,892 £49 4%
4 £0 £4,782 £125 £580 £5,487 £93 7%
5 £0 £8,289 £805 £1,170 £10,264 £174 13%
6 £0 £16,775 £805 £1,500 £19,080 £323 24%
Medium Case (Market town scenario with medium ecological value and low flood risk)
1 £0 £275 £0 £10 £285 £5 0%
2 £0 £1,648 £0 £115 £1,763 £30 2%
3 £0 £2,622 £125 £175 £2,922 £50 4%
4 £0 £5,054 £125 £880 £6,059 £103 8%
5 £0 £9,962 £805 £1,500 £12,267 £208 15%
6 £0 £18,596 £805 £1,850 £21,251 £360 27%
Worst Case (City infill scenario with high ecological value and medium/high flood risk)
1 £0 £460 £0 £40 £500 £8 1%
2 £0 £1,648 £0 £205 £1,853 £31 2%
3 £0 £2,622 £125 £420 £3,167 £54 4%
4 £0 £5,054 £125 £1,020 £6,199 £105 8%
5 £0 £12,055 £805 £1,850 £14,710 £249 19%
6 £0 £18,430 £805 £3,320 £22,555 £382 28%
For each house type the analysis shows a substantial increase in cost between Code levels 5 and 6, largely as a result of the additional costs associated with achieving Zero carbon status together with the Code 6 requirement that the home’s heat loss parameter must be 0.8 W m2K. The heat loss parameter requirement has the combined effect of increasing capital costs whilst also reducing the home’s demand for heat (and therefore the amount of low carbon electricity generated by a CHP system).
The range in cost estimates from the best to worst case scenarios is most marked for the houses, particularly the detached house, and there is a clear link between development density and scale and cost. The costs at Code level 6 do not take into account the benefit of zero stamp duty associated with achieving the zero carbon standard, if these were included it could reduce costs (assuming all of the benefit were to accrue to the house builder) by up to £15k per home, depending on sale price. If this benefit were factored into the analysis it could mean that it would be more cost effective to build to Code level 6 than Code level 5 (i.e. where the cost differential is less than the level of stamp duty avoided). Further work would be required to determine the likely percentage of avoided stamp duty that could be added to property value, although it would seem likely that this would be a relatively high percentage given that a Code 6 home is offering measurable performance improvements over a Code 5 home.
34 Cost Analysis of The Code for Sustainable Homes
Chapter 5
Potential for cost reduction
Section 2.2 illustrated the potential for reduction in the costs associated with achieving the energy components of the Code with reductions of up to 35 per cent occurring by 2025. It would be expected that other Code elements could also be subject to reduced compliance costs in the future10. Potential sources of cost reduction include:
• LearningeffectssimilartothosemodelledforenergyinSection2.2
• Wholesalerevisionofbaseproducttodeliveratanewbenchmark(e.g.theuseoflowenergy light fittings is expected to become a standard product across the domestic sector by 2011)
• Abilitytoremovecostswholesaleoncetheindustrybecomesmorefamiliarwithdelivering the required performance standards. For example, it would be expected that within the next 18 months Robust Standard Details would begin to emerge that deliver the 8dB enhancement on Part E required for full Code credits in this area. This would avoid the need for expenditure on sound testing.
It is assumed that the relative cost of measures required to achieve savings in water consumption would follow a similar pattern to that seen for energy (although further modelling would be required to substantiate this). Table 5.1 summarises the key areas where it is expected that the costs of non mandatory Code credits would reduce by 2016 respectively. These reductions in compliance cost estimates are then used to estimate costs of compliance (in current prices) for homes in 2016 as shown in Table 5.2 (for the terraced house type only). It should be remembered, that by 2016 the energy elements of the Code up to Level 4 will be required to achieve compliance with Building Regulations.
10 Notwithstanding the potential for Code standards to be revised as performance benchmarks improve
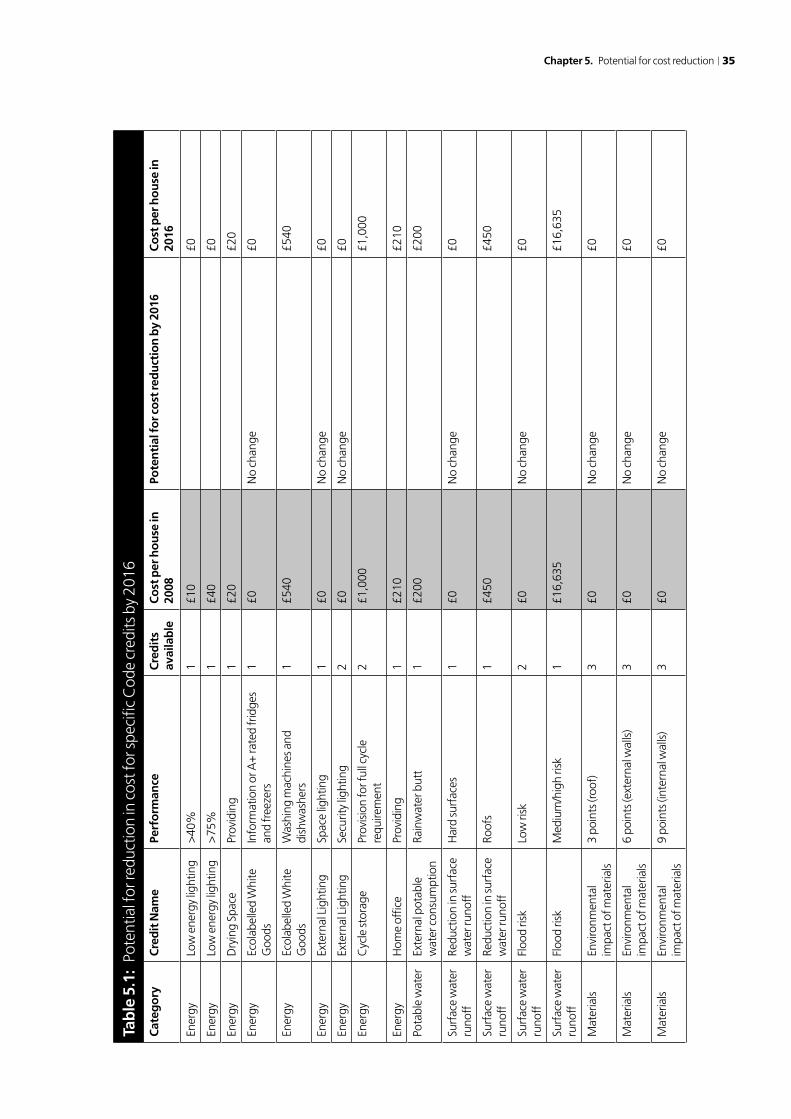
Chapter 5. Potential for cost reduction 35
Tab
le 5
.1:
Pote
ntia
l for
redu
ctio
n in
cos
t for
spec
ific
Cod
e cr
edits
by
2016
Cat
ego
ryC
red
it N
ame
Perf
orm
ance
Cre
dit
s av
aila
ble
Co
st p
er h
ou
se in
20
08Po
ten
tial
for c
ost
red
uct
ion
by
2016
Co
st p
er h
ou
se in
20
16
Ener
gy
Low
ene
rgy
light
ing
>40
%1
£10
£0
Ener
gyLo
w e
nerg
y lig
htin
g >
75%
1£4
0£0
Ener
gyD
ryin
g Sp
ace
Prov
idin
g 1
£20
£20
Ener
gy
Ecol
abel
led
Whi
te
Goo
dsIn
form
atio
n or
A+
rate
d fr
idge
s an
d fr
eeze
rs1
£0N
o ch
ange
£0
Ener
gyEc
olab
elle
d W
hite
G
oods
Was
hing
mac
hine
s and
di
shw
ashe
rs1
£540
£540
Ener
gyEx
tern
al L
ight
ing
Spac
e lig
htin
g1
£0N
o ch
ange
£0
Ener
gy
Exte
rnal
Lig
htin
gSe
curit
y lig
htin
g2
£0N
o ch
ange
£0
Ener
gyC
ycle
stor
age
Prov
isio
n fo
r ful
l cyc
le
requ
irem
ent
2£1
,000
£1,0
00
Ener
gyH
ome
offic
ePr
ovid
ing
1£2
10£2
10
Pota
ble
wat
erEx
tern
al p
otab
le
wat
er c
onsu
mpt
ion
Rain
wat
er b
utt
1£2
00£2
00
Surf
ace
wat
er
runo
ffRe
duct
ion
in su
rfac
e w
ater
runo
ffH
ard
surf
aces
1£0
No
chan
ge£0
Surf
ace
wat
er
runo
ffRe
duct
ion
in su
rfac
e w
ater
runo
ffRo
ofs
1£4
50£4
50
Surf
ace
wat
er
runo
ffFl
ood
risk
Low
risk
2£0
No
chan
ge£0
Surf
ace
wat
er
runo
ffFl
ood
risk
Med
ium
/hig
h ris
k1
£16,
635
£16,
635
Mat
eria
ls
Envi
ronm
enta
l im
pact
of m
ater
ials
3 po
ints
(roo
f)3
£0N
o ch
ange
£0
Mat
eria
ls
Envi
ronm
enta
l im
pact
of m
ater
ials
6 po
ints
(ext
erna
l wal
ls)
3£0
No
chan
ge£0
Mat
eria
ls
Envi
ronm
enta
l im
pact
of m
ater
ials
9 po
ints
(int
erna
l wal
ls)
3£0
No
chan
ge£0
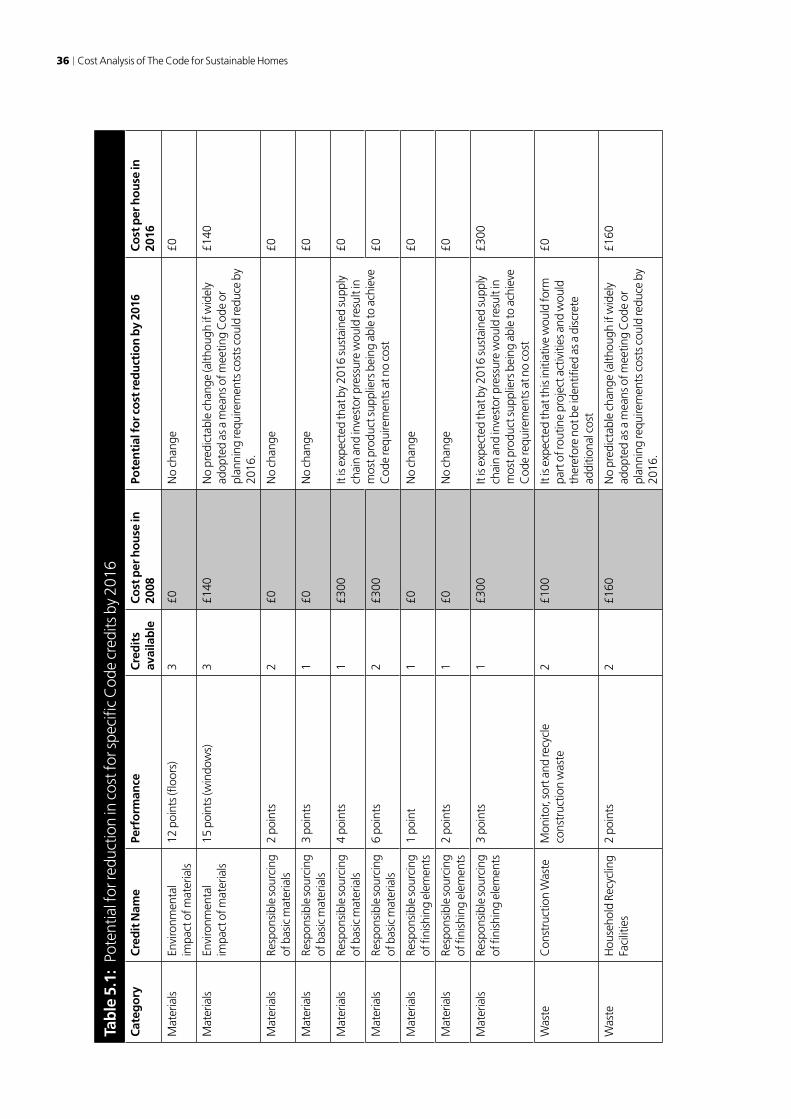
36 Cost Analysis of The Code for Sustainable Homes
Tab
le 5
.1:
Pote
ntia
l for
redu
ctio
n in
cos
t for
spec
ific
Cod
e cr
edits
by
2016
Cat
ego
ryC
red
it N
ame
Perf
orm
ance
Cre
dit
s av
aila
ble
Co
st p
er h
ou
se in
20
08Po
ten
tial
for c
ost
red
uct
ion
by
2016
Co
st p
er h
ou
se in
20
16
Mat
eria
ls
Envi
ronm
enta
l im
pact
of m
ater
ials
12 p
oint
s (flo
ors)
3£0
No
chan
ge£0
Mat
eria
ls
Envi
ronm
enta
l im
pact
of m
ater
ials
15 p
oint
s (w
indo
ws)
3£1
40N
o pr
edic
tabl
e ch
ange
(alth
ough
if w
idel
y ad
opte
d as
a m
eans
of m
eetin
g C
ode
or
plan
ning
requ
irem
ents
cos
ts c
ould
redu
ce b
y 20
16.
£140
Mat
eria
ls
Resp
onsi
ble
sour
cing
of
bas
ic m
ater
ials
2 po
ints
2£0
No
chan
ge
£0
Mat
eria
ls
Resp
onsi
ble
sour
cing
of
bas
ic m
ater
ials
3 po
ints
1£0
No
chan
ge£0
Mat
eria
ls
Resp
onsi
ble
sour
cing
of
bas
ic m
ater
ials
4 po
ints
1£3
00It
is e
xpec
ted
that
by
2016
sust
aine
d su
pply
ch
ain
and
inve
stor
pre
ssur
e w
ould
resu
lt in
m
ost p
rodu
ct su
pplie
rs b
eing
abl
e to
ach
ieve
C
ode
requ
irem
ents
at n
o co
st
£0
Mat
eria
ls
Resp
onsi
ble
sour
cing
of
bas
ic m
ater
ials
6 po
ints
2£3
00£0
Mat
eria
ls
Resp
onsi
ble
sour
cing
of
fini
shin
g el
emen
ts1
poin
t1
£0N
o ch
ange
£0
Mat
eria
ls
Resp
onsi
ble
sour
cing
of
fini
shin
g el
emen
ts2
poin
ts1
£0N
o ch
ange
£0
Mat
eria
ls
Resp
onsi
ble
sour
cing
of
fini
shin
g el
emen
ts3
poin
ts1
£300
It is
exp
ecte
d th
at b
y 20
16 su
stai
ned
supp
ly
chai
n an
d in
vest
or p
ress
ure
wou
ld re
sult
in
mos
t pro
duct
supp
liers
bei
ng a
ble
to a
chie
ve
Cod
e re
quire
men
ts a
t no
cost
£300
Was
teC
onst
ruct
ion
Was
teM
onito
r, so
rt a
nd re
cycl
e co
nstr
uctio
n w
aste
2£1
00It
is e
xpec
ted
that
this
initi
ativ
e w
ould
form
pa
rt o
f rou
tine
proj
ect a
ctiv
ities
and
wou
ld
ther
efor
e no
t be
iden
tified
as a
dis
cret
e ad
ditio
nal c
ost
£0
Was
teH
ouse
hold
Rec
yclin
g Fa
cilit
ies
2 po
ints
2£1
60N
o pr
edic
tabl
e ch
ange
(alth
ough
if w
idel
y ad
opte
d as
a m
eans
of m
eetin
g C
ode
or
plan
ning
requ
irem
ents
cos
ts c
ould
redu
ce b
y 20
16.
£160
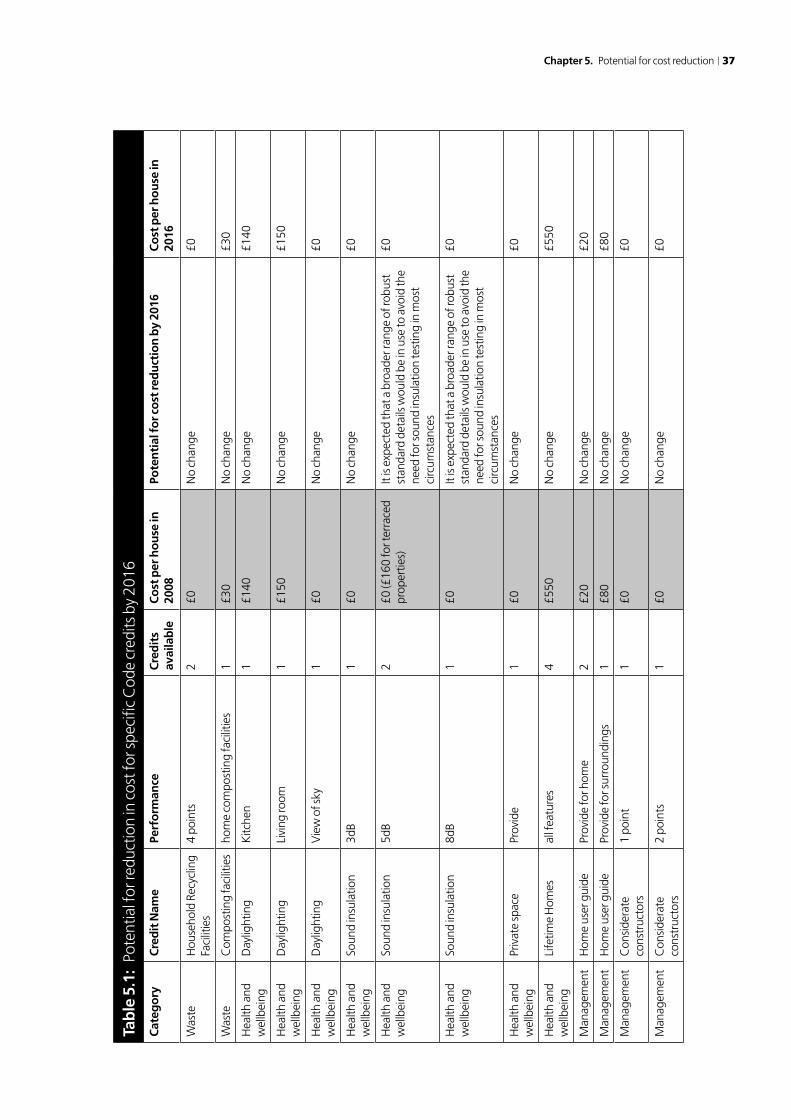
Chapter 5. Potential for cost reduction 37
Tab
le 5
.1:
Pote
ntia
l for
redu
ctio
n in
cos
t for
spec
ific
Cod
e cr
edits
by
2016
Cat
ego
ryC
red
it N
ame
Perf
orm
ance
Cre
dit
s av
aila
ble
Co
st p
er h
ou
se in
20
08Po
ten
tial
for c
ost
red
uct
ion
by
2016
Co
st p
er h
ou
se in
20
16
Was
teH
ouse
hold
Rec
yclin
g Fa
cilit
ies
4 po
ints
2£0
No
chan
ge£0
Was
teC
ompo
stin
g fa
cilit
ies
hom
e co
mpo
stin
g fa
cilit
ies
1£3
0N
o ch
ange
£30
Hea
lth a
nd
wel
lbei
ngD
aylig
htin
g K
itche
n 1
£140
No
chan
ge£1
40
Hea
lth a
nd
wel
lbei
ngD
aylig
htin
g Li
ving
room
1£1
50N
o ch
ange
£150
Hea
lth a
nd
wel
lbei
ngD
aylig
htin
g V
iew
of s
ky1
£0N
o ch
ange
£0
Hea
lth a
nd
wel
lbei
ngSo
und
insu
latio
n3d
B1
£0N
o ch
ange
£0
Hea
lth a
nd
wel
lbei
ngSo
und
insu
latio
n5d
B2
£0 (£
160
for t
erra
ced
prop
ertie
s)It
is e
xpec
ted
that
a b
road
er ra
nge
of ro
bust
st
anda
rd d
etai
ls w
ould
be
in u
se to
avo
id th
e ne
ed fo
r sou
nd in
sula
tion
test
ing
in m
ost
circ
umst
ance
s
£0
Hea
lth a
nd
wel
lbei
ngSo
und
insu
latio
n8d
B1
£0It
is e
xpec
ted
that
a b
road
er ra
nge
of ro
bust
st
anda
rd d
etai
ls w
ould
be
in u
se to
avo
id th
e ne
ed fo
r sou
nd in
sula
tion
test
ing
in m
ost
circ
umst
ance
s
£0
Hea
lth a
nd
wel
lbei
ngPr
ivat
e sp
ace
Prov
ide
1£0
No
chan
ge£0
Hea
lth a
nd
wel
lbei
ngLi
fetim
e H
omes
all f
eatu
res
4£5
50N
o ch
ange
£550
Man
agem
ent
Hom
e us
er g
uide
Prov
ide
for h
ome
2£2
0N
o ch
ange
£20
Man
agem
ent
Hom
e us
er g
uide
Prov
ide
for s
urro
undi
ngs
1£8
0N
o ch
ange
£80
Man
agem
ent
Con
side
rate
co
nstr
ucto
rs1
poin
t1
£0N
o ch
ange
£0
Man
agem
ent
Con
side
rate
co
nstr
ucto
rs2
poin
ts1
£0N
o ch
ange
£0
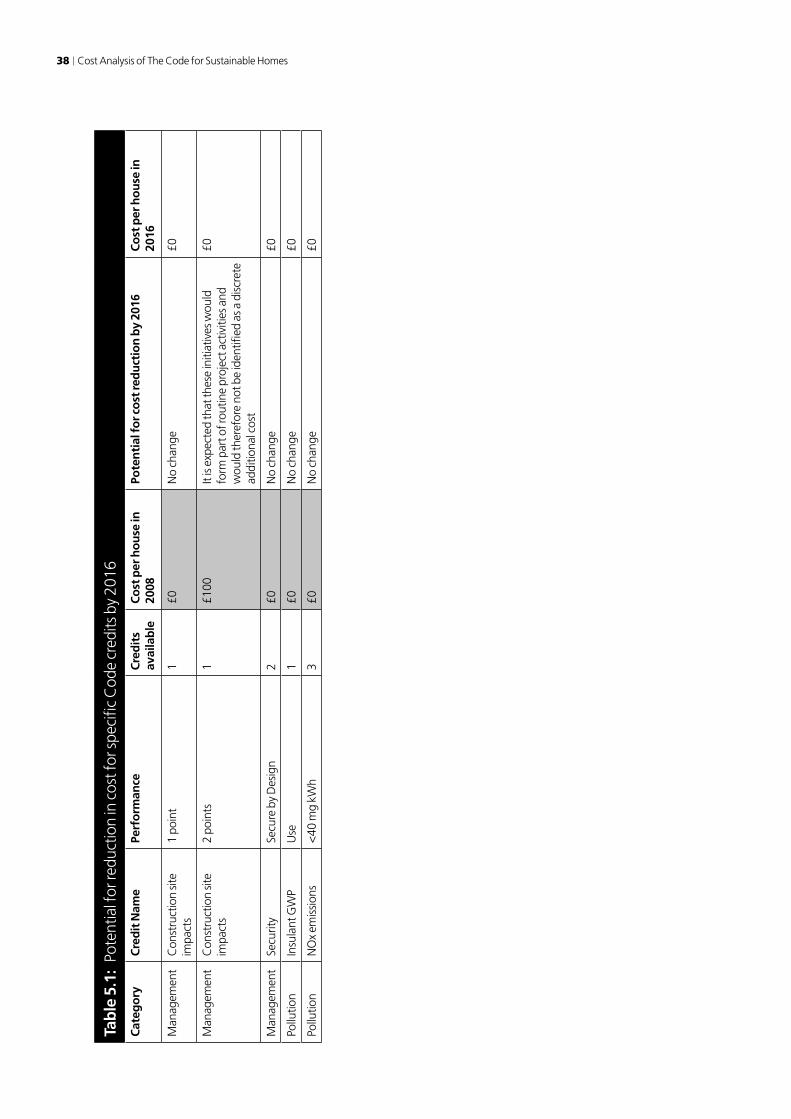
38 Cost Analysis of The Code for Sustainable Homes
Tab
le 5
.1:
Pote
ntia
l for
redu
ctio
n in
cos
t for
spec
ific
Cod
e cr
edits
by
2016
Cat
ego
ryC
red
it N
ame
Perf
orm
ance
Cre
dit
s av
aila
ble
Co
st p
er h
ou
se in
20
08Po
ten
tial
for c
ost
red
uct
ion
by
2016
Co
st p
er h
ou
se in
20
16
Man
agem
ent
Con
stru
ctio
n si
te
impa
cts
1 po
int
1£0
No
chan
ge£0
Man
agem
ent
Con
stru
ctio
n si
te
impa
cts
2 po
ints
1£1
00It
is e
xpec
ted
that
thes
e in
itiat
ives
wou
ld
form
par
t of r
outin
e pr
ojec
t act
iviti
es a
nd
wou
ld th
eref
ore
not b
e id
entifi
ed a
s a d
iscr
ete
addi
tiona
l cos
t
£0
Man
agem
ent
Secu
rity
Secu
re b
y D
esig
n2
£0N
o ch
ange
£0
Pollu
tion
Insu
lant
GW
PU
se1
£0N
o ch
ange
£0
Pollu
tion
NO
x em
issi
ons
<40
mg
kWh
3£0
No
chan
ge£0
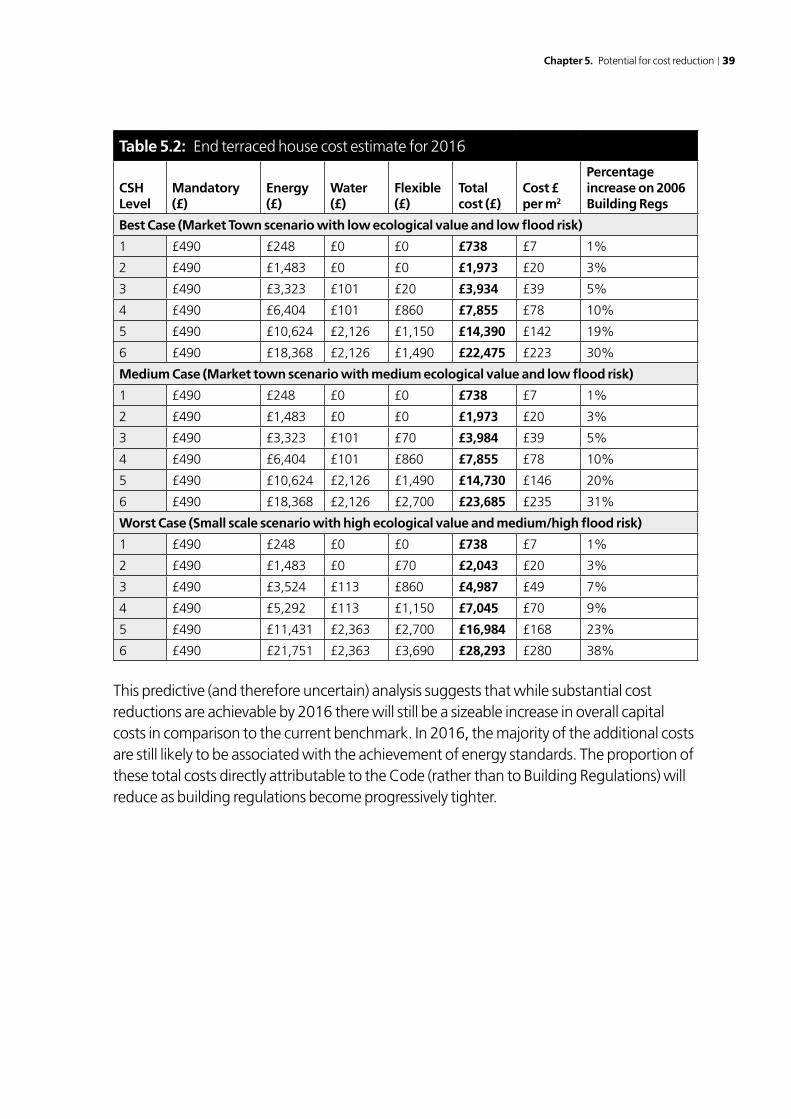
Chapter 5. Potential for cost reduction 39
Table 5.2: End terraced house cost estimate for 2016
CSH Level
Mandatory (£)
Energy (£)
Water (£)
Flexible (£)
Total cost (£)
Cost £ per m2
Percentage increase on 2006 Building Regs
Best Case (Market Town scenario with low ecological value and low flood risk)
1 £490 £248 £0 £0 £738 £7 1%
2 £490 £1,483 £0 £0 £1,973 £20 3%
3 £490 £3,323 £101 £20 £3,934 £39 5%
4 £490 £6,404 £101 £860 £7,855 £78 10%
5 £490 £10,624 £2,126 £1,150 £14,390 £142 19%
6 £490 £18,368 £2,126 £1,490 £22,475 £223 30%
Medium Case (Market town scenario with medium ecological value and low flood risk)
1 £490 £248 £0 £0 £738 £7 1%
2 £490 £1,483 £0 £0 £1,973 £20 3%
3 £490 £3,323 £101 £70 £3,984 £39 5%
4 £490 £6,404 £101 £860 £7,855 £78 10%
5 £490 £10,624 £2,126 £1,490 £14,730 £146 20%
6 £490 £18,368 £2,126 £2,700 £23,685 £235 31%
Worst Case (Small scale scenario with high ecological value and medium/high flood risk)
1 £490 £248 £0 £0 £738 £7 1%
2 £490 £1,483 £0 £70 £2,043 £20 3%
3 £490 £3,524 £113 £860 £4,987 £49 7%
4 £490 £5,292 £113 £1,150 £7,045 £70 9%
5 £490 £11,431 £2,363 £2,700 £16,984 £168 23%
6 £490 £21,751 £2,363 £3,690 £28,293 £280 38%
This predictive (and therefore uncertain) analysis suggests that while substantial cost reductions are achievable by 2016 there will still be a sizeable increase in overall capital costs in comparison to the current benchmark. In 2016, the majority of the additional costs are still likely to be associated with the achievement of energy standards. The proportion of these total costs directly attributable to the Code (rather than to Building Regulations) will reduce as building regulations become progressively tighter.
40 Cost Analysis of The Code for Sustainable Homes
Chapter 6
Conclusions
This update to previous analysis of the costs of associated with achieving different standards of the Code for Sustainable Homes refines the analysis by:
• Consideringtherelativecostsonfourdiscretedevelopmentscenarios
• Incorporatingamoredetailedanalysisofthecostsassociatedwithachievingtheminimum energy standards required at each level including for Code Level 6.
• AdjustingtheanalysisofsomeCodecategoriestoreflectthedetailoftheSeptember2007 Code technical guide
• Assessingthepotentialforreductionincostovertime
This revised analysis shows that the costs of achieving the higher code levels can vary quite substantially as a result of dwelling type, development type and site characteristics (e.g. ecological value and flood risk). The range in per dwelling cost estimates varies from £19k to £47k per unit. Lowest costs are typically seen for those developments where there is potential to use site wide carbon saving technologies (e.g. CHP systems), these are typically sites with relatively high numbers and densities of development. Nonetheless, in the absence of medium/large scale wind solutions it is necessary to make extensive use of microgeneration technologies (e.g. PV) to achieve the standards required at level 6.
The costs of achieving the specific energy standards required level 6 are typically higher than those associated with achieving zero carbon status (without the need for a heat loss parameter of less than 0.8 w/m2 K). This is because of the cost associated with the additional thermal efficiency measures and the impact of reduced heat demand on the carbon savings arising from CHP systems. Where it is possible to utilise medium/large scale wind turbines on site (or connected via a private wire) costs are expected to be substantially lower than for the approaches detailed in this analysis (assuming the distance of private wire required is not prohibitively expensive).
It is expected that costs of compliance will fall over time and that by 2016 they could have reduced by between 16 and 25 per cent depending on Code level.