Embed Size (px)
Citation preview

Islamic Republic of Afghanistan
Ministry of Public Health
General Directorate of Policy, Planning, and International Relations
Health Economics and Financing Directorate
Cost Analysis of the French
Medical Institute for
Children (FMIC)
December 2013
2013

Cost analysis of the French Medical Institute for Children (FMIC) ii
TABLE OF CONTENTS
ACKNOWLEDGEMENTS ................................................................................................................... iv
EXCUTIVE SUMMARY ....................................................................................................................... v
ABBREVIATIONS ............................................................................................................................... vi
I. INTRODUCTION .......................................................................................................................... 1
Background ......................................................................................................................................... 1
French Medical Institute for Children ................................................................................................. 1
II. OBJECTIVES ................................................................................................................................. 2
III. METHOD ................................................................................................................................... 2
Study Site and Period .......................................................................................................................... 3
Data Collection ................................................................................................................................... 3
Data Analysis ...................................................................................................................................... 4
V. RESULTS ....................................................................................................................................... 5
A. Overall Statistics ......................................................................................................................... 5
B. Utilization ................................................................................................................................... 6
C. Human Resources ....................................................................................................................... 6
D. Costs ............................................................................................................................................ 7
VI. LIMITATIONS ......................................................................................................................... 12
VII. DISCUSSION AND CONCLUSION ....................................................................................... 12
REFERENCES ..................................................................................................................................... 15
ANNEX 1: DEFINITIONS ................................................................................................................... 16
ANNEX 2: FIGURES ........................................................................................................................... 17

Cost analysis of the French Medical Institute for Children (FMIC) iii
LIST OF TABLES
Table 1. Data Requirements .................................................................................................................... 3
Table 2. Overall Statistics ....................................................................................................................... 5
Table 3. FMIC hospital BOR and ALOS ................................................................................................ 6
Table 4. Number of Staff ........................................................................................................................ 7
Table 5. Hospital Staffing Ratios ............................................................................................................ 7
Table 6. Hospital Costs by Cost Centers ................................................................................................. 8
Table 7. Hospital Total Cost Breakdown by Budget line ....................................................................... 8
Table 8. Recurrent Costs Breakdown ..................................................................................................... 9
Table 9. Hospital Costs by Clinical Services ....................................................................................... 10
Table 10. Hospital Revenue Sources .................................................................................................... 11
LIST OF FIGURES
Figure1. Framework for step-down cost accounting approach ............................................................... 3
Figure2. Average cost per Bed Day or Outpatient Visit by Department .............................................. 11

Cost analysis of the French Medical Institute for Children (FMIC) iv
ACKNOWLEDGEMENTS
Production of this report is a result of joint efforts of a number of individuals. We would like to take
this opportunity to thank Health Economics and Financing Directorate (HEFD) staff, specially (in
alphabetical order) Ahmad Reshad Osmani, Emal Masood, Faridoon Joyenda, Mohammad Saber
Perdes, Mohammad Samim Soroush, and Shuhrat Munir for their efforts in designing the study;
collecting and analyzing data; and producing the report. We are also grateful to the team of French
Medical Institute for Children (FMIC) for provision of data and cooperation during the study process.
We would like to acknowledge the support of Ms. Christine Kim from the United States Agency for
International Development (USAID)-funded Health Policy Project (HPP) in finalizing the report.
Finally, special thanks to the HEFD director, Ahmad Shah Salehi for his initiatives and overall
guidance.
Dr. Ahmad Jan Naeem
Deputy Minister of Policy, Plan and Technical Affairs
Ministry of Public Health, Afghanistan

Cost analysis of the French Medical Institute for Children (FMIC) v
EXCUTIVE SUMMARY
Background: Cost analysis is an essential tool relating the inputs of resources in monetary terms to
the outputs of services provided by the hospital. Fundamentally, effective analysis of hospital
performance requires the existence of both timely and accurate cost and output data. In most
developing countries (including Afghanistan) however, these basic ingredients are lacking due to poor
information systems and/or other sources of data, resulting in health expenditures being substituted
for actual costs in analyzing hospital costs. The primary rationale for this study is to provide a basis
on which to compare costs of individual departments and services within the French Medical Institute
for Children (FMIC) as a private hospital and use them in case of outsourcing services in public
hospitals. The report thus gives details of the unit costs for various services from outpatient care to
various inpatient services in considering future models of public-private partnerships for health care
delivery.
Method: The study uses step-down method to track the costs of inputs uses to find out the unit costs
of each service at FMIC. The hospital is divided into three cost centers (departments): general,
ancillary (intermediate) and clinical. The general cost centers provide services to ancillary and clinical
cost centers. The ancillary cost centers provide services to clinical departments and patients. A
clinical department provides services directly to patients.
Results: Total costs of FMIC are presented in two different scenarios, with and without the costs of
the welfare fund. Overall results indicate that the total cost of FMIC with welfare fund during the
study period was $ 15,701,841, while, without welfare fund was $ 12,068,561. Figures’ breakdown in
this study represents hospital cost with welfare funding. On average, inpatient services at FMIC
hospital cost $413 per occupied bed per year. The total cost per inpatient admission is approximately
$1,858. The average cost per outpatient visit is $ 105. Considering the cost centers, large proportion
of costs goes to general cost centers that account for 43% of the hospital’s total cost. The second big
proportion goes to clinical departments that account for 33% of the total costs. Ancillary departments
account for the lowest proportion of total costs that is 23%. Human resources, facility management,
Radiology and laboratory beside welfare fund of the hospital composite the major components of the
hospital costs.
Recommendations: The study provides some useful insights into the cost and income across the
FMIC. In particular it provides an understanding of the relationship of costs to the different mixes of
services. Considering the per capita Gross Domestic Product (GDP) of Afghans at USD 715, cost of
services across the outpatient and inpatient departments are high. In order to reduce average unit cost
of services, it is recommended to increase the number of OPD and IPD services delivered.
Furthermore, findings indicate, that utilization indicators of the hospitals such BOR and ALOS differ
from the proposed levels recommended by the MoPH, which may be the source of inefficiency in the
hospital. FMIC should consider areas where ALOS can be decreased from 4.5 day to 3 days and
similarly, BOR should be increased to 80-85 percent. As a result, average cost of service per
admission could decrease.
In order to avoid any confusion and enhance an accountable and transparent mechanism in
implementing the welfare fund, the formation of an independent body is strongly recommended to
closely monitor the welfare fund management.

Cost analysis of the French Medical Institute for Children (FMIC) vi
ABBREVIATIONS
AKDN Agha Khan Development Network
ALOS Average Length of Stay
BOR Bed Occupancy Rate
CEO Chief Executive Officer
ENT Ear, Nose and Throat
FMIC French Medical Institute for Children
GDP Gross Domestic Product
GoIRA Government of the Islamic Republic of Afghanistan
HEF Health Equity Fund
HEFD Health Economics and Financing Directorate
HMIS Health Management Information System
HOSPICAL Hospital Cost Allocation Tool
HPP Health Policy Project
IPD Inpatient Department
ISO International Organization for Standardization
MoPH Ministry of Public Health
MSH Management Sciences for Health
NGO Non-Governmental Organization
OPD Outpatient Department
OSR Outside Referral
PPP Public Private Partnership
USAID United States Agency for International Development

Cost analysis of French Medical Institute for Children (FMIC) 1
I. INTRODUCTION
Background
In almost every country, the delivery of health services involves some sort of public-private
partnership (PPP). In many countries, the delivery of health services is often contracted to a for-profit
or not-for-profit entity using public funds. Additionally, even where public facilities are involved, the
procurement of drugs and equipment or diagnostic testing often involves sourcing from the private
sector. Although intrinsically it is believed that the public sector is less efficient than the private
sector, studies have shown varying degrees of quality in the delivery of services by both. In Australia,
studies have shown that public hospitals operate more efficiently than private hospitals after adjusting
for case mix (Duckett and Jackson, 2000, p. 439). Furthermore, a systematic literature review
identified and compared 149 for-profit and not-for-profit health facilities in the US and found that 88
non-profit facilities performed better in terms of cost, outcomes of care, access, and mission; 43
studies found no difference, and 18 found for-profit facilities to perform better. (Rosenau and Linder,
2003, pp. 219--241)
The concept and implementation of PPP in the delivery of health services in developing countries is
complex and remains not as well understood as other mechanisms of contracting by the public sector.
In Afghanistan, there is a need to better understand the different models of PPP in the provision of
hospital services to have a clearer picture of the costs, quality, flexibility, and complexity of the types
of options that may thrive in the country. The French Medical Institute for Children (FMIC) is
currently the longest functioning PPP hospital for children in Afghanistan. This report presents the
first cost analysis study on an operational PPP hospital. The results will support policymakers to
better understand the costs of operating a PPP similar to FMIC and how their investments have
provided better care for children, especially the most vulnerable.
French Medical Institute for Children
A memorandum 1 of agreement was signed on October 8, 2006, and renewed in 2009, by the
Government of the Islamic Republic of Afghanistan (GoIRA), the Government of France; Agha Khan
Development Network (AKDN) (including the University in Karachi, Agha Khan Health Services and
other relevant entities within AKDN), La Chaine De L'Espoir and Enfants Afghanistan. This
memorandum identifies different domains of cooperation amongst aforementioned parties and the
GoIRA. Issues like autonomy of the FMIC in terms of healthcare service provision, staffing, training,
fundraising by FMIC are all fully discussed in the memorandum. Furthermore, responsibilities of
GoIRA in terms of providing welfare fund, tax exemption of the Institute are also part of the
agreement.
FMIC was formally inaugurated in 2006, and began providing pediatric surgical care, including
general and orthopedic surgery. FMIC was soon providing services in pediatric medicine, cardiology,
neurosurgery, cardiac surgery, pediatric plastic surgery and anesthesia. It is now an 83 bed hospital
which also includes 15 intensive care beds. The hospital is equipped with state-of-the art CT scanning
facilities, general radiology and ultrasound. It houses a pharmacy, a well-equipped laboratory and
1 Memorandum was provided to the Health Economics and Financing by International Relations Directorate of MoPH.

Cost analysis of French Medical Institute for Children (FMIC) 2
four operating theatres. FMIC also has Tele-medicine links with the Agha Khan University in
Karachi, Bamyan and Badakhshan Provincial Hospital in Afghanistan and Khorog General Oblast
Hospital in Tajikistan.
At present, a Patient Welfare programme is being run by French Medical Institute for Children
(FMIC) which is a PPP model in a collaborative way wherein the facility managed by Agha Khan
Development Network (AKDN) and funded by MoPH, French Non-Governmental Organization
(NGO) and AKDN, as the facility is striving to be sustainable through its own revenue generation.
FMIC receives a specific amount of funds2 from the GoIRA to provide welfare services to families
with an income less than 10,000 Afs (US$200) per month. Besides, government of France and some
other entities also contribute to the welfare fund. Indigent patients requesting for welfare support to
meet their expenses for hospitalization/inpatient treatment at FMIC, will be financially supported
through the Hospital's Patient Welfare Program, provided they meet the hospital's eligibility criteria
for welfare support. There are different eligibility criteria for Inpatient and Outpatient Welfare.3
FMIC mainly provides inpatient and outpatient services. However, Outside Referral (OSR) is another
type of service that is being provided. OSRs are related to those patients that visit non-FMIC doctors
and they are prescribed laboratories tests and imagery procedures at FMIC.
II. OBJECTIVES
The objective of this study is to provide costing data on FMIC, which is a certified tertiary hospital.
Findings will be used by the MoPH to indicate the costs of quality services at a private hospital
providing specialty services with a welfare fund. Cost presentations might be used to purchase
services if PPP schemes are considered in the future.
III. METHOD
The cost analysis is conducted from the hospital management prospective. The study applied to the
step-down method to track the costs of inputs to find out the unit costs of each service at FMIC
Hospital. The hospital is divided into three cost centers (departments): general, ancillary
(intermediate) and clinical. The general cost centers provide services to ancillary and clinical cost
centers. The ancillary cost centers provide services to clinical departments and patients. A clinical
department provides services directly to patients. Figure 1 shows the step-down cost allocation from
general to ancillary and clinical cost centers.
2 FMIC Memorandum between the GoIRA and French Medical Institute for Children, Page 6 3 Inpatient and outpatient welfare fund is provided to all indigent patients whose household income does not
exceed 10,000 AF per month. Exceptions might be considered if the number of household member is higher
than six people.

Cost analysis of French Medical Institute for Children (FMIC) 3
Figure1. Framework for step-down cost accounting approach
Study Site and Period
FMIC is located in the 3rd district of Kabul city. The study examines the costs and efficiency
indicators from FMIC for January 1st to December 31st, 2012.
Data Collection
Data were collected by the Health Economics and Financing Directorate (HEFD) of the MoPH. After
providing an official letter and meeting with the leadership of the hospital, the HEFD team was
directed to the management team of the hospital to get the required data. A series of tables were
developed to collect the data related to costs of inputs and basic hospital information. The following
table shows data type and sources with detailed explanations.
Table 1. Data Requirements
Area Data Requirements General Hospital
Data
Hospital organization and cost centers
Structure of administrative, ancillary and clinical departments
Total number of beds and breakdown by department
Utilization Utilization statistics broken down by department
o Total number of visits for all outpatient departments
o Total number of admissions, hospitalization days, discharges and
deaths for inpatient departments
Staffing Complete staff list for facility, including name, function, level, payment
source
Determination of cost center associated with each staff
Detailed salary breakdown for each staff, including base salary,
allowances, insurance, etc.

Cost analysis of French Medical Institute for Children (FMIC) 4
Area Data Requirements Expenditure Total number of admissions, hospitalization days, discharges and deaths
for inpatient hospitals
Total hospital expenditure, broken down by detailed line item
o Expenditures on drugs, salaries, capital costs, other recurrent
expenditures
Drug expenditure broken down by ancillary or clinical department
Ancillary Department
Statistics
For each ancillary department, the cost or quantity of ancillary
department services broken down by clinical department
Data Analysis
The Hospital Cost Allocation Tool (HOSPICAL) was used to analyze the information. HOSPICAL is
a Microsoft Excel based tool developed by Management Sciences for Health (MSH). The tool adopts
the step-down costing approach and finds the total costs and unit costs of each department including
the inpatient and outpatient units.
Data were classified into groups related to human resources; drugs and other recurrent medical
supplies; food; laundry and cleaning; utilities and other recurrent costs; training and quality assurance,
laboratory; imagery; welfare fund; and depreciation costs.
Human Resources: Human resources costs were allocated to general, ancillary and clinical
departments based on the proportion of staff time given to each department. The data related to the
distribution of staff time were collected from the hospital management team. Allocation of staff to
different departments was identified by FMIC management.
Drugs and other recurrent medical supplies: The costs of drugs and other medical supplies were
allocated to pharmacy unit of ancillary departments. Then, costs were allocated to clinical
departments based on the percentage of usage. The data on usage of drugs by clinical departments
were collected from the records of medical unit.
Laundry, cleaning, utilities and other recurrent expenditures: These costs were allocated to
general departments. Then, the costs of general departments were allocated to ancillary and clinical
departments.
Training and Quality Assurance: Quality assurance and training consist of a considerable amount of
expenses. All their expenses are allocated to the clinical management and training cost centers.
Laboratory and Imagery: Expenses related to laboratory and imagery are allocated to laboratory and
imagery cost centers, respectively.
Welfare fund: The welfare fund is included as a portion of total hospital expenditures. Therefore,
welfare funds were distributed among different OPD clinics and IPD based on utilization.
Capital: Depreciation costs of buildings and equipment are all calculated on a straight line method.
They are included in the study and allocated to specific cost centers.

Cost analysis of French Medical Institute for Children (FMIC) 5
IV. KEY ASSUMPTIONS
Human Resources:
Capital cost: The FMIC put an estimated 25 years life for buildings and 10 years for medical
equipment. The depreciation costs (annual cost) of capitals are calculated with a straight line method.
Welfare Fund: The FMIC mainly spend welfare fund in outpatient and inpatient departments. It is
distributed among different clinical services on basis of their utilization rate. Outside referral gets the
highest welfare fund due to its higher utilization than other clinics.
Other expenditure: Some other miscellaneous expenses that were given as an aggregate amount but
related to outpatient clinics were allocated to different outpatient visits on basis of their utilization.
V. RESULTS
The results of the analysis are organized into four categories: overall statistics, utilization, human
resources and expenditures.
A. Overall Statistics
FMIC has two inpatient wards (Medicine and Surgery), and Outpatient departments such as,
medicine; surgery; cardiac; Ear, Nose and Throat (ENT); dental and corporate clinic. Although
outpatient wards accept adult patients too, only children are admitted into inpatient wards for
treatment. There is an exclusive type of service that is named OSR. This category of service provides
laboratory, imaging and pharmacy for patients that are referred from other facilities.
The following table includes overall statistics of the FMIC hospital.
Table 2. Overall Statistics
Number of Hospital’s Active Beds 83
Number of Staff 563
Inpatient Admission 4,825
Inpatient Discharged 4,654
Inpatient Deaths 166
Outpatient visits 83,684
OSR4 120,269
FMIC mainly has a total number of 83 beds in two inpatient departments, 42 beds in surgery
department and 41 in internal medicine department.
Welfare statistics include 3,612 inpatients 5 and 42,177 outpatients. The majority of outpatients
benefitting from the welfare fund were adults for radiology, laboratory, and consultations. Thus, 74.8
percent of inpatient admissions 50.4 percent of outpatient visits were welfare fund recipients.
4 OSR means Outside referrals, these volumes are not the spin off volumes from IPD and OPD, these are related to those patients who visited Non-FMIC doctors and they prescribed to do their laboratory test and radiology procedures from FMIC.

Cost analysis of French Medical Institute for Children (FMIC) 6
B. Utilization
The hospital utilization indices, such as Bed Occupancy Rate (BOR) and Average Length of Stay
(ALOS), illustrate patterns of utilization. Not all factors affecting hospital utilization are necessarily
linked to efficiency or service quality, utilization data is nevertheless an important starting point for
identifying inefficiencies; best practices and opportunities for improving service delivery. This section
highlights two key utilization indices, as indicated above. BOR and ALOS are important efficiency
indictors for hospitals, but there is no standard rate which can be applicable to all hospitals due to
differences in the treatment nature and context of hospitals. However, Based on Health Management
Information System (HMIS) of Afghanistan the normal BOR is between 80-85 percent. The following
table shows hospital BOR and ALOS during the study period.
Table 3. FMIC hospital BOR and ALOS
Hospitalization Days 21,708
BOR 72%
ALOS 4.5 Days
Surgery Ward ALOS 4.9 Days
Medicine Ward ALOS 4.1 Days
FMIC has a BOR of 72 percent, which is lower than the recommended 85 percent. Similarly, it is
found that ALOS is extended in both inpatient departments though extension of ALOS in surgery
ward reasonable due to admission of complicated cases. Pediatric hospitals tend to have higher
ALOS, particularly in surgery as shown here. When compared to national public hospitals, Indira
Gandhi Pediatric Hospital was found to have an overall ALOS of 4.2 days. (Salehi and Foshanji et al.,
2012) The MoPH recommended ALOS is 3 days for hospitals, however, varying types of services and
patient mix will affect the ALOS across facilities. Possible reasons for extended ALOS at FMIC
hospital may include:
Patients admitted for diagnostic tests remain in the hospital until the results are received before
undergoing medical or surgical treatments.
An absence of standard practices and protocols for the same cause of admission creates variations
in treatment among the physicians of the same department.
C. Human Resources
Human resources consume a major proportion of the hospital budget. Efficient management of human
resources can improve the overall efficiency of a hospital. Staffing of FMIC is mainly studied in five
main categories described in Table 4:
Table 4 shows the number of staff in each of the abovementioned categories.
5 There were also 870 Kate Project Welfare Fund patients who receive 20% coverage through the welfare fund but are not 100% covered.

Cost analysis of French Medical Institute for Children (FMIC) 7
Table 4. Number of Staff
Staff category Description
Number % of
Total
Doctor
Includes all medical doctors working in outpatient and
inpatient departments. In addition, dentists are included
in this category.
67 12%
Nurse Includes all nurses who graduated either from the school
of nursing or from the high institute of nursing. 159 28%
Pharmacist
Considered technician/skilled personnel: Includes
personnel with a university degree or a special skill.
They include lab technicians, dietitians, pharmacists and
drivers for vehicles or ambulances.
12 2%
Technician Same as above 71 13%
Support Staff Considered unskilled personnel: Includes all personnel
working as janitors and messengers 188 33%
Admin/Finance
Includes personnel performing administrative work.
Most personnel in this category are working in the
overhead department while very little work in the
clinical management cost center.
65 12%
Total Staff 562 100%
The table below shows staffing ratios at FMIC Hospital.
Table 5. Hospital Staffing Ratios
Indicators Ratio
Doctor to Nurse 1.1 : 2
Doctor to Bed 1.3 : 2
Nurse to Bed 2.3 : 2
It is worth to mention that there is no standardized ratio among number of doctors, nurses, and beds at
the international level. It depends on the context of countries and specifically the types of services
provided at the hospital. However, the number of doctors and nurses employed at FMIC can serve a
larger population of clients if the hospital is expanded.
D. Costs
Understanding cost of services at FMIC hospital helps the MoPH to understand the cost of quality
services in an ISO 9001: 2008 certified hospital6 similar to FMIC.
6International Organization for Standardization (ISO) certification refers to the approval bestowed by accreditation bodies upon companies that meet the ISO standards http://www.fmic.org.af/AboutUs/QualityandSafetyPolicy/Pages/cert.aspx

Cost analysis of French Medical Institute for Children (FMIC) 8
Total Cost
Total cost of FMIC is indicated in two different scenarios, cost with welfare and without welfare fund.
The total cost of hospital was US$15,701,841 with welfare and US$12,068,561 without welfare. The
tables provide total costs of the hospital given the two different scenarios.
Cost by Cost Centers
Costs were allocated to three main cost centers: general, ancillary and clinical costs.
Table 6. Hospital Costs by Cost Centers
Category
Cost with
Welfare fund
(USD)
% of Total
Cost without
Welfare fund
(USD)
% of
Total
Cost of General Departments 6,829,414 43% 6,829,414 57%
Cost of Ancillary Departments 3,684,687 23% 3,684,687 31%
Cost of Clinical Departments 5,187,740 33% 1,554,460 13%
Total Hospital Costs 15,701,841 100% 12,068,561 100%
The above table shows total cost breakdown of the hospital in two scenarios: cost with welfare fund
and cost without welfare fund. The largest proportion of cost in both scenarios goes to the general
departments. This could be due to the inclusion of all direct and indirect costs of administration,
support staff, maintenance, cleaning and food. The second largest proportion of cost with the welfare
fund goes to the clinical departments, but it goes to the ancillary departments if welfare fund is not
considered in the calculations. Table 6 explicitly reveals that welfare fund has been totally directed
towards the clinical departments.
Human resources, recurrent expenditures, and capital costs are major components of the hospital
costs. Within the total recurrent costs, maintenance and utility, guest house compose a large
proportion of recurrent expenditure amongst others. The following table shows the proportion of each
component.
Table 7. Hospital Total Cost Breakdown by Budget line
Category Cost (USD) with
welfare fund
% of Total
Costs
Cost (USD) without
welfare fund
% of Total
Cost
Total Staff Costs 4,748,120 30% 4,748,120 39%
Total Recurrent Costs 9,858,741 63% 6,225,461 52%
Total Capital Costs 1,094,980 7% 1,094,980 9%
Total Hospital Costs 15,701,841 100% 12,068,561 100%
Recurrent Costs: The recurrent costs include expenditures of kitchen, laundry, pharmaceuticals,
transportation and other recurrent utilities. Table 7 indicates breakdown of recurrent costs.

Cost analysis of French Medical Institute for Children (FMIC) 9
Table 8. Recurrent Costs Breakdown
Expenditure item Amount in USD % of Total
Administrator Professional Services 686 0.01%
Consulting Clinics, Surgery 12,493 0.13%
Consulting Clinics, Medicine 35,594 0.36%
Consulting Clinics, Cardiac 2,774 0.03%
Consulting Clinics, ENT 2,114 0.02%
Consulting Clinics, Dental 612 0.01%
Consulting Clinics, Corporate 756 0.01%
Finance 672,235 6.82%
Facilities Management 901,983 9.15%
Food Services 190,833 1.94%
General Director and Chief Executive
Officer’s (CEO) Office 93,247 0.95%
Guest House 402,352 4.08%
Human Resources 58,818 0.60%
Information Technology 113,454 1.15%
Laboratory 509,729 5.17%
Marketing 30,998 0.31%
Medical Coordinator Office 411,322 4.17%
Medicine 5,955 0.06%
Materials Management & Administration 49,803 0.51%
Nursing Services 690,463 7.00%
Post Graduate Medical Education 42,302 0.43%
Pharmacy 728,445 7.39%
Quality Assurance 22,116 0.22%
Radiology 1,060,815 10.76%
Surgery 28,641 0.29%
Surgery (IPD1) Welfare 1,415,702 14.36%
Medicine (IPD2) Welfare 1,372,364 13.92%
Surgery Clinic Welfare 115,520 1.17%
Medicine Clinic Welfare 329,140 3.34%
Cardiac Clinic Welfare 25,652 0.26%
ENT Clinic Welfare 19,546 0.20%
Dental Clinic Welfare 5,657 0.06%
Corporate Clinic Welfare 6,990 0.07%
OSR Welfare 342,710 3.48%
Capacity Building 156,920 1.59%
Total 9,858,740 100%

Cost analysis of French Medical Institute for Children (FMIC) 10
Cost breakdown shows that OPD and IPD welfare are the main cost drivers; while, visiting clinics
gets the lowest share of costs. Facility management with US$901,908 (9%) constitutes a big portion
of recurrent expenditures. Based on international standards maintenance cost of hospital ranges from
10-15 percent of total recurrent cost. (Mills, 1990, pp. 107--117) Therefore, FMIC has a reasonable
cost for facility management. It is important to mention that in the second scenario, welfare funds are
not included in the recurrent costs.
Cost by Services
At FMIC hospital, the majority of costs go to the inpatient departments. Amongst the outpatient
departments, internal medicine clinic gets the highest portion of costs. OSR patients who are referred
to FMIC for delivering laboratory and imagery services consume a considerable cost. The following
table shows the proportion of costs driven by these two units.
Table 9. Hospital Costs by Clinical Services
Clinical Services Cost with Welfare
fund (USD) % of Total
Surgery (IPD1) 4,687,274 29.9%
Medicine (IPD2) 4,237,092 27.0%
Surgery Clinic Visits 1,322,047 8.4%
Medicine Clinic Visits 1,921,860 12.2%
Cardiac Clinic Visits 476,054 3.0%
ENT Clinic Visits 224,433 1.4%
Dental Clinic Visits 167,251 1.1%
Corporate Clinic Visits 198,430 1.3%
OSR 2,467,401 15.7%
Total 15,701,842 100.0%
Average Unit cost of Services
Average unit cost of services at FMIC provides evidence for the MoPH to understand the cost of a
specific service in a certified tertiary hospital. Internal medicine with US$437 presents the highest
cost per bed per day in the inpatient department. ALOS in the internal medicine department is 4.1
days. Consequently, average cost per admission at internal medicine ward is US$1,791. Cost per
admission at surgery ward is US$1,911. The below table shows average unit cost of clinical services
at FMIC

Cost analysis of French Medical Institute for Children (FMIC) 11
Figure2. Average cost per Bed Day or Outpatient Visit by Department
E. Revenue source and its implication
As a private for-profit hospital, FMIC has various revenue sources. Table 11 shows different sources
with their monetary amounts from the study period.
Table 10. Hospital Revenue Sources
REVENUE ITEM SOURCE OF FUNDING AMOUNT
(USD)
% of
Total
Room and Nursing Revenue Individual 669,596 4%
Inpatient Revenue Individual 3,167,897 20%
Outpatient and OSR Revenue Individual 5,152,853 33%
Grants Utilization (Other than
GoIRA)
La Chaine De L’Espoir, Roshan,
The Agha Khan and others 5,289,919
34%
GoIRA Funding Government of Afghanistan 1,247,600 8%
Other Revenue Miscellaneous 173,980 1%
Total Revenue 15,701,845 100%
The largest proportion (US$5,152,853) of revenue comes from grants and charities. GoIRA provides
US$1,000,000 in cash and US$247, 600 in exemptions for the cost of utilities such as water, and
electricity.
$390 $437
$69 $35
$111 $69
$178 $170
$21
$- $50
$100 $150 $200 $250 $300 $350 $400 $450 $500
Average Cost per Bed Day or Outpatient Visit by Department

Cost analysis of French Medical Institute for Children (FMIC) 12
VI. LIMITATIONS
Limitations of the study include the following:
The HOSPICAL tool provides costs for cost centers but not by clinical service. This limits the
ability to interpret findings for the use and application of introducing case-mix payments.
As a private hospital, certain levels of cost data were not shared openly. Availability of
disaggregated data posed a limitation resulting in various assumptions to be made, such as
with human resources. The cost per position was not provided, rather only at aggregated
levels.
A price list per service was not made readily available by FMIC, limiting the interpretation of
findings.
VII. DISCUSSION AND CONCLUSION
HEFD conducted a costing practice of a number of hospitals based in Kabul city. This report presents
core findings of cost and efficiency analysis of FMIC, the first PPP facility included in the series of
cost analysis studies.
Total operating costs of FMIC from 1st January to 31st December 2012 were allocated to direct and
indirect cost centers. These cost centers are categorized as general, ancillary and clinical departments
from which clinical and ancillary are direct cost centers while general department is considered as
indirect cost center. The general and ancillary departments such as administration, maintenance,
pharmacy and laboratory provide support to clinical departments including inpatient and outpatient.
Overall, twenty functional direct and indirect cost centers were identified at FMIC. General
departments composed of seven centers, ancillary composed of four and clinical departments
composed of nine cost centers.
Thirty six major categories of expense channels were identified to determine hospital total costs,
including staff salaries, hospital finance and facility management, imagery and laboratory,
pharmaceuticals, welfare fund, quality assurance, medical equipment and other miscellaneous
recurrent expenditures.
The general cost is the major cost driver with 43 percent contribution to the total cost of the hospital.
The breakdown of staff costs within the departments indicate that the cost of staff in clinical
departments is the highest while clinical and ancillary compose 36 percent and 26 percent of costs,
respectively. Likewise, physicians and nurses staff cost are the two highest, technicians and other
skilled and non-skilled staff are the two consequent cost drivers. Human resource ratios were
comparable to those found in national hospitals, with greater efficiency in the doctor to nurse ratio at
FMIC. However, doctor and nurse to bed ratios tend to be higher than those found at other public
hospitals.
Recurrent cost of hospital is mainly composed of cost incurred by general departments, pharmacy and
imagery, inpatient and outpatient departments and welfare fund. However, recurrent cost such as
guest house, finance and Information technology also constitute big amounts. Average cost of drugs
per hospitalization day is US$33.5. This estimate does not include prescription drugs purchased by
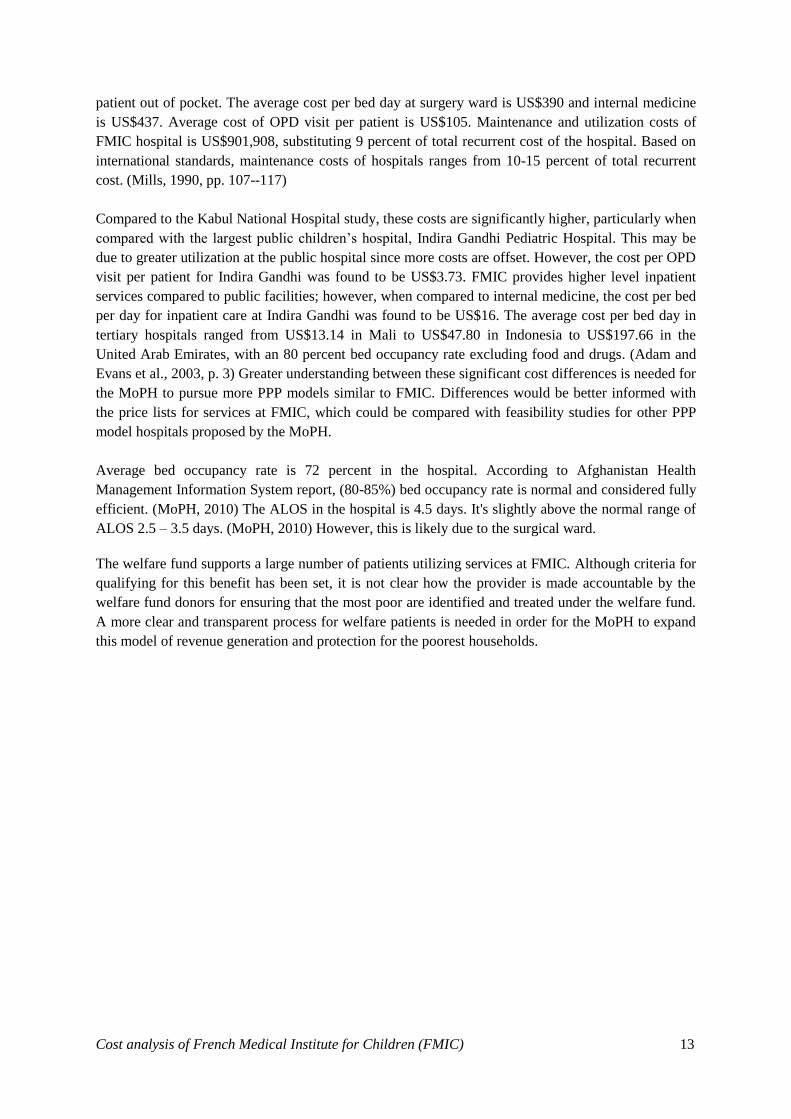
Cost analysis of French Medical Institute for Children (FMIC) 13
patient out of pocket. The average cost per bed day at surgery ward is US$390 and internal medicine
is US$437. Average cost of OPD visit per patient is US$105. Maintenance and utilization costs of
FMIC hospital is US$901,908, substituting 9 percent of total recurrent cost of the hospital. Based on
international standards, maintenance costs of hospitals ranges from 10-15 percent of total recurrent
cost. (Mills, 1990, pp. 107--117)
Compared to the Kabul National Hospital study, these costs are significantly higher, particularly when
compared with the largest public children’s hospital, Indira Gandhi Pediatric Hospital. This may be
due to greater utilization at the public hospital since more costs are offset. However, the cost per OPD
visit per patient for Indira Gandhi was found to be US$3.73. FMIC provides higher level inpatient
services compared to public facilities; however, when compared to internal medicine, the cost per bed
per day for inpatient care at Indira Gandhi was found to be US$16. The average cost per bed day in
tertiary hospitals ranged from US$13.14 in Mali to US$47.80 in Indonesia to US$197.66 in the
United Arab Emirates, with an 80 percent bed occupancy rate excluding food and drugs. (Adam and
Evans et al., 2003, p. 3) Greater understanding between these significant cost differences is needed for
the MoPH to pursue more PPP models similar to FMIC. Differences would be better informed with
the price lists for services at FMIC, which could be compared with feasibility studies for other PPP
model hospitals proposed by the MoPH.
Average bed occupancy rate is 72 percent in the hospital. According to Afghanistan Health
Management Information System report, (80-85%) bed occupancy rate is normal and considered fully
efficient. (MoPH, 2010) The ALOS in the hospital is 4.5 days. It's slightly above the normal range of
ALOS 2.5 – 3.5 days. (MoPH, 2010) However, this is likely due to the surgical ward.
The welfare fund supports a large number of patients utilizing services at FMIC. Although criteria for
qualifying for this benefit has been set, it is not clear how the provider is made accountable by the
welfare fund donors for ensuring that the most poor are identified and treated under the welfare fund.
A more clear and transparent process for welfare patients is needed in order for the MoPH to expand
this model of revenue generation and protection for the poorest households.

Cost analysis of French Medical Institute for Children (FMIC) 14
VIII. RECOMMENDATIONS
Recommendations of this study are mainly in two parts specific to cost and utilization indicators.
Cost related recommendations: It is found that cost of services is much higher than the per capita
Gross Domestic Product (GDP) of Afghans which was estimated at USD 715 in 2011/2012.
(Afghanistan Statistical Yearbook, 2011/2012) In order to reduce the average unit cost of services, it
is proposed to increase the number of services delivered by increasing utilization in OPD and IPD.
This would result in economies of scale and thereby decreasing the unit costs.
Utilization Indicators of the Hospital: Utilization indicators of the hospital such as BORs, ALOS
could influence the cost of services. FMIC has an average ALOS of 4.5 days which is higher than the
proposed range (2.5 – 3.5 days) of MoPH. Similarly, MoPH suggests 80-85 percent as a normal BOR,
while FMIC shows a BOR lower than the normal range. However, it should be reminded that
utilization indicators of a hospital may vary by type of services provided and context of the hospital.
An increase in the utilization of indicators of the hospitals would reduce average unit costs of services
across FMIC and the hospital has enough potential to scale up its services with the current inputs.
Welfare fund of the Hospital: User fee could be an obstacle between the poor and access to
healthcare services. According to Noirhomme and Meessen et al, results of many studies indicate that
user fees in the health sector exclude the poorest quintile from accessing quality health services.
Therefore, it is recommended to introduce user fee with caution and take appropriate measures to
protect the poor. On the other hand, Health Equity Fund (HEF) can improve beneficiaries’ access to
healthcare services by paying on behalf of poor families. To successfully implement HEF and get
better result from this mechanism, it is important to think about an accountable and transparent
system. (Noirhomme and Meessen et al., 2007, pp. 246--262)
Thus, in order to improve accountability of the provider and transparency in the implementation of
HEFs, a separation of functions is recommended for the distribution of HEFs. Purchasing of health
services and beneficiary identification shouldn’t be the sole responsibility of a health care provider. In
addition, there should be clear guiding principles established for managing HEFs. Noirhomme and
Meessen et al identified these principles as “(1) good knowledge of the socio-economic conditions of
the population; (2) minimal managerial capacity of the people who identify indigents; (3) no conflict
of interest towards patients or providers, so they are not subject to pressure; (4) accountable to the
funder; and (5) guarantee a presence at hospital level order to avoid conflicts of interest.”
(Noirhomme and Meessen et al., 2007, pp. 246--262)
As GoIRA finances US$1,000,000 annually to FMIC for the purpose of the HEF, an independent
body is strongly recommended to manage the welfare fund. Additionally, more evidence on the
effectiveness of the HEF at FMIC is needed to fully understand its design, management, and
implementation to serve as a potential model for the future as the MoPH considers other health
financing and revenue generation options at public tertiary hospitals.

Cost analysis of French Medical Institute for Children (FMIC) 15
REFERENCES
Adam, T., Evans, D. B. and Murray, C. J. 2003. Econometric estimation of country-specific hospital
costs. Cost effectiveness and resource allocation, 1 (1), p. 3.
Afghanistan Statistical Yearbook. 2011/2012. [report] Kabul: Government of Islamic Republic of
Afghanistan.
Duckett, S. J. and Jackson, T. J. 2000. The new health insurance rebate: an inefficient way of assisting
public hospitals. The Medical Journal of Australia, 172 (9), p. 439.
Mills, A. 1990. The economics of hospitals in developing countries. Part I: expenditure patterns.
Health policy and planning, 5 (2), pp. 107--117.
MoPH. 2011. [Database]. Afghanistan Ministry of Public Health, Health Management Information
System (HMIS), Kabul.
Noirhomme, M., Meessen, B., Griffiths, F., Ir, P., Jacobs, B., Thor, R., Criel, B. and Van Damme, W.
2007. Improving access to hospital care for the poor: comparative analysis of four health equity funds
in Cambodia. Health policy and planning, 22 (4), pp. 246--262.
Rosenau, P. V. and Linder, S. H. 2003. Two Decades of Research Comparing For-Profit and
Nonprofit Health Provider Performance in the United States*. Social Science Quarterly, 84 (2), pp.
219--241.
Salehi, A., Foshanji, A. I., Osmani, A. R., Behzad, A., Ismailzada, F., Joyenda, F., Sadat, H., Saeed,
K. M. A., Bishop, M., Hashimi, M. N., Perdes, M. S., Zawoli, M. Y., Oshang, N., Rasa, N., Ahmady,
S., Alawi, S. M. K. and Munir, S. 2012. Cost Analysis of Kabul's National Hospitals. [report] Kabul:
Afghanistan Ministry of Public Health.

Cost analysis of French Medical Institute for Children (FMIC) 16
ANNEX 1: DEFINITIONS
Allocation of Costs: The assignment of costs to different cost centers or departments according to
estimated use of resources (in terms of space, number of staff, cost, number of bed days and
admission etc.) by those cost centers.
Average Length of Stay (ALOS): average length of one inpatient hospitalization stay. It is calculated
by dividing the total number of bed days by the total number of discharges (including deaths).
Bed Day: a day during which a person is confined to a bed and in which the patient stays overnight in
a hospital. Day cases (patients admitted for a medical procedure or surgery in the morning and
released before the evening) should be excluded. It should be based on a head count that is performed
at the same time each day.
Bed Occupancy Rate (BOR): the number of bed days occupied by patients as a percentage of the
total available bed days in the hospital. BOR is calculated by dividing the number of occupied bed
days for the period by the number of available bed days for the period, and expressing the result as a
percentage. An “ideal” BOR is 85%.
Cost-Center: a program or a department within a hospital.
1. General Cost Center: Managerial, administrative, and financial activities that support but do not
directly provide patient care services. For example, administration, maintenance and utilities,
transport, kitchen, social services, clinical management, etc.
2. Ancillary Cost Center: Medical support activities indirectly required to deliver a clinical
service. For example, central store, pharmacy, blood bank, family planning, vaccination,
radiology, Operation Theater, laboratory, physical therapy, etc.
3. Clinical Cost Center: Direct medical activities pertaining to the production of clinical services.
Step-down Costing: This is a process of allocating general and ancillary costs to clinical cost centers
to get a fully loaded unit cost per visit and per bed day. The allocation is based on a proportional
distribution of those costs. It is a two-step allocation. In the first step, the costs of general departments
are assigned to inpatient, outpatient and ancillary cost centers based on a certain allocation factor. In
the second step, the costs of ancillary services are allocated to inpatient and outpatient cost centers
according to their service utilization figures.
Unit Cost per Bed Day: the total (direct and indirect) cost of producing inpatient services divided by
the total number of bed days for a given timeline. Note that it is very difficult to get a unit cost per bed
day by diagnosis (e.g., peritonitis) because hospitals include many complex diagnoses. For this
reason, the final result of the step-down process is the unit cost per bed day by department.
Unit Cost per Outpatient Visit: the total cost (direct and indirect) of producing outpatient services
divided by the number of outpatient visits for a given timeline.

Cost analysis of French Medical Institute for Children (FMIC) 17
ANNEX 2: FIGURES
Figure 1. Number of Staff by Staff Type
Figure 2. Hospital Total Cost Breakdown by Budget Line
6712%
15928%
122%
7113%
18833%
6512%
Doctor
Nurse
Pharmacist
Technician
Support Staff
Admin/Finance
0
2,000,000
4,000,000
6,000,000
8,000,000
10,000,000
12,000,000
Total Staff Costs Total Recurrent Costs Total Capital Costs

Cost analysis of French Medical Institute for Children (FMIC) 18
Figure 3: Hospital Revenue Sources
Figure 4. Average cost per bed day or outpatient visit
4%
20%
33%
34%
8%
1%Room and NursingRevenue
Inpatient Revenue
Outpatient and OSRRevenue
Grants Uilization (Otherthan GoA)
GoA Funding
Other Revenue