Embed Size (px)
Citation preview

EPA
United StatesEnvironmental ProtectionAgency
Solid Waste and Emergency Response (5102G)
EPA 542-R-00-013February 2001clu-in.org
Cost Analyses for SelectedGroundwater Cleanup Projects:Pump and Treat Systemsand Permeable Reactive Barriers
SUMMARY
Groundwater contamination is present at many Superfund and RCRA corrective action sites. Groundwater cleanuptechnologies, such as pump-and-treat (P&T) systems and permeable reactive barriers (PRBs), are being used at anumber of those sites. Information about the costs of groundwater cleanup technologies and factors that affect thosecosts may be valuable to site managers, technology developers and users, and others involved in groundwaterremediation efforts to identify and evaluate those technologies for new and ongoing projects. This report presentsthe results of an analysis, performed by the U.S. Environmental Protection Agency (EPA), of costs for groundwatercleanup incurred at 48 sites (the 32 P&T sites and 16 PRB sites listed in Exhibit 1). The report is based on data incase studies prepared by EPA and other members of the Federal Remediation Technologies Roundtable (FRTR) andby the Remediation Technologies Development Forum (RTDF), and supplements EPA’s analysis of 28 groundwaterremediation projects (Groundwater Cleanup: Overview of Operating Experience at 28 Sites, September 1999,EPA 542-R-99-006).
The analysis of the 48 sites found that there is a significant amount of variability in the costs of groundwatercleanups and that many of the factors that affect costs are site-specific. However, the following overall conclusionscan be drawn:
& The types of contaminant groups in the groundwater affect the capital costs of a P&T system. In general, capitalcosts and annual operating costs were lower for sites at which chlorinated solvents are present, alone or withother volatile organic compounds (VOCs), than for sites at which other combinations of contaminants (such asVOCs with metals) are present. For sites at which complex combinations are present, it generally was necessaryto use more complex aboveground treatment systems.
& The types of above-ground treatment affect the annual operating costs of a P&T system. For P&T sites at whichchlorinated solvents are present, alone or with other VOCs, and at which air stripping or granular activatedcarbon (GAC) treatment only are used, annual operating costs were lower than for sites at which the samecontaminants are present but a wider variety of treatment technologies are used. The additional treatmenttechnologies sometimes require additional labor and use of both chemicals and energy.
& For the sites in this analysis, the capital costs for PRBs generally were lower than those for P&T systems. Decisions about whether a PRB or P&T system would be less expensive for a given site generally are based ontotal life-cycle costs for each type of system (including total capital and operating costs); such site-specificfactors as hydrogeology, contaminant type, extent of contamination, and remedial goals often are considered inmaking such decisions. In addition, PRBs may not be technically feasible at all sites.
The FRTR includes senior executives of eight agencies that have an interest in exchanging information about remediationtechnologies. Primary members include the U.S. Departments of Defense, Energy, and the Interior, and EPA. Otherparticipants include the Nuclear Regulatory Commission, the National Aeronautics and Space Administration, the TennesseeValley Authority, and the U.S. Coast Guard. Information about the Roundtable is available through the FRTR’s web site at<www.frtr.gov>. Information about the P&T sites was obtained from FRTR case studies.
The RTDF includes members representing industry, government, and academia who have an interest in identifying stepsgovernment and industry can take together to develop and improve the environmental technologies needed to address theirmutual cleanup problems in the safest, most cost-effective manner possible. Information about the RTDF is available throughthe RTDF’s web site at <www.rtdf.org>. Information about PRB sites was obtained primarily from an RTDF report; limitedinformation was obtained from FRTR and other sources.

2
& Economies of scale were observed when the P&T system treats relatively large volumes of groundwater. Forsystems treating more than 20 million gallons of groundwater per year, capital and annual operating costs pervolume of groundwater treated per year appear to be lower than those costs for systems treating less than 20million gallons per year.
CRITERIA FOR SELECTING SITES FOR ANALYSIS
Exhibit 2 provides a description of P&T and PRB technologies. In selecting sites for this analysis, the availableFRTR and RTDF case studies were screened using the following criteria:
& The P&T or PRB system was operated on a full-scale basis (rather than as a pilot-scale or fielddemonstration).
& For P&T sites, information was available about the capital cost, the annual average operating cost, and theamount of groundwater treated per year of system operation; for PRB sites, information was available aboutthe capital cost.
& For P&T sites, aquifer cleanup goals (not containment-only goals) had been established.
For the analysis, 48 sites were identified (32 P&T sites and 16 PRB sites, including one site at which a PRBreplaced a P&T system), as shown in Exhibit 1.
EXHIBIT 1. ALPHABETICAL LIST OF SELECTED SITES
Site Name
P&T Sites (32)
Amoco Petroleum Pipeline, Michigan Mystery Bridge at Highway 20 Superfund Site, DOW/DSI,
Baird and McGuire Superfund Site, Massachusetts Odessa Chromium I Superfund Site, OU 2, Texas
Bofors Nobel Superfund Site, OU 1, Michigan Odessa Chromium IIS Superfund Site, OU 2, Texas
City Industries Superfund Site, Florida Old Mill Superfund Site, Ohio
Des Moines TCE Superfund Site, OU 1, Iowa SCRDI Dixiana Superfund Site, South Carolina
Former Firestone Facility Superfund Site, California Site A (confidential Superfund site), New York
Former Intersil, Inc. Site, California* Sol Lynn/Industrial Transformers Superfund Site, Texas
French Limited Superfund Site, Texas Solid State Circuits Superfund Site, Missouri
Gold Coast Superfund Site, Florida Solvent Recovery Services of New England, Inc. Superfund Site,
JMT Facility RCRA Site (formerly Black & Decker), New York Sylvester/Gilson Road Superfund Site, New Hampshire
Keefe Environmental Services Superfund Site, New Hampshire Twin Cities Army Ammunition Plant Superfund Site (TCAAP),
King of Prussia Technical Corporation Superfund Site, New United Chrome Superfund Site, Oregon
LaSalle Electrical Superfund Site, Illinois U.S. Aviex Superfund Site, Michigan
Libby Groundwater Superfund Site, Montana U.S. Department of Energy (DOE) Kansas City Plant, Missouri
McClellan Air Force Base Superfund Site, OU B/C California U.S. DOE, Savannah River site, A/M Area, South Carolina
Mid-South Wood Products Superfund Site, Arkansas Western Processing Superfund Site, Washington
PRB Sites (16)
Aircraft Maintenance Facility, Oregon Industrial Site, Northern Ireland
Caldwell Trucking, New Jersey Industrial Site, South Carolina
Federal Highway Administration Facility, Colorado Kansas City Plant, Missouri
Former Drycleaning Site, Germany Lowry Air Force Base, Colorado
Former Intersil, Inc. Site, California* Marzone Inc./Chevron Chemical Company, Georgia
Former Manufacturing Site, New Jersey Nickel Rim Mine Site, Ontario, Canada
Industrial Site, Kansas U.S. Coast Guard Support Center, North Carolina
Industrial Site, New York Y-12 Site, Oak Ridge National Laboratory, Tennessee
*Both a PRB and a P&T system were operated at the former Intersil site.

3
EXHIBIT 2. SELECT GROUNDWATER TREATMENT TECHNOLOGIES
Pump and Treat (P&T)
P&T involves extracting contaminated groundwater through recovery wells or trenches and treating the groundwater by ex situ(aboveground) processes, such as air stripping, carbon adsorption, biological reactors, or chemical precipitation. Variables inthe design of a typical P&T system include:
& The number and pumping rate of groundwater extraction points (determined by such factors as the extent ofcontamination and the productivity of the contaminated aquifer)
& The ex situ treatment processes employed (determined by such factors as system throughput and the contaminants thatrequire remediation)
& The discharge location for the effluent from the treatment plant (determined by such factors as location of the site andregulatory requirements)
Additional information about the fundamentals of P&T technology can be found in Design Guidelines for ConventionalPump-and-Treat Systems.
Permeable Reactive Barriers (PRBs)
A PRB is an in situ (below-ground) treatment zone of reactive material that degrades or immobilizes contaminants asgroundwater flows through it. PRBs are installed as permanent, semi-permanent, or replaceable units across the flow path of acontaminated plume. Natural gradients transport contaminants through strategically placed media. The media degrade, sorb,precipitate, or otherwise remove groundwater contaminants. The choice of the reactive media for a PRB is based on thespecific organic or inorganic contaminant to be remediated. Most PRBs installed to date use zero-valent iron (Feo) as thereactive medium for converting contaminants to nontoxic or immobile species. Other applications under development uselimestone, organic carbon, or bone char phosphate. The hydrogeologic setting at the site also is crucial; PRBs are best appliedto shallow, unconfined aquifer systems in unconsolidated deposits, as long as the reactive material is more conductive than theaquifer.
Most PRBs are installed in one of two basic configurations: funnel-and-gate or continuous trench, although other techniquessuch as hydrofracturing also are used. The funnel-and-gate system employs impermeable walls to direct the contaminatedplume through a gate, or treatment zone, that contains the reactive media. In a continuous trench configuration, a trench isinstalled across the entire path of the plume and is filled with reactive media. Most PRBs installed to date have had depths of50 feet (ft) or less. PRBs having depths of 30 ft or less can be installed with a continuous trencher, while those installed atdepths between 30 and 70 ft require a more innovative installation method, such as biopolymers. Installation of PRBs atdepths greater than 70 ft is more challenging.
IMPORTANT DATA CONSIDERATIONS
Several important considerations related to the data and results presented in this report are listed below:
& The sites selected are not a statistically representative sample of groundwater remediation projects; rather,they present a range of the types of systems that are used to clean up groundwater at Superfund and RCRAcorrective action sites.
& Cost data were provided by EPA remedial project managers (RPMs), site owners, or vendors; include bothactual and estimated costs of groundwater cleanup; and were not verified independently by EPA.
& Groundwater cleanup has been completed at only two of the 32 P&T sites and is ongoing at the other P&Tsites. For the 30 P&T sites where remediation is ongoing, the costs presented in this report do not necessarilyrepresent the total cost of cleaning up groundwater at the site.
& Because groundwater cleanup is ongoing at most of the sites and the total time necessary to complete cleanupis not known, this report presents the average annual operating costs rather than the total operating costsincurred during site remediation. Likewise, no net present value (NPV) was calculated for the remedial costsbecause additional costs will be incurred at sites at which remediation is ongoing, and the length of time eachsystem will operate in the future is not known. Rather, costs are presented as unit costs (cost per year or costper 1,000 gallons). The unit costs are described in more detail later in this report.
& The costs for PRB and P&T systems presented in this report may include costs for source control remedies(such as slurry walls) employed at the sites, when the source control was an integrated part of the groundwatercleanup. Exhibits 10 and 11 present the components included in the costs for each of the sites included in thisanalysis.
4
METHODOLOGY FOR EVALUATING THE COSTS OF P&T AND PRB TECHNOLOGIES
Total capital and total annual operating costs were provided in the individual case studies by EPA RPMs, siteowners, and vendors. For this analysis, the following methodology was used to calculate unit costs and adjustedcosts for the 48 sites.
Unit Costs
There are several ways in which unit costs can be calculated for groundwater remediation systems. The followingthree types of unit costs were used in this analysis:
& Average operating cost per year of operation: This value was calculated by dividing the total operating costto date by the number of years represented by that cost. Several factors affect the average operating cost peryear, including throughput of the system, the treatment processes required to treat the extracted groundwater,and the operating efficiency of the system. Because a breakdown of annual operating costs by year was notavailable for most of the sites, the change in operating costs over the life of a site’s remediation system couldnot be evaluated.
& Capital cost per 1,000 gallons of groundwater treated per year: This value represents the relative costs ofinstalling remedial systems of various capacities, and is influenced by such factors as:
- the complexity of the aquifer (which affect the size and complexity of the system needed to extract thecontaminated groundwater)
- the types of contaminants targeted for treatment at the site (which affect the components of the treatmentplant needed to remove the contaminants)
- the water and air discharge limits for the particular site (which affect the treatment plant componentsneeded)
- restoration goals (which affect the time frame for cleanup)
& Average annual operating cost per 1,000 gallons of groundwater treated per year: This value represents therelative costs of operating systems of various capacities and complexities. Similar to the capital cost per1,000 gallons of groundwater treated per year, this unit cost is highly dependent on such site-specific factorsas the complexity of the aquifer, the types of contaminants targeted for treatment, the water and air dischargelimits, and the restoration goals.
Adjusted Costs
Remediation costs for the selected sites were adjusted for the location of the site (location adjustment) and for theyears in which costs were incurred (inflation adjustment). Those adjustments are described below and inAppendix A to this report. Appendix A presents the equations used to adjust the total capital and total annualoperating costs; gives equations used to calculate the average annual operating costs; and shows examplecalculations for one of the sites.
• Location adjustment: Costs were adjusted for location by multiplying the costs provided for each site by anArea Cost Factor (ACF) Index published by the U.S. Army Corps of Engineers in PAX Newsletter No. 3.2.1,dated March 31, 1999 and available at <http://www.hq.usace.army.mil/cemp/e/es/pax/paxtoc.htm>.
• Inflation adjustment: The inflation factor used for this analysis was based on the Construction Cost Indexpublished by Engineering News Record. The most current year that had an annual average inflationadjustment factor available at the time of preparing this report was for 1999. Costs were adjusted to year1999 dollars by multiplying the costs provided for each site by an inflation adjustment factor for the year inwhich the costs were incurred. For capital cost time adjustment, the inflation adjustment factor for the actualyear that the costs were incurred was used. For annual operating cost time adjustment, the inflationadjustment factor for the median year of all years over which the costs were incurred was used. TheConstruction Cost Index is available at http://www.enr.com/cost/costcci.asp.
5
RESULTS AND CONCLUSIONS
This analysis considered six main factors that affect the cost of P&T and PRB technology applications (discussedin reference 1): (1) characteristics or properties of contaminants present, (2) system design and operation, (3)source control, (4) hydrogeologic setting, (5) extent of contamination, and (6) remedial goals. The analysis foundthat the costs varied significantly between sites and that many of the factors that affect costs are site-specific. Inaddition, the amount of information available about each of the factors varied by site. For the analysis, generalconclusions were identified about the effect of a factor when information related to that factor was available forfive or more sites.
Exhibits 3 through 9 present the results of the cost analysis for the 48 sites, with detailed data for each sitesummarized in Exhibits 10 and 11 for P&T and PRB sites, respectively. Exhibit 3 provides an overall summary ofthe remedial cost and unit cost data for the 48 sites included in the analysis, while Exhibits 4 through 9 present 25th
percentile, 50th percentile (median), 75th percentile, and average costs, based on the types of contaminants present,the technologies used, and the volume of groundwater treated each year. General conclusions about the effect ofcontaminant property factors and system design and operation factors are presented below.
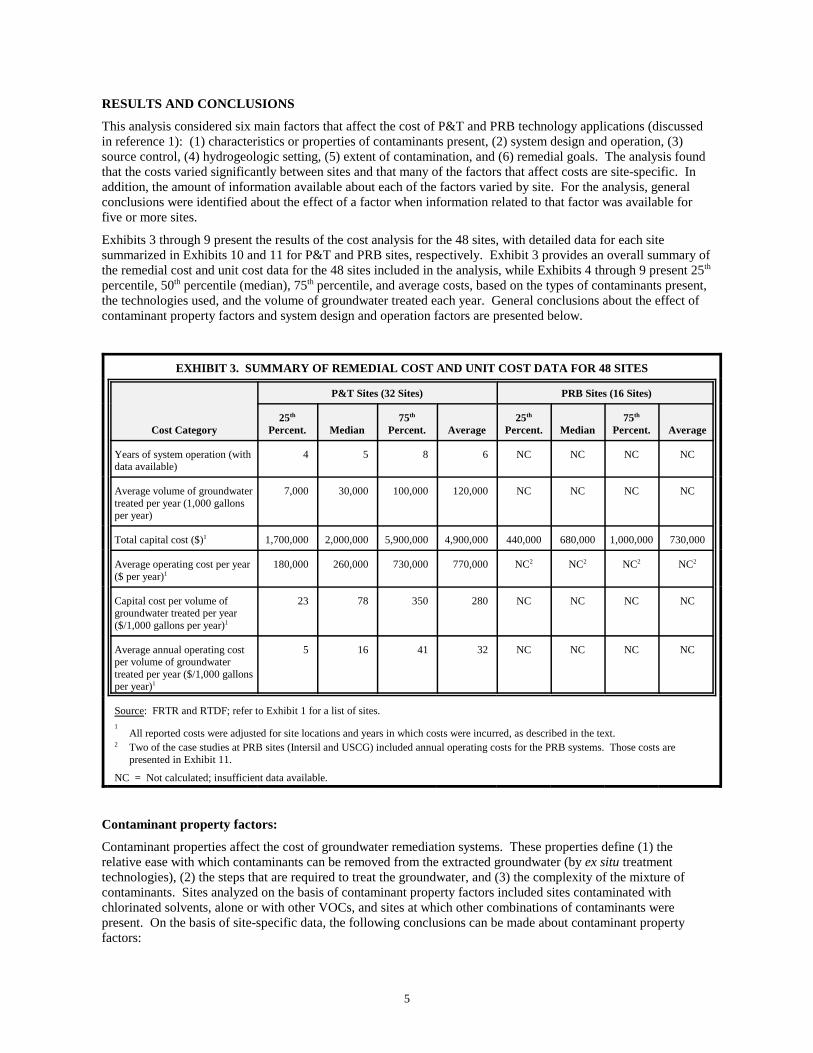
EXHIBIT 3. SUMMARY OF REMEDIAL COST AND UNIT COST DATA FOR 48 SITES
Cost Category
P&T Sites (32 Sites) PRB Sites (16 Sites)
25th
Percent. Median75th
Percent. Average25th
Percent. Median75th
Percent. Average
Years of system operation (withdata available)
4 5 8 6 NC NC NC NC
Average volume of groundwatertreated per year (1,000 gallonsper year)
7,000 30,000 100,000 120,000 NC NC NC NC
Total capital cost ($)1 1,700,000 2,000,000 5,900,000 4,900,000 440,000 680,000 1,000,000 730,000
Average operating cost per year($ per year)1
180,000 260,000 730,000 770,000 NC2 NC2 NC2 NC2
Capital cost per volume ofgroundwater treated per year($/1,000 gallons per year)1
23 78 350 280 NC NC NC NC
Average annual operating costper volume of groundwatertreated per year ($/1,000 gallonsper year)1
5 16 41 32 NC NC NC NC
Source: FRTR and RTDF; refer to Exhibit 1 for a list of sites.1
All reported costs were adjusted for site locations and years in which costs were incurred, as described in the text.2 Two of the case studies at PRB sites (Intersil and USCG) included annual operating costs for the PRB systems. Those costs are
presented in Exhibit 11.
NC = Not calculated; insufficient data available.
Contaminant property factors:
Contaminant properties affect the cost of groundwater remediation systems. These properties define (1) therelative ease with which contaminants can be removed from the extracted groundwater (by ex situ treatmenttechnologies), (2) the steps that are required to treat the groundwater, and (3) the complexity of the mixture ofcontaminants. Sites analyzed on the basis of contaminant property factors included sites contaminated withchlorinated solvents, alone or with other VOCs, and sites at which other combinations of contaminants werepresent. On the basis of site-specific data, the following conclusions can be made about contaminant propertyfactors:

6
& The type of contaminant groups in the groundwater affects both the capital and the annual operating cost of aP&T system, as shown in Exhibit 4. For sites with chlorinated solvents alone or with other VOCs (such asethers or ketones), capital costs were lower than those for sites with other combinations of contaminants (suchas chlorinated solvents, BTEX, metals, PCBs, or PAHs). The median capital cost for P&T systems removingchlorinated solvents, alone or with other VOCs, is $1,900,000, as compared with a median capital cost of$7,400,000 for P&T systems removing other combinations of contaminants. The type of contaminant groups inthe groundwater has similar effects on the annual operating cost of a P&T system. Sites at which chlorinatedsolvents, alone or with other VOCs, were present had lower annual operating costs than sites at which othercombinations of contaminants were present. The median annual operating cost for P&T systems removingchlorinated solvents alone, or with other VOCs, is $12 per 1,000 gallons treated, as compared with a medianannual operating cost of $39 per 1,000 gallons treated for P&T systems removing other combinations ofcontaminants.
EXHIBIT 4. COST COMPARISON OF P&T SYSTEMS THAT TREAT VARIOUS CONTAMINANT GROUPS
Contaminant Group
Cost Range
Average Cost Number of Sites25th Percentile Median 75th Percentile
Total Capital Cost2
Chlorinated solvents, aloneor with other VOCs
$1,200,000 $1,900,000 $4,400,000 $3,600,000 18
Other combinations ofcontaminants (solvents,BTEX, metals, PCBs orPAHs)1
$4,300,000 $7,400,000 $15,000,000 $8,900,000 9
Average Annual Operating Cost per 1,000 Gallons Treated2,3
Chlorinated solvents, aloneor with other VOCs
$3 $12 $40 $26 18
Other combinations ofcontaminants (solvents,BTEX, metals, PCBs orPAHs)1
$10 $39 $61 $53 9
1 The costs of P&T systems that treat only metals or only BTEX are not included in this exhibit because data were available for onlythree such systems. General conclusions were developed about the effect of a factor when information about that factor wasavailable for five or more sites.
2 All reported costs were adjusted for site locations and years in which costs were incurred, as described in the text.3 The average volume of groundwater treated per year for the 18 sites at which chlorinated solvents, alone or with other VOCs, were
present and the nine sites at which a combination of contaminants were present are 160,000,000 and 65,000,000 gallons,respectively.
& The type of above-ground treatment affects the annual operating cost of a P&T system. For sites contaminatedwith chlorinated solvents, alone or with other VOCs, Exhibit 5 compares the annual operating costs of treatmentsystems using air stripping or GAC only with annual operating costs of treatment systems using a wider varietyof treatment technologies. For P&T sites for which remedial cleanup goals had been established for chlorinatedsolvents, alone or with other VOCs, and using air stripping or GAC treatment only, annual operating costs werelower than those for sites for which remedial cleanup goals had been established for the same contaminants butat which other combinations of treatment technologies, such as biological treatment or filtration, were used. The median average annual operating cost for P&T systems removing chlorinated solvents with air stripping orGAC only is $3 per 1,000 gallons treated. The median average annual operating cost for P&T systemsremoving the same contaminants with other combinations of treatment technologies is $40 per 1,000 gallonstreated. At sites for which remedial cleanup goals had been established for chlorinated solvents, alone or withother VOCs, treatment technologies besides air stripping or GAC may be necessary because other substancespresent in the groundwater may inhibit the effectiveness of the air stripping or GAC units. For example, at SolLynn, the initial treatment system included an air stripper and GAC unit only. However, an iron filter wasadded to the treatment train to minimize fouling of the packing of the air stripper. Such additional treatmenttechnologies may require additional labor and use of chemicals or electricity.

7
EXHIBIT 5. ANNUAL OPERATING COST COMPARISON OF VARIOUS P&T TECHNOLOGIES AT SITESCONTAMINATED WITH CHLORINATED SOLVENTS, ALONE OR WITH OTHER VOCs
Treatment Technology
Average Annual Operating Cost per 1,000 Gallons Treated1,2
Number of Sites25th Percentile ($) Median ($) 75th Percentile ($)
AS and/or GAC treatmentonly
2 3 12 11
Other combination oftreatment technologies (seeExhibit 10)
28 40 41 7
All sites with chlorinatedsolvents, alone or with otherVOCs
3 12 40 18
1 All reported costs were adjusted for site locations and years when costs were incurred, as described in the text.2 The average volume of groundwater treated per year for the 11 sites at which air stripping (AS) or granular activated carbon (GAC)
was used, the 7 sites at which other combinations of treatment technologies were used, and the 18 sites at which chlorinated solventsalone or with other VOCs, were present are 260,000,000; 19,000,000; and 160,000,000 gallons, respectively.
System design and operation factors:
The cost of a groundwater remediation system is affected by a number of factors including the type of treatmenttechnologies used to remediate the site, the adequacy of a system design to remediate the site, system downtime,system optimization efforts, the amount and type of monitoring performed, and the use of multiple primarytreatment technologies (for example, P&T and an in situ technology). On the basis of site-specific data, thefollowing conclusions can be made about system design and operation factors:
& For the sites included in the analysis, the total capital costs for PRBs generally were lower than those for P&Tsystems. As demonstrated in Exhibit 6, the 75th percentile of total capital costs for the 16 PRB projects($1,000,000) was less than the 25th percentile of total capital costs for the 32 P&T projects ($1,700,000). Thedata included in the analysis show that the total capital cost of a very large PRB may approach the total capitalcost of a small P&T system. In addition, the median total capital cost for the 32 P&T projects is $2,000,000;the median total capital cost for the 16 PRB projects is $680,000. Decisions about whether a PRB or P&Tsystem would be less expensive for a given site generally are based on total life-cycle costs for each type ofsystem; such site-specific factors as hydrogeology, contaminant type, extent of contamination, and remedialgoals should be considered in making those decisions. Further, PRBs may not be feasible at every site;therefore, a comparison of P&T and PRB systems may not be appropriate for a given site.
EXHIBIT 6. CAPITAL COST COMPARISON OF P&T AND PRB SYSTEMS
Technology
Capital Cost Range1 AverageCapitalCost1 ($)
Number ofSites25th Percentile ($) Median ($) 75th Percentile ($)
P&T 1,700,000 2,000,000 5,900,000 4,900,000 32
PRBs 440,000 680,000 1,000,000 730,000 16
1 All reported costs were adjusted for site locations and years when costs were incurred, as described in the text
& Two of the case studies at PRB sites included annual operating costs for the PRB systems. The adjusted annualoperating costs for the PRBs at those sites are $75,000 at the U.S. Coast Guard site and $120,000 at the Intersilsite. The annual operating costs included in the analysis are those for relatively new PRB systems, andoperating costs included monitoring costs only; maintenance was not required during the period of operation forwhich data were available. As a PRB system ages, maintenance of the system may be required, includingreplacement of the exhausted reactive medium and other repairs of the PRB system. Decisions about whether aPRB or a P&T system would be less expensive would include an analysis of total life-cycle costs for each type

1There are several tools available that are used to estimate the costs for use of groundwater (and other) cleanuptechnologies, and that address these types of factors. Tools include products such as RACER and RS Means®. Additional information on these products is available through the RACER and RS Means® web sites, at<www.talpart.com/products/racer/racerabout.html> and <www.rsmeans.com>, respectively.
8
of system. Again, such site-specific factors as hydrogeology, contaminant type, extent of contamination, andremedial goals should be considered in making those decisions.
& Economies of scale were observed when relatively large volumes of groundwater were treated annually by aP&T system. For sites at which more than 20 million gallons of groundwater per year are treated, the capitaland annual operating costs per volume of groundwater treated per year appear to be lower than at sites where 20million gallons or less are treated per year. As Exhibit 7 shows, the median capital costs per volume ofgroundwater treated per year for P&T sites at which 20 million gallons or less are treated per year and for thoseat which more than 20 million gallons are treated per year are $440 per 1,000 gallons per year and $24 per1,000 gallons per year, respectively. The data show a similar trend in annual operating costs per volume ofgroundwater treated per year. The median average annual operating costs per volume of groundwater treatedper year for P&T sites at which 20 million gallons or less are treated per year and for those at which more than20 million gallons are treated per year are $42 per 1,000 gallons per year and $5 per 1,000 gallons per year,respectively.
Exhibits 8 and 9 show the distribution of the unit capital costs and the average annual operating costs for theP&T sites included in the analysis, respectively, as a function of volume of groundwater treated per year. Forsites at which more than 20 million gallons per year are treated, operating and capital costs are lower than costsfor sites at which 20 million gallons or less per year are treated. Unit costs vary more for sites at which 20million gallons or less per year are treated than for sites at which 20 million or more gallons per year aretreated. Because of the variability in the costs, these data are not intended for use in making estimates of costsfor other sites.
EXHIBIT 7. COMPARISON OF UNIT TREATMENT COST FOR P&T SITESWITH VOLUME TREATED PER YEAR
Size of Treatment SystemSize
(1,000 gallons/year)
Cost RangeAverage
CostNumber of
Sites25th Percentile Median 75th Percentile
Capital Cost Per Volume of Groundwater Treated Per Year ($/1,000 gallons/year)1
� 20,000 $200 $440 $730 $580 14
> 20,000 $14 $24 $62 $49 18
Average Annual Operating Cost Per Volume of Groundwater Treated Per Year ($/1,000 gallons)1,2
� 20,000 $33 $42 $64 $62 14
> 20,000 $3 $5 $7 $10 18
1 All reported costs were adjusted for site locations and years when costs were incurred, as described in the text.2 The average volume of groundwater treated per year for the 14 sites treating 20 million gallons or less of groundwater annually and
the 18 sites treating more than 20 million gallons of groundwater annually are 7,800,000 and 200,000,000 gallons, respectively.
Other Factors - Source control, hydrogeology, extent of contamination, and remedial goals also can have asignificant effect on remediation costs; however, insufficient data were available to develop quantitativeconclusions about the effects of those factors on the costs for the sites included in the analysis.1 Several site-specific examples are presented below to demonstrate how each of those factors increase or decrease costs for aparticular site. The examples listed below compare remediation costs for P&T sites at which the groundwater iscontaminated with chlorinated solvents, alone or with other VOCs. The examples also are presented in Exhibits10 and 11, which include costs and information about the factors that affect the costs for all 48 sites included in theanalysis.

9
0
500
1,000
1,500
2,000
2,500
3,000
3,500
4,000
4,500
0 50,000 100,000 150,000 200,000 250,000 300,000
Best Fit
Upper Confidence Limit
LowerConfidence Limit
Average Gallons Treated Per Year (1,000 Gallons/Year)
Cap
ital
Co
st P
er V
olu
me
of
Gro
un
dw
ater
Tre
ated
An
nu
ally
($
/1,0
00 G
allo
ns/
Yea
r)
EXHIBIT 8. CAPITAL COST FOR PUMP AND TREAT SYSTEMS AS A FUNCTION OF QUANTITY TREATED PER YEAR
1. All reported costs were adjusted for site locations and years when costs were incurred, as described in the text.
2. This chart shows a solid line based on a best fit of the available data for the 32 P&T sites, and dashed lines for the upper and lower confidence intervals using a 95% degree of confidence. Thelines were drawn based on the results from a statistical analysis of the available data, using SAS JMP software; the specific methodology used to draw the lines is described more fully in the EPAreport titled “Year 2000 Remediation Technology Cost Compendium” (under preparation by EPA’s Technology Innovation Office). This chart shows an expanded view of the data points withinthe ranges shown, and does not include several sites that are treating more than 300,000 gallons per year.

10
0
50
100
150
200
250
300
350
400
0 50,000 100,000 150,000 200,000 250,000 300,000
Average Gallons Treated Per Year (1,000 Gallons/Year)
Best Fit
Upper Confidence Limit
LowerConfidence Limit
Ave
rag
e A
nn
ual
Op
erat
ing
Co
st P
er V
olu
me
of
Gro
un
dw
ater
Tre
ated
An
nu
ally
($
/1,0
00 G
allo
ns)
EXHIBIT 9. ANNUAL OPERATING COST FOR PUMP AND TREAT SYSTEMS AS A FUNCTION OF QUANTITY TREATED PER YEAR
1. All reported costs were adjusted for site locations and years when costs were incurred, as described in the text.
2. This chart shows a solid line based on a best fit of the available data for the 32 P&T sites, and dashed lines for the upper and lower confidence intervals using a 95% degree of confidence. Thelines were drawn based on the results from a statistical analysis of the available data, using SAS JMP software; the specific methodology used to draw the lines is described more fully in the EPAreport titled “Year 2000 Remediation Technology Cost Compendium” (under preparation by EPA’s Technology Innovation Office). This chart shows an expanded view of the data points withinthe ranges shown, and does not include several sites that are treating more than 300,000 gallons per year.

11
Source control factors:
The method, timing of application, and success of source controls in mitigating contact of non-aqueous phaseliquids (NAPLs) or other sources of contaminants, such as highly contaminated soil, with groundwater affect thecost of groundwater remediation systems. At several sites, efforts were made to remove NAPL or isolate theNAPL from contact with the groundwater. Such efforts often involved significant capital expenditures. Forexample, at Western Processing, both dense non-aqueous phase liquids (DNAPLs) and light non-aqueous phaseliquids (LNAPLs) were observed in the groundwater. A slurry wall was constructed around the site to contain theplume and NAPLs and help achieve the cleanup goals in a limited amount of time. Capital costs for constructionof the slurry wall were approximately $1.8 million.
Hydrogeologic factors:
The cost of groundwater remediation systems is affected by the properties of the aquifer. These properties includehydraulic connection of aquifers that allows for contamination of more than one aquifer, aquifer flow parameters,influences of adjacent surface water bodies on the aquifer system, and influences of adjacent groundwaterproduction wells on the aquifer system. The following example illustrates a specific case in whichhydrogeological factors affected the cost of the groundwater remediation technology implemented at the site. AtJMT, the hydraulic conductivity in the contaminated bedrock aquifer was relatively low (0.65 feet per day). Toincrease the hydraulic conductivity, controlled blasting was carried out to create an artificial fracture zone, whichserved as an interceptor drain in the bedrock around the extraction well. While that approach increased the capitalcost of the system, it allowed effective extraction of the groundwater from the bedrock aquifer by one wellscreened in the new fracture zone.
Extent of contamination factors:
The magnitude of the contaminated groundwater plume, including the area and depth of the plume and theconcentration of contaminants within the plume, affect the cost of groundwater remediation systems. Typically,groundwater contamination that is limited in area and depth is easier and cheaper to remediate than the same massof contaminant when it extends deeper and spreads out over a larger area. This factor affects the size of theextraction and treatment system and the complexity of the system in terms of the quantity of groundwater to beextracted from the aquifer and treated ex situ. For example, at Gold Coast, the initial areal extent of thecontaminated plume was estimated to be 0.87 acre, and the initial volume of the plume was estimated to be lessthan 3 million gallons. The site was remediated at a total cost of less than $800,000.
Remedial goal factors:
Regulatory factors affect the design of a remedial system or the period of time it must be operated. These factorsinclude aquifer restoration or treatment system performance goals, and specific system design requirements (suchas disallowing reinjection of treated groundwater or specifying the treatment technology to be used). For example,at Western Processing, a P&T system, consisting of more than 200 groundwater extraction points pumpingapproximately 265 gpm, was installed. After approximately seven years of operation, an ESD was issued tochange the focus of remediation efforts from restoration to containment. Because of that change, the system wasmodified to a system pumping approximately 80 gpm, which significantly reduced operating costs for the system.
NOTICE AND DISCLAIMER
This report was prepared by EPA’s Technology Innovation Office with support provided under Contract Number68-W-99-003. Information in this report is derived from a variety of references (including personalcommunications with experts in the field), some of which have been peer-reviewed. This report has undergoneEPA and external review by experts in the field. Mention of trade names or commercial products does notconstitute endorsement or recommendation for use. For more information about this report, please contact: Linda Fiedler, U.S. EPA, Technology Innovation Office, Ariel Rios Building, 1200 Pennsylvania Ave., N.W.(MS 5102G), Washington, D.C., 20460; (703) 603-7194; e-mail: [email protected].

12
EXHIBIT 10. SUMMARY OF COST AND TECHNICAL INFORMATION FOR SELECTED P&T SITES
Site Nameand Location
Contaminants WithRemedial
Cleanup Goals 1
Remediation Technology 2
Yea
rs o
f O
pera
tion
/Sta
tus
3,4
Gal
lons
Tre
ated
Per
Yea
r
(
1,00
0 G
allo
ns)
Adj
uste
d C
apit
al C
ost
(Rep
orte
d C
apit
al C
ost)
5
A
djus
ted
Av.
Ann
. Ope
r. C
ost
(Rep
orte
d A
v. A
nn. O
per.
Cos
t) 5,
6
Adj
uste
d C
apit
al C
ost
Per
Vol
ume
of
Gro
undw
ater
Tre
ated
Per
Yea
r
($/
1,00
0 G
allo
ns/Y
ear)
5
Adj
uste
d A
v. A
nn. O
per.
Cos
t P
erV
olum
e of
Gro
undw
ater
Tre
ated
Per
Yea
r($
/1,0
00 G
allo
ns)
5,6
Cost HighlightsP&T (with ex situ
treatment)7
AS
FP
R
ISB
PR
B
VC
B
BIO
GA
C
PH
YS/
CH
EM
OX
ID
STR
IP
CHLORINATED SOLVENTS ALONE OR WITH OTHER VOCs
French, Ltd.,TX
benzene, toluene,chloroform, 1,2-DCA,VC
q q q q q 3.9/A 78,000 $16,000,000($15,000,000)
$3,200,000($3,300,000)
$200 $41 Oversight costs were high because this is a largesystem. Costs include those for P&T, ISB, andtwo VCBs. Ex situ metals treatment was addedafter it was determined that the biologicaltreatment unit failed to sufficiently removemetals. Costs for VCBs are included in thecapital costs because they were an integral partof containing the groundwater plume.
TCAAP, MN 1,2-DCE, 1,1,1-TCA,TCE, PCE
q 4.9/O 1,400,000 $12,000,000($8,000,000)
$810,000($590,000)
$8.4 $0.58 Complex hydrogeology (multilayer aquifersystem) increased remediation costs.
Firestone, CA 1,1-DCE, TCE, PCE,1,1-DCA, benzene,toluene, xylene
q q 6.8/C 270,000 $6,900,000($4,100,000)
$2,000,000($1,300,000)
$26 $7.3 Frequent modifications to system increasedcosts. Cost of analysis and data managementwere high.
McClellanAFB, OU B/C,CA
None, primarycontaminants of concernare TCE, cis-1,2-DCE,PCE, 1,2-DCA
q 6.8/O 96,000 $5,600,000($4,000,000)
$1,600,000($1,200,000)
$58 $17 Frequent modifications to system increasedcosts. Excess treatment capacity requiredinternal groundwater recycling to sustainefficient treatment; this raised operating costs. Small system, unit costs reflect economies ofscale. The ex situ treatment system originallyincluded biological treatment. This unitoperation was discontinued after influent ketonelevels fell below detection limits. A secondsmaller groundwater treatment system wasinstalled at the site in 1991; costs for thissystem are not included.
U.S. DOE,SavannahRiver, SC
TCE, PCE, 1,1,1-TCA q 8.3/O 240,000 $5,200,000($4,100,000)
$170,000($150,000)
$21 $0.71 Complex hydrogeology and presence ofDNAPLs increased remediation costs.
Des Moines,IA
TCE q 8.8/O 550,000 $2,200,000($1,600,000)
$140,000($110,000)
$3.9 $0.25 Large treatment system; unit costs reflecteconomies of scale.
Old Mill, OH TCE, PCE, 1,2-DCE,ethylbenzene
q q 7.8/O 1,700 $2,100,000($1,600,000)
$240,000($210,000)
$1,300 $150 Modifications to the system increased capitalcosts by 22 percent. Relatively small volume ofgroundwater treated annually; increased unitcost relative to larger systems.
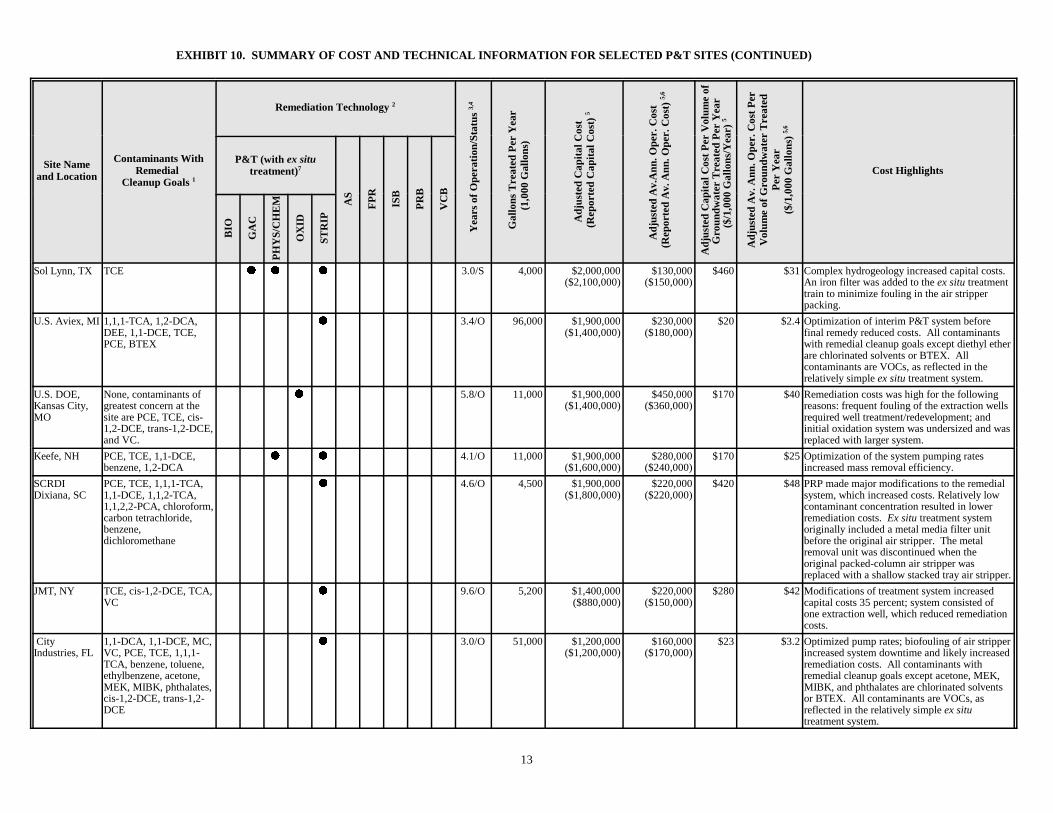
EXHIBIT 10. SUMMARY OF COST AND TECHNICAL INFORMATION FOR SELECTED P&T SITES (CONTINUED)
Site Nameand Location
Contaminants WithRemedial
Cleanup Goals 1
Remediation Technology 2
Yea
rs o
f O
pera
tion
/Sta
tus
3,4
Gal
lons
Tre
ated
Per
Yea
r
(
1,00
0 G
allo
ns)
Adj
uste
d C
apit
al C
ost
(Rep
orte
d C
apit
al C
ost)
5
A
djus
ted
Av.
Ann
. Ope
r. C
ost
(Rep
orte
d A
v. A
nn. O
per.
Cos
t) 5,
6
Adj
uste
d C
apit
al C
ost
Per
Vol
ume
of
Gro
undw
ater
Tre
ated
Per
Yea
r
($/
1,00
0 G
allo
ns/Y
ear)
5
Adj
uste
d A
v. A
nn. O
per.
Cos
t P
erV
olum
e of
Gro
undw
ater
Tre
ated
Per
Yea
r($
/1,0
00 G
allo
ns)
5,6
Cost HighlightsP&T (with ex situ
treatment)7
AS
FP
R
ISB
PR
B
VC
B
BIO
GA
C
PH
YS/
CH
EM
OX
ID
STR
IP
13
Sol Lynn, TX TCE q q q 3.0/S 4,000 $2,000,000($2,100,000)
$130,000($150,000)
$460 $31 Complex hydrogeology increased capital costs.An iron filter was added to the ex situ treatmenttrain to minimize fouling in the air stripperpacking.
U.S. Aviex, MI 1,1,1-TCA, 1,2-DCA,DEE, 1,1-DCE, TCE,PCE, BTEX
q 3.4/O 96,000 $1,900,000($1,400,000)
$230,000($180,000)
$20 $2.4 Optimization of interim P&T system beforefinal remedy reduced costs. All contaminantswith remedial cleanup goals except diethyl etherare chlorinated solvents or BTEX. Allcontaminants are VOCs, as reflected in therelatively simple ex situ treatment system.
U.S. DOE,Kansas City,MO
None, contaminants ofgreatest concern at thesite are PCE, TCE, cis-1,2-DCE, trans-1,2-DCE,and VC.
q 5.8/O 11,000 $1,900,000($1,400,000)
$450,000($360,000)
$170 $40 Remediation costs was high for the followingreasons: frequent fouling of the extraction wellsrequired well treatment/redevelopment; andinitial oxidation system was undersized and wasreplaced with larger system.
Keefe, NH PCE, TCE, 1,1-DCE,benzene, 1,2-DCA
q q 4.1/O 11,000 $1,900,000($1,600,000)
$280,000($240,000)
$170 $25 Optimization of the system pumping ratesincreased mass removal efficiency.
SCRDIDixiana, SC
PCE, TCE, 1,1,1-TCA,1,1-DCE, 1,1,2-TCA,1,1,2,2-PCA, chloroform,carbon tetrachloride,benzene,dichloromethane
q 4.6/O 4,500 $1,900,000($1,800,000)
$220,000($220,000)
$420 $48 PRP made major modifications to the remedialsystem, which increased costs. Relatively lowcontaminant concentration resulted in lowerremediation costs. Ex situ treatment systemoriginally included a metal media filter unitbefore the original air stripper. The metalremoval unit was discontinued when theoriginal packed-column air stripper wasreplaced with a shallow stacked tray air stripper.
JMT, NY TCE, cis-1,2-DCE, TCA,VC
q 9.6/O 5,200 $1,400,000($880,000)
$220,000($150,000)
$280 $42 Modifications of treatment system increasedcapital costs 35 percent; system consisted ofone extraction well, which reduced remediationcosts.
CityIndustries, FL
1,1-DCA, 1,1-DCE, MC,VC, PCE, TCE, 1,1,1-TCA, benzene, toluene,ethylbenzene, acetone,MEK, MIBK, phthalates,cis-1,2-DCE, trans-1,2-DCE
q 3.0/O 51,000 $1,200,000($1,200,000)
$160,000($170,000)
$23 $3.2 Optimized pump rates; biofouling of air stripperincreased system downtime and likely increasedremediation costs. All contaminants withremedial cleanup goals except acetone, MEK,MIBK, and phthalates are chlorinated solventsor BTEX. All contaminants are VOCs, asreflected in the relatively simple ex situtreatment system.

EXHIBIT 10. SUMMARY OF COST AND TECHNICAL INFORMATION FOR SELECTED P&T SITES (CONTINUED)
Site Nameand Location
Contaminants WithRemedial
Cleanup Goals 1
Remediation Technology 2
Yea
rs o
f O
pera
tion
/Sta
tus
3,4
Gal
lons
Tre
ated
Per
Yea
r
(
1,00
0 G
allo
ns)
Adj
uste
d C
apit
al C
ost
(Rep
orte
d C
apit
al C
ost)
5
A
djus
ted
Av.
Ann
. Ope
r. C
ost
(Rep
orte
d A
v. A
nn. O
per.
Cos
t) 5,
6
Adj
uste
d C
apit
al C
ost
Per
Vol
ume
of
Gro
undw
ater
Tre
ated
Per
Yea
r
($/
1,00
0 G
allo
ns/Y
ear)
5
Adj
uste
d A
v. A
nn. O
per.
Cos
t P
erV
olum
e of
Gro
undw
ater
Tre
ated
Per
Yea
r($
/1,0
00 G
allo
ns)
5,6
Cost HighlightsP&T (with ex situ
treatment)7
AS
FP
R
ISB
PR
B
VC
B
BIO
GA
C
PH
YS/
CH
EM
OX
ID
STR
IP
14
Solid State,MO
TCE q 4.2/O 62,000 $1,000,000($930,000)
$300,000($280,000)
$17 $4.9 Capital costs do not include costs forinstallation of four deep extraction wellsinstalled as part of RI/FS.
Intersil (P&T),CA
TCE, cis-1,2-DCE, VC,Freon 113®
q q 7.2/D 5,000 $510,000($320,000)
$200,000($140,000)
$100 $41 Groundwater extraction system was expandedafter three years of operation, likely increasingoperating costs. Costs for the PRB are notincluded.
MysteryBridge, WY
trans-1,2-DCE, cis-1,2-DCE, TCE, PCE, 1,1,1-TCA, 1,1-DCE
q 3.6/O 54,000 $340,000($310,000)
$180,000($170,000)
$6.3 $3.4 Low concentrations in groundwater result inlower remediation costs.
Gold Coast, FL MC, 1,1-DCA, trans-1,2-DCE, TCE, PCE, toluene
q q 3.7/C 22,000 $290,000($250,000)
$130,000($120,000)
$13 $6.2 Optimized extraction wells resulted in lowerremediation costs; P&T system required lessthan four years to clean up site. Costs for theAS are not included.
BTEX ONLY
Site A, NY BTEX q q q 2.3/O 6,700 $2,200,000($1,400,000)
$430,000($290,000)
$330 $65 Use of skid-mounted modular equipmentreduced capital costs. The capital cost includesthe cost of SVE wells because this cost couldnot be separated from the groundwater systemcosts.
Amoco, MI None, contaminants ofconcern are BTEX andMTBE
q q 5.7/O 150,000 $470,000($300,000)
$700,000($480,000)
$3.2 $4.7 Leasing GAC and GAC system providedflexibility to modify treatment system, likelyreducing remediation costs. Costs for AS arenot included.
METALS ONLY
UnitedChrome, OR
Cr q 8.6/O 7,200 $5,100,000($3,300,000)
$110,000($74,000)
$710 $15 Modular treatment system used initially,reducing costs.
Odessa I, TX Cr q 4.2/O 30,000 $1,900,000($2,000,000)
$220,000($250,000)
$62 $7.5 ROD required that ferrous iron be producedonsite electrochemically, limiting number ofappropriate vendors and increasing capitalcosts.
Odessa II, TX Cr q 4.1/O 30,000 $1,800,000($1,900,000)
$160,000($180,000)
$62 $5.4 ROD required that ferrous iron be producedonsite electrochemically, limiting number ofappropriate vendors and increasing capitalcosts.

EXHIBIT 10. SUMMARY OF COST AND TECHNICAL INFORMATION FOR SELECTED P&T SITES (CONTINUED)
Site Nameand Location
Contaminants WithRemedial
Cleanup Goals 1
Remediation Technology 2
Yea
rs o
f O
pera
tion
/Sta
tus
3,4
Gal
lons
Tre
ated
Per
Yea
r
(
1,00
0 G
allo
ns)
Adj
uste
d C
apit
al C
ost
(Rep
orte
d C
apit
al C
ost)
5
A
djus
ted
Av.
Ann
. Ope
r. C
ost
(Rep
orte
d A
v. A
nn. O
per.
Cos
t) 5,
6
Adj
uste
d C
apit
al C
ost
Per
Vol
ume
of
Gro
undw
ater
Tre
ated
Per
Yea
r
($/
1,00
0 G
allo
ns/Y
ear)
5
Adj
uste
d A
v. A
nn. O
per.
Cos
t P
erV
olum
e of
Gro
undw
ater
Tre
ated
Per
Yea
r($
/1,0
00 G
allo
ns)
5,6
Cost HighlightsP&T (with ex situ
treatment)7
AS
FP
R
ISB
PR
B
VC
B
BIO
GA
C
PH
YS/
CH
EM
OX
ID
STR
IP
15
OTHER COMBINATIONS OF CONTAMINANTS
WesternProcessing,WA
Cd, Cr, Cu, Ni, Pb, Zn,Hg, Ag, cyanide, trans-1,2-DCE, cis-1,2-DCE
q q 8.2/O 120,000 $19,000,000($14,000,000)
$4,600,000($3,600,000)
$160 $39 Remediation cost was high for the followingreasons: large complex system with over 200vacuum well points was initially used, 24-houroversight was required; frequent maintenancewas required to control iron precipitate buildup;treatment system originally included metalsprecipitation, oxidation, air stripping, andgranular activated carbon treatment. In 1995,remedial goal was changed from aquiferrestoration to plume containment; metalsprecipitation, oxidation, and granular activatedcarbon treatment were subsequentlydiscontinued. The capital cost includes the costof a slurry wall because it is an integral part ofcontaining the groundwater plume.
Bofors Nobel,OU 1, MI
Remedial goals set foranaline, 2-chloroaniline,selected purgeablehalocarbons, and selectedpurgeable aromatics. Key specificcontaminants arebenzene, benzidine, 2-chloroaniline, 1,2-DCE,TCE, 3,3-dichlorobenzidene,aniline, VC.
q q q 3.1/O 230,000 $16,000,000($12,000,000)
$970,000($770,000)
$70 $4.3 Preventative maintenance program ensureduninterrupted operation of extraction system,which likely reduced remediation costs. Ametals precipitation unit that was operatedduring the first two years of system operationwas taken out of service after it was determinedto be unnecessary.
Baird andMcGuire, MA
BTEX, acenaphthene,naphthalene, 2,4-dimethyl phenol,dieldrin, chlordane, Pb,As
q q q 3.8/O 21,000 $15,000,000($11,000,000)
$2,500,000($2,000,000)
$730 $120 Operating costs increased due to the need tomonitor for a wide range of contaminants andfor several full-time operators to be onsite. Originally, ex situ system included biologicaltreatment. This step was eventuallydiscontinued. Historical data indicate thatsufficient organic removal rates are attainedwithout the use of biological treatment.

EXHIBIT 10. SUMMARY OF COST AND TECHNICAL INFORMATION FOR SELECTED P&T SITES (CONTINUED)
Site Nameand Location
Contaminants WithRemedial
Cleanup Goals 1
Remediation Technology 2
Yea
rs o
f O
pera
tion
/Sta
tus
3,4
Gal
lons
Tre
ated
Per
Yea
r
(
1,00
0 G
allo
ns)
Adj
uste
d C
apit
al C
ost
(Rep
orte
d C
apit
al C
ost)
5
A
djus
ted
Av.
Ann
. Ope
r. C
ost
(Rep
orte
d A
v. A
nn. O
per.
Cos
t) 5,
6
Adj
uste
d C
apit
al C
ost
Per
Vol
ume
of
Gro
undw
ater
Tre
ated
Per
Yea
r
($/
1,00
0 G
allo
ns/Y
ear)
5
Adj
uste
d A
v. A
nn. O
per.
Cos
t P
erV
olum
e of
Gro
undw
ater
Tre
ated
Per
Yea
r($
/1,0
00 G
allo
ns)
5,6
Cost HighlightsP&T (with ex situ
treatment)7
AS
FP
R
ISB
PR
B
VC
B
BIO
GA
C
PH
YS/
CH
EM
OX
ID
STR
IP
16
Sylvester/Gilson Road,NH
MC, chloroform, MEK,toluene, phenols, Se,methyl methacrylate,1,1,1-TCA, trans-1,2-DCA, 1,1-DCA,chlorobenzene, 1,1,2-TCA, VC, benzene
q q q q 9.5/E 130,000 $11,000,000($7,200,000)
$2,400,000($1,800,000)
$85 $19 Remediation cost was high for the followingreasons: several full-time operators were on site24 hours per day, high costs for fuel oil tooperate the vapor incinerator used for airemission control.
LaSalle, IL PCBs, TCE, 1,2-DCE,1,1,1-TCA, VC, 1,1-DCA, PCE
q q 4.4/O 5,200 $7,400,000($5,300,000)
$210,000($160,000)
$1,400 $40 Complex mixture of contaminants and DNAPLcontributed to elevated capital costs. Relativelysmall volume of groundwater treated annually;increased unit cost relative to larger systems.
SolventRecoveryService, CT
None, contaminants atthe site include TCE, cis-1,2-DCE, 1,1,1-TCA,PCBs, Ba, Cd, Ch, Pb,Mn
q q q q 3.0/O 11,000 $5,100,000($4,400,000)
$660,000($580,000)
$470 $61 Presence of DNAPL contributed to elevatedcapital and operating costs. The capital costincludes the cost of a sheet pile wall because itwas an integral part of containing thegroundwater plume.
Libby, MT napthalene,acenaphthene, fluorene,anthracene, pyrene,fluoranthene,benzo(a)anthracene,chrysene,benzo(b)fluoranthene,benzo(a)pyrene,dibenzo(a,h)anthracene,indeno(1,2,3-cd)pyrene,As, benzene, PCP
q q 5.3/O 3,000 $4,300,000($3,000,000)
$520,000($400,000)
$1,500 $180 Chemical costs (e.g., hydrogen peroxide) werehigh for in situ bioremediation; monitoring,sampling, and analysis costs were high at thebeginning of the project. Relatively smallvolume of groundwater treated annually;increased unit cost relative to larger systems.
King ofPrussia, NJ
1,1-DCA, trans-1,2-DCE, 1,1,1-TCA, TCE,PCA, PCE, benzene,toluene, ethylbenzene,Be, Cr, Cu, Ni, Cd, Hg,,Zn
q q q 2.7/O 57,000 $1,800,000($2,000,000)
$290,000($330,000)
$32 $5.1 Electrochemical treatment to remove metalsfrom the groundwater increased costs.

EXHIBIT 10. SUMMARY OF COST AND TECHNICAL INFORMATION FOR SELECTED P&T SITES (CONTINUED)
Site Nameand Location
Contaminants WithRemedial
Cleanup Goals 1
Remediation Technology 2
Yea
rs o
f O
pera
tion
/Sta
tus
3,4
Gal
lons
Tre
ated
Per
Yea
r
(
1,00
0 G
allo
ns)
Adj
uste
d C
apit
al C
ost
(Rep
orte
d C
apit
al C
ost)
5
A
djus
ted
Av.
Ann
. Ope
r. C
ost
(Rep
orte
d A
v. A
nn. O
per.
Cos
t) 5,
6
Adj
uste
d C
apit
al C
ost
Per
Vol
ume
of
Gro
undw
ater
Tre
ated
Per
Yea
r
($/
1,00
0 G
allo
ns/Y
ear)
5
Adj
uste
d A
v. A
nn. O
per.
Cos
t P
erV
olum
e of
Gro
undw
ater
Tre
ated
Per
Yea
r($
/1,0
00 G
allo
ns)
5,6
Cost HighlightsP&T (with ex situ
treatment)7
AS
FP
R
ISB
PR
B
VC
B
BIO
GA
C
PH
YS/
CH
EM
OX
ID
STR
IP
17
MSWP, AR PCP, Cr, As,benzo(a)anthracene,benzo(a)pyrene,benzo(b+k)fluoranthene,chrysene
q 8.3/O 12,000 $600,000($470,000)
$120,000($110,000)
$49 $10 Use of fabric filters increased operating life ofGAC units and therefore reduced remediationcosts. During a slowdown in plant operations,an additional carbon treatment system wasoperated briefly to treat metal-contaminatedgroundwater from one extraction well. Beforeand after this slowdown, the water from thiswell was used as makeup water for plantoperations.
Source: FRTR case studies of ongoing and completed groundwater remediation projects.1Contaminant Key: As = arsenic, Ba = barium, Be = beryllium, BTEX = benzene, toluene, ethylbenzene, and xylenes, Cd = cadmium, Cr = chromium, Cu = copper, DCA = dichloroethane, DCE = dichloroethene, DEE = diethylether, MC = methylene chloride, MEK = methyl ethyl ketone, MIBK = methyl isobutyl ketone, Mn = manganese, MTBE = methyl tert butyl ether, NH-SVOLs = nonhalogenated semivolatiles, Ni = nickel, PAH = polycyclic aromatichydrocarbons, Pb = lead, PCA = tetrachloroethane, PCB = polychlorinated biphenyls, PCE = tetrachloroethene, PCP = pentachlorophenol, TCA = tetrachloroethane, TCE = tetrachloroethene, VC = vinyl chloride, Zn = zinc.2Remediation Technology Key: AS = air sparging, BIO = biological treatment, FPR = free product recovery, GAC = granular activated carbon adsorption, ISB = in situ bioremediation, PHYS/CHEM = physical or chemical removalof metal, OXID = Oxidation, PRB = permeable reactive barrier, STRIP = air stripping, VCB = vertical containment barrier.3If cost data are not available for the entire period of treatment system operation, then the number of years for which cost data are available is presented.4Status Key: A = monitored natural attenuation, C = complete, D = P&T discontinued, PRB ongoing, E = shut down pending explanation of significant difference, O = ongoing, S = shut down pending study.5All reported costs were adjusted for site locations and years when costs were incurred, as described in the text. All unadjusted (reported) costs are presented in parentheses. Adjusted costs are not presented in parentheses.6Av. Ann. Oper. Cost = Average Annual Operating Cost7The ex situ treatment systems presented in these columns include the treatment units in operation at the time that the case studies were prepared (for systems with and ongoing status) or the treatment units most recently in operationbefore system shutdown (for systems with any status other than ongoing).
18
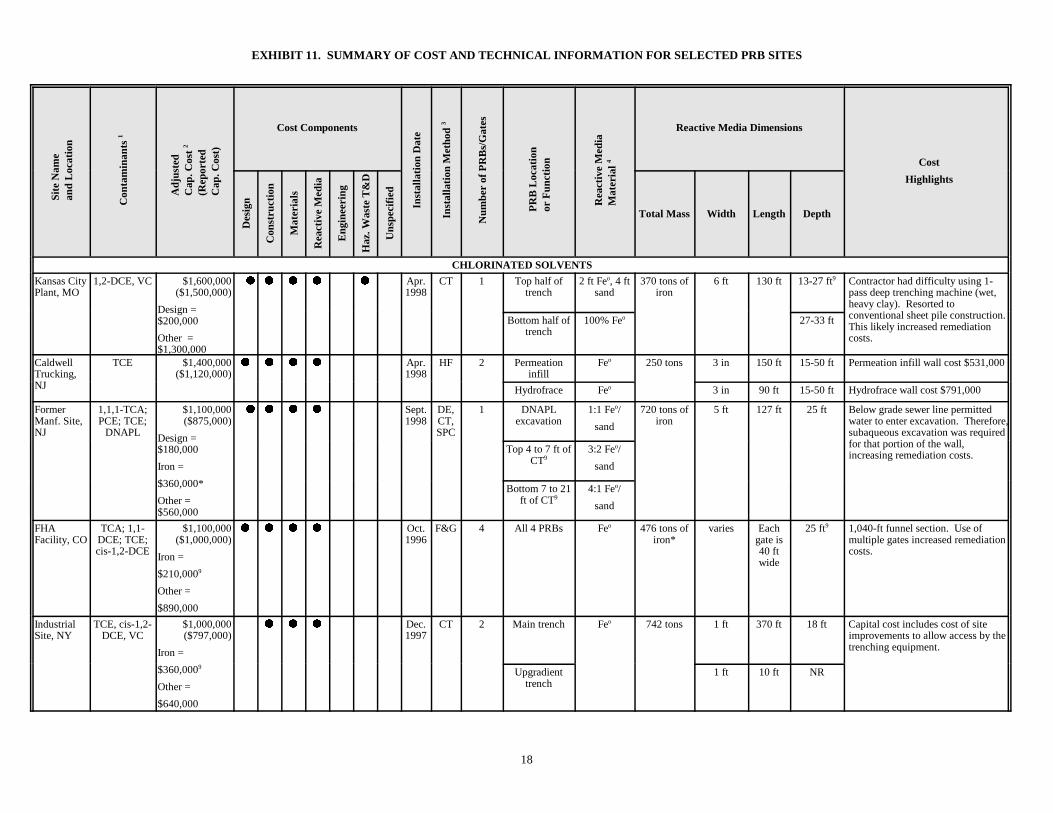
EXHIBIT 11. SUMMARY OF COST AND TECHNICAL INFORMATION FOR SELECTED PRB SITESSi
te N
ame
and
Loc
atio
n
Con
tam
inan
ts 1
Adj
uste
dC
ap. C
ost
2
(Rep
orte
dC
ap. C
ost)
Cost Components
Inst
alla
tion
Dat
e
Inst
alla
tion
Met
hod
3
Num
ber
of P
RB
s/G
ates
PR
B L
ocat
ion
or F
unct
ion
Rea
ctiv
e M
edia
Mat
eria
l 4
Reactive Media Dimensions
Cost
Highlights
Des
ign
Con
stru
ctio
n
Mat
eria
ls
Rea
ctiv
e M
edia
Eng
inee
ring
Haz
. Was
te T
&D
Uns
peci
fied
Total Mass Width Length Depth
CHLORINATED SOLVENTS
Kansas CityPlant, MO
1,2-DCE, VC $1,600,000($1,500,000)
Design =$200,000
Other =$1,300,000
q q q q q Apr.1998
CT 1 Top half oftrench
2 ft Feo, 4 ftsand
370 tons ofiron
6 ft 130 ft 13-27 ft9 Contractor had difficulty using 1-pass deep trenching machine (wet,heavy clay). Resorted toconventional sheet pile construction. This likely increased remediationcosts.
Bottom half oftrench
100% Feo 27-33 ft
CaldwellTrucking,NJ
TCE $1,400,000($1,120,000)
q q q q Apr.1998
HF 2 Permeationinfill
Feo 250 tons 3 in 150 ft 15-50 ft Permeation infill wall cost $531,000
Hydrofrace Feo 3 in 90 ft 15-50 ft Hydrofrace wall cost $791,000
FormerManf. Site,NJ
1,1,1-TCA;PCE; TCE;
DNAPL
$1,100,000($875,000)
Design =$180,000
Iron =
$360,000*
Other =$560,000
q q q q Sept.1998
DE,CT,SPC
1 DNAPLexcavation
1:1 Feo/
sand
720 tons ofiron
5 ft 127 ft 25 ft Below grade sewer line permittedwater to enter excavation. Therefore,subaqueous excavation was requiredfor that portion of the wall,increasing remediation costs.
Top 4 to 7 ft ofCT9
3:2 Feo/
sand
Bottom 7 to 21ft of CT9
4:1 Feo/
sand
FHAFacility, CO
TCA; 1,1-DCE; TCE;cis-1,2-DCE
$1,100,000($1,000,000)
Iron =
$210,0009
Other =
$890,000
q q q q Oct.1996
F&G 4 All 4 PRBs Feo 476 tons ofiron*
varies Eachgate is40 ftwide
25 ft9 1,040-ft funnel section. Use ofmultiple gates increased remediationcosts.
IndustrialSite, NY
TCE, cis-1,2-DCE, VC
$1,000,000($797,000)
Iron =
$360,0009
Other =
$640,000
q q q Dec.1997
CT 2 Main trench Feo 742 tons 1 ft 370 ft 18 ft Capital cost includes cost of siteimprovements to allow access by thetrenching equipment.
Upgradienttrench
1 ft 10 ft NR

EXHIBIT 11. SUMMARY OF COST AND TECHNICAL INFORMATION FOR SELECTED PRB SITES (CONTINUED)Si
te N
ame
and
Loc
atio
n
Con
tam
inan
ts 1
Adj
uste
dC
ap. C
ost
2
(Rep
orte
dC
ap. C
ost)
Cost Components
Inst
alla
tion
Dat
e
Inst
alla
tion
Met
hod
3
Num
ber
of P
RB
s/G
ates
PR
B L
ocat
ion
or F
unct
ion
Rea
ctiv
e M
edia
Mat
eria
l 4
Reactive Media Dimensions
Cost
Highlights
Des
ign
Con
stru
ctio
n
Mat
eria
ls
Rea
ctiv
e M
edia
Eng
inee
ring
Haz
. Was
te T
&D
Uns
peci
fied
Total Mass Width Length Depth
19
Intersil, CA5 TCE, cis-1,2-DCE, VC,
Freon 113®
$760,000($600,000)10
Iron =
$170,000*
Other =
$590,000
q q q Feb.1995
F&G 1 NA Feo 220 tons 4 ft 36 ft 11-31 ft Two slurry walls: 300 ft and 235 ftlong. Average annual operatingcosts are $120,00010.
AircraftFacility, OR
TCE $710,000($600,000)
q Mar.1998
F&G 2 Gate 1 Feo 324 tons ofiron9
Two 9-inthick layers
50 ft to 24-34 ft 2-ft. thick funnel walls, 650-ft. longfunnel.
Gate 2 Feo, sand 3 ft 60 ft to 24-34 ft
Lowry AirForce Base,CO
TCE $600,000($530,000)
q q q q Dec.1995
F&G 1 NA Feo NR 5 ft 10 ft 0-17 ft Two 14-ft. sheet piling funnel walls
IndustrialSite, N.Ireland
TCE; cis-1,2-DCE
$580,0006
($375,000)q9 q q q Dec.
1995F&R 1 NA Feo NR Vessel has
4-ft diam.
Vesselhas
4-ftdiam.
33-49 ft Two 100-ft. bentonite/cement slurrywalls
IndustrialSite, KS
TCE; 1,1,1-TCA
$400,000($400,000)
Iron =
$50,000*
Other =
$350,000
q9 q q Jan.1996
F&G 1 NA Feo 70 tons 3 ft 20 ft 0-30 ft Two 490-ft. bentonite slurry walls
IndustrialSite, SC
TCE, cis-1,2-DCE, VC
$360,000($400,000)
Design =$45,000
Iron =
$130,000*
Other =$180,000
q q q q Nov.1997
CT 1 NA Feo, sand(1:1 ratio)
400 tons ofiron
1 ft 375 ft9 0-29 ft Installation of PRB system beingperformed in two phases; costsreflect both phases.

EXHIBIT 11. SUMMARY OF COST AND TECHNICAL INFORMATION FOR SELECTED PRB SITES (CONTINUED)Si
te N
ame
and
Loc
atio
n
Con
tam
inan
ts 1
Adj
uste
dC
ap. C
ost
2
(Rep
orte
dC
ap. C
ost)
Cost Components
Inst
alla
tion
Dat
e
Inst
alla
tion
Met
hod
3
Num
ber
of P
RB
s/G
ates
PR
B L
ocat
ion
or F
unct
ion
Rea
ctiv
e M
edia
Mat
eria
l 4
Reactive Media Dimensions
Cost
Highlights
Des
ign
Con
stru
ctio
n
Mat
eria
ls
Rea
ctiv
e M
edia
Eng
inee
ring
Haz
. Was
te T
&D
Uns
peci
fied
Total Mass Width Length Depth
20
FormerDrycleanSite,Germany
PCE; 1,2-DCE
$160,000($123,000)
Design =$39,000
Other =$120,000
q q q June1998
CW 1 NS 1:1 massratio Feo/
gravel
69 tons 2-3 ft 33 ft 10 - 33 ft7 The mandrel construction methodwas chosen because it wasdetermined to be easier and lessexpensive than continuous sheetpiling construction.NS IS 85 tons 41 ft
METALS AND INORGANICS
Nickel RimMine Site,Canada
Ni, Fe,Sulfate
$43,000($30,000)
q q q q Aug.1995
C&F 1 NA OC/
pea gravel
NR 12 ft 50 ft 14 ft deep 12-in clay cap covers PRB to preventsurface water and oxygen entry. Coarse sand buffer zones installed upand downgradient.
COMBINATION OF CONTAMINANTS
Y-12 Site,Oak RidgeNationalLab, TN
U, Tc, HNO3 $900,000($1,000,000)
q q q q Nov.1997
CT 1 NS 100% iron 80 tons iron 2 ft 26 ft 22-30 ft Did not excavate into confining unit;this may result in lower remediationcosts and may permit thegroundwater to bypass the reactivemedia.
NS 100% gravel NR 199 ft
Dec.1997
F&R 5 All 5 reactors iron NR NR NR NR
MarzoneInc., GA
alpha-HCB,beta-HCB,
DDD, DDT,xylene, EB,
lindane,methyl
parathion
$650,000($750,000)
Design =$200,000
Other =$450,000
q q q q Aug.1998
F&G 1 NA AC 0.9 tons NR 400 ft NR System flushing required every 3-4weeks to reinitiate flow; resulting inhigher than anticipated operatingcosts.
U.S. CoastGuardSupportCenter, NC8
Cr+6, TCE $460,000($500,000)10
Design =$160,000
Iron = $150,000
Other =$150,000
q q q q June1996
CT 1 NA Feo 450 tons 2 ft 150 ft 3-24 ft Total trench is 225 ft long. Theexact location of the 26-ft ironportion is unspecified.
Primary Source: EPA, Office of Solid Waste and Emergency Response. 1999. Field Applications of In Situ Remediation Technologies: Permeable Reactive Barriers. EPA 542-R-99-002. June.

EXHIBIT 11. SUMMARY OF COST AND TECHNICAL INFORMATION FOR SELECTED PRB SITES (CONTINUED)
21
Additional Sources: Fax Transmittal from Mr. Robert Puls, EPA to Susan Guenther, TTEMI. March 8, 2000. Comments on Exhibit 10: Summary of Cost and Technical Information for Selected Permeable Reactive Barrier Sites. EPA. 1998. Remediation Case Studies: Innovative Groundwater Treatment Technologies. Volume 11. EPA 542-R-98-015. September.
1 Contaminant Key: As = arsenic, HCB = hexachlorobenzene, Cd = cadmium, Cu = copper, Cr+6 = hexavalent chromium, DCE = dichloroethene, DDD = dichlorodiphenyldichloroethane, DDT = dichlorodiphenyltrichloroethane,DNAPL = dense nonaqueous-phase liquid, EB = ethylbenzene, Fe = Iron, HNO3 = nitric acid, Ni = Nickel, Pb = lead, PCE = tetrachloroethene, Tc = technetium, TCA = trichloroethane, TCE = trichloroethene, U = uranium, VC =vinyl chloride, Zn = zinc.
2 All reported capital costs were adjusted for site locations and years when costs were incurred, as described in the text. All unadjusted (reported) costs are presented in parentheses. Adjusted costs are not presented in parentheses.3 Installation Method Key: C&F = cut and fill, CT = continuous trencher, CW = continuous wall, DE = dense nonaqueous-phase liquid (DNAPL) extraction, F&G = funnel and gate, F&R = funnel and reaction vessel, HF =
hydraulic fracturing, SPC = Sheet piling construction.4 Reactive Media Material Key: AC = activated carbon, AFO = amorphous ferric oxyhydroxide, Feo = zero-valent iron, IS = iron sponge (wood shavings or chips impregnated with hydrated iron oxide), LM = limestone, OC =
organic carbon (municipal/leaf compost and wood chips), PO4 = bone char phosphate.5 Adjusted average annual operating costs for Intersil are $120,000. Information was obtained from EPA 542-R-98-015.6 An adjustment factor for Northern Ireland is not available. Therefore, an adjustment factor for the United Kingdom was used.7 The lower boundary of the continuous wall was not reported. However, the aquifer extends to 33 ft.8 Adjusted average annual operating costs for the U.S. Coast Guard Support Center are $78,000. Information was obtained from EPA 542-R-98-015.9 Information provided by Mr Robert Puls, EPA.10 Information obtained from EPA 542-R-98-015.NA = Not applicable, NR = Not reported, NS = Not specified

22
REFERENCES
1. U.S. Environmental Protection Agency (EPA). 1999. Groundwater Cleanup: Overview of OperatingExperience at 28 Sites. EPA 542-R-99-006. <http://www.clu-in.org>. September.
2. EPA. 1999. Field Applications of In Situ Remediation Technologies: Permeable Reactive Barriers. EPA542-R-99-002. <http://www.clu-in.org>. June.
3. U.S. Army Corps of Engineers. 1999. PAX Newsletter No. 3.2.1.<http://www.hq.usace.army.mil/cemp/e/es/pax/paxtoc.htm>. March.
4. EPA. 1998. Guide to Documenting and Managing Cost and Performance Information for RemediationProjects, Revised Version. EPA 542-B-98-007. <http://www.frtr.gov>. October.
5. EPA. 1998. Remediation Case Studies: Groundwater Pump and Treat (Chlorinated Solvents, Volume 9). EPA 542-R-98-013. <http://www.frtr.gov>. September.
6. EPA. 1998. Remediation Case Studies: Groundwater Pump and Treat (Nonchlorinated Contaminants,Volume 10). EPA 542-R-98-014. <http://www.frtr.gov>. September.
7. EPA. 1998. Remediation Case Studies: Innovative Groundwater Treatment Technologies, Volume 11. EPA542-R-98-015. <http://www.frtr.gov>. September.
8. Battelle. 1998. Performance Evaluation of a Pilot-Scale Permeable Reactive Barrier at Former Naval AirStation Moffett Field, Mountain View, California. June.
9. EPA. 1995. Remediation Case Studies: Groundwater Treatment. EPA-542-R-95-003. <http://www.frtr.gov>. March.
10. Federal Remediation Technologies Roundtable. <http://www.frtr.gov>.
11. Remediation Technologies Development Forum. <http://www.rtdf.org>.
12. U.S. Department of Labor, Bureau of Labor Statistics. Consumer Price Index.<http://stats.bls.gov/datahome.htm>.
13. EPA. 1997. Cleaning Up the Nation’s Waste Sites: Markets and Technology Trends (1996 Edition). EPA-542-R-96-005. April.
14. Cohen, R.M., J.W. Mercer, and R.M. Greenwald. 1998. EPA Groundwater Issue, Design Guidelines forConventional Pump-and-Treat Systems. EPA 540/S-97/504. <http://www.epa.gov/ada/issue.html>. September.
APPENDIX A. COST EQUATIONS AND EXAMPLE CALCULATIONS
The equations used to normalize the total capital and total annual operating costs and to calculate the average annualoperating costs are presented below.
Adjusted Total Capital Cost = (Total Capital Cost)(ACF)(IF)
Adjusted Total Annual Operating Cost = (Total Annual Operating Cost)(ACF)(IF)
Average Annual Operating Cost = (Adjusted Total Annual Operating Cost)/(# of Years)
Example calculations are presented below for the Former Firestone Superfund Site, which is one of the 32 P&T sitesincluded in the analysis. The site is located in Salinas, California (California ACF = 1.15). The groundwatertreatment system at the Former Firestone Superfund Site was installed in 1985 (IF = 1.44). Annual costs wereincurred from 1986 to 1992, for a total of 6.8 years. 1989 was used as the median year in which annual costs wereincurred (IF = 1.31). The total unadjusted capital cost and total annual operating cost for the site are $4,100,000and $8,800,000, respectively.
Adjusted Total Capital Cost = ($4,100,000)(1.15)(1.44) = $6,900,000
Adjusted Total Annual Cost = ($8,800,000)(1.15)(1.31) = $13,000,000
Average Annual Operating Cost = ($13,000,000)/(6.8) = $2,000,000

23
Case Studies and Related Publications Ordering Instructions and Form
The following documents are available free-of-charge from the U.S. Environmental Protection Agency (EPA) National Service Centerfor Environmental Publications (NSCEP). To order, mail this completed form to: EPA NSCEP, P.O. Box 42419, Cincinnati, OH 45242;or fax the form to (513) 489-8695. Telephone orders may be placed at (800) 490-9198 or (513) 489-8190.
Title NumberPleaseSend
FRTR Publications
Abstracts of Remediation Case Studies, Volume 1 EPA-542-R-95-001; March 1995 *
Remediation Case Studies, Volume 1: Bioremediation EPA-542-R-95-002; March 1995 *
Remediation Case Studies, Volume 2: Groundwater Treatment EPA-542-R-95-003; March 1995 *
Remediation Case Studies, Volume 3: Soil Vapor Extraction EPA-542-R-95-004; March 1995 *
Remediation Case Studies, Volume 4: Thermal Desorption, SoilWashing, and In Situ Vitrification
EPA-542-R-95-005; March 1995 *
Abstracts of Remediation Case Studies, Volume 2 EPA-542-R-97-010; July 1997 *
Remediation Case Studies, Volume 5: Bioremediation and Vitrification EPA-542-R-97-008; July 1997 *
Remediation Case Studies, Volume 6: Soil Vapor Extraction and Other InSitu Technologies
EPA-542-R-97-009; July 1997 *
Abstracts of Remediation Case Studies, Volume 3 EPA-542-R-98-010; September 1998 *
Remediation Case Studies, Volume 7: Ex Situ Soil TreatmentTechnologies (Bioremediation, Solvent Extraction, Thermal Desorption)
EPA-542-R-98-011; September 1998 *
Remediation Case Studies, Volume 8: In Situ Soil TreatmentTechnologies (Soil Vapor Extraction, Thermal Processes)
EPA-542-R-98-012; September 1998 *
Remediation Case Studies, Volume 9: Groundwater Pump and Treat(Chlorinated Solvents)
EPA-542-R-98-013; September 1998 *
Remediation Case Studies, Volume 10: Groundwater Pump and Treat(Nonchlorinated Contaminants)
EPA-542-R-98-014; September 1998 *
Remediation Case Studies, Volume 11: Innovative GroundwaterTreatment Technologies
EPA-542-R-98-015; September 1998 *
Remediation Case Studies, Volume 12: On-Site Incineration EPA-542-R-98-016; September 1998 *
Remediation Case Studies, Volume 13: Debris and Surface CleaningTechnologies, and Other Miscellaneous Technologies
EPA-542-R-98-017; September 1998 *
Guide to Documenting and Managing Cost and Performance Informationfor Remediation Projects, Revised Version
EPA-542-B-98-007; October 1998 *
Abstracts of Remediation Case Studies, Volume 4 EPA-542-R-00-006; June 2000 *
FRTR Cost and Performance Remediation Case Studies and RelatedInformation (CD-ROM)
EPA 542-C-00-001; June 2000 *
EPA Publications
Field Applications of In Situ Remediation Technologies: PermeableReactive Barriers
EPA-542-R-99-002; June 1999 *
Groundwater Cleanup: Overview of Operating Experience at 28 Sites EPA-542-R-99-006; September 1999 *
Name Date
Organization
Address
City/State/Zip
Telephone
E-mail Address
Individual remediation case studies and abstracts also are available on the Internet at http://www.frtr.gov/cost or at http://clu-in.org. EPA publications are available at http://clu-in.org.


![Treatment Technologies for Site Cleanup: Annual Status ...€¦ · groundwater: In situ and ex situ (pump and treat [P&T]) groundwater treatment technologies and monitored natural](https://img.pdfslide.us/doc/110x75/5f10212b7e708231d44797d1/treatment-technologies-for-site-cleanup-annual-status-groundwater-in-situ.jpg)