Embed Size (px)
Citation preview
© 2015 Navigant Consulting Ltd.
COST ALLOCATION TO DIFFERENT
TYPES OF STREET LIGHTING
CONFIGURATIONS
EB‐2012‐0383
Prepared for:
Ontario Energy Board
2300 Yonge Street, 27th floor
Toronto, ON M4P 1E4
Navigant Consulting Ltd.
Bay Adelaide Centre
333 Bay Street, Suite 1250
Toronto, ON M5H 2S7
416‐777‐2440
www.navigantconsulting.com
June 12, 2015

DISCLAIMER
The views expressed in this report are those of Navigant Consulting Limited and do not necessarily represent the views of, and should not be attributed to, the Ontario Energy Board (OEB), any individual Board member of the OEB, or OEB Staff.
Cost Allocation to Different Types of Street Lighting Configurations EB-2012-0383 Page ii Navigant Project No: 174305
TABLE OF CONTENTS
EXECUTIVE SUMMARY................................................................................................................................ 1
1 INTRODUCTION ................................................................................................................................. 4
1.1 Study Objectives .................................................................................................................... 4
1.2 Background ............................................................................................................................ 4
1.3 Street lighting Configurations ............................................................................................. 6
1.4 Structure of Report ............................................................................................................... 7
2 REVIEW OF COST ALLOCATION MODELS (CAM) .......................................................................... 8
2.1 Overview ................................................................................................................................ 8
2.2 Comparison of Street lighting Data for a Range of Connection Ratios ......................... 8
2.3 Cost Allocation Methodology ............................................................................................. 9
3 INTERVIEWS WITH LDC’S AND MUNICIPALITIES ......................................................................... 13
3.1 Overview .............................................................................................................................. 13
3.2 Discussion Guide ................................................................................................................ 14
3.3 Summary of Findings ......................................................................................................... 14
4 CONCLUSIONS AND RECOMMENDATIONS ................................................................................... 16
4.1 General Conclusions ........................................................................................................... 16
4.2 Primary and Line Transformer Assets ............................................................................. 17
4.3 Secondary Assets ................................................................................................................ 17
4.4 Street lighting Adjustment Factor .................................................................................... 18
4.5 Change in Cost Allocation by Customer Class ............................................................... 20
4.6 Other Issues and Considerations ...................................................................................... 21
4.7 Summary .............................................................................................................................. 22
APPENDIX A: DISCUSSION GUIDE ........................................................................................................... 24
APPENDIX B: DETAILS OF INTERVIEWS WITH LDC’S AND MUNICIPALITIES ........................................ 27
Cost Allocation to Different Types of Street Lighting Configurations EB-2012-0383 Page iii Navigant Project No: 174305
LIST OF FIGURES AND TABLES
Figure 1‐ One‐to‐one (1:1) and Daisy‐chain Street lighting Configurations .................................... 7
Figure 2 ‐ Sensitivity of customer related cost to connection ratio .................................................. 10
Figure 3 – Sensitivity of customer and demand related costs to connection ratio ........................ 12
Figure 4 – Discussion Guide Outline ................................................................................................... 13
Figure 5 – Street lighting Cost Allocation ........................................................................................... 20
Table 1‐ Select Data for Sample LDC’s .................................................................................................. 8
Table 2 – Sensitivity of customer related costs to connection ratio ................................................. 10
Table 3 ‐ Sample calculation of street lighting adjustment factor .................................................... 19
Table 4 ‐ Street lighting Adjustment Factors ...................................................................................... 19
Table 5 - Change in Cost Allocation .................................................................................................... 21
Cost Allocation to Different Types of Street Lighting Configurations EB-2012-0383 Page 1 Navigant Project No: 174305
EXECUTIVE SUMMARY
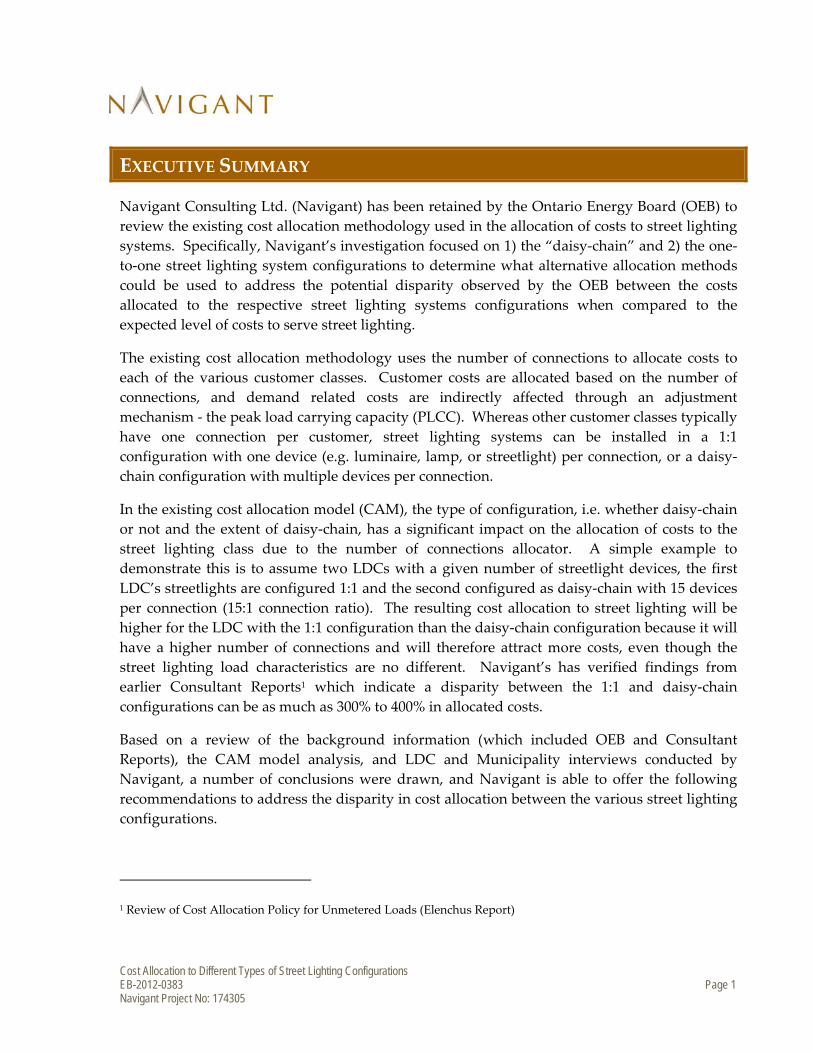
Navigant Consulting Ltd. (Navigant) has been retained by the Ontario Energy Board (OEB) to
review the existing cost allocation methodology used in the allocation of costs to street lighting
systems. Specifically, Navigant’s investigation focused on 1) the “daisy‐chain” and 2) the one‐
to‐one street lighting system configurations to determine what alternative allocation methods
could be used to address the potential disparity observed by the OEB between the costs
allocated to the respective street lighting systems configurations when compared to the
expected level of costs to serve street lighting.
The existing cost allocation methodology uses the number of connections to allocate costs to
each of the various customer classes. Customer costs are allocated based on the number of
connections, and demand related costs are indirectly affected through an adjustment
mechanism ‐ the peak load carrying capacity (PLCC). Whereas other customer classes typically
have one connection per customer, street lighting systems can be installed in a 1:1
configuration with one device (e.g. luminaire, lamp, or streetlight) per connection, or a daisy‐
chain configuration with multiple devices per connection.
In the existing cost allocation model (CAM), the type of configuration, i.e. whether daisy‐chain
or not and the extent of daisy‐chain, has a significant impact on the allocation of costs to the
street lighting class due to the number of connections allocator. A simple example to
demonstrate this is to assume two LDCs with a given number of streetlight devices, the first
LDC’s streetlights are configured 1:1 and the second configured as daisy‐chain with 15 devices
per connection (15:1 connection ratio). The resulting cost allocation to street lighting will be
higher for the LDC with the 1:1 configuration than the daisy‐chain configuration because it will
have a higher number of connections and will therefore attract more costs, even though the
street lighting load characteristics are no different. Navigant’s has verified findings from
earlier Consultant Reports1 which indicate a disparity between the 1:1 and daisy‐chain
configurations can be as much as 300% to 400% in allocated costs.
Based on a review of the background information (which included OEB and Consultant
Reports), the CAM model analysis, and LDC and Municipality interviews conducted by
Navigant, a number of conclusions were drawn, and Navigant is able to offer the following
recommendations to address the disparity in cost allocation between the various street lighting
configurations.
1 Review of Cost Allocation Policy for Unmetered Loads (Elenchus Report)

Cost Allocation to Different Types of Street Lighting Configurations EB-2012-0383 Page 2 Navigant Project No: 174305
Navigant recommends that:
1. The allocation of the primary and line transformer assets and related costs to street
lighting be calculated using a newly devised “street lighting adjustment factor” instead
of the existing allocation that is based on number of street lighting connections.
2. The street lighting adjustment factor is calculated as the ratio of i) the four highest
monthly non‐coincident peak demands (NCP42) for the residential customer class
divided by the number of residential customers, and ii) the NCP4 for the street lighting
customer class divided by the number of streetlight devices.
3. No change for the allocation of the secondary assets and related costs, which is based
on the number of connections.
The resulting adjustment factor is independent of the number of streetlight connections and
would not vary with the street lighting connection ratio, and eliminates much of the disparity
between the 1:1 and daisy‐chain street lighting configurations. The calculated adjustment
factor is also LDC‐specific and can be calculated using information that is available in the
existing CAM model.
The expected change in cost allocation for each of the various customer classes is provided in
Table ES ‐ 1 below. Navigant estimates that LDCs with connection ratios of 3:1 or less could
potentially see reductions in distribution cost allocations to the street lighting class ranging
from 50% to 70%, with the offsetting increase to other customer classes ranging from 0% to 4%.
High connection ratio LDCs (greater than 10:1) could potentially see an increase in cost
allocation to the street lighting class ranging from 0% to 15% and no material decrease is
expected for the other customer classes.
As a cautionary note, Navigant reiterates that the cost allocation changes indicated are only
estimates and actual changes may vary considerably depending on the specific characteristics
of individual LDCs.
2 The Cost Allocation Model decides whether to use a 1 NCP or 4 NCP method for allocating demand costs based on
a test described in Board Directions on Cost Allocation Methodology for Electricity Distributors, EB‐2005‐0317, p.61, dated
September 29, 2006. All distributors except one had an NCP4 test result in their Cost Allocation filings.
Cost Allocation to Different Types of Street Lighting Configurations EB-2012-0383 Page 3 Navigant Project No: 174305
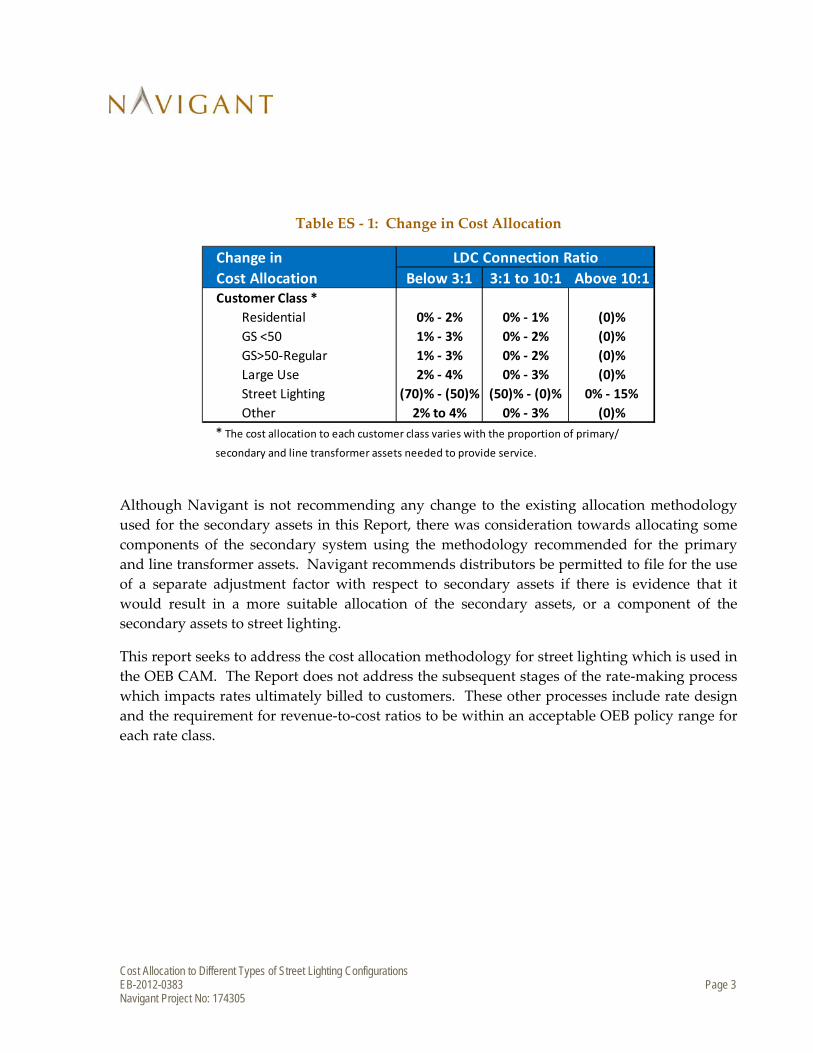
Table ES ‐ 1: Change in Cost Allocation
Although Navigant is not recommending any change to the existing allocation methodology
used for the secondary assets in this Report, there was consideration towards allocating some
components of the secondary system using the methodology recommended for the primary
and line transformer assets. Navigant recommends distributors be permitted to file for the use
of a separate adjustment factor with respect to secondary assets if there is evidence that it
would result in a more suitable allocation of the secondary assets, or a component of the
secondary assets to street lighting.
This report seeks to address the cost allocation methodology for street lighting which is used in
the OEB CAM. The Report does not address the subsequent stages of the rate‐making process
which impacts rates ultimately billed to customers. These other processes include rate design
and the requirement for revenue‐to‐cost ratios to be within an acceptable OEB policy range for
each rate class.
Change in
Cost Allocation Below 3:1 3:1 to 10:1 Above 10:1Customer Class *
Residential 0% ‐ 2% 0% ‐ 1% (0)%
GS <50 1% ‐ 3% 0% ‐ 2% (0)%
GS>50‐Regular 1% ‐ 3% 0% ‐ 2% (0)%
Large Use 2% ‐ 4% 0% ‐ 3% (0)%
Street Lighting (70)% ‐ (50)% (50)% ‐ (0)% 0% ‐ 15%
Other 2% to 4% 0% ‐ 3% (0)%
* The cost allocation to each customer class varies with the proportion of primary/
secondary and line transformer assets needed to provide service.
LDC Connection Ratio

Cost Allocation to Different Types of Street Lighting Configurations EB-2012-0383 Page 4 Navigant Project No: 174305
1 INTRODUCTION
Navigant Consulting Ltd. (Navigant) has been retained by the Ontario Energy Board (OEB) to
review the existing cost allocation methodology used in the allocation of electricity distribution
costs to street lighting systems. Specifically, Navigant’s investigation focused on 1) the “daisy‐
chain” and 2) the one‐to‐one street lighting system configurations to determine what
alternative allocation methods could be used to address the potential disparity observed by the
OEB between the costs allocated to the respective street lighting systems configurations when
compared to the expected level of costs to serve street lighting.
1.1 Study Objectives
The key objectives of this project are:
1. Examine the utility and municipality assets and the portion of utility assets required to
serve the various street lighting system configurations and associated costs;
2. Examine the existing methods of cost allocation and assessing their appropriateness for
application to the various street lighting system configurations;
3. Examine and classify the determinants relevant to the allocation of costs to common
connection street lighting systems and one‐device‐per‐connection systems; and
4. Update the Cost Allocation Model, as required, with respect to the cost allocation to
various street lighting system configurations.
1.2 Background
Prior to this study, the cost allocation potential disparity issue for the various street lighting
system configurations was identified in two OEB documents3 and one Consultant Report4. The
relevant findings from each of these documents are briefly summarized below.
3 Cost Allocation Review EB 2005‐0317, and Report of the Board EB‐2012‐0383
4 Review of Cost Allocation Policy for Unmetered Loads (Elenchus Report)

Cost Allocation to Different Types of Street Lighting Configurations EB-2012-0383 Page 5 Navigant Project No: 174305
1.2.1 Cost Allocation Review EB 2005-0317, Board Directions on Cost Allocation Methodology for Electricity Distributors
Certain aspects of the existing cost allocation methodology that relate to street lighting are
derived from this review. This includes:
Peak Load Carrying Capability (PLCC) – this adjustment reduces a portion of the
demand related costs which are covered in the customer/connection minimum system
allocation. The cost allocation incorporates a common PLCC adjustment of 0.4 kW per
customer, or 0.4 kW per connection. For street lighting and unmetered scattered loads,
the number of connections will be used to determine the PLCC adjustment for these
customers. It is expected that when these customers are in a separate rate classification,
in some cases the PLCC adjustment will reduce the demand allocator to zero and thus
no demand‐related costs associated with the minimum system will be allocated to the
rate classification. This is considered a reasonable outcome, as there are a number of
cases where the connection will use less than 0.4 kW of load.5
Definition of Customer and Connection for Filings ‐ For unmetered loads, the
number of connections will be used to allocate some customer‐related costs. For
streetlights, sentinel lights and unmetered scattered loads, the number of connections
will be the actual number of devices. In the case of streetlights, one “connection”
frequently links a number of fixtures to the distribution system and simply using the
number of devices may overstate the number of physical connections to the
distributor’s system. Therefore, where better information is available, distributors must
apply a connection factor to the number of streetlight fixtures for the purpose of
determining the customer allocation factor.
1.2.2 Report of the Board - EB-2012-0383, Review of the Board’s Cost Allocation Policy for Unmetered Loads
Among the issues addressed in this Report was a review of the Cost Allocation Model (CAM)
and the cost allocation methodology. Specific statements include:
The Board remains concerned with the allocation of costs to daisy‐chain configured
systems. The disparity in the cost allocation result between a street lighting customer
configuration with multiple devices per connection and a street lighting customer with
a device to connection ratio close to 1:1 appears to be disproportionate when compared
to actual costs to serve the street lighting rate class. The Board believes that further
5 The default PLCC value is 0.4 kW, but LDC’s may adopt a unique value that can be supported.
Cost Allocation to Different Types of Street Lighting Configurations EB-2012-0383 Page 6 Navigant Project No: 174305
investigation is necessary before making a determination. The Board will issue a letter
shortly to begin a consultation process for this single issue.
The Board does not believe that there is sufficient evidence at this time to narrow the
revenue to cost ratio range for the street lighting class (i.e. the revenue to cost ratio
range is to remain at 0.7 to 1.2).
1.2.3 Review of Cost Allocation Policy for Unmetered Loads (Elenchus Report)
This Consultant Report preceded and informed the EB‐2012‐0383 Report of the Board
referenced above. The key findings and recommendations from this report include:
A critical assumption with respect to the inputs for Street Lighting is the number of
devices per connection. This assumption has the most significant impact on the revenue
requirement for the Street Lighting customer class. The difference in revenue
requirement between a device per connection ratio of 15:1 and a 1:1 is over 400%.
Communication (Distributors’ Responsibility) ‐ The actual configuration used by the
distributors in connecting Unmetered Loads should be reflected in their Cost Allocation
Methodology. This leads to different cost allocation study results from one utility to
another as the connection configuration of Unmetered Loads varies.
1.3 Street lighting Configurations
A key objective of this Navigant study is to review the cost allocation methodologies for one‐
to‐one (1:1) and daisy‐chain street lighting configurations. As depicted in Figure 1 below, a 1:1
configuration is where there is one LDC connection for each streetlight or device, and daisy‐
chain is where there are multiple streetlights or devices connected to a single connection. For
the daisy‐chain example depicted in Figure 1, the number of devices per connection, or
connection ratio would be 6:1 i.e. six devices for one connection.
Cost Allocation to Different Types of Street Lighting Configurations EB-2012-0383 Page 7 Navigant Project No: 174305
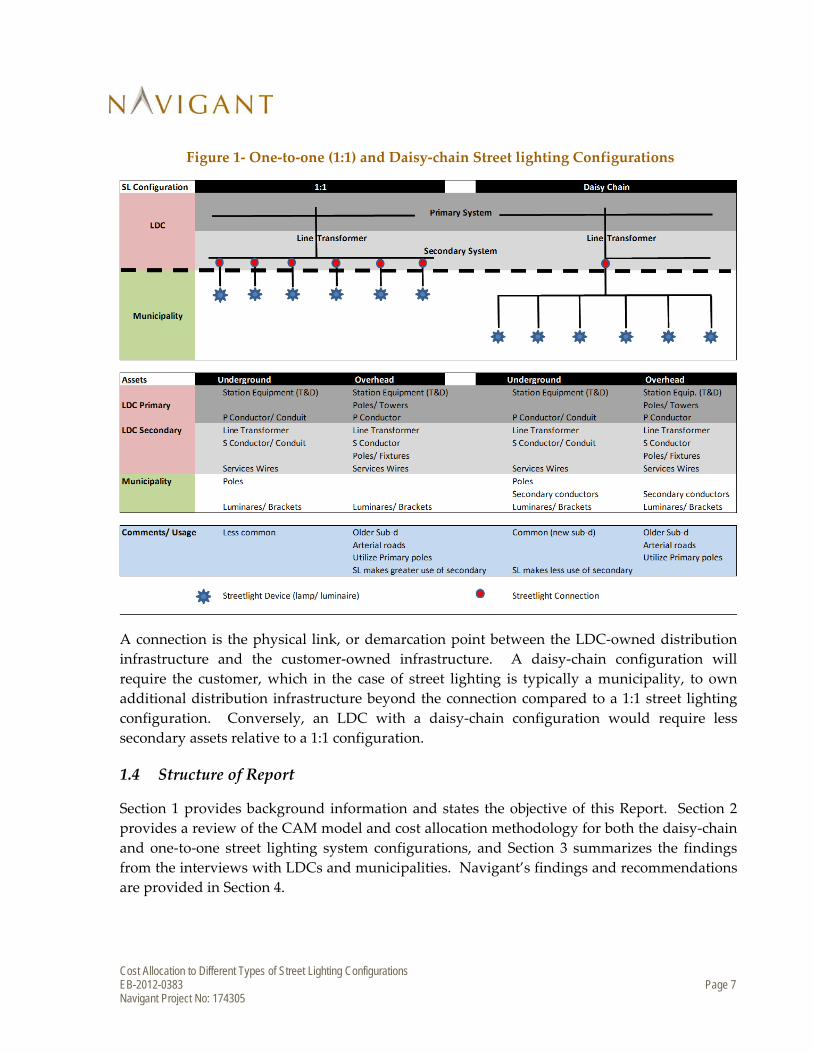
Figure 1‐ One‐to‐one (1:1) and Daisy‐chain Street lighting Configurations
A connection is the physical link, or demarcation point between the LDC‐owned distribution
infrastructure and the customer‐owned infrastructure. A daisy‐chain configuration will
require the customer, which in the case of street lighting is typically a municipality, to own
additional distribution infrastructure beyond the connection compared to a 1:1 street lighting
configuration. Conversely, an LDC with a daisy‐chain configuration would require less
secondary assets relative to a 1:1 configuration.
1.4 Structure of Report
Section 1 provides background information and states the objective of this Report. Section 2
provides a review of the CAM model and cost allocation methodology for both the daisy‐chain
and one‐to‐one street lighting system configurations, and Section 3 summarizes the findings
from the interviews with LDCs and municipalities. Navigant’s findings and recommendations
are provided in Section 4.
Cost Allocation to Different Types of Street Lighting Configurations EB-2012-0383 Page 8 Navigant Project No: 174305
2 REVIEW OF COST ALLOCATION MODELS (CAM)
2.1 Overview
This section reviews the CAM models and highlights the differences between the daisy‐chain
and one‐to‐one street lighting system configurations. The review provides a comparison of
street lighting data for a range of connection ratios ranging from 1:1 to 15:1, and investigates
the allocation of customer related costs and demand related costs.
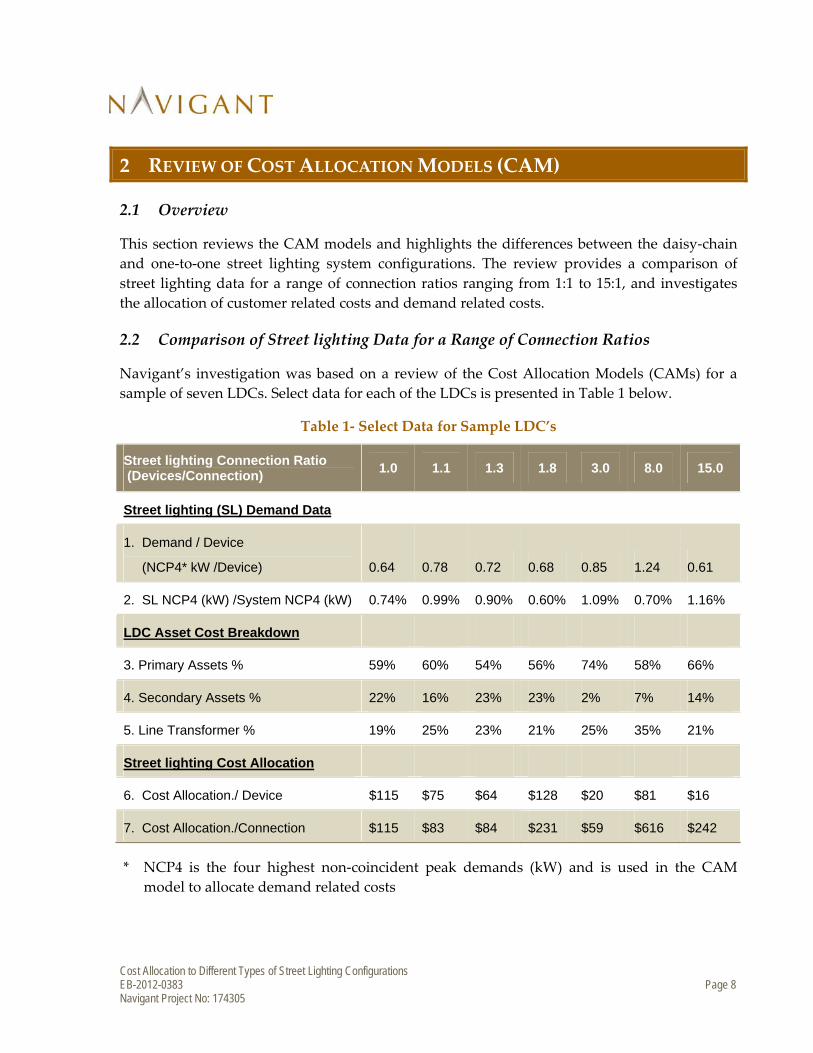
2.2 Comparison of Street lighting Data for a Range of Connection Ratios
Navigant’s investigation was based on a review of the Cost Allocation Models (CAMs) for a
sample of seven LDCs. Select data for each of the LDCs is presented in Table 1 below.
Table 1‐ Select Data for Sample LDC’s
Street lighting Connection Ratio (Devices/Connection)
1.0 1.1 1.3 1.8 3.0 8.0 15.0
Street lighting (SL) Demand Data
1. Demand / Device
(NCP4* kW /Device) 0.64 0.78 0.72 0.68 0.85 1.24 0.61
2. SL NCP4 (kW) /System NCP4 (kW) 0.74% 0.99% 0.90% 0.60% 1.09% 0.70% 1.16%
LDC Asset Cost Breakdown
3. Primary Assets % 59% 60% 54% 56% 74% 58% 66%
4. Secondary Assets % 22% 16% 23% 23% 2% 7% 14%
5. Line Transformer % 19% 25% 23% 21% 25% 35% 21%
Street lighting Cost Allocation
6. Cost Allocation./ Device $115 $75 $64 $128 $20 $81 $16
7. Cost Allocation./Connection $115 $83 $84 $231 $59 $616 $242
* NCP4 is the four highest non‐coincident peak demands (kW) and is used in the CAM
model to allocate demand related costs
Cost Allocation to Different Types of Street Lighting Configurations EB-2012-0383 Page 9 Navigant Project No: 174305
Navigant’s review of the street lighting demand data did not indicate any material difference
or trend when comparing LDCs at various connection ratios, either in terms of average
demand per street lighting device (Table 1 – line 1) or the total street lighting demand as a
proportion of the total demand for the LDC (Table 1 – line 2). A trend that is apparent is a
decrease in the proportion of the LDC secondary assets as the connection ratio increases. This
is shown in Table 1, line 4 where the secondary assets for LDCs with a connection ratio below
2.0 ranges from 16% to 23%, whereas LDCs with connection ratios above 2.0 ranges from 7% to
14%. As already noted in Section 1.3, this is not unexpected given that a daisy‐chain
configuration would require less secondary assets on the LDC side of the ownership
demarcation point, but would require additional municipally owned street lighting assets.
A trend that is clearly evident is the decrease in cost allocation per street lighting device as
shown in Table 1, line 6, where the revenue requirement decreases from $115 for a connection
ratio of 1.0, to $16 per device for a daisy‐chain configuration with a connection ratio of 15:1.
This difference in cost allocation to 1:1 versus daisy‐chain street lighting configurations
highlights the concerns of the OEB as noted in the Review of the Board’s Cost Allocation
Policy for Unmetered Loads (Report of the Board EB‐2012‐0383).
2.3 Cost Allocation Methodology
The existing cost allocation methodology uses the minimum system method to categorize or
split the distribution system between customer and demand related costs. This theoretical
method is used to determine the proportion of assets and costs that are customer related and
do not vary with changes in demand, with the remaining proportion categorized as demand
related. The CAM model then uses connections to allocate customer related costs to each of the
customer classes. Each connection attracts the same level of customer related costs, regardless
of customer class, or in the case of street lighting a connection with a single device (1:1) attracts
the same level of customer related costs as a connection with 15 devices (daisy‐chain at 15:1).
Demand related costs are allocated on the basis of the non‐coincident peak demand (NCP).
The customer and demand cost allocation mechanisms are examined in further detail in
sections 2.3.1 and 2.3.2 below.
2.3.1 Customer Related Costs
Given the CAM model cost allocation methodology and the use of connections to allocate
customer related costs, a key factor impacting the allocation of costs to street lighting is the
type of configuration (1:1 or daisy‐chain), and correspondingly the connection ratio. In the
Elenchus Report (Review of Cost Allocation Policy for Unmetered Loads), it was noted that the
allocation to street lighting can vary by over 400% depending on the street lighting connection
Cost Allocation to Different Types of Street Lighting Configurations EB-2012-0383 Page 10 Navigant Project No: 174305
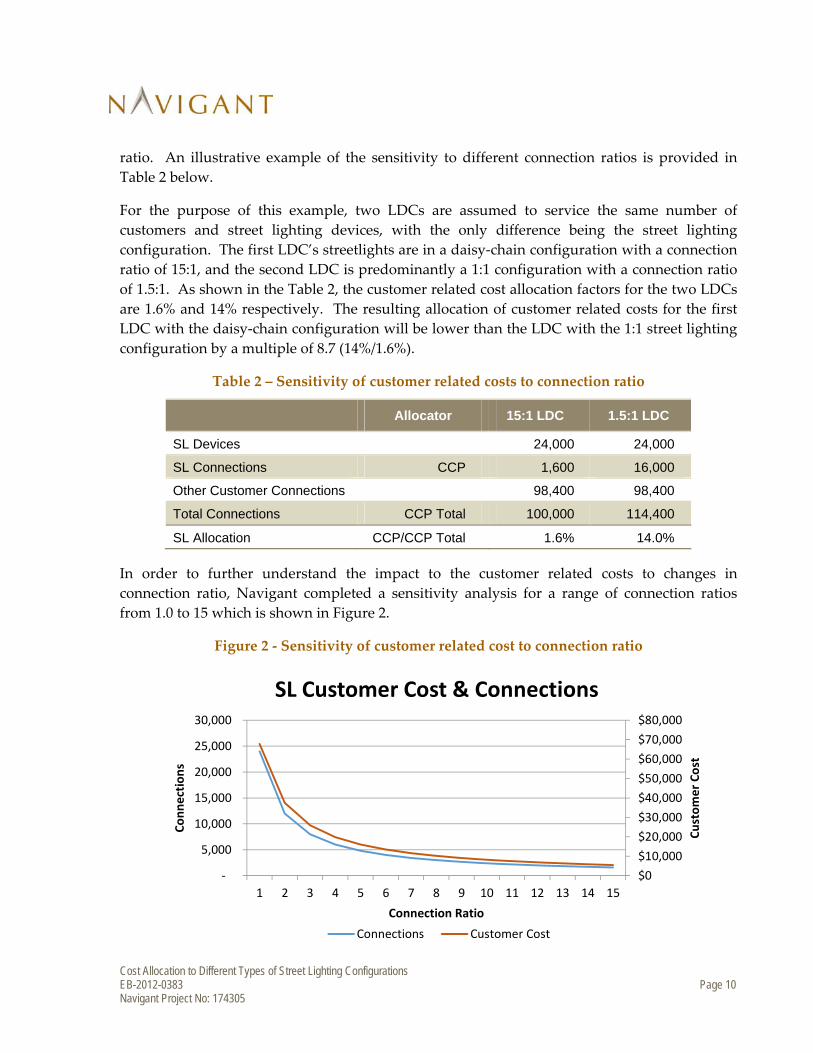
ratio. An illustrative example of the sensitivity to different connection ratios is provided in
Table 2 below.
For the purpose of this example, two LDCs are assumed to service the same number of
customers and street lighting devices, with the only difference being the street lighting
configuration. The first LDC’s streetlights are in a daisy‐chain configuration with a connection
ratio of 15:1, and the second LDC is predominantly a 1:1 configuration with a connection ratio
of 1.5:1. As shown in the Table 2, the customer related cost allocation factors for the two LDCs
are 1.6% and 14% respectively. The resulting allocation of customer related costs for the first
LDC with the daisy‐chain configuration will be lower than the LDC with the 1:1 street lighting
configuration by a multiple of 8.7 (14%/1.6%).
Table 2 – Sensitivity of customer related costs to connection ratio
Allocator 15:1 LDC 1.5:1 LDC
SL Devices 24,000 24,000
SL Connections CCP 1,600 16,000
Other Customer Connections 98,400 98,400
Total Connections CCP Total 100,000 114,400
SL Allocation CCP/CCP Total 1.6% 14.0%
In order to further understand the impact to the customer related costs to changes in
connection ratio, Navigant completed a sensitivity analysis for a range of connection ratios
from 1.0 to 15 which is shown in Figure 2.
Figure 2 ‐ Sensitivity of customer related cost to connection ratio
$0
$10,000
$20,000
$30,000
$40,000
$50,000
$60,000
$70,000
$80,000
‐
5,000
10,000
15,000
20,000
25,000
30,000
1 2 3 4 5 6 7 8 9 10 11 12 13 14 15
Customer Cost
Connections
Connection Ratio
SL Customer Cost & Connections
Connections Customer Cost
Cost Allocation to Different Types of Street Lighting Configurations EB-2012-0383 Page 11 Navigant Project No: 174305
The sensitivity analysis above shows that the allocation of customer costs to street lighting is
far more sensitive for connection ratios of 1:1 to 3:1 than for high connection ratios where it is
relatively insensitive to changes. For this example, a change in connection ratio from 1:1 to 2:1,
decreases the allocation to street lighting for this customer account by approximately 45%.
While some differences exist in the cost to connect and maintain street lighting service, in
Navigant’s view it is difficult to rationalize that the street lighting customer cost curve
presented in Figure 2 is a true reflection of the expected level of costs for LDCs to provide
street lighting service.
Key Points:
The allocation of customer related cost are very sensitive to the street lighting
connection ratio, particularly for low connection ratios
It is difficult to rationalize that the customer cost sensitivity to connection ratio as per
the existing coast allocation methodology reflects actual LDC costs to provide service
2.3.2 Demand Related Costs
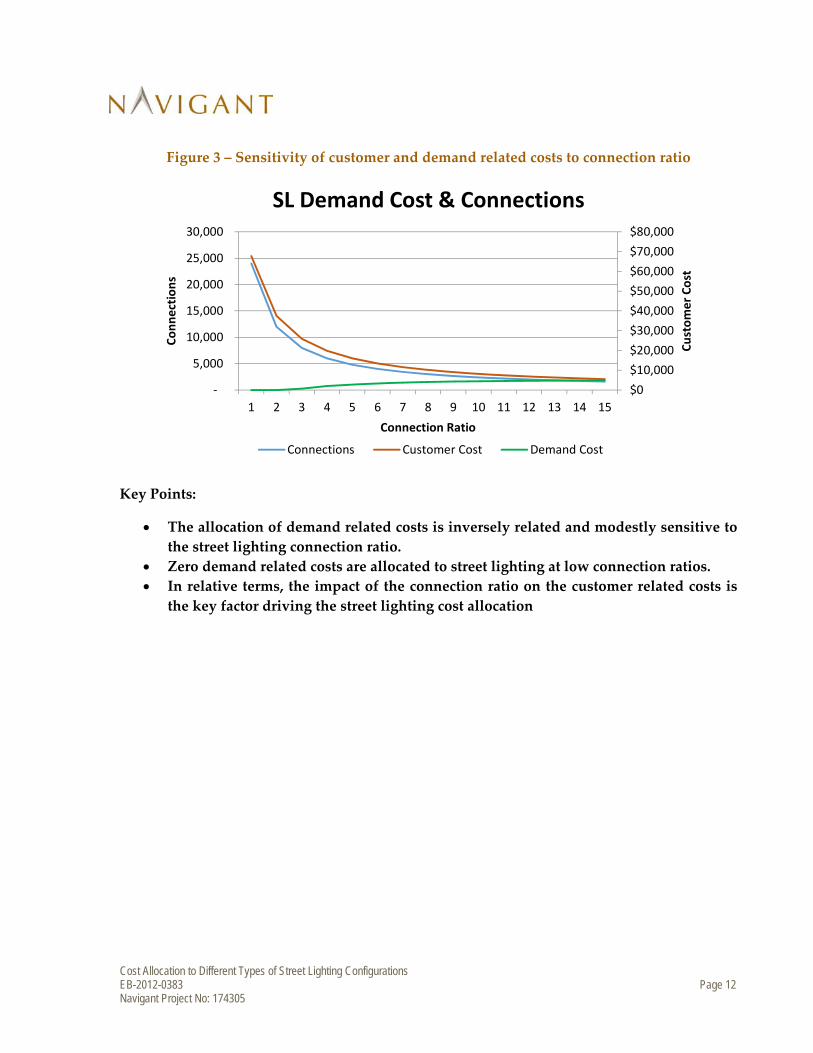
The CAM model uses the non‐coincident peak demand data to allocate demand related costs to
each customer class, and in most cases uses the four highest monthly non‐coincident peak
(NCP4) demands. The sensitivity of the demand related costs to connection ratio for street
lighting is provided in Figure 3, which also includes the customer related costs from Figure 2
for comparison. This Figure shows that demand related costs are inversely related to the
customer related costs, and less sensitive in connection ratio. The change in the demand
allocation is related to the Peak Load Carrying Capacity (PLCC) adjustment for the NCP4,
which serves to partially offset the customer related allocation which includes a small demand
related cost component. The adjustment results in a zero demand allocation (NCP4) at low
connection ratios in the range of 1 to 2.
Cost Allocation to Different Types of Street Lighting Configurations EB-2012-0383 Page 12 Navigant Project No: 174305
Figure 3 – Sensitivity of customer and demand related costs to connection ratio
Key Points:
The allocation of demand related costs is inversely related and modestly sensitive to
the street lighting connection ratio.
Zero demand related costs are allocated to street lighting at low connection ratios.
In relative terms, the impact of the connection ratio on the customer related costs is
the key factor driving the street lighting cost allocation
$0
$10,000
$20,000
$30,000
$40,000
$50,000
$60,000
$70,000
$80,000
‐
5,000
10,000
15,000
20,000
25,000
30,000
1 2 3 4 5 6 7 8 9 10 11 12 13 14 15
Customer Cost
Connections
Connection Ratio
SL Demand Cost & Connections
Connections Customer Cost Demand Cost
Cost Allocation to Different Types of Street Lighting Configurations EB-2012-0383 Page 13 Navigant Project No: 174305
3 INTERVIEWS WITH LDC’S AND MUNICIPALITIES
3.1 Overview
Navigant sent out an introductory letter to seven LDCs and their associated municipalities.
This letter provided a synopsis of the project objectives, key topics of discussion and how
information obtained through the interview would be used in the project and analysis. These
interviews consisted of one‐on‐one interviews and information gathering sessions with both
the local distribution companies and their associated municipalities.
In the case of LDCs that serve more than one municipality, Navigant initially targeted the
largest municipality served by the LDC and followed with contacting the second‐largest
municipality if it appeared that an interview was not likely to proceed on a timely basis with
the largest municipality. Navigant also included both regulatory and engineering staff in the
interviews to cover both the cost allocation and network configuration applicable to the LDC.
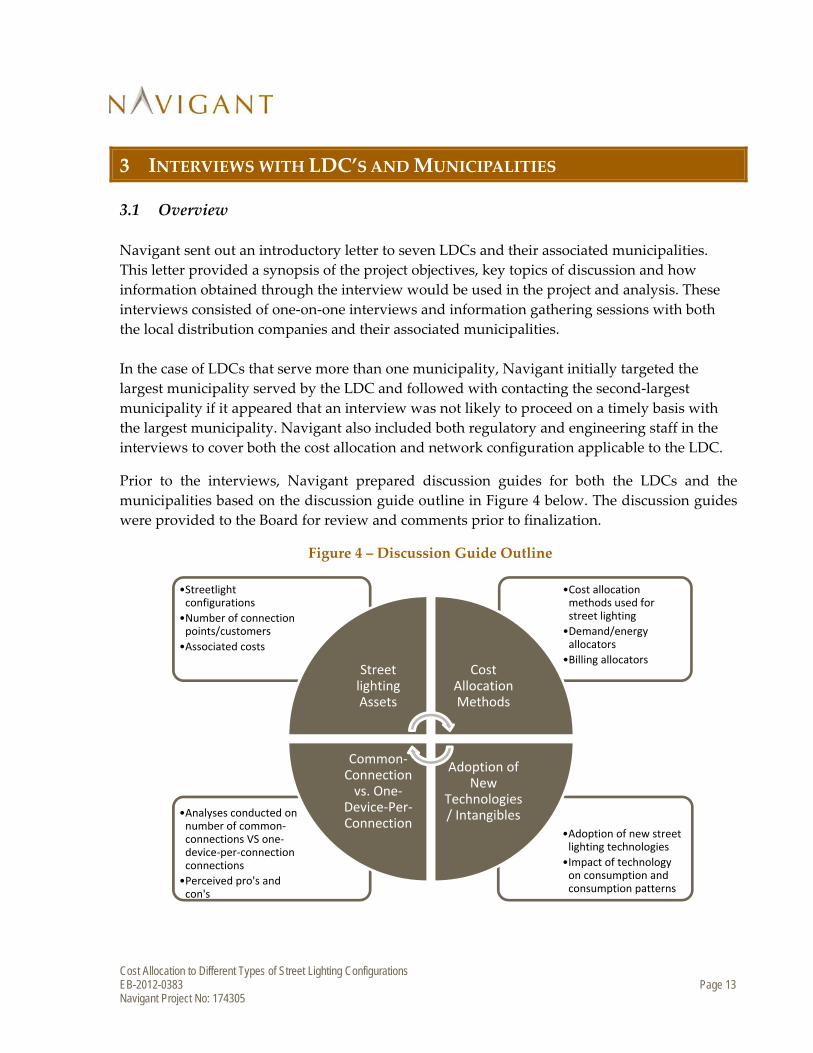
Prior to the interviews, Navigant prepared discussion guides for both the LDCs and the
municipalities based on the discussion guide outline in Figure 4 below. The discussion guides
were provided to the Board for review and comments prior to finalization.
Figure 4 – Discussion Guide Outline
•Adoption of new street lighting technologies
•Impact of technology on consumption and consumption patterns
•Analyses conducted on number of common‐connections VS one‐device‐per‐connection connections
•Perceived pro's and con's
•Cost allocation methods used for street lighting
•Demand/energy allocators
•Billing allocators
•Streetlight configurations
•Number of connection points/customers
•Associated costs
Street lighting Assets
Cost Allocation Methods
Adoption of New
Technologies / Intangibles
Common‐Connection vs. One‐
Device‐Per‐Connection
Cost Allocation to Different Types of Street Lighting Configurations EB-2012-0383 Page 14 Navigant Project No: 174305
3.2 Discussion Guide
Navigant developed a Discussion Guide to assist with the interviews. The questions were split
up into sections for street lighting assets, cost allocation methods, adoption of technologies,
and whether street lighting configurations are common‐connection or one device per
connection. Each question was categorized to be targeted towards either a LDC or
municipality. This guide was used as a baseline for the interviews, however is not an
exhaustive list of what was discussed. Navigant generally conducted the interviews based
upon the pace and direction of interview responses. The Discussion Guide is provided in
Appendix A.
3.3 Summary of Findings
From the interviews it was found that the majority of the LDCs do not own street lighting
assets, with the exception of one LDC having recently purchased street lighting assets. As most
of these assets are not LDC owned, operations and maintenance (O&M) is typically performed
by the municipality and the number of streetlights that are overhead or underground
connected is not tracked by the LDC. However, further discussions with LDCs and
municipalities revealed that some of these jurisdictions have tracked the number of bulbs in
geographic information systems. Most LDCs have a combination of both 1:1 and daisy‐chain
configurations throughout their systems, with most new residential subdivisions being
configured as underground daisy‐chain. Daisy‐chain configurations with the LDCs
interviewed were typically between 6‐12 connections per mainline connection.
Subsequent to the initial interviews, Navigant conducted follow‐up calls with engineering and
technical staff (distribution system planning staff) from a number of the LDCs to ask further
questions about street lighting and the design of the various components of the distribution
system. Navigant’s findings with respect to asset utiliziation were the following:
Primary and Line Transformer Assets
The assets are designed for peak load (normal peak + contingency backup)
Street lighting peak load is not considered for design purposes (too small)
For a given number of devices, the street lighting configuration (1:1 or daisy‐chain) has
an identical impact on planning of primary and line transformer assets. For both the 1:1
or daisy‐chain configurations there is a single connection from the secondary to the
primary/ line transformer assets.
Secondary Assets

Cost Allocation to Different Types of Street Lighting Configurations EB-2012-0383 Page 15 Navigant Project No: 174305
The secondary system design is not dependent on the size of individual customer loads.
Typically a standardized equipment specification using the same size or capacity of
lines, poles, equipment etc. is deployed regardless of customer type. Voltage drop is
typically the limiting factor for streetlight design.
The purpose of the secondary system is to connect all customers taking power at
secondary voltage levels to the distribution system.
Secondary assets (below the line transformer) are not the same for a daisy‐chain and 1:1
street lighting configuration. There are generally more LDC assets for 1:1 street lighting
configuration.
Navigant’s detailed findings are provided in Appendix A.
Cost Allocation to Different Types of Street Lighting Configurations EB-2012-0383 Page 16 Navigant Project No: 174305
4 CONCLUSIONS AND RECOMMENDATIONS
Based on a review of the background information (which included OEB and Consultant
Reports), the CAM model analysis, and LDC and Municipality interviews conducted by
Navigant, a number of conclusions were drawn, and Navigant is able to offer
recommendations to address the daisy‐chain issue.
Navigant’s general conclusions are provided below, and are followed by the conclusions and
recommendations that apply specifically to the secondary assets, and the primary and line
transformer assets.
4.1 General Conclusions
Street lighting differs from other customer classes in that the number of connections per
device can vary significantly between LDCs, and the number of connections may not
equal the number of devices. For most other rate classes the number of connections is
typically equal to the number of customers.
The existing connection based cost allocation methodology results in a disproportionate
share of costs to 1:1 street lighting configurations compared to daisy chain
configurations.
Based on the findings in the interviews, a number of LDCs did not know precisely the
number of physical street lighting connections on their system, and as such used an
estimate for the purpose of their cost allocation study. Each of the LDCs interviewed
kept accurate records of the number of devices which is typically used for billing
purposes.
Street lighting configurations and demarcation points from one LDC to the next, as well
as within a single LDC, can vary widely given that the distribution system
infrastructure may be composed of equipment of various vintages or LDC
consolidations etc.
Recommendation – modify the existing connection based cost allocation methodology
for street lighting with a street lighting adjustment factor that is independent of the
actual number of streetlight connections.
In order to attract the same level of costs regardless of configuration and the actual number
of connections, it is recommended that the street lighting adjustment factor be used in
conjunction with the number of devices or lamps to derive the connection factor. As an
example, an LDC with 10,000 devices would have 1,000 SL connections using an assumed
street lighting adjustment factor of 10. The adjustment factor would be calculated based on
Cost Allocation to Different Types of Street Lighting Configurations EB-2012-0383 Page 17 Navigant Project No: 174305
the individual LDC load data and is independent of the actual number of street lighting
connections.
4.2 Primary and Line Transformer Assets
Findings
Assets are designed for peak load (normal peak and contingency backup).
Street lighting demand is not considered in peak load (too small).
For a given number of devices or load, the street lighting configuration (daisy‐chain or
1:1) has an equivalent impact on the primary system, and in both cases there is a single
primary connection/ line transformer.
Under the existing cost allocation methodology, a street lighting connection is
equivalent to any other connection on the system and attracts the same level of costs,
regardless if it is a 1:1 or daisy‐chain configuration.
A street lighting connection is not equivalent to a residential connection in terms of load
and the impact on the primary distribution system.
Conclusions:
For a given number of devices, both daisy‐chain and 1:1 street lighting configurations
should attract the same level of costs given that the effect on the primary distribution
system and line transformers is the same for both configurations.
Recommendation: For the allocation of the primary and line transformer assets and related
costs to street lighting, Navigant recommends that the existing methodology based on the
physical number of connections be replaced with a street lighting adjustment factor. The
recommended street lighting adjustment factor is calculated as the ratio of 1) the four
highest monthly non‐coincident peak demands (NCP4) for the residential customer class
divided by the number of residential customers, and 2) the NCP4 for the street lighting
customer class divided by the number of streetlight devices. The CAM model would be
updated to calculate the street lighting adjustment factors for both the primary and line
transformer assets respectively.
4.3 Secondary Assets
Findings:
Cost Allocation to Different Types of Street Lighting Configurations EB-2012-0383 Page 18 Navigant Project No: 174305
Municipal asset ownership is higher for daisy‐chain than 1:1 i.e. the lines and poles on
the municipal side of the demarcation point.
Typically a standardized equipment specification using the same size or capacity of
lines, poles, equipment etc. is deployed regardless of customer type. Voltage drop is
typically the limiting factor for streetlight design.
Street lighting configurations are typically a mix of 1:1 and daisy‐chain and the
connection ratio will vary from one LDC to the next depending on the vintage of the
equipment, design standards etc.
Secondary assets (below the line transformer) are not the same for daisy‐chain and 1:1
street lighting configurations. LDCs with 1:1 street lighting configurations typically
have a higher proportion of secondary assets (as indicated in Table 1 ‐ line 4).
The secondary system design is not dependent on the size of individual customer loads
and a standardized equipment specification for lines and poles etc. is used regardless of
customer type.
Conclusions:
The purpose of the secondary system is to connect all customers taking power at
secondary voltage levels to the distribution system.
The existing cost allocation methodology and the use of connections to allocate
secondary costs (below the line transformer) is reasonable.
Recommendation ‐ For the allocation of the secondary assets and related costs to street
lighting, Navigant does not recommend any change to the existing connection based cost
allocation.
Although no specific recommendation is included in this Report, it should be noted that there
was consideration during the course of the study towards allocating some components of the
secondary system using the methodology recommended for the primary and line transformer
assets. Navigant recommends distributors be permitted to file for the use of a separate
adjustment factor with respect to secondary assets if there is evidence that it would result in a
more suitable allocation of the secondary assets, or a component of the secondary assets to
street lighting.
4.4 Street lighting Adjustment Factor
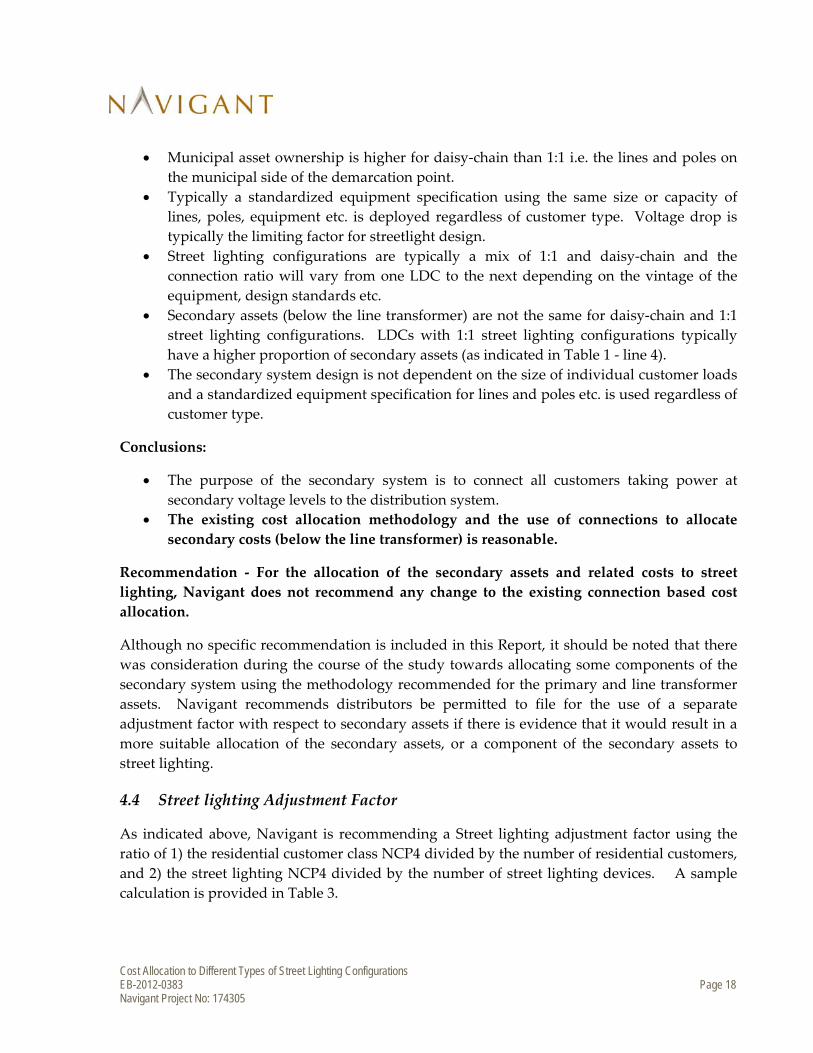
As indicated above, Navigant is recommending a Street lighting adjustment factor using the
ratio of 1) the residential customer class NCP4 divided by the number of residential customers,
and 2) the street lighting NCP4 divided by the number of street lighting devices. A sample
calculation is provided in Table 3.
Cost Allocation to Different Types of Street Lighting Configurations EB-2012-0383 Page 19 Navigant Project No: 174305
Table 3 ‐ Sample calculation of street lighting adjustment factor
The primary system street lighting adjustment factor is 10.5 in this example and is calculated
by dividing the average NCP4 for a residential customer (8.4) by the average NCP4 of a
streetlight (0.8).
The adjustment factor would be calculated for both the primary assets and line transformer
assets, and the required input data is currently available in the CAM model (NCP4 and
customers/ devices for both the residential and street lighting customer classes).
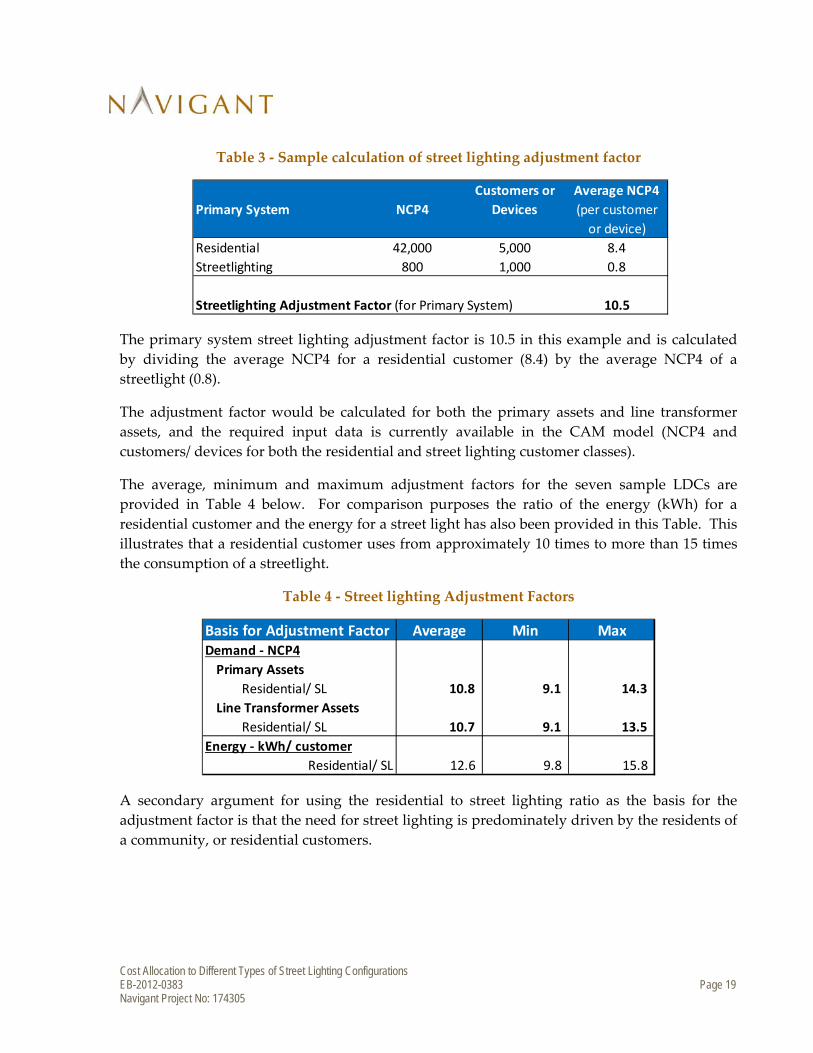
The average, minimum and maximum adjustment factors for the seven sample LDCs are
provided in Table 4 below. For comparison purposes the ratio of the energy (kWh) for a
residential customer and the energy for a street light has also been provided in this Table. This
illustrates that a residential customer uses from approximately 10 times to more than 15 times
the consumption of a streetlight.
Table 4 ‐ Street lighting Adjustment Factors
A secondary argument for using the residential to street lighting ratio as the basis for the
adjustment factor is that the need for street lighting is predominately driven by the residents of
a community, or residential customers.
Customers or Average NCP4
Primary System NCP4 Devices (per customer
or device)
Residential 42,000 5,000 8.4
Streetlighting 800 1,000 0.8
Streetlighting Adjustment Factor (for Primary System) 10.5
Basis for Adjustment Factor Average Min MaxDemand ‐ NCP4
Primary Assets
Residential/ SL 10.8 9.1 14.3
Line Transformer Assets
Residential/ SL 10.7 9.1 13.5
Energy ‐ kWh/ customer
Residential/ SL 12.6 9.8 15.8
Cost Allocation to Different Types of Street Lighting Configurations EB-2012-0383 Page 20 Navigant Project No: 174305
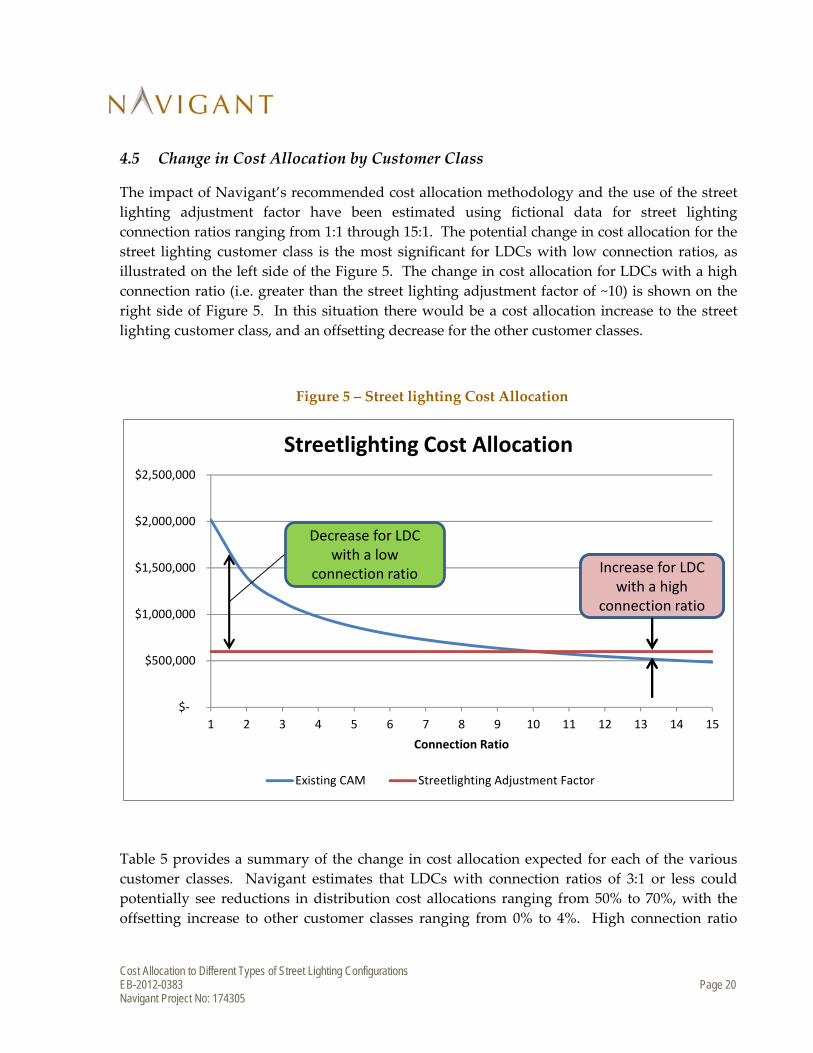
4.5 Change in Cost Allocation by Customer Class
The impact of Navigant’s recommended cost allocation methodology and the use of the street
lighting adjustment factor have been estimated using fictional data for street lighting
connection ratios ranging from 1:1 through 15:1. The potential change in cost allocation for the
street lighting customer class is the most significant for LDCs with low connection ratios, as
illustrated on the left side of the Figure 5. The change in cost allocation for LDCs with a high
connection ratio (i.e. greater than the street lighting adjustment factor of ~10) is shown on the
right side of Figure 5. In this situation there would be a cost allocation increase to the street
lighting customer class, and an offsetting decrease for the other customer classes.
Figure 5 – Street lighting Cost Allocation
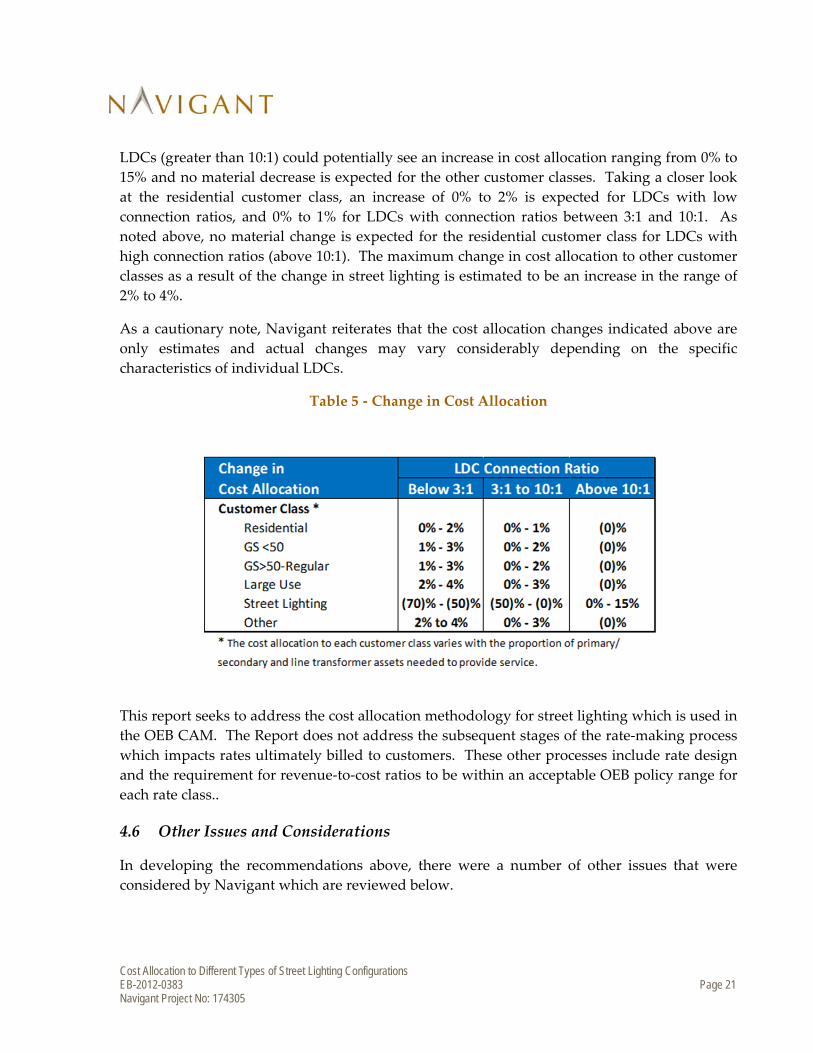
Table 5 provides a summary of the change in cost allocation expected for each of the various
customer classes. Navigant estimates that LDCs with connection ratios of 3:1 or less could
potentially see reductions in distribution cost allocations ranging from 50% to 70%, with the
offsetting increase to other customer classes ranging from 0% to 4%. High connection ratio
Decrease for LDC with a low
connection ratio Increase for LDC with a high
connection ratio
Decrease for LDC with a low
connection ratio Increase for LDC with a high
connection ratio
$‐
$500,000
$1,000,000
$1,500,000
$2,000,000
$2,500,000
1 2 3 4 5 6 7 8 9 10 11 12 13 14 15
Connection Ratio
Streetlighting Cost Allocation
Existing CAM Streetlighting Adjustment Factor
Increase for LDC with a high
connection ratio
Decrease for LDC with a low
connection ratio Increase for LDC with a high
connection ratio
Cost Allocation to Different Types of Street Lighting Configurations EB-2012-0383 Page 21 Navigant Project No: 174305
LDCs (greater than 10:1) could potentially see an increase in cost allocation ranging from 0% to
15% and no material decrease is expected for the other customer classes. Taking a closer look
at the residential customer class, an increase of 0% to 2% is expected for LDCs with low
connection ratios, and 0% to 1% for LDCs with connection ratios between 3:1 and 10:1. As
noted above, no material change is expected for the residential customer class for LDCs with
high connection ratios (above 10:1). The maximum change in cost allocation to other customer
classes as a result of the change in street lighting is estimated to be an increase in the range of
2% to 4%.
As a cautionary note, Navigant reiterates that the cost allocation changes indicated above are
only estimates and actual changes may vary considerably depending on the specific
characteristics of individual LDCs.
Table 5 - Change in Cost Allocation
This report seeks to address the cost allocation methodology for street lighting which is used in
the OEB CAM. The Report does not address the subsequent stages of the rate‐making process
which impacts rates ultimately billed to customers. These other processes include rate design
and the requirement for revenue‐to‐cost ratios to be within an acceptable OEB policy range for
each rate class..
4.6 Other Issues and Considerations
In developing the recommendations above, there were a number of other issues that were
considered by Navigant which are reviewed below.
Cost Allocation to Different Types of Street Lighting Configurations EB-2012-0383 Page 22 Navigant Project No: 174305
The first consideration is that the disparity between the two system configurations could create
an economic incentive for municipalities (who currently own street lighting assets that are
configured as 1:1) to invest in new infrastructure and convert to a daisy‐chain configuration in
order to attract a lower level of allocated costs. Stated another way, the cost distortion between
the various configurations could create a perverse economic incentive, that in Navigant’s view
does not appear to result in a rational use of capital. The street lighting adjustment factor
would have a considerable influence in addressing this potential issue.
The second consideration is that the recommended solution is pragmatic and fits within the
confines of the existing cost allocation methodology and CAM model, but also addresses the
street lighting cost distortion. All the data required for the street lighting adjustment factor
calculation is available and is supplied as part of the existing inputs to the CAM model. It
should also be noted that that the LDCs interviewed typically estimated the number of street
lighting connections as accurate data does not exist. The recommended approach reduces the
importance and use of the number of street lighting connections which would only be used for
the allocation of the secondary assets and related costs, if the recommendations are adopted.
Navigant believes that the proposed recommendations effectively address much of the cost
allocation disparity between 1:1 and daisy‐chain street lighting configurations, and on balance
is a significant improvement relative to the existing cost allocation methodology. The
proposed recommendations are pragmatic and provide a timely solution that fits within the
structure of the existing cost allocation methodology and can easily be incorporated into the
existing CAM model.
If these recommendations are accepted the CAM model will need to be updated.
4.7 Summary
Navigant recommends that the allocation of the primary and line transformer assets and
related costs to street lighting be calculated using a newly devised “street lighting adjustment
factor”. The recommended street lighting adjustment factor is calculated as the ratio of 1) the
four highest monthly non‐coincident peak demands (NCP4) for the residential customer class
divided by the number of residential customers, and 2) the NCP4 for the street lighting
customer class divided by the number of streetlight devices. The resulting adjustment factor is
independent of the number of connections and would not vary with the street lighting device‐
to‐connection ratio, and would serve to eliminate much of the disparity between the 1:1 and
daisy‐chain street lighting configurations. The calculated adjustment factor would be LDC‐
specific and the required data is available in the existing CAM model.
In summary, Navigant recommends that:

Cost Allocation to Different Types of Street Lighting Configurations EB-2012-0383 Page 23 Navigant Project No: 174305
1. The allocation of the primary and line transformer assets and related costs to street
lighting be calculated using a newly devised “street lighting adjustment factor” instead
of the existing allocation that is based on number of street lighting connections.
2. The street lighting adjustment factor is calculated as the ratio of i) the four highest
monthly non‐coincident peak demands (NCP46) for the residential customer class
divided by the number of residential customers, and ii) the NCP4 for the street lighting
customer class divided by the number of streetlight devices.
3. No change for the allocation of the secondary assets and related costs, which is based
on the number of connections.
6 The Cost Allocation Model decides whether to use a 1 NCP or 4 NCP method for allocating demand costs based on
a test described in Board Directions on Cost Allocation Methodology for Electricity Distributors, EB‐2005‐0317, p.61, dated
September 29, 2006. All distributors except one had an NCP4 test result in their Cost Allocation filings.
Cost Allocation to Different Types of Street Lighting Configurations EB-2012-0383 Page 24 Navigant Project No: 174305
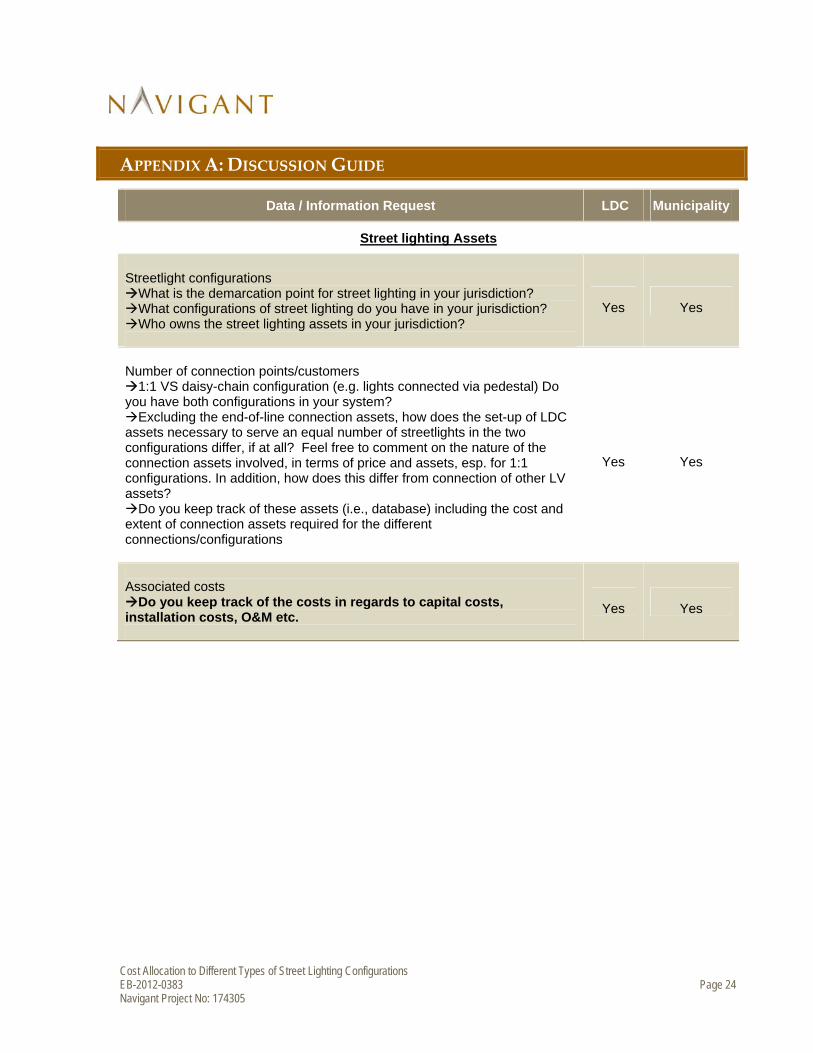
APPENDIX A: DISCUSSION GUIDE
Data / Information Request LDC Municipality
Street lighting Assets
Streetlight configurations What is the demarcation point for street lighting in your jurisdiction? What configurations of street lighting do you have in your jurisdiction? Who owns the street lighting assets in your jurisdiction?
Yes Yes
Number of connection points/customers 1:1 VS daisy-chain configuration (e.g. lights connected via pedestal) Do you have both configurations in your system? Excluding the end-of-line connection assets, how does the set-up of LDC assets necessary to serve an equal number of streetlights in the two configurations differ, if at all? Feel free to comment on the nature of the connection assets involved, in terms of price and assets, esp. for 1:1 configurations. In addition, how does this differ from connection of other LV assets? Do you keep track of these assets (i.e., database) including the cost and extent of connection assets required for the different connections/configurations
Yes Yes
Associated costs Do you keep track of the costs in regards to capital costs, installation costs, O&M etc.
Yes Yes
Cost Allocation to Different Types of Street Lighting Configurations EB-2012-0383 Page 25 Navigant Project No: 174305
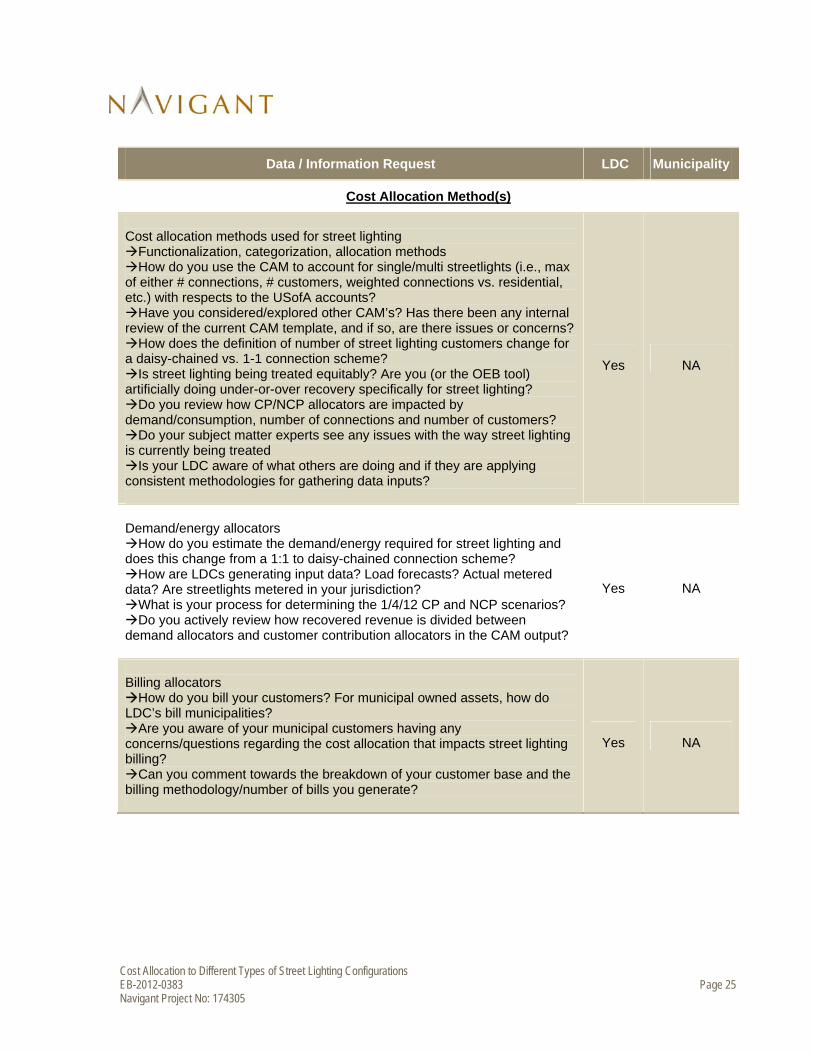
Data / Information Request LDC Municipality
Cost Allocation Method(s)
Cost allocation methods used for street lighting Functionalization, categorization, allocation methods How do you use the CAM to account for single/multi streetlights (i.e., max of either # connections, # customers, weighted connections vs. residential, etc.) with respects to the USofA accounts? Have you considered/explored other CAM’s? Has there been any internal review of the current CAM template, and if so, are there issues or concerns? How does the definition of number of street lighting customers change for a daisy-chained vs. 1-1 connection scheme? Is street lighting being treated equitably? Are you (or the OEB tool) artificially doing under-or-over recovery specifically for street lighting? Do you review how CP/NCP allocators are impacted by demand/consumption, number of connections and number of customers? Do your subject matter experts see any issues with the way street lighting is currently being treated Is your LDC aware of what others are doing and if they are applying consistent methodologies for gathering data inputs?
Yes NA
Demand/energy allocators How do you estimate the demand/energy required for street lighting and does this change from a 1:1 to daisy-chained connection scheme? How are LDCs generating input data? Load forecasts? Actual metered data? Are streetlights metered in your jurisdiction? What is your process for determining the 1/4/12 CP and NCP scenarios? Do you actively review how recovered revenue is divided between demand allocators and customer contribution allocators in the CAM output?
Yes NA
Billing allocators How do you bill your customers? For municipal owned assets, how do LDC’s bill municipalities? Are you aware of your municipal customers having any concerns/questions regarding the cost allocation that impacts street lighting billing? Can you comment towards the breakdown of your customer base and the billing methodology/number of bills you generate?
Yes NA

Cost Allocation to Different Types of Street Lighting Configurations EB-2012-0383 Page 26 Navigant Project No: 174305
Data / Information Request LDC Municipality
Adoption of New Technologies / Intangibles
Adoption of new street lighting technologies Have there been discussions/studies into the adoption of new street lighting technologies? (i.e., LED’s) Were these discussions primarily driven by the LDC or the municipality? How does the current policy framework and cost allocation model affect your decisions regarding the connection of new street lighting assets? How does the current policy framework and cost allocation model affect your decisions regarding upgrades to existing street lighting assets? Does the distributor typically allow for the installation of whatever system you choose (be it 1:1 or common connection), or are you restricted in this choice? How has the uptake of smart metering impacted the estimation of demand/energy forecasts for street lighting?
Yes Yes
Impact of technology on consumption and consumption patterns How will new technology affect load forecasts? Has the roll-out of smart meters affected the way street lighting is being treated with regards to cost allocations Is there a trend of moving towards a specific configuration? Does your municipality quantify and assess the non-distribution cost savings from replacement and installation
Yes Yes
Common-Connection vs. One-Device-Per-Connection
Analyses conducted on number of common-connections VS one-device-per-connection connections
Yes Yes
Perceived pros and cons
Yes Yes
Cost Allocation to Different Types of Street Lighting Configurations EB-2012-0383 Page 27 Navigant Project No: 174305
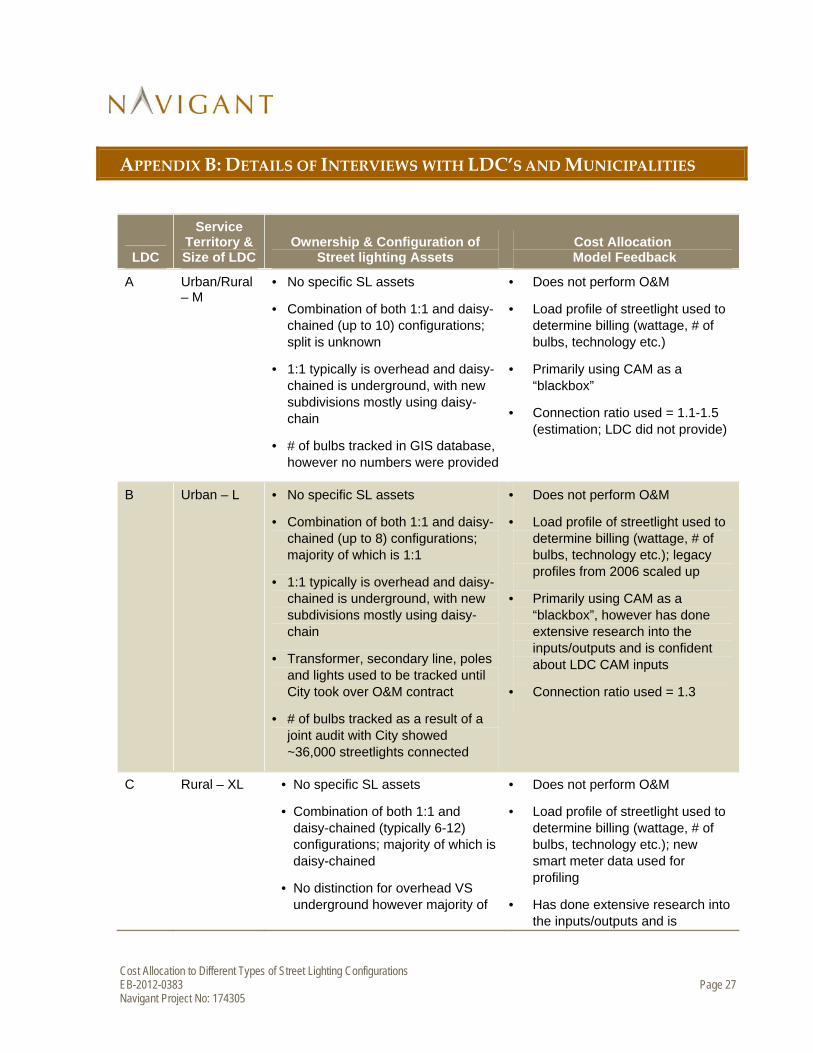
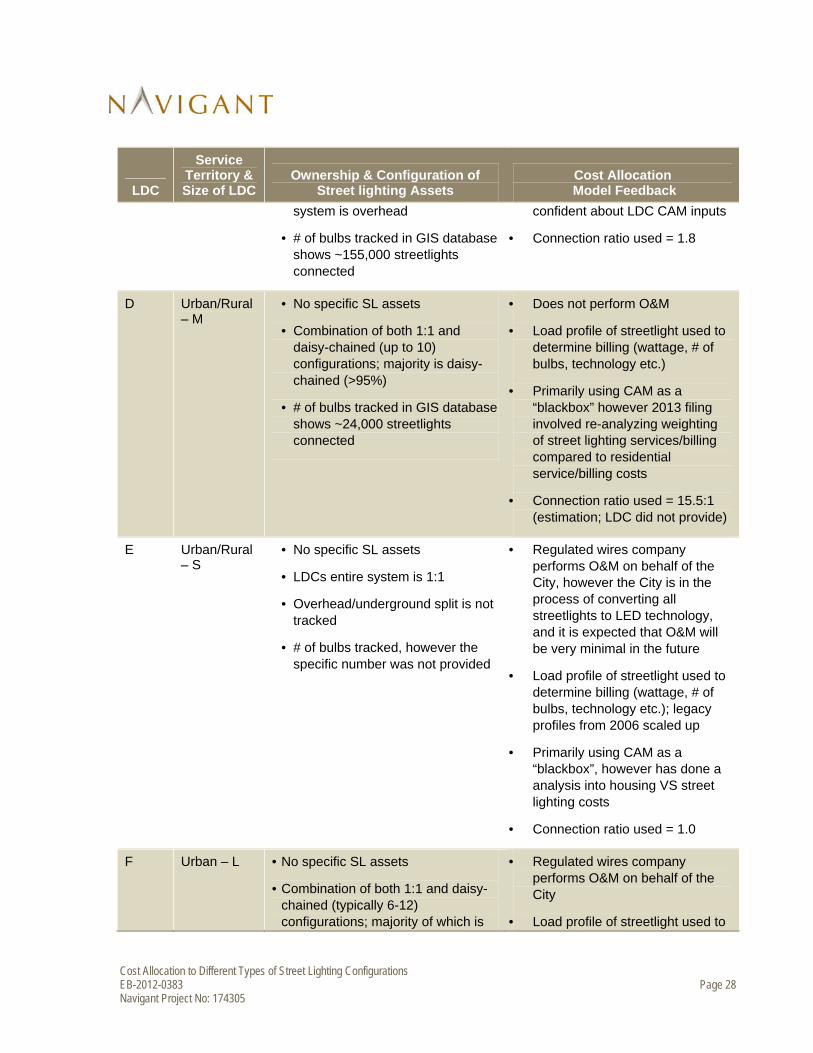
APPENDIX B: DETAILS OF INTERVIEWS WITH LDC’S AND MUNICIPALITIES
LDC
Service Territory & Size of LDC
Ownership & Configuration of Street lighting Assets
Cost Allocation Model Feedback
A Urban/Rural – M
• No specific SL assets
• Combination of both 1:1 and daisy-chained (up to 10) configurations; split is unknown
• 1:1 typically is overhead and daisy-chained is underground, with new subdivisions mostly using daisy-chain
• # of bulbs tracked in GIS database, however no numbers were provided
• Does not perform O&M
• Load profile of streetlight used to determine billing (wattage, # of bulbs, technology etc.)
• Primarily using CAM as a “blackbox”
• Connection ratio used = 1.1-1.5 (estimation; LDC did not provide)
B Urban – L • No specific SL assets
• Combination of both 1:1 and daisy-chained (up to 8) configurations; majority of which is 1:1
• 1:1 typically is overhead and daisy-chained is underground, with new subdivisions mostly using daisy-chain
• Transformer, secondary line, poles and lights used to be tracked until City took over O&M contract
• # of bulbs tracked as a result of a joint audit with City showed ~36,000 streetlights connected
• Does not perform O&M
• Load profile of streetlight used to determine billing (wattage, # of bulbs, technology etc.); legacy profiles from 2006 scaled up
• Primarily using CAM as a “blackbox”, however has done extensive research into the inputs/outputs and is confident about LDC CAM inputs
• Connection ratio used = 1.3
C Rural – XL • No specific SL assets
• Combination of both 1:1 and daisy-chained (typically 6-12) configurations; majority of which is daisy-chained
• No distinction for overhead VS underground however majority of
• Does not perform O&M
• Load profile of streetlight used to determine billing (wattage, # of bulbs, technology etc.); new smart meter data used for profiling
• Has done extensive research into the inputs/outputs and is
Cost Allocation to Different Types of Street Lighting Configurations EB-2012-0383 Page 28 Navigant Project No: 174305
LDC
Service Territory & Size of LDC
Ownership & Configuration of Street lighting Assets
Cost Allocation Model Feedback
system is overhead
• # of bulbs tracked in GIS database shows ~155,000 streetlights connected
confident about LDC CAM inputs
• Connection ratio used = 1.8
D Urban/Rural – M
• No specific SL assets
• Combination of both 1:1 and daisy-chained (up to 10) configurations; majority is daisy-chained (>95%)
• # of bulbs tracked in GIS database shows ~24,000 streetlights connected
• Does not perform O&M
• Load profile of streetlight used to determine billing (wattage, # of bulbs, technology etc.)
• Primarily using CAM as a “blackbox” however 2013 filing involved re-analyzing weighting of street lighting services/billing compared to residential service/billing costs
• Connection ratio used = 15.5:1 (estimation; LDC did not provide)
E Urban/Rural – S
• No specific SL assets
• LDCs entire system is 1:1
• Overhead/underground split is not tracked
• # of bulbs tracked, however the specific number was not provided
• Regulated wires company performs O&M on behalf of the City, however the City is in the process of converting all streetlights to LED technology, and it is expected that O&M will be very minimal in the future
• Load profile of streetlight used to determine billing (wattage, # of bulbs, technology etc.); legacy profiles from 2006 scaled up
• Primarily using CAM as a “blackbox”, however has done a analysis into housing VS street lighting costs
• Connection ratio used = 1.0
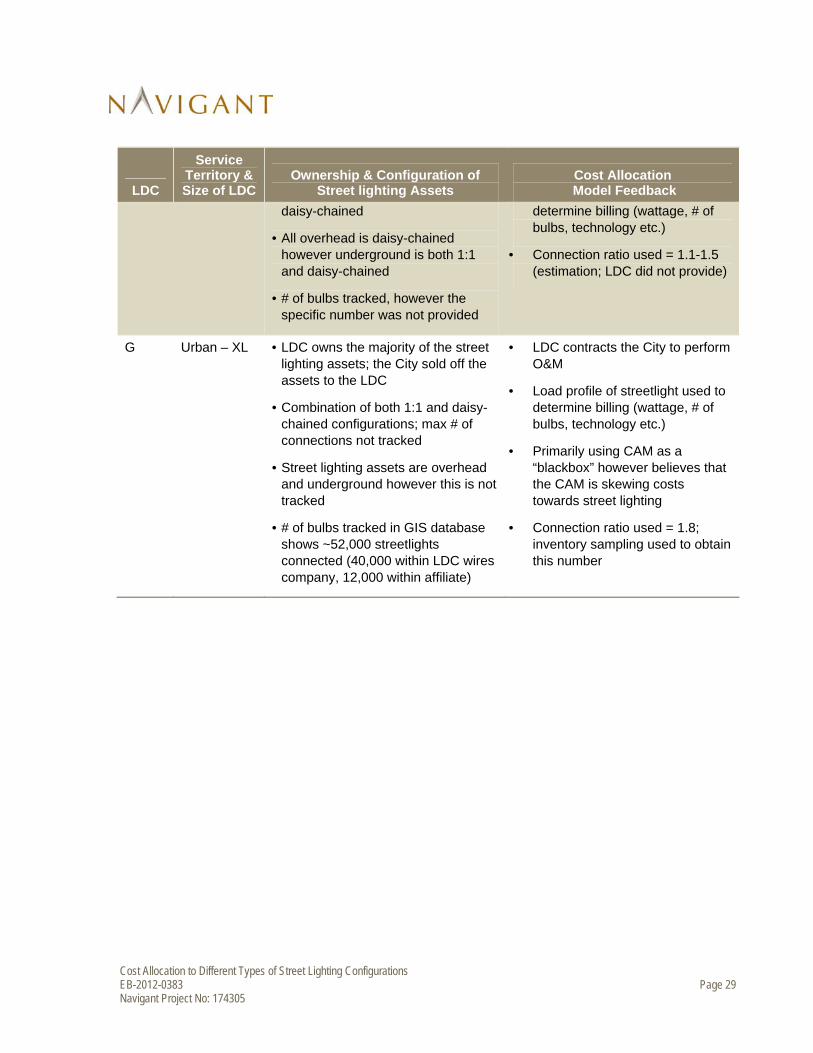
F Urban – L • No specific SL assets
• Combination of both 1:1 and daisy-chained (typically 6-12) configurations; majority of which is
• Regulated wires company performs O&M on behalf of the City
• Load profile of streetlight used to
Cost Allocation to Different Types of Street Lighting Configurations EB-2012-0383 Page 29 Navigant Project No: 174305
LDC
Service Territory & Size of LDC
Ownership & Configuration of Street lighting Assets
Cost Allocation Model Feedback
daisy-chained
• All overhead is daisy-chained however underground is both 1:1 and daisy-chained
• # of bulbs tracked, however the specific number was not provided
determine billing (wattage, # of bulbs, technology etc.)
• Connection ratio used = 1.1-1.5 (estimation; LDC did not provide)
G Urban – XL • LDC owns the majority of the street lighting assets; the City sold off the assets to the LDC
• Combination of both 1:1 and daisy-chained configurations; max # of connections not tracked
• Street lighting assets are overhead and underground however this is not tracked
• # of bulbs tracked in GIS database shows ~52,000 streetlights connected (40,000 within LDC wires company, 12,000 within affiliate)
• LDC contracts the City to perform O&M
• Load profile of streetlight used to determine billing (wattage, # of bulbs, technology etc.)
• Primarily using CAM as a “blackbox” however believes that the CAM is skewing costs towards street lighting
• Connection ratio used = 1.8; inventory sampling used to obtain this number