Embed Size (px)
DESCRIPTION
ZICA Manual
Citation preview
1
CHAPTER 1
THE SCOPE OF COST ACCOUNTING
Introduction
Welcome to Paper T2 of the ZICA Accountancy program syllabus. This and the
following two chapters will give an introduction to cost accounting. This chapter
provides definitions and the link between cost accounting, management accounting and
financial accounting. The chapter will go further to explain various terminologies, which
form the basis for the cost accounting framework that will be used throughout the course.
Contents
1. The need for Cost Accounting systems.
2. Definition of Cost Accounting.
3. Definition of Management Accounting.
4. Definition of Financial Accounting.
Learning outcomes
After studying this chapter you should be able to:
Define Cost Accounting.
Understand the range of information provided by the cost accounting system.
Compare and contrast financial and cost and management accounting.
Explain the nature of responsibility accounting and use of cost centres, profit
centres and investment centres.
2
1.0 COST AND MANAGEMENT ACCOUNTING
Managers need detailed information about the working of the business to
enable them plan, control and make decisions. The cost and management
accounting system provide financial information regarding the financial
aspects of business performance needed by management.
1.1 Management accounting
Management accounting is the application of the principles of accounting
and financial management to create, protect, preserve and increase value
so as to deliver that value to the stakeholders of profit and not for profit
enterprises both public and private.
1.2 Cost accounting
Cost accounting is the establishment of budgets, standard costs and actual
costs of operations, processes, activities or products and the analysis of
variances profitability or social use of funds.
1.21 Cost accounting and management accounting are terms which are used
interchangeably. However, this is not entirely right.
1.22 Cost accounting is part of management accounting. Cost accounting
provides a bank of data for the management accountant to use. Cost
accounting aims to establish the following:
a) the cost of goods produced or services provided;
b) the cost of a department or work section;
c) what revenues have been;
d) the profitability of a product, service or department or the
organization in total;
e) selling prices;
f) the value of stocks of goods;
g) future costs of goods and services; and
h) comparison of actual and budgeted costs
3
2.0 COST ACCOUNTING SYSTEM
A cost accounting system is a system used by an organization to gather,
store and analyse data about costs. The purpose of a cost accounting
system is to provide management information about costs and profits.
A cost accounting system is often the basis for a management accounting
system. The term cost accounting and management accounting are often
used to mean the same thing, although strictly there are differences.
3.0 FINANCIAL ACCOUNTING AND COST AND MANAGEMENT
ACCOUNTING
3.1 Financial accounting is the classification and recording of the monetary
transaction of an entity in accordance with established concepts,
principles, accounting standards and legal requirements and their
presentation by means of profit and loss accounts, balance sheet and cash
flow statements, during and at the end of an accounting period.
3.2 Many businesses have a financial accounting system with a nominal
ledger, sales ledger and purchases ledger and books of prime entry for
recording transaction that have occurred during a given period.
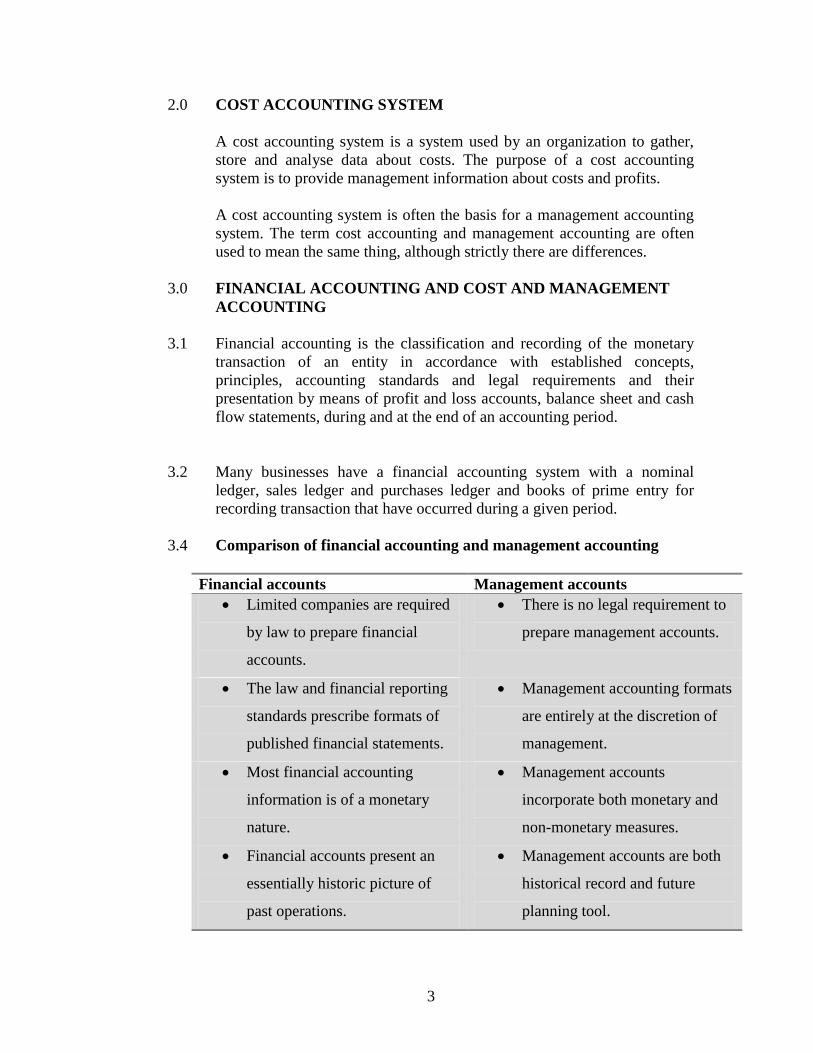
3.4 Comparison of financial accounting and management accounting
Financial accounts Management accounts
Limited companies are required
by law to prepare financial
accounts.
There is no legal requirement to
prepare management accounts.
The law and financial reporting
standards prescribe formats of
published financial statements.
Management accounting formats
are entirely at the discretion of
management.
Most financial accounting
information is of a monetary
nature.
Management accounts
incorporate both monetary and
non-monetary measures.
Financial accounts present an
essentially historic picture of
past operations.
Management accounts are both
historical record and future
planning tool.
4
4.0 INTERNAL REPORTING STRUCTURES
When costs are recorded, analysed and reported, it is important they are
reported to the managers or departments responsible for the spending. In
other words, the reporting of cost information should ideally be based on a
system of responsibility accounting and responsibility centres.
4.1 Responsibility accounting
A system of providing financial information to management where the
structure of the reporting system is based on identifying individual parts of
a business which are a responsibility of a single manager.
4.2 Responsibility centres
A responsibility centre is an individual part of a business whose manager
has personal responsibility for its performance.
Many businesses are structured into a hierarchy of responsibility centres.
These might be cost centres, revenue centres, profit centres and investment
centres.
At the lowest level of the hierarchy is the cost centre and at the highest is
the investment centre.
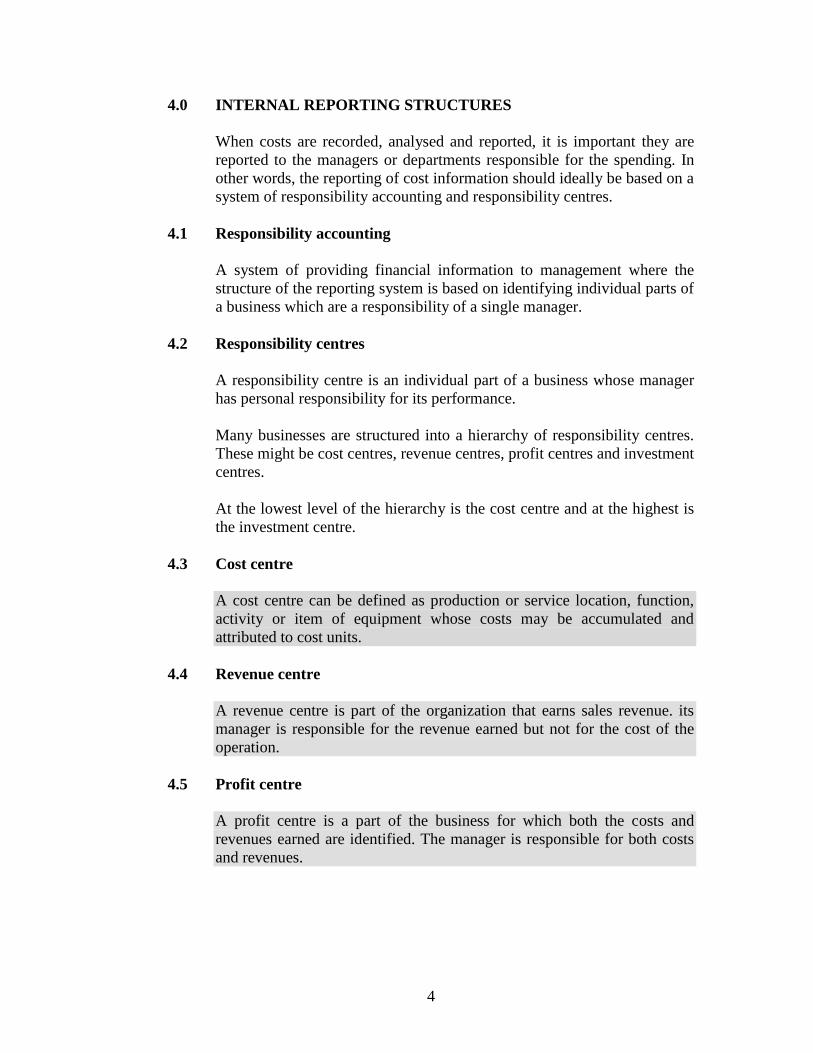
4.3 Cost centre
A cost centre can be defined as production or service location, function,
activity or item of equipment whose costs may be accumulated and
attributed to cost units.
4.4 Revenue centre
A revenue centre is part of the organization that earns sales revenue. its
manager is responsible for the revenue earned but not for the cost of the
operation.
4.5 Profit centre
A profit centre is a part of the business for which both the costs and
revenues earned are identified. The manager is responsible for both costs
and revenues.
5
4.6 Investment centre
An investment centre is a profit centre with additional responsibilities for
capital employed and possibly investment decisions. Managers of
investment centres are responsible not just for decisions affecting costs
and revenues but also investment decisions.
5.0 ALLOCATION OF COSTS
Costs are incurred in business on the following:
Direct materials.
Direct labour.
Direct expenses.
Production overheads.
Administrative overheads.
General overheads.
When costs are incurred, they are generally allocated to costs centres. Cost
centres are simply collection points for costs for further analysis.
5.1 Cost units
Once costs have been traced to cost centres, they can further be analysed
in order to establish cost per unit.
A cost unit is a unit of production or unity of activity in relation to which
cost is measured. The cost unit is a basic control unit for costing purposes.
5.2 Cost units are measured for several reasons:
To establish how much it has cost to produce an item or perform
an activity.
To measure profit or loss on an item.
To value closing stocks.
To compare costs with budgeted costs.
Examples of cost units
Student in a college
Barrel in the brewing industry
Room in a hotel
6
5.3 Cost object
A cost object is any activity for which a separate measurement of costs is
desired.
If the users of management accounting want to know the cost of
something this something is known as cost object. Examples of cost object
include:
The cost of a product
The cost of a service
The cost of operating a department
6.0 SOURCES OF DATA FOR A COST AND MANAGEMENT
ACCOUNTING SYSTEM
6.1 THE ROLE OF ACCOUNTING TECHNICIAN
As part of the cost accounting team, the accounting technician is likely to
be included in gathering and processing data to measure the costs of an
organisation’s activities, products and services.
6.2 For example, in a manufacturing business, the accounting technician could
be involved in measuring and analysing:
The cost of raw materials used in manufacturing
The value of stocks of unused raw materials
The cost of labour used in production
The costs of other expenses incurred in production
Overhead costs for each product
Total cost for each product made by the business
The profitability of each product.
6.3 Measuring costs and revenues is an important step in providing
management with information to assist them with planning, control and
decision making.
7
CHAPTER SUMMARY
Cost centres are collection pools for costs before they are further analysed into
cost unit.
A cost unit is a unit of product or service to which costs can be related.
A cost object is any activity for which a separate measure of cost is desired.
A responsibility centre is a department or organisational function whose
performance is the direct responsibility of a specific manager.
Profit centres are responsibility centres that are responsible for both costs and
revenues.
Revenue centres are responsibility centres responsible for only revenue
generation.
An investment centre is profit centre that is also responsible for capital
investment and possibly financing.
8
SELF REVIEW QUESTIONS
SELF TEST QUESTIONS
1. Define management accounting (1.1)
2. Define cost accounting (1.2)
3. Highlight key differences between management accounting and financial
accounting (3.4)
4. Define responsibility accounting (4.1)
EXAMINATION TYPE QUESTIONS
1. Which of the following describes a cost unit?
A. Cost per unit of output
B. Direct cost
C. Unit of product
D. Production department
2. A profit center is:
A. The profit attributed to a business unit
B. A business unit whose manager is responsible for operating costs and
revenues from the activities of the unit
C. A unit of product or service for which costs and revenues are measured
D. A business unit whose manager is responsible for investment decisions
within the unit.
Check for answers at the end of the text
9
CHAPTER 2
COST CLASSIFICATION
Introduction
This chapter explains that costs can be classified in different ways according to the
purpose for which the cost information is required. Various methods of classifying costs
will now be described.
Contents
1. Total product/service costs.
2. Direct cots and indirect costs.
3. Functional costs.
4. Fixed costs and variable costs.
5. Product costs and period costs.
6. Other cost classifications.
Learning objectives
After studying this chapter you should be able to:
Outline reasons for cost classification.
Describe different methods of classifying costs.
10
1.0 CLASSIFICATION OF COSTS
1.1 Cost classification is the analysis of costs into logical groups so that they may be
summarised into meaningful information for management.
1.2.1 Management in organisations requires information concerning a variety of issues
which require different types of cost summaries. Costs are thus classified in
different ways according to the purpose for which they are to be used. The main
classifications include:
1.3
Cost by element
Direct and indirect costs
Functional costs
Fixed and variable costs
Other categories
2.0 CLASSIFICATION BY ELEMENT
The initial cost classification basis is according to the elements on which
expenditure is incurred:
Materials
Labour
Expenses
2.1 Within costs elements, costs can be further classified according to the nature of
expenditure. For example material costs may be further classified according to
whether they are raw materials, components, cleaning materials, maintenance
materials etc.
2.20 DIRECT AND INDIRECT COSTS
Each cost element namely materials, labour and expenses can be classified as
either a direct cost or indirect cost.
A direct cost is a cost that can be traced in full to the product, service or
department that is being costed.
An indirect cost or overhead is a cost that is incurred in the course of making a
product, providing a service or running a department, but which cannot be traced
directly and in full to the product or service or department.
11
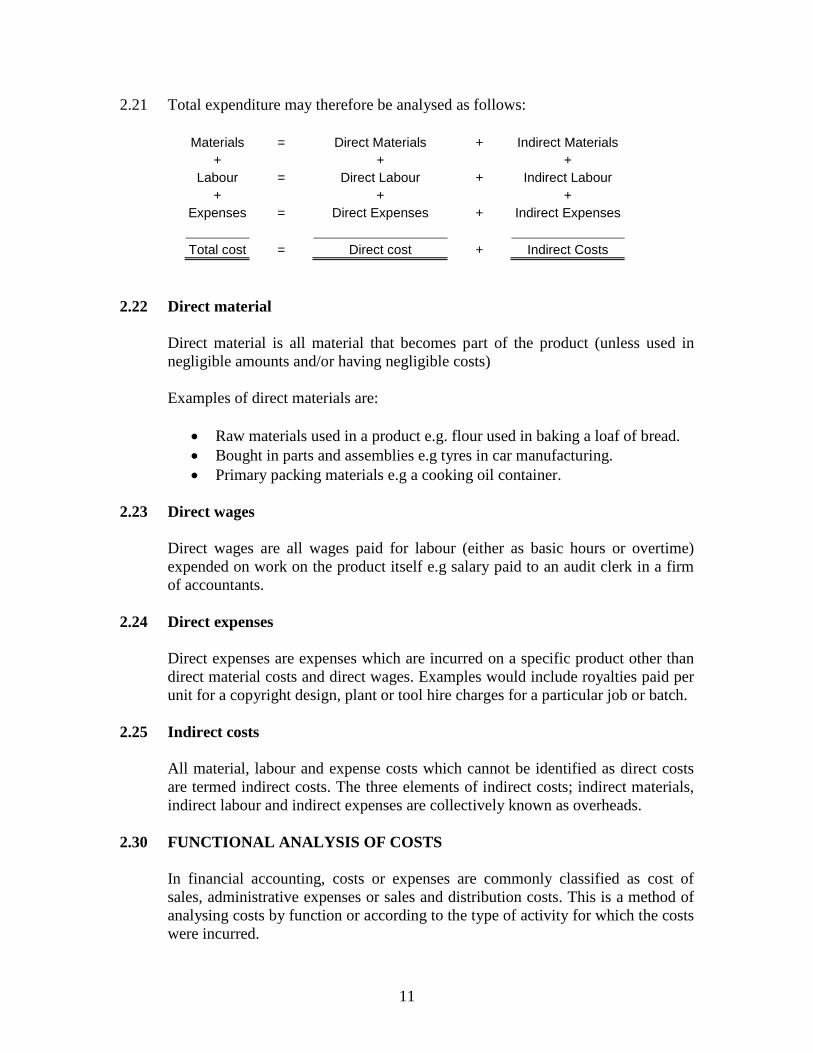
2.21 Total expenditure may therefore be analysed as follows:
Materials = Direct Materials + Indirect Materials
+ + +
Labour = Direct Labour + Indirect Labour
+ + +
Expenses = Direct Expenses + Indirect Expenses
Total cost = Direct cost + Indirect Costs
2.22 Direct material
Direct material is all material that becomes part of the product (unless used in
negligible amounts and/or having negligible costs)
Examples of direct materials are:
Raw materials used in a product e.g. flour used in baking a loaf of bread.
Bought in parts and assemblies e.g tyres in car manufacturing.
Primary packing materials e.g a cooking oil container.
2.23 Direct wages
Direct wages are all wages paid for labour (either as basic hours or overtime)
expended on work on the product itself e.g salary paid to an audit clerk in a firm
of accountants.
2.24 Direct expenses
Direct expenses are expenses which are incurred on a specific product other than
direct material costs and direct wages. Examples would include royalties paid per
unit for a copyright design, plant or tool hire charges for a particular job or batch.
2.25 Indirect costs
All material, labour and expense costs which cannot be identified as direct costs
are termed indirect costs. The three elements of indirect costs; indirect materials,
indirect labour and indirect expenses are collectively known as overheads.
2.30 FUNCTIONAL ANALYSIS OF COSTS
In financial accounting, costs or expenses are commonly classified as cost of
sales, administrative expenses or sales and distribution costs. This is a method of
analysing costs by function or according to the type of activity for which the costs
were incurred.

12
In cost accounting costs are often analysed by function and categories of
functional analysis commonly used are:
Production costs.
Administration costs.
Selling costs.
Distribution costs.
Research and development costs.
Financing costs.
2.4 FIXED AND VARIABLE COSTS
A different way of analysing and classifying costs is into fixed and variable costs.
A fixed cost is a cost which is incurred for a particular period of time and which
within a certain activity levels is unaffected by changes in the levels of activity
e.g rent paid by a business.
A variable cost is a cost which tends to vary with the level of activity. Eg
materials used in manufacturing.
2.5 PRODUCT COST AND PERIOD COSTS
Product costs are costs identified with a finished product. Such costs are initially
identified as part of the value of stock. They become expenses only when the
stock is sold.
Period costs are costs that are deducted as expenses during the current period
without ever being included in the value of stock held.
2.6 OTHER COST CLASSIFICATIONS
Avoidable costs
Avoidable costs are specific costs of an activity or business which would be
avoided if the activity or business did not exist.
Unavoidable costs
Unavoidable costs are costs which would be incurred whether or not an activity or
sector existed.
13
Controllable cost
A controllable costs is a cost which can be influenced by management decisions
and actions
An uncontrollable costs
An uncontrollable costs is any cost which cannot be affected by management
within given time span
Discretionary costs
Discretionary costs are costs incurred at the discretion of a manager and examples
of discretionary costs include advertising, research and development and training.
CHAPTER SUMMARY
Cost classification is the analysis of costs into logical groups so that they may be
summarised into meaningful information for management.
The main classifications include:
o Cost by element
o Direct and indirect costs
o Functional costs
o Fixed and variable costs
o Other categories Such as ; controllable/uncontrollable and
avoidable/unavoidable
14
SELF REVIEW QUESTIONS
SELF TEST QUESTIONS
1. What is cost classification (1.1)
2. Mention various cost classification categories (1.3)
3. Define direct cost (2.2)
4. Distinguish fixed cost from variable cost (2.4)
EXAMINATION TYPE QUESTIONS
1. DIRECT OR INDIRECT COST
Classify the following expenses as direct or indirect
a) Factory rental.
b) Insurance of machinery used for one product only.
c) Warehouse rental.
d) Insurance of office buildings.
e) Costs of canteen for employees.
f) Petrol for delivery vehicles.
2. COST CLASSIFICATION
Distinguish between and provide information to illustrate:
a) Avoidable and unavoidable costs
b) Cost centres and cost units
Check for answers at the end of the text
15
CHAPTER 3
COST BEHAVIOUR
Introduction
In the last chapter, we looked at various ways of classifying costs. In particular, we
covered the classification of costs into those that vary directly with changes in activity
levels (variable costs) and those that do not change (fixed costs). This chapter examines
further this two way split of cost behaviour and explains methods of splitting semi-
variable costs into fixed and variable components. This information is important for
management, who will use it in setting budgets, carrying out variance analysis and
decision making.
Contents
1. Introduction to cost behaviour.
2. Cost behavior pattern.
3. Determining the fixed and variable elements of semi-variable costs.
Learning objectives
After studying this chapter you should be able to:
Explain the importance of cost behavior in relation to decision-making.
Explain the nature of fixed, variable and semi variable costs
Describe other cost behavior patterns for individual items of cost.
Identify, describe and illustrate graphically different types of cost behavior
Provide examples of semi variable costs
Analyse semi-variable costs into their fixed and variable cost elements using the
high-low method.
16
1.0 DEFINITION AND APPLICATION OF COST BEHAVIOUR CONCEPT
Cost behaviour is the way in which costs are affected by the changes in the
volume of output. Management decisions are often based on how costs and
revenues vary at different activity levels.
1.1 Cost behaviour and levels of activity
Although there are many factors which may influence costs, the major influence
is the volume of output or the level of activity. The term level of activity may
refer to one of the following:
Number of units produced.
Value of items sold.
Number of items sold.
Number of invoices issued.
Number of units of electricity consumed.
1.2 Application of cost behavior information
Management may use knowledge of cost behaviour pattern in the following
management tasks:
Controlling costs.
Preparing budgets or forecasts.
Deciding on output levels.
Adjusting selling prices.
Deciding whether to accept or reject a contract.
Making decision to Subcontract.
1.3 Cost behavior principles
The basic principle of cost behaviour is that as the level of activity rises, costs will
usually rise. It will cost more to produce 2000 units of output than it will cost to
produce 1000 units.
However not all items of cost will incur higher costs as the output level rises. This
creates a problem for the management accountants who have to ascertain how
each item of cost varies with increases or indeed decrease in activity levels.
17
2.0 COST BEHAVIOUR PATTERNS
Cost behaviour analysis is concerned with how costs change with level of activity
and by how much. Individual items of cost can be classified according to their
cost behaviour. There are many cost behavior patterns but many costs can be
classified according to behaviour as:
Fixed costs.
Variable costs.
Semi-variable costs.
Step costs.
2.1 FIXED COSTS
A fixed cost is a cost which tends to be unaffected in total by increases or
decreases in the volume of output.
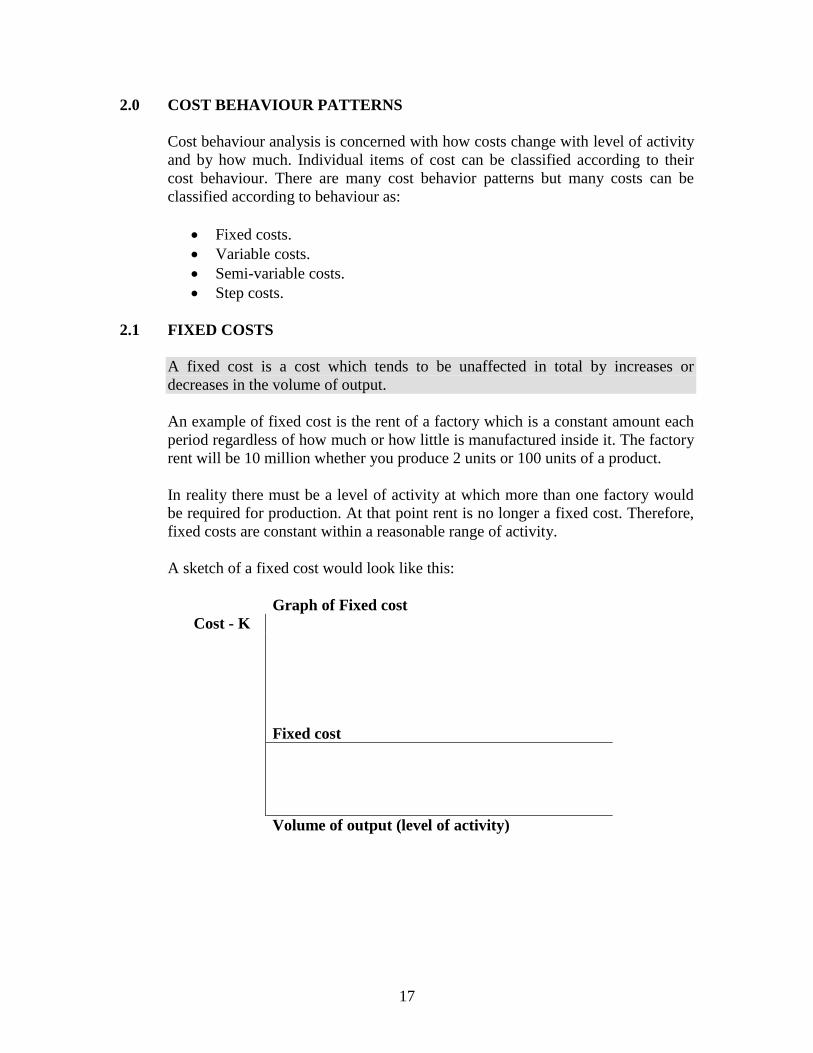
An example of fixed cost is the rent of a factory which is a constant amount each
period regardless of how much or how little is manufactured inside it. The factory
rent will be 10 million whether you produce 2 units or 100 units of a product.
In reality there must be a level of activity at which more than one factory would
be required for production. At that point rent is no longer a fixed cost. Therefore,
fixed costs are constant within a reasonable range of activity.
A sketch of a fixed cost would look like this:
Graph of Fixed cost
Cost - K
Fixed cost
Volume of output (level of activity)
18
Examples of fixed costs would be:
The salary of a managing director per year.
The rent of a single factory building per year or month.
Straight-line depreciation of a single machine.
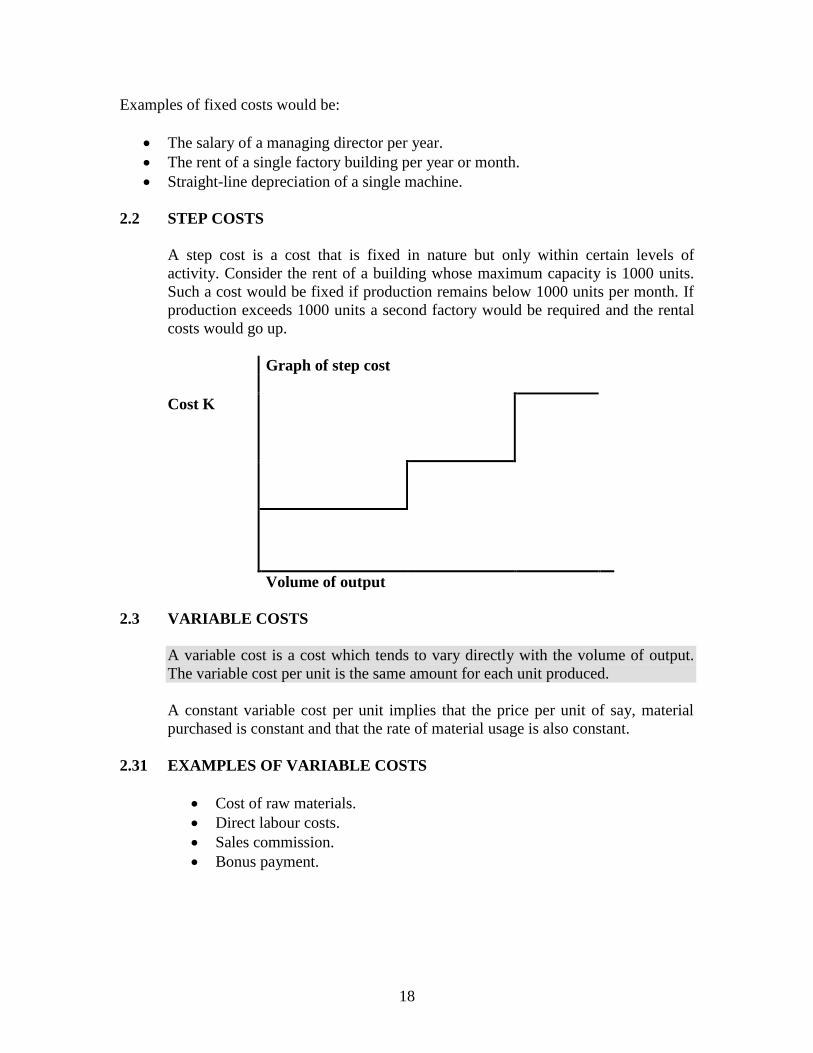
2.2 STEP COSTS
A step cost is a cost that is fixed in nature but only within certain levels of
activity. Consider the rent of a building whose maximum capacity is 1000 units.
Such a cost would be fixed if production remains below 1000 units per month. If
production exceeds 1000 units a second factory would be required and the rental
costs would go up.
Graph of step cost
Cost K
Volume of output
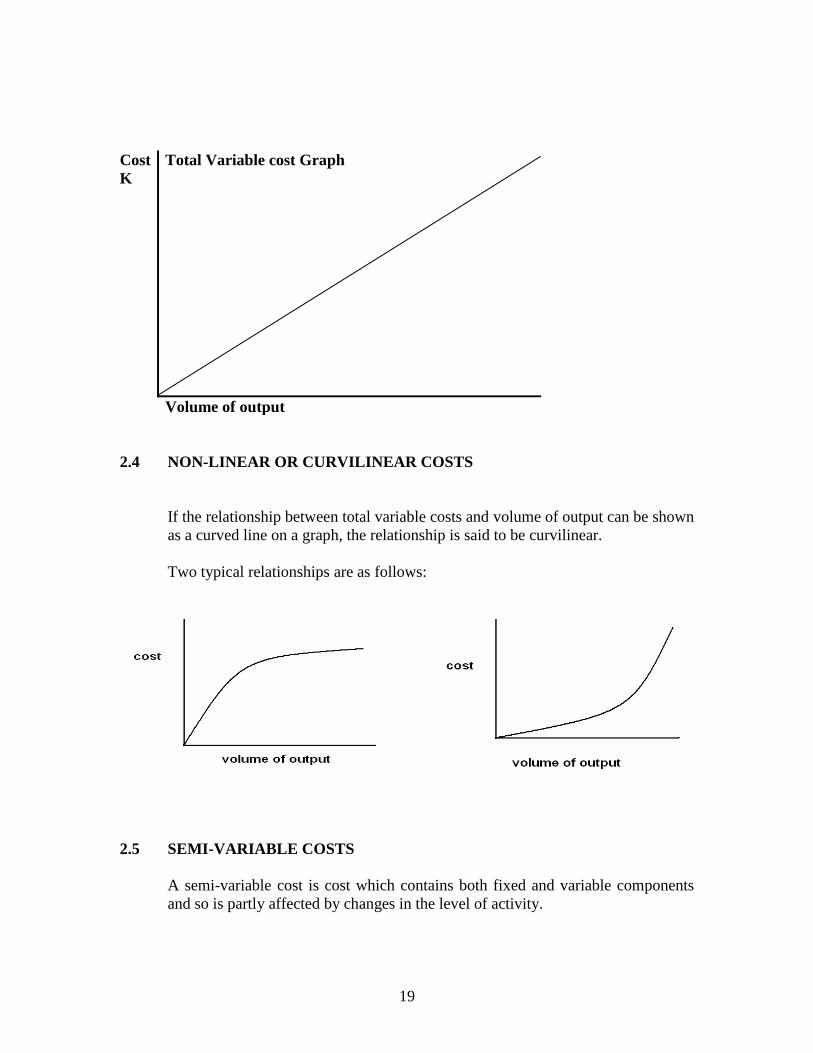
2.3 VARIABLE COSTS
A variable cost is a cost which tends to vary directly with the volume of output.
The variable cost per unit is the same amount for each unit produced.
A constant variable cost per unit implies that the price per unit of say, material
purchased is constant and that the rate of material usage is also constant.
2.31 EXAMPLES OF VARIABLE COSTS
Cost of raw materials.
Direct labour costs.
Sales commission.
Bonus payment.
19
Cost
K
Total Variable cost Graph
Volume of output
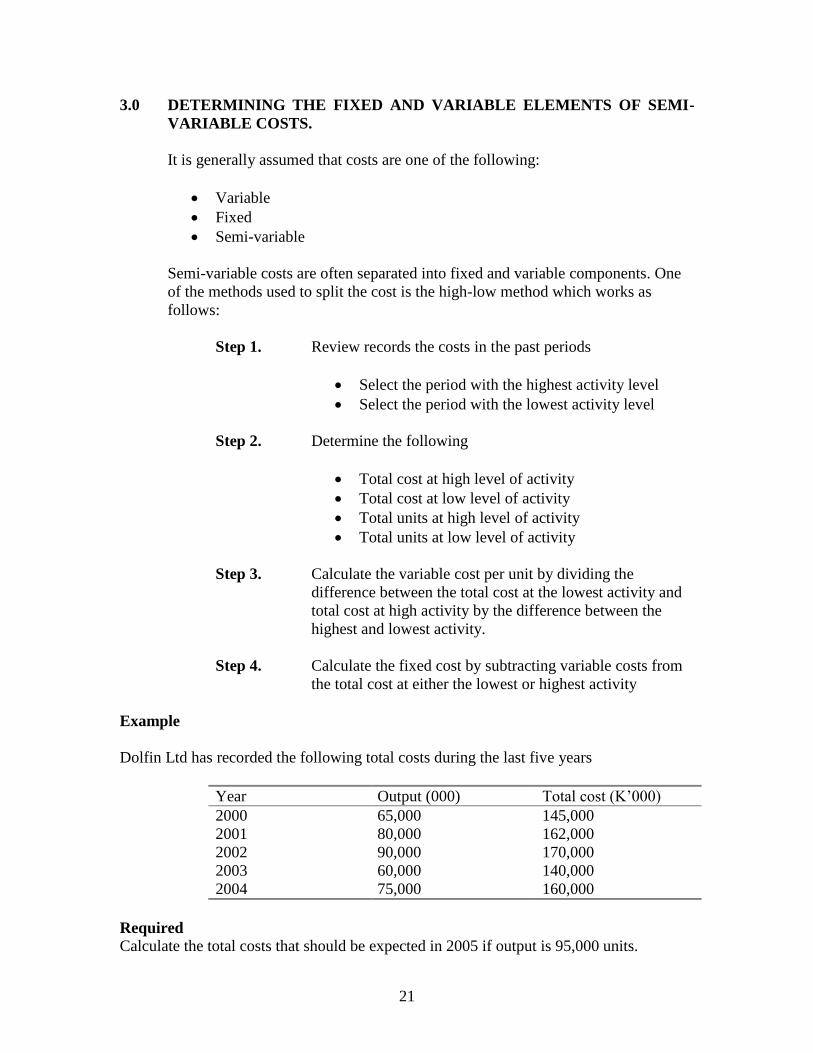
2.4 NON-LINEAR OR CURVILINEAR COSTS
If the relationship between total variable costs and volume of output can be shown
as a curved line on a graph, the relationship is said to be curvilinear.
Two typical relationships are as follows:
2.5 SEMI-VARIABLE COSTS
A semi-variable cost is cost which contains both fixed and variable components
and so is partly affected by changes in the level of activity.
20
Examples of semi-variable costs include:
Electricity bills
Salesman’s salary
Costs of running a car
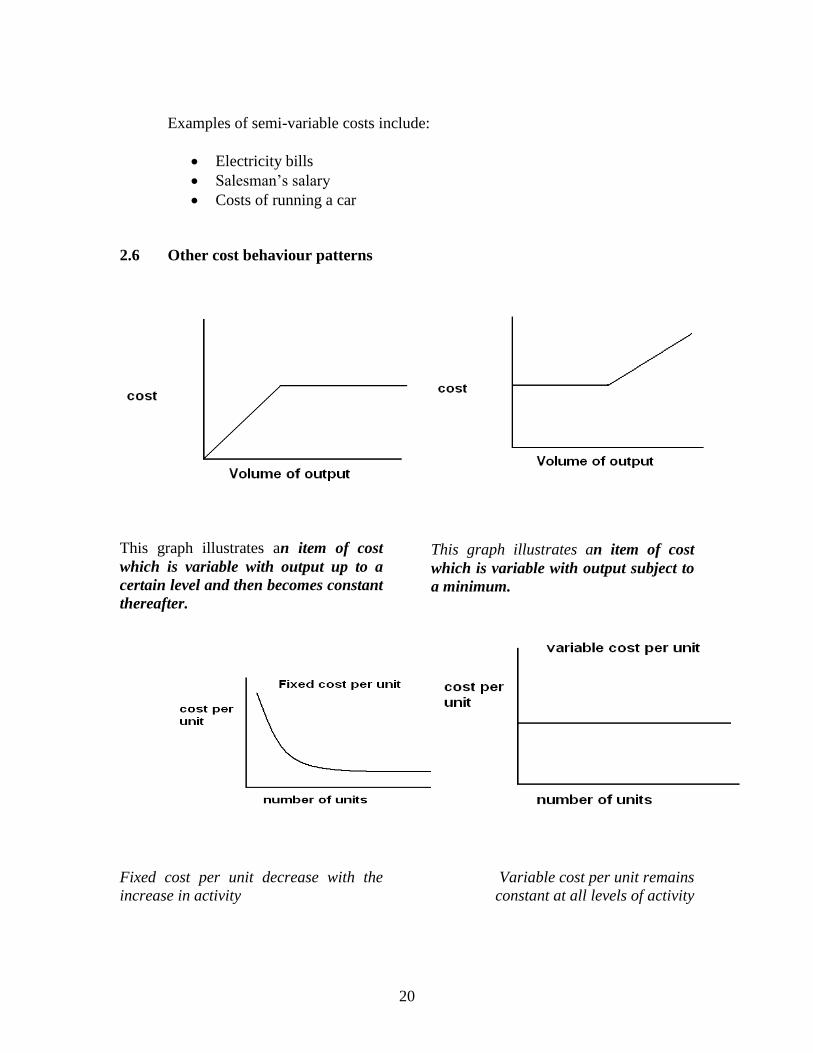
2.6 Other cost behaviour patterns
This graph illustrates an item of cost
which is variable with output up to a
certain level and then becomes constant
thereafter.
This graph illustrates an item of cost
which is variable with output subject to
a minimum.
Fixed cost per unit decrease with the
increase in activity
Variable cost per unit remains
constant at all levels of activity
21
3.0 DETERMINING THE FIXED AND VARIABLE ELEMENTS OF SEMI-
VARIABLE COSTS.
It is generally assumed that costs are one of the following:
Variable
Fixed
Semi-variable
Semi-variable costs are often separated into fixed and variable components. One
of the methods used to split the cost is the high-low method which works as
follows:
Step 1. Review records the costs in the past periods
Select the period with the highest activity level
Select the period with the lowest activity level
Step 2. Determine the following
Total cost at high level of activity
Total cost at low level of activity
Total units at high level of activity
Total units at low level of activity
Step 3. Calculate the variable cost per unit by dividing the
difference between the total cost at the lowest activity and
total cost at high activity by the difference between the
highest and lowest activity.
Step 4. Calculate the fixed cost by subtracting variable costs from
the total cost at either the lowest or highest activity
Example
Dolfin Ltd has recorded the following total costs during the last five years
Year Output (000) Total cost (K’000)
2000 65,000 145,000
2001 80,000 162,000
2002 90,000 170,000
2003 60,000 140,000
2004 75,000 160,000
Required
Calculate the total costs that should be expected in 2005 if output is 95,000 units.
22
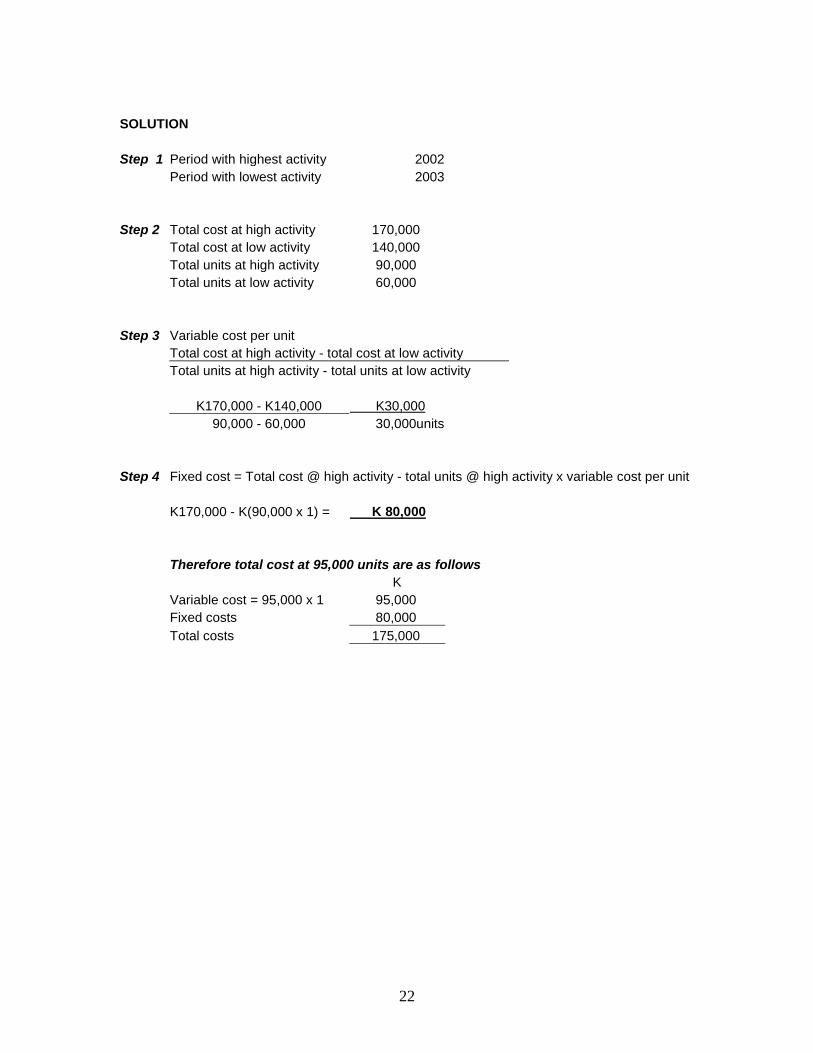
SOLUTION
Step 1 Period with highest activity 2002
Period with lowest activity 2003
Step 2 Total cost at high activity 170,000
Total cost at low activity 140,000
Total units at high activity 90,000
Total units at low activity 60,000
Step 3 Variable cost per unit
Total cost at high activity - total cost at low activity
Total units at high activity - total units at low activity
K170,000 - K140,000 K30,000
90,000 - 60,000 30,000units
Step 4 Fixed cost = Total cost @ high activity - total units @ high activity x variable cost per unit
K170,000 - K(90,000 x 1) = K 80,000
Therefore total cost at 95,000 units are as follows
K
Variable cost = 95,000 x 1 95,000
Fixed costs 80,000
Total costs 175,000
23
CHAPTER SUMMARY
Key points covered include the following:
Costs which are not affected by the level of activity are fixed costs or period costs
Step fixed costs are fixed with a certain range of activity
Variable costs increase or decrease with the level of activity and they are assumed
to be constant per unit
Semi-variable costs are costs that are part fixed and part variable.
The fixed and variable elements of semi-variable costs can be determined by the
high-low method
STUDENT-SELF TESTING
SELF REVIEW QUESTIONS
1. What does the term cost behaviour refer to? (1.0)
2. How is the knowledge of cost behaviour used in cost and management
accounting? (1.2)
3. Outline some expected cost behavioural patterns (2.0)
4. outline steps involved in using the high-low method (3.0)
24
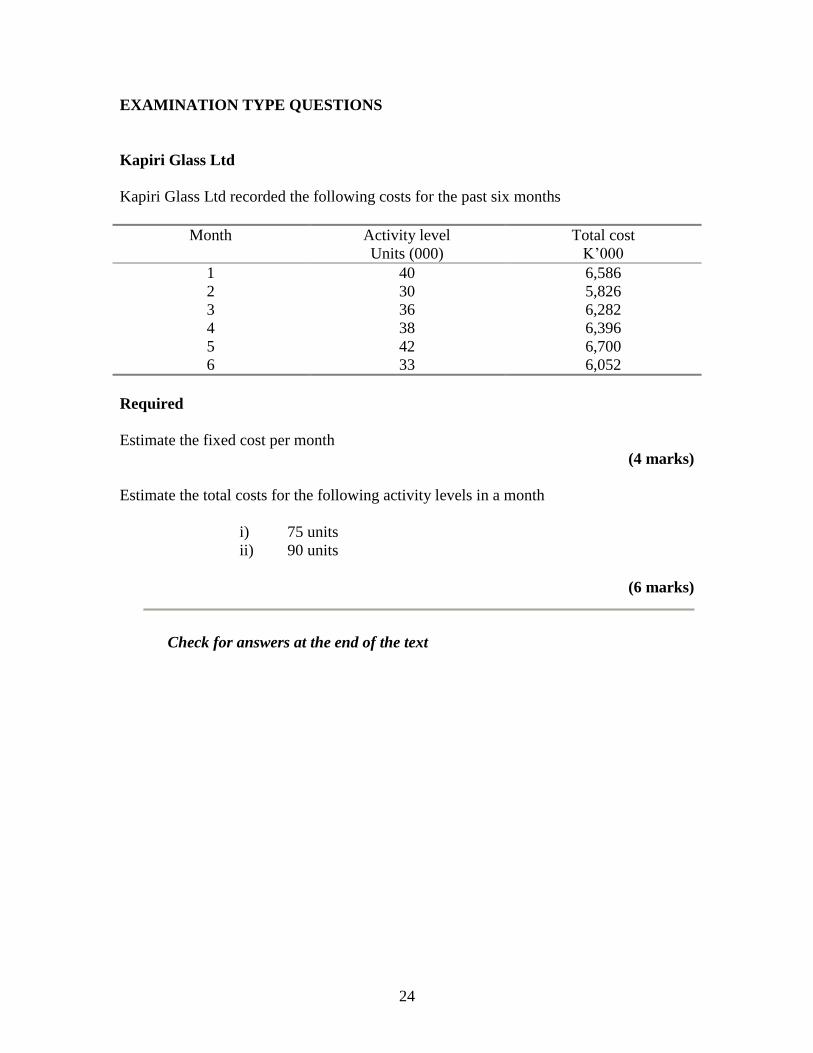
EXAMINATION TYPE QUESTIONS
Kapiri Glass Ltd
Kapiri Glass Ltd recorded the following costs for the past six months
Month
Activity level
Units (000)
Total cost
K’000
1 40 6,586
2 30 5,826
3 36 6,282
4 38 6,396
5 42 6,700
6 33 6,052
Required
Estimate the fixed cost per month
(4 marks)
Estimate the total costs for the following activity levels in a month
i) 75 units
ii) 90 units
(6 marks)
Check for answers at the end of the text
25
CHAPTER 4
COSTING OF MATERIALS
Introduction
This is the first of several chapters that deals with the accounting and costing of the
elements of costs namely materials, labour and expenses. These could either be direct or
indirect costs.
CONTENTS
1. Direct and indirect materials
2. Procedures and documentation of materials
3. Purchasing of materials
4. Pricing of issues
5. Accounting for material costs
Learning outcomes
After studying this chapter you should be able to:
Explain the distinction between direct and indirect material costs.
Describe the documentation used for recording of materials.
Calculate the costs of materials used in production and the values of closing
stocks using the FIFO, LIFO and weighted average cost methods of stock
valuation.
Account for material costs in the ledger accounts.
26
1.0 DIRECT AND INDIRECT MATERIALS
In cost and management accounting, materials are commonly classified as either
direct or indirect. Direct materials are the materials that can be directly attributed
to a unit of production, or specific job or service provided directly to a customer.
In a manufacturing business direct materials include:
Raw materials
Components
Indirect materials are other materials that cannot be directly attributed to a unit of
production. An example of indirect materials might be the oil used for the
lubrication of production machinery or other consumable such as cleaning
materials.
2.0 STOCK CONTROL
As the cost of purchasing stock is usually one of the largest costs faced by a
business it is important that an effective stock control system is established within
an organization.
Stock control for a business should cover the following functions:
The ordering of stock.
The purchase of stock.
The receipt of the ordered items.
Storage of stock items.
The issue of stock items.
The maintenance of sufficient stocks.
3.0 PROCEDURE AND DOCUMENTATION FOR MATERIALS
3.1 Purchase procedure
As bought in materials and services normally represent a large proportion of a
firm’s cost, it is essential that the materials purchased are most suitable from the
utility and cost basis.
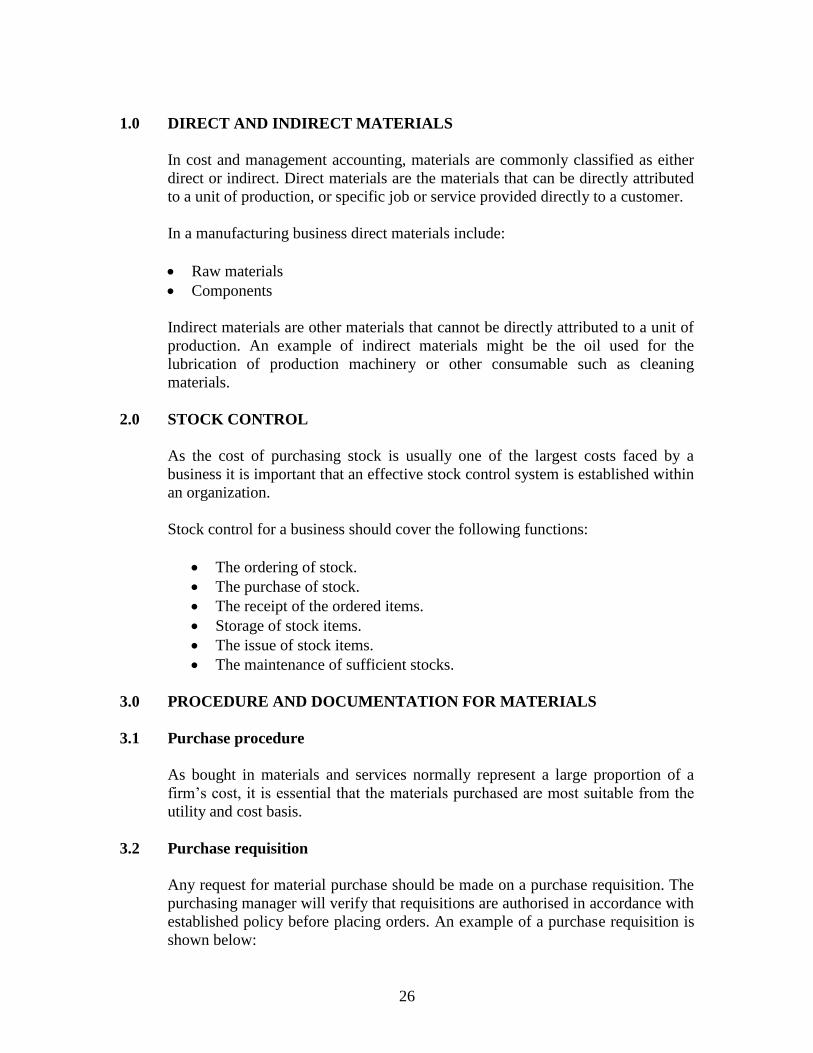
3.2 Purchase requisition
Any request for material purchase should be made on a purchase requisition. The
purchasing manager will verify that requisitions are authorised in accordance with
established policy before placing orders. An example of a purchase requisition is
shown below:
27
PURCHASE REQUISITION Req. No: …….
Department/Job no
Suggested supplier : Date requested :
Requested by :
Latest date required :
Quantity
Code number Description Estimated costs
Unit K
Authorised signature :
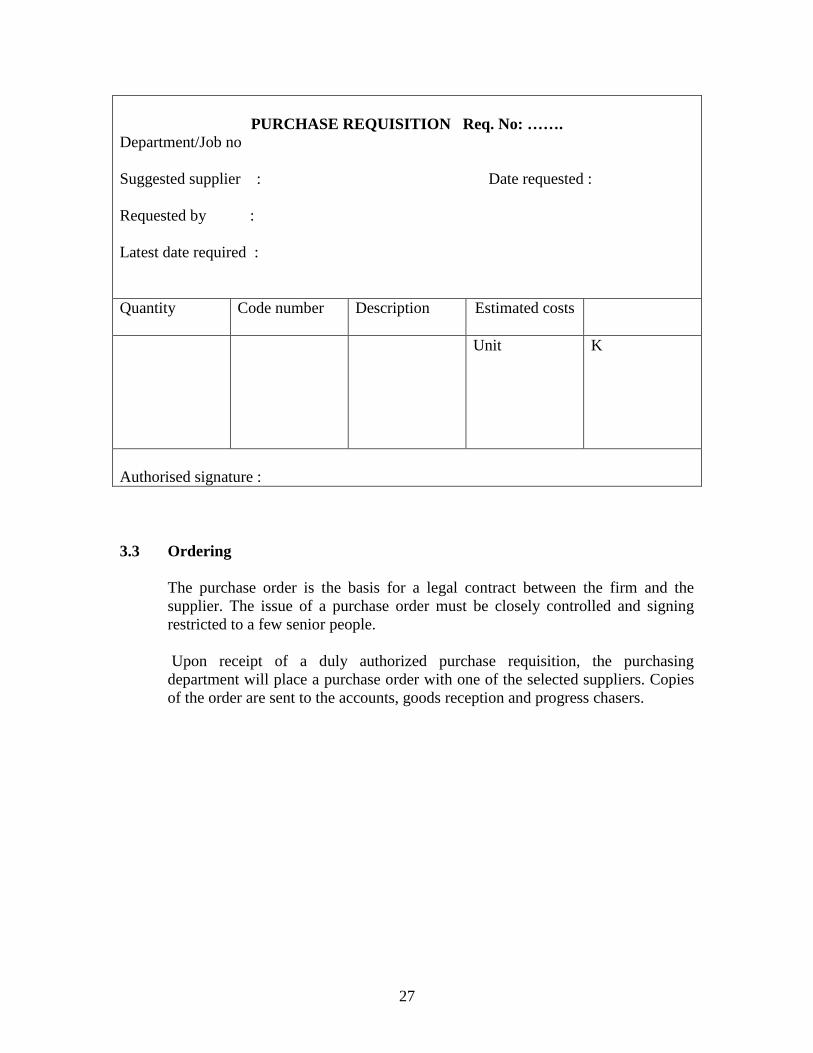
3.3 Ordering
The purchase order is the basis for a legal contract between the firm and the
supplier. The issue of a purchase order must be closely controlled and signing
restricted to a few senior people.
Upon receipt of a duly authorized purchase requisition, the purchasing
department will place a purchase order with one of the selected suppliers. Copies
of the order are sent to the accounts, goods reception and progress chasers.
28
Purchase order/ confirmation
Purchase order ref:
To
Subtotal
Vat @17.5%
Total
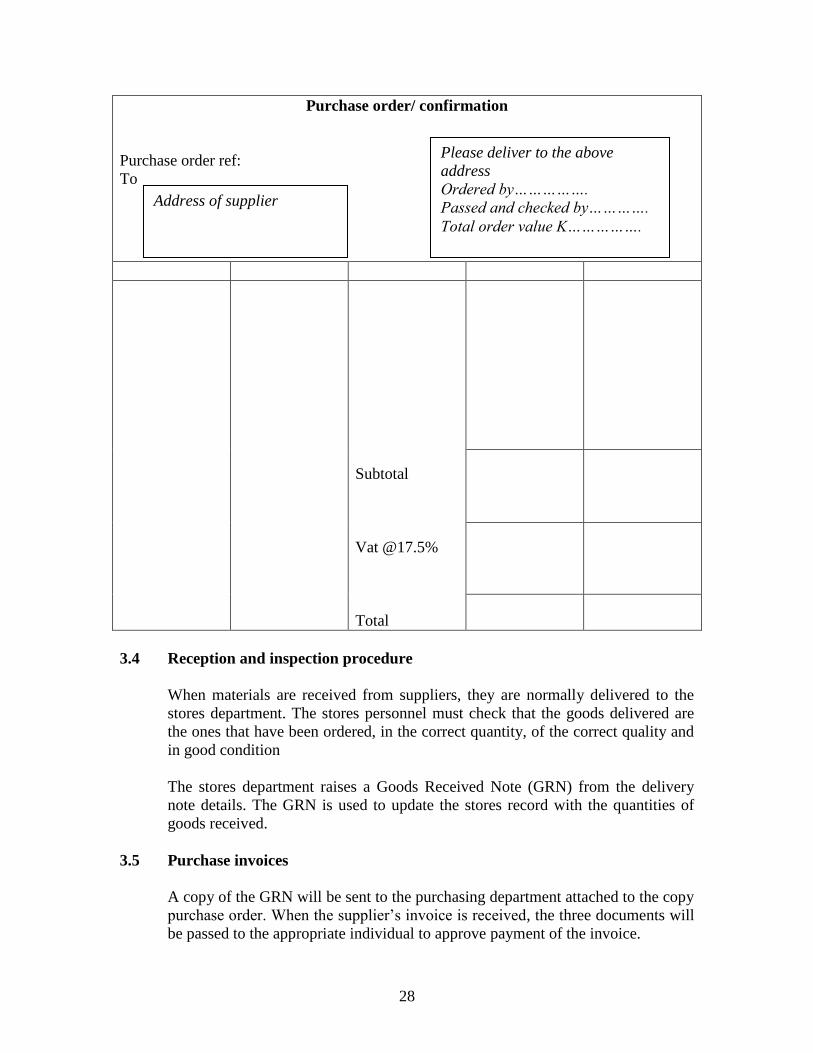
3.4 Reception and inspection procedure
When materials are received from suppliers, they are normally delivered to the
stores department. The stores personnel must check that the goods delivered are
the ones that have been ordered, in the correct quantity, of the correct quality and
in good condition
The stores department raises a Goods Received Note (GRN) from the delivery
note details. The GRN is used to update the stores record with the quantities of
goods received.
3.5 Purchase invoices
A copy of the GRN will be sent to the purchasing department attached to the copy
purchase order. When the supplier’s invoice is received, the three documents will
be passed to the appropriate individual to approve payment of the invoice.
Address of supplier
Please deliver to the above
address
Ordered by…………….
Passed and checked by………….
Total order value K…………….
29
GOODS RECEIVED NOTE
Date : Time:
Our order No……………………..
Supplier and suppliers advice note No…………………….
QUANTITY CAT NO DESCRIPTION
RECEIVED IN GOOD CONDITION
Name………………………………..
Signature……………………………
3.6 Storage
In any stock control system, there should be a continual record of the current
quantities of each of the stock item held in store. Receipt into store and issues
from store must be recorded, so that the current balance in stock can be kept up-
to-date.
Storekeeping involves storing materials to achieve the following objectives
Speedy issue and receipt of materials
Full identification of materials at all time
Correct location of all materials at all times
Protection of materials from damage and deterioration
Provision of secure stores to avoid pilferage, theft and fire
Efficient usage of storage space
Maintenance of correct stock levels
Keeping correct and up-to-date details of receipts, issues and stock levels
When the stores control system is a paper-based system, there could be two
separate stock records
Bin card system
Stock ledger system
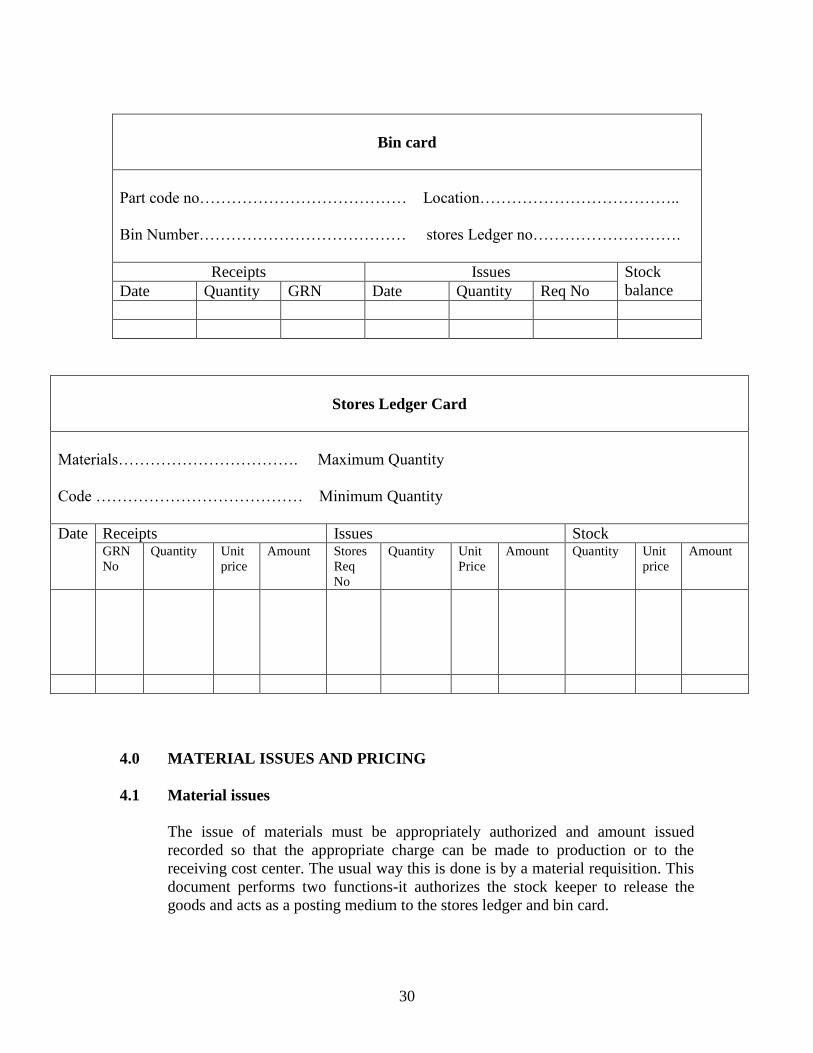
30
Bin card
Part code no………………………………… Location………………………………..
Bin Number………………………………… stores Ledger no……………………….
Receipts Issues Stock
balance Date Quantity GRN Date Quantity Req No
Stores Ledger Card
Materials……………………………. Maximum Quantity
Code ………………………………… Minimum Quantity
Date Receipts Issues Stock GRN
No
Quantity Unit
price
Amount Stores
Req
No
Quantity Unit
Price
Amount Quantity Unit
price
Amount
4.0 MATERIAL ISSUES AND PRICING
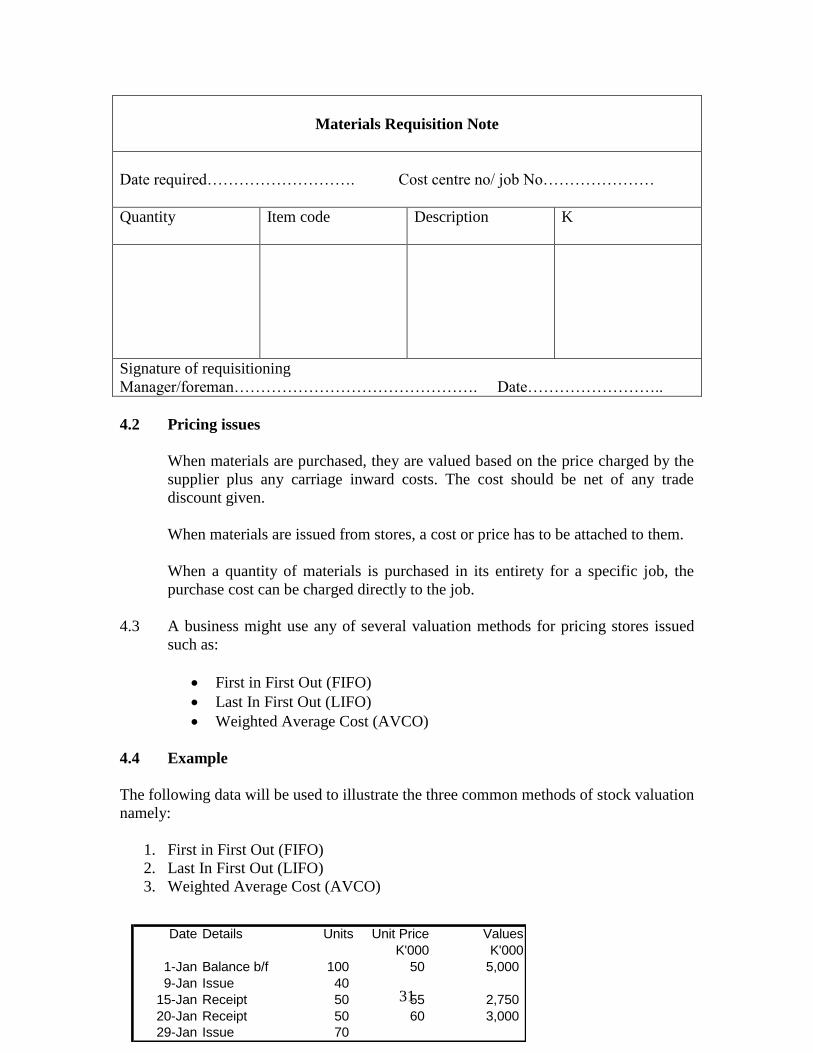
4.1 Material issues
The issue of materials must be appropriately authorized and amount issued
recorded so that the appropriate charge can be made to production or to the
receiving cost center. The usual way this is done is by a material requisition. This
document performs two functions-it authorizes the stock keeper to release the
goods and acts as a posting medium to the stores ledger and bin card.
31
Materials Requisition Note
Date required………………………. Cost centre no/ job No…………………
Quantity
Item code Description
K
Signature of requisitioning
Manager/foreman………………………………………. Date……………………..
4.2 Pricing issues
When materials are purchased, they are valued based on the price charged by the
supplier plus any carriage inward costs. The cost should be net of any trade
discount given.
When materials are issued from stores, a cost or price has to be attached to them.
When a quantity of materials is purchased in its entirety for a specific job, the
purchase cost can be charged directly to the job.
4.3 A business might use any of several valuation methods for pricing stores issued
such as:
First in First Out (FIFO)
Last In First Out (LIFO)
Weighted Average Cost (AVCO)
4.4 Example
The following data will be used to illustrate the three common methods of stock valuation
namely:
1. First in First Out (FIFO)
2. Last In First Out (LIFO)
3. Weighted Average Cost (AVCO)
Date Details Units Unit Price Values
K'000 K'000
1-Jan Balance b/f 100 50 5,000
9-Jan Issue 40
15-Jan Receipt 50 55 2,750
20-Jan Receipt 50 60 3,000
29-Jan Issue 70
32
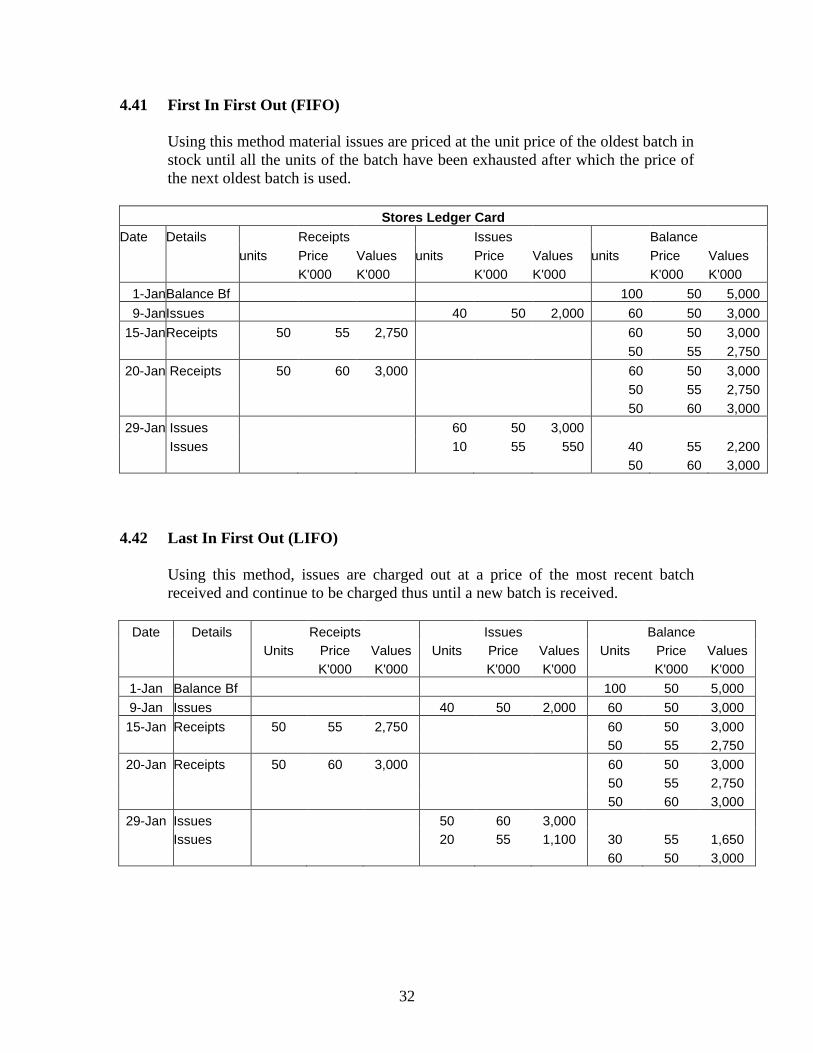
4.41 First In First Out (FIFO)
Using this method material issues are priced at the unit price of the oldest batch in
stock until all the units of the batch have been exhausted after which the price of
the next oldest batch is used.
Stores Ledger Card
Date Details Receipts Issues Balance
units Price Values units Price Values units Price Values
K'000 K'000 K'000 K'000 K'000 K'000
1-Jan Balance Bf 100 50 5,000
9-Jan Issues 40 50 2,000 60 50 3,000
15-Jan Receipts 50 55 2,750 60 50 3,000
50 55 2,750
20-Jan Receipts 50 60 3,000 60 50 3,000
50 55 2,750
50 60 3,000
29-Jan Issues 60 50 3,000
Issues 10 55 550 40 55 2,200
50 60 3,000
4.42 Last In First Out (LIFO)
Using this method, issues are charged out at a price of the most recent batch
received and continue to be charged thus until a new batch is received.
Date Details Receipts Issues Balance
Units Price Values Units Price Values Units Price Values
K'000 K'000 K'000 K'000 K'000 K'000
1-Jan Balance Bf 100 50 5,000
9-Jan Issues 40 50 2,000 60 50 3,000
15-Jan Receipts 50 55 2,750 60 50 3,000
50 55 2,750
20-Jan Receipts 50 60 3,000 60 50 3,000
50 55 2,750
50 60 3,000
29-Jan Issues 50 60 3,000
Issues 20 55 1,100 30 55 1,650
60 50 3,000
33
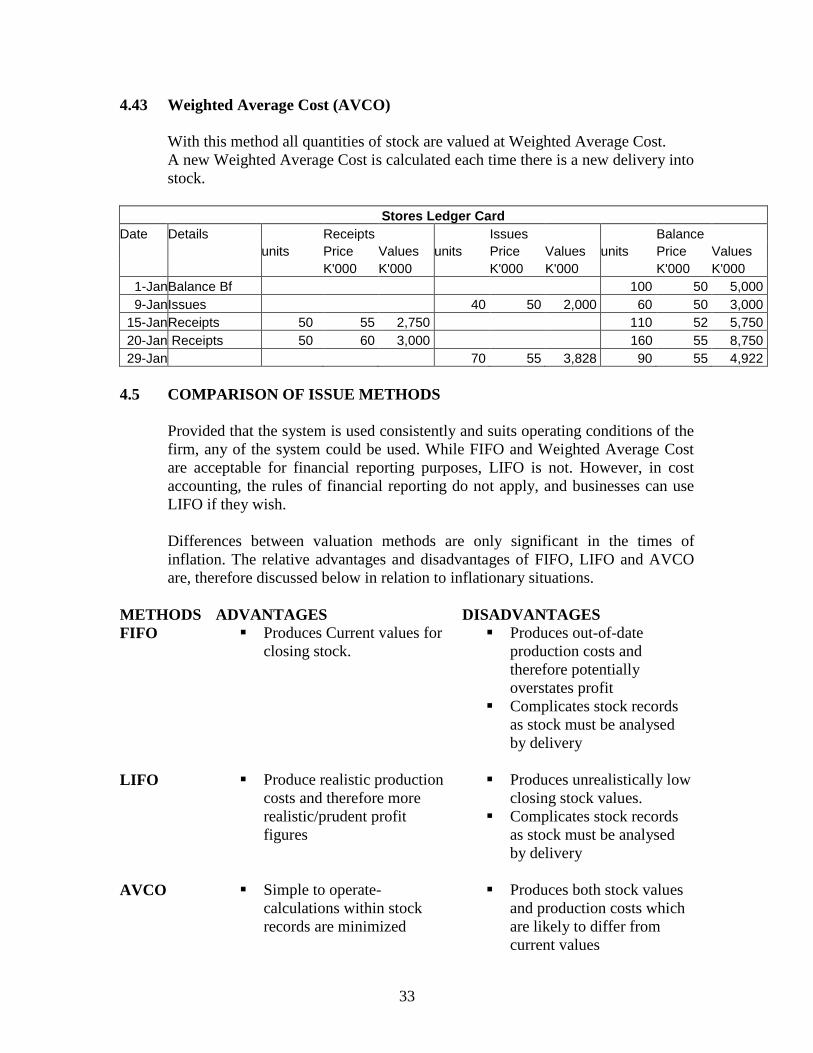
4.43 Weighted Average Cost (AVCO)
With this method all quantities of stock are valued at Weighted Average Cost.
A new Weighted Average Cost is calculated each time there is a new delivery into
stock.
Stores Ledger Card
Date Details Receipts Issues Balance
units Price Values units Price Values units Price Values
K'000 K'000 K'000 K'000 K'000 K'000
1-Jan Balance Bf 100 50 5,000
9-Jan Issues 40 50 2,000 60 50 3,000
15-Jan Receipts 50 55 2,750 110 52 5,750
20-Jan Receipts 50 60 3,000 160 55 8,750
29-Jan 70 55 3,828 90 55 4,922
4.5 COMPARISON OF ISSUE METHODS
Provided that the system is used consistently and suits operating conditions of the
firm, any of the system could be used. While FIFO and Weighted Average Cost
are acceptable for financial reporting purposes, LIFO is not. However, in cost
accounting, the rules of financial reporting do not apply, and businesses can use
LIFO if they wish.
Differences between valuation methods are only significant in the times of
inflation. The relative advantages and disadvantages of FIFO, LIFO and AVCO
are, therefore discussed below in relation to inflationary situations.
METHODS ADVANTAGES DISADVANTAGES
FIFO Produces Current values for
closing stock.
Produces out-of-date
production costs and
therefore potentially
overstates profit
Complicates stock records
as stock must be analysed
by delivery
LIFO Produce realistic production
costs and therefore more
realistic/prudent profit
figures
Produces unrealistically low
closing stock values.
Complicates stock records
as stock must be analysed
by delivery
AVCO Simple to operate-
calculations within stock
records are minimized
Produces both stock values
and production costs which
are likely to differ from
current values
34
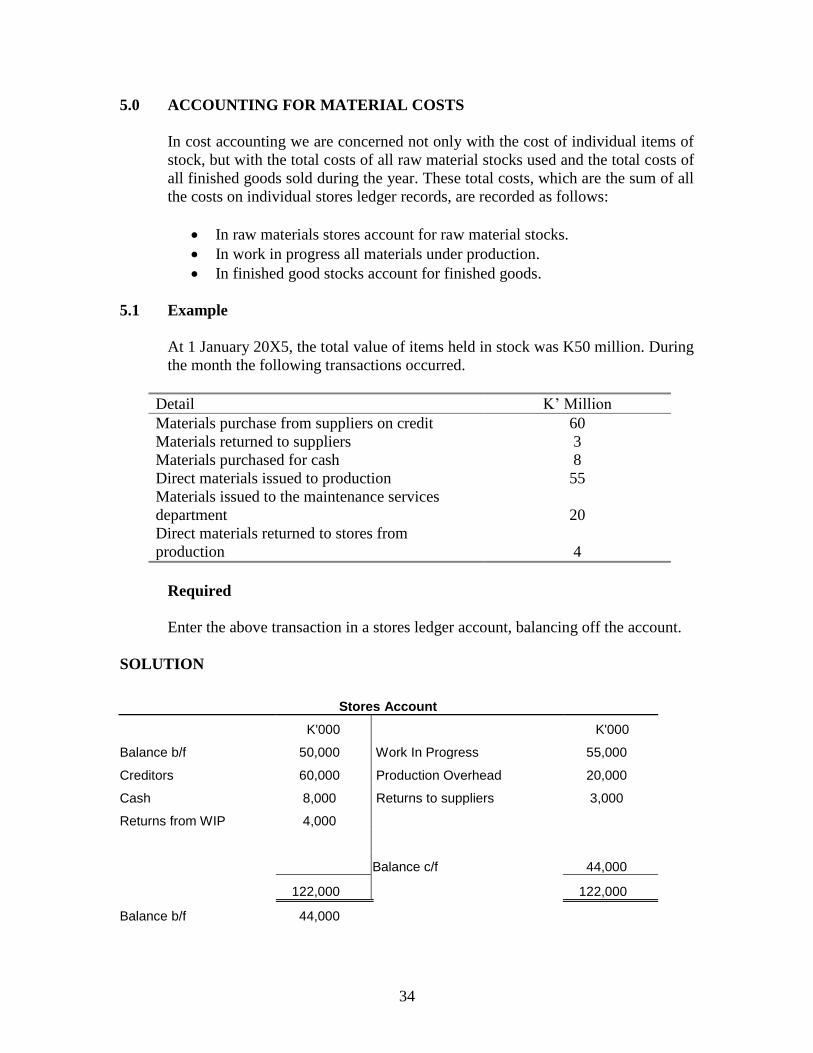
5.0 ACCOUNTING FOR MATERIAL COSTS
In cost accounting we are concerned not only with the cost of individual items of
stock, but with the total costs of all raw material stocks used and the total costs of
all finished goods sold during the year. These total costs, which are the sum of all
the costs on individual stores ledger records, are recorded as follows:
In raw materials stores account for raw material stocks.
In work in progress all materials under production.
In finished good stocks account for finished goods.
5.1 Example
At 1 January 20X5, the total value of items held in stock was K50 million. During
the month the following transactions occurred.
Detail K’ Million
Materials purchase from suppliers on credit 60
Materials returned to suppliers 3
Materials purchased for cash 8
Direct materials issued to production 55
Materials issued to the maintenance services
department
20
Direct materials returned to stores from
production
4
Required
Enter the above transaction in a stores ledger account, balancing off the account.
SOLUTION
Stores Account
K'000 K'000
Balance b/f 50,000 Work In Progress 55,000
Creditors 60,000 Production Overhead 20,000
Cash 8,000 Returns to suppliers 3,000
Returns from WIP 4,000
Balance c/f 44,000
122,000 122,000
Balance b/f 44,000
35
Chapter summary
Direct materials are materials that can be directly attributed to a unit of
production or a specific job or service provided directly to a customer.
Indirect material are materials that cannot be directly attributed to a unit of
production
FIFO- First in First out method of stock pricing
LIFO- Last in First out method of pricing
AVCO-Weighted average method of stock pricing
The total cost of all raw materials stocks used during the accounting
period is recorded in the raw materials stock account.
The total cost of stocks manufactured in the production department is
recorded in the work in progress
The total cost of finished goods sold in an accounting period are recorded
in the finished goods account
SELF REVIEW QUESTIONS
SELF TEST QUESTIONS
1. Outline the functions of stock control (2.0)
2. Mention 3 commonly used methods for pricing material issues (3.0)
3. Outline key documents used in stock handling (3.0 – 3.7)
4. What are the advantages and disadvantages of the following methods for pricing
issues (4.5)
FIFO
LIFO
AVCO
5. What is the function of the purchase requisition note (3.2)
6. Who raises the Goods Received Note – GRN (3.4)
7. What is the function of the materials Requisition note (4.1)
36
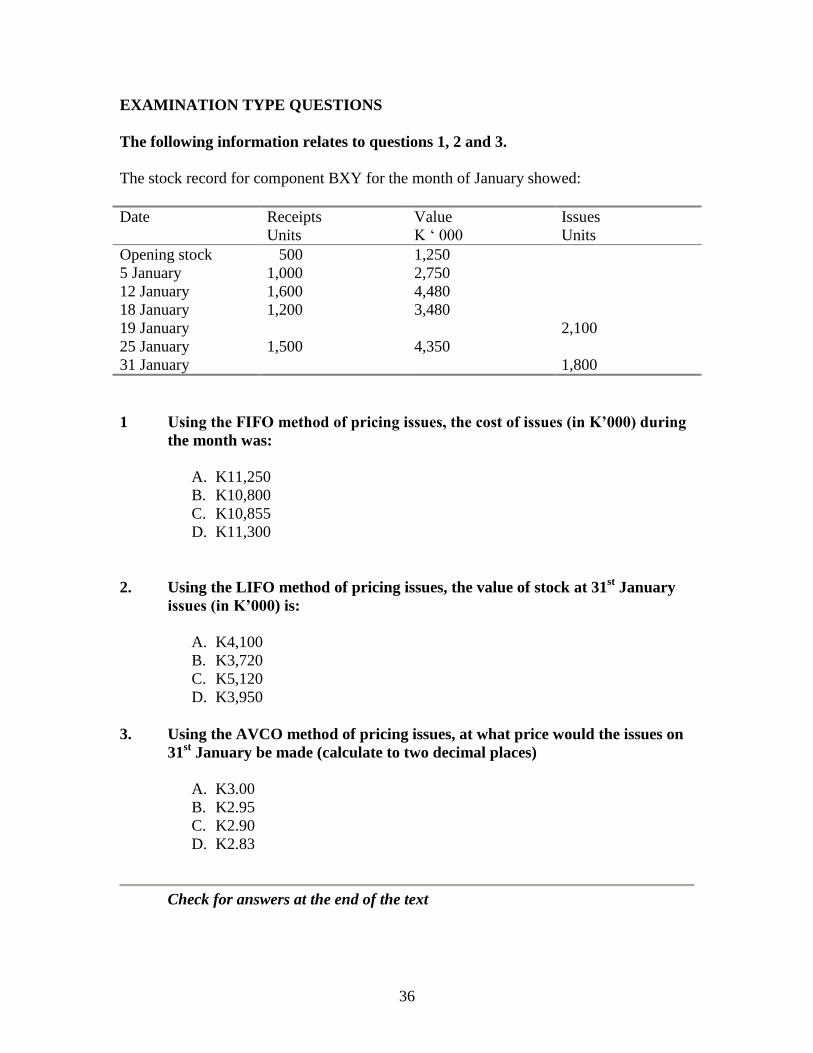
EXAMINATION TYPE QUESTIONS
The following information relates to questions 1, 2 and 3.
The stock record for component BXY for the month of January showed:
Date Receipts
Units
Value
K ‘ 000
Issues
Units
Opening stock 500 1,250
5 January 1,000 2,750
12 January 1,600 4,480
18 January 1,200 3,480
19 January 2,100
25 January 1,500 4,350
31 January 1,800
1 Using the FIFO method of pricing issues, the cost of issues (in K’000) during
the month was:
A. K11,250
B. K10,800
C. K10,855
D. K11,300
2. Using the LIFO method of pricing issues, the value of stock at 31st January
issues (in K’000) is:
A. K4,100
B. K3,720
C. K5,120
D. K3,950
3. Using the AVCO method of pricing issues, at what price would the issues on
31st January be made (calculate to two decimal places)
A. K3.00
B. K2.95
C. K2.90
D. K2.83
Check for answers at the end of the text
37
CHAPTER 5
MATERIALS STOCK CONTROL
The previous chapter looked at how transactions involving materials are recorded and
valued. This chapter looks at the monitoring of stock levels as a means of controlling the
stock costs.
Contents
1. Costs of stock holding and stock-outs
2. Stock taking
3. Economic Order Quantity
4. Stock reorder level
5. Other stock control systems
Learning outcomes
After studying this chapter you should be able to:
Describe the procedures required to monitor stock and minimise stock
discrepancies and losses.
Explain the costs of stockholding and stock-outs.
Explain and illustrate minimum stock levels, maximum stock levels and stock
reorder levels.
Calculate and interpret optimal order quantities.
1.1 Why stock control?
The costs of purchasing stock are usually one of the largest costs faced by an
organisation and once obtained, stock has to be carefully controlled and checked.
1.2 The benefits of stock holding
The main reasons for holding stock can be summarized as follows:
To take care of possible future shortages.
To ensure sufficient goods are available to meet expected demand.
To absorb seasonal fluctuation and any variations in usage and demand.
To allow production processes to flow smoothly and efficiently.
As a deliberate investment policy, especially in times of inflation.
38
1.3 Holding costs
Though beneficial, holding stocks can be an expensive business. The objective of
a stock policy should be to minimise the total annual costs associated with stock
holding. Such costs include:
Storage costs
Interest costs
Insurance costs
Risk of obsolescence
Deterioration
1.4 Order costs
These are costs that are incurred every time stock is purchased from a supplier
and they are high when stocks are ordered in smaller quantities but more
frequently. Such costs include:
Clerical and administrative.
Transport costs.
Production runs costs.
1.5 Stock out costs
An additional type of cost which may arise if stocks are kept too low is the type
associated with running out of stock. These include:
Lost contribution from lost sales
Loss of future sales due to disgruntled customers
Loss of customer goodwill
Cost of production stoppages
Labour frustrations over stoppages
Extra costs of urgent orders
2.0 MONITORING STOCKS AND STOCK LOSSES
Stocks can be monitored using stocktaking.
Stocktaking involves counting the physical stock on hand at a certain date and
then checking this against the balance shown on the stock records.
There are two methods of carrying out this process. These are periodic stock
taking and continuous stock taking.
39
2.1 Periodic stocktaking
‘A process whereby all stock items are physically counted and valued at a
set point in time, usually at the end of an accounting period.’
CIMA Official Terminology
2.2 Continuous stocktaking
‘The process of counting and valuing selected items at different times on a
rotating basis’
CIMA Official Terminology
This involves a specialist team counting and checking a number of stock items
each day so that each item is checked at least once a year. Valuable items or items
with a high turnover could be checked more frequently.
2.3 The advantages of continuous stocktaking compared to periodic stock taking are
as follows:
There will be occasions when stock checks disclose discrepancies between the
physical amount of an item in stock and the amount shown in the stock records.
When this occurs, the cause of the discrepancy should be investigated and
appropriate action taken.
2.4 Objective of stock control
The overall objective of stock control is to ensure that the total of the following
costs is minimised:
Holding costs.
Ordering costs.
Stock out costs.
3.0 Re-order level system
This is a more sophisticated version of the two bin system, which involves the
setting of three control levels based on an analysis of past stock usage and
delivery times. These levels are:
Re-order level
Minimum stock level
Maximum stock
40
3.1 Re-order level
The reorder level is the level of stock at which a replenishment order should be
placed.
Reorder Level = Maximum Usage x Maximum Lead time
3.2 Minimum stock level
The minimum stock level for an item of stock is a warning level at which
management should check to ensure that a new delivery of the item will be
received from the supplier before stock out occurs. This may call for emergency
action to replenish stocks.
Minimum stock level = Reorder level – (average usage x average lead time)
3.3 Maximum stock
This is the maximum amount of stock that should ever be held in stock. This also
acts as a warning level to signal management that stocks are reaching a potentially
wasteful level.
Maximum stock = reorder level + reorder quantity – (minimum usage x
minimum lead time)
3.4 Average stock level
Although average stock is not a control level itself, you may need it to calculate
estimated stock holding costs.
If we assume that a replenishment order arrives at the point at which stock reaches
the buffer or safety stock level, and then thereafter stock is used evenly until it
reaches reorder level and an order is placed, the average stock level can be
calculated as
Average stock = safety stock + ½ reorder quantity
If we assume that no safety stock is held, so that a delivery is received just as
stock falls to zero, then the formula for calculating the average stock is
Average stock = ½ of reorder quantity
41
3.5 Example
Zam Tyre Ltd deals in Good year tyre for which the following information is
available:
Average usage 140 tyres per day
Minimum usage 90 tyres per day
Maximum usage 175 tyres per day
Lead time 10 – 16 days
Reorder Quantity 3000 tyres
Required
Based on this information calculate
a. Reorder level
b. Minimum stock level
c. Maximum stock level
3.6 Solution
Reorder level = Maximum Usage x Maximum Lead Time
175 x 16 = 2,800
Minimum stock level = Reorder level – (average usage x average lead time)
2,800 – (140 x 13) = 980
Maximum stock = reorder level + reorder quantity – (minimum usage x
minimum lead time)
2,800 + 3,000 – (90 x 10) = 4,900
3.7 ECONOMIC ORDER QUANTITY
Ordering in large quantities reduces the annual costs of ordering. On the other
hand, large orders increase storage requirements which increases stock holding
costs. The economic order quantity minimises the combined costs of stock
ordering and stock holding.
42
Definition
Economic Order Quantity (EOQ) is the order quantity for a stock item that will
minimise the combined costs of stock ordering plus stock holding over a given
period, say a year.
EOQ is based on the following assumptions:
There should be no stock-out of the item.
There is no buffer stock.
A new delivery of the stock item is received from the supplier at the exact
time that existing stocks run out.
The stock item is used up at an even rate and predictable rate over time.
The delivery lead-time from the supplier is predictable and reliable.
Formula
2CoD
Ch
4.0 Other systems of stock control
4.1 Two-bin system
This is a system whereby each stores item is kept in two storage bins, say A and
B. When bin A is emptied, an order must be placed for re-supply; bin B will
contain sufficient stocks to last until the fresh delivery is received.
4.2 Periodic review system
Under this system the stock levels are reviewed at fixed intervals e.g every four
weeks.
4.3 ABC inventory analysis
This is a selective approach to stock control whereby materials are classified
under A, B and C according to their expense group, A being the most expensive,
group B the medium cost and group C the inexpensive material. High valued
items are more carefully monitored compared to less valued ones.
4.4 JIT systems
Some manufacturing companies have sought to reduce their inventories of raw
materials and components by using the Just-In-Time philosophy. This is a system
43
where raw materials are bought for production and not for stocking. Components
are also made when there is readily available customer demand
JIT philosophy is only possible when suppliers can be relied upon to deliver fresh
supplies of an item at the required time and to the required quality standard. Such
a system can be successfully adopted where the following features are present:
Stable high volume of stock consumption.
Coordination of the daily production programmes of the suppliers and the
consumer.
Co-operation of suppliers.
A convenient reliable transport system, or the supplier being in close
proximity to the consumer.
The relative costs and benefits of JIT are as follows:
Warehousing costs are almost eliminated.
The quality control function has been made the responsibility of the supplier.
Problems of obsolescence, deterioration, theft, cost tied up and all other costs
associated with holding stock have been avoided.
However, it should be noted that the JIT systems expose a business to huge costs
such as unfulfilled customer orders when there is breakdown in the supply chain
network.
Chapter summary
Perpetual inventory refers to stock recording system whereby the records (bin
card and stores ledger card) are updated for each receipt and issue of stock as
it occurs.
Stocktaking - counting and recording physical quantities of stock
Lead time - the time between when an order is placed and the receipt of stock
Stock control levels can be calculated in order to maintain stocks at the
optimum level. The three critical levels are reorder level, minimum level and
maximum level
Stock costs include purchase costs, holding costs, ordering costs and stock-out
costs.
Economic order quantity - the order quantity that minimizes ordering and
holding costs and can be computed using a table, a graph or formula.
44
SELF REVIEW QUESTIONS
SELF TEST QUESTIONS
1. Why do organisations hold stock (1.2)
2. Give examples of stockholding costs (1.3)
3. Give examples of stock-out costs (1.5)
4. What is stock taking (2.0)
5. State the formula for reorder level (3.1)
6. State the formula for minimum stock level (3.2)
7. State the formula for maximum stock level (3.3)
8. State the EOQ formula (3.7)
9. What are some of the benefits of operating a JIT system (4.4)
EXAMINATION TYPE QUESTIONS
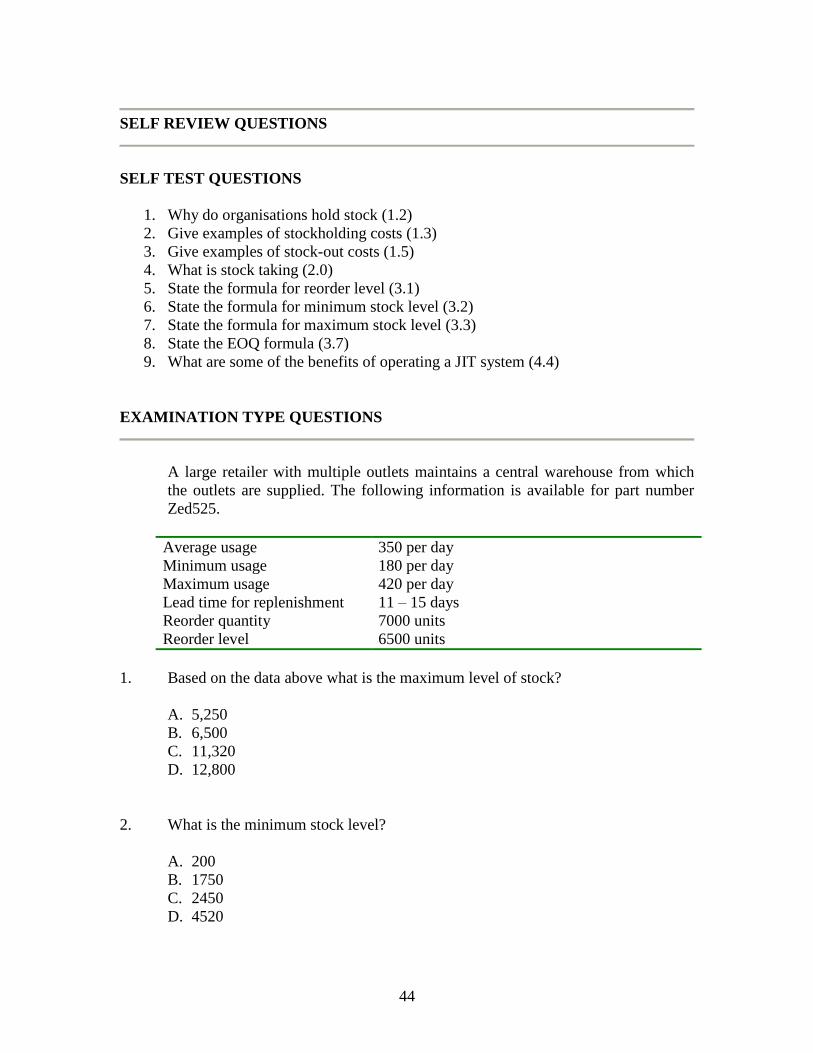
A large retailer with multiple outlets maintains a central warehouse from which
the outlets are supplied. The following information is available for part number
Zed525.
Average usage 350 per day
Minimum usage 180 per day
Maximum usage 420 per day
Lead time for replenishment 11 – 15 days
Reorder quantity 7000 units
Reorder level 6500 units
1. Based on the data above what is the maximum level of stock?
A. 5,250
B. 6,500
C. 11,320
D. 12,800
2. What is the minimum stock level?
A. 200
B. 1750
C. 2450
D. 4520
45
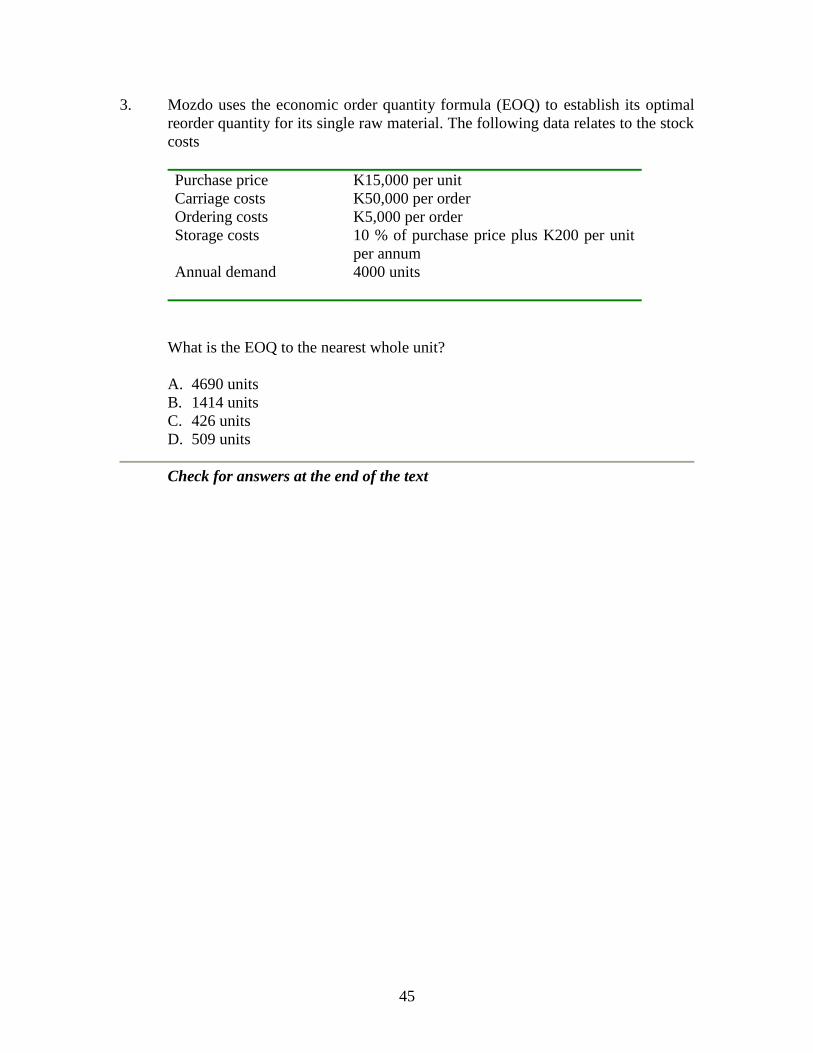
3. Mozdo uses the economic order quantity formula (EOQ) to establish its optimal
reorder quantity for its single raw material. The following data relates to the stock
costs
Purchase price K15,000 per unit
Carriage costs K50,000 per order
Ordering costs K5,000 per order
Storage costs 10 % of purchase price plus K200 per unit
per annum
Annual demand 4000 units
What is the EOQ to the nearest whole unit?
A. 4690 units
B. 1414 units
C. 426 units
D. 509 units
Check for answers at the end of the text
46
CHAPTER 6
LABOUR COSTING
Introduction
In this chapter we look at labour costs. We begin by looking at a number of remuneration
methods and will consider the various types of incentive schemes that exist. We will also
examine the procedures and documents required for the accurate recording of labour. The
procedure for accounting for labour costs will then be described and finally certain
aspects of labour cost control will be explained such as monitoring labour turnover and
productivity.
CONTENTS
1. Remuneration methods
2. Recording labour costs
3. Classification of labour costs
4. Accounting for labour
5. Labour turnover
6. Measuring labour activity
LEARNING OUTCOMES
After studying this chapter you should be able to:
Describe and illustrate different remuneration methods.
Explain how labour time might be recorded and traced to individual products,
jobs or activities.
Distinguish between direct and indirect labour costs.
Explain the cause and costs of labour turnover and calculate turnover.
Describe and illustrate measures of labour efficiency and utilisation.
1.0 REMUNERATION METHODS
There are three basic groups of remuneration method:
Time related
Output related
Bonus/incentive schemes
1.20 Time based systems
Basic system
At the simplest level workers would be paid for the number of hours worked at a
basic rate per hour up to say 40 hours per week using the following formula.
FORMULA
Wages = Hours worked x Rate of pay per hour
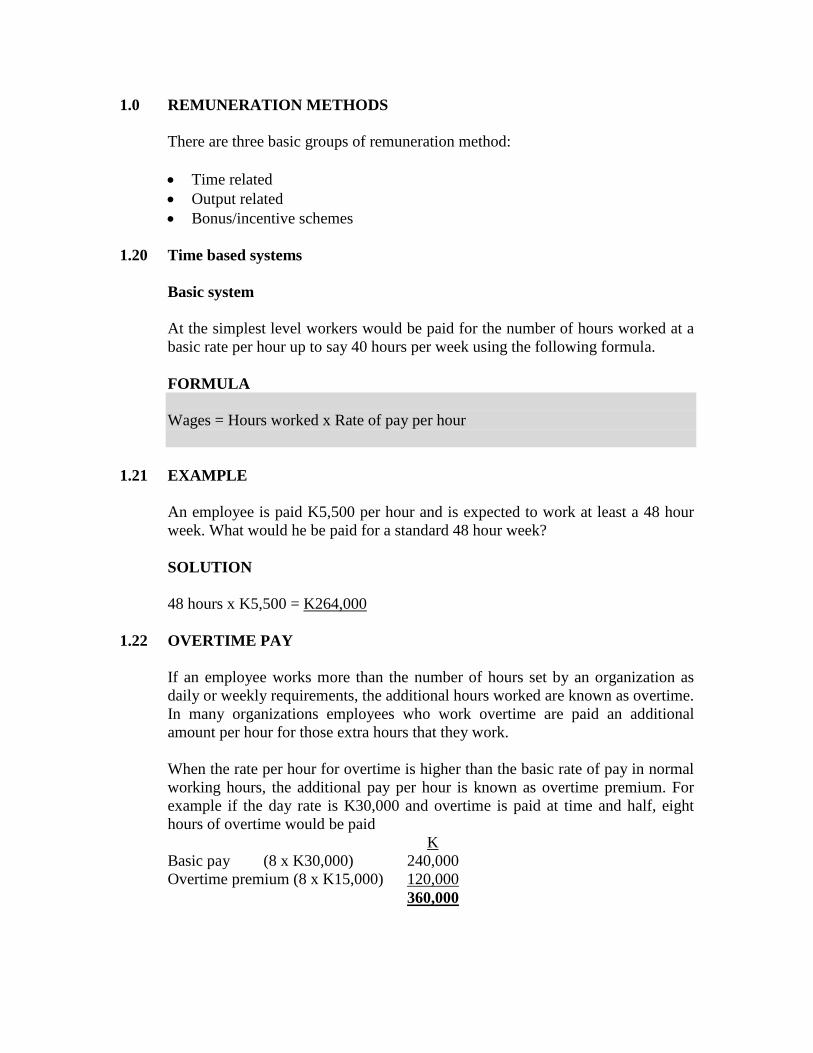
1.21 EXAMPLE
An employee is paid K5,500 per hour and is expected to work at least a 48 hour
week. What would he be paid for a standard 48 hour week?
SOLUTION
48 hours x K5,500 = K264,000
1.22 OVERTIME PAY
If an employee works more than the number of hours set by an organization as
daily or weekly requirements, the additional hours worked are known as overtime.
In many organizations employees who work overtime are paid an additional
amount per hour for those extra hours that they work.
When the rate per hour for overtime is higher than the basic rate of pay in normal
working hours, the additional pay per hour is known as overtime premium. For
example if the day rate is K30,000 and overtime is paid at time and half, eight
hours of overtime would be paid
K
Basic pay (8 x K30,000) 240,000
Overtime premium (8 x K15,000) 120,000
360,000
48
The over time premium is the extra rate per hour which is paid and not the whole
of the payment for the overtime hours.
1.23 HIGH DAY RATE SYSTEMS
This is a time based system which is designed to provide a strong incentive by
paying rates well above normal basic rates in exchange for above average output
and performance. For its successful application it is necessary to ensure that the
output levels are the result of detailed work studies and that there is agreement
from labour force and the unions involved on the required production level.
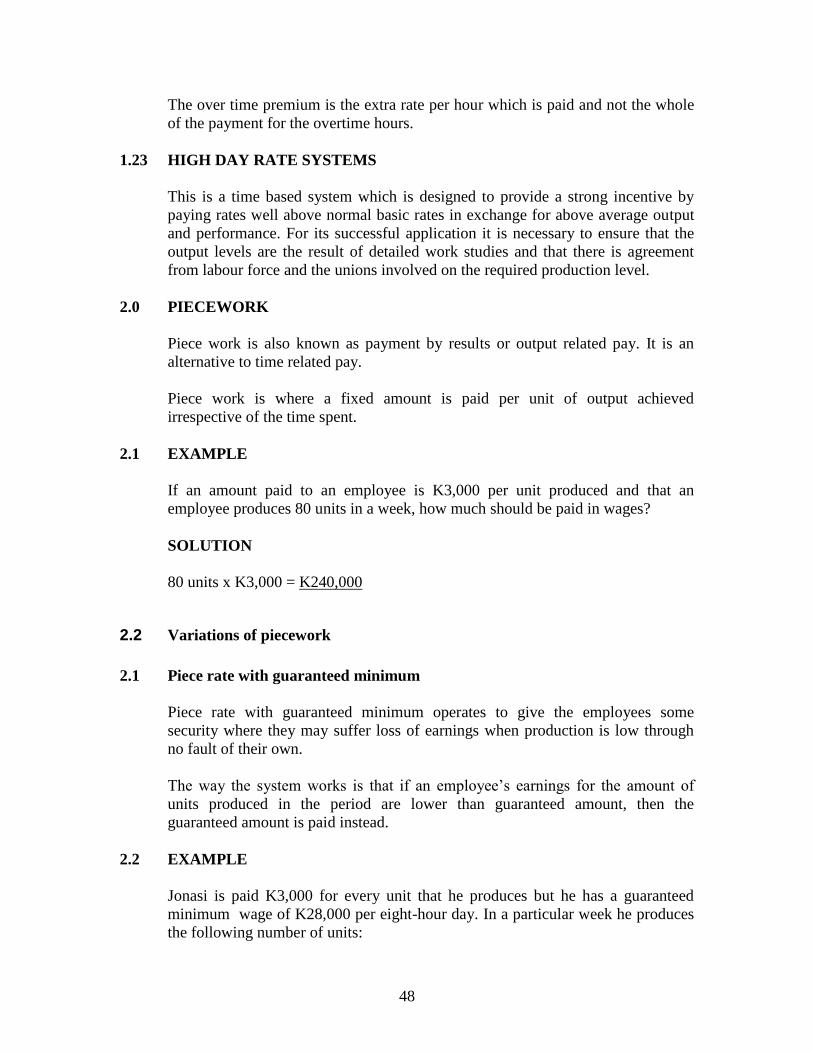
2.0 PIECEWORK
Piece work is also known as payment by results or output related pay. It is an
alternative to time related pay.
Piece work is where a fixed amount is paid per unit of output achieved
irrespective of the time spent.
2.1 EXAMPLE
If an amount paid to an employee is K3,000 per unit produced and that an
employee produces 80 units in a week, how much should be paid in wages?
SOLUTION
80 units x K3,000 = K240,000
2.2 Variations of piecework
2.1 Piece rate with guaranteed minimum
Piece rate with guaranteed minimum operates to give the employees some
security where they may suffer loss of earnings when production is low through
no fault of their own.
The way the system works is that if an employee’s earnings for the amount of
units produced in the period are lower than guaranteed amount, then the
guaranteed amount is paid instead.
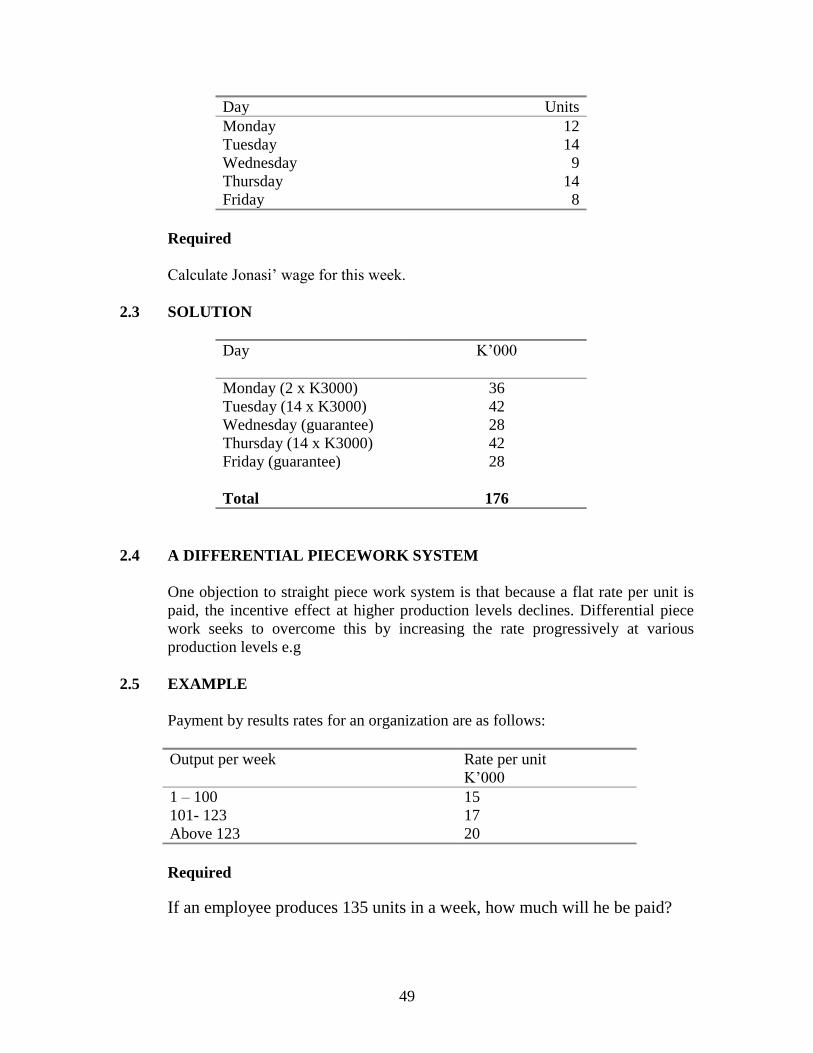
2.2 EXAMPLE
Jonasi is paid K3,000 for every unit that he produces but he has a guaranteed
minimum wage of K28,000 per eight-hour day. In a particular week he produces
the following number of units:
49
Day Units
Monday 12
Tuesday 14
Wednesday 9
Thursday
Friday
14
8
Required
Calculate Jonasi’ wage for this week.
2.3 SOLUTION
Day
K’000
Monday (2 x K3000) 36
Tuesday (14 x K3000) 42
Wednesday (guarantee) 28
Thursday (14 x K3000)
Friday (guarantee)
Total
42
28
176
2.4 A DIFFERENTIAL PIECEWORK SYSTEM
One objection to straight piece work system is that because a flat rate per unit is
paid, the incentive effect at higher production levels declines. Differential piece
work seeks to overcome this by increasing the rate progressively at various
production levels e.g
2.5 EXAMPLE
Payment by results rates for an organization are as follows:
Output per week Rate per unit
K’000
1 – 100
101- 123
15
17
Above 123 20
Required
If an employee produces 135 units in a week, how much will he be paid?
50
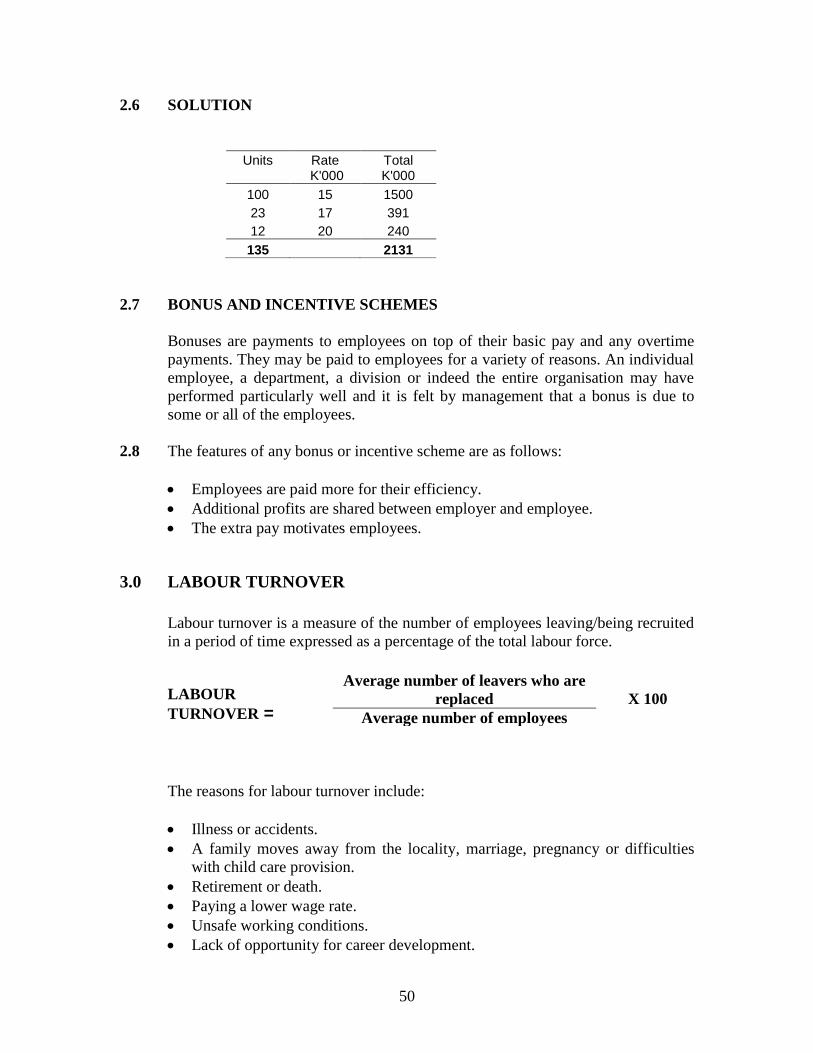
2.6 SOLUTION
Units
Rate K'000
Total K'000
100 15 1500
23 17 391
12 20 240
135 2131
2.7 BONUS AND INCENTIVE SCHEMES
Bonuses are payments to employees on top of their basic pay and any overtime
payments. They may be paid to employees for a variety of reasons. An individual
employee, a department, a division or indeed the entire organisation may have
performed particularly well and it is felt by management that a bonus is due to
some or all of the employees.
2.8 The features of any bonus or incentive scheme are as follows:
Employees are paid more for their efficiency.
Additional profits are shared between employer and employee.
The extra pay motivates employees.
3.0 LABOUR TURNOVER
Labour turnover is a measure of the number of employees leaving/being recruited
in a period of time expressed as a percentage of the total labour force.
LABOUR
TURNOVER =
The reasons for labour turnover include:
Illness or accidents.
A family moves away from the locality, marriage, pregnancy or difficulties
with child care provision.
Retirement or death.
Paying a lower wage rate.
Unsafe working conditions.
Lack of opportunity for career development.
Average number of leavers who are
replaced
X 100
Average number of employees
51
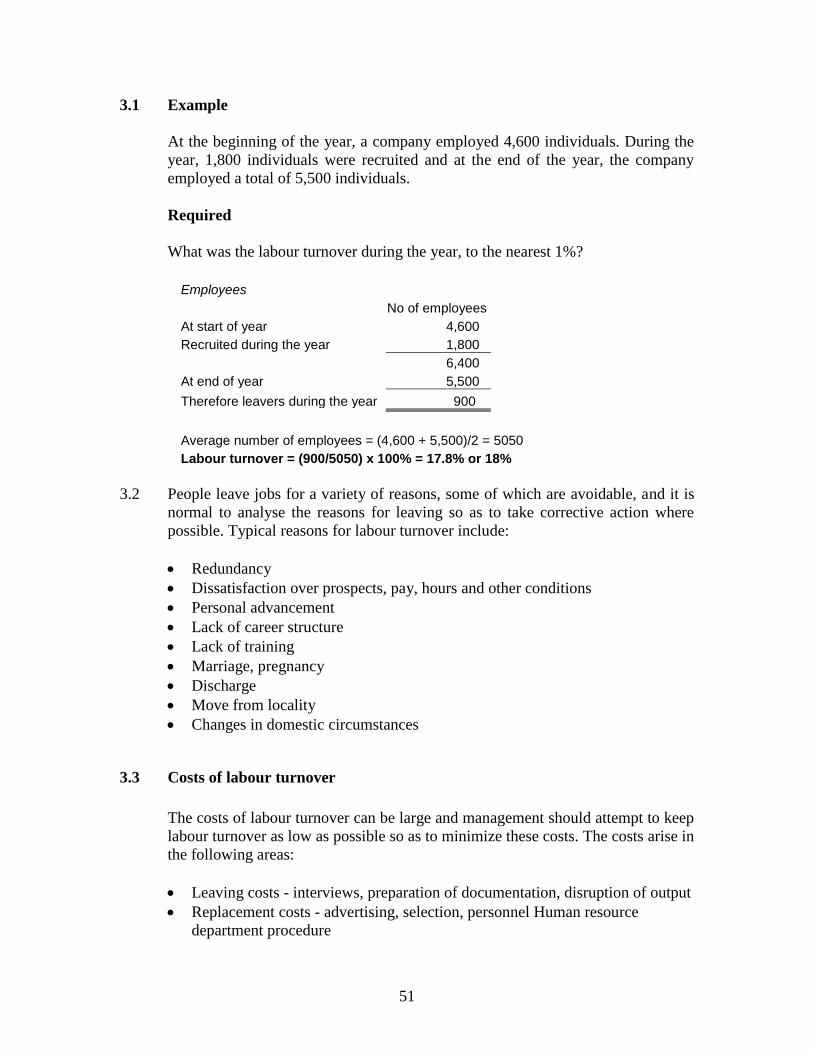
3.1 Example
At the beginning of the year, a company employed 4,600 individuals. During the
year, 1,800 individuals were recruited and at the end of the year, the company
employed a total of 5,500 individuals.
Required
What was the labour turnover during the year, to the nearest 1%?
Employees
No of employees
At start of year 4,600
Recruited during the year 1,800
6,400
At end of year 5,500
Therefore leavers during the year 900
Average number of employees = (4,600 + 5,500)/2 = 5050
Labour turnover = (900/5050) x 100% = 17.8% or 18%
3.2 People leave jobs for a variety of reasons, some of which are avoidable, and it is
normal to analyse the reasons for leaving so as to take corrective action where
possible. Typical reasons for labour turnover include:
Redundancy
Dissatisfaction over prospects, pay, hours and other conditions
Personal advancement
Lack of career structure
Lack of training
Marriage, pregnancy
Discharge
Move from locality
Changes in domestic circumstances
3.3 Costs of labour turnover
The costs of labour turnover can be large and management should attempt to keep
labour turnover as low as possible so as to minimize these costs. The costs arise in
the following areas:
Leaving costs - interviews, preparation of documentation, disruption of output
Replacement costs - advertising, selection, personnel Human resource
department procedure
52
Training costs - costs of required internal and external courses
Learning costs - slower initial production, high scrap rate, tool breakages,
increased accident rate, poor service.
3.4 The prevention of high labour turnover
Following actions could reduce labour turnover:
Paying satisfactory wages
Offering satisfactory hours and conditions of service
Creating good informal relationship between members of staff
Offering good training schemes and a well understood career or promotional
ladder
Improving the content of the job to create job satisfaction
Improving human resource planning to avoid redundancies
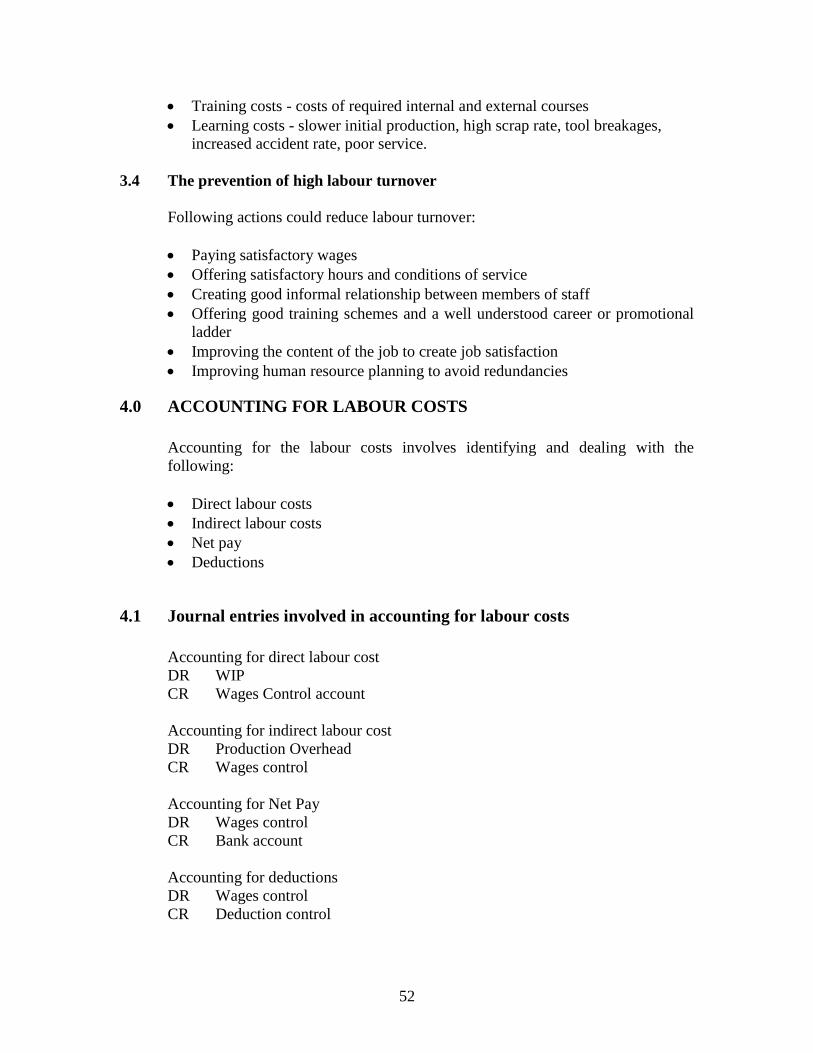
4.0 ACCOUNTING FOR LABOUR COSTS
Accounting for the labour costs involves identifying and dealing with the
following:
Direct labour costs
Indirect labour costs
Net pay
Deductions
4.1 Journal entries involved in accounting for labour costs
Accounting for direct labour cost
DR WIP
CR Wages Control account
Accounting for indirect labour cost
DR Production Overhead
CR Wages control
Accounting for Net Pay
DR Wages control
CR Bank account
Accounting for deductions
DR Wages control
CR Deduction control
53
5.0 DIRECT AND INDIRECT LABOUR COSTS
Employees can be classified as either direct labour or indirect labour. Direct
labour means employees who are directly involved in producing goods or services
for customers.
Indirect employees refer to employees who are not directly involved in this work.
Examples of indirect employees in a manufacturing business are:
Staff working in administration, selling or distribution
Employees in production support departments such as maintenance
and planning
The aim of cost accounting is to identify direct labour costs and indirect labour
costs which is not the same thing as the cost of direct labour and indirect labour
employees.
5.1 Identifying direct and indirect labour costs
All costs of indirect labour employees are indirect labour costs.
Not all the costs of direct labour employees are treated as direct. Costs of
direct labour employees that are usually treated as indirect costs are:
- The cost of idle time
- The cost of overtime premium
- Costs of labour time not spent in production such as when one is
on training, sick or holiday.
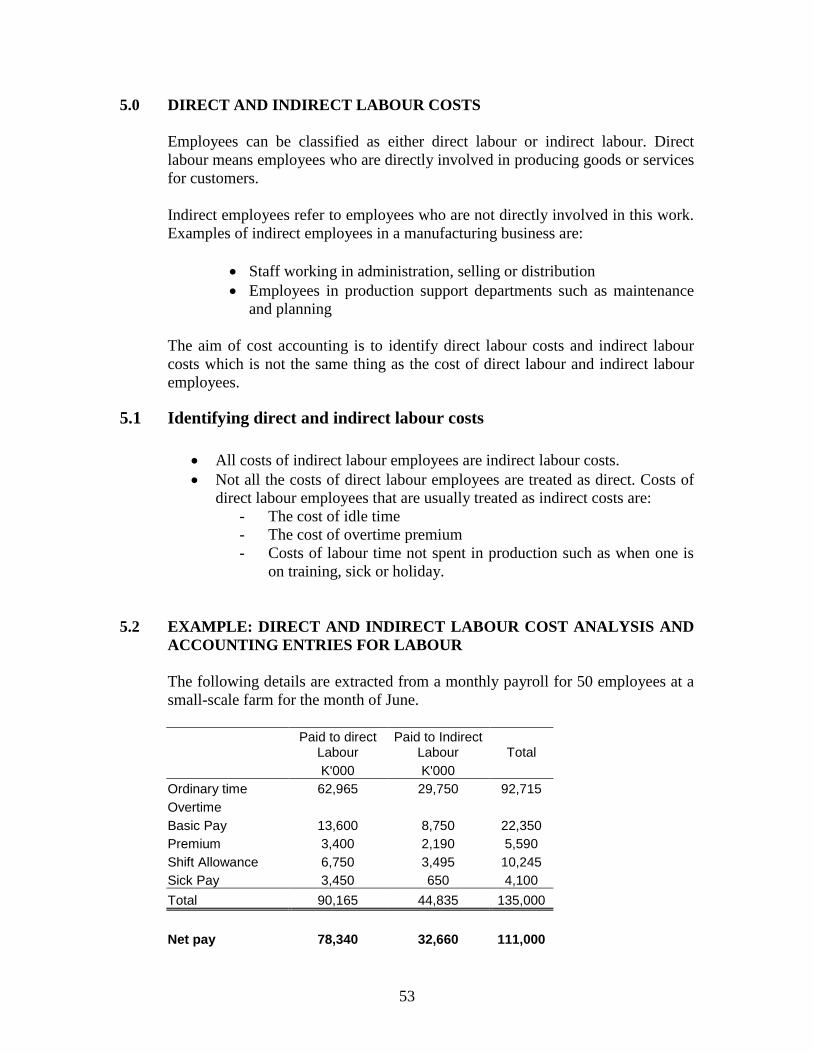
5.2 EXAMPLE: DIRECT AND INDIRECT LABOUR COST ANALYSIS AND
ACCOUNTING ENTRIES FOR LABOUR
The following details are extracted from a monthly payroll for 50 employees at a
small-scale farm for the month of June.
Paid to direct
Labour Paid to Indirect
Labour Total
K'000 K'000
Ordinary time 62,965 29,750 92,715
Overtime
Basic Pay 13,600 8,750 22,350
Premium 3,400 2,190 5,590
Shift Allowance 6,750 3,495 10,245
Sick Pay 3,450 650 4,100
Total 90,165 44,835 135,000
Net pay 78,340 32,660 111,000
54
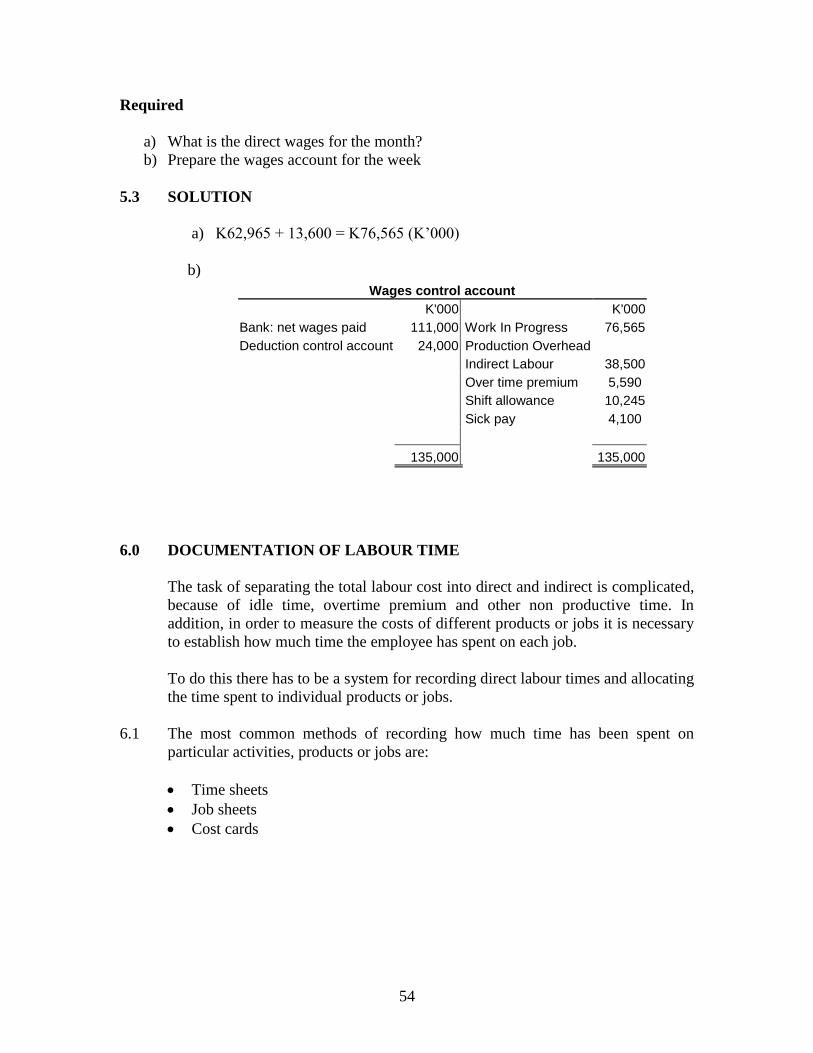
Required
a) What is the direct wages for the month?
b) Prepare the wages account for the week
5.3 SOLUTION
a) K62,965 + 13,600 = K76,565 (K’000)
b)
Wages control account
K'000 K'000
Bank: net wages paid 111,000 Work In Progress 76,565
Deduction control account 24,000 Production Overhead
Indirect Labour 38,500
Over time premium 5,590
Shift allowance 10,245
Sick pay 4,100
135,000 135,000
6.0 DOCUMENTATION OF LABOUR TIME
The task of separating the total labour cost into direct and indirect is complicated,
because of idle time, overtime premium and other non productive time. In
addition, in order to measure the costs of different products or jobs it is necessary
to establish how much time the employee has spent on each job.
To do this there has to be a system for recording direct labour times and allocating
the time spent to individual products or jobs.
6.1 The most common methods of recording how much time has been spent on
particular activities, products or jobs are:
Time sheets
Job sheets
Cost cards
55
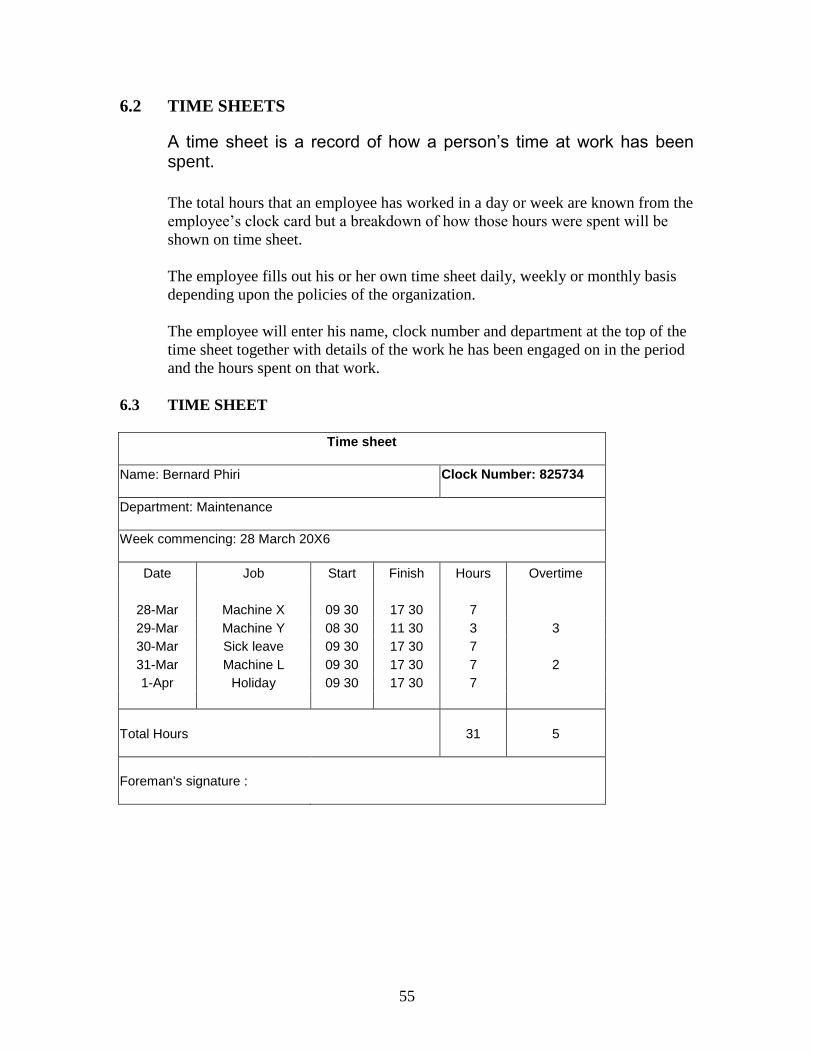
6.2 TIME SHEETS
A time sheet is a record of how a person’s time at work has been spent.
The total hours that an employee has worked in a day or week are known from the
employee’s clock card but a breakdown of how those hours were spent will be
shown on time sheet.
The employee fills out his or her own time sheet daily, weekly or monthly basis
depending upon the policies of the organization.
The employee will enter his name, clock number and department at the top of the
time sheet together with details of the work he has been engaged on in the period
and the hours spent on that work.
6.3 TIME SHEET
Time sheet
Name: Bernard Phiri
Clock Number: 825734
Department: Maintenance
Week commencing: 28 March 20X6
Date Job Start Finish Hours Overtime
28-Mar Machine X 09 30 17 30 7
29-Mar Machine Y 08 30 11 30 3 3
30-Mar Sick leave 09 30 17 30 7
31-Mar Machine L 09 30 17 30 7 2
1-Apr Holiday 09 30 17 30 7
Total Hours
31
5
Foreman's signature :
56
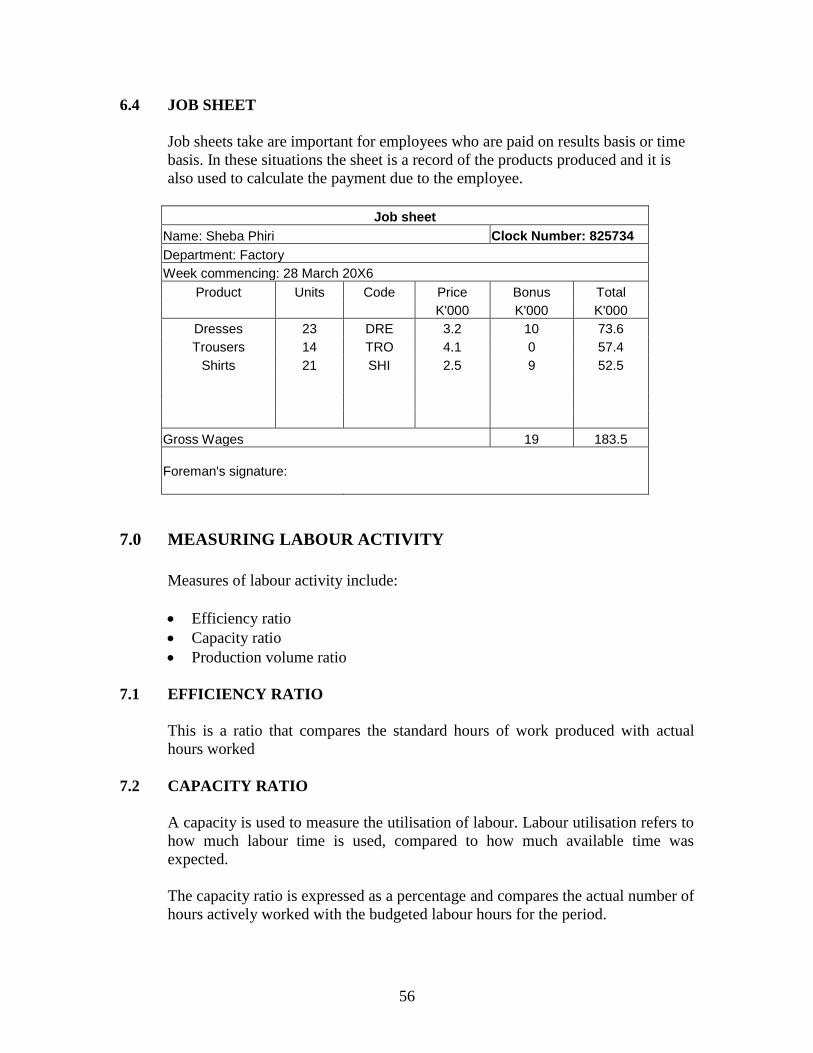
6.4 JOB SHEET
Job sheets take are important for employees who are paid on results basis or time
basis. In these situations the sheet is a record of the products produced and it is
also used to calculate the payment due to the employee.
Job sheet
Name: Sheba Phiri Clock Number: 825734
Department: Factory
Week commencing: 28 March 20X6
Product Units Code Price Bonus Total
K'000 K'000 K'000
Dresses 23 DRE 3.2 10 73.6
Trousers 14 TRO 4.1 0 57.4
Shirts 21 SHI 2.5 9 52.5
Gross Wages 19 183.5
Foreman's signature:
7.0 MEASURING LABOUR ACTIVITY
Measures of labour activity include:
Efficiency ratio
Capacity ratio
Production volume ratio
7.1 EFFICIENCY RATIO
This is a ratio that compares the standard hours of work produced with actual
hours worked
7.2 CAPACITY RATIO
A capacity is used to measure the utilisation of labour. Labour utilisation refers to
how much labour time is used, compared to how much available time was
expected.
The capacity ratio is expressed as a percentage and compares the actual number of
hours actively worked with the budgeted labour hours for the period.
57
7.3 PRODUCTION VOLUME RATIO
The production/volume ratio assesses how the overall production level compares
to planned levels and is the product of the efficiency ratio and the capacity ratio.
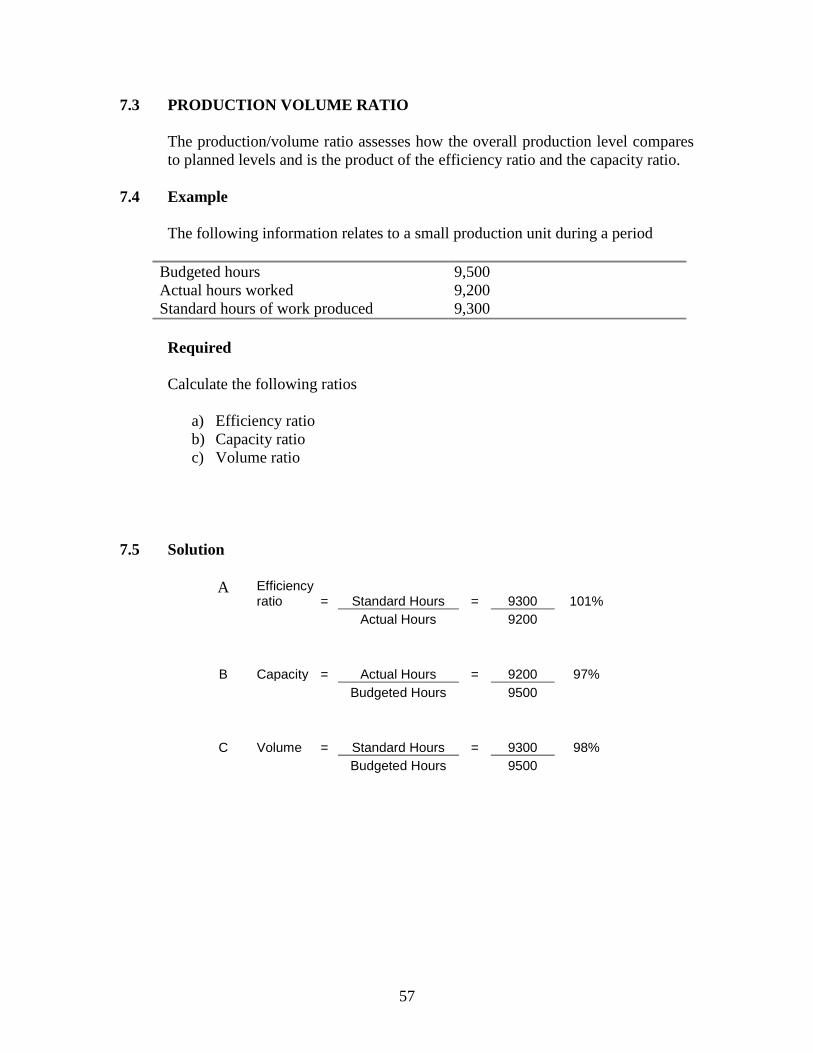
7.4 Example
The following information relates to a small production unit during a period
Budgeted hours 9,500
Actual hours worked 9,200
Standard hours of work produced 9,300
Required
Calculate the following ratios
a) Efficiency ratio
b) Capacity ratio
c) Volume ratio
7.5 Solution
A Efficiency ratio = Standard Hours = 9300 101%
Actual Hours 9200
B Capacity = Actual Hours = 9200 97%
Budgeted Hours 9500
C Volume = Standard Hours = 9300 98%
Budgeted Hours 9500
58
Chapter summary
There are three basic groups of remuneration methods time based, piece work and
bonus/incentive schemes.
Labour attendance time is recorded on for example an attendance record or clock
card. Job time may be recorded on time sheets or job sheets
Overtime is time that is paid for usually at a premium, over and above the basic
hours for the period
Labour turnover is the rate at which employees leave a company and this rate
must be kept as low as possible. The cost of labour turnover can be divided into
preventative and replacement costs
Direct labour cost is the cost of labour that is directly attributable to a cost unit. It
consist of the cost of direct labour spent actively working on production, but
usually excludes any over time premium payments
Indirect labour cost or labour overheads consist of the labour cost of indirect
workers plus indirect labour costs of direct workers
The wages control account acts as a collecting place for wages before they are
analysed to work in progress and production overhead control account.
Efficiency ratio compares the expected time for producing output compared with
the actual time expressed as a percentage.
Capacity ratio compares the actual time worked with budgeted time for the period
expressed as a percentage.
59
STUDENT-SELF TESTING
SELF REVIEW QUESTIONS
1. Mention 3 remuneration methods (1.0)
2. What is overtime premium (1.22)
3. What is the high day rate systems (1.23)
4. What is differential piece work system (2.4)
5. What is labour turnover (3.0)
6. Mention some costs of labour turnover (3.3)
7. Mention 3 ratios used to measure labour activity (7.0)
EXAMINATION TYPE QUESTIONS
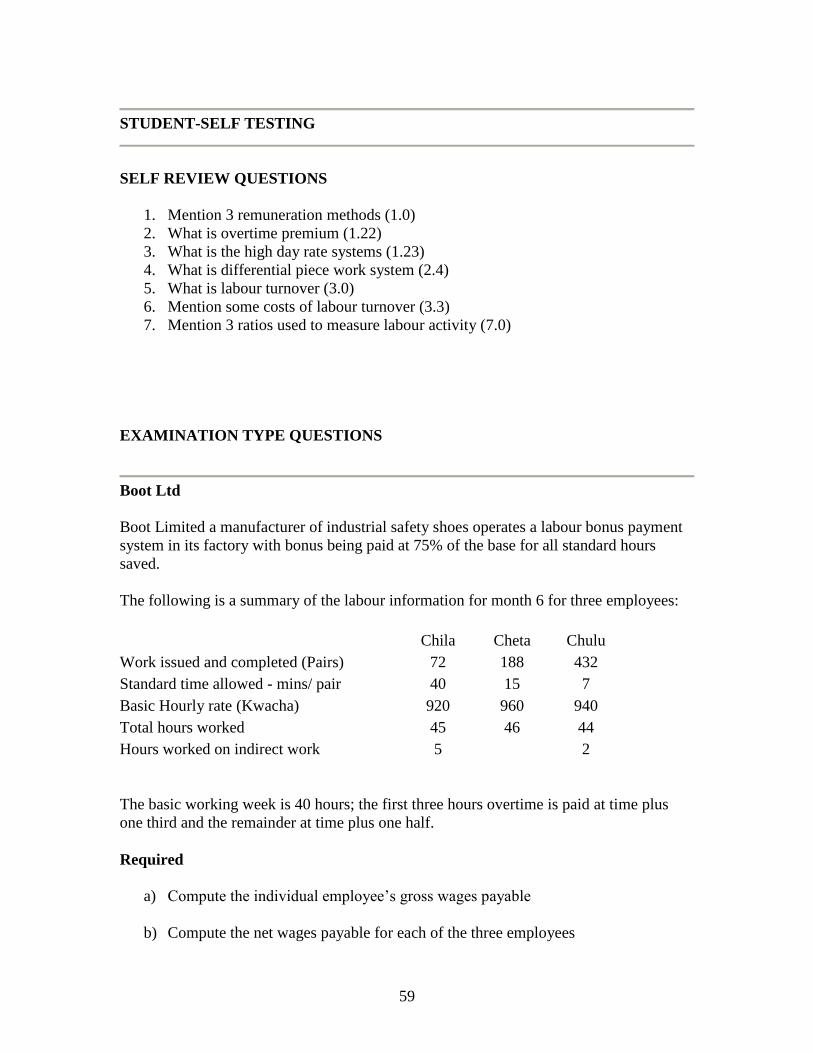
Boot Ltd
Boot Limited a manufacturer of industrial safety shoes operates a labour bonus payment
system in its factory with bonus being paid at 75% of the base for all standard hours
saved.
The following is a summary of the labour information for month 6 for three employees:
Chila Cheta Chulu
Work issued and completed (Pairs) 72 188 432
Standard time allowed - mins/ pair 40 15 7
Basic Hourly rate (Kwacha) 920 960 940
Total hours worked 45 46 44
Hours worked on indirect work 5 2
The basic working week is 40 hours; the first three hours overtime is paid at time plus
one third and the remainder at time plus one half.
Required
a) Compute the individual employee’s gross wages payable
b) Compute the net wages payable for each of the three employees
60
c) Prepare journal entries for the above data taking into account the following
additional factors:
Taxation is at the rate of 30% of gross pay
Each employee pays K3000 as NAPSA
Each employee is a member of Mukuba Pension Scheme to which they
contribute K2,500 monthly
Check for answers at the end of the text
61
CHAPTER 7
OVERHEADS AND ABSORPTION COSTING
INTRODUCTION
In the previous two chapters we have demonstrated how to attribute material and labour
costs to units of production or services provided by an organization. This chapter
proceeds to explain the process involved in attributing indirect costs to products and
services using a system known as absorption costing.
CONTENTS
1. Product costs and service costs.
2. Overheads
3. Overhead allocation
4. Overhead apportionment
5. Overhead absorption
6. Over and under absorption of overheads
7. Non-production overheads
8. Ledger entries relating to overheads
LEARNING OUTCOMES
After studying this chapter you should be able to:
Explain the reason for using absorption costing
Describe the process of allocation, apportionment, re-apportionment and
absorption to establish product cost in absorption costing
Calculate overhead absorption rates
Calculate costs using the absorption costing method
Explain why predetermined overheads absorption rates are used
Calculate the under/over absorption costs
Describe and apply methods of charging administration overheads and sales and
distribution overheads to cost unit
62
1.0 PRODUCT COSTS AND SERVICE COSTS
1.1 Commercial organisations either sell products or provide services and they should
know how much it costs them to provide these services and products in order to
do the following:
Carry out product profitability analysis.
Price products and services.
Value stocks.
1.2 Costs incurred in business can be recorded as:
Direct materials
Direct labour
Direct expenses
Overheads
2.0 OVERHEADS
An overhead is the cost incurred in the making of a product, providing a service
or running a department, but which cannot be traced directly and in full to the
product, service or department.
An overhead is actually the total of the following:
Indirect material
Indirect labour
Indirect expenses
Indirect costs are usually classified by function as shown below:
Production overhead
Administration overheads
Selling and distribution overheads
2.1 PRODUCTION OVERHEADS
Production overheads represent indirect materials, indirect wages and indirect
expenses attributable to production and also the service activities associated with
production.
63
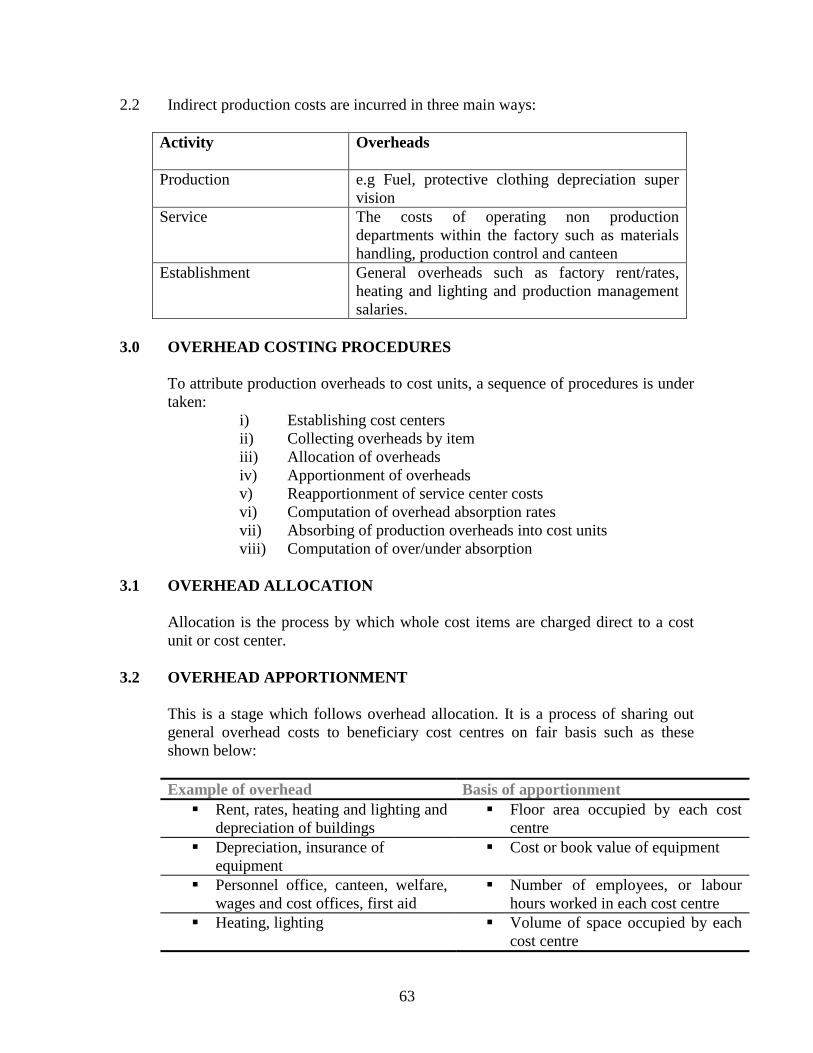
2.2 Indirect production costs are incurred in three main ways:
Activity Overheads
Production e.g Fuel, protective clothing depreciation super
vision
Service The costs of operating non production
departments within the factory such as materials
handling, production control and canteen
Establishment General overheads such as factory rent/rates,
heating and lighting and production management
salaries.
3.0 OVERHEAD COSTING PROCEDURES
To attribute production overheads to cost units, a sequence of procedures is under
taken:
i) Establishing cost centers
ii) Collecting overheads by item
iii) Allocation of overheads
iv) Apportionment of overheads
v) Reapportionment of service center costs
vi) Computation of overhead absorption rates
vii) Absorbing of production overheads into cost units
viii) Computation of over/under absorption
3.1 OVERHEAD ALLOCATION
Allocation is the process by which whole cost items are charged direct to a cost
unit or cost center.
3.2 OVERHEAD APPORTIONMENT
This is a stage which follows overhead allocation. It is a process of sharing out
general overhead costs to beneficiary cost centres on fair basis such as these
shown below:
Example of overhead Basis of apportionment
Rent, rates, heating and lighting and
depreciation of buildings
Floor area occupied by each cost
centre
Depreciation, insurance of
equipment
Cost or book value of equipment
Personnel office, canteen, welfare,
wages and cost offices, first aid
Number of employees, or labour
hours worked in each cost centre
Heating, lighting Volume of space occupied by each
cost centre
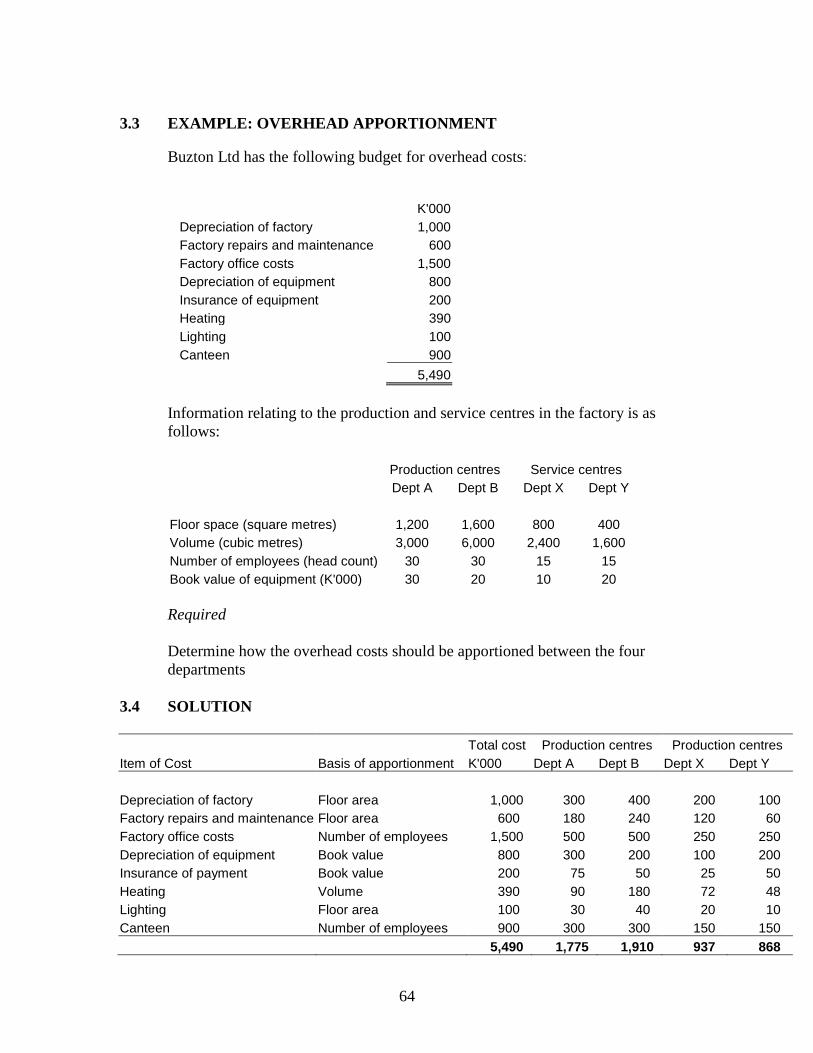
64
3.3 EXAMPLE: OVERHEAD APPORTIONMENT
Buzton Ltd has the following budget for overhead costs:
K'000
Depreciation of factory 1,000
Factory repairs and maintenance 600
Factory office costs 1,500
Depreciation of equipment 800
Insurance of equipment 200
Heating 390
Lighting 100
Canteen 900
5,490
Information relating to the production and service centres in the factory is as
follows:
Production centres Service centres
Dept A Dept B Dept X Dept Y
Floor space (square metres) 1,200 1,600 800 400
Volume (cubic metres) 3,000 6,000 2,400 1,600
Number of employees (head count) 30 30 15 15
Book value of equipment (K'000) 30 20 10 20
Required
Determine how the overhead costs should be apportioned between the four
departments
3.4 SOLUTION
Total cost Production centres Production centres
Item of Cost Basis of apportionment K'000 Dept A Dept B Dept X Dept Y
Depreciation of factory Floor area 1,000 300 400 200 100
Factory repairs and maintenance Floor area 600 180 240 120 60
Factory office costs Number of employees 1,500 500 500 250 250
Depreciation of equipment Book value 800 300 200 100 200
Insurance of payment Book value 200 75 50 25 50
Heating Volume 390 90 180 72 48
Lighting Floor area 100 30 40 20 10
Canteen Number of employees 900 300 300 150 150
5,490 1,775 1,910 937 868
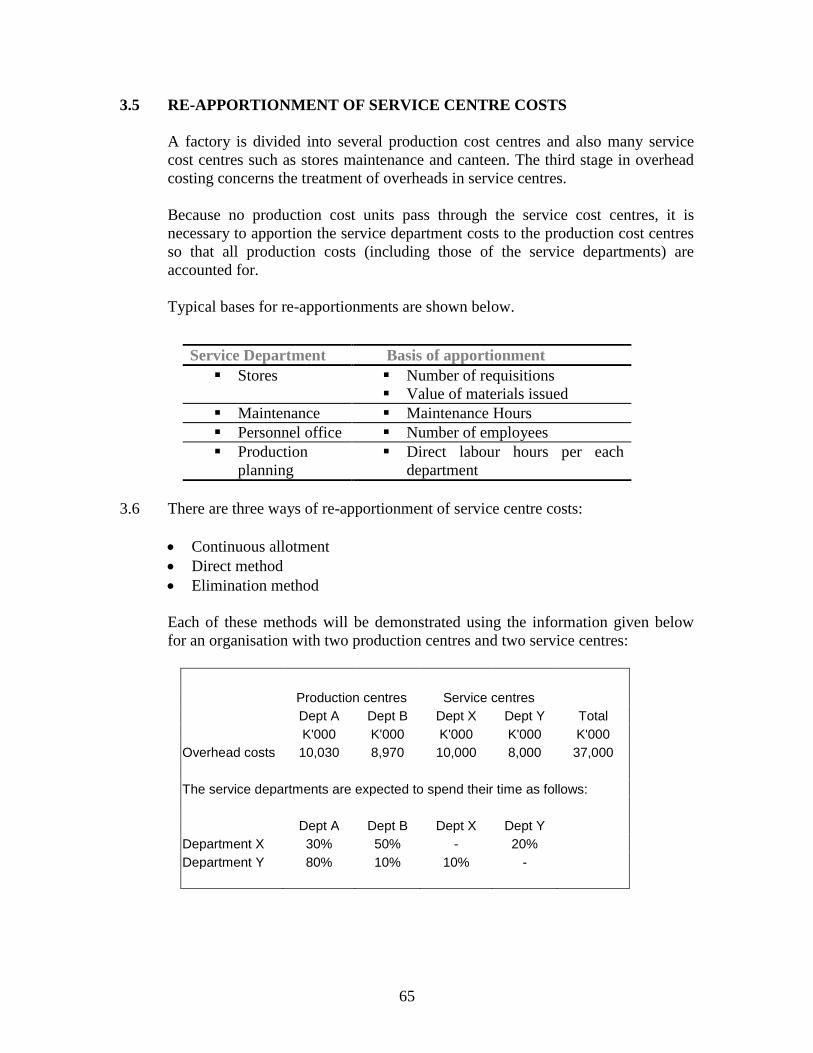
65
3.5 RE-APPORTIONMENT OF SERVICE CENTRE COSTS
A factory is divided into several production cost centres and also many service
cost centres such as stores maintenance and canteen. The third stage in overhead
costing concerns the treatment of overheads in service centres.
Because no production cost units pass through the service cost centres, it is
necessary to apportion the service department costs to the production cost centres
so that all production costs (including those of the service departments) are
accounted for.
Typical bases for re-apportionments are shown below.
3.6 There are three ways of re-apportionment of service centre costs:
Continuous allotment
Direct method
Elimination method
Each of these methods will be demonstrated using the information given below
for an organisation with two production centres and two service centres:
Production centres Service centres
Dept A Dept B Dept X Dept Y Total
K'000 K'000 K'000 K'000 K'000
Overhead costs 10,030 8,970 10,000 8,000 37,000
The service departments are expected to spend their time as follows:
Dept A Dept B Dept X Dept Y
Department X 30% 50% - 20%
Department Y 80% 10% 10% -
Service Department Basis of apportionment
Stores Number of requisitions
Value of materials issued
Maintenance Maintenance Hours
Personnel office Number of employees
Production
planning
Direct labour hours per each
department
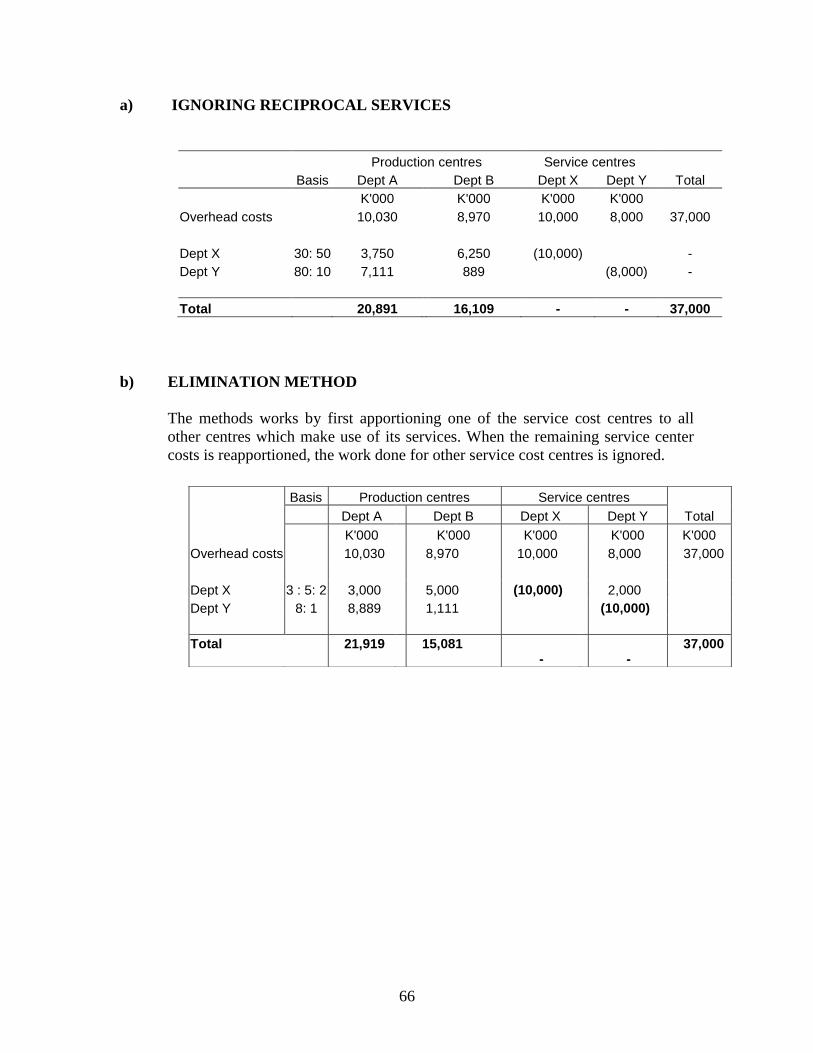
66
a) IGNORING RECIPROCAL SERVICES
Production centres Service centres
Basis Dept A Dept B Dept X Dept Y Total
K'000 K'000 K'000 K'000
Overhead costs 10,030 8,970 10,000 8,000 37,000
Dept X 30: 50 3,750 6,250 (10,000) -
Dept Y 80: 10 7,111 889 (8,000) -
Total 20,891 16,109 - - 37,000
b) ELIMINATION METHOD
The methods works by first apportioning one of the service cost centres to all
other centres which make use of its services. When the remaining service center
costs is reapportioned, the work done for other service cost centres is ignored.
Basis Production centres Service centres
Dept A Dept B Dept X Dept Y Total
K'000 K'000 K'000 K'000 K'000
Overhead costs 10,030 8,970 10,000 8,000 37,000
Dept X 3 : 5: 2 3,000 5,000 (10,000) 2,000
Dept Y 8: 1 8,889 1,111 (10,000)
Total
21,919
15,081 - -
37,000
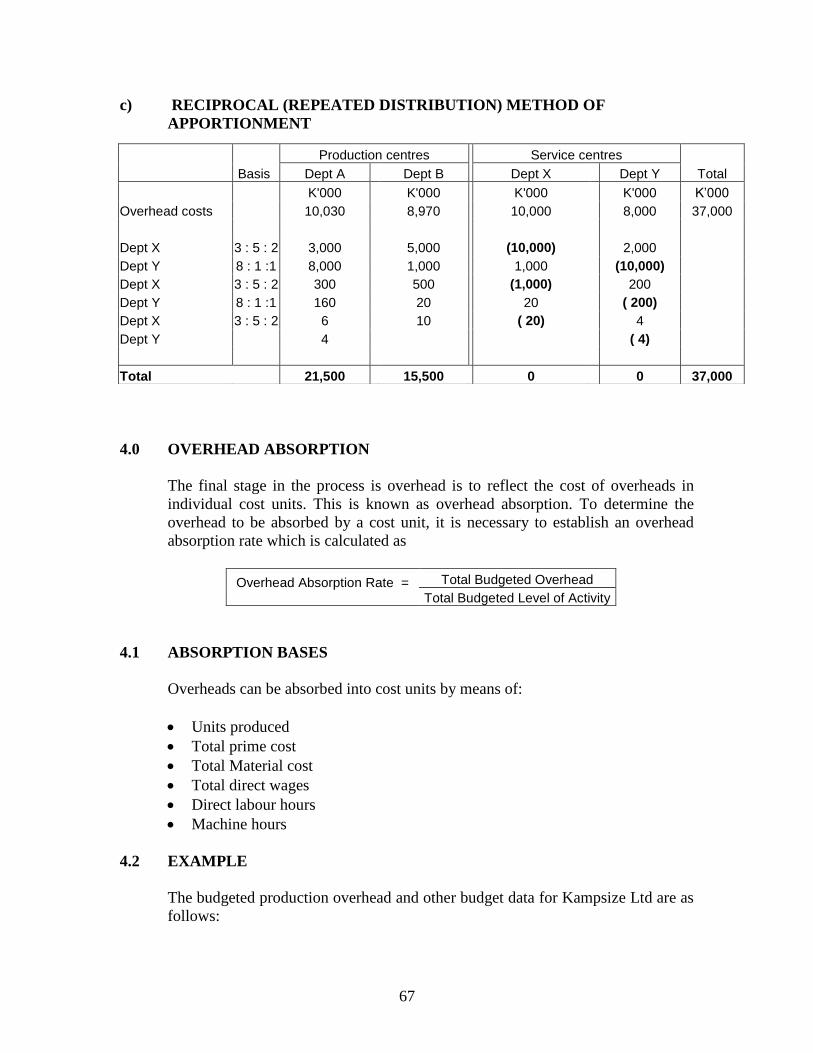
67
c) RECIPROCAL (REPEATED DISTRIBUTION) METHOD OF
APPORTIONMENT
4.0 OVERHEAD ABSORPTION
The final stage in the process is overhead is to reflect the cost of overheads in
individual cost units. This is known as overhead absorption. To determine the
overhead to be absorbed by a cost unit, it is necessary to establish an overhead
absorption rate which is calculated as
Overhead Absorption Rate =
Total Budgeted Overhead
Total Budgeted Level of Activity
4.1 ABSORPTION BASES
Overheads can be absorbed into cost units by means of:
Units produced
Total prime cost
Total Material cost
Total direct wages
Direct labour hours
Machine hours
4.2 EXAMPLE
The budgeted production overhead and other budget data for Kampsize Ltd are as
follows:
Production centres Service centres
Basis Dept A Dept B Dept X Dept Y Total
K'000 K'000 K'000 K'000 K’000
Overhead costs 10,030 8,970 10,000 8,000 37,000
Dept X 3 : 5 : 2 3,000 5,000 (10,000) 2,000
Dept Y 8 : 1 :1 8,000 1,000 1,000 (10,000)
Dept X 3 : 5 : 2 300 500 (1,000) 200
Dept Y 8 : 1 :1 160 20 20 ( 200)
Dept X 3 : 5 : 2 6 10 ( 20) 4
Dept Y 4 ( 4)
Total 21,500 15,500 0 0 37,000
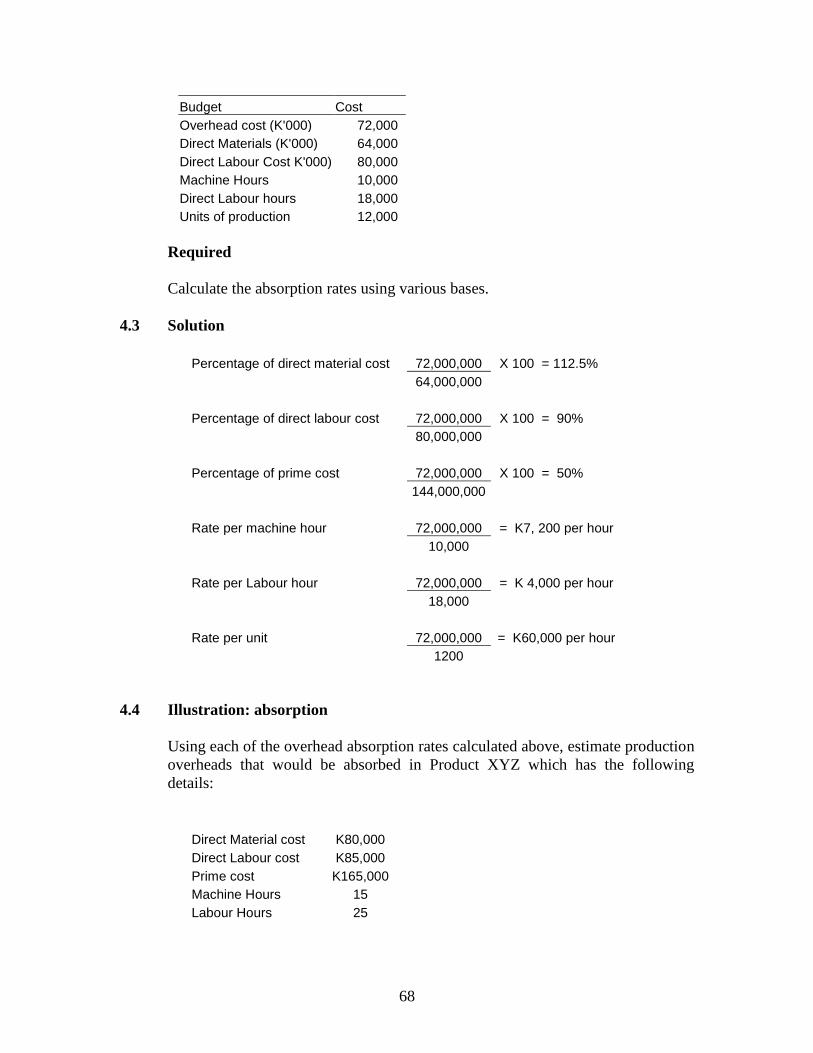
68
Budget Cost
Overhead cost (K'000) 72,000
Direct Materials (K'000) 64,000
Direct Labour Cost K'000) 80,000
Machine Hours 10,000
Direct Labour hours 18,000
Units of production 12,000
Required
Calculate the absorption rates using various bases.
4.3 Solution
Percentage of direct material cost 72,000,000 X 100 = 112.5%
64,000,000
Percentage of direct labour cost 72,000,000 X 100 = 90%
80,000,000
Percentage of prime cost 72,000,000 X 100 = 50%
144,000,000
Rate per machine hour 72,000,000 = K7, 200 per hour
10,000
Rate per Labour hour 72,000,000 = K 4,000 per hour
18,000
Rate per unit 72,000,000 = K60,000 per hour
1200
4.4 Illustration: absorption
Using each of the overhead absorption rates calculated above, estimate production
overheads that would be absorbed in Product XYZ which has the following
details:
Direct Material cost K80,000
Direct Labour cost K85,000
Prime cost K165,000
Machine Hours 15
Labour Hours 25
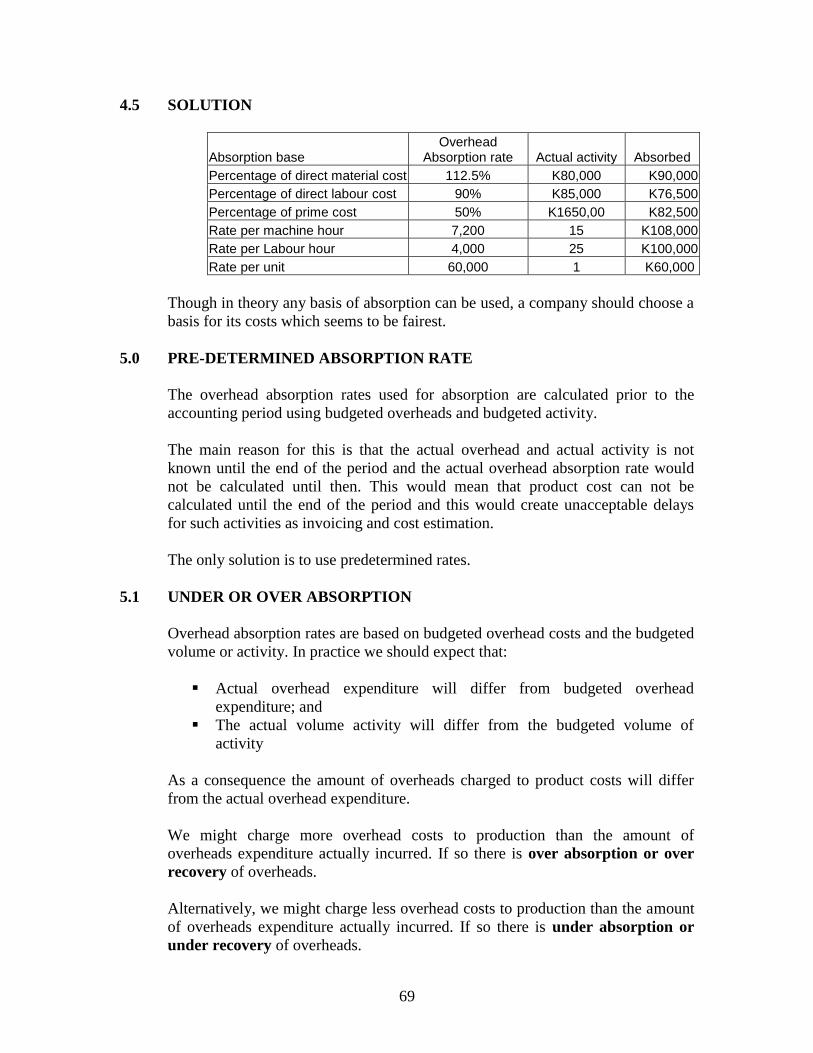
69
4.5 SOLUTION
Absorption base Overhead
Absorption rate Actual activity Absorbed
Percentage of direct material cost 112.5% K80,000 K90,000
Percentage of direct labour cost 90% K85,000 K76,500
Percentage of prime cost 50% K1650,00 K82,500
Rate per machine hour 7,200 15 K108,000
Rate per Labour hour 4,000 25 K100,000
Rate per unit 60,000 1 K60,000
Though in theory any basis of absorption can be used, a company should choose a
basis for its costs which seems to be fairest.
5.0 PRE-DETERMINED ABSORPTION RATE
The overhead absorption rates used for absorption are calculated prior to the
accounting period using budgeted overheads and budgeted activity.
The main reason for this is that the actual overhead and actual activity is not
known until the end of the period and the actual overhead absorption rate would
not be calculated until then. This would mean that product cost can not be
calculated until the end of the period and this would create unacceptable delays
for such activities as invoicing and cost estimation.
The only solution is to use predetermined rates.
5.1 UNDER OR OVER ABSORPTION
Overhead absorption rates are based on budgeted overhead costs and the budgeted
volume or activity. In practice we should expect that:
Actual overhead expenditure will differ from budgeted overhead
expenditure; and
The actual volume activity will differ from the budgeted volume of
activity
As a consequence the amount of overheads charged to product costs will differ
from the actual overhead expenditure.
We might charge more overhead costs to production than the amount of
overheads expenditure actually incurred. If so there is over absorption or over
recovery of overheads.
Alternatively, we might charge less overhead costs to production than the amount
of overheads expenditure actually incurred. If so there is under absorption or
under recovery of overheads.
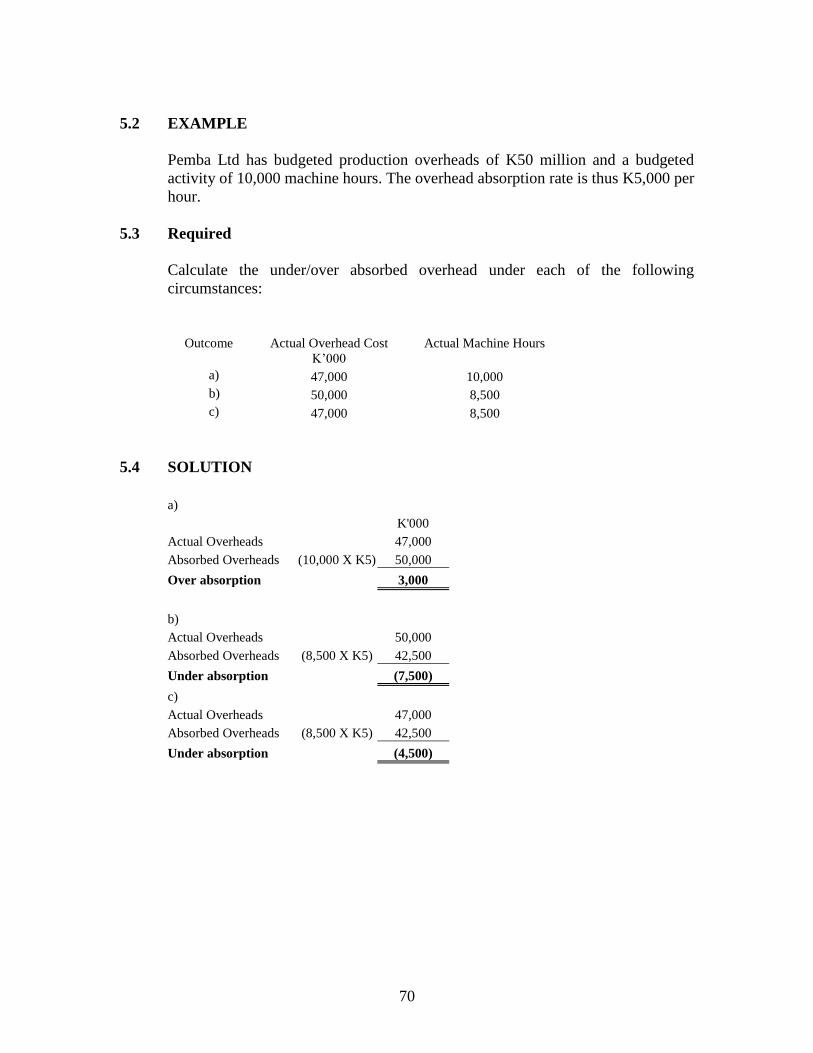
70
5.2 EXAMPLE
Pemba Ltd has budgeted production overheads of K50 million and a budgeted
activity of 10,000 machine hours. The overhead absorption rate is thus K5,000 per
hour.
5.3 Required
Calculate the under/over absorbed overhead under each of the following
circumstances:
Outcome Actual Overhead Cost
K’000
Actual Machine Hours
a) 47,000 10,000
b) 50,000 8,500
c) 47,000 8,500
5.4 SOLUTION
a)
K'000
Actual Overheads 47,000
Absorbed Overheads (10,000 X K5) 50,000
Over absorption 3,000
b)
Actual Overheads 50,000
Absorbed Overheads (8,500 X K5) 42,500
Under absorption (7,500)
c)
Actual Overheads 47,000
Absorbed Overheads (8,500 X K5) 42,500
Under absorption (4,500)
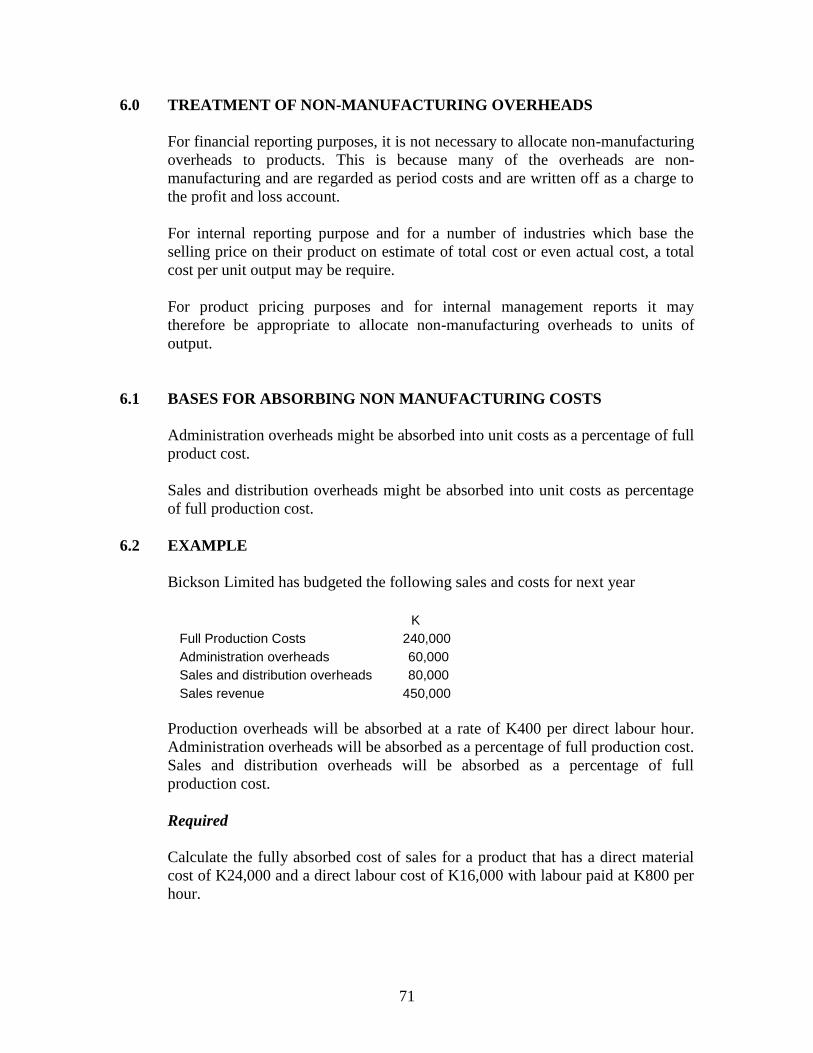
71
6.0 TREATMENT OF NON-MANUFACTURING OVERHEADS
For financial reporting purposes, it is not necessary to allocate non-manufacturing
overheads to products. This is because many of the overheads are non-
manufacturing and are regarded as period costs and are written off as a charge to
the profit and loss account.
For internal reporting purpose and for a number of industries which base the
selling price on their product on estimate of total cost or even actual cost, a total
cost per unit output may be require.
For product pricing purposes and for internal management reports it may
therefore be appropriate to allocate non-manufacturing overheads to units of
output.
6.1 BASES FOR ABSORBING NON MANUFACTURING COSTS
Administration overheads might be absorbed into unit costs as a percentage of full
product cost.
Sales and distribution overheads might be absorbed into unit costs as percentage
of full production cost.
6.2 EXAMPLE
Bickson Limited has budgeted the following sales and costs for next year
K
Full Production Costs 240,000
Administration overheads 60,000
Sales and distribution overheads 80,000
Sales revenue 450,000
Production overheads will be absorbed at a rate of K400 per direct labour hour.
Administration overheads will be absorbed as a percentage of full production cost.
Sales and distribution overheads will be absorbed as a percentage of full
production cost.
Required
Calculate the fully absorbed cost of sales for a product that has a direct material
cost of K24,000 and a direct labour cost of K16,000 with labour paid at K800 per
hour.
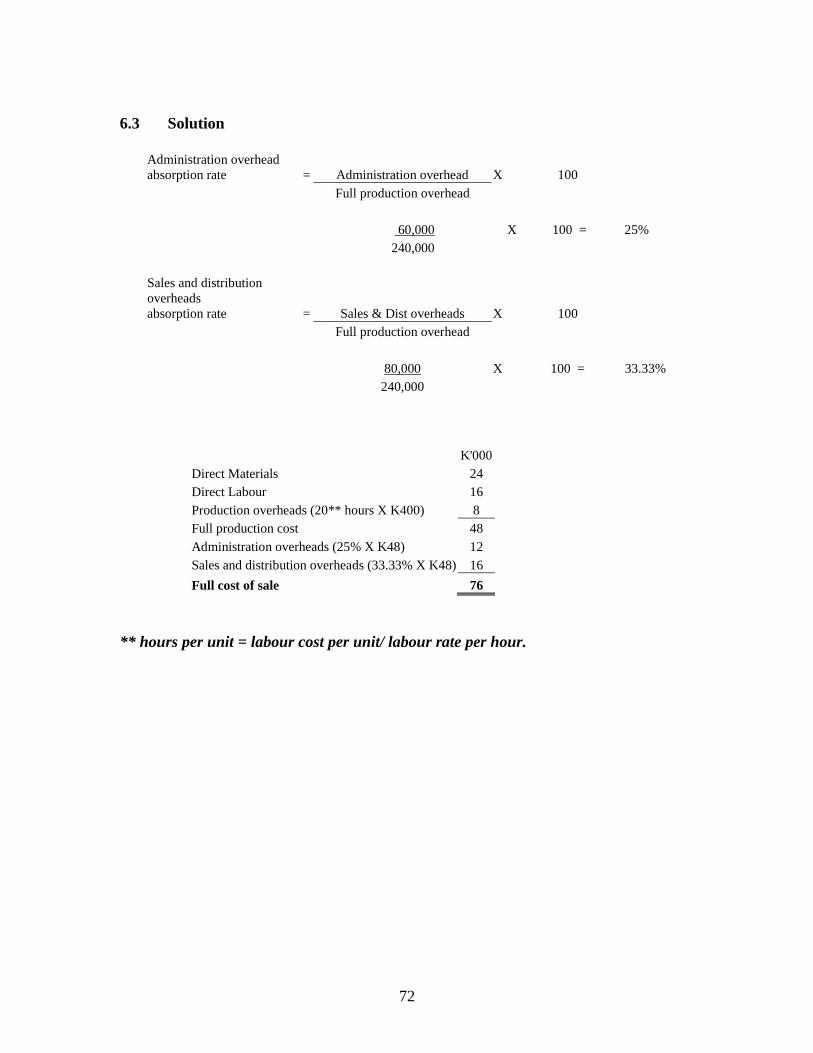
72
6.3 Solution
Administration overhead
absorption rate = Administration overhead X 100
Full production overhead
60,000 X 100 = 25%
240,000
Sales and distribution
overheads
absorption rate = Sales & Dist overheads X 100
Full production overhead
80,000 X 100 = 33.33%
240,000
K'000
Direct Materials 24
Direct Labour 16
Production overheads (20** hours X K400) 8
Full production cost 48
Administration overheads (25% X K48) 12
Sales and distribution overheads (33.33% X K48) 16
Full cost of sale 76
** hours per unit = labour cost per unit/ labour rate per hour.
73
Chapter summary
Overhead is the cost incurred in the course of making a product, providing a
service or running a department, which cannot be traced directly and in full to the
product, service or department.
The main reasons for absorbing overheads into products are for stock valuations,
pricing decisions and product profitability analysis.
The three main stages in absorption costing are:
o Allocation
o Apportionment
o Re-apportionment
o Absorption
Apportionment is the process by which whole cost items are charged directly to a
cost unit or cost centre.
Apportionment is a procedure whereby indirect costs are spread fairly between
costs centres.
Re-apportionment is a procedure where service center costs are spread fairly to
production centres using one of the following methods:
o Direct method
o Reciprocal method
o Step method
Overhead absorption is the process whereby costs of production cost centres are
added to a unit, job or batch costs. Overhead absorption is called overhead
recovery.
Under absorption occurs when the overheads absorbed into the product is less
than overheads incurred. It is charged as an expense in the profit and loss account.
Overhead absorption occurs when the overheads absorbed in the product is
greater than overheads incurred. This amount is credited to the profit and loss
account.
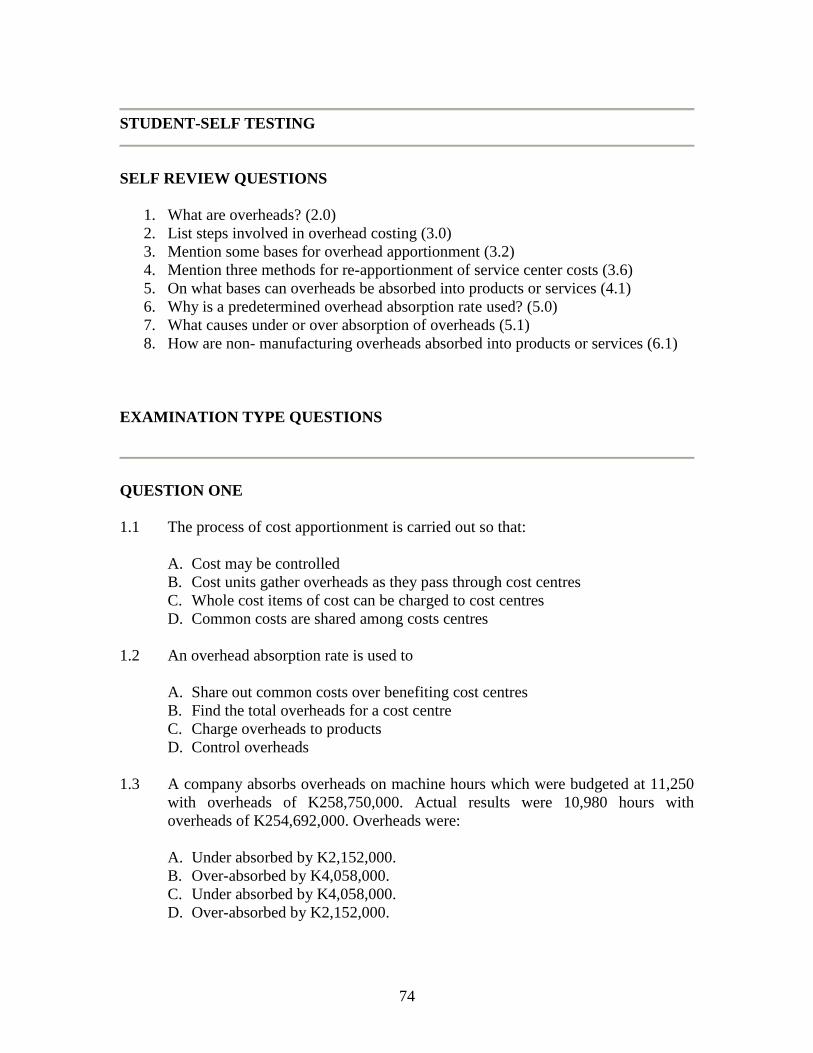
74
STUDENT-SELF TESTING
SELF REVIEW QUESTIONS
1. What are overheads? (2.0)
2. List steps involved in overhead costing (3.0)
3. Mention some bases for overhead apportionment (3.2)
4. Mention three methods for re-apportionment of service center costs (3.6)
5. On what bases can overheads be absorbed into products or services (4.1)
6. Why is a predetermined overhead absorption rate used? (5.0)
7. What causes under or over absorption of overheads (5.1)
8. How are non- manufacturing overheads absorbed into products or services (6.1)
EXAMINATION TYPE QUESTIONS
QUESTION ONE
1.1 The process of cost apportionment is carried out so that:
A. Cost may be controlled
B. Cost units gather overheads as they pass through cost centres
C. Whole cost items of cost can be charged to cost centres
D. Common costs are shared among costs centres
1.2 An overhead absorption rate is used to
A. Share out common costs over benefiting cost centres
B. Find the total overheads for a cost centre
C. Charge overheads to products
D. Control overheads
1.3 A company absorbs overheads on machine hours which were budgeted at 11,250
with overheads of K258,750,000. Actual results were 10,980 hours with
overheads of K254,692,000. Overheads were:
A. Under absorbed by K2,152,000.
B. Over-absorbed by K4,058,000.
C. Under absorbed by K4,058,000.
D. Over-absorbed by K2,152,000.
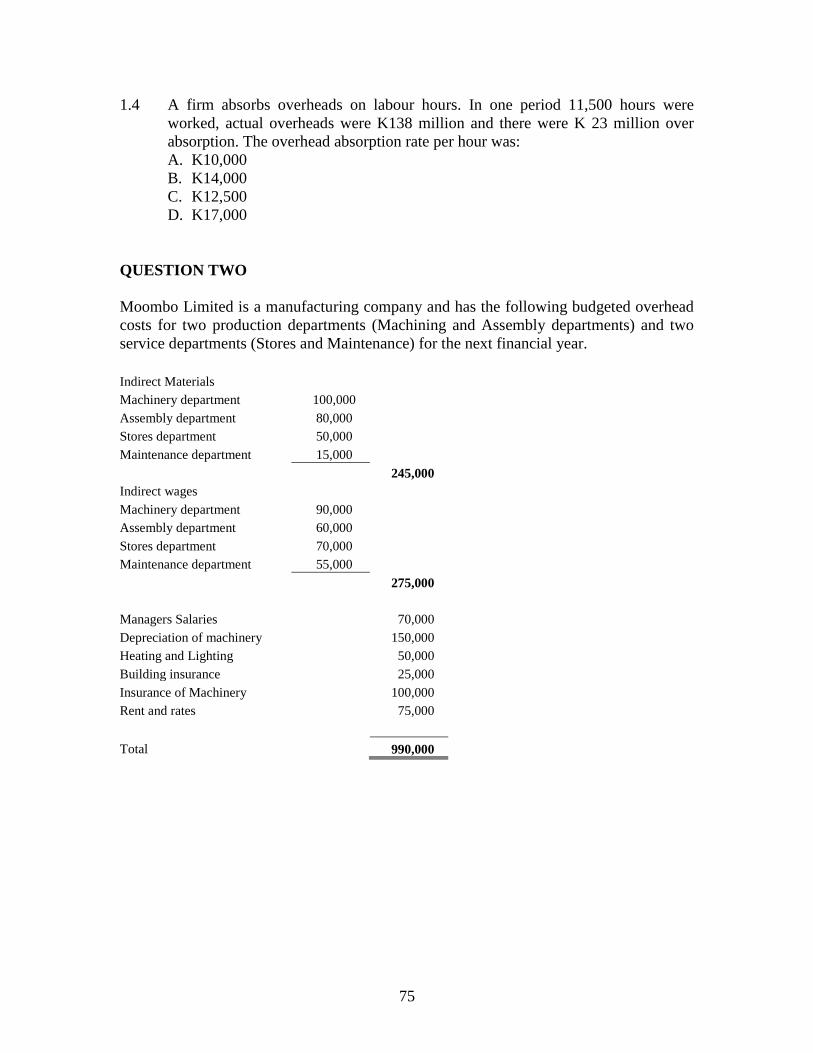
75
1.4 A firm absorbs overheads on labour hours. In one period 11,500 hours were
worked, actual overheads were K138 million and there were K 23 million over
absorption. The overhead absorption rate per hour was:
A. K10,000
B. K14,000
C. K12,500
D. K17,000
QUESTION TWO
Moombo Limited is a manufacturing company and has the following budgeted overhead
costs for two production departments (Machining and Assembly departments) and two
service departments (Stores and Maintenance) for the next financial year.
Indirect Materials
Machinery department 100,000
Assembly department 80,000
Stores department 50,000
Maintenance department 15,000
245,000
Indirect wages
Machinery department 90,000
Assembly department 60,000
Stores department 70,000
Maintenance department 55,000
275,000
Managers Salaries 70,000
Depreciation of machinery 150,000
Heating and Lighting 50,000
Building insurance 25,000
Insurance of Machinery 100,000
Rent and rates 75,000
Total 990,000
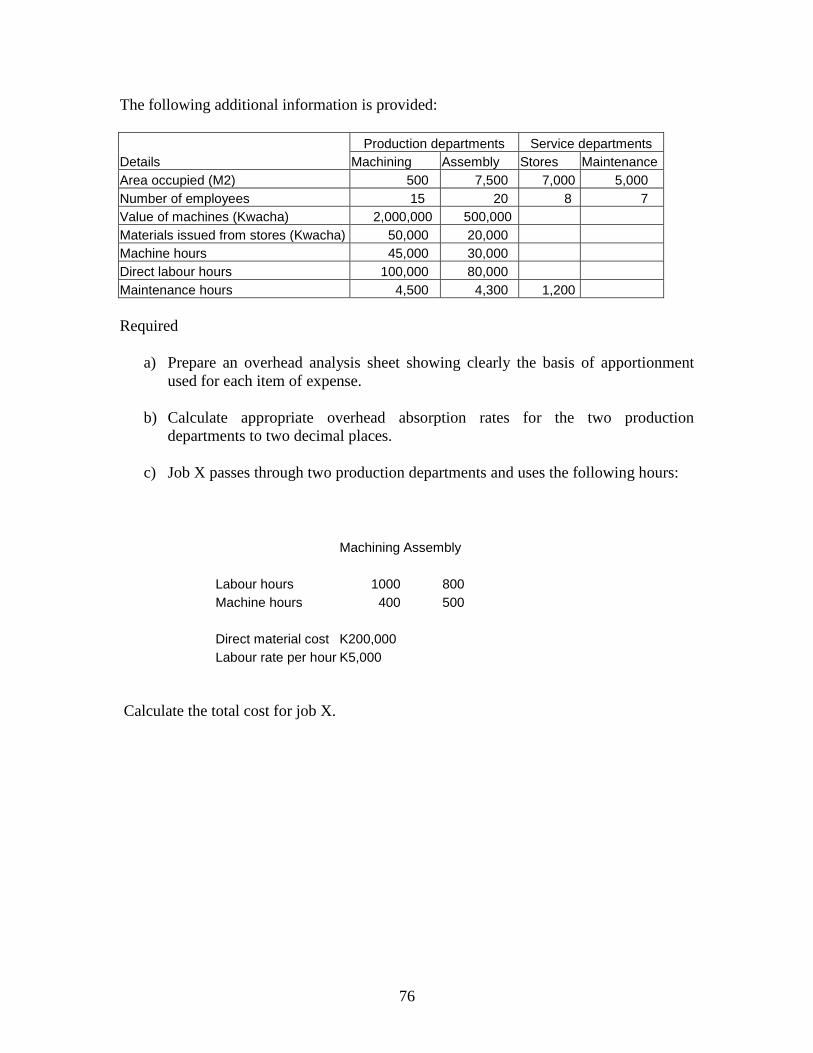
76
The following additional information is provided:
Details
Production departments Service departments
Machining Assembly Stores Maintenance
Area occupied (M2) 500 7,500 7,000 5,000
Number of employees 15 20 8 7
Value of machines (Kwacha) 2,000,000 500,000
Materials issued from stores (Kwacha) 50,000 20,000
Machine hours 45,000 30,000
Direct labour hours 100,000 80,000
Maintenance hours 4,500 4,300 1,200
Required
a) Prepare an overhead analysis sheet showing clearly the basis of apportionment
used for each item of expense.
b) Calculate appropriate overhead absorption rates for the two production
departments to two decimal places.
c) Job X passes through two production departments and uses the following hours:
Machining Assembly
Labour hours 1000 800
Machine hours 400 500
Direct material cost K200,000
Labour rate per hour K5,000
Calculate the total cost for job X.
77
CHAPTER 8
ABSORPTION AND MARGINAL COSTING
Introduction
This chapter defines marginal costing and absorption costing system. As you will learn,
absorption costing recognizes fixed costs as part of a product cost, whereas in marginal
costing fixed costs are treated as period cost. We shall be looking at the arguments in
favour of and against each method. As each method produces a different profit figure, we
shall demonstrate how to reconcile the profit figures.
CONTENTS
1. Full cost and marginal costing.
2. Contribution concept.
3. Profit statements under absorption and marginal costing.
4. Advantages and disadvantages of marginal costing.
5. Advantages and disadvantages of absorption costing.
LEARNING OUTCOMES
After studying this chapter you should be able to:
Define marginal costing.
Explain the concept of contribution.
Prepare profit statements using absorption and marginal costing principles.
Reconcile the profits reported by absorption and marginal costing.
Discuss advantages and disadvantages of absorption and marginal costing
systems.
78
1.0 MARGINAL COST AND MARGINAL COSTING
Marginal cost is the part of the cost of one unit of product or service which would
be avoided if the units were not produced, or which would increase if one extra
unit were produced.
1.1 The marginal production cost per unit of an item usually consists of the following:
Direct materials.
Direct labour.
Variable production overheads.
1.2 Marginal costing
Marginal costing is the accounting system in which variable costs are charged to
cost units and fixed costs of the period is written off in full against the total
contribution.
1.3 Marginal cost of sales
Marginal cost of sales usually include marginal cost of production adjusted for
stock movement plus variable selling costs, which would include items such as
sales commission and possibly some variable distribution costs.
2.0 Principles of marginal costing
The principles of marginal costing are that:
Fixed costs are the same for any volume of activity.
By producing and selling an extra unit or service only the variable cost
increases.
By producing and selling the additional unit, the total profit increase by the
amount of contribution from that unit.
2.1 Based on the above points marginal costing argues that:
The valuation of stock should be at variable production costs (direct materials,
direct labour and direct expenses).
Profit measurement should be based on contribution analysis
3.0 Absorption costing
Under absorption costing both variable and fixed costs are absorbed into cost
units. The fundamental difference between marginal and absorption costing is one
of timing. In marginal costing fixed costs are written off in the period incurred. In
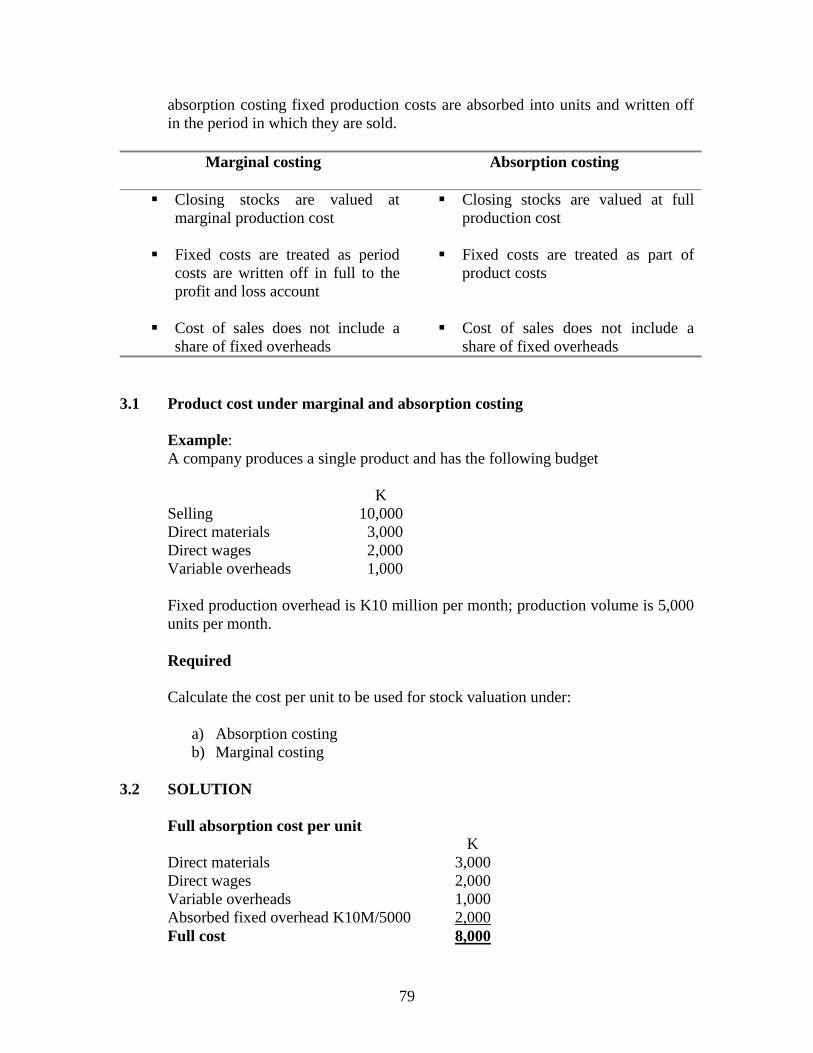
79
absorption costing fixed production costs are absorbed into units and written off
in the period in which they are sold.
Marginal costing
Absorption costing
Closing stocks are valued at
marginal production cost
Closing stocks are valued at full
production cost
Fixed costs are treated as period
costs are written off in full to the
profit and loss account
Fixed costs are treated as part of
product costs
Cost of sales does not include a
share of fixed overheads
Cost of sales does not include a
share of fixed overheads
3.1 Product cost under marginal and absorption costing
Example:
A company produces a single product and has the following budget
K
Selling 10,000
Direct materials 3,000
Direct wages 2,000
Variable overheads 1,000
Fixed production overhead is K10 million per month; production volume is 5,000
units per month.
Required
Calculate the cost per unit to be used for stock valuation under:
a) Absorption costing
b) Marginal costing
3.2 SOLUTION
Full absorption cost per unit
K
Direct materials 3,000
Direct wages 2,000
Variable overheads 1,000
Absorbed fixed overhead K10M/5000 2,000
Full cost 8,000
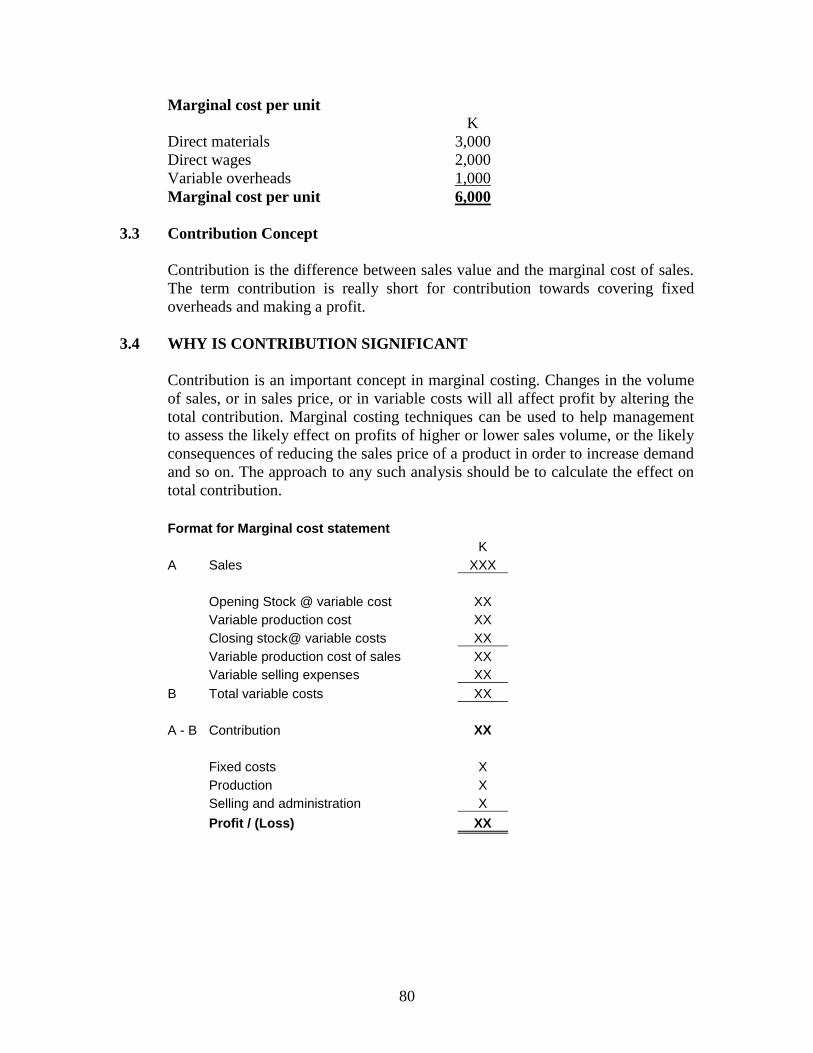
80
Marginal cost per unit
K
Direct materials 3,000
Direct wages 2,000
Variable overheads 1,000
Marginal cost per unit 6,000
3.3 Contribution Concept
Contribution is the difference between sales value and the marginal cost of sales.
The term contribution is really short for contribution towards covering fixed
overheads and making a profit.
3.4 WHY IS CONTRIBUTION SIGNIFICANT
Contribution is an important concept in marginal costing. Changes in the volume
of sales, or in sales price, or in variable costs will all affect profit by altering the
total contribution. Marginal costing techniques can be used to help management
to assess the likely effect on profits of higher or lower sales volume, or the likely
consequences of reducing the sales price of a product in order to increase demand
and so on. The approach to any such analysis should be to calculate the effect on
total contribution.
Format for Marginal cost statement
K
A Sales XXX
Opening Stock @ variable cost XX
Variable production cost XX
Closing stock@ variable costs XX
Variable production cost of sales XX
Variable selling expenses XX
B Total variable costs XX
A - B Contribution XX
Fixed costs X
Production X
Selling and administration X
Profit / (Loss) XX
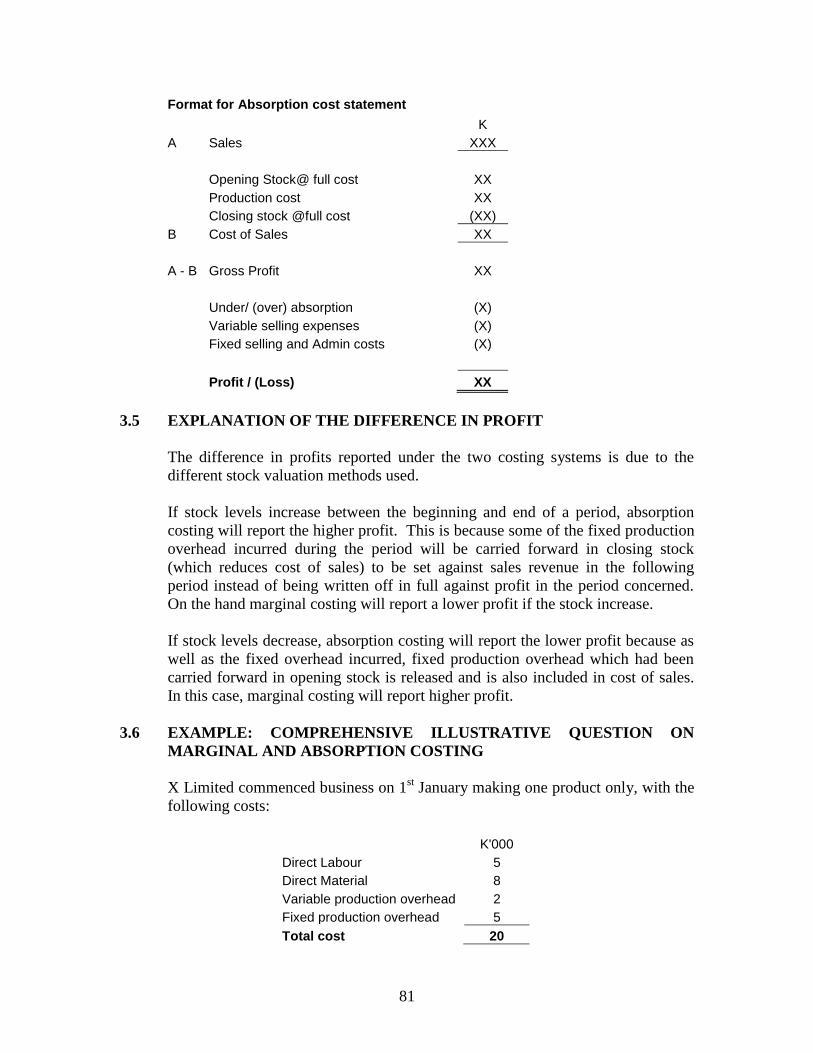
81
Format for Absorption cost statement
K
A Sales XXX
Opening Stock@ full cost XX
Production cost XX
Closing stock @full cost (XX)
B Cost of Sales XX
A - B Gross Profit XX
Under/ (over) absorption (X)
Variable selling expenses (X)
Fixed selling and Admin costs (X)
Profit / (Loss) XX
3.5 EXPLANATION OF THE DIFFERENCE IN PROFIT
The difference in profits reported under the two costing systems is due to the
different stock valuation methods used.
If stock levels increase between the beginning and end of a period, absorption
costing will report the higher profit. This is because some of the fixed production
overhead incurred during the period will be carried forward in closing stock
(which reduces cost of sales) to be set against sales revenue in the following
period instead of being written off in full against profit in the period concerned.
On the hand marginal costing will report a lower profit if the stock increase.
If stock levels decrease, absorption costing will report the lower profit because as
well as the fixed overhead incurred, fixed production overhead which had been
carried forward in opening stock is released and is also included in cost of sales.
In this case, marginal costing will report higher profit.
3.6 EXAMPLE: COMPREHENSIVE ILLUSTRATIVE QUESTION ON
MARGINAL AND ABSORPTION COSTING
X Limited commenced business on 1st January making one product only, with the
following costs:
K'000
Direct Labour 5
Direct Material 8
Variable production overhead 2
Fixed production overhead 5
Total cost 20
82
The fixed production overheads figure has been calculated on the basis of a
budgeted normal output of 36,000 units per annum.
You are to assume that there is no expenditure or efficiency variance and that all
budgeted expenditure is incurred evenly over the year.
Selling, distribution and administration expenses are:
Fixed K120 million
Variable 15% of the sales value
The selling price per unit is K35,000 and the number of units produced and sold
were:
March April
Units Units
Production 2,000 3,200
Sales 1,500 3,000
Required
Prepare profit statement for each of the months of March and April using:
a) Marginal costing; and
b) Absorption costing principles
3.7 SOLUTION
W1 Production Overhead
Per year Per month
36,000 X 5 = 180,000 15,000
W2 Selling and admin overhead (K’000)
Per year Per month
120,000
10,000
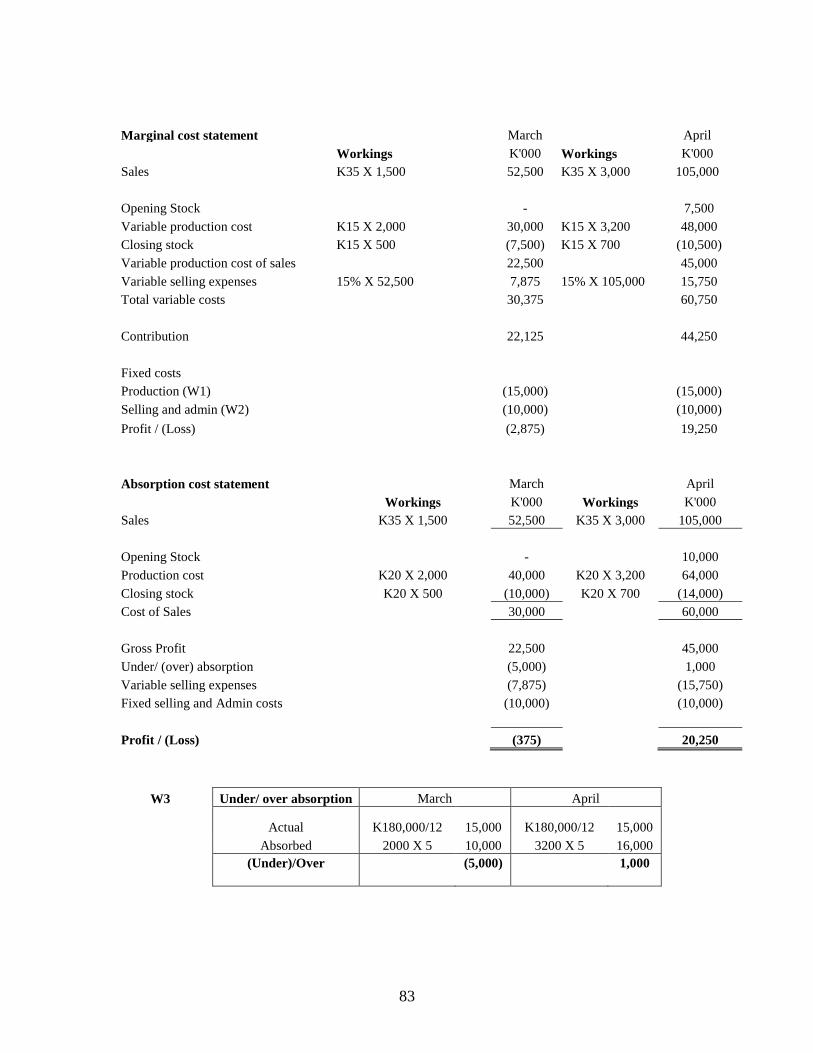
83
Marginal cost statement March April
Workings K'000 Workings K'000
Sales K35 X 1,500 52,500 K35 X 3,000 105,000
Opening Stock - 7,500
Variable production cost K15 X 2,000 30,000 K15 X 3,200 48,000
Closing stock K15 X 500 (7,500) K15 X 700 (10,500)
Variable production cost of sales 22,500 45,000
Variable selling expenses 15% X 52,500 7,875 15% X 105,000 15,750
Total variable costs 30,375 60,750
Contribution 22,125 44,250
Fixed costs
Production (W1) (15,000) (15,000)
Selling and admin (W2) (10,000) (10,000)
Profit / (Loss) (2,875) 19,250
Absorption cost statement March April
Workings K'000 Workings K'000
Sales K35 X 1,500 52,500 K35 X 3,000 105,000
Opening Stock - 10,000
Production cost K20 X 2,000 40,000 K20 X 3,200 64,000
Closing stock K20 X 500 (10,000) K20 X 700 (14,000)
Cost of Sales 30,000 60,000
Gross Profit 22,500 45,000
Under/ (over) absorption (5,000) 1,000
Variable selling expenses (7,875) (15,750)
Fixed selling and Admin costs (10,000) (10,000)
Profit / (Loss) (375) 20,250
W3 Under/ over absorption March April
Actual K180,000/12 15,000 K180,000/12 15,000
Absorbed 2000 X 5 10,000 3200 X 5 16,000
(Under)/Over
(5,000)
1,000
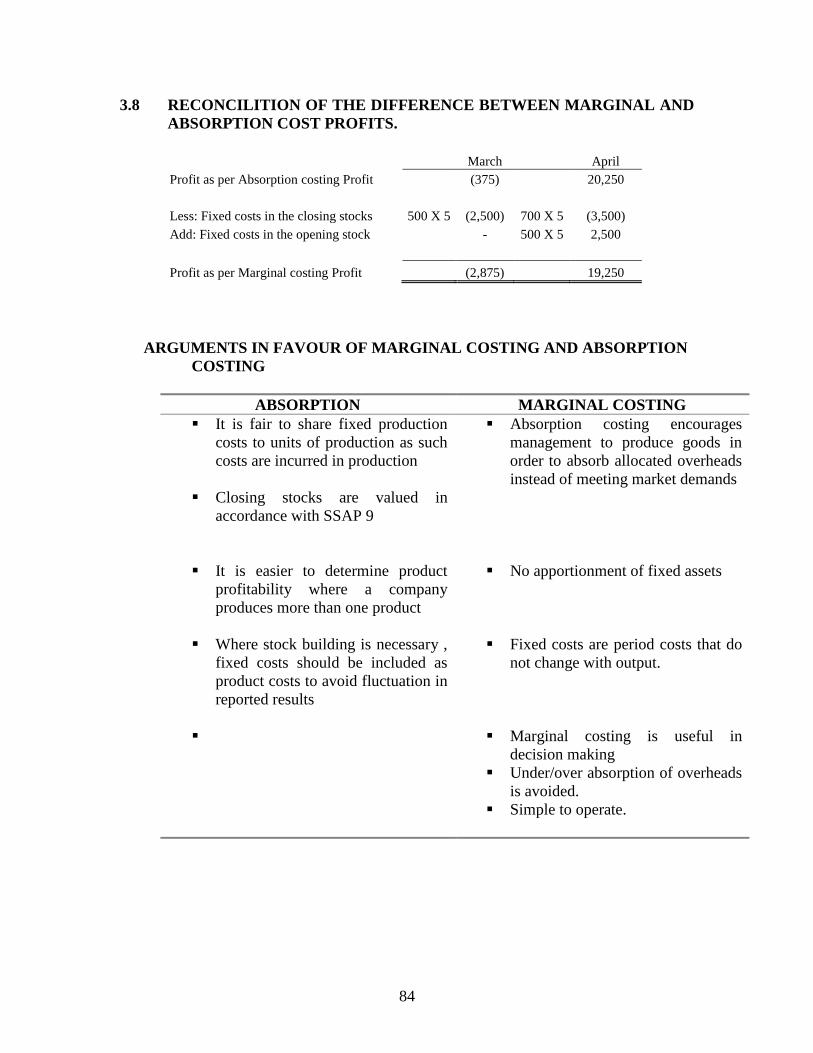
84
3.8 RECONCILITION OF THE DIFFERENCE BETWEEN MARGINAL AND
ABSORPTION COST PROFITS.
March April
Profit as per Absorption costing Profit (375) 20,250
Less: Fixed costs in the closing stocks 500 X 5 (2,500) 700 X 5 (3,500)
Add: Fixed costs in the opening stock - 500 X 5 2,500
Profit as per Marginal costing Profit (2,875) 19,250
ARGUMENTS IN FAVOUR OF MARGINAL COSTING AND ABSORPTION
COSTING
ABSORPTION MARGINAL COSTING
It is fair to share fixed production
costs to units of production as such
costs are incurred in production
Closing stocks are valued in
accordance with SSAP 9
Absorption costing encourages
management to produce goods in
order to absorb allocated overheads
instead of meeting market demands
It is easier to determine product
profitability where a company
produces more than one product
No apportionment of fixed assets
Where stock building is necessary ,
fixed costs should be included as
product costs to avoid fluctuation in
reported results
Fixed costs are period costs that do
not change with output.
Marginal costing is useful in
decision making
Under/over absorption of overheads
is avoided.
Simple to operate.
85
Chapter summary
Marginal cost is the variable cost of one unit of product or service.
Contribution is an important measure in marginal costing, and it is calculated as
the difference between sales value and marginal or variable costs.
In marginal costing, fixed production costs are treated as period costs and are
written off as they are incurred.
In absorption costing, fixed production costs are absorbed into cost units and are
carried forward in stock to be charged against sales for the next period. Stock
values using absorption costing are therefore greater than those calculated using
marginal costing.
SSAP 9 recommends the use of absorption costing for the valuation of stocks in
financial accounts
STUDENT-SELF TESTING
SELF REVIEW QUESTIONS
1. Define marginal costing. (1.0)
2. State principles of marginal costing (2.0)
3. What are the differences between marginal and absorption costing? (3.0)
4. What is contribution? (3.3)
5. State the arguments in favour of marginal and absorption costing (4.0)
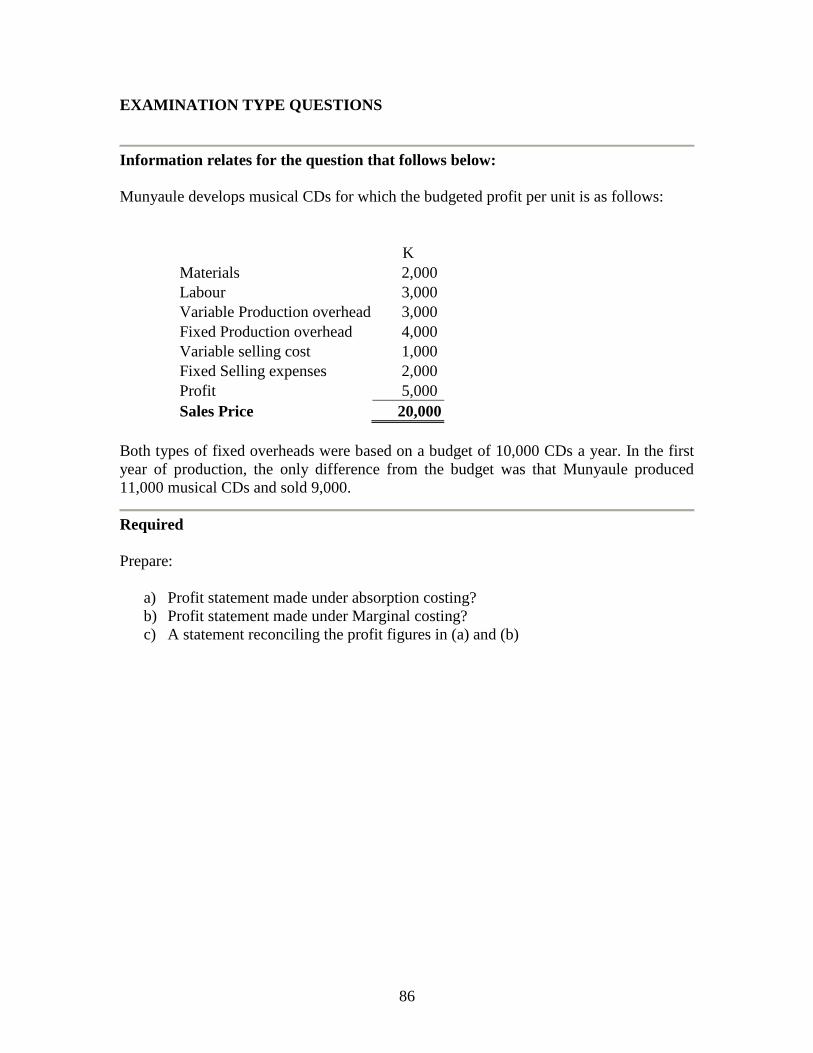
86
EXAMINATION TYPE QUESTIONS
Information relates for the question that follows below:
Munyaule develops musical CDs for which the budgeted profit per unit is as follows:
K
Materials 2,000
Labour 3,000
Variable Production overhead 3,000
Fixed Production overhead 4,000
Variable selling cost 1,000
Fixed Selling expenses 2,000
Profit 5,000
Sales Price 20,000
Both types of fixed overheads were based on a budget of 10,000 CDs a year. In the first
year of production, the only difference from the budget was that Munyaule produced
11,000 musical CDs and sold 9,000.
Required
Prepare:
a) Profit statement made under absorption costing?
b) Profit statement made under Marginal costing?
c) A statement reconciling the profit figures in (a) and (b)
87
CHAPTER 9
ACTIVITY BASED COSTING
Introduction
We have so far seen how to incorporate indirect costs into cost objects using the
traditional approach referred to as absorption costing. This chapter will introduce you to
an alternative approach to dealing with overheads known as Activity Based Costing
(ABC). ABC was developed in the 1970s and 1980s as alternative to absorption costing.
Absorption costing was found to be limited in the modern manufacturing environment
where indirect costs were becoming a significant proportion of the product cost. This
chapter will give a full background to the development of ABC and will demonstrate the
application of the concept.
Contents
1. Background to ABC.
2. Identification of activities.
3. Identification of cost drivers.
4. Accounting for overheads using ABC.
5. Contrasting ABC and the traditional approach.
6. Other uses of ABC.
Learning outcomes
After studying this chapter you should be able to:
Explain the limitation of the traditional approach to costing.
Understand the concept of activities and cost drivers.
Contrast the ABC approach and the traditional approach.
Explain other uses of ABC.
88
1.0 BACKGROUND TO ABC
ABC was developed in the 1970s and 1980s as an alternative to absorption
costing. Since the time when absorption costing was initially developed (at the
time of the Industrial Revolution), many aspects of manufacturing have changed
and it was felt that absorption cost was not providing information of sufficient
quality and accuracy. Some of these changes observed by the advocates of ABC
are:
1.1 Product range
The traditional cost accumulation systems of absorption costing were developed
at a time when most organisations produced only a narrow range of products, so
that products under went similar operations and consumed similar proportions of
overheads.
1.2 Level of indirect costs
The traditional cost accumulation systems of absorption costing was developed at
a time when overheads were only a very small fraction of total costs, direct labour
and direct material costs accounted for the largest proportion of the cost. As such
the benefit of more accurate systems of overhead allocation would probably have
been relatively small.
1.3 Information processing costs
The traditional costing systems were developed at a time when information
processing costs were so high that on a cost benefit analysis basis, the
introduction of ABC would not be approved in most organisations.
1.4 Labour costs.
Traditional costing mainly allocated costs on the basis of labour component in a
cost object. With the advent of Advanced Manufacturing Technology, labour has
drastically declined (to as low as 5% of a product cost in some cases) and cannot
be justified as a correct absorption base.
2.0 DEFINITION OF ABC
Activity Based Costing is an approach to costing and monitoring of activities
which involves tracing resource consumption and costing final output. Resources
are assigned to activities and activities to cost objects based on consumption
estimates. The later utilizes cost drivers to attach activity costs to outputs
(CIMA Official Terminology)
89
The major ideas behind ABC are as follows:
Activities cause costs
Producing products creates demand for the activities
Costs are assigned to a product on the basis of the products consumption of
the activities
2.1 Designing an ABC system
Four steps involved in the design of ABC are to:
Identify major activities that take place within an organisation.
Assign costs to cost pools/cost centres for each activity.
Determine the cost driver for each major activity.
Assign costs to products according to products demand for activities.
2.2 IDENTIFICATION OF MAJOR ACTIVITIES
Activities are composed of the aggregation of units of work or tasks and are
described by verbs associated with tasks. For example activities in a stores
department include such tasks as:
Receiving a purchase request.
Identifying suppliers.
Preparing purchase orders.
Mailing purchase orders.
Performing follow-ups.
The number of activities to include in the system is a matter of judgment by
management.
2.3 ASSIGNING COSTS TO EACH ACTIVITY
After the activities have been identified the cost of resources consumed over a
specified period must be assigned to each activity. The aim is to determine how
much the organisation is spending on each of its activities. Costs shared by
several activities have to be apportioned on some fair bases.
2.4 IDENTIFICATION OF COST DRIVERS
In order to assign costs attached to each activity to products, a cost driver must be
selected for each activity.
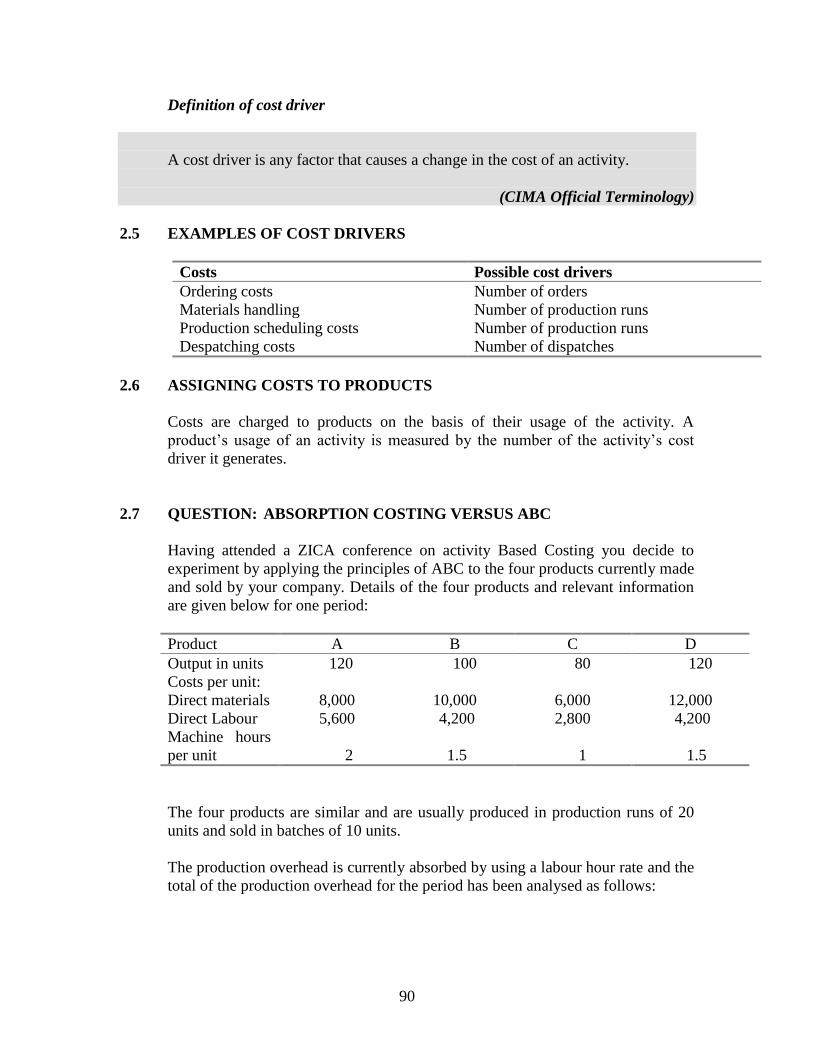
90
Definition of cost driver
A cost driver is any factor that causes a change in the cost of an activity.
(CIMA Official Terminology)
2.5 EXAMPLES OF COST DRIVERS
Costs Possible cost drivers
Ordering costs Number of orders
Materials handling Number of production runs
Production scheduling costs Number of production runs
Despatching costs Number of dispatches
2.6 ASSIGNING COSTS TO PRODUCTS
Costs are charged to products on the basis of their usage of the activity. A
product’s usage of an activity is measured by the number of the activity’s cost
driver it generates.
2.7 QUESTION: ABSORPTION COSTING VERSUS ABC
Having attended a ZICA conference on activity Based Costing you decide to
experiment by applying the principles of ABC to the four products currently made
and sold by your company. Details of the four products and relevant information
are given below for one period:
Product A B C D
Output in units 120 100 80 120
Costs per unit:
Direct materials 8,000 10,000 6,000 12,000
Direct Labour 5,600 4,200 2,800 4,200
Machine hours
per unit
2
1.5
1
1.5
The four products are similar and are usually produced in production runs of 20
units and sold in batches of 10 units.
The production overhead is currently absorbed by using a labour hour rate and the
total of the production overhead for the period has been analysed as follows:
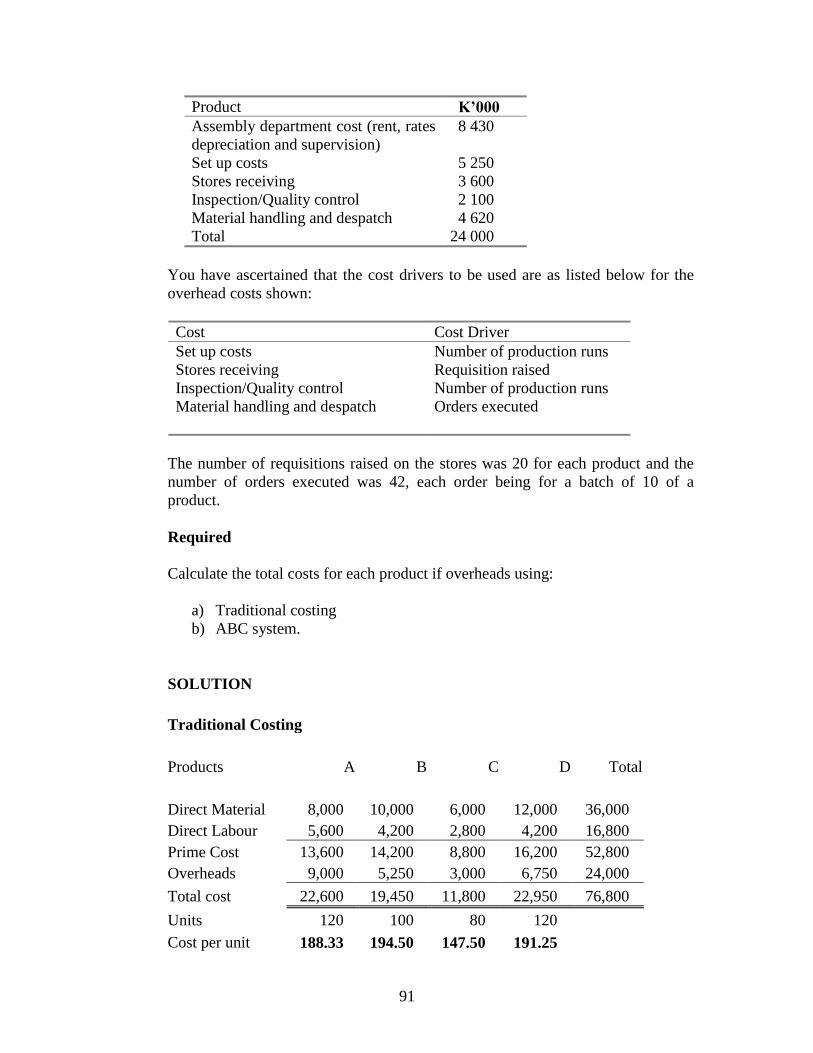
91
Product K’000
Assembly department cost (rent, rates
depreciation and supervision)
8 430
Set up costs 5 250
Stores receiving 3 600
Inspection/Quality control 2 100
Material handling and despatch 4 620
Total 24 000
You have ascertained that the cost drivers to be used are as listed below for the
overhead costs shown:
Cost Cost Driver
Set up costs Number of production runs
Stores receiving Requisition raised
Inspection/Quality control Number of production runs
Material handling and despatch Orders executed
The number of requisitions raised on the stores was 20 for each product and the
number of orders executed was 42, each order being for a batch of 10 of a
product.
Required
Calculate the total costs for each product if overheads using:
a) Traditional costing
b) ABC system.
SOLUTION
Traditional Costing
Products A B C D Total
Direct Material 8,000 10,000 6,000 12,000 36,000
Direct Labour 5,600 4,200 2,800 4,200 16,800
Prime Cost 13,600 14,200 8,800 16,200 52,800
Overheads 9,000 5,250 3,000 6,750 24,000
Total cost 22,600 19,450 11,800 22,950 76,800
Units 120 100 80 120
Cost per unit 188.33 194.50 147.50 191.25
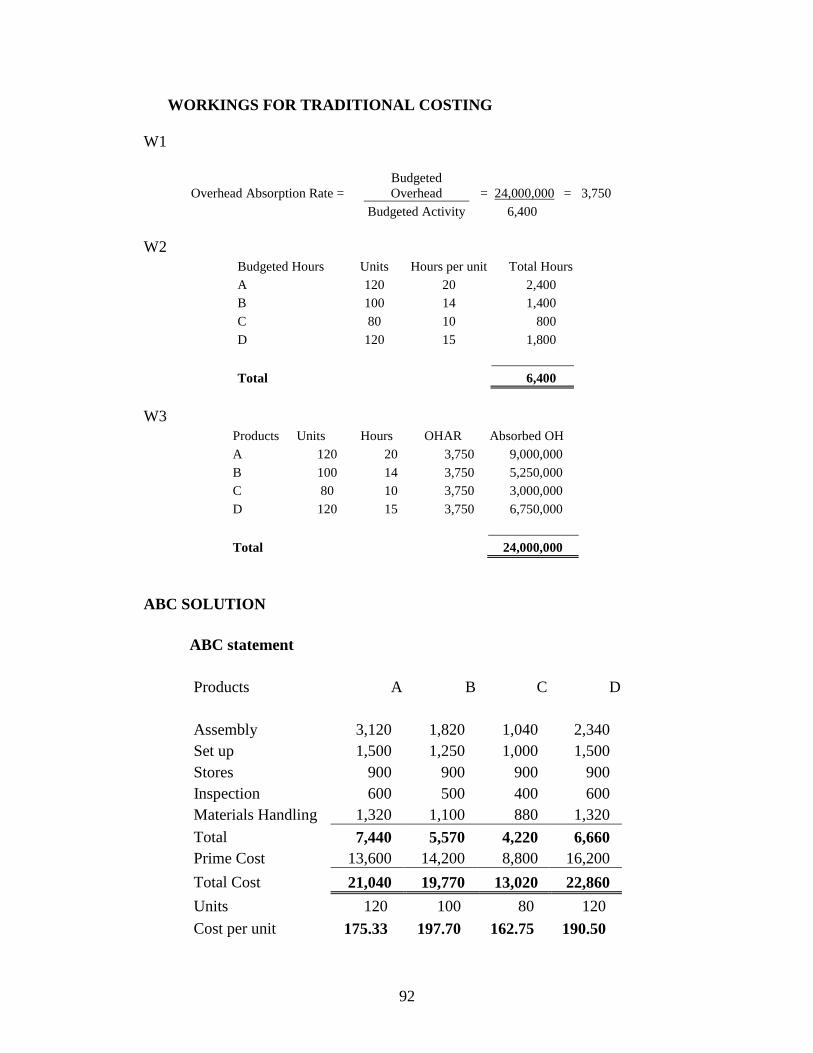
92
WORKINGS FOR TRADITIONAL COSTING
W1
Overhead Absorption Rate =
Budgeted
Overhead = 24,000,000 = 3,750
Budgeted Activity 6,400
W2
Budgeted Hours Units Hours per unit Total Hours
A 120 20 2,400
B 100 14 1,400
C 80 10 800
D 120 15 1,800
Total 6,400
W3
Products Units Hours OHAR Absorbed OH
A 120 20 3,750 9,000,000
B 100 14 3,750 5,250,000
C 80 10 3,750 3,000,000
D 120 15 3,750 6,750,000
Total 24,000,000
ABC SOLUTION
ABC statement
Products A B C D
Assembly 3,120 1,820 1,040 2,340
Set up 1,500 1,250 1,000 1,500
Stores 900 900 900 900
Inspection 600 500 400 600
Materials Handling 1,320 1,100 880 1,320
Total 7,440 5,570 4,220 6,660
Prime Cost 13,600 14,200 8,800 16,200
Total Cost 21,040 19,770 13,020 22,860
Units 120 100 80 120
Cost per unit 175.33 197.70 162.75 190.50
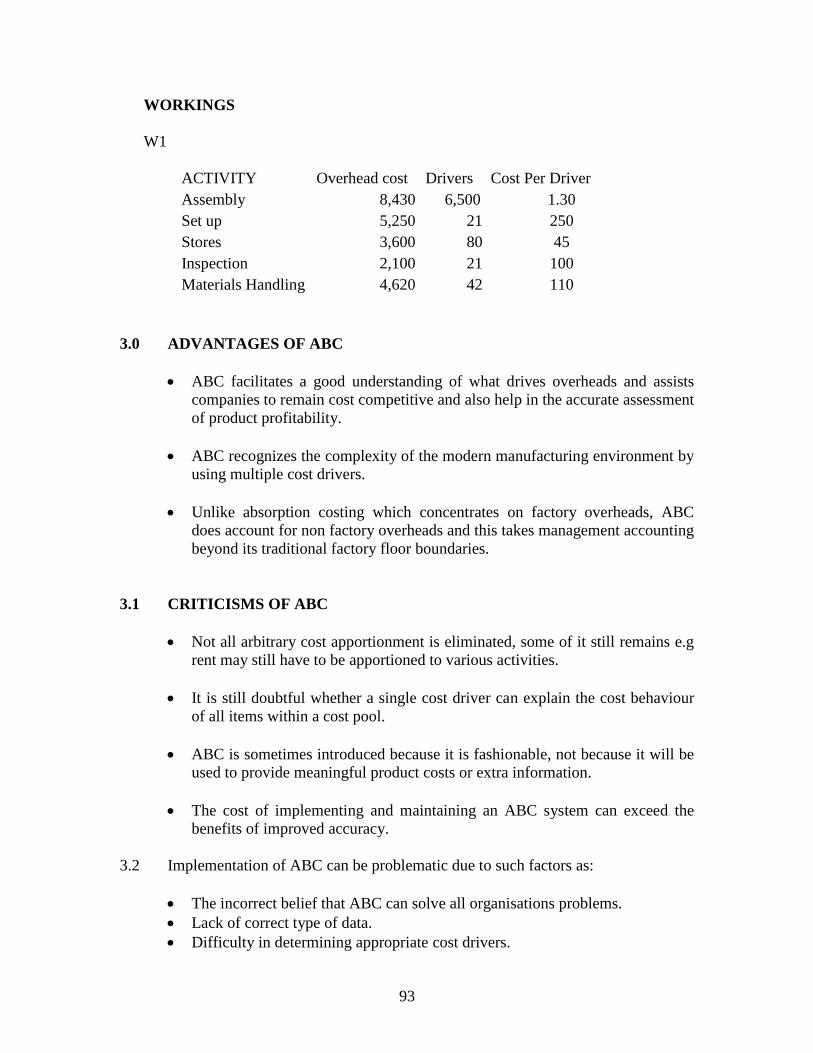
93
WORKINGS
W1
3.0 ADVANTAGES OF ABC
ABC facilitates a good understanding of what drives overheads and assists
companies to remain cost competitive and also help in the accurate assessment
of product profitability.
ABC recognizes the complexity of the modern manufacturing environment by
using multiple cost drivers.
Unlike absorption costing which concentrates on factory overheads, ABC
does account for non factory overheads and this takes management accounting
beyond its traditional factory floor boundaries.
3.1 CRITICISMS OF ABC
Not all arbitrary cost apportionment is eliminated, some of it still remains e.g
rent may still have to be apportioned to various activities.
It is still doubtful whether a single cost driver can explain the cost behaviour
of all items within a cost pool.
ABC is sometimes introduced because it is fashionable, not because it will be
used to provide meaningful product costs or extra information.
The cost of implementing and maintaining an ABC system can exceed the
benefits of improved accuracy.
3.2 Implementation of ABC can be problematic due to such factors as:
The incorrect belief that ABC can solve all organisations problems.
Lack of correct type of data.
Difficulty in determining appropriate cost drivers.
ACTIVITY Overhead cost Drivers Cost Per Driver
Assembly 8,430 6,500 1.30
Set up 5,250 21 250
Stores 3,600 80 45
Inspection 2,100 21 100
Materials Handling 4,620 42 110
94
3.30 OTHER USES OF ABC
Information which is gathered in the process of designing and implementing ABC
can be used in the management functions of planning, control and decision
making.
3.31 Planning
One of the critical steps in the design of an ABC system is the analysis of the
organisation’s activities, cost drivers and the relation ship between the activities,
products/services and their costs. This type of information would be very relevant
for the budgeting exercise.
3.32 Control
ABC clearly identifies what causes costs for an organisation in the service and
support departments. This makes it possible to control costs by managing the
activities which underlie the support departments.
3.33 Decision making
By providing accurate and reliable cost information ABC information can be used
to make the following decisions:
Pricing
Promotion or discontinuing products or parts of the business
Redesigning products and developing new products or new ways to do
business.
95
Chapter summary
Activity Based Costing is an alternative costing method to absorption costing.
ABC was developed to remedy weaknesses inherent in the absorption costing
approach such as the reliance on labour for cost allocation and absorption
when labour is a declining as a proportion of product cost.
ABC involves the identification of the factors which cause costs (cost drivers)
of an organisation’s major activities and charging support overheads to
products on the basis of usage of an activity.
Steps involved in ABC are:
o Identification of major activities within an organisation.
o Assigning overheads to the activities.
o Identifying cost drivers for each cost pool.
o Finding cost per driver and assigning the cost to cost objects.
One of the key advantages of ABC is that it recognizes the complexity of the
modern manufacturing environment by using multiple cost drivers
Information from ABC can be used by management for planning, control and
decision-making.
STUDENT-SELF TESTING
SELF REVIEW QUESTIONS
1. What developments have led to the introduction of ABC? (1.1-1.4)
2. Define ABC (2.0)
3. Mention four steps involved in the development of ABC? 2.1
4. What is a cost driver (2.4)
5. What are the advantages of ABC? 3.0
6. Mention the major criticisms of ABC (3.1)
96
EXAMINATION TYPE QUESTIONS
Falcon limited uses a single plant and production process to manufacture its candle and
matches for its mainly rural market. An extract of production data for these products for
the period ending 31st March 20X5 has been given as follows:
Matches Candles
Quantities produced (Units) 5000 7000
Direct Labour hours per unit 1 2
Machine hours per unit 3 1
Set-ups in the period 10 40
Orders handled in the period 15 60
Overhead costs K'000
Relating to Machine activity 220,000
Relating to production run set ups 20,000
Relating to handling of orders 45,000
285,000
Required
Calculate the production overheads to be absorbed by one unit of each of the products
using:
i) Traditional costing
ii) Activity Based Costing approach
97
CHAPTER 10
JOB AND BATCH COSTING
INTRODUCTION
In this chapter, we look at the first costing method, known as job costing. We will see
circumstances in which job costing should be used and how the costs of jobs are
calculated. We shall proceed to consider batch costing. These costing systems are usually
associated with absorption costing methodology and the costs calculated for each batch or
each job produced are normally a fully absorbed costs.
CONTENTS
1. Costing methods.
2. Job costing.
3. Batch costing.
LEARNING OUTCOMES
After studying this chapter you should be able to:
Describe the characteristics of job costing and batch costing.
Identify situations where the application of job costing or batch costing is
appropriate.
Discuss and illustrate the treatment of direct, indirect and abnormal costs.
Complete cost records and accounts in job and batch costing situation.
Estimate job costs from given information.
Apply cost-plus pricing in job costing.
98
1.0 Costing methods
A costing method is designed to suit the way goods are processed or
manufactured or the way services are provided. Each organisation’s costing
method will therefore have unique features but costing methods of firms in the
same line of business will more than likely have common aspects.
1.1 There are five costing methods to be considered in two categories:
Specific order costing
Job costing.
Batch costing.
Contract costing.
Continuous operational costing
Process costing.
Service costing.
1.2 We will be considering two important costing methods in this chapter.
Job costing.
Batch costing.
2.0 JOB COSTING
Job costing is a costing method applied where work is undertaken to customers’
specific requirements and each order is of comparatively short duration.
The work relating to a job moves through processes and operations as a
continuously identifiable unit. Job costing is most commonly applied within a
factory or workshop, but may also be applied to property repairs and internal
capital expenditure.
3.0 PROCEDURES FOR THE PERFORMANCE OF JOBS
The normal procedure in jobbing concerns involves:
The prospective customer approaches the supplier and indicates the
requirements.
A representative sees the prospective customer and agrees with him the
precise details of the items to be supplied.
The estimating department of the organization then prepares an estimate for
the job. This will be based on the cost of materials to be used, the labour
99
expense expected, the cost of overhead, the cost of any additional equipment
needed specially for the job and finally the supplier’s profit margin.
If the estimate is accepted the job can be scheduled. All the required resources
are arranged for the job.
3.00 JOB COST INFORMATION
3.10 Materials
When material is requisitioned for a job then the issue of materials will be
recorded in the stock ledger account. They will also be recorded at their issue
price in the job cost card as they are used as input into the particular job.
Materials that have to be specially purchased for the job in question will need to
be priced by the purchasing department.
3.11 Direct labour costs
As the job card travels with each job, the hours worked by each grade of labour
are logged onto the card. The relevant hourly labour rate is then applied to each
grade of labour to give a cost for each grade and a total cost for the job.
3.12 Direct expenses
Direct expenses are any cost that can be directly attributed to that particular job.
The details of these costs are can be obtained from invoices and the cost
accountant is responsible for recording these.
3.13 Production overheads
The estimated production overheads to be included in the job cost will be
calculated from predetermined overhead absorption rates and the actual hours
worked.
3.14 Other overheads and job costs
In order to arrive at the total costs for a particular job, any non-production
overheads such as administration, selling and distribution should be included in
the job costs. A variety of methods such as percentage of full product costs etc
could be used to estimate overheads to include in the job.
4.0 JOB PRICING
The common method of fixing prices for jobs is cost plus pricing where a required
profit mark-up is added to the total cost in order to arrive at a selling price.
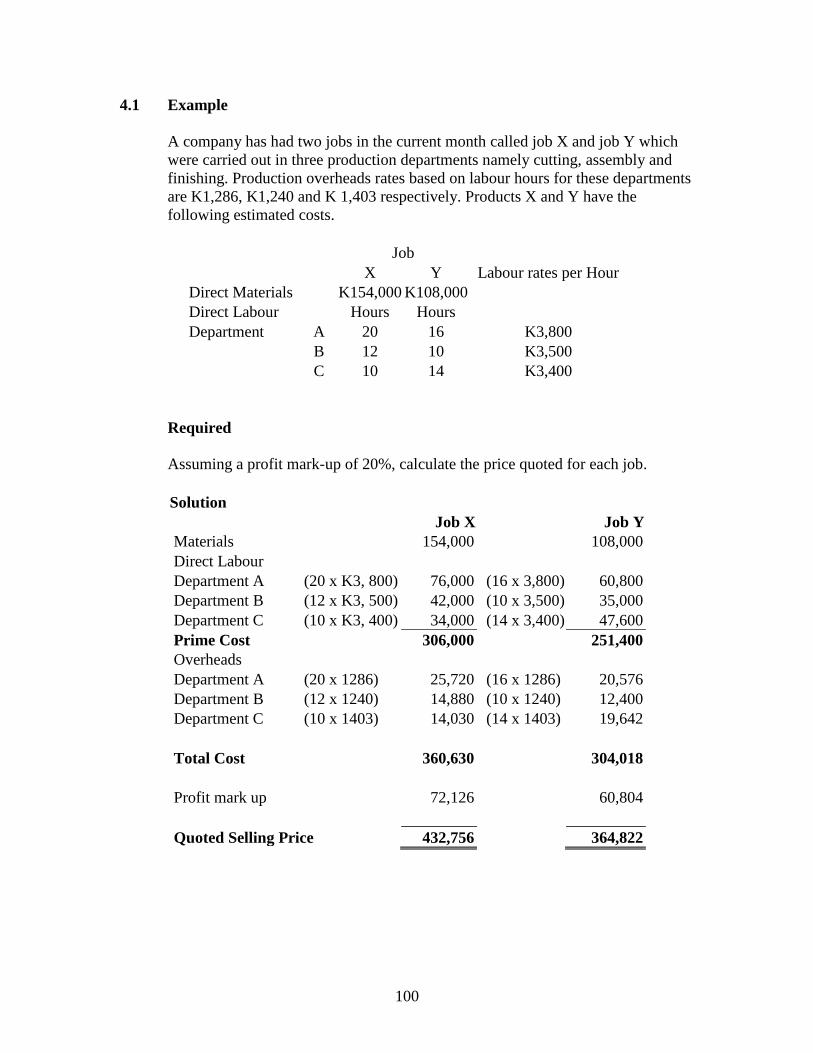
100
4.1 Example
A company has had two jobs in the current month called job X and job Y which
were carried out in three production departments namely cutting, assembly and
finishing. Production overheads rates based on labour hours for these departments
are K1,286, K1,240 and K 1,403 respectively. Products X and Y have the
following estimated costs.
Job
X Y Labour rates per Hour
Direct Materials K154,000 K108,000
Direct Labour Hours Hours
Department A 20 16 K3,800
B 12 10 K3,500
C 10 14 K3,400
Required
Assuming a profit mark-up of 20%, calculate the price quoted for each job.
Solution
Job X Job Y
Materials 154,000 108,000
Direct Labour
Department A (20 x K3, 800) 76,000 (16 x 3,800) 60,800
Department B (12 x K3, 500) 42,000 (10 x 3,500) 35,000
Department C (10 x K3, 400) 34,000 (14 x 3,400) 47,600
Prime Cost 306,000 251,400
Overheads
Department A (20 x 1286) 25,720 (16 x 1286) 20,576
Department B (12 x 1240) 14,880 (10 x 1240) 12,400
Department C (10 x 1403) 14,030 (14 x 1403) 19,642
Total Cost 360,630 304,018
Profit mark up 72,126 60,804
Quoted Selling Price 432,756 364,822
101
The focal point of job costing system is the cost sheet. Each job will be given a
unique job number and a separate sheet will be opened for each job, on which will be
recorded:
Materials
Labour
Direct expenses
Overheads
5.0 BATCH COSTING
A batch is a group of identical but separately identifiable products that are made
together.
Batch costing is a form of specific order costing in which costs are attributed to
batches of products.
Each batch is very similar to a job and in exactly the same way as job costing.
The costs of that batch are gathered together on a batch cost card. These costs are
materials, labour, expenses and a batch’s share of overheads.
5.1 UNIT COST OF A BATCH
As a batch is made up of a number identical products or cost units, the cost per
unit computation differs from the job. In order to find the cost of each product or
cost unit the total cost of the job is divided by the number of products in that
batch.
5.2 Example
Batch number X002 has the following inputs:
01 May Material X: 30kg @ K10,000 per kg.
40 hours of grade II labour at K6,000 per hr.
15 May Material Y: 20kg @ K30,000 per kg.
60 hours of grade III labour at K5000 per hr.
Production overheads are to be absorbed into the cost of each batch on the basis
of labour hours at a rate of K500 per labour hour.
Required:
Calculate the cost per unit in the batch.
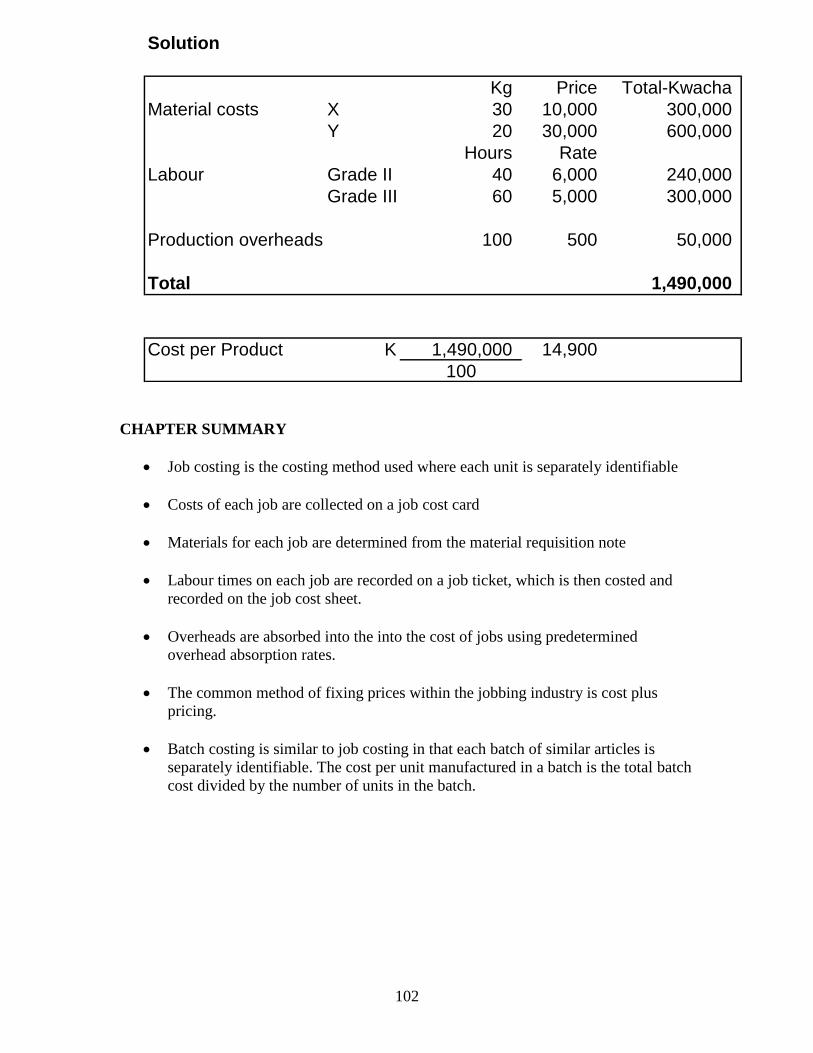
102
CHAPTER SUMMARY
Job costing is the costing method used where each unit is separately identifiable
Costs of each job are collected on a job cost card
Materials for each job are determined from the material requisition note
Labour times on each job are recorded on a job ticket, which is then costed and
recorded on the job cost sheet.
Overheads are absorbed into the into the cost of jobs using predetermined
overhead absorption rates.
The common method of fixing prices within the jobbing industry is cost plus
pricing.
Batch costing is similar to job costing in that each batch of similar articles is
separately identifiable. The cost per unit manufactured in a batch is the total batch
cost divided by the number of units in the batch.
Solution
Kg Price Total-Kwacha
Material costs X 30 10,000 300,000
Y 20 30,000 600,000
Hours Rate
Labour Grade II 40 6,000 240,000
Grade III 60 5,000 300,000
Production overheads 100 500 50,000
Total 1,490,000
Cost per Product K 1,490,000 14,900
100
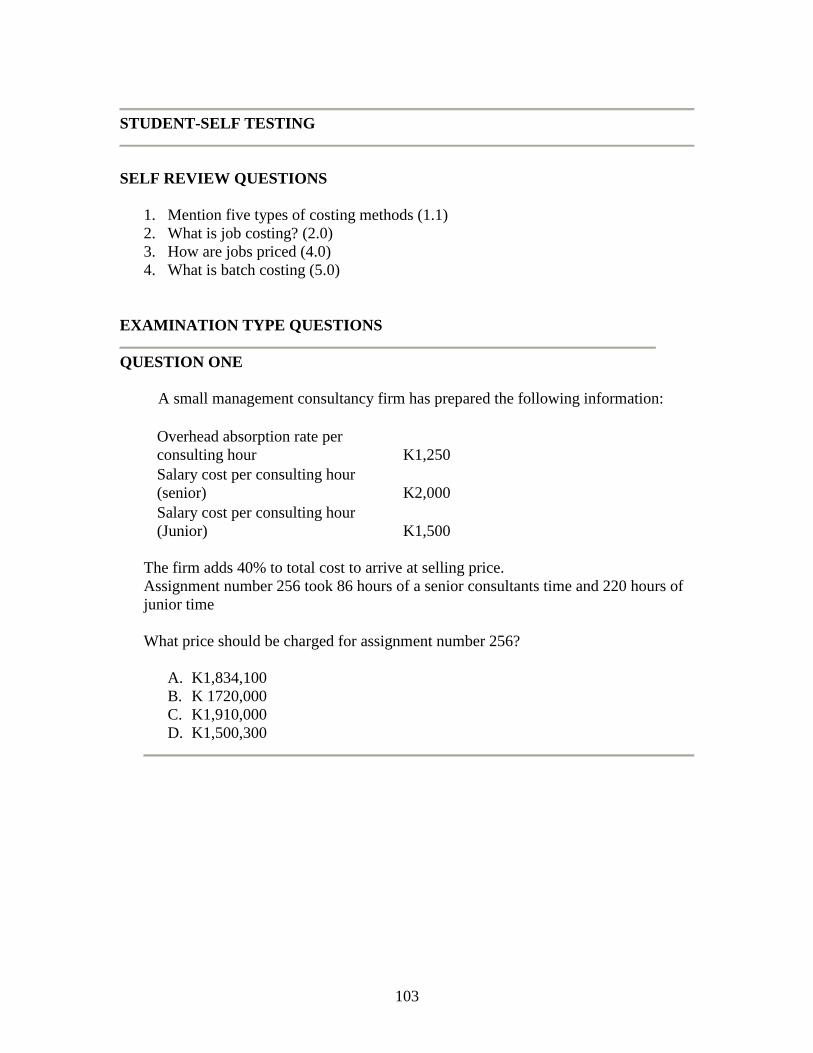
103
STUDENT-SELF TESTING
SELF REVIEW QUESTIONS
1. Mention five types of costing methods (1.1)
2. What is job costing? (2.0)
3. How are jobs priced (4.0)
4. What is batch costing (5.0)
EXAMINATION TYPE QUESTIONS
QUESTION ONE
A small management consultancy firm has prepared the following information:
Overhead absorption rate per
consulting hour K1,250
Salary cost per consulting hour
(senior) K2,000
Salary cost per consulting hour
(Junior) K1,500
The firm adds 40% to total cost to arrive at selling price.
Assignment number 256 took 86 hours of a senior consultants time and 220 hours of
junior time
What price should be charged for assignment number 256?
A. K1,834,100
B. K 1720,000
C. K1,910,000
D. K1,500,300
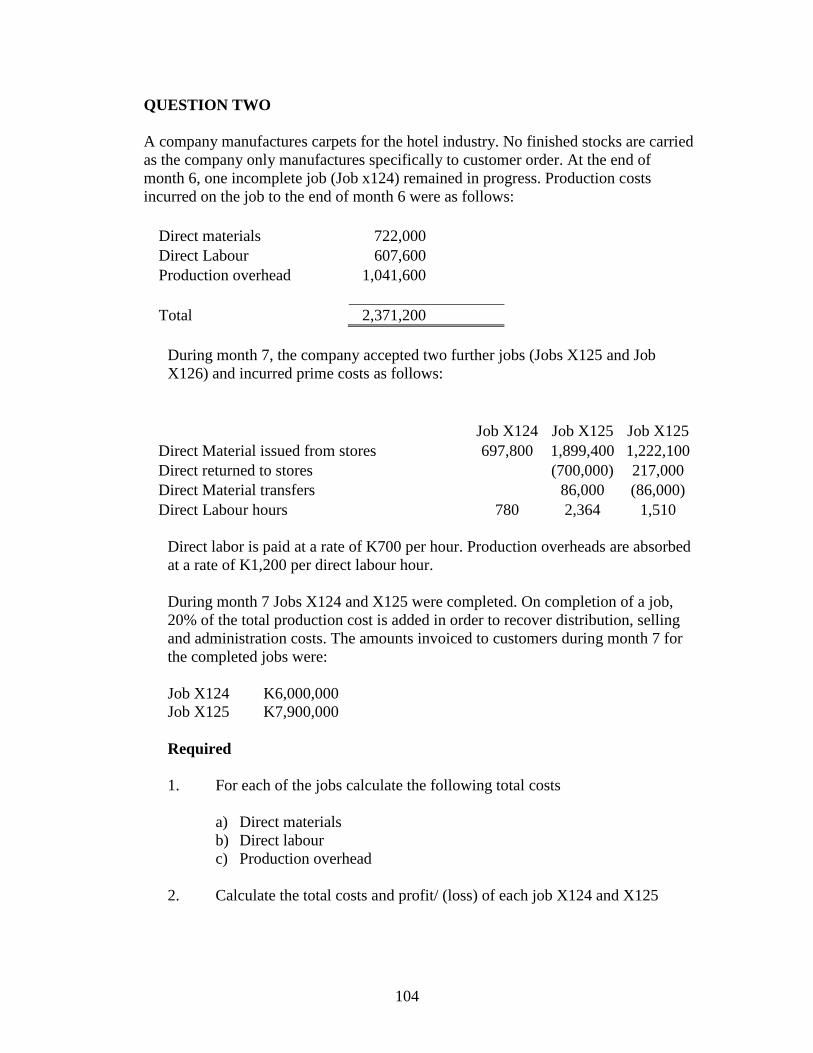
104
QUESTION TWO
A company manufactures carpets for the hotel industry. No finished stocks are carried
as the company only manufactures specifically to customer order. At the end of
month 6, one incomplete job (Job x124) remained in progress. Production costs
incurred on the job to the end of month 6 were as follows:
Direct materials 722,000
Direct Labour 607,600
Production overhead 1,041,600
Total 2,371,200
During month 7, the company accepted two further jobs (Jobs X125 and Job
X126) and incurred prime costs as follows:
Job X124 Job X125 Job X125
Direct Material issued from stores 697,800 1,899,400 1,222,100
Direct returned to stores (700,000) 217,000
Direct Material transfers 86,000 (86,000)
Direct Labour hours 780 2,364 1,510
Direct labor is paid at a rate of K700 per hour. Production overheads are absorbed
at a rate of K1,200 per direct labour hour.
During month 7 Jobs X124 and X125 were completed. On completion of a job,
20% of the total production cost is added in order to recover distribution, selling
and administration costs. The amounts invoiced to customers during month 7 for
the completed jobs were:
Job X124 K6,000,000
Job X125 K7,900,000
Required
1. For each of the jobs calculate the following total costs
a) Direct materials
b) Direct labour
c) Production overhead
2. Calculate the total costs and profit/ (loss) of each job X124 and X125
105
CHAPTER 11
CONTRACT COSTING
Introduction
We now turn attention to a third specific order costing method called contract costing.
Contracts are basically large long term jobs. Most of the costing principles covered under
job costing are also applicable to contract costing. The main difference is the recognition
of attributable profit part way through the contract.
CONTENTS
1. What is contract costing?
2. Features of contracts.
3. Contract account.
4. Profit taking.
5. Accounting entries.
LEARNING OUTCOMES
After studying this chapter you should be able to:
Know the characteristics of contract costing.
Be able to prepare a contract account.
Calculate profits on completed and incomplete contracts.
Prepare balance sheets entries relating to long-term contracts.
Be able to summarise standard accounting requirements regarding profits, losses
and contract balances.
106
1.0 DEFINITION
Contract costing is a form of specific order costing in which costs are attributable
to individual contracts.
1.1 Contract costing has many similarities to job costing and is usually applied to
work which is:
Undertaken to customer’s special requirements.
Relatively long duration.
Site based and sometimes overseas.
Frequently of a constructional nature.
The main difference between a job and a contract is one of size and time span.
Contract costing is used by firms, which undertake building or other
constructional work that takes years or months to complete.
1.2 Characteristics of contract costing
Although details vary, certain characteristics are common to most contracts
costing systems:
Higher proportion of direct costs
Low indirect costs
Difficulties of cost control
Surplus materials
2.0 TREATMENT OF COSTS
Each contract is a separately identifiable cost unit, against which cost are
collected and later used in profit computations. The various elements of cost are
dealt with as follows.
2.1 Direct materials
Materials charged to a contract include materials specifically purchased for the
contract, materials transferred from other contracts and materials issued from the
stores. At the end of an accounting period, the contract account should be credited
with:
Unused materials.
Materials transferred to other projects.
Materials returned to stores.
107
2.2 Direct wages
The direct wages include work done by the design and drawing office, work done
on the site. All labour employed on the site of the contract is direct. Time sheets
may be used to disclose time spent by workers at different sites. All such labour
costs are debited to the contract account.
2.3 Direct expenses
Direct contract costs other than materials and labour are often very significant and
the two major items falling within this category are plant and subcontracted work.
Plant used on a contract could come from the following sources:
Plant specifically purchased for the project.
Plant transferred from other contracts.
Plant hired from outside the company.
The contract account should be debited with the cost of using the plant and this is
done as follows:
For plant hired, the hire charge is the cost of using the asset and is charged to
the contract.
For the assets owned by the company, depreciation represents the cost of
using the plant and is therefore charged to the contract.
Subcontracted work – it is common in contract operation to find that the main
contractor hires subcontractors to undertake some of the activities on a
contract. The cost of any subcontracted work is a direct expense of a contract
and is debited to the contract account.
3.0 TERMINOLOGY RELATING TO THE OPERATION OF A CONTRACT.
For contracts a price is agreed between the company and customer. For large
companies where work is spread over a number of months or years, the contractor
will receive progress payments. Such interim payments are based on the work
done involving certain procedures:
Architects certificates- the architect issues a certificate showing the value of the
work completed on the contract. Based on the certificates the contractor issues an
invoice to the customer as a demand for progress payment.
Retention monies- this refers to monies which a client withholds from the total
invoice amounts as he makes progress payments to the contractor. Retention
monies act as motivation for possible future rectification work by the contractor.
108
Such retention monies are therefore paid upon the completion of the contract
when any faulty work has been done.
4.0 TAKING PROFITS ON LONG TERM CONTRACTS
Where a contract extends over a long period, IAS11 allows the contractor to
take credit for part of the attributable profit to the contract in each year’s
contract.
This provision avoids inconsistency of having a number of years with no
profit from a particular contract and then suddenly making a huge profit in the
year when the contract is completed.
In deciding to what extent profit can be taken on uncompleted contract, the
following matters should be considered:
o The successful outcome of the contract should be certain before any
interim profit is taken.
o Any profits should only be taken in proportion to the work completed to
date on the contract.
o Any anticipated overall loss on the contract should be provided for as soon
as it is recognized.
4.1 Guidelines on calculating interim profit
Various possibilities exist for estimating the profit on incomplete contracts and
several options are shown here below. The overriding principle is that a prudent
view must always be taken and the profit taken should reflect the degree of
completion.
If the contract is at an early stage (say less than 30% complete) no profit should
be taken. Interim profits however calculated, should only be taken when the final
contract outcome of the contract can be assessed with reasonable certainty.
4.2 Options for estimating interim profits
Exam focus
Note that in the exam the approach you should adopt in estimating profit should
be based on the requirements of the question and the available information.
Option 1
When substantial costs have been incurred (say 30% - 80% complete) a formula
which has been traditionally used in the construction industry is:
109
Profit taken = 2/3 or 3/4 of the notional profit X Cash received from progress payments
Value of work certified
Where notional profit = Value of Work Certified – Cost of Work Certified
Option 2
This approach involves the following five steps:
Step 1
Determine the total sales value of the contract - for fixed price contracts; this is
simply the agreed contract price. Call this (a)
Step 2
Compute the total expected costs to complete the contract which consists of two
elements:
The actual costs incurred to date on the contract, plus
The estimated future costs necessary to complete the contracts
Call this (b)
Step 3
The expected overall profit on the contract is given by (a) – (b)
Step 4
The attributable profit to date on the contract should reflect the amount of work
that has been completed so far. It can be calculated as follows:
Estimated overall profit X
It is important to realize that the attributable profit calculated in the above
formula is the cumulative figure.
Step 5
The profit to be taken this year is the cumulative attributable profit calculated at
step 4 less the profit on the contract recognized in the previous year.
Value of work certified to date
Total contract price
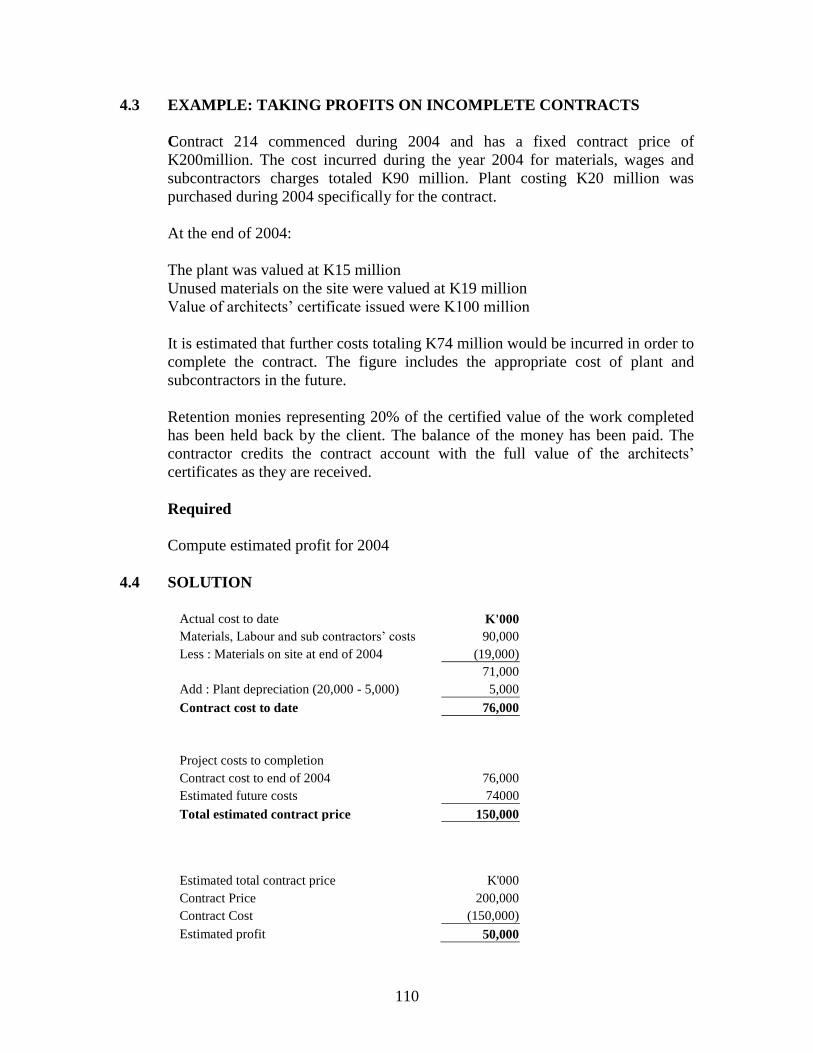
110
4.3 EXAMPLE: TAKING PROFITS ON INCOMPLETE CONTRACTS
Contract 214 commenced during 2004 and has a fixed contract price of
K200million. The cost incurred during the year 2004 for materials, wages and
subcontractors charges totaled K90 million. Plant costing K20 million was
purchased during 2004 specifically for the contract.
At the end of 2004:
The plant was valued at K15 million
Unused materials on the site were valued at K19 million
Value of architects’ certificate issued were K100 million
It is estimated that further costs totaling K74 million would be incurred in order to
complete the contract. The figure includes the appropriate cost of plant and
subcontractors in the future.
Retention monies representing 20% of the certified value of the work completed
has been held back by the client. The balance of the money has been paid. The
contractor credits the contract account with the full value of the architects’
certificates as they are received.
Required
Compute estimated profit for 2004
4.4 SOLUTION
Actual cost to date K'000
Materials, Labour and sub contractors’ costs 90,000
Less : Materials on site at end of 2004 (19,000)
71,000
Add : Plant depreciation (20,000 - 5,000) 5,000
Contract cost to date 76,000
Project costs to completion
Contract cost to end of 2004 76,000
Estimated future costs 74000
Total estimated contract price 150,000
Estimated total contract price K'000
Contract Price 200,000
Contract Cost (150,000)
Estimated profit 50,000
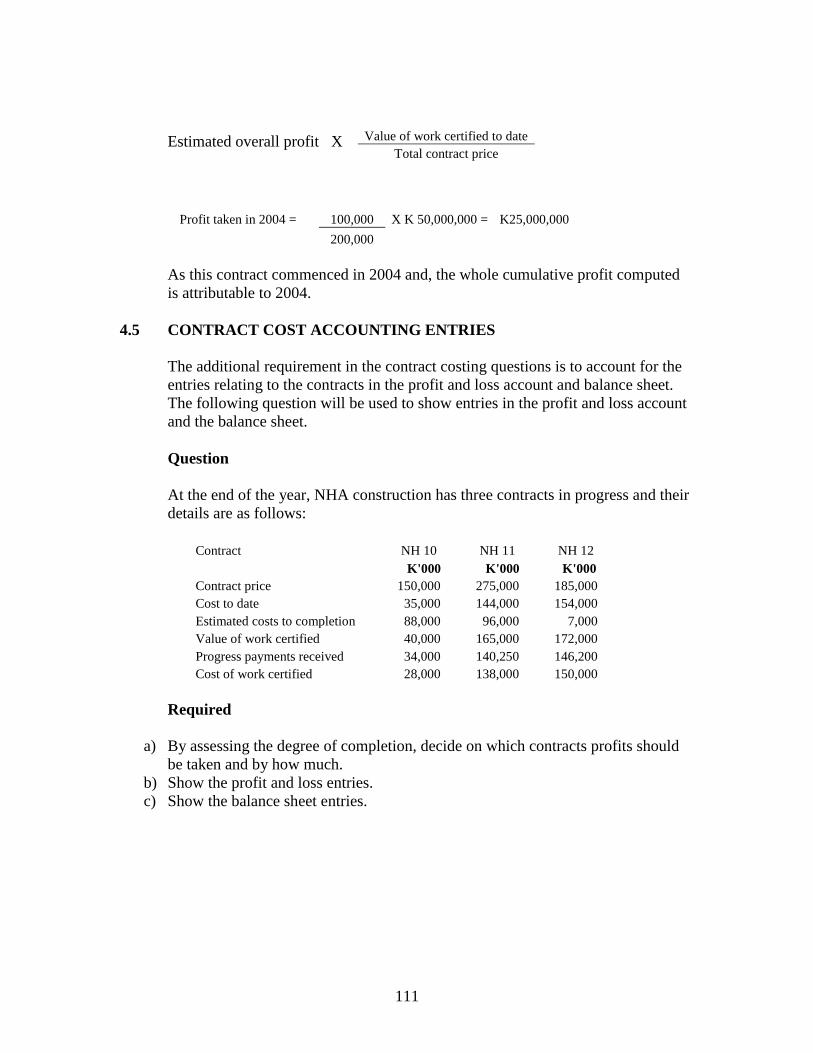
111
Estimated overall profit X
Profit taken in 2004 = 100,000 X K 50,000,000 = K25,000,000
200,000
As this contract commenced in 2004 and, the whole cumulative profit computed
is attributable to 2004.
4.5 CONTRACT COST ACCOUNTING ENTRIES
The additional requirement in the contract costing questions is to account for the
entries relating to the contracts in the profit and loss account and balance sheet.
The following question will be used to show entries in the profit and loss account
and the balance sheet.
Question
At the end of the year, NHA construction has three contracts in progress and their
details are as follows:
Contract NH 10 NH 11 NH 12
K'000 K'000 K'000
Contract price 150,000 275,000 185,000
Cost to date 35,000 144,000 154,000
Estimated costs to completion 88,000 96,000 7,000
Value of work certified 40,000 165,000 172,000
Progress payments received 34,000 140,250 146,200
Cost of work certified 28,000 138,000 150,000
Required
a) By assessing the degree of completion, decide on which contracts profits should
be taken and by how much.
b) Show the profit and loss entries.
c) Show the balance sheet entries.
Value of work certified to date
Total contract price
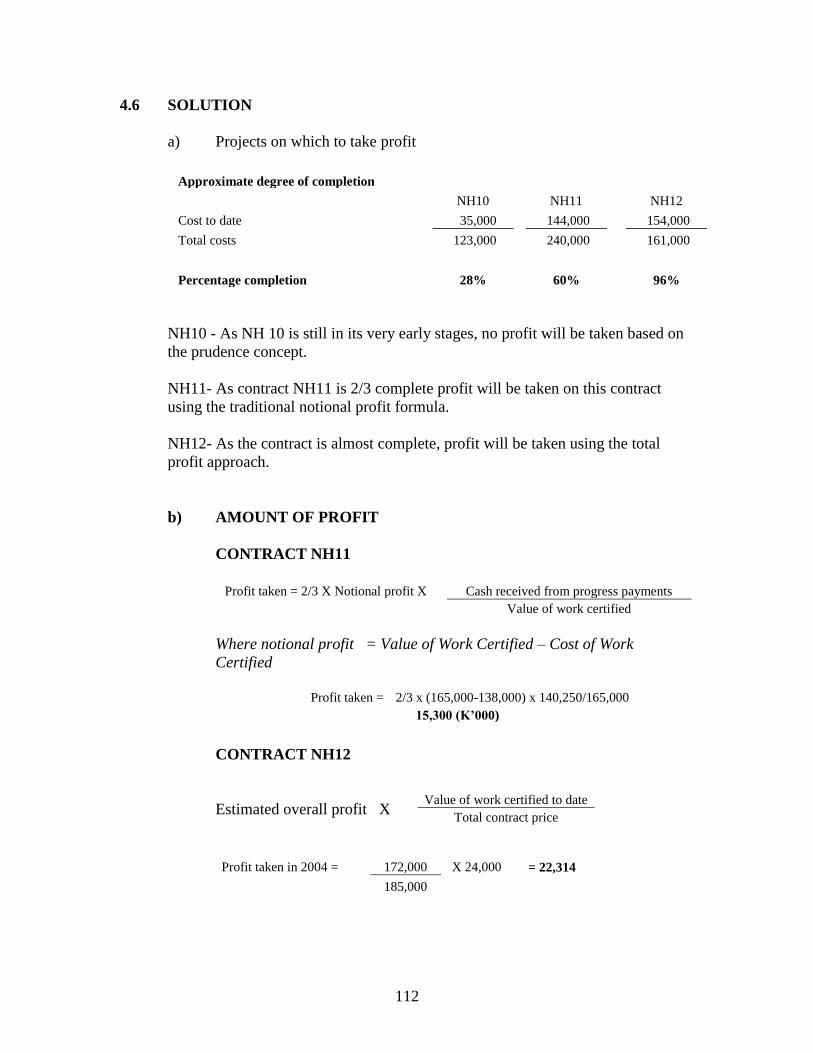
112
4.6 SOLUTION
a) Projects on which to take profit
Approximate degree of completion
NH10 NH11 NH12
Cost to date 35,000 144,000 154,000
Total costs 123,000 240,000 161,000
Percentage completion 28% 60% 96%
NH10 - As NH 10 is still in its very early stages, no profit will be taken based on
the prudence concept.
NH11- As contract NH11 is 2/3 complete profit will be taken on this contract
using the traditional notional profit formula.
NH12- As the contract is almost complete, profit will be taken using the total
profit approach.
b) AMOUNT OF PROFIT
CONTRACT NH11
Profit taken = 2/3 X Notional profit X Cash received from progress payments
Value of work certified
Where notional profit = Value of Work Certified – Cost of Work
Certified
CONTRACT NH12
Estimated overall profit X
Profit taken in 2004 = 172,000 X 24,000 = 22,314
185,000
Profit taken = 2/3 x (165,000-138,000) x 140,250/165,000
15,300 (K’000)
Value of work certified to date
Total contract price
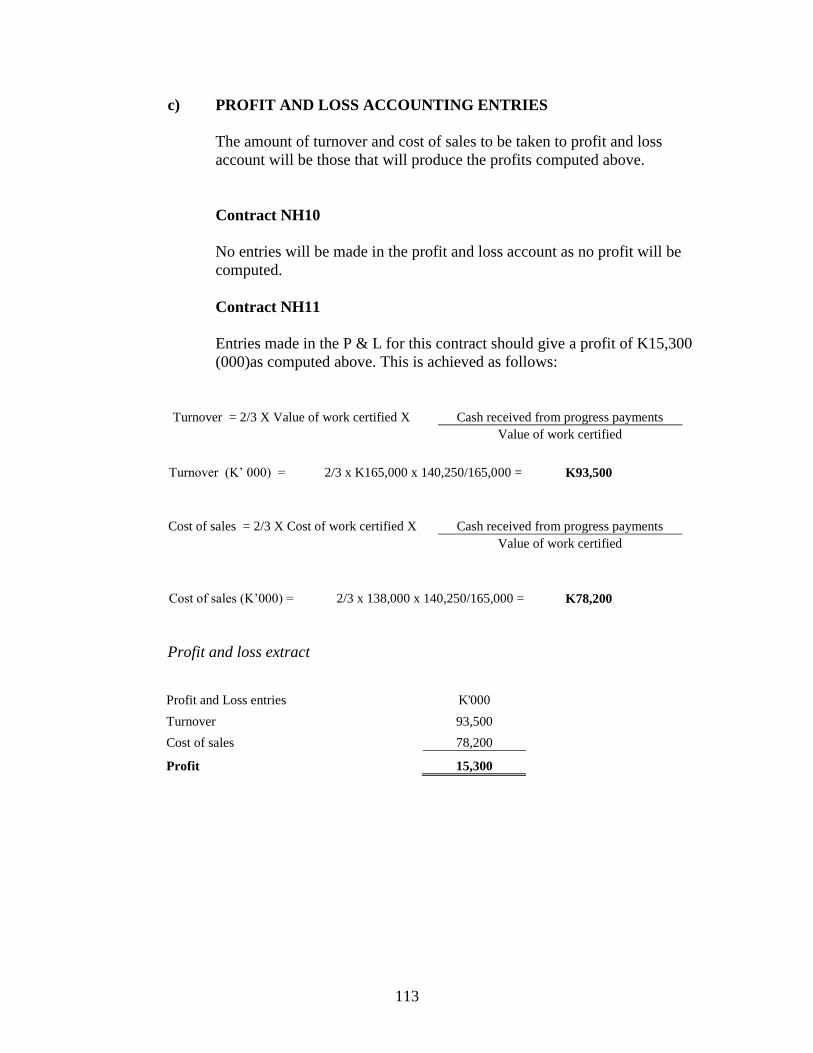
113
c) PROFIT AND LOSS ACCOUNTING ENTRIES
The amount of turnover and cost of sales to be taken to profit and loss
account will be those that will produce the profits computed above.
Contract NH10
No entries will be made in the profit and loss account as no profit will be
computed.
Contract NH11
Entries made in the P & L for this contract should give a profit of K15,300
(000)as computed above. This is achieved as follows:
Turnover = 2/3 X Value of work certified X Cash received from progress payments
Value of work certified
Turnover (K’ 000) = 2/3 x K165,000 x 140,250/165,000 = K93,500
Cost of sales = 2/3 X Cost of work certified X Cash received from progress payments
Value of work certified
Cost of sales (K’000) = 2/3 x 138,000 x 140,250/165,000 = K78,200
Profit and loss extract
Profit and Loss entries K'000
Turnover 93,500
Cost of sales 78,200
Profit 15,300
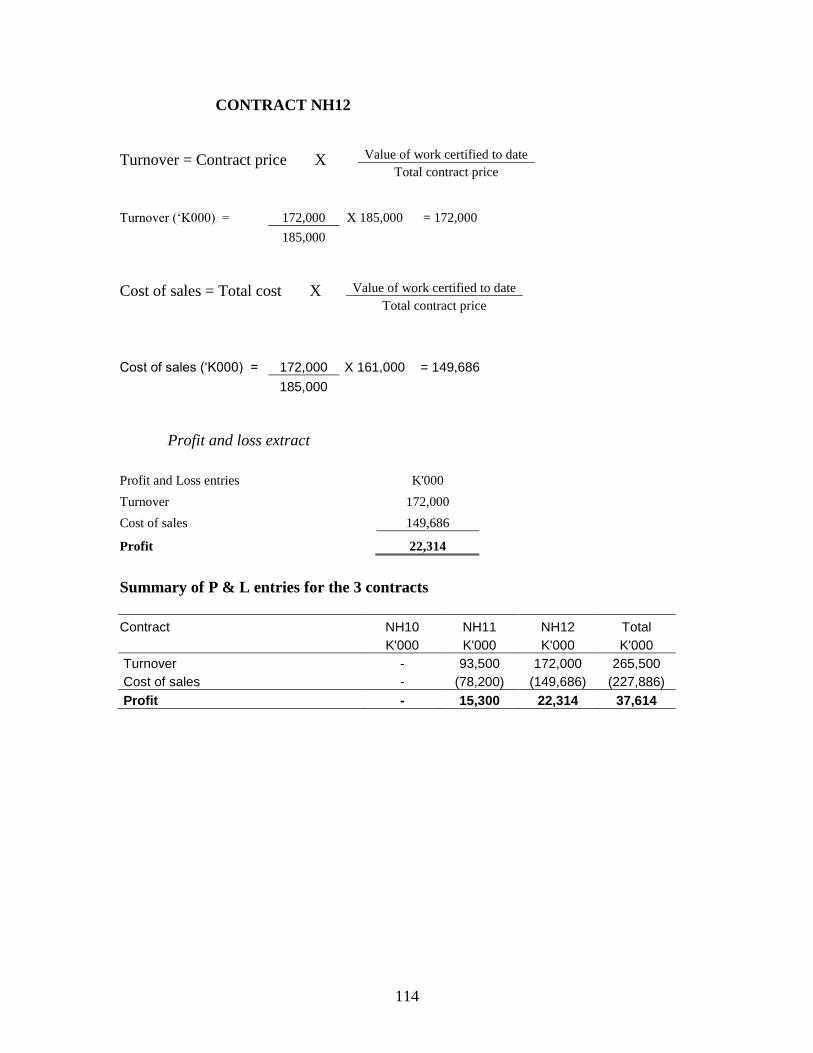
114
CONTRACT NH12
Turnover = Contract price X
Turnover (‘K000) = 172,000 X 185,000 = 172,000
185,000
Cost of sales = Total cost X
Cost of sales (‘K000) = 172,000 X 161,000 = 149,686
185,000
Profit and loss extract
Summary of P & L entries for the 3 contracts
Contract NH10 NH11 NH12 Total
K'000 K'000 K'000 K'000
Turnover - 93,500 172,000 265,500
Cost of sales - (78,200) (149,686) (227,886)
Profit - 15,300 22,314 37,614
Value of work certified to date
Total contract price
Value of work certified to date
Total contract price
Profit and Loss entries K'000
Turnover 172,000
Cost of sales 149,686
Profit 22,314
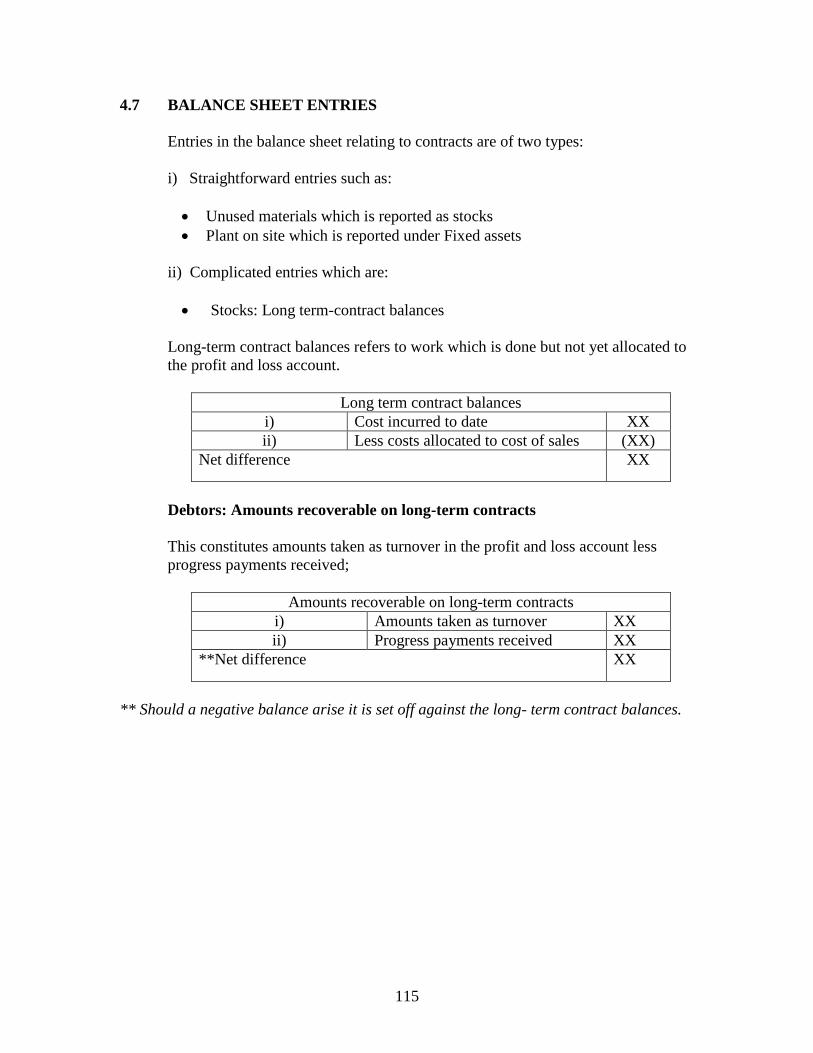
115
4.7 BALANCE SHEET ENTRIES
Entries in the balance sheet relating to contracts are of two types:
i) Straightforward entries such as:
Unused materials which is reported as stocks
Plant on site which is reported under Fixed assets
ii) Complicated entries which are:
Stocks: Long term-contract balances
Long-term contract balances refers to work which is done but not yet allocated to
the profit and loss account.
Long term contract balances
i) Cost incurred to date XX
ii) Less costs allocated to cost of sales (XX)
Net difference XX
Debtors: Amounts recoverable on long-term contracts
This constitutes amounts taken as turnover in the profit and loss account less
progress payments received;
Amounts recoverable on long-term contracts
i) Amounts taken as turnover XX
ii) Progress payments received XX
**Net difference XX
** Should a negative balance arise it is set off against the long- term contract balances.
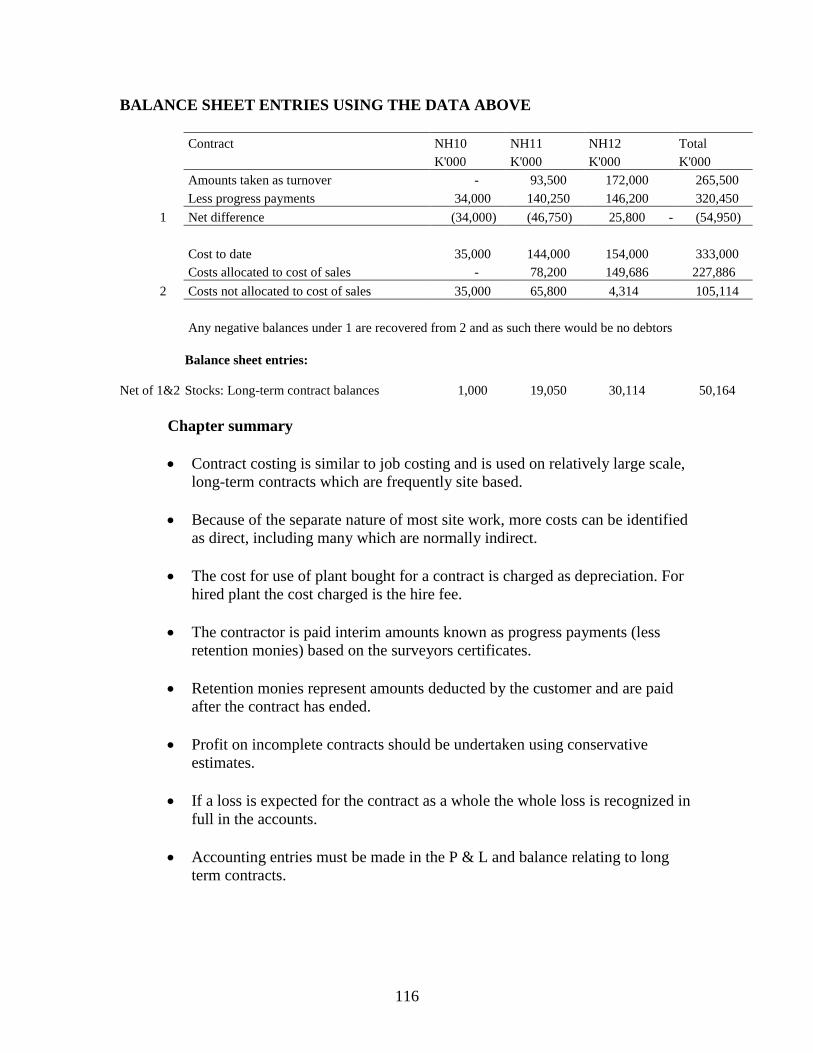
116
BALANCE SHEET ENTRIES USING THE DATA ABOVE
Contract NH10 NH11 NH12 Total
K'000 K'000 K'000 K'000
Amounts taken as turnover - 93,500 172,000 265,500
Less progress payments 34,000 140,250 146,200 320,450
1 Net difference (34,000) (46,750) 25,800 - (54,950)
Cost to date 35,000 144,000 154,000 333,000
Costs allocated to cost of sales - 78,200 149,686 227,886
2 Costs not allocated to cost of sales 35,000 65,800 4,314 105,114
Any negative balances under 1 are recovered from 2 and as such there would be no debtors
Net of 1&2
Balance sheet entries:
Stocks: Long-term contract balances 1,000 19,050 30,114 50,164
Chapter summary
Contract costing is similar to job costing and is used on relatively large scale,
long-term contracts which are frequently site based.
Because of the separate nature of most site work, more costs can be identified
as direct, including many which are normally indirect.
The cost for use of plant bought for a contract is charged as depreciation. For
hired plant the cost charged is the hire fee.
The contractor is paid interim amounts known as progress payments (less
retention monies) based on the surveyors certificates.
Retention monies represent amounts deducted by the customer and are paid
after the contract has ended.
Profit on incomplete contracts should be undertaken using conservative
estimates.
If a loss is expected for the contract as a whole the whole loss is recognized in
full in the accounts.
Accounting entries must be made in the P & L and balance relating to long
term contracts.
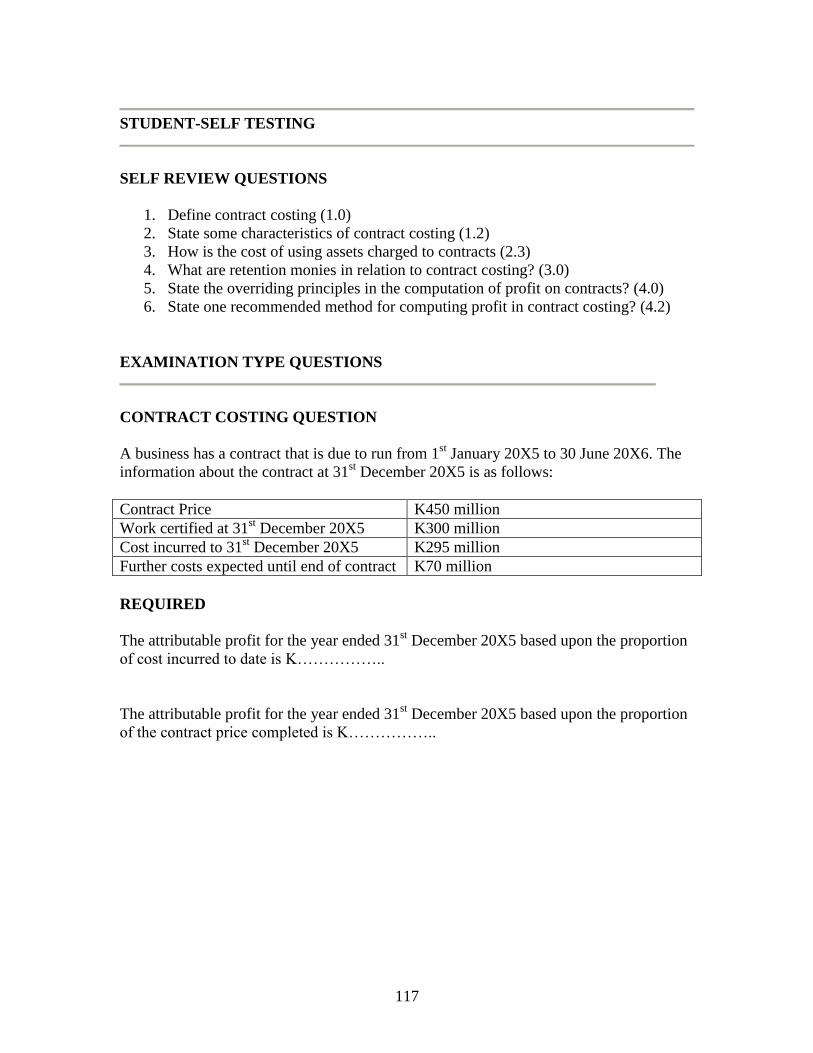
117
STUDENT-SELF TESTING
SELF REVIEW QUESTIONS
1. Define contract costing (1.0)
2. State some characteristics of contract costing (1.2)
3. How is the cost of using assets charged to contracts (2.3)
4. What are retention monies in relation to contract costing? (3.0)
5. State the overriding principles in the computation of profit on contracts? (4.0)
6. State one recommended method for computing profit in contract costing? (4.2)
EXAMINATION TYPE QUESTIONS
CONTRACT COSTING QUESTION
A business has a contract that is due to run from 1st January 20X5 to 30 June 20X6. The
information about the contract at 31st December 20X5 is as follows:
Contract Price K450 million
Work certified at 31st December 20X5 K300 million
Cost incurred to 31st December 20X5 K295 million
Further costs expected until end of contract K70 million
REQUIRED
The attributable profit for the year ended 31st December 20X5 based upon the proportion
of cost incurred to date is K……………..
The attributable profit for the year ended 31st December 20X5 based upon the proportion
of the contract price completed is K……………..
118
CHAPTER 12
PROCESS COSTING
Introduction
Having looked at job costing and batch costing in the previous chapter, we shall proceed
to consider a third costing method called process costing. This chapter starts by
considering the basics of the topic which are preparation of basic process accounts and
later moving on to accounting for process losses and finally the valuation of work in
progress. The next chapter will deal with the accounting for by products and joint
products.
CONTENTS
1. Process costing.
2. Process losses.
3. Scrap value.
4. Abnormal gain.
5. Equivalent units.
6. Closing Work in progress.
7. Opening Work in progress.
LEARNING OUTCOMES
After reading this chapter you should be able to:
Know the features of process costing and the situation where the use of process
costing is appropriate.
Learn how to prepare a process account.
Know the treatment of normal losses.
Know the treatment of abnormal losses and abnormal gains.
Learn how to account for scrap value of losses.
Understand the concept of equivalent units for the valuation of work in progress.
119
1.0 INTRODUCTION TO PROCESS COSTING
Process costing is a costing method used where production follows a series of
sequential processes. It is used in a variety of industries including:
Oil refining
Food processing
Paper making
Brewing
Chemical and drug manufacture
1.2 FEATURES OF PROCESS COSTING
Process production has the following features which make it different from other
types of manufacturing operations:
Process operations are continuous i.e. they never stop, materials are
continually being added to operations and output is continually being
produced e.g brewing and paint making.
Due to the continuous nature of operations, there is normally opening work in
progress at the beginning and closing work in progress at the end of the
accounting period.
The output of one process becomes input to the next until the finished product
is made in the final process.
There is often a loss in process due to spoilage, wastage evaporation and so
on.
There could be more than one product produced from a common input. For
example oil refinery may produce petrol, diesel, tar, etc. These products may
be joint products or by products.
1.3 The main problems in process costing are:
Preparation of process account
Treatment of losses
Valuation of work in progress
Costing of joint and by products
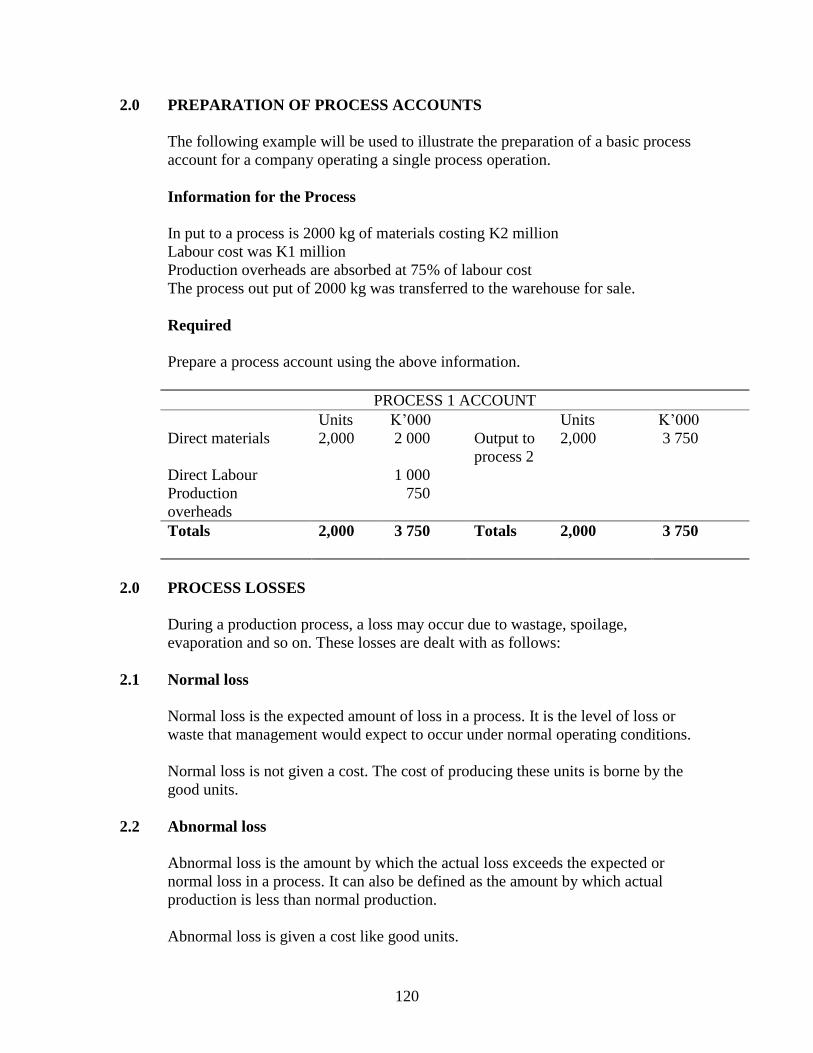
120
2.0 PREPARATION OF PROCESS ACCOUNTS
The following example will be used to illustrate the preparation of a basic process
account for a company operating a single process operation.
Information for the Process
In put to a process is 2000 kg of materials costing K2 million
Labour cost was K1 million
Production overheads are absorbed at 75% of labour cost
The process out put of 2000 kg was transferred to the warehouse for sale.
Required
Prepare a process account using the above information.
PROCESS 1 ACCOUNT
Units K’000 Units K’000
Direct materials 2,000 2 000 Output to
process 2
2,000 3 750
Direct Labour 1 000
Production
overheads
750
Totals
2,000 3 750 Totals 2,000 3 750
2.0 PROCESS LOSSES
During a production process, a loss may occur due to wastage, spoilage,
evaporation and so on. These losses are dealt with as follows:
2.1 Normal loss
Normal loss is the expected amount of loss in a process. It is the level of loss or
waste that management would expect to occur under normal operating conditions.
Normal loss is not given a cost. The cost of producing these units is borne by the
good units.
2.2 Abnormal loss
Abnormal loss is the amount by which the actual loss exceeds the expected or
normal loss in a process. It can also be defined as the amount by which actual
production is less than normal production.
Abnormal loss is given a cost like good units.
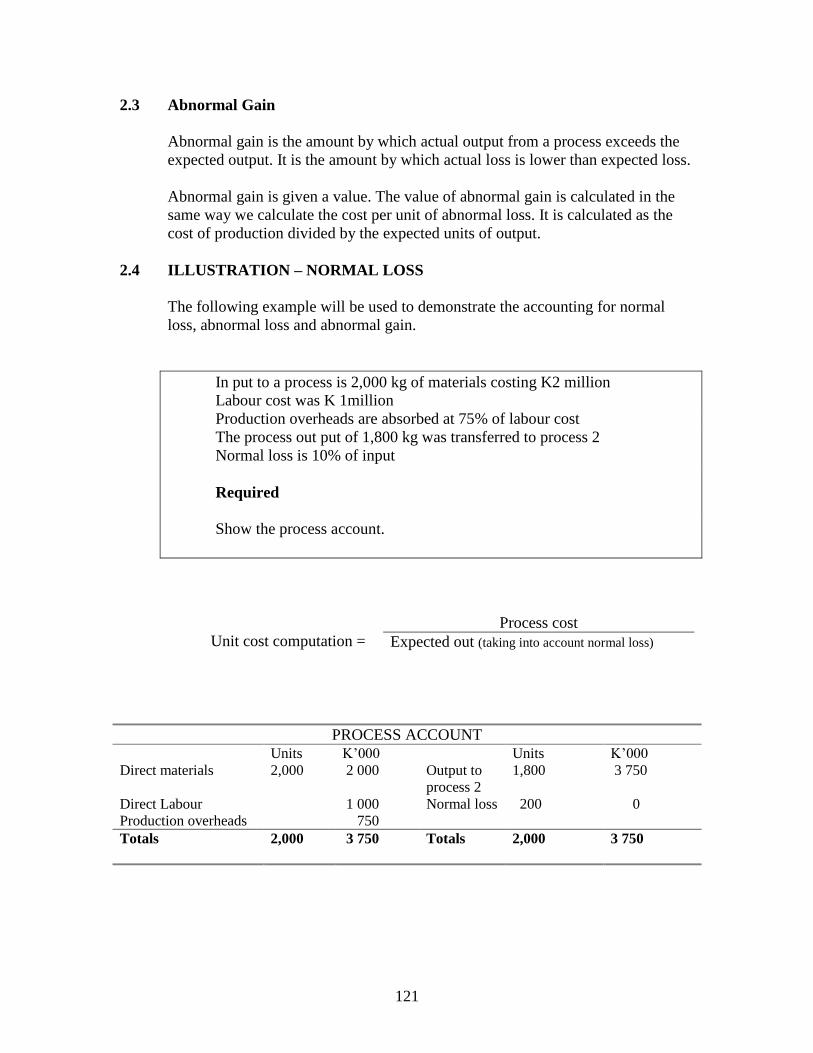
121
2.3 Abnormal Gain
Abnormal gain is the amount by which actual output from a process exceeds the
expected output. It is the amount by which actual loss is lower than expected loss.
Abnormal gain is given a value. The value of abnormal gain is calculated in the
same way we calculate the cost per unit of abnormal loss. It is calculated as the
cost of production divided by the expected units of output.
2.4 ILLUSTRATION – NORMAL LOSS
The following example will be used to demonstrate the accounting for normal
loss, abnormal loss and abnormal gain.
In put to a process is 2,000 kg of materials costing K2 million
Labour cost was K 1million
Production overheads are absorbed at 75% of labour cost
The process out put of 1,800 kg was transferred to process 2
Normal loss is 10% of input
Required
Show the process account.
Unit cost computation =
Process cost
Expected out (taking into account normal loss)
PROCESS ACCOUNT
Units K’000 Units K’000
Direct materials 2,000 2 000 Output to
process 2
1,800 3 750
Direct Labour 1 000 Normal loss 200 0
Production overheads 750
Totals
2,000 3 750 Totals 2,000 3 750
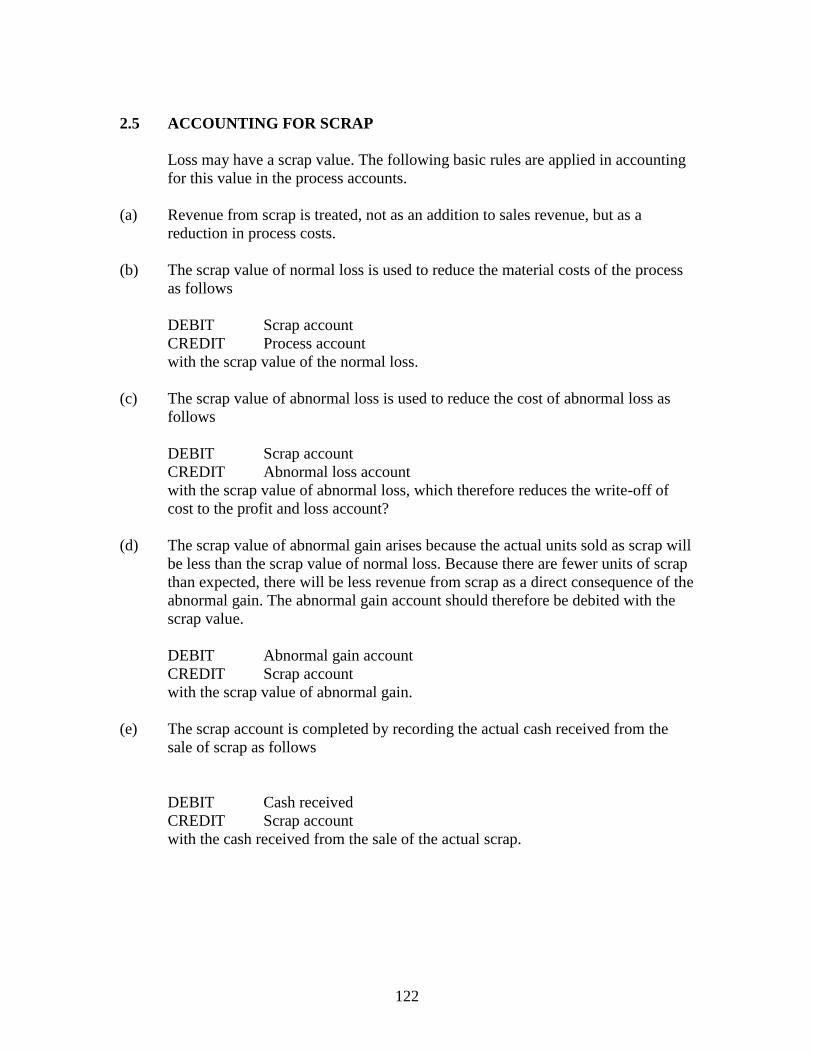
122
2.5 ACCOUNTING FOR SCRAP
Loss may have a scrap value. The following basic rules are applied in accounting
for this value in the process accounts.
(a) Revenue from scrap is treated, not as an addition to sales revenue, but as a
reduction in process costs.
(b) The scrap value of normal loss is used to reduce the material costs of the process
as follows
DEBIT Scrap account
CREDIT Process account
with the scrap value of the normal loss.
(c) The scrap value of abnormal loss is used to reduce the cost of abnormal loss as
follows
DEBIT Scrap account
CREDIT Abnormal loss account
with the scrap value of abnormal loss, which therefore reduces the write-off of
cost to the profit and loss account?
(d) The scrap value of abnormal gain arises because the actual units sold as scrap will
be less than the scrap value of normal loss. Because there are fewer units of scrap
than expected, there will be less revenue from scrap as a direct consequence of the
abnormal gain. The abnormal gain account should therefore be debited with the
scrap value.
DEBIT Abnormal gain account
CREDIT Scrap account
with the scrap value of abnormal gain.
(e) The scrap account is completed by recording the actual cash received from the
sale of scrap as follows
DEBIT Cash received
CREDIT Scrap account
with the cash received from the sale of the actual scrap.
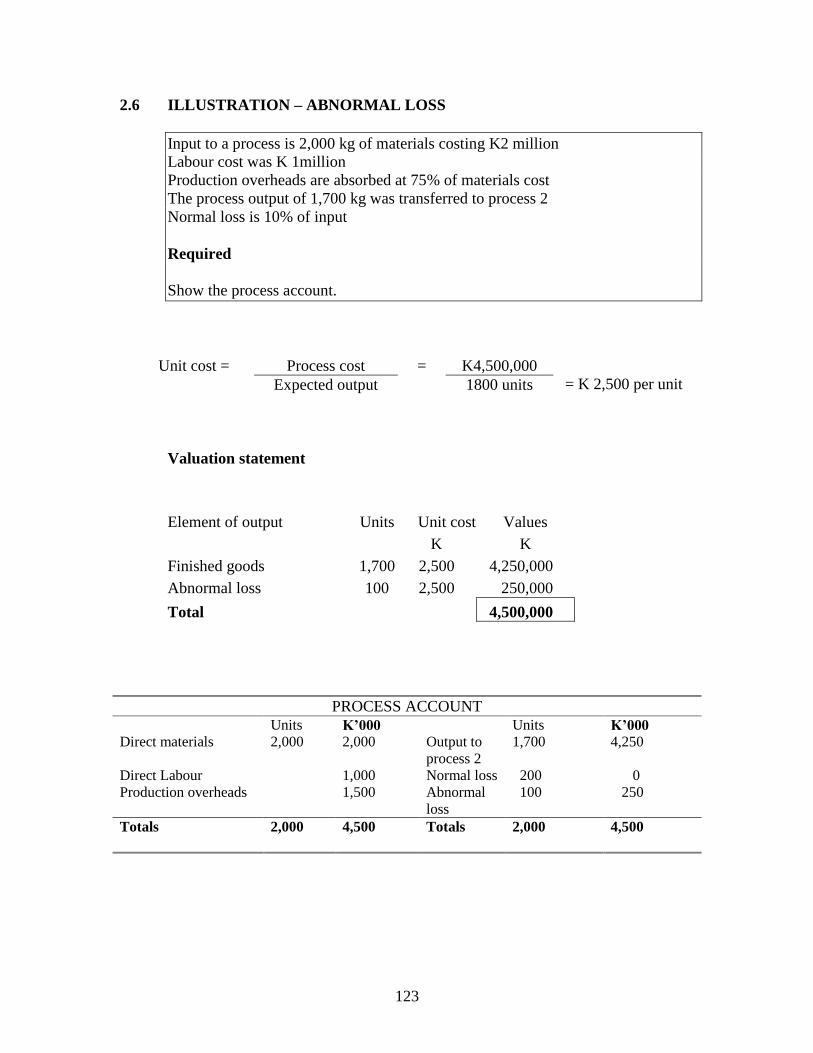
123
2.6 ILLUSTRATION – ABNORMAL LOSS
Input to a process is 2,000 kg of materials costing K2 million
Labour cost was K 1million
Production overheads are absorbed at 75% of materials cost
The process output of 1,700 kg was transferred to process 2
Normal loss is 10% of input
Required
Show the process account.
Unit cost = Process cost = K4,500,000
= K 2,500 per unit Expected output 1800 units
Valuation statement
Element of output Units Unit cost Values
K K
Finished goods 1,700 2,500 4,250,000
Abnormal loss 100 2,500 250,000
Total 4,500,000
PROCESS ACCOUNT
Units K’000 Units K’000
Direct materials 2,000 2,000 Output to
process 2
1,700 4,250
Direct Labour 1,000 Normal loss 200 0
Production overheads 1,500 Abnormal
loss
100 250
Totals
2,000 4,500 Totals 2,000 4,500
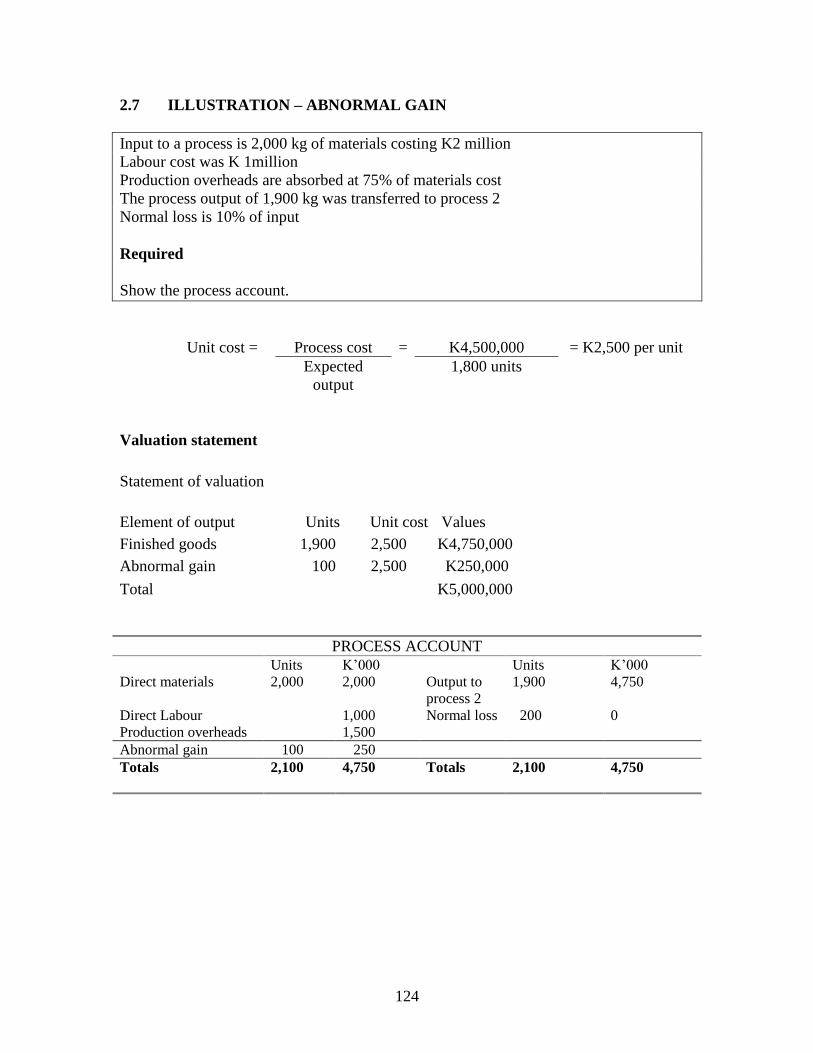
124
2.7 ILLUSTRATION – ABNORMAL GAIN
Input to a process is 2,000 kg of materials costing K2 million
Labour cost was K 1million
Production overheads are absorbed at 75% of materials cost
The process output of 1,900 kg was transferred to process 2
Normal loss is 10% of input
Required
Show the process account.
Unit cost = Process cost = K4,500,000 = K2,500 per unit
Expected
output
1,800 units
Valuation statement
Statement of valuation
Element of output Units Unit cost Values
Finished goods 1,900 2,500 K4,750,000
Abnormal gain 100 2,500 K250,000
Total K5,000,000
PROCESS ACCOUNT
Units K’000 Units K’000
Direct materials 2,000 2,000 Output to
process 2
1,900 4,750
Direct Labour 1,000 Normal loss 200 0
Production overheads 1,500
Abnormal gain 100 250
Totals
2,100 4,750 Totals 2,100 4,750
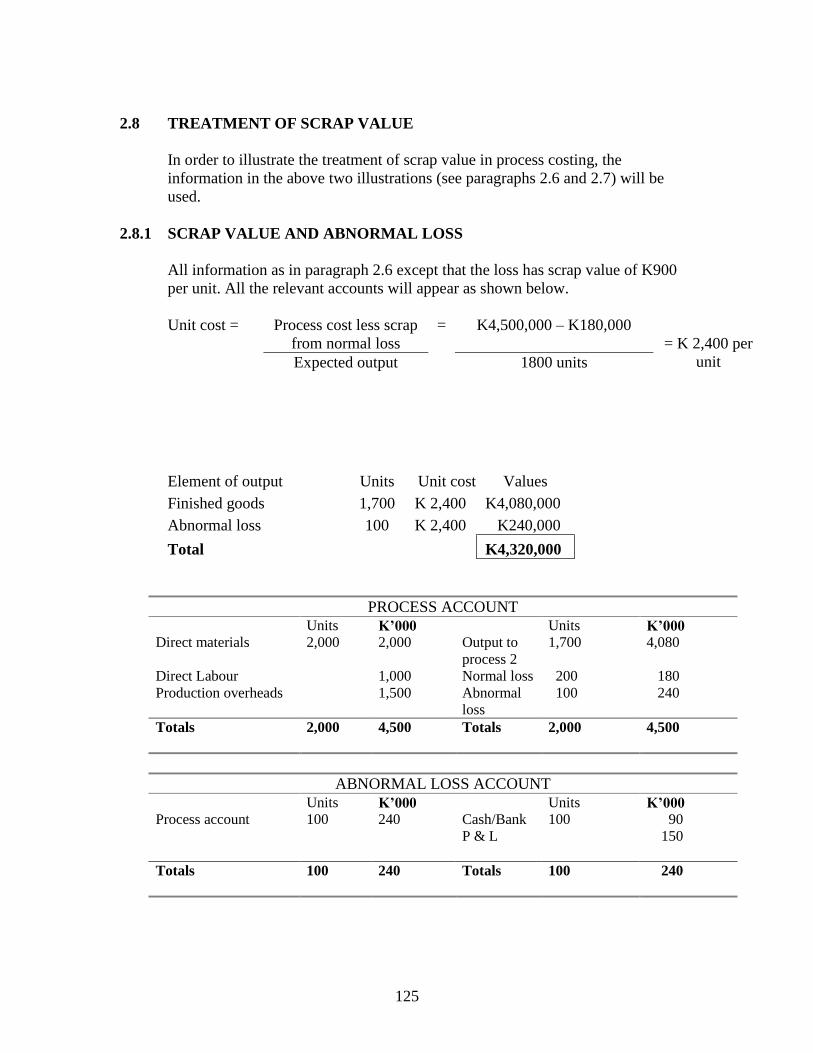
125
2.8 TREATMENT OF SCRAP VALUE
In order to illustrate the treatment of scrap value in process costing, the
information in the above two illustrations (see paragraphs 2.6 and 2.7) will be
used.
2.8.1 SCRAP VALUE AND ABNORMAL LOSS
All information as in paragraph 2.6 except that the loss has scrap value of K900
per unit. All the relevant accounts will appear as shown below.
Unit cost = Process cost less scrap
from normal loss
= K4,500,000 – K180,000
= K 2,400 per
unit Expected output 1800 units
Element of output Units Unit cost Values
Finished goods 1,700 K 2,400 K4,080,000
Abnormal loss 100 K 2,400 K240,000
Total K4,320,000
PROCESS ACCOUNT
Units K’000 Units K’000
Direct materials 2,000 2,000 Output to
process 2
1,700 4,080
Direct Labour 1,000 Normal loss 200 180
Production overheads 1,500 Abnormal
loss
100 240
Totals
2,000 4,500 Totals 2,000 4,500
ABNORMAL LOSS ACCOUNT
Units K’000 Units K’000
Process account 100 240 Cash/Bank 100 90
P & L 150
Totals
100 240 Totals 100 240
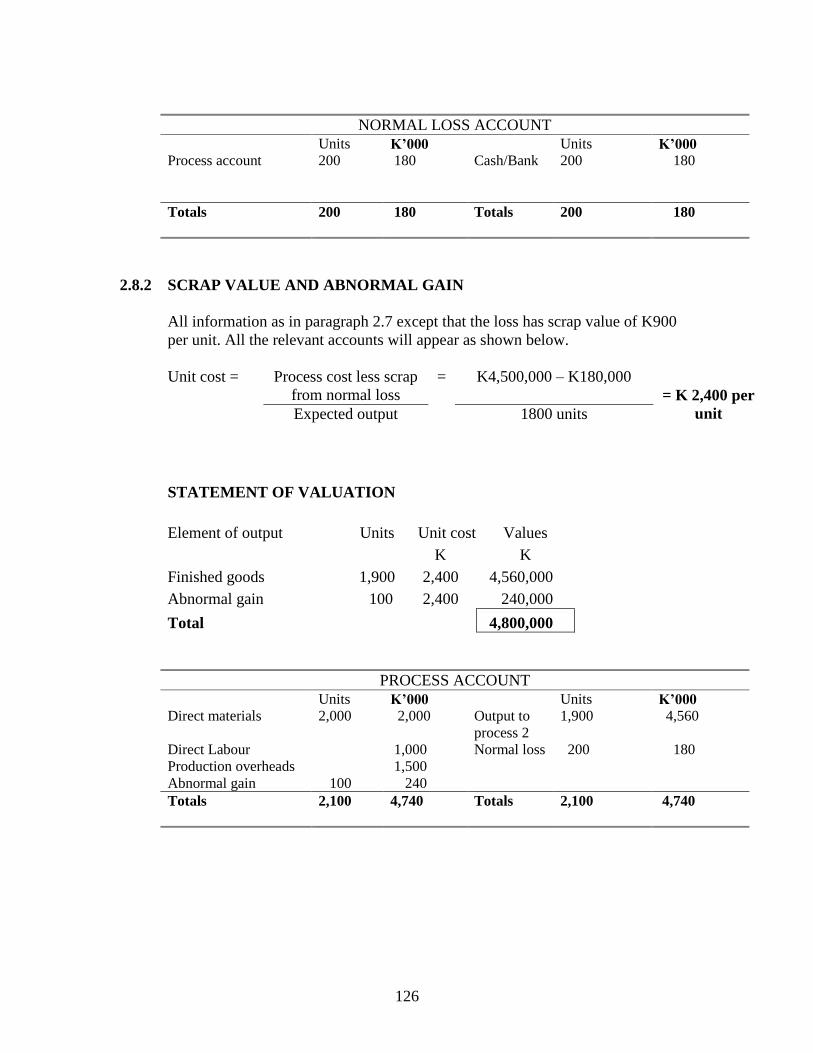
126
NORMAL LOSS ACCOUNT
Units K’000 Units K’000
Process account 200 180 Cash/Bank 200 180
Totals
200 180 Totals 200 180
2.8.2 SCRAP VALUE AND ABNORMAL GAIN
All information as in paragraph 2.7 except that the loss has scrap value of K900
per unit. All the relevant accounts will appear as shown below.
Unit cost = Process cost less scrap
from normal loss
= K4,500,000 – K180,000
= K 2,400 per
unit Expected output 1800 units
STATEMENT OF VALUATION
Element of output Units Unit cost Values
K K
Finished goods 1,900 2,400 4,560,000
Abnormal gain 100 2,400 240,000
Total 4,800,000
PROCESS ACCOUNT
Units K’000 Units K’000
Direct materials 2,000 2,000 Output to
process 2
1,900 4,560
Direct Labour 1,000 Normal loss 200 180
Production overheads 1,500
Abnormal gain 100 240
Totals
2,100 4,740 Totals 2,100 4,740
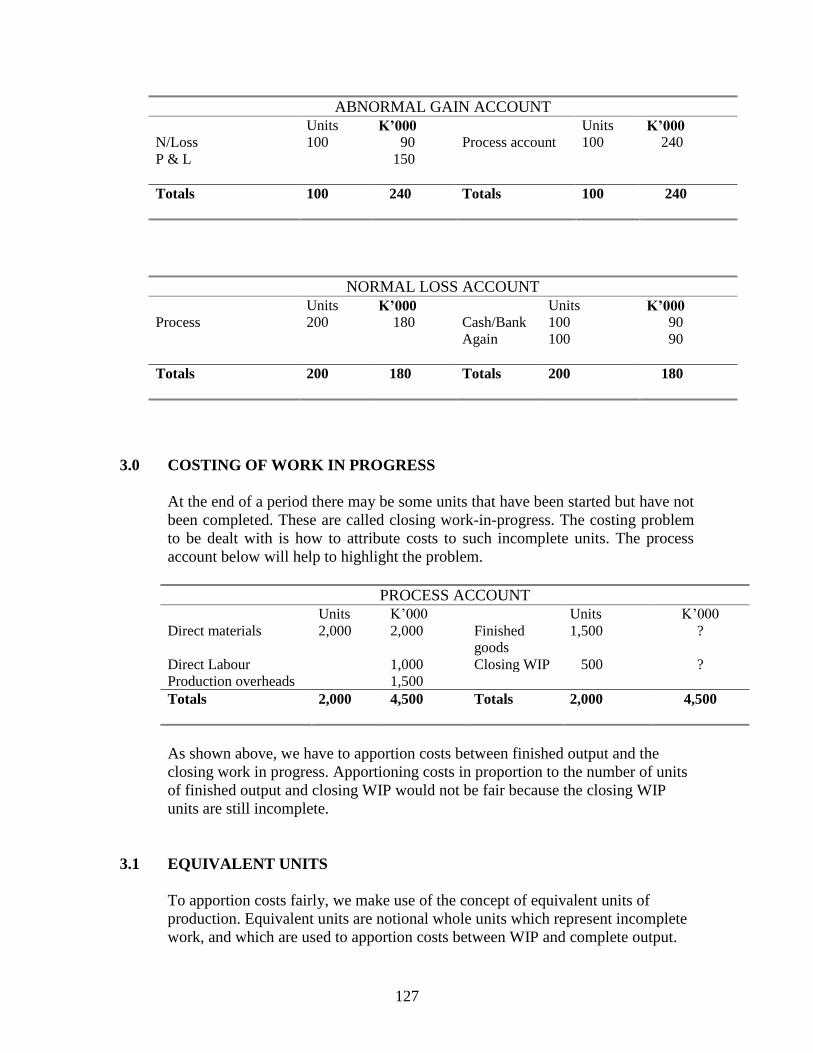
127
ABNORMAL GAIN ACCOUNT
Units K’000 Units K’000
N/Loss 100 90 Process account 100 240
P & L 150
Totals
100 240 Totals 100 240
NORMAL LOSS ACCOUNT
Units K’000 Units K’000
Process 200 180 Cash/Bank 100 90
Again 100 90
Totals
200 180 Totals 200 180
3.0 COSTING OF WORK IN PROGRESS
At the end of a period there may be some units that have been started but have not
been completed. These are called closing work-in-progress. The costing problem
to be dealt with is how to attribute costs to such incomplete units. The process
account below will help to highlight the problem.
PROCESS ACCOUNT
Units K’000 Units K’000
Direct materials 2,000 2,000 Finished
goods
1,500 ?
Direct Labour 1,000 Closing WIP 500 ?
Production overheads 1,500
Totals
2,000 4,500 Totals 2,000 4,500
As shown above, we have to apportion costs between finished output and the
closing work in progress. Apportioning costs in proportion to the number of units
of finished output and closing WIP would not be fair because the closing WIP
units are still incomplete.
3.1 EQUIVALENT UNITS
To apportion costs fairly, we make use of the concept of equivalent units of
production. Equivalent units are notional whole units which represent incomplete
work, and which are used to apportion costs between WIP and complete output.
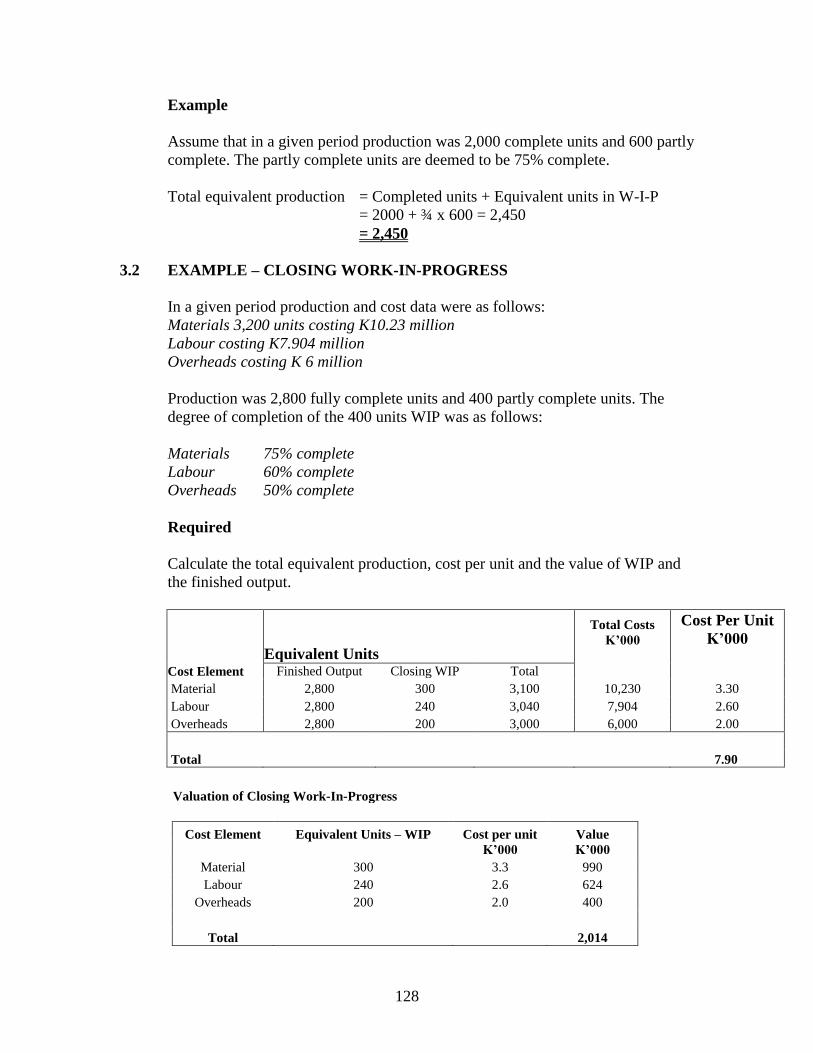
128
Example
Assume that in a given period production was 2,000 complete units and 600 partly
complete. The partly complete units are deemed to be 75% complete.
Total equivalent production = Completed units + Equivalent units in W-I-P
= 2000 + ¾ x 600 = 2,450
= 2,450
3.2 EXAMPLE – CLOSING WORK-IN-PROGRESS
In a given period production and cost data were as follows:
Materials 3,200 units costing K10.23 million
Labour costing K7.904 million
Overheads costing K 6 million
Production was 2,800 fully complete units and 400 partly complete units. The
degree of completion of the 400 units WIP was as follows:
Materials 75% complete
Labour 60% complete
Overheads 50% complete
Required
Calculate the total equivalent production, cost per unit and the value of WIP and
the finished output.
Cost Element
Equivalent Units
Total Costs
K’000
Cost Per Unit
K’000
Finished Output Closing WIP Total
Material 2,800 300 3,100 10,230 3.30
Labour 2,800 240 3,040 7,904 2.60
Overheads 2,800 200 3,000 6,000 2.00
Total 7.90
Valuation of Closing Work-In-Progress
Cost Element
Equivalent Units – WIP
Cost per unit
K’000
Value
K’000
Material 300 3.3 990
Labour 240 2.6 624
Overheads 200 2.0 400
Total 2,014
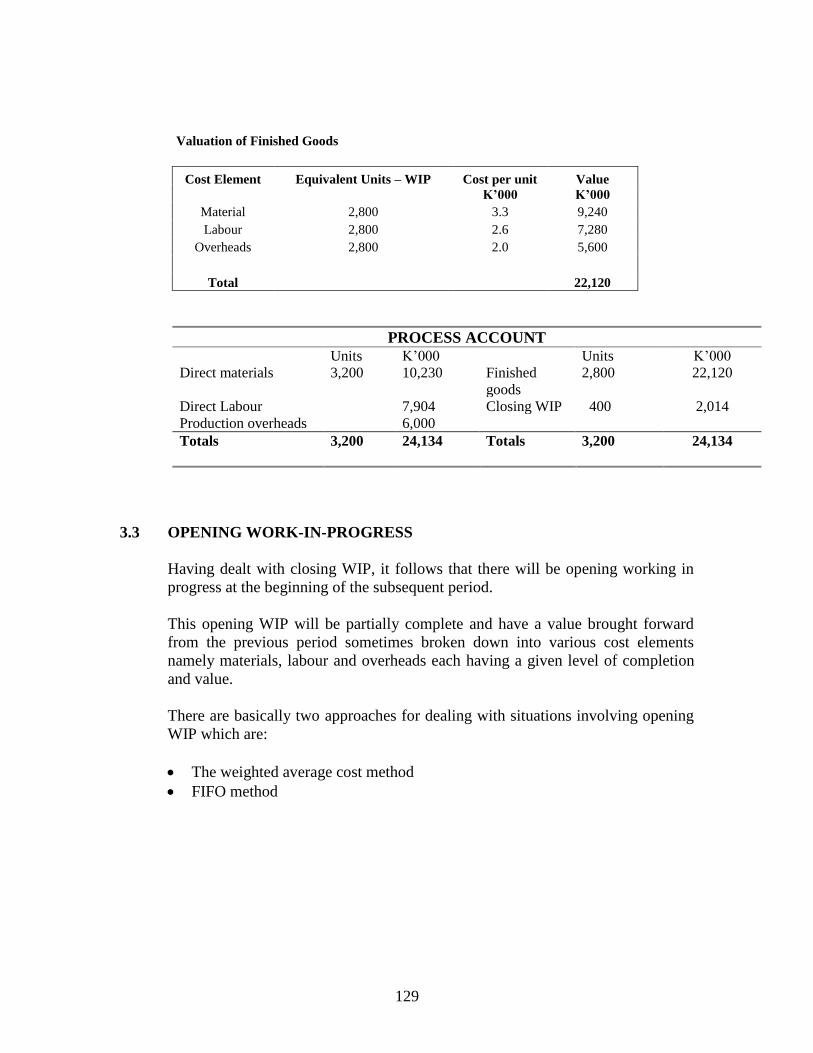
129
Valuation of Finished Goods
Cost Element
Equivalent Units – WIP
Cost per unit
K’000
Value
K’000
Material 2,800 3.3 9,240
Labour 2,800 2.6 7,280
Overheads 2,800 2.0 5,600
Total 22,120
PROCESS ACCOUNT
Units K’000 Units K’000
Direct materials 3,200 10,230 Finished
goods
2,800 22,120
Direct Labour 7,904 Closing WIP 400 2,014
Production overheads 6,000
Totals
3,200 24,134 Totals 3,200 24,134
3.3 OPENING WORK-IN-PROGRESS
Having dealt with closing WIP, it follows that there will be opening working in
progress at the beginning of the subsequent period.
This opening WIP will be partially complete and have a value brought forward
from the previous period sometimes broken down into various cost elements
namely materials, labour and overheads each having a given level of completion
and value.
There are basically two approaches for dealing with situations involving opening
WIP which are:
The weighted average cost method
FIFO method
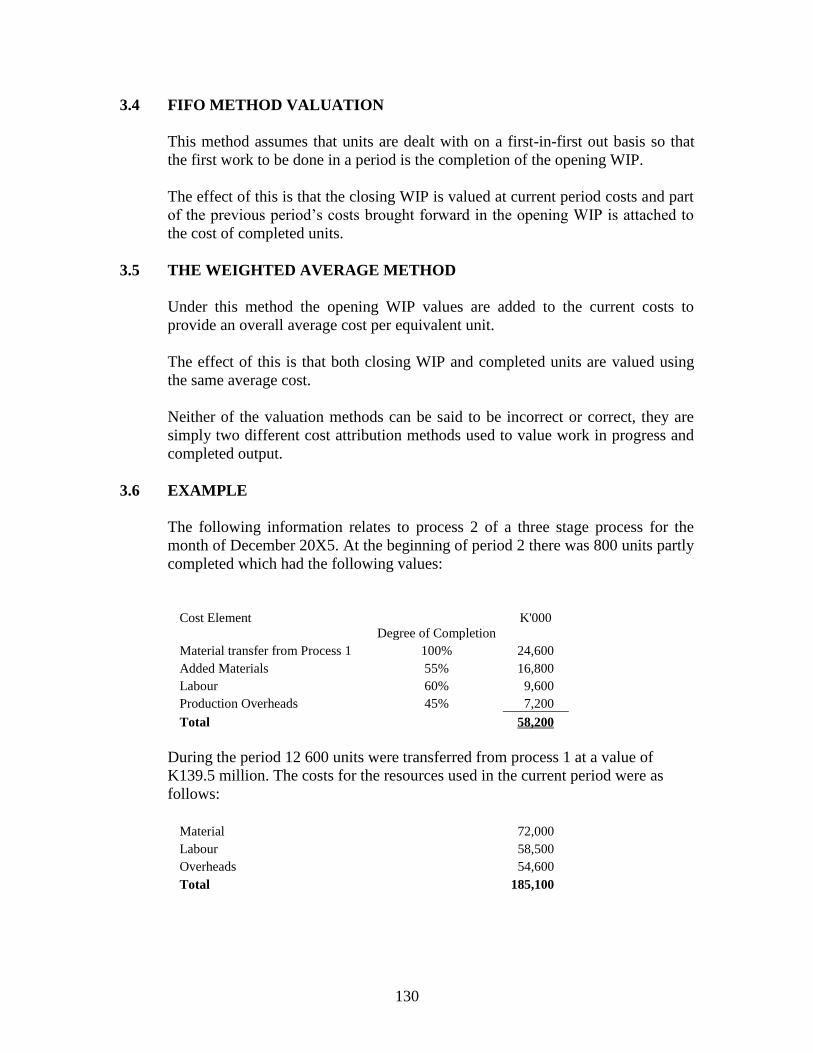
130
3.4 FIFO METHOD VALUATION
This method assumes that units are dealt with on a first-in-first out basis so that
the first work to be done in a period is the completion of the opening WIP.
The effect of this is that the closing WIP is valued at current period costs and part
of the previous period’s costs brought forward in the opening WIP is attached to
the cost of completed units.
3.5 THE WEIGHTED AVERAGE METHOD
Under this method the opening WIP values are added to the current costs to
provide an overall average cost per equivalent unit.
The effect of this is that both closing WIP and completed units are valued using
the same average cost.
Neither of the valuation methods can be said to be incorrect or correct, they are
simply two different cost attribution methods used to value work in progress and
completed output.
3.6 EXAMPLE
The following information relates to process 2 of a three stage process for the
month of December 20X5. At the beginning of period 2 there was 800 units partly
completed which had the following values:
Cost Element
Degree of Completion
K'000
Material transfer from Process 1 100% 24,600
Added Materials 55% 16,800
Labour 60% 9,600
Production Overheads 45% 7,200
Total 58,200
During the period 12 600 units were transferred from process 1 at a value of
K139.5 million. The costs for the resources used in the current period were as
follows:
Material 72,000
Labour 58,500
Overheads 54,600
Total 185,100
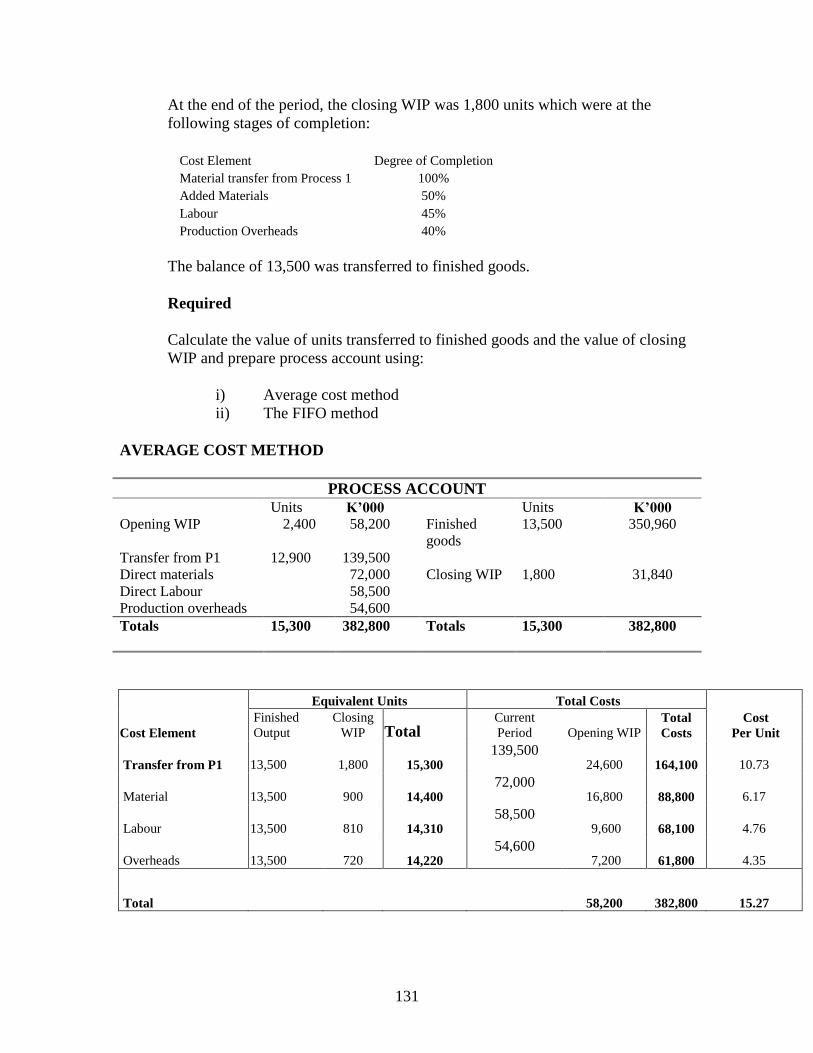
131
At the end of the period, the closing WIP was 1,800 units which were at the
following stages of completion:
Cost Element Degree of Completion
Material transfer from Process 1 100%
Added Materials 50%
Labour 45%
Production Overheads 40%
The balance of 13,500 was transferred to finished goods.
Required
Calculate the value of units transferred to finished goods and the value of closing
WIP and prepare process account using:
i) Average cost method
ii) The FIFO method
AVERAGE COST METHOD
PROCESS ACCOUNT
Units K’000 Units K’000
Opening WIP 2,400 58,200 Finished
goods
13,500 350,960
Transfer from P1 12,900 139,500
Direct materials 72,000 Closing WIP 1,800 31,840
Direct Labour 58,500
Production overheads 54,600
Totals
15,300 382,800 Totals 15,300 382,800
Cost Element
Equivalent Units Total Costs
Cost
Per Unit
Finished
Output
Closing
WIP Total Current
Period Opening WIP Total
Costs
Transfer from P1
13,500 1,800 15,300 139,500
24,600 164,100 10.73
Material
13,500 900 14,400 72,000
16,800 88,800 6.17
Labour
13,500 810 14,310 58,500
9,600 68,100 4.76
Overheads
13,500 720 14,220 54,600
7,200 61,800 4.35
Total 58,200 382,800 15.27
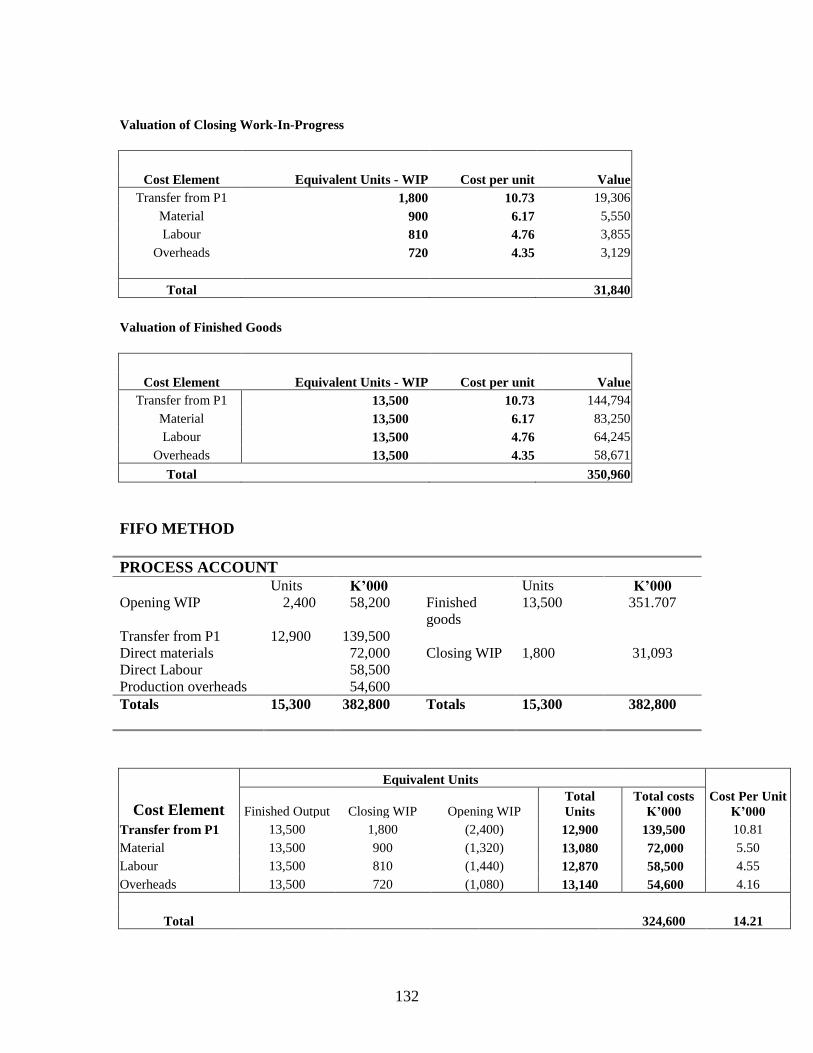
132
Valuation of Closing Work-In-Progress
Cost Element Equivalent Units - WIP Cost per unit Value
Transfer from P1 1,800 10.73 19,306
Material 900 6.17 5,550
Labour 810 4.76 3,855
Overheads 720 4.35 3,129
Total 31,840
Valuation of Finished Goods
Cost Element Equivalent Units - WIP Cost per unit Value
Transfer from P1 13,500 10.73 144,794
Material 13,500 6.17 83,250
Labour 13,500 4.76 64,245
Overheads 13,500 4.35 58,671
Total 350,960
FIFO METHOD
PROCESS ACCOUNT
Units K’000 Units K’000
Opening WIP 2,400 58,200 Finished
goods
13,500 351.707
Transfer from P1 12,900 139,500
Direct materials 72,000 Closing WIP 1,800 31,093
Direct Labour 58,500
Production overheads 54,600
Totals
15,300 382,800 Totals 15,300 382,800
Cost Element
Equivalent Units
Cost Per Unit
K’000 Finished Output Closing WIP Opening WIP Total
Units
Total costs
K’000
Transfer from P1 13,500 1,800 (2,400) 12,900 139,500 10.81
Material 13,500 900 (1,320) 13,080 72,000 5.50
Labour 13,500 810 (1,440) 12,870 58,500 4.55
Overheads 13,500 720 (1,080) 13,140 54,600 4.16
Total 324,600 14.21
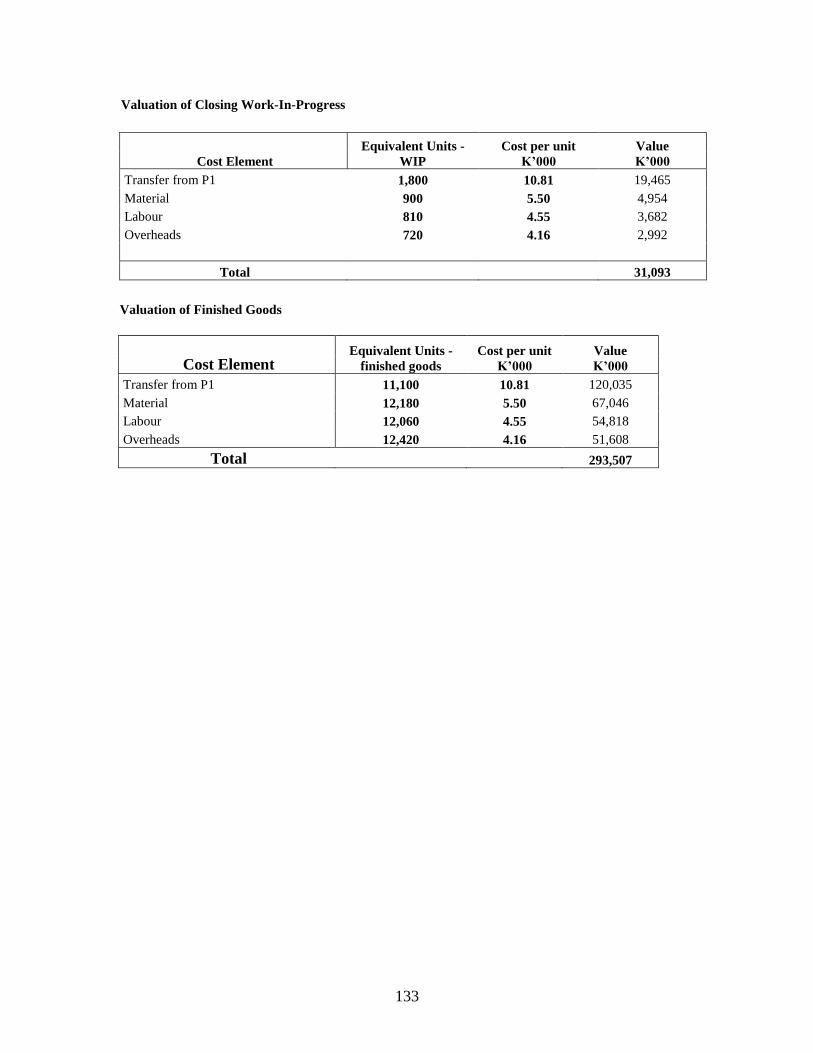
133
Valuation of Closing Work-In-Progress
Cost Element
Equivalent Units -
WIP
Cost per unit
K’000
Value
K’000
Transfer from P1 1,800 10.81 19,465
Material 900 5.50 4,954
Labour 810 4.55 3,682
Overheads 720 4.16 2,992
Total 31,093
Valuation of Finished Goods
Cost Element Equivalent Units -
finished goods
Cost per unit
K’000
Value
K’000
Transfer from P1 11,100 10.81 120,035
Material 12,180 5.50 67,046
Labour 12,060 4.55 54,818
Overheads 12,420 4.16 51,608
Total 293,507
134
STUDENT-SELF TESTING
SELF REVIEW QUESTIONS
1. Give examples of industries which use process costing (1.0 )
2. What are the key features of process operations (1.2 )
3. What is normal loss (2.1 )
4. What is abnormal loss (2.2 )
5. What is abnormal gain ( 2.3)
6. How is scrap value treated in process costing (2.81 )
7. Define equivalent units (3.1 )
8. Mention two approaches for dealing with opening WIP (3.3 )
EXAMINATION TYPE QUESTIONS
Dude Kings Limited produces a detergent paste by putting it through a single process.
You are given the following details for period 2:
Input costs were 50,000 kilos at K496 per kilo
Labour costs for 16,000 hours at K1,100 per hour
Over heads costs were K12,600,000
You are also informed that:
i) Normal loss is 4%
ii) Scrap value of normal loss is K400 per kilo
iii) Finished output amounted to 30,000 units
iv) Closing WIP amounted to 12,000 units and was fully complete for materials, ⅔
complete for labour and ½ complete for overheads.
v) There was no opening WIP
REQUIRED
a) Prepare the process account for period 2 detailing the value of the finished units and
the work-in-progress. (10 marks)
b) Prepare an abnormal loss account. (2 marks)
135
CHAPTER 13
PROCESS COSTING – BY PRODUCTS AND JOINT
PRODUCTS
INTRODUCTION
The previous chapter introduced the process costing method including the treatment for
losses and work in progress. This chapter will deal with further complications in process
costing where two or more products are output from the same process. When this
happens the output items are called joint products or by products. In this chapter,
attention will be focused on how to apportion the common process costs between joint
products and by-products.
CONTENTS
1. The nature of joint products and by-products.
2. Joint costs.
3. Costing joint products.
4. Costing by products.
5. Further processing decisions.
LEARNING OUTCOMES
After studying this chapter you should be able to:
Distinguish between joint products and by-products.
Explain the treatment of joint products and by-products at the point of separation.
Value by-products and joint products at the point of separation.
Discuss the usefulness of the cost and profit data for joint products.
Decide whether to further process products or not.
136
1.0 CONTRASTING JOINT PRODUCTS AND BY-PRODUCTS
A single process might produce a number of different products. For example a
chemical process such as oil refining might produce several products such as
diesel, petrol, paraffin and lubricants from a single process. Some of these
products could be classified as joint products while others would be by-products.
1.1 Before going further, the following key terms would be defined:
Joint products.
By-products.
Joint costs.
Split-off point.
1.2 Joint products
Joint products are two or more products which are output from the same
processing operation, but which are indistinguishable from each other up to their
point of separation. They have significant or material sales value in relation to by-
products.
1.3 By-products
A by-product is a supplementary or secondary product whose value is small
relative to that of the principal product.
1.4 Split-off point
Split-off point in a manufacturing operation is the point during manufacture
where two or more products are produced from a common process. Items
produced at the split-off point are either sold in their current form or put through
further processing before sale.
1.5 Joint costs
Joint costs or pre-separation costs are the costs incurred in a process up to the
split-off point and must be apportioned amongst the products produced by the
process.
1.6 WHAT EXACTLY SEPARATES A JOINT PRODUCT FROM A BY-
PRODUCT?
Joint products have substantial sales value. They are regarded as important
saleable items which should be costed separately and whose profitability should
be analysed in the cost accounts.
137
The distinguishing feature of a by-product is its relatively low sales value in
comparison to the main product. By-products are not an important saleable item
and whatever revenue it earns is a bonus for the organization. Because of their
relative insignificance, by products are not separately costed.
2.0 PROBLEMS IN ACCOUNTING FOR JOINT COSTS
The problems in accounting for joint products relate to two main issues, namely:
How common costs should be apportioned between products in order to put
value on closing stocks and the cost of sales for each product.
Whether it is more profitable to sell a joint product at one stage of processing
or to process the product further and sell it at a later stage
2.1 DEALING WITH COMMON COST
The problem of costing joint products concerns common costs, i.e. those
processing costs shared between the units of eventual output up to their split-off-
point.
Some method needs to be devised for sharing the common costs between the
individual joint products for the following reasons:
To put a value to closing stocks of each joint product.
To record the costs and therefore the profit from each joint product
To assist in pricing
2.2 Various methods might be used to establish the basis for apportioning or
allocating common costs to each product including:
Physical measurement
Sales value at split-off-point
Net realizable value
2.3 Example
A process produces three joint products with the following volume and sales
values at the split-off point:
Product Quantities in Kg Selling price per Kg
(Kwacha)
X 100,000 5,000
Y 20,000 10,000
Z 80,000 4,500
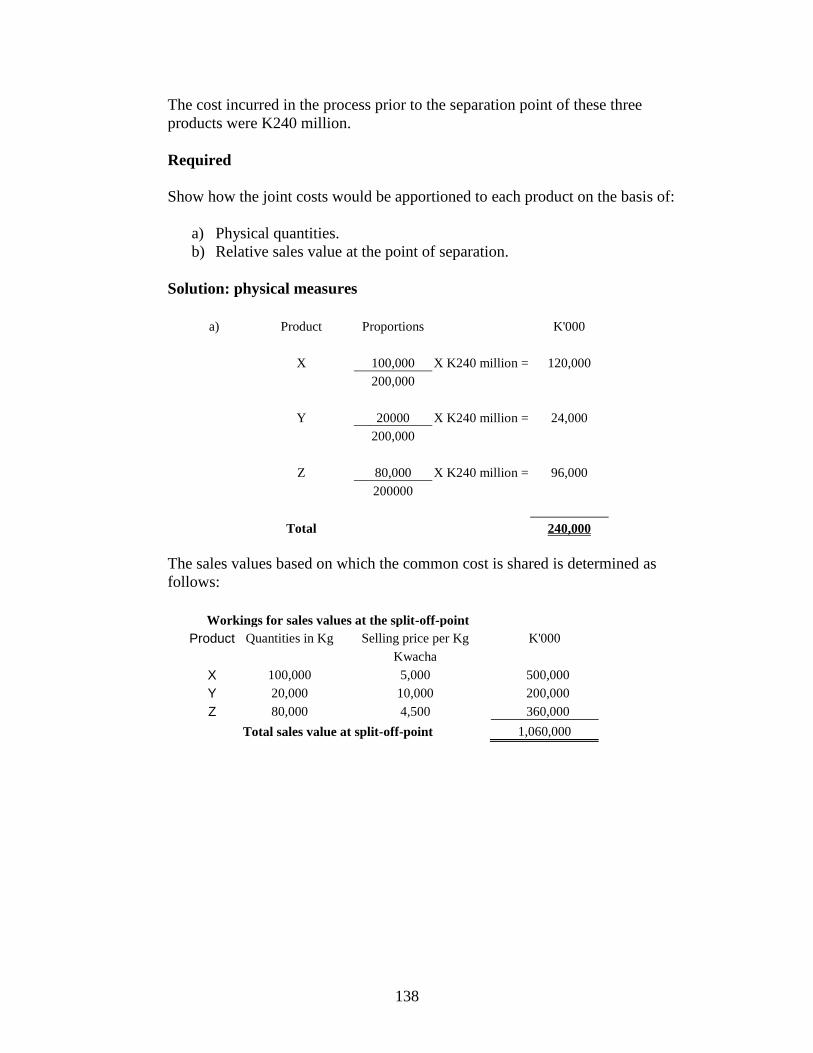
138
The cost incurred in the process prior to the separation point of these three
products were K240 million.
Required
Show how the joint costs would be apportioned to each product on the basis of:
a) Physical quantities.
b) Relative sales value at the point of separation.
Solution: physical measures
a) Product Proportions K'000
X 100,000 X K240 million = 120,000
200,000
Y 20000 X K240 million = 24,000
200,000
Z 80,000 X K240 million = 96,000
200000
Total 240,000
The sales values based on which the common cost is shared is determined as
follows:
Workings for sales values at the split-off-point
Product Quantities in Kg Selling price per Kg K'000
Kwacha
X 100,000 5,000 500,000
Y 20,000 10,000 200,000
Z 80,000 4,500 360,000
Total sales value at split-off-point 1,060,000
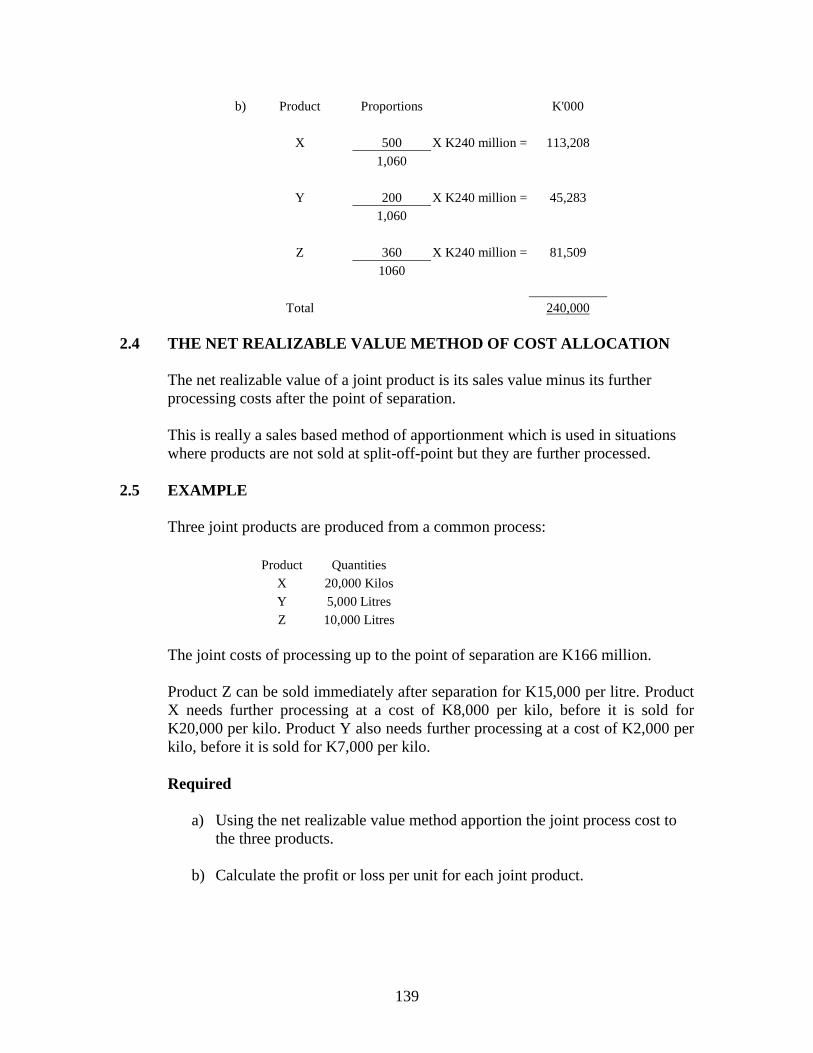
139
b) Product Proportions K'000
X 500 X K240 million = 113,208
1,060
Y 200 X K240 million = 45,283
1,060
Z 360 X K240 million = 81,509
1060
Total 240,000
2.4 THE NET REALIZABLE VALUE METHOD OF COST ALLOCATION
The net realizable value of a joint product is its sales value minus its further
processing costs after the point of separation.
This is really a sales based method of apportionment which is used in situations
where products are not sold at split-off-point but they are further processed.
2.5 EXAMPLE
Three joint products are produced from a common process:
Product Quantities
X 20,000 Kilos
Y 5,000 Litres
Z 10,000 Litres
The joint costs of processing up to the point of separation are K166 million.
Product Z can be sold immediately after separation for K15,000 per litre. Product
X needs further processing at a cost of K8,000 per kilo, before it is sold for
K20,000 per kilo. Product Y also needs further processing at a cost of K2,000 per
kilo, before it is sold for K7,000 per kilo.
Required
a) Using the net realizable value method apportion the joint process cost to
the three products.
b) Calculate the profit or loss per unit for each joint product.
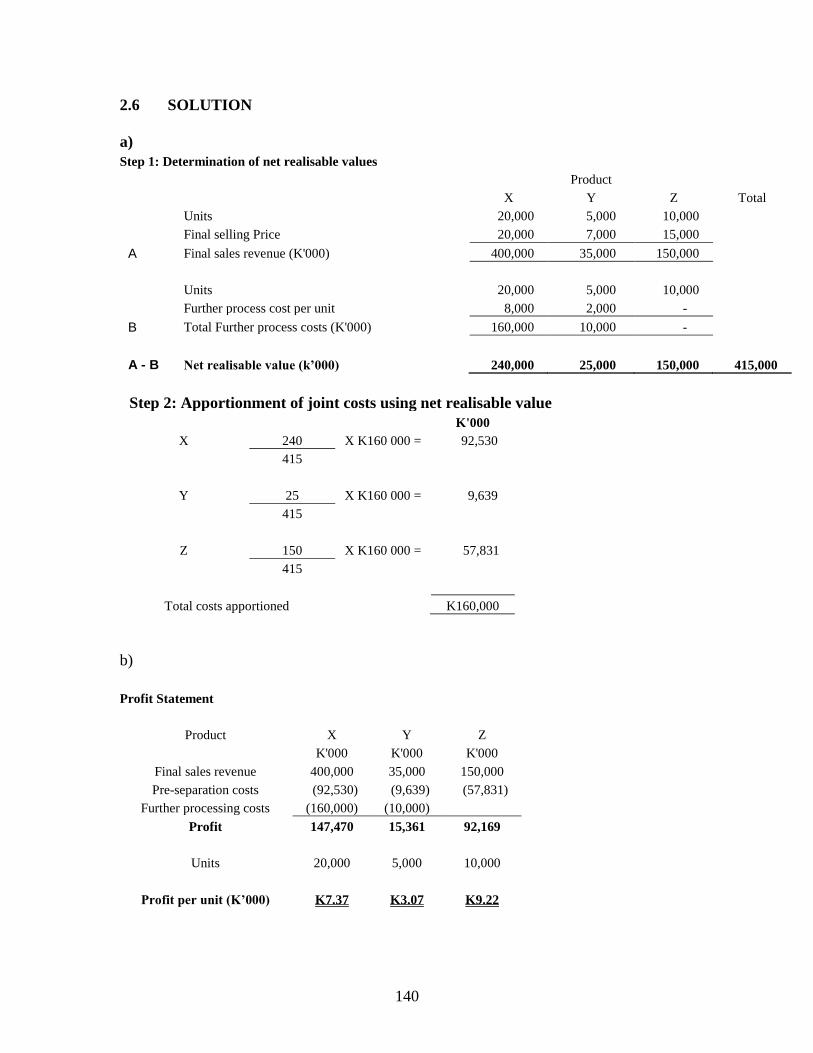
140
2.6 SOLUTION
a)
Step 1: Determination of net realisable values
Product
X Y Z Total
Units 20,000 5,000 10,000
Final selling Price 20,000 7,000 15,000
A Final sales revenue (K'000) 400,000 35,000 150,000
Units 20,000 5,000 10,000
Further process cost per unit 8,000 2,000 -
B Total Further process costs (K'000) 160,000 10,000 -
A - B Net realisable value (k’000) 240,000 25,000 150,000 415,000
Step 2: Apportionment of joint costs using net realisable value
K'000
X 240 X K160 000 = 92,530
415
Y 25 X K160 000 = 9,639
415
Z 150 X K160 000 = 57,831
415
Total costs apportioned K160,000
b)
Profit Statement
Product X Y Z
K'000 K'000 K'000
Final sales revenue 400,000 35,000 150,000
Pre-separation costs (92,530) (9,639) (57,831)
Further processing costs (160,000) (10,000)
Profit 147,470 15,361 92,169
Units 20,000 5,000 10,000
Profit per unit (K’000) K7.37 K3.07 K9.22
141
3.0 ACCOUNTING FOR BY-PRODUCTS
Since by products have very little sales value, it is pointless to try working out a
cost and a profit for units of by products. By-products are incidental output, not
main products.
3.1 Accounting treatment of revenue from by-products:
Method 1
Income from the sale of by-product may be added to the sales of the main
product, there by increasing sales turnover for the period.
Method 2
Instead of adding the income from by-product sales to total sales income in the
profit and loss account, deduct the sales value of the by-product from the common
processing costs. The pre separation costs for apportioning between joint products
is therefore the actual pre-separation costs minus sales value of the by-products.
4.0 EVALUATING THE BENEFIT OF FURTHER PROCESSING
A completely different costing problem arises when management decides what to
do with joint products after the point of separation. A joint product might be in a
condition to sell at the point of separation, but can also be processed further to sell
at a higher selling price. In such cases management have to decide whether to sell
the product immediately after the point of separation or whether to sell the
product further before selling it.
4.1 Approach to the problem is as follows:
The pre-separation costs of the common processing of the joint products are
irrelevant to the further processing decision. The joint costs are not affected by
whether individual products are further processed, and are therefore not relevant
to the decision under consideration.
In deciding whether to further process the individual product, incremental costs
and revenues should be evaluated. Products whose additional revenue exceeds
additional costs are the ones that should be further processed on financial
grounds.
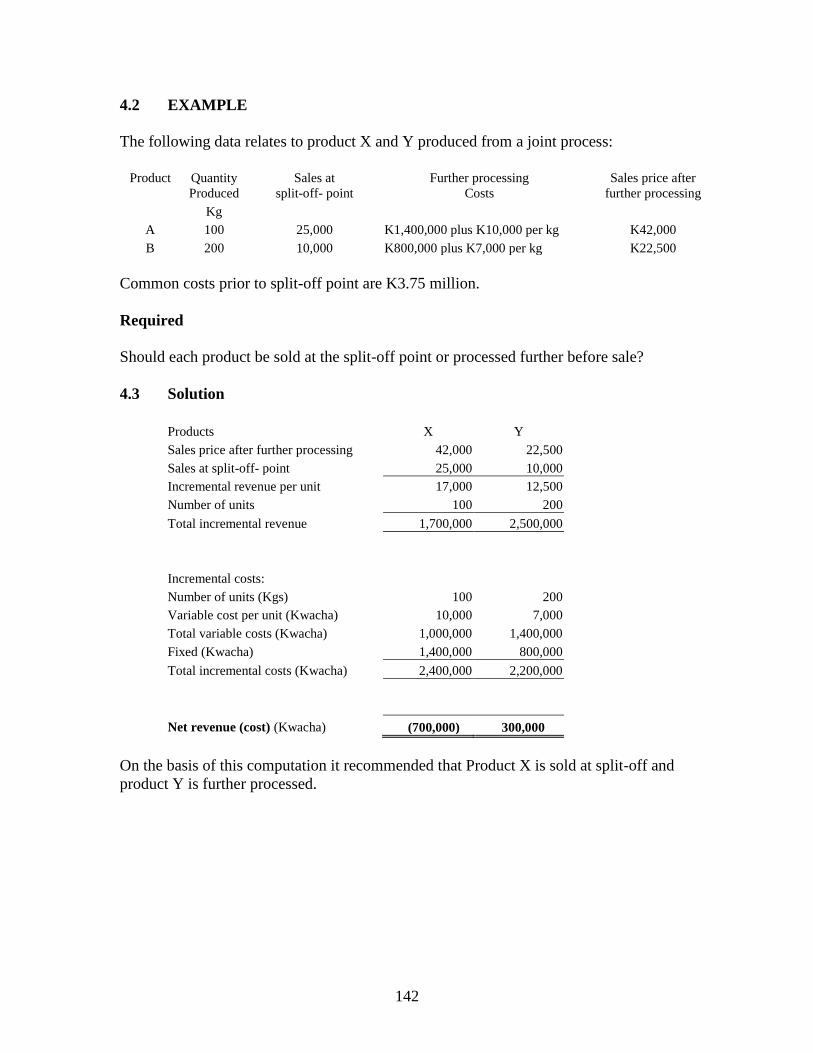
142
4.2 EXAMPLE
The following data relates to product X and Y produced from a joint process:
Product
Quantity
Produced
Sales at
split-off- point
Further processing
Costs
Sales price after
further processing
Kg
A 100 25,000 K1,400,000 plus K10,000 per kg K42,000
B 200 10,000 K800,000 plus K7,000 per kg K22,500
Common costs prior to split-off point are K3.75 million.
Required
Should each product be sold at the split-off point or processed further before sale?
4.3 Solution
Products X Y
Sales price after further processing 42,000 22,500
Sales at split-off- point 25,000 10,000
Incremental revenue per unit 17,000 12,500
Number of units 100 200
Total incremental revenue 1,700,000 2,500,000
Incremental costs:
Number of units (Kgs) 100 200
Variable cost per unit (Kwacha) 10,000 7,000
Total variable costs (Kwacha) 1,000,000 1,400,000
Fixed (Kwacha) 1,400,000 800,000
Total incremental costs (Kwacha) 2,400,000 2,200,000
Net revenue (cost) (Kwacha) (700,000) 300,000
On the basis of this computation it recommended that Product X is sold at split-off and
product Y is further processed.
143
Chapter summary
Joint products are two or more products separated in a process, each of which has
a significant sales value compared to the other.
A by-product is an incidental product from a process which has insignificant sales
value compared to the main product
The split-off-point or separation point is the point at which joint and by-products
become separately identifiable.
Joint costs are pre-separation costs incurred up to the separation point
The main methods of apportioning joint costs, each of which can produce
significantly different results.
o Physical measures
o Sales value at split off-point
o Net realisable method
By-products are not costed, but revenue which they generate can be directly
added to sales or be deducted from the process costs.
Where there is a possibility to further process joint products, the decision must be
made by comparing incremental costs and revenue.
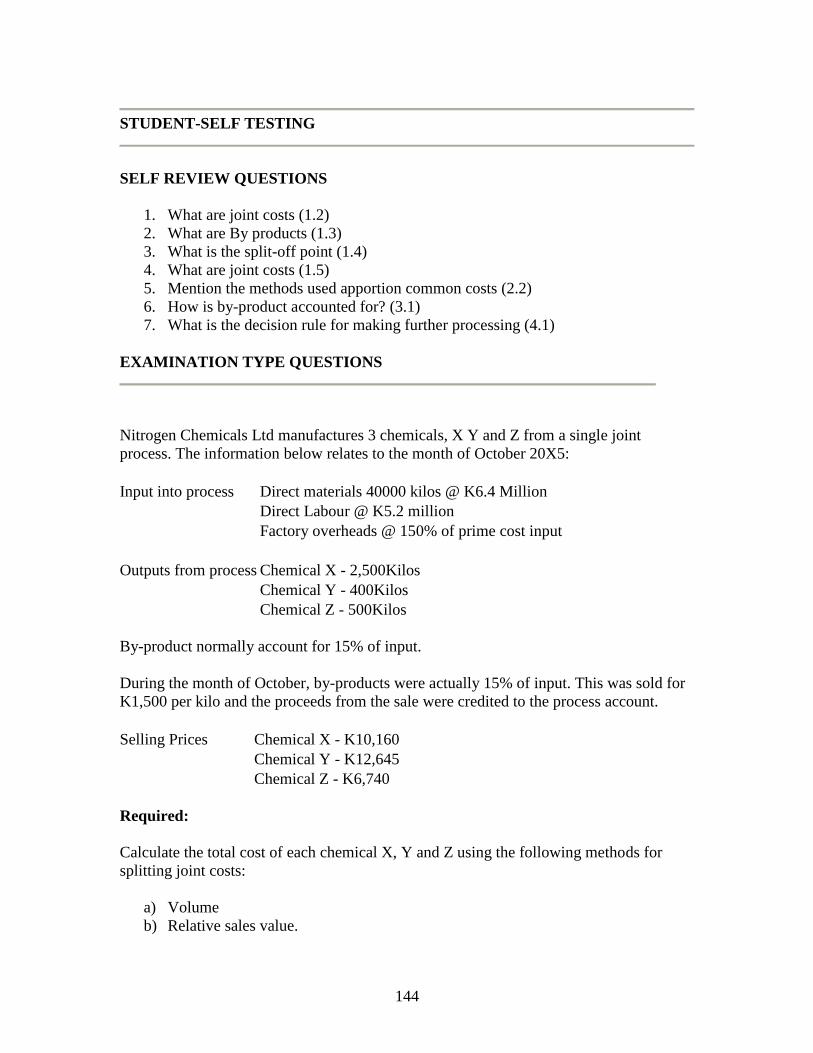
144
STUDENT-SELF TESTING
SELF REVIEW QUESTIONS
1. What are joint costs (1.2)
2. What are By products (1.3)
3. What is the split-off point (1.4)
4. What are joint costs (1.5)
5. Mention the methods used apportion common costs (2.2)
6. How is by-product accounted for? (3.1)
7. What is the decision rule for making further processing (4.1)
EXAMINATION TYPE QUESTIONS
Nitrogen Chemicals Ltd manufactures 3 chemicals, X Y and Z from a single joint
process. The information below relates to the month of October 20X5:
Input into process Direct materials 40000 kilos @ K6.4 Million
Direct Labour @ K5.2 million
Factory overheads @ 150% of prime cost input
Outputs from process Chemical X - 2,500Kilos
Chemical Y - 400Kilos
Chemical Z - 500Kilos
By-product normally account for 15% of input.
During the month of October, by-products were actually 15% of input. This was sold for
K1,500 per kilo and the proceeds from the sale were credited to the process account.
Selling Prices Chemical X - K10,160
Chemical Y - K12,645
Chemical Z - K6,740
Required:
Calculate the total cost of each chemical X, Y and Z using the following methods for
splitting joint costs:
a) Volume
b) Relative sales value.
145
CHAPTER 14
SERVICE COSTING
Introduction
In the previous chapters we have considered costing methods which are relevant to
manufacturing operations. In this chapter we turn our attention to service costing, i.e.
costing methods which are relevant to service organizations such as hospitals and
education establishments. This costing method can also be used to cost output of service
departments within an organisation. Service costing is widely used today because more
and more entities are operating in the service industry rather than manufacturing.
CONTENTS
1. What is service costing?
2. Service costs and cost units.
3. Service costs analysis in service industry.
4. Service costing for internal services.
LEARNING OUTCOMES
After studying this chapter you should be able to:
Describe the circumstances in which service costing should be used.
Explain the practical problems that can arise with the costing of services.
Illustrate suitable cost units that can be used in a variety of different service
operations.
Carry out service cost analysis in service industry situations.
Carry out service cost analysis in internal service situations.
146
1.0 What is service costing?
Service costing is a costing method concerned with establishing the costs, not of
products but of services rendered.
1.1 When to use service costing
Service costing is used in the following circumstances:
A company operating in the service industry will use service costing to
cost its output to customers. Examples of service companies are telephone
companies, power companies, auditing and management consulting firms.
A service department such as IT department or repairs and maintenance
within an organisation can use service costing methodology to cost the
work done for various internal departments.
1.2 Service costing compared with product costing
The cost of direct materials will be relatively small compared with the costs of
direct labour, direct expenses and overheads
Indirect costs will generally represent a higher proportion of total costs.
1.3 Comparison of a product and service
Specific characteristics of services that distinguish them from products are
intangibility, simultaneity, perishability and heterogeneity.
Intangibility – a service such as a hair cut is intangible.
Simultaneity – the production and consumption of a service take place at
the same time.
Perishability – a service cannot be stored for future consumption.
Heterogeneity – service provided cannot be exactly the same every time.
1.4 Service costs and cost units
A major problem in service industries is the selection of a suitable unit for
measuring the service. It is not easy to decide what service is actually being
provided and what measures of performance are most appropriate to the control of
costs. Frequently a composite unit may be deemed more appropriate.
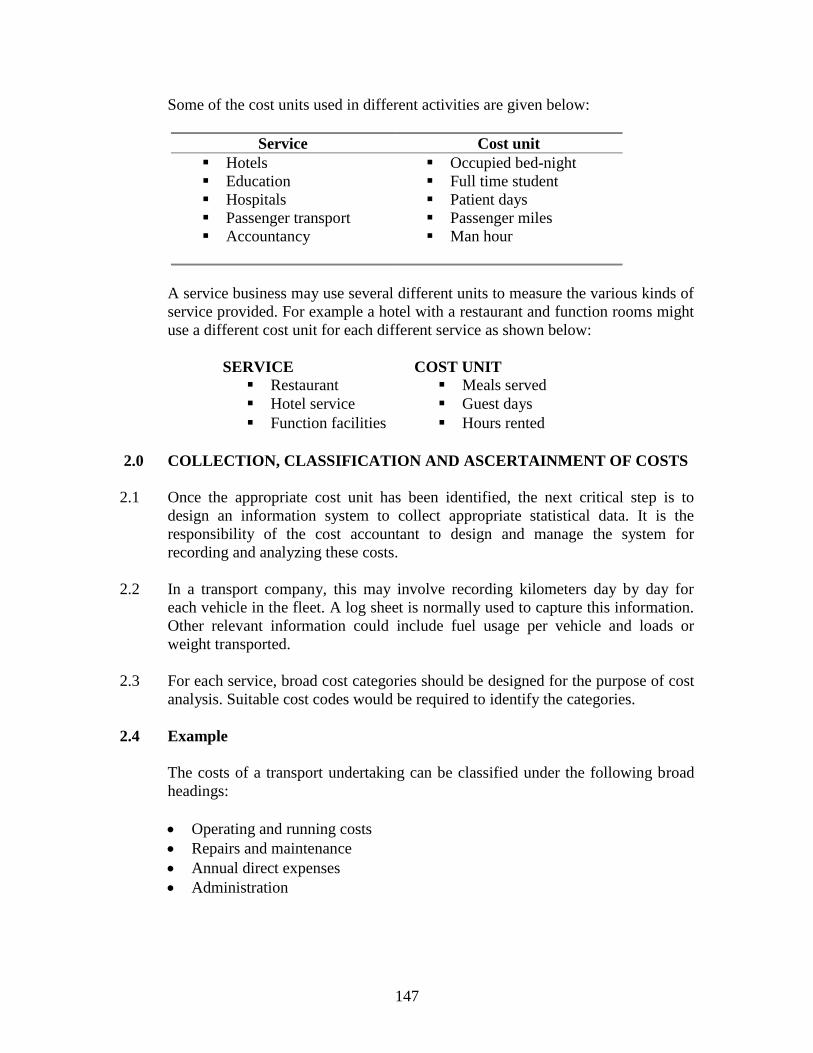
147
Some of the cost units used in different activities are given below:
Service Cost unit
Hotels Occupied bed-night
Education Full time student
Hospitals Patient days
Passenger transport Passenger miles
Accountancy Man hour
A service business may use several different units to measure the various kinds of
service provided. For example a hotel with a restaurant and function rooms might
use a different cost unit for each different service as shown below:
SERVICE COST UNIT
Restaurant Meals served
Hotel service Guest days
Function facilities Hours rented
2.0 COLLECTION, CLASSIFICATION AND ASCERTAINMENT OF COSTS
2.1 Once the appropriate cost unit has been identified, the next critical step is to
design an information system to collect appropriate statistical data. It is the
responsibility of the cost accountant to design and manage the system for
recording and analyzing these costs.
2.2 In a transport company, this may involve recording kilometers day by day for
each vehicle in the fleet. A log sheet is normally used to capture this information.
Other relevant information could include fuel usage per vehicle and loads or
weight transported.
2.3 For each service, broad cost categories should be designed for the purpose of cost
analysis. Suitable cost codes would be required to identify the categories.
2.4 Example
The costs of a transport undertaking can be classified under the following broad
headings:
Operating and running costs
Repairs and maintenance
Annual direct expenses
Administration
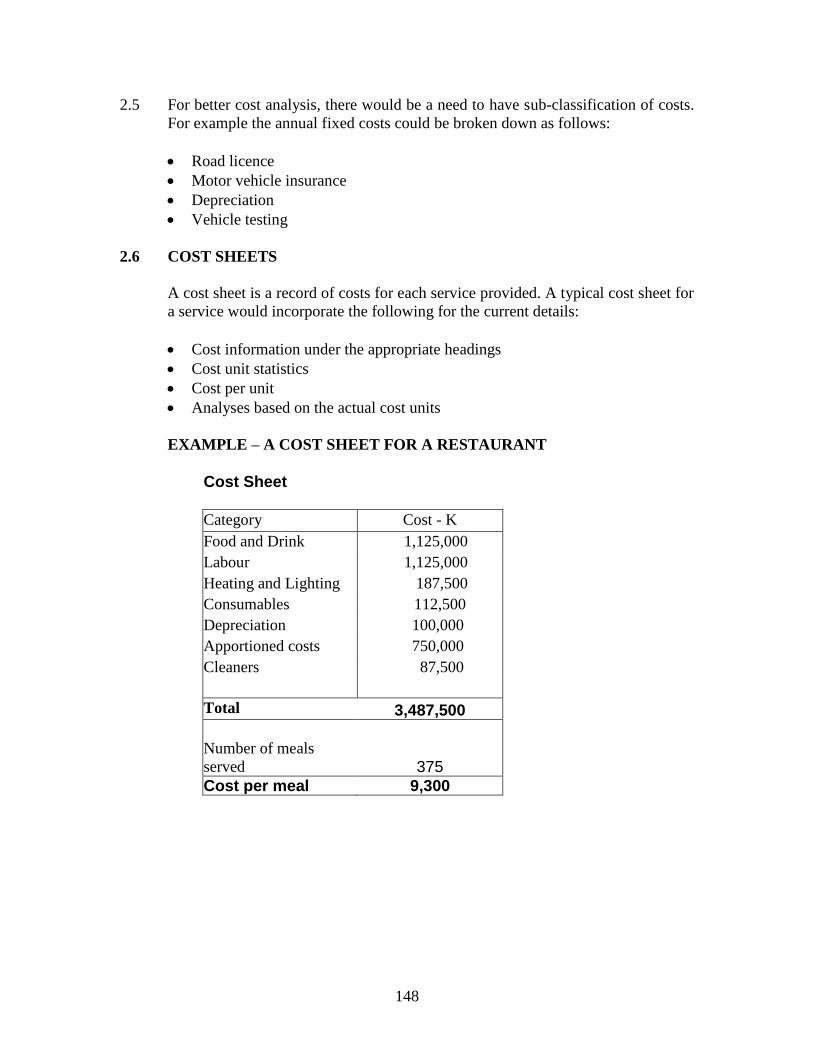
148
2.5 For better cost analysis, there would be a need to have sub-classification of costs.
For example the annual fixed costs could be broken down as follows:
Road licence
Motor vehicle insurance
Depreciation
Vehicle testing
2.6 COST SHEETS
A cost sheet is a record of costs for each service provided. A typical cost sheet for
a service would incorporate the following for the current details:
Cost information under the appropriate headings
Cost unit statistics
Cost per unit
Analyses based on the actual cost units
EXAMPLE – A COST SHEET FOR A RESTAURANT
Cost Sheet
Category Cost - K
Food and Drink 1,125,000
Labour 1,125,000
Heating and Lighting 187,500
Consumables 112,500
Depreciation 100,000
Apportioned costs 750,000
Cleaners 87,500
Total 3,487,500
Number of meals
served 375
Cost per meal 9,300
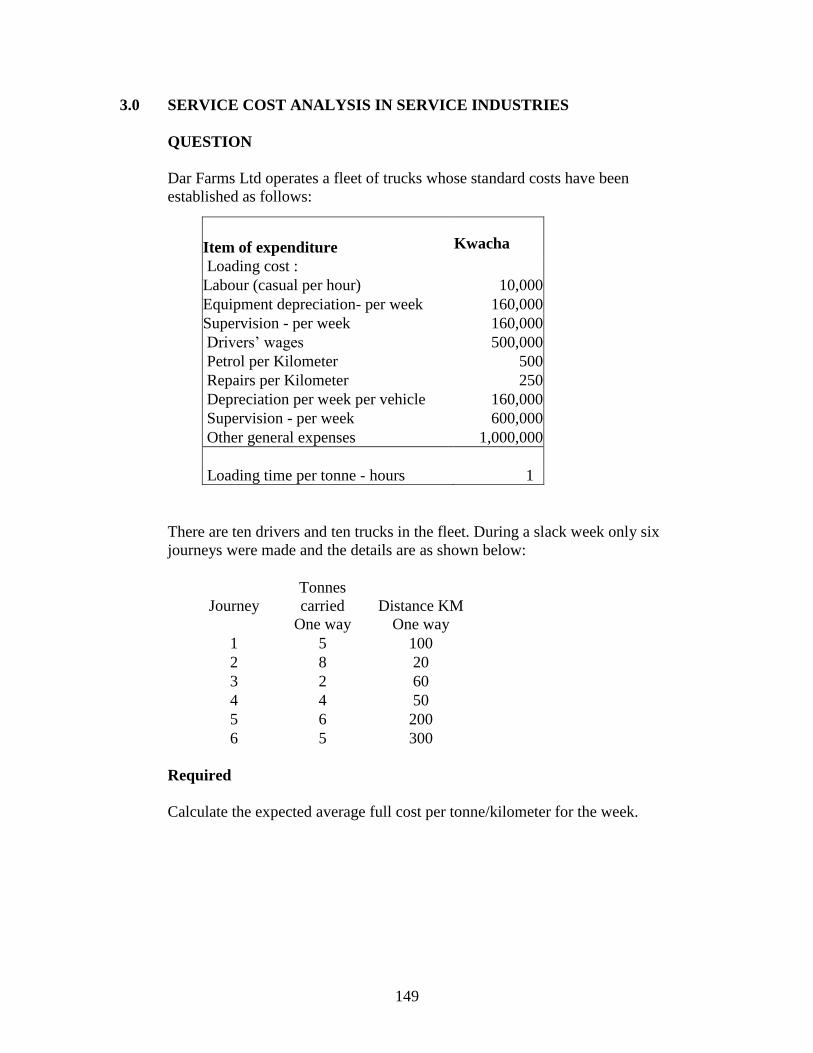
149
3.0 SERVICE COST ANALYSIS IN SERVICE INDUSTRIES
QUESTION
Dar Farms Ltd operates a fleet of trucks whose standard costs have been
established as follows:
There are ten drivers and ten trucks in the fleet. During a slack week only six
journeys were made and the details are as shown below:
Journey
Tonnes
carried
One way
Distance KM
One way
1 5 100
2 8 20
3 2 60
4 4 50
5 6 200
6 5 300
Required
Calculate the expected average full cost per tonne/kilometer for the week.
Item of expenditure Kwacha
Loading cost :
Labour (casual per hour) 10,000
Equipment depreciation- per week 160,000
Supervision - per week 160,000
Drivers’ wages 500,000
Petrol per Kilometer 500
Repairs per Kilometer 250
Depreciation per week per vehicle 160,000
Supervision - per week 600,000
Other general expenses 1,000,000
Loading time per tonne - hours 1
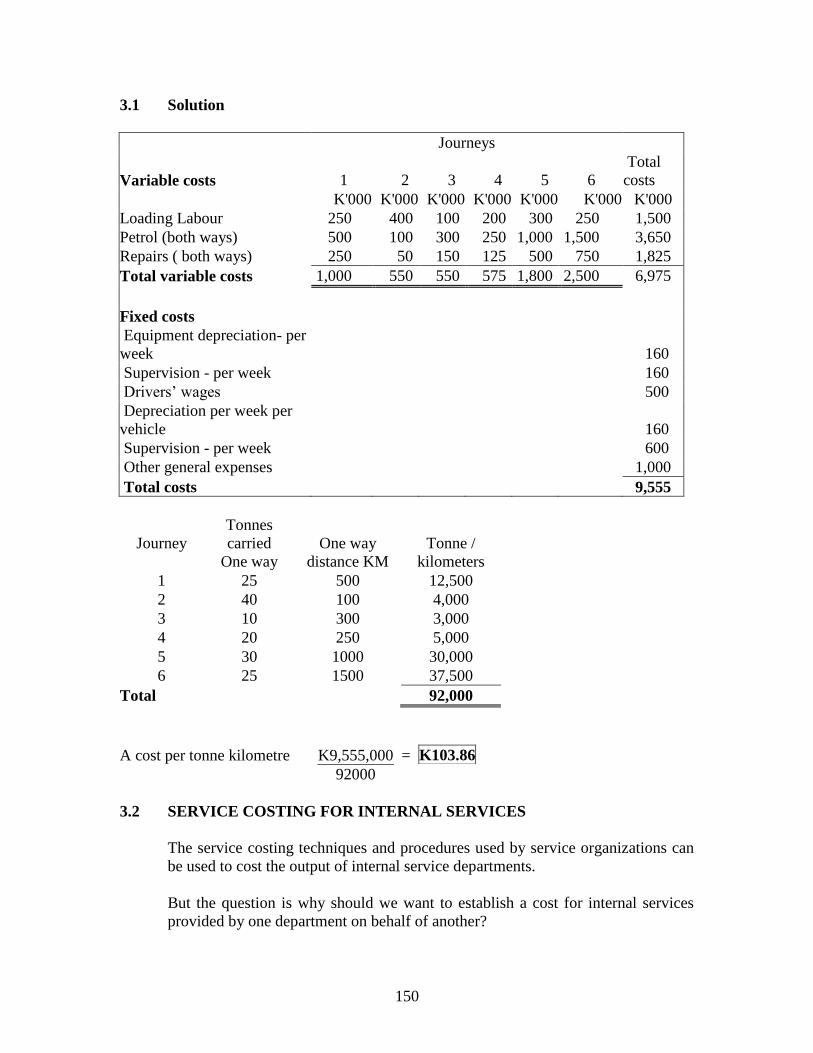
150
3.1 Solution
Journeys
Variable costs 1 2 3 4 5 6
Total
costs
K'000 K'000 K'000 K'000 K'000 K'000 K'000
Loading Labour 250 400 100 200 300 250 1,500
Petrol (both ways) 500 100 300 250 1,000 1,500 3,650
Repairs ( both ways) 250 50 150 125 500 750 1,825
Total variable costs 1,000 550 550 575 1,800 2,500 6,975
Fixed costs
Equipment depreciation- per
week 160
Supervision - per week 160
Drivers’ wages 500
Depreciation per week per
vehicle 160
Supervision - per week 600
Other general expenses 1,000
Total costs 9,555
Journey
Tonnes
carried
One way
One way
distance KM
Tonne /
kilometers
1 25 500 12,500
2 40 100 4,000
3 10 300 3,000
4 20 250 5,000
5 30 1000 30,000
6 25 1500 37,500
Total 92,000
A cost per tonne kilometre K9,555,000 =
K103.86
92000
3.2 SERVICE COSTING FOR INTERNAL SERVICES
The service costing techniques and procedures used by service organizations can
be used to cost the output of internal service departments.
But the question is why should we want to establish a cost for internal services
provided by one department on behalf of another?
151
3.3 Service costing for internal services has two basic purposes:
To control the costs in the service departments
o Once cost per unit has been established, it can be compared with the
target, budget or previous year’s figures for the purposes of control.
To control the costs of the user departments in the following ways:
o The overhead costs of the user department will be established more
accurately.
o The user department is discouraged to make wasteful use of the service
departments.
o The user department may be prompted to obtain a similar service
externally.
4.0 CHAPTER SUMMARY
Service costing can be used by companies operating in a service industry and
by service departments of organizations.
Characteristics which distinguish a service from a product include:
o Intangibility
o Simultaneity
o Perishability
o Heterogeneity
A common problem with service costing is that of identifying a suitable cost
unit for costing purposes. As a result composite cost units are normally used.
Cost per service unit
Service costing techniques are also used to establish costs for internal services
which is a service provided by one department for another.
Total costs for the period
Number of service units per period
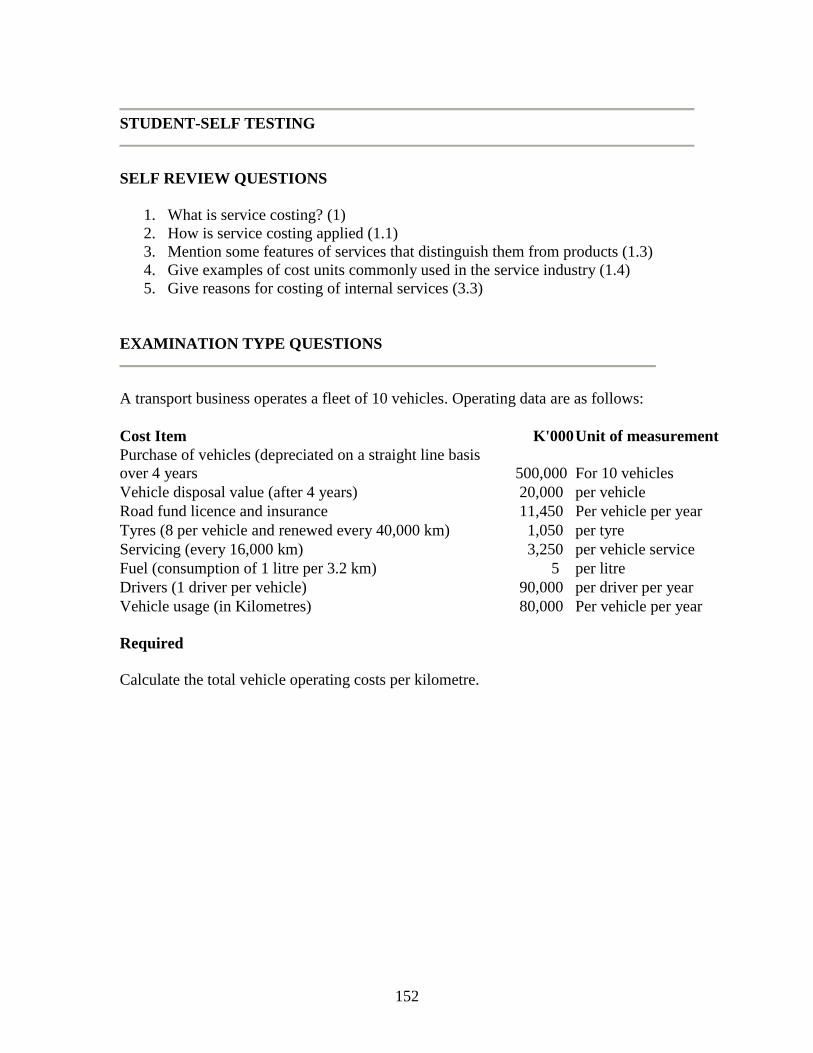
152
STUDENT-SELF TESTING
SELF REVIEW QUESTIONS
1. What is service costing? (1)
2. How is service costing applied (1.1)
3. Mention some features of services that distinguish them from products (1.3)
4. Give examples of cost units commonly used in the service industry (1.4)
5. Give reasons for costing of internal services (3.3)
EXAMINATION TYPE QUESTIONS
A transport business operates a fleet of 10 vehicles. Operating data are as follows:
Cost Item K'000 Unit of measurement
Purchase of vehicles (depreciated on a straight line basis
over 4 years 500,000 For 10 vehicles
Vehicle disposal value (after 4 years) 20,000 per vehicle
Road fund licence and insurance 11,450 Per vehicle per year
Tyres (8 per vehicle and renewed every 40,000 km) 1,050 per tyre
Servicing (every 16,000 km) 3,250 per vehicle service
Fuel (consumption of 1 litre per 3.2 km) 5 per litre
Drivers (1 driver per vehicle) 90,000 per driver per year
Vehicle usage (in Kilometres) 80,000 Per vehicle per year
Required
Calculate the total vehicle operating costs per kilometre.
153
CHAPTER 15
STANDARD COSTING
INTRODUCTION
This chapter introduces you to the concept of standards, an idea which is fairly common
to many day to day activities. For instance as a student of accountancy how many times
have you heard your fellow students comment on the standard of tuition they are
receiving. In a similar vain as a management accountant you can set a standard cost for
products and services. This chapter looks at the uses of standard costing, the standard
setting process and review of such standards.
CONTENTS
1. Standard cost.
2. Standard costing.
3. Types of standard.
4. Preparation of standard costs.
5. The need to review standards.
LEARNING OUTCOMES
After studying this chapter, you should be able to:
Define standard cost and standard costing.
Explain types of operations most suited for standard costing.
Understand how standards are set.
Explain why standards should be continuously reviewed.
154
1.0 INTRODUCTION
We shall start this chapter by defining the following terms:
Standards
Standard cost
Standard costing
1.1 STANDARD
A standard is a benchmark measurement of resource usage, set in defined
conditions.
1.2 STANDARD COST
A standard cost is the planned unit cost of the products, components or services
produced in a period. The main uses of standard costs are in performance
measurement, control, stock valuation and in the establishment of selling prices. (CIMA Official Terminology)
A standard cost is built up using the following elements of cost:
Labour.
Materials.
Variable overheads.
Fixed overheads.
1.3 STANDARD COSTING
Standard costing involves the establishment of predetermined estimates of the
costs of products or services, the collection of actual costs and the comparison of
the actual costs with predetermined estimates. The predetermined costs are known
as standard costs and the difference between standard and actual costs is known as
a variance.
Standard costing was developed primarily for use in the manufacturing industry
as a formal method for calculating the expected costs of products. It differs from
general budgeting (which is normally concerned with the costs of sections of
organisation), because it focuses on the cost of what the organisation produces –
the units costs.
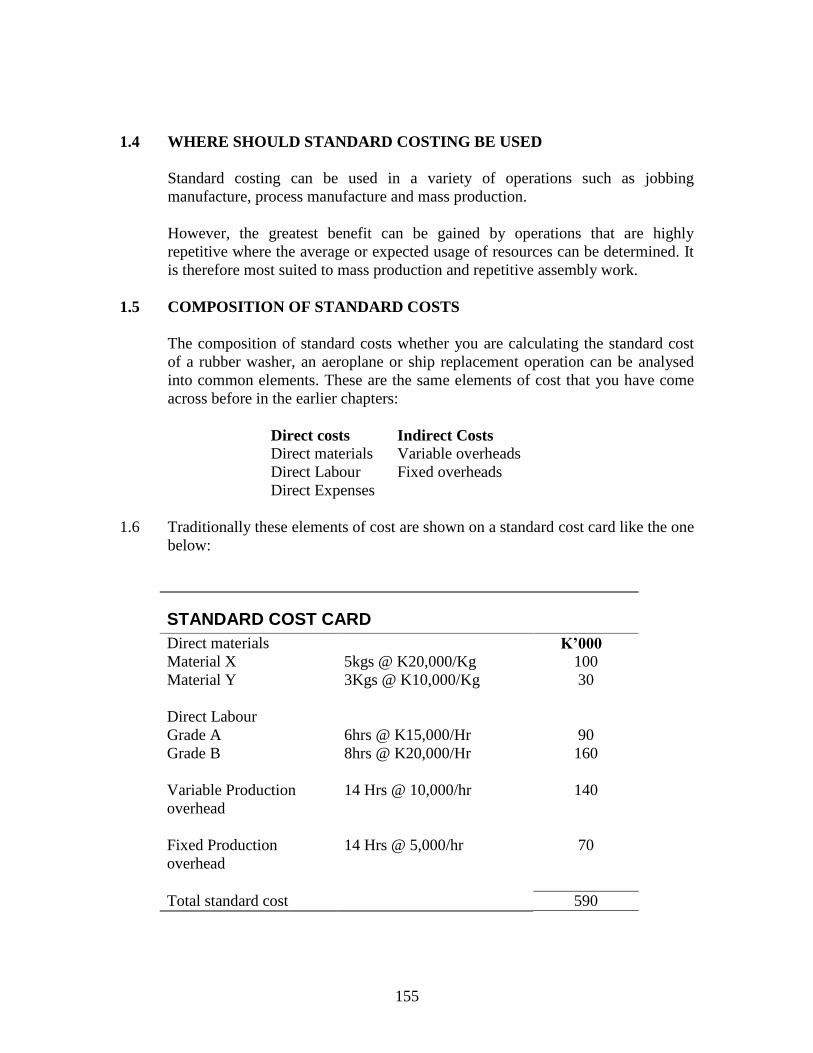
155
1.4 WHERE SHOULD STANDARD COSTING BE USED
Standard costing can be used in a variety of operations such as jobbing
manufacture, process manufacture and mass production.
However, the greatest benefit can be gained by operations that are highly
repetitive where the average or expected usage of resources can be determined. It
is therefore most suited to mass production and repetitive assembly work.
1.5 COMPOSITION OF STANDARD COSTS
The composition of standard costs whether you are calculating the standard cost
of a rubber washer, an aeroplane or ship replacement operation can be analysed
into common elements. These are the same elements of cost that you have come
across before in the earlier chapters:
Direct costs Indirect Costs
Direct materials Variable overheads
Direct Labour Fixed overheads
Direct Expenses
1.6 Traditionally these elements of cost are shown on a standard cost card like the one
below:
STANDARD COST CARD
Direct materials K’000
Material X 5kgs @ K20,000/Kg 100
Material Y 3Kgs @ K10,000/Kg 30
Direct Labour
Grade A 6hrs @ K15,000/Hr 90
Grade B 8hrs @ K20,000/Hr 160
Variable Production
overhead
14 Hrs @ 10,000/hr 140
Fixed Production
overhead
14 Hrs @ 5,000/hr 70
Total standard cost 590
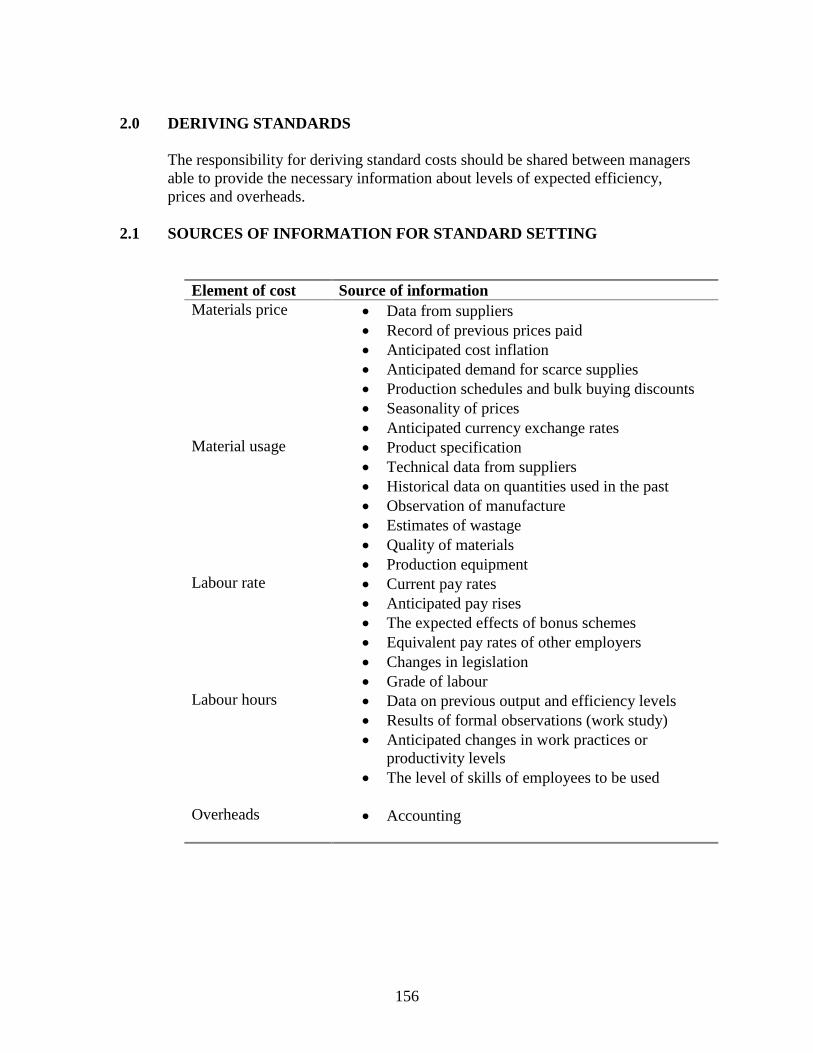
156
2.0 DERIVING STANDARDS
The responsibility for deriving standard costs should be shared between managers
able to provide the necessary information about levels of expected efficiency,
prices and overheads.
2.1 SOURCES OF INFORMATION FOR STANDARD SETTING
Element of cost Source of information
Materials price Data from suppliers
Record of previous prices paid
Anticipated cost inflation
Anticipated demand for scarce supplies
Production schedules and bulk buying discounts
Seasonality of prices
Anticipated currency exchange rates
Material usage Product specification
Technical data from suppliers
Historical data on quantities used in the past
Observation of manufacture
Estimates of wastage
Quality of materials
Production equipment
Labour rate Current pay rates
Anticipated pay rises
The expected effects of bonus schemes
Equivalent pay rates of other employers
Changes in legislation
Grade of labour
Labour hours Data on previous output and efficiency levels
Results of formal observations (work study)
Anticipated changes in work practices or
productivity levels
The level of skills of employees to be used
Overheads
Accounting
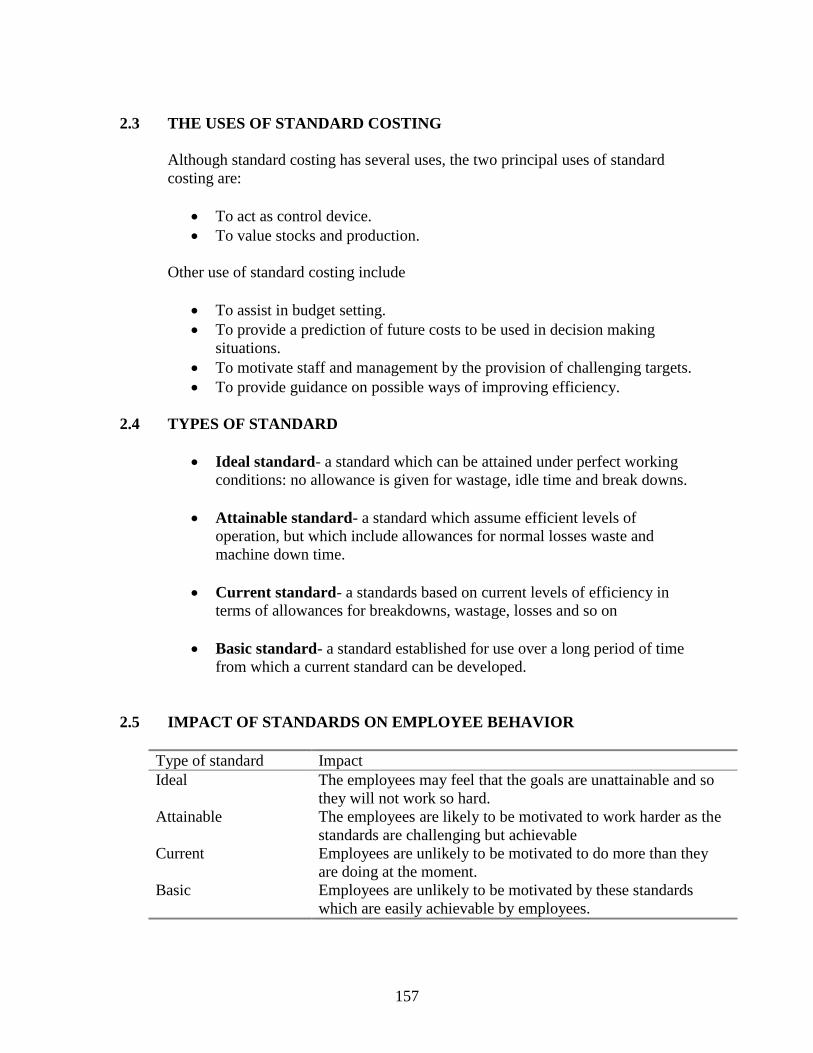
157
2.3 THE USES OF STANDARD COSTING
Although standard costing has several uses, the two principal uses of standard
costing are:
To act as control device.
To value stocks and production.
Other use of standard costing include
To assist in budget setting.
To provide a prediction of future costs to be used in decision making
situations.
To motivate staff and management by the provision of challenging targets.
To provide guidance on possible ways of improving efficiency.
2.4 TYPES OF STANDARD
Ideal standard- a standard which can be attained under perfect working
conditions: no allowance is given for wastage, idle time and break downs.
Attainable standard- a standard which assume efficient levels of
operation, but which include allowances for normal losses waste and
machine down time.
Current standard- a standards based on current levels of efficiency in
terms of allowances for breakdowns, wastage, losses and so on
Basic standard- a standard established for use over a long period of time
from which a current standard can be developed.
2.5 IMPACT OF STANDARDS ON EMPLOYEE BEHAVIOR
Type of standard Impact
Ideal The employees may feel that the goals are unattainable and so
they will not work so hard.
Attainable The employees are likely to be motivated to work harder as the
standards are challenging but achievable
Current Employees are unlikely to be motivated to do more than they
are doing at the moment.
Basic Employees are unlikely to be motivated by these standards
which are easily achievable by employees.

158
2.6 PROBLEMS OF SETTING STANDARDS
Common problems encountered in the standard setting process include:
How to deal with inflation
Who to set efficiency standards
How to incorporate the need for continuous improvement.
2.7 REVIEWING STANDARDS
Management should not think that once standards are set they would remain
useful forever. Standards must evolve to reflect the organisation’s changing
methods and processes. Comparing out of date standards with actual results will
provide misleading information.
Many organizations have adopted the approach of revising standards whenever
changes of a permanent and reasonably long-term nature occur.
CHAPTER SUMMARY
A standard cost is an estimated unit cost built from each element of cost.
Standard costing is primarily used to value production and stocks and as a cost
control tool.
Standard costing is most suited to mass production and other repetitive
operations.
There are four types of standards namely ideal, attainable, current and basic.
Standards should be revised when there is change of a permanent nature.
159
STUDENT-SELF TESTING
SELF REVIEW QUESTIONS
1. Define a standard (1.1)
2. Define standard cost (1.2)
3. Define standard costing (1.3)
4. Mention some sources of information for preparing standards (2.1)
5. Mention four types of standards (2.4)
EXAMINATION TYPE QUESTIONS
From the following data prepare the standard cost card for one unit of the single
product manufactured:
Direct materials:
10kg of material X @ K1 600 per kg
7.5kg of material Y @ K2 500 per Kg
Direct Labour:
Preparation 14 hours @ K3 750 per hour
Assembly 5 hours @ K5 000 per hour
The budgeted total overheads for one year are:
The fixed overheads (included in the above figures) are K25 000 and K48 000
respectively.
The standard cost card should show sub totals for:
Prime cost
Variable production cost
Total production cost
K’000 Hours
Preparation department 88 20,000
Assembly department 150 24,000
160
CHAPTER 16
VARIANCE ANALYSIS
INTRODUCTION
Having introduced the concept of standard costing in the previous chapter, this chapter
will deal with the computation of cost variances and explanation of the possible causes of
variances.
CONTENTS
1. Variance accounting.
2. Labour variances.
3. Material variances.
4. Overhead cost variances.
5. Causes of variances.
LEARNING OUTCOMES
After studying this chapter you will be able to:
Know what is meant by variance and variance analysis.
Understand the relationship between variances.
Calculate cost variances.
Explain the causes of variances.
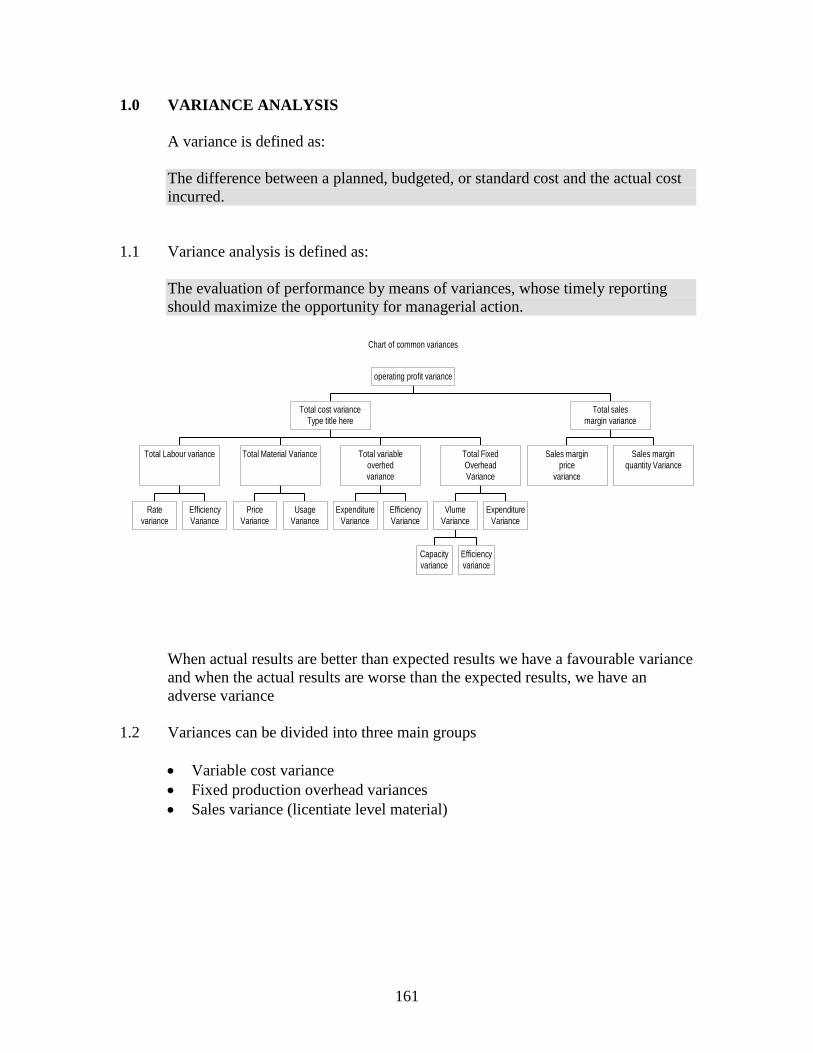
161
1.0 VARIANCE ANALYSIS
A variance is defined as:
The difference between a planned, budgeted, or standard cost and the actual cost
incurred.
1.1 Variance analysis is defined as:
The evaluation of performance by means of variances, whose timely reporting
should maximize the opportunity for managerial action.
When actual results are better than expected results we have a favourable variance
and when the actual results are worse than the expected results, we have an
adverse variance
1.2 Variances can be divided into three main groups
Variable cost variance
Fixed production overhead variances
Sales variance (licentiate level material)
Chart of common variances
Rate
variance
Efficiency
Variance
Total Labour variance
Price
Variance
Usage
Variance
Total Material Variance
Expenditure
Variance
Efficiency
Variance
Total variable
overhed
variance
Capacity
variance
Efficiency
variance
Vlume
Variance
Expenditure
Variance
Total Fixed
Overhead
Variance
Total cost variance
Type title here
Sales margin
price
variance
Sales margin
quantity Variance
Total sales
margin variance
operating profit variance
162
1.3 KEY ILLUSTRATION
The following example will be used to illustrate the computation of all cost
variances.
Kipata manufacturing company produces a single product which is known as
Kiwaya. The product requires a single operation and the standard cost for this
operation is presented in the following standard costs card.
STANDARD COST CARD
Direct materials K’000
Material X 0.5kgs @ K40,000/Kg 20
Direct Labour
Grade A 2 hours @ K20,000/Hr 40
Variable Production
overhead
2 hours @ K3,000/Hr 6
Fixed Production
overhead
2 Hrs @ K37,000/hr 74
Total standard cost 140
Standard Profit 60
Standard Price 200
Budgeted output for June was 5,100 units. Actual results for June were as follows:
Production of 4,850 units was sold for K 1,042.75 million.
Materials consumed in production amounted to 2,300 kilos at a cost of
K98.9 million
Labour hours paid amounted to 8,000 hours at a cost of K162 million
Actual variable overheads amounted to K26 million
Fixed over heads amounted to K423 million
REQUIRED
This information will be used to define and calculate the following variances:
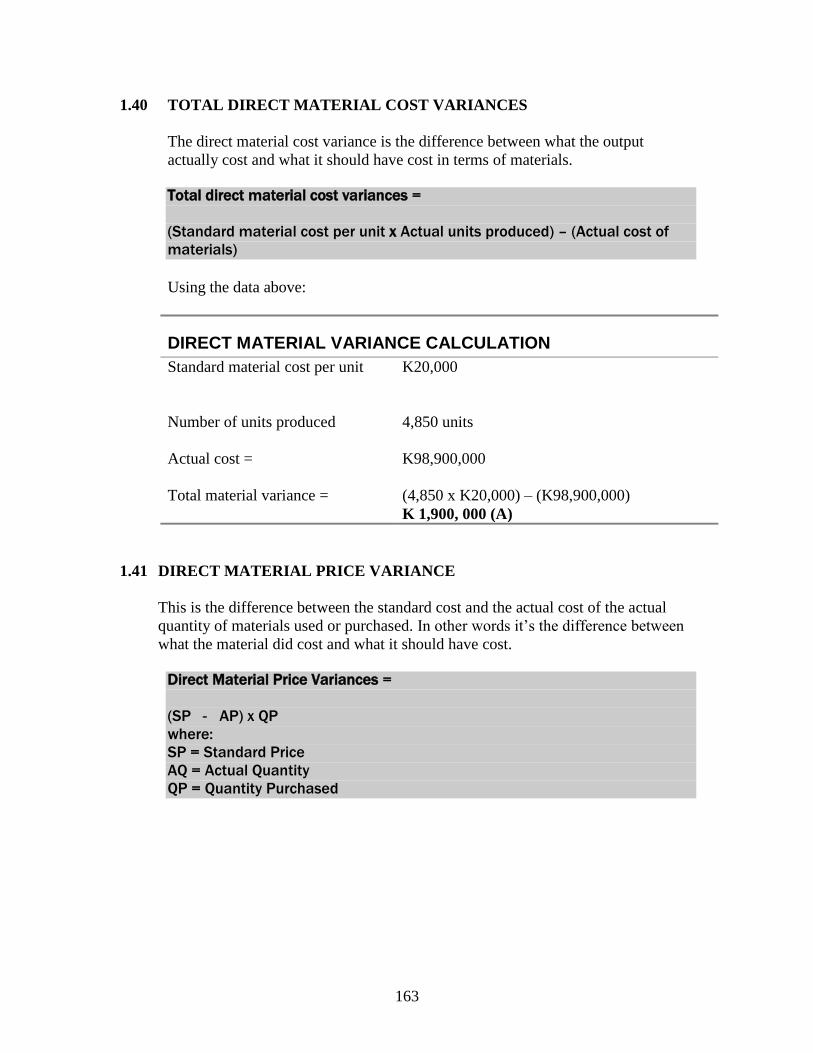
163
1.40 TOTAL DIRECT MATERIAL COST VARIANCES
The direct material cost variance is the difference between what the output
actually cost and what it should have cost in terms of materials.
Total direct material cost variances =
(Standard material cost per unit x Actual units produced) – (Actual cost of
materials)
Using the data above:
DIRECT MATERIAL VARIANCE CALCULATION
Standard material cost per unit
K20,000
Number of units produced
4,850 units
Actual cost =
K98,900,000
Total material variance =
(4,850 x K20,000) – (K98,900,000)
K 1,900, 000 (A)
1.41 DIRECT MATERIAL PRICE VARIANCE
This is the difference between the standard cost and the actual cost of the actual
quantity of materials used or purchased. In other words it’s the difference between
what the material did cost and what it should have cost.
Direct Material Price Variances =
(SP - AP) x QP
where:
SP = Standard Price
AQ = Actual Quantity
QP = Quantity Purchased
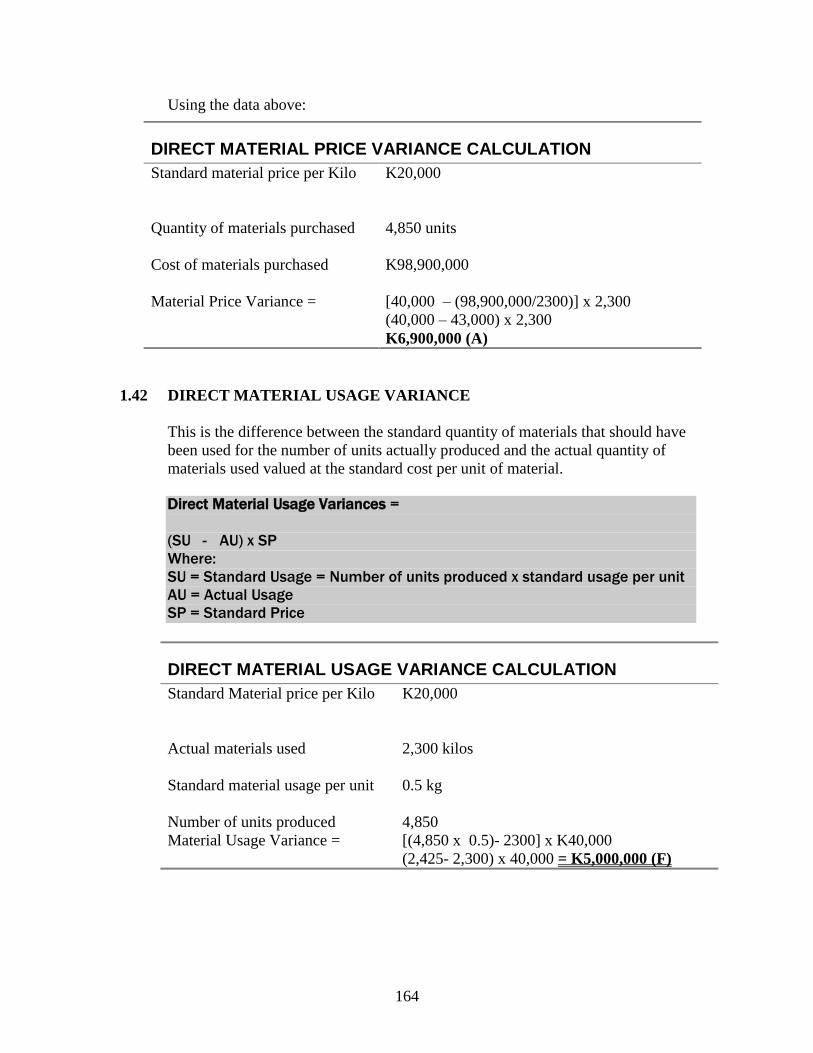
164
Using the data above:
1.42 DIRECT MATERIAL USAGE VARIANCE
This is the difference between the standard quantity of materials that should have
been used for the number of units actually produced and the actual quantity of
materials used valued at the standard cost per unit of material.
Direct Material Usage Variances =
(SU - AU) x SP
Where:
SU = Standard Usage = Number of units produced x standard usage per unit
AU = Actual Usage
SP = Standard Price
DIRECT MATERIAL USAGE VARIANCE CALCULATION
Standard Material price per Kilo
K20,000
Actual materials used
2,300 kilos
Standard material usage per unit
0.5 kg
Number of units produced 4,850
Material Usage Variance =
[(4,850 x 0.5)- 2300] x K40,000
(2,425- 2,300) x 40,000 = K5,000,000 (F)
DIRECT MATERIAL PRICE VARIANCE CALCULATION
Standard material price per Kilo
K20,000
Quantity of materials purchased
4,850 units
Cost of materials purchased
K98,900,000
Material Price Variance =
[40,000 – (98,900,000/2300)] x 2,300
(40,000 – 43,000) x 2,300
K6,900,000 (A)
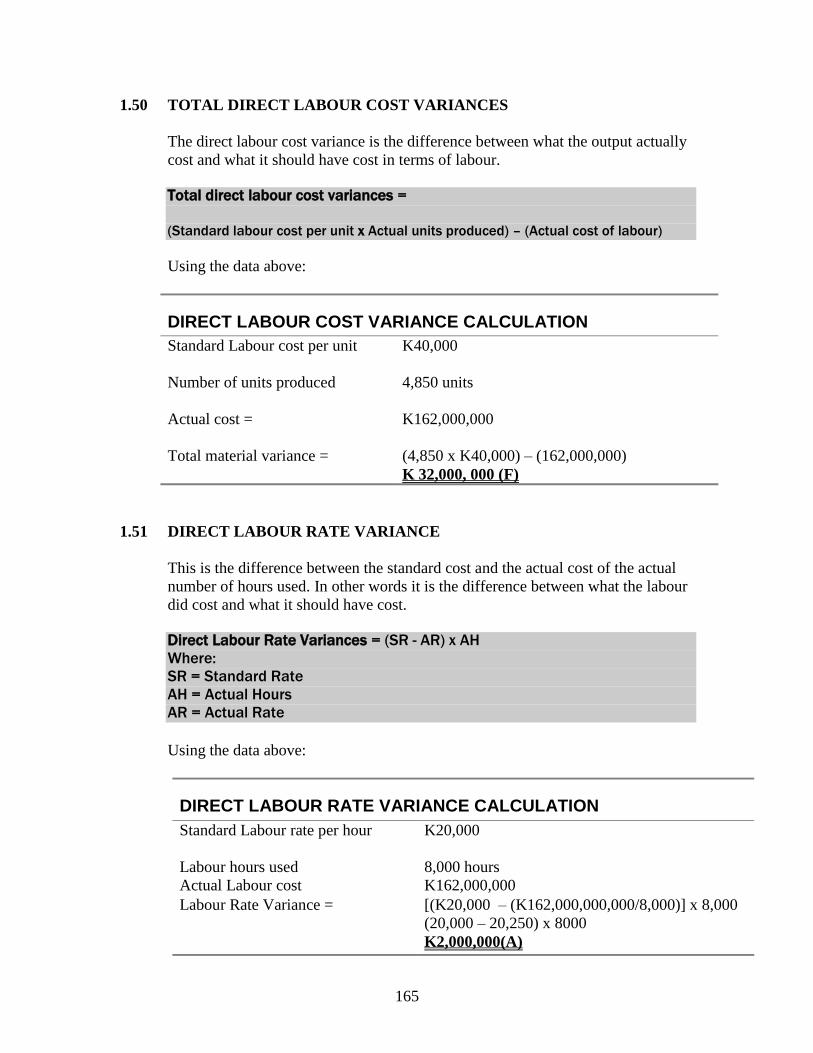
165
1.50 TOTAL DIRECT LABOUR COST VARIANCES
The direct labour cost variance is the difference between what the output actually
cost and what it should have cost in terms of labour.
Total direct labour cost variances =
(Standard labour cost per unit x Actual units produced) – (Actual cost of labour)
Using the data above:
DIRECT LABOUR COST VARIANCE CALCULATION
Standard Labour cost per unit
K40,000
Number of units produced
4,850 units
Actual cost =
K162,000,000
Total material variance =
(4,850 x K40,000) – (162,000,000)
K 32,000, 000 (F)
1.51 DIRECT LABOUR RATE VARIANCE
This is the difference between the standard cost and the actual cost of the actual
number of hours used. In other words it is the difference between what the labour
did cost and what it should have cost.
Direct Labour Rate Variances = (SR - AR) x AH
Where:
SR = Standard Rate
AH = Actual Hours
AR = Actual Rate
Using the data above:
DIRECT LABOUR RATE VARIANCE CALCULATION
Standard Labour rate per hour
K20,000
Labour hours used 8,000 hours
Actual Labour cost K162,000,000
Labour Rate Variance =
[(K20,000 – (K162,000,000,000/8,000)] x 8,000
(20,000 – 20,250) x 8000
K2,000,000(A)
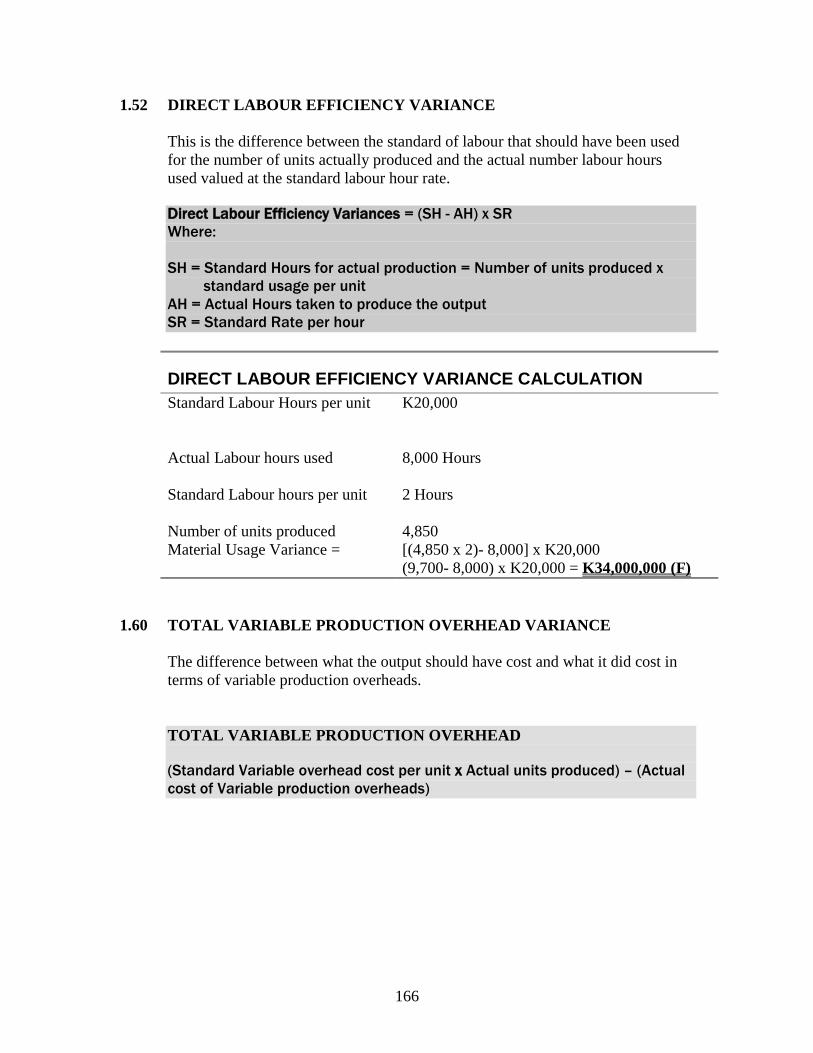
166
1.52 DIRECT LABOUR EFFICIENCY VARIANCE
This is the difference between the standard of labour that should have been used
for the number of units actually produced and the actual number labour hours
used valued at the standard labour hour rate.
Direct Labour Efficiency Variances = (SH - AH) x SR
Where:
SH = Standard Hours for actual production = Number of units produced x
standard usage per unit
AH = Actual Hours taken to produce the output
SR = Standard Rate per hour
DIRECT LABOUR EFFICIENCY VARIANCE CALCULATION
Standard Labour Hours per unit
K20,000
Actual Labour hours used
8,000 Hours
Standard Labour hours per unit
2 Hours
Number of units produced 4,850
Material Usage Variance =
[(4,850 x 2)- 8,000] x K20,000
(9,700- 8,000) x K20,000 = K34,000,000 (F)
1.60 TOTAL VARIABLE PRODUCTION OVERHEAD VARIANCE
The difference between what the output should have cost and what it did cost in
terms of variable production overheads.
TOTAL VARIABLE PRODUCTION OVERHEAD
(Standard Variable overhead cost per unit x Actual units produced) – (Actual
cost of Variable production overheads)
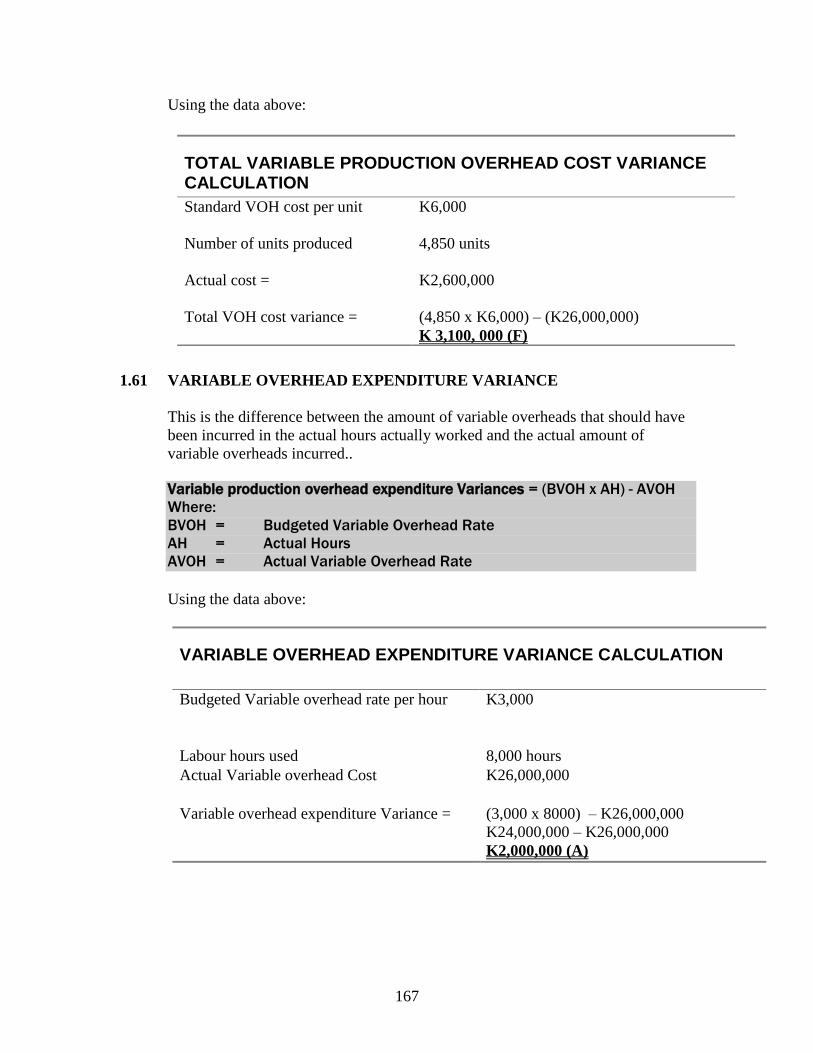
167
Using the data above:
1.61 VARIABLE OVERHEAD EXPENDITURE VARIANCE
This is the difference between the amount of variable overheads that should have
been incurred in the actual hours actually worked and the actual amount of
variable overheads incurred..
Variable production overhead expenditure Variances = (BVOH x AH) - AVOH
Where:
BVOH = Budgeted Variable Overhead Rate
AH = Actual Hours
AVOH = Actual Variable Overhead Rate
Using the data above:
VARIABLE OVERHEAD EXPENDITURE VARIANCE CALCULATION
Budgeted Variable overhead rate per hour
K3,000
Labour hours used 8,000 hours
Actual Variable overhead Cost
K26,000,000
Variable overhead expenditure Variance =
(3,000 x 8000) – K26,000,000
K24,000,000 – K26,000,000
K2,000,000 (A)
TOTAL VARIABLE PRODUCTION OVERHEAD COST VARIANCE CALCULATION
Standard VOH cost per unit
K6,000
Number of units produced
4,850 units
Actual cost =
K2,600,000
Total VOH cost variance =
(4,850 x K6,000) – (K26,000,000)
K 3,100, 000 (F)
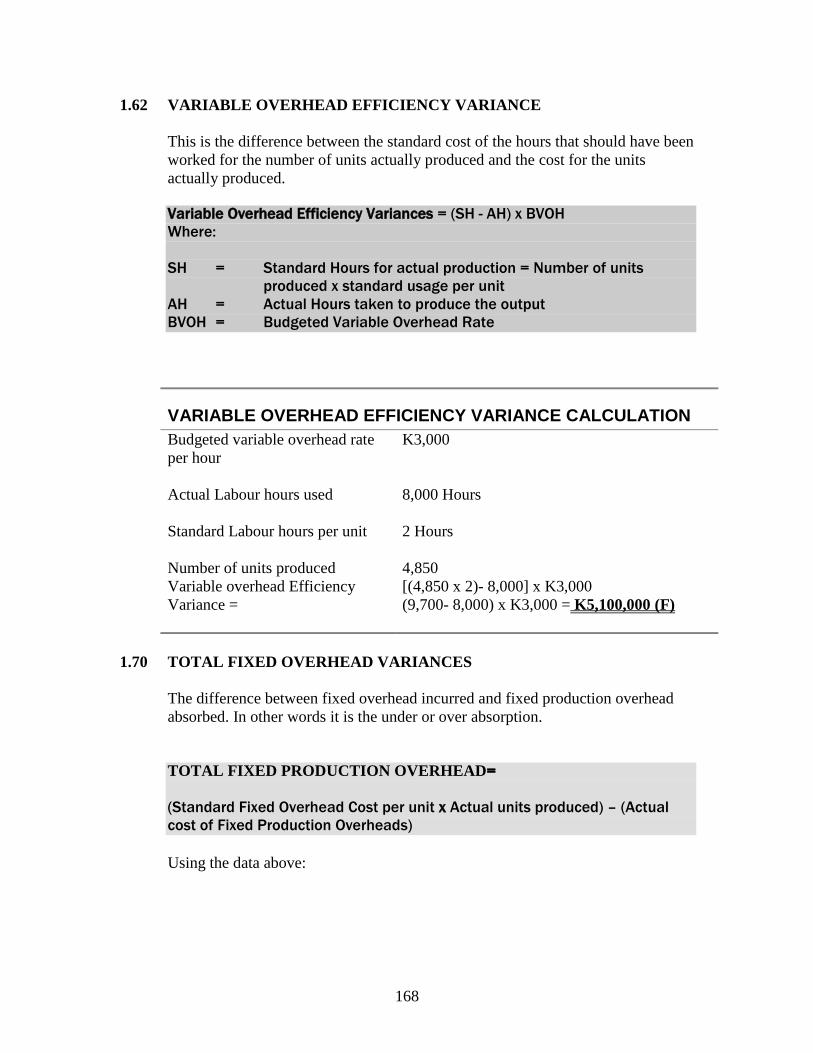
168
1.62 VARIABLE OVERHEAD EFFICIENCY VARIANCE
This is the difference between the standard cost of the hours that should have been
worked for the number of units actually produced and the cost for the units
actually produced.
Variable Overhead Efficiency Variances = (SH - AH) x BVOH
Where:
SH = Standard Hours for actual production = Number of units
produced x standard usage per unit
AH = Actual Hours taken to produce the output
BVOH = Budgeted Variable Overhead Rate
VARIABLE OVERHEAD EFFICIENCY VARIANCE CALCULATION
Budgeted variable overhead rate
per hour
K3,000
Actual Labour hours used
8,000 Hours
Standard Labour hours per unit
2 Hours
Number of units produced 4,850
Variable overhead Efficiency
Variance =
[(4,850 x 2)- 8,000] x K3,000
(9,700- 8,000) x K3,000 = K5,100,000 (F)
1.70 TOTAL FIXED OVERHEAD VARIANCES
The difference between fixed overhead incurred and fixed production overhead
absorbed. In other words it is the under or over absorption.
TOTAL FIXED PRODUCTION OVERHEAD=
(Standard Fixed Overhead Cost per unit x Actual units produced) – (Actual
cost of Fixed Production Overheads)
Using the data above:
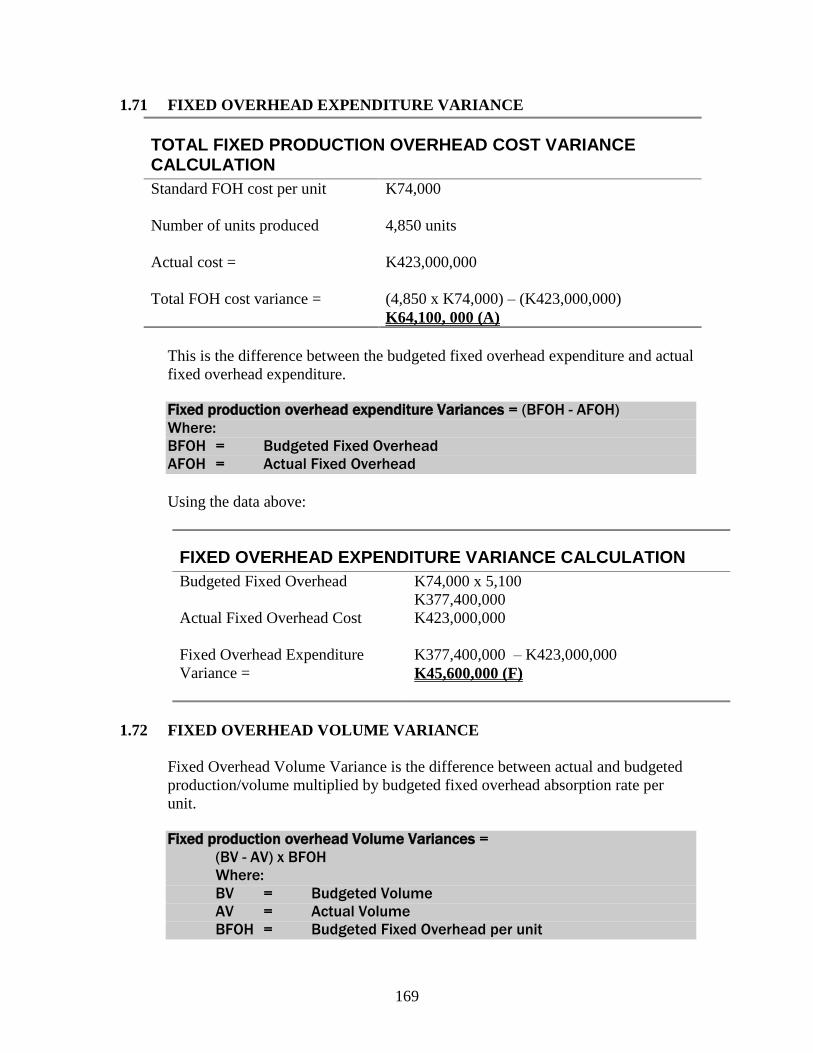
169
1.71 FIXED OVERHEAD EXPENDITURE VARIANCE
This is the difference between the budgeted fixed overhead expenditure and actual
fixed overhead expenditure.
Fixed production overhead expenditure Variances = (BFOH - AFOH)
Where:
BFOH = Budgeted Fixed Overhead
AFOH = Actual Fixed Overhead
Using the data above:
FIXED OVERHEAD EXPENDITURE VARIANCE CALCULATION
Budgeted Fixed Overhead
K74,000 x 5,100
K377,400,000
Actual Fixed Overhead Cost
K423,000,000
Fixed Overhead Expenditure
Variance =
K377,400,000 – K423,000,000
K45,600,000 (F)
1.72 FIXED OVERHEAD VOLUME VARIANCE
Fixed Overhead Volume Variance is the difference between actual and budgeted
production/volume multiplied by budgeted fixed overhead absorption rate per
unit.
Fixed production overhead Volume Variances =
(BV - AV) x BFOH
Where:
BV = Budgeted Volume
AV = Actual Volume
BFOH = Budgeted Fixed Overhead per unit
TOTAL FIXED PRODUCTION OVERHEAD COST VARIANCE CALCULATION
Standard FOH cost per unit
K74,000
Number of units produced
4,850 units
Actual cost =
K423,000,000
Total FOH cost variance =
(4,850 x K74,000) – (K423,000,000)
K64,100, 000 (A)
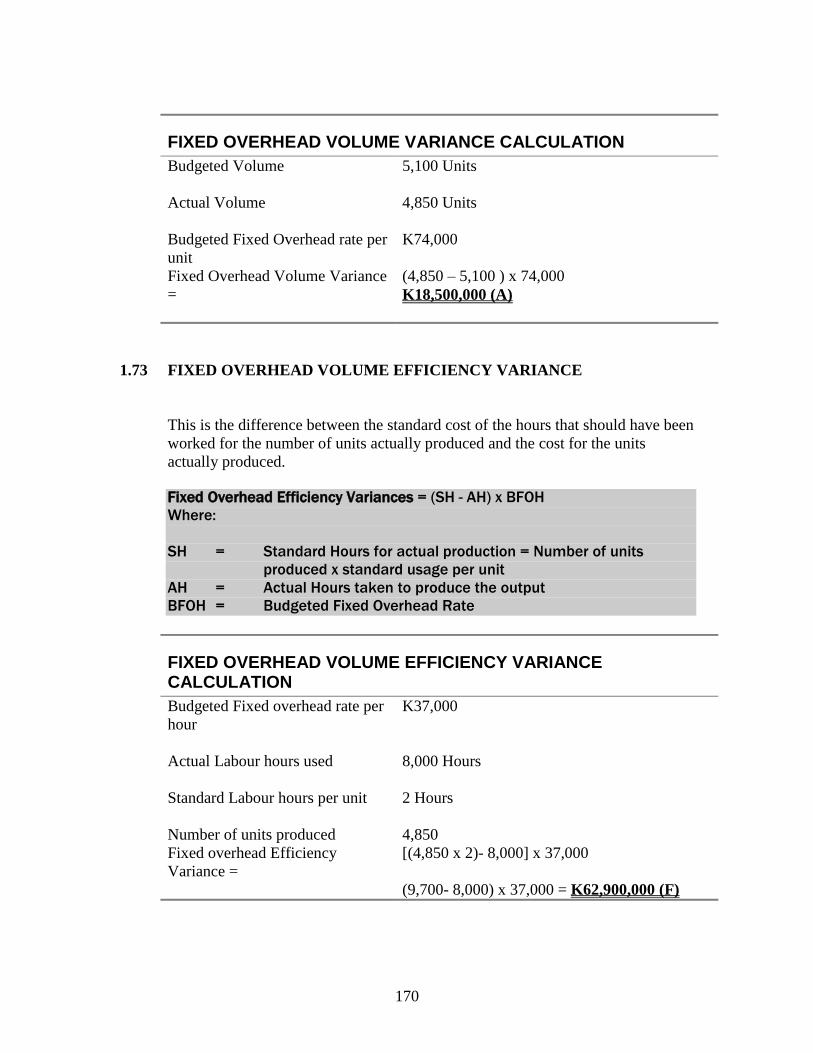
170
FIXED OVERHEAD VOLUME VARIANCE CALCULATION
Budgeted Volume
5,100 Units
Actual Volume
4,850 Units
Budgeted Fixed Overhead rate per
unit
K74,000
Fixed Overhead Volume Variance
=
(4,850 – 5,100 ) x 74,000
K18,500,000 (A)
1.73 FIXED OVERHEAD VOLUME EFFICIENCY VARIANCE
This is the difference between the standard cost of the hours that should have been
worked for the number of units actually produced and the cost for the units
actually produced.
Fixed Overhead Efficiency Variances = (SH - AH) x BFOH
Where:
SH = Standard Hours for actual production = Number of units
produced x standard usage per unit
AH = Actual Hours taken to produce the output
BFOH = Budgeted Fixed Overhead Rate
FIXED OVERHEAD VOLUME EFFICIENCY VARIANCE CALCULATION
Budgeted Fixed overhead rate per
hour
K37,000
Actual Labour hours used
8,000 Hours
Standard Labour hours per unit
2 Hours
Number of units produced 4,850
Fixed overhead Efficiency
Variance =
[(4,850 x 2)- 8,000] x 37,000
(9,700- 8,000) x 37,000 = K62,900,000 (F)
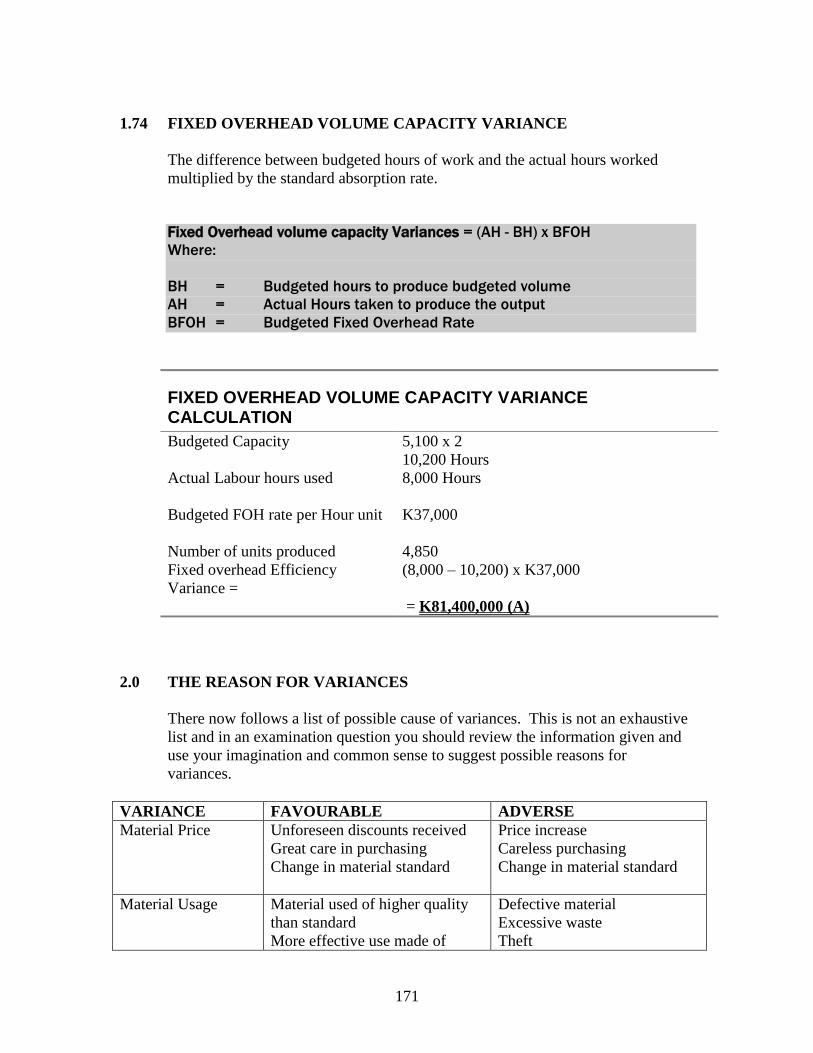
171
1.74 FIXED OVERHEAD VOLUME CAPACITY VARIANCE
The difference between budgeted hours of work and the actual hours worked
multiplied by the standard absorption rate.
Fixed Overhead volume capacity Variances = (AH - BH) x BFOH
Where:
BH = Budgeted hours to produce budgeted volume
AH = Actual Hours taken to produce the output
BFOH = Budgeted Fixed Overhead Rate
FIXED OVERHEAD VOLUME CAPACITY VARIANCE CALCULATION
Budgeted Capacity
5,100 x 2
10,200 Hours
Actual Labour hours used
8,000 Hours
Budgeted FOH rate per Hour unit
K37,000
Number of units produced 4,850
Fixed overhead Efficiency
Variance =
(8,000 – 10,200) x K37,000
= K81,400,000 (A)
2.0 THE REASON FOR VARIANCES
There now follows a list of possible cause of variances. This is not an exhaustive
list and in an examination question you should review the information given and
use your imagination and common sense to suggest possible reasons for
variances.
VARIANCE FAVOURABLE ADVERSE
Material Price Unforeseen discounts received
Great care in purchasing
Change in material standard
Price increase
Careless purchasing
Change in material standard
Material Usage Material used of higher quality
than standard
More effective use made of
Defective material
Excessive waste
Theft
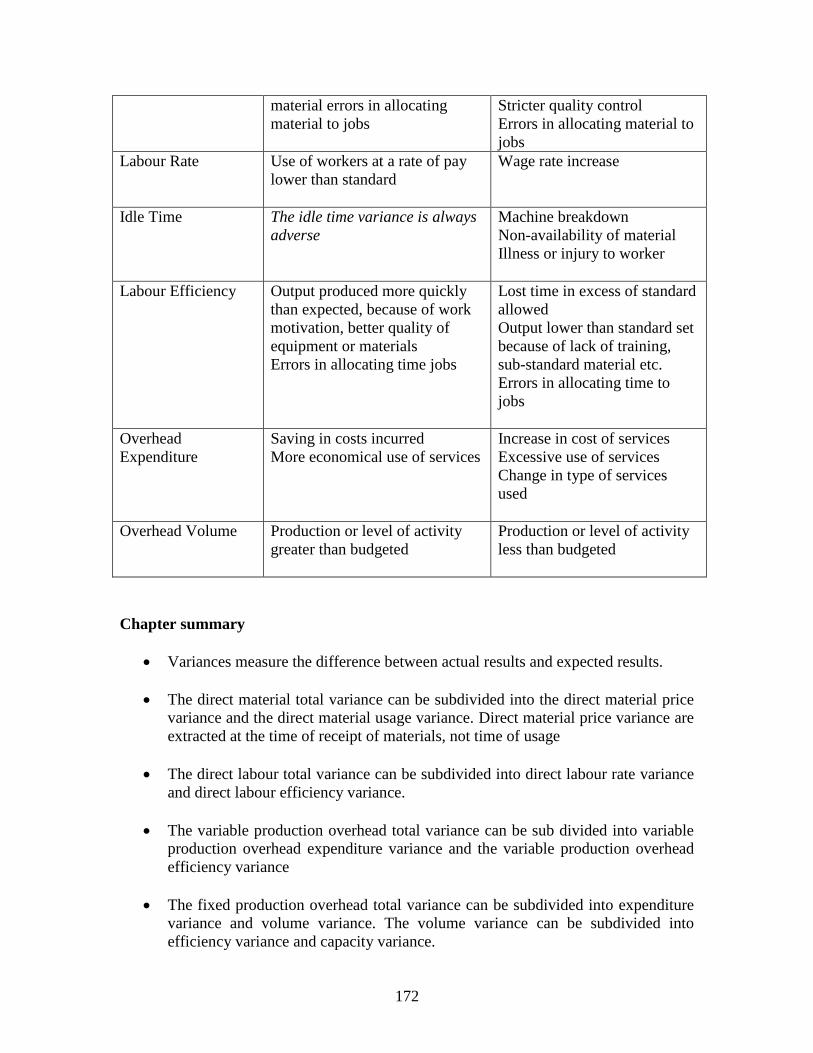
172
material errors in allocating
material to jobs
Stricter quality control
Errors in allocating material to
jobs
Labour Rate Use of workers at a rate of pay
lower than standard
Wage rate increase
Idle Time The idle time variance is always
adverse
Machine breakdown
Non-availability of material
Illness or injury to worker
Labour Efficiency Output produced more quickly
than expected, because of work
motivation, better quality of
equipment or materials
Errors in allocating time jobs
Lost time in excess of standard
allowed
Output lower than standard set
because of lack of training,
sub-standard material etc.
Errors in allocating time to
jobs
Overhead
Expenditure
Saving in costs incurred
More economical use of services
Increase in cost of services
Excessive use of services
Change in type of services
used
Overhead Volume Production or level of activity
greater than budgeted
Production or level of activity
less than budgeted
Chapter summary
Variances measure the difference between actual results and expected results.
The direct material total variance can be subdivided into the direct material price
variance and the direct material usage variance. Direct material price variance are
extracted at the time of receipt of materials, not time of usage
The direct labour total variance can be subdivided into direct labour rate variance
and direct labour efficiency variance.
The variable production overhead total variance can be sub divided into variable
production overhead expenditure variance and the variable production overhead
efficiency variance
The fixed production overhead total variance can be subdivided into expenditure
variance and volume variance. The volume variance can be subdivided into
efficiency variance and capacity variance.
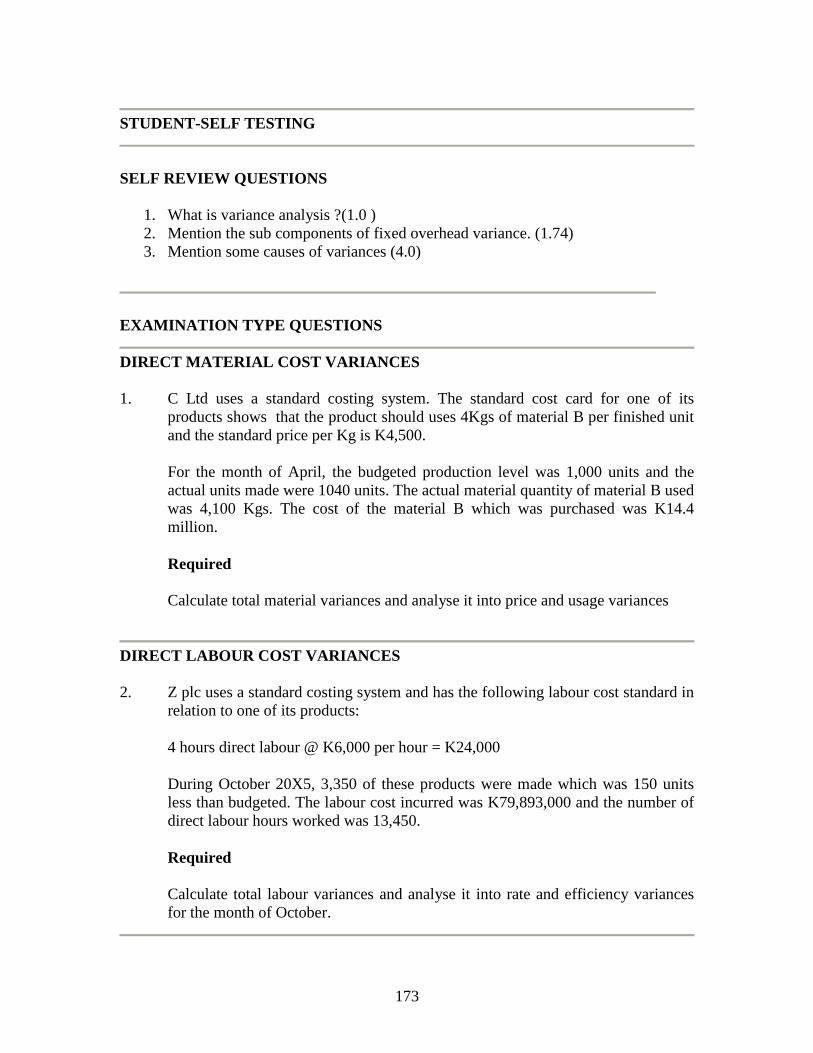
173
STUDENT-SELF TESTING
SELF REVIEW QUESTIONS
1. What is variance analysis ?(1.0 )
2. Mention the sub components of fixed overhead variance. (1.74)
3. Mention some causes of variances (4.0)
EXAMINATION TYPE QUESTIONS
DIRECT MATERIAL COST VARIANCES
1. C Ltd uses a standard costing system. The standard cost card for one of its
products shows that the product should uses 4Kgs of material B per finished unit
and the standard price per Kg is K4,500.
For the month of April, the budgeted production level was 1,000 units and the
actual units made were 1040 units. The actual material quantity of material B used
was 4,100 Kgs. The cost of the material B which was purchased was K14.4
million.
Required
Calculate total material variances and analyse it into price and usage variances
DIRECT LABOUR COST VARIANCES
2. Z plc uses a standard costing system and has the following labour cost standard in
relation to one of its products:
4 hours direct labour @ K6,000 per hour = K24,000
During October 20X5, 3,350 of these products were made which was 150 units
less than budgeted. The labour cost incurred was K79,893,000 and the number of
direct labour hours worked was 13,450.
Required
Calculate total labour variances and analyse it into rate and efficiency variances
for the month of October.
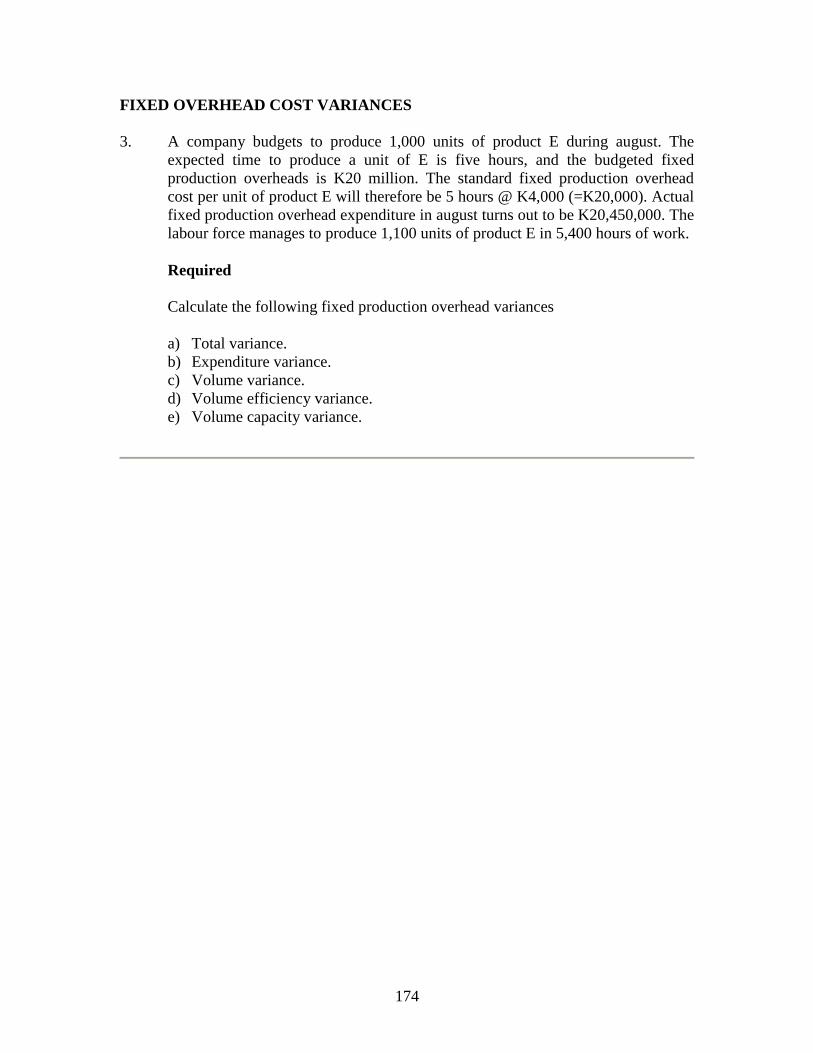
174
FIXED OVERHEAD COST VARIANCES
3. A company budgets to produce 1,000 units of product E during august. The
expected time to produce a unit of E is five hours, and the budgeted fixed
production overheads is K20 million. The standard fixed production overhead
cost per unit of product E will therefore be 5 hours @ K4,000 (=K20,000). Actual
fixed production overhead expenditure in august turns out to be K20,450,000. The
labour force manages to produce 1,100 units of product E in 5,400 hours of work.
Required
Calculate the following fixed production overhead variances
a) Total variance.
b) Expenditure variance.
c) Volume variance.
d) Volume efficiency variance.
e) Volume capacity variance.
175
CHAPTER 17
COST BOOKKEEPING
Introduction
This chapter introduces you to the concept of Cost Bookkeeping. This is a systematic
way of recording cost accounting transactions in the books of accounts in order to
facilitate the preparation of financial statements
CONTENTS
1. Introduction
2. The dichotomy
3. The integrated system
4. The interlocking system
LEARNING OUTCOMES
After studying this chapter you should be able to:
Understand the theory underlying cost bookkeeping.
Record systematically cost accounting transactions in cost ledger accounts.
Effectively carry out the double entry in the cost ledgers using integrated accounts
and interlocking accounts.
Differentiate interlocking accounts from integrated accounts.
176
1.0 INTRODUCTION
Cost book keeping is a systematic way of recording cost accounting transactions
in the books of accounts in order to facilitate the preparation of financial
statements relating to the calculation of profits or losses of products or services
offered.
The key areas of cost accounting transactions are mainly those that relate to the
elements of cost or principles of costing which are materials, labour and
overheads. These three elements make up the total cost of a product or
service.
1.1 Materials
Materials can be direct and indirect and can be raw materials, work in progress
and finished goods. For direct materials we open in the cost ledger, stores control
account or materials control account, work in progress account and finished goods
account. For indirect materials we open the production overhead control account
1.2 Labour
Labour can be direct and indirect. For direct labour, in the cost ledger we open the
wages control account and the work in progress accounts. For indirect labour we
open the production overhead control account.
1.3 Overheads
All indirect costs are overheads. Overheads can be production and non-
production .all overheads can be absorbed into products using various bases. We
determine differences between actual overheads and absorbed overheads the
results are over absorption or under absorption which increases or reduces the
profits. The full double entry will be shown later.
2.0 THE DICHOTOMY
In the accountancy profession, there are three accounting dimensions: financial
accounting, cost accounting and management accounting. In the recent years, the
three dimensions have been reduced to only two; that is financial accounting and
management accounting. Cost accounting is now part of management accounting.
Most manufacturing businesses adopt one of the following systems of cost
accounting:
177
i) An independent system
ii) A reconciled system
iii) An integrated system
iv) An interlocking system
2.1 Independent System
In this system, no reconciliations are necessary between cost accounts and
financial accounts. The two sets of accounts are kept separately. Some
manufacturing businesses have adopted this system.
2.2 Reconciled System
In this system, financial accounts are independently kept from cost accounts.
Both sets of accounts each produces a profit figure. The profit figures produced
must be reconciled just as we reconcile the cashbook balance with a bank
statement balance.
The reconciliation can begin from the financial profit figure and end with cost
accounts profit figure, additions and subtractions have to be made taking into
account items in cost accounts and items not in cost accounts. This system is also
common to the interlocking system.
3.0 INTEGRATED SYSTEM
In this system, both financial accounts and cost accounts are linked together and
presented as one set of accounts, the system uses one common system of input
data. There is no need for the reconciliation since only one profit figure is arrived
at. In this system there are resource accounts, accounts which record the cost of
production items from the start of production work through to cost of sales as
mentioned above, sales account, and profit and loss account.
By using the integrated system, savings in administration are made. The
disadvantage is that the system is required to serve two purposes i.e. external
reporting and internal reporting and this disadvantage has been overcome by the
use of computers.
178
3.1 EXAMPLE
A LTD manufacturing company operating an integrated system had the following
results for the year ended 31st December 2006:
Balances at 1/1/2006:
K000
Raw materials control 25
Work in progress control 40
Finished goods control 56
Transactions for the year were:
K000
Materials purchased on credit 100
Materials purchased for cash 10
Direct materials issued to production 80
Indirect materials issued 15
Direct wages incurred 50
Indirect wages incurred 20
Actual Selling and administrative overhead 12
Production completed and transferred to cost of sales 150
Production cost of sales 180
Credit sales 250
Depreciation production equipment 5
Direct and indirect wages paid 70
Production overhead is absorbed at the rate of 80 percent of actual direct wages.
Required
Prepare the following ledger accounts:
1. Raw materials control
2. Work in progress control
3. Finished goods control
4. Production overhead control
5. Wages control
6. Selling and administrative overhead control
7. Cost of sales
8. Trading and profit and loss.
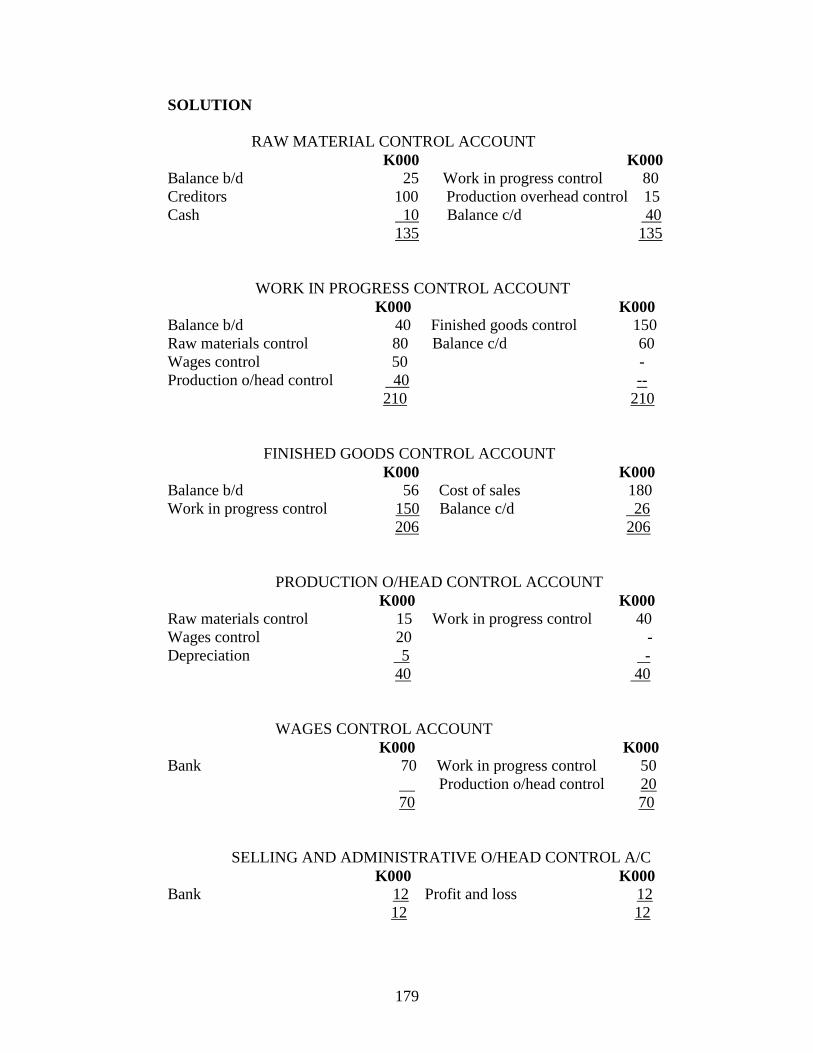
179
SOLUTION
RAW MATERIAL CONTROL ACCOUNT
K000 K000
Balance b/d 25 Work in progress control 80
Creditors 100 Production overhead control 15
Cash 10 Balance c/d 40
135 135
WORK IN PROGRESS CONTROL ACCOUNT
K000 K000
Balance b/d 40 Finished goods control 150
Raw materials control 80 Balance c/d 60
Wages control 50 -
Production o/head control 40 --
210 210
FINISHED GOODS CONTROL ACCOUNT
K000 K000
Balance b/d 56 Cost of sales 180
Work in progress control 150 Balance c/d 26
206 206
PRODUCTION O/HEAD CONTROL ACCOUNT
K000 K000
Raw materials control 15 Work in progress control 40
Wages control 20 -
Depreciation 5 -
40 40
WAGES CONTROL ACCOUNT
K000 K000
Bank 70 Work in progress control 50
Production o/head control 20
70 70
SELLING AND ADMINISTRATIVE O/HEAD CONTROL A/C
K000 K000
Bank 12 Profit and loss 12
12 12
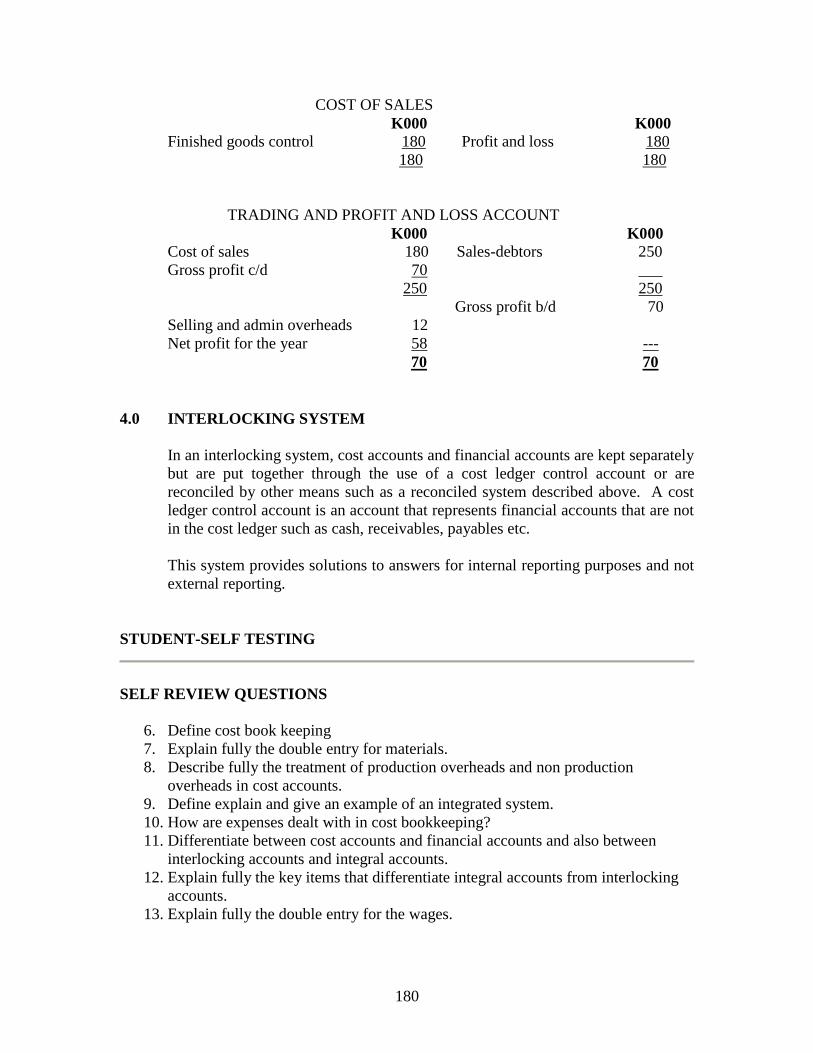
180
COST OF SALES
K000 K000
Finished goods control 180 Profit and loss 180
180 180
TRADING AND PROFIT AND LOSS ACCOUNT
K000 K000
Cost of sales 180 Sales-debtors 250
Gross profit c/d 70 ___
250 250
Gross profit b/d 70
Selling and admin overheads 12
Net profit for the year 58 ---
70 70
4.0 INTERLOCKING SYSTEM
In an interlocking system, cost accounts and financial accounts are kept separately
but are put together through the use of a cost ledger control account or are
reconciled by other means such as a reconciled system described above. A cost
ledger control account is an account that represents financial accounts that are not
in the cost ledger such as cash, receivables, payables etc.
This system provides solutions to answers for internal reporting purposes and not
external reporting.
STUDENT-SELF TESTING
SELF REVIEW QUESTIONS
6. Define cost book keeping
7. Explain fully the double entry for materials.
8. Describe fully the treatment of production overheads and non production
overheads in cost accounts.
9. Define explain and give an example of an integrated system.
10. How are expenses dealt with in cost bookkeeping?
11. Differentiate between cost accounts and financial accounts and also between
interlocking accounts and integral accounts.
12. Explain fully the key items that differentiate integral accounts from interlocking
accounts.
13. Explain fully the double entry for the wages.
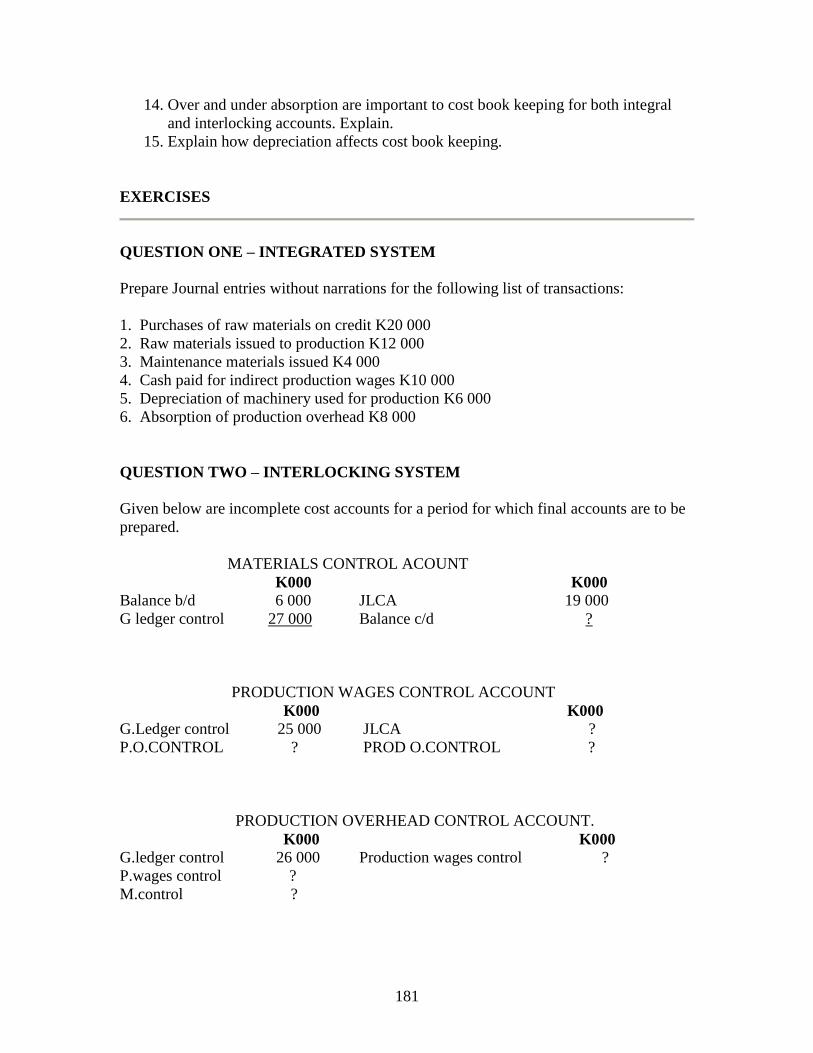
181
14. Over and under absorption are important to cost book keeping for both integral
and interlocking accounts. Explain.
15. Explain how depreciation affects cost book keeping.
EXERCISES
QUESTION ONE – INTEGRATED SYSTEM
Prepare Journal entries without narrations for the following list of transactions:
1. Purchases of raw materials on credit K20 000
2. Raw materials issued to production K12 000
3. Maintenance materials issued K4 000
4. Cash paid for indirect production wages K10 000
5. Depreciation of machinery used for production K6 000
6. Absorption of production overhead K8 000
QUESTION TWO – INTERLOCKING SYSTEM
Given below are incomplete cost accounts for a period for which final accounts are to be
prepared.
MATERIALS CONTROL ACOUNT
K000 K000
Balance b/d 6 000 JLCA 19 000
G ledger control 27 000 Balance c/d ?
PRODUCTION WAGES CONTROL ACCOUNT
K000 K000
G.Ledger control 25 000 JLCA ?
P.O.CONTROL ? PROD O.CONTROL ?
PRODUCTION OVERHEAD CONTROL ACCOUNT.
K000 K000
G.ledger control 26 000 Production wages control ?
P.wages control ?
M.control ?
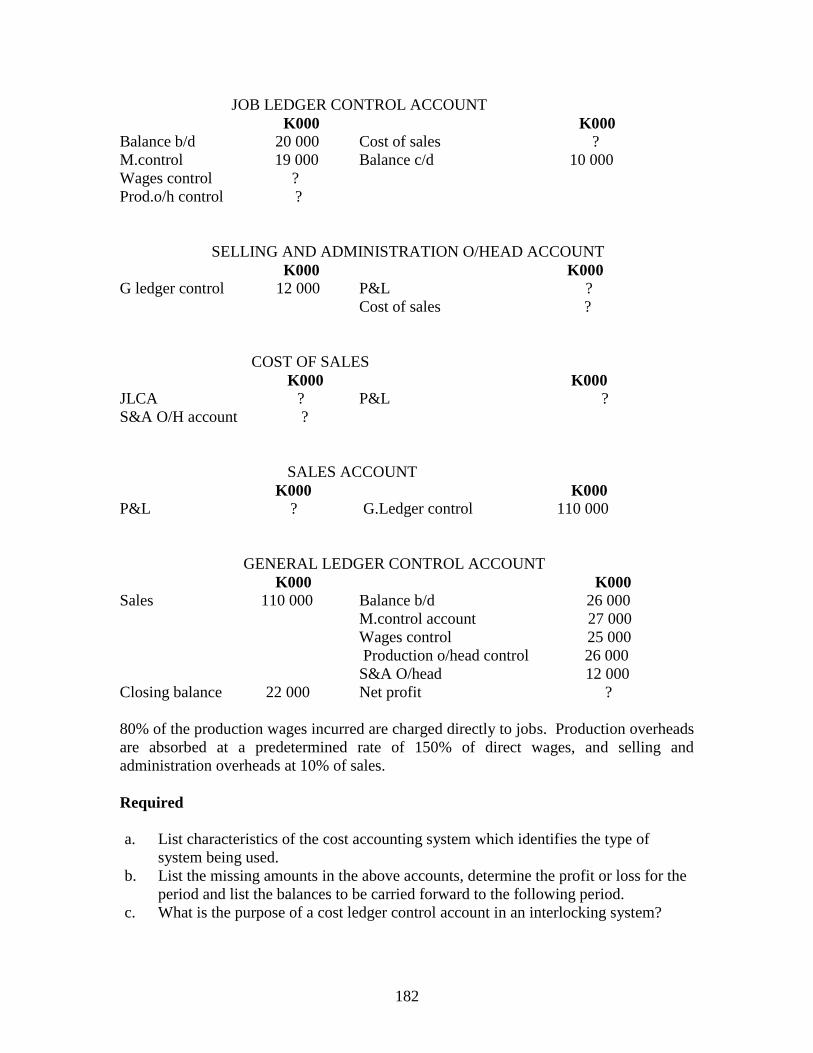
182
JOB LEDGER CONTROL ACCOUNT
K000 K000
Balance b/d 20 000 Cost of sales ?
M.control 19 000 Balance c/d 10 000
Wages control ?
Prod.o/h control ?
SELLING AND ADMINISTRATION O/HEAD ACCOUNT
K000 K000
G ledger control 12 000 P&L ?
Cost of sales ?
COST OF SALES
K000 K000
JLCA ? P&L ?
S&A O/H account ?
SALES ACCOUNT
K000 K000
P&L ? G.Ledger control 110 000
GENERAL LEDGER CONTROL ACCOUNT
K000 K000
Sales 110 000 Balance b/d 26 000
M.control account 27 000
Wages control 25 000
Production o/head control 26 000
S&A O/head 12 000
Closing balance 22 000 Net profit ?
80% of the production wages incurred are charged directly to jobs. Production overheads
are absorbed at a predetermined rate of 150% of direct wages, and selling and
administration overheads at 10% of sales.
Required
a. List characteristics of the cost accounting system which identifies the type of
system being used.
b. List the missing amounts in the above accounts, determine the profit or loss for the
period and list the balances to be carried forward to the following period.
c. What is the purpose of a cost ledger control account in an interlocking system?
183
ANSWERS TO EXAMINATION
TYPE QUESTIONS
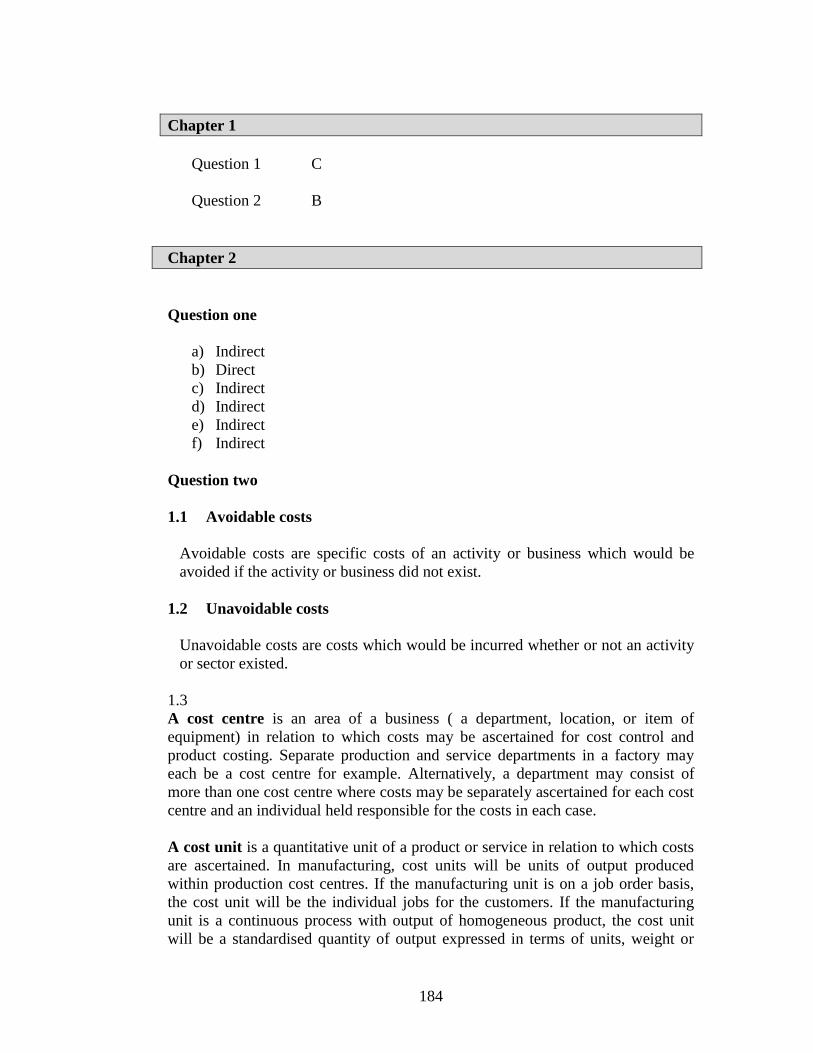
184
Chapter 1
Question 1 C
Question 2 B
Chapter 2
Question one
a) Indirect
b) Direct
c) Indirect
d) Indirect
e) Indirect
f) Indirect
Question two
1.1 Avoidable costs
Avoidable costs are specific costs of an activity or business which would be
avoided if the activity or business did not exist.
1.2 Unavoidable costs
Unavoidable costs are costs which would be incurred whether or not an activity
or sector existed.
1.3
A cost centre is an area of a business ( a department, location, or item of
equipment) in relation to which costs may be ascertained for cost control and
product costing. Separate production and service departments in a factory may
each be a cost centre for example. Alternatively, a department may consist of
more than one cost centre where costs may be separately ascertained for each cost
centre and an individual held responsible for the costs in each case.
A cost unit is a quantitative unit of a product or service in relation to which costs
are ascertained. In manufacturing, cost units will be units of output produced
within production cost centres. If the manufacturing unit is on a job order basis,
the cost unit will be the individual jobs for the customers. If the manufacturing
unit is a continuous process with output of homogeneous product, the cost unit
will be a standardised quantity of output expressed in terms of units, weight or
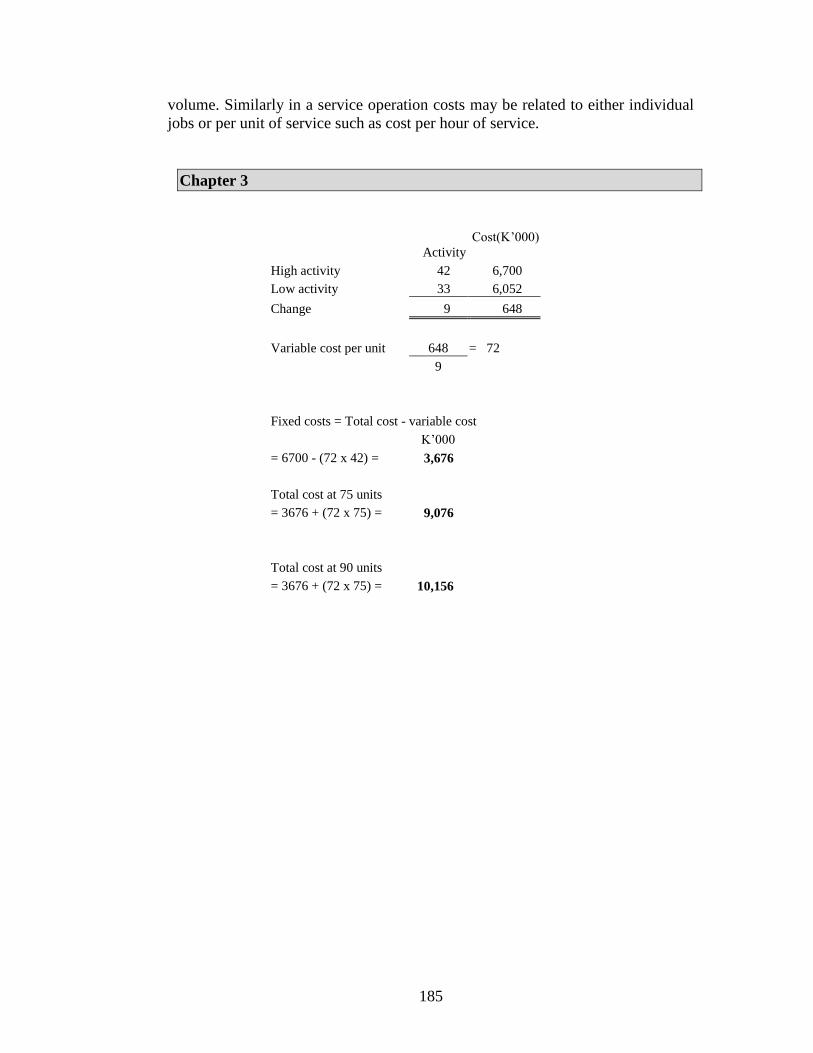
185
volume. Similarly in a service operation costs may be related to either individual
jobs or per unit of service such as cost per hour of service.
Chapter 3
Activity
Cost(K’000)
High activity 42 6,700
Low activity 33 6,052
Change 9 648
Variable cost per unit 648 = 72
9
Fixed costs = Total cost - variable cost
K’000
= 6700 - (72 x 42) = 3,676
Total cost at 75 units
= 3676 + (72 x 75) = 9,076
Total cost at 90 units
= 3676 + (72 x 75) = 10,156
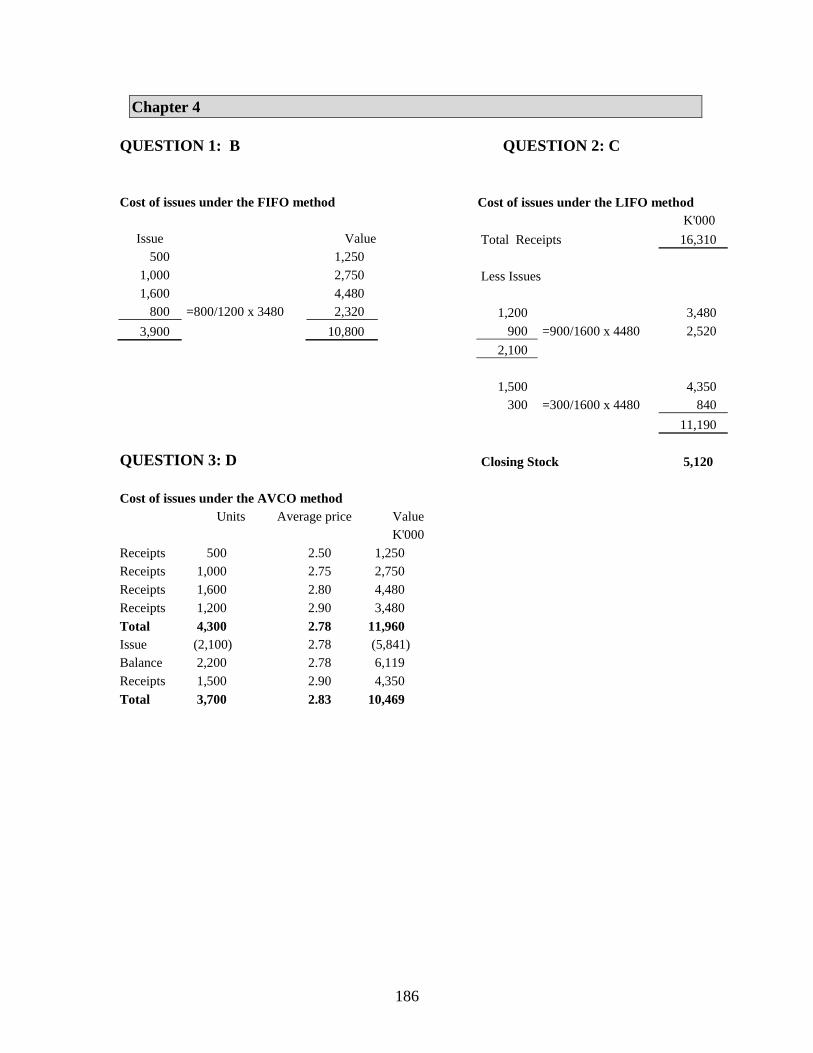
186
Chapter 4
QUESTION 1: B QUESTION 2: C
Cost of issues under the FIFO method
Issue Value
500 1,250
1,000 2,750
1,600 4,480
800 =800/1200 x 3480 2,320
3,900 10,800
QUESTION 3: D
Cost of issues under the AVCO method
Units Average price Value
K'000
Receipts 500 2.50 1,250
Receipts 1,000 2.75 2,750
Receipts 1,600 2.80 4,480
Receipts 1,200 2.90 3,480
Total 4,300 2.78 11,960
Issue (2,100) 2.78 (5,841)
Balance 2,200 2.78 6,119
Receipts 1,500 2.90 4,350
Total 3,700 2.83 10,469
Cost of issues under the LIFO method
K'000
Total Receipts 16,310
Less Issues
1,200 3,480
900 =900/1600 x 4480 2,520
2,100
1,500 4,350
300 =300/1600 x 4480 840
11,190
Closing Stock 5,120
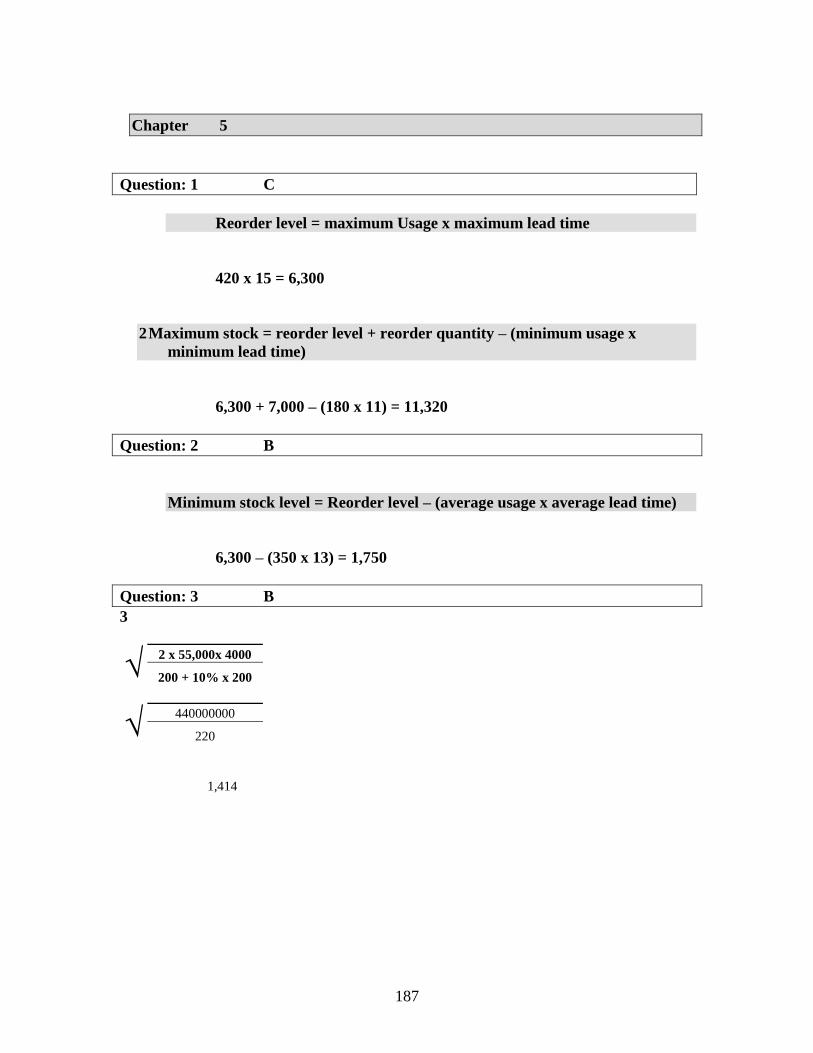
187
Chapter 5
Question: 1 C
Reorder level = maximum Usage x maximum lead time
420 x 15 = 6,300
2 Maximum stock = reorder level + reorder quantity – (minimum usage x
minimum lead time)
6,300 + 7,000 – (180 x 11) = 11,320
Question: 2 B
Minimum stock level = Reorder level – (average usage x average lead time)
6,300 – (350 x 13) = 1,750
Question: 3 B
3
√ 2 x 55,000x 4000
200 + 10% x 200
√ 440000000
220
1,414
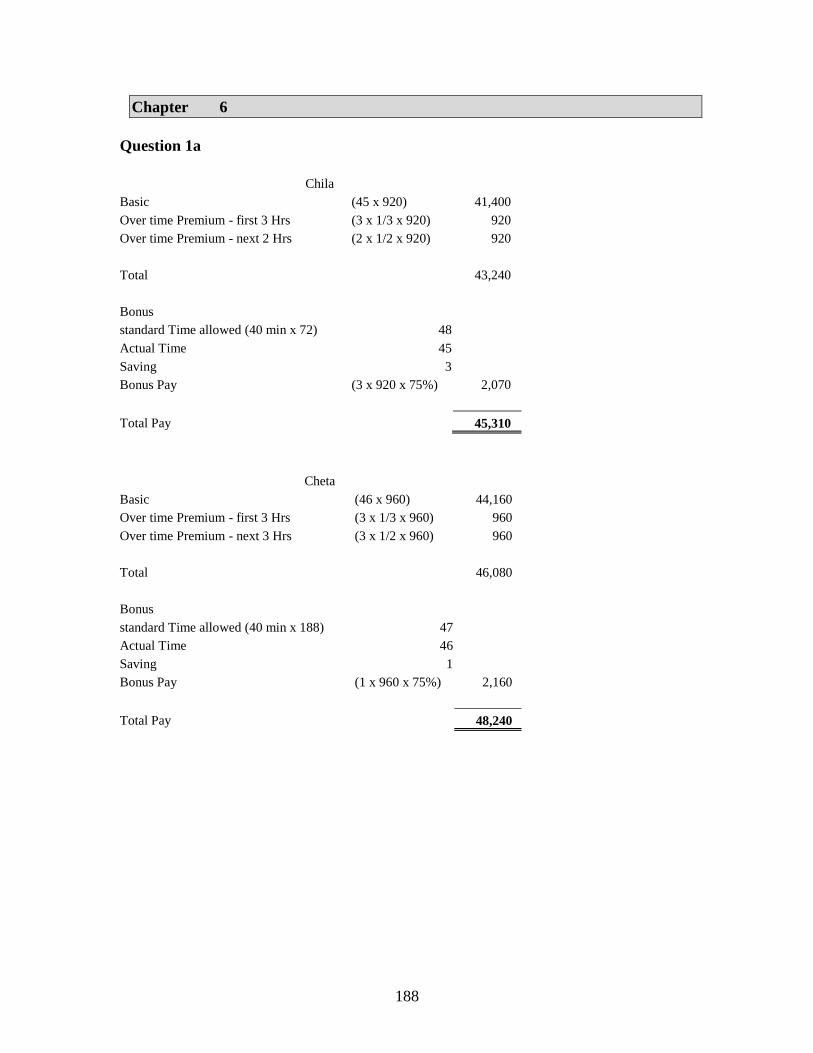
188
Chapter 6
Question 1a
Chila
Basic (45 x 920) 41,400
Over time Premium - first 3 Hrs (3 x 1/3 x 920) 920
Over time Premium - next 2 Hrs (2 x 1/2 x 920) 920
Total 43,240
Bonus
standard Time allowed (40 min x 72) 48
Actual Time 45
Saving 3
Bonus Pay (3 x 920 x 75%) 2,070
Total Pay 45,310
Cheta
Basic (46 x 960) 44,160
Over time Premium - first 3 Hrs (3 x 1/3 x 960) 960
Over time Premium - next 3 Hrs (3 x 1/2 x 960) 960
Total 46,080
Bonus
standard Time allowed (40 min x 188) 47
Actual Time 46
Saving 1
Bonus Pay (1 x 960 x 75%) 2,160
Total Pay 48,240
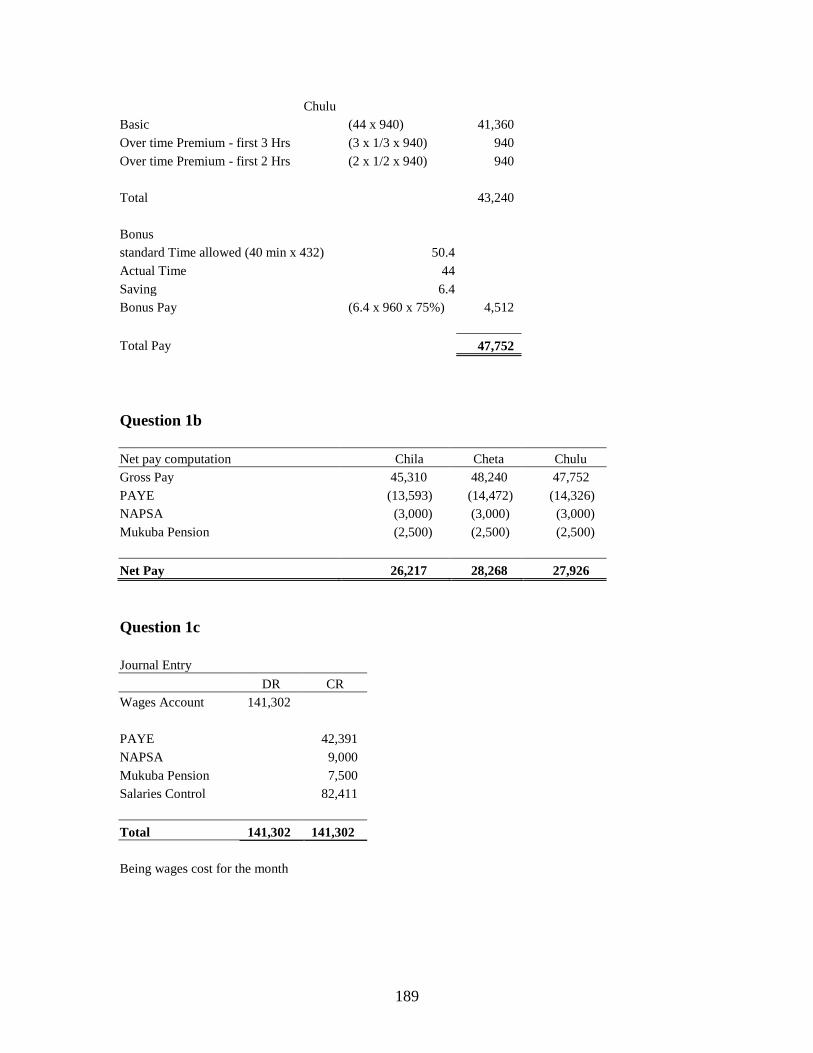
189
Chulu
Basic (44 x 940) 41,360
Over time Premium - first 3 Hrs (3 x 1/3 x 940) 940
Over time Premium - first 2 Hrs (2 x 1/2 x 940) 940
Total 43,240
Bonus
standard Time allowed (40 min x 432) 50.4
Actual Time 44
Saving 6.4
Bonus Pay (6.4 x 960 x 75%) 4,512
Total Pay 47,752
Question 1b
Net pay computation Chila Cheta Chulu
Gross Pay 45,310 48,240 47,752
PAYE (13,593) (14,472) (14,326)
NAPSA (3,000) (3,000) (3,000)
Mukuba Pension (2,500) (2,500) (2,500)
Net Pay 26,217 28,268 27,926
Question 1c
Journal Entry
DR CR
Wages Account 141,302
PAYE 42,391
NAPSA 9,000
Mukuba Pension 7,500
Salaries Control 82,411
Total 141,302 141,302
Being wages cost for the month
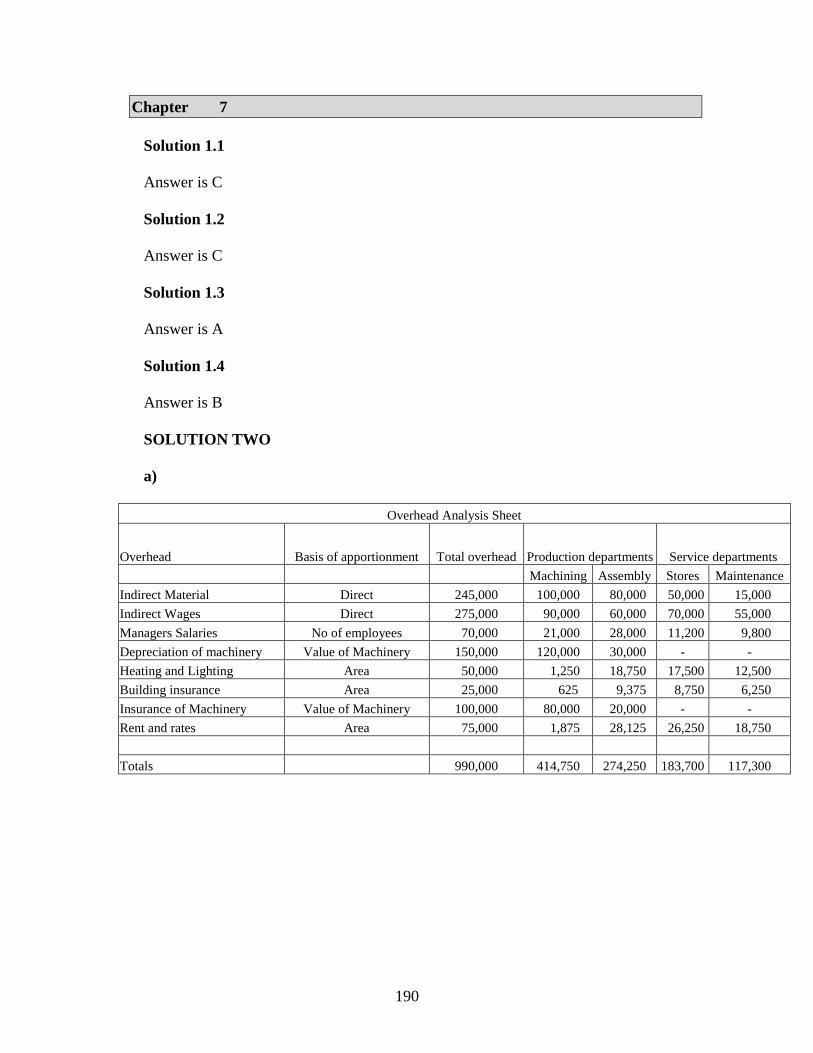
190
Chapter 7
Solution 1.1
Answer is C
Solution 1.2
Answer is C
Solution 1.3
Answer is A
Solution 1.4
Answer is B
SOLUTION TWO
a)
Overhead Analysis Sheet
Overhead Basis of apportionment Total overhead Production departments Service departments
Machining Assembly Stores Maintenance
Indirect Material Direct 245,000 100,000 80,000 50,000 15,000
Indirect Wages Direct 275,000 90,000 60,000 70,000 55,000
Managers Salaries No of employees 70,000 21,000 28,000 11,200 9,800
Depreciation of machinery Value of Machinery 150,000 120,000 30,000 - -
Heating and Lighting Area 50,000 1,250 18,750 17,500 12,500
Building insurance Area 25,000 625 9,375 8,750 6,250
Insurance of Machinery Value of Machinery 100,000 80,000 20,000 - -
Rent and rates Area 75,000 1,875 28,125 26,250 18,750
Totals 990,000 414,750 274,250 183,700 117,300
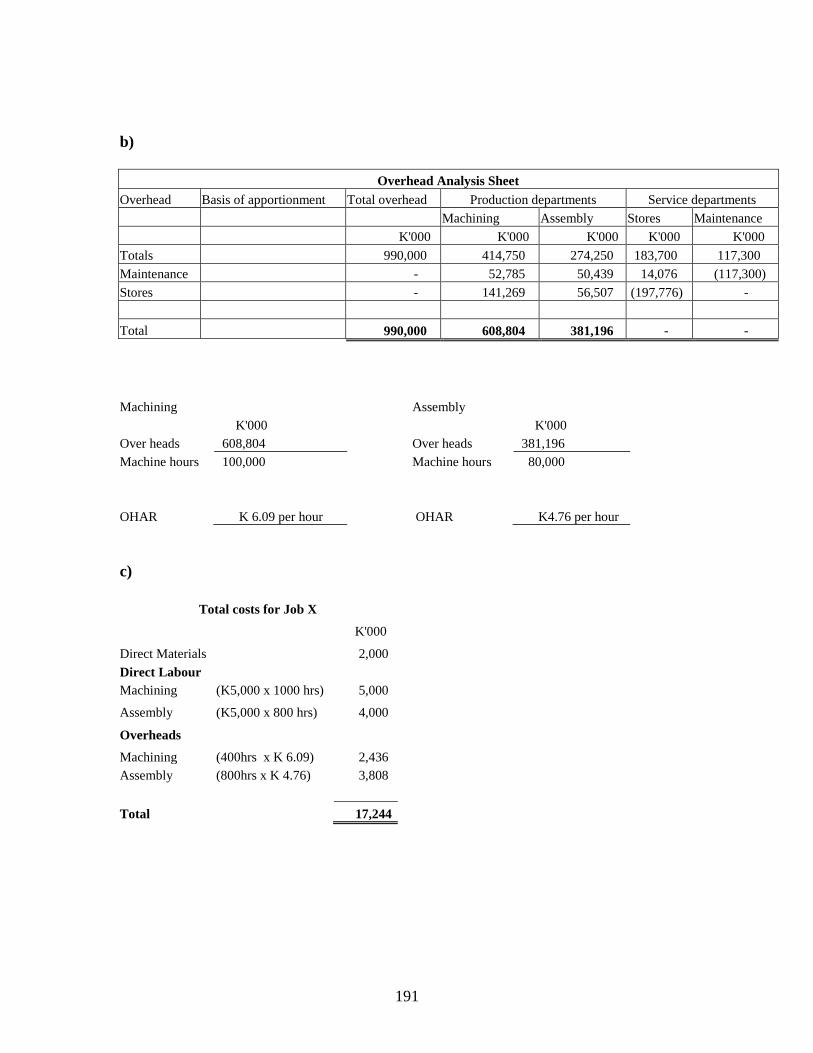
191
b)
Overhead Analysis Sheet
Overhead Basis of apportionment Total overhead Production departments Service departments
Machining Assembly Stores Maintenance
K'000 K'000 K'000 K'000 K'000
Totals 990,000 414,750 274,250 183,700 117,300
Maintenance - 52,785 50,439 14,076 (117,300)
Stores - 141,269 56,507 (197,776) -
Total 990,000 608,804 381,196 - -
Machining Assembly
K'000 K'000
Over heads 608,804 Over heads 381,196
Machine hours 100,000 Machine hours 80,000
OHAR K 6.09 per hour OHAR K4.76 per hour
c)
Total costs for Job X
K'000
Direct Materials 2,000
Direct Labour
Machining (K5,000 x 1000 hrs) 5,000
Assembly (K5,000 x 800 hrs) 4,000
Overheads
Machining (400hrs x K 6.09) 2,436
Assembly (800hrs x K 4.76) 3,808
Total 17,244
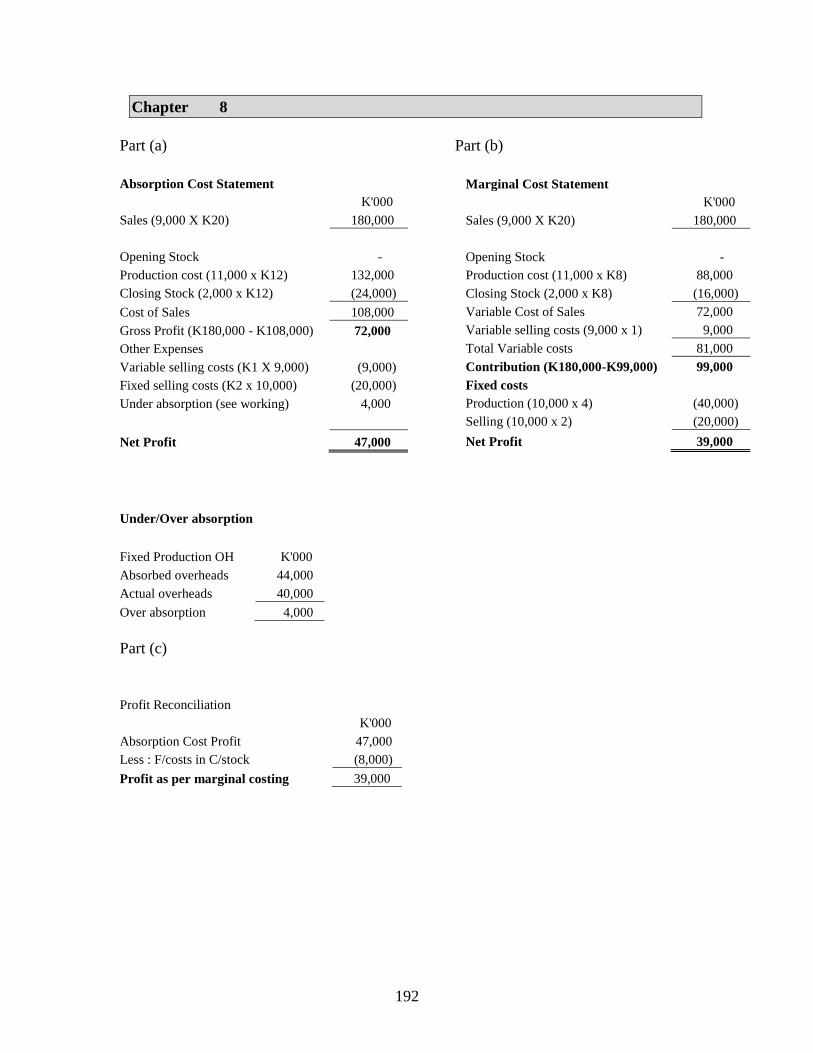
192
Chapter 8
Part (a) Part (b)
Absorption Cost Statement
K'000
Sales (9,000 X K20) 180,000
Opening Stock -
Production cost (11,000 x K12) 132,000
Closing Stock (2,000 x K12) (24,000)
Cost of Sales 108,000
Gross Profit (K180,000 - K108,000) 72,000
Other Expenses
Variable selling costs (K1 X 9,000) (9,000)
Fixed selling costs (K2 x 10,000) (20,000)
Under absorption (see working) 4,000
Net Profit 47,000
Under/Over absorption
Fixed Production OH K'000
Absorbed overheads 44,000
Actual overheads 40,000
Over absorption 4,000
Part (c)
Profit Reconciliation
K'000
Absorption Cost Profit 47,000
Less : F/costs in C/stock (8,000)
Profit as per marginal costing 39,000
Marginal Cost Statement
K'000
Sales (9,000 X K20) 180,000
Opening Stock -
Production cost (11,000 x K8) 88,000
Closing Stock (2,000 x K8) (16,000)
Variable Cost of Sales 72,000
Variable selling costs (9,000 x 1) 9,000
Total Variable costs 81,000
Contribution (K180,000-K99,000) 99,000
Fixed costs
Production (10,000 x 4) (40,000)
Selling (10,000 x 2) (20,000)
Net Profit 39,000
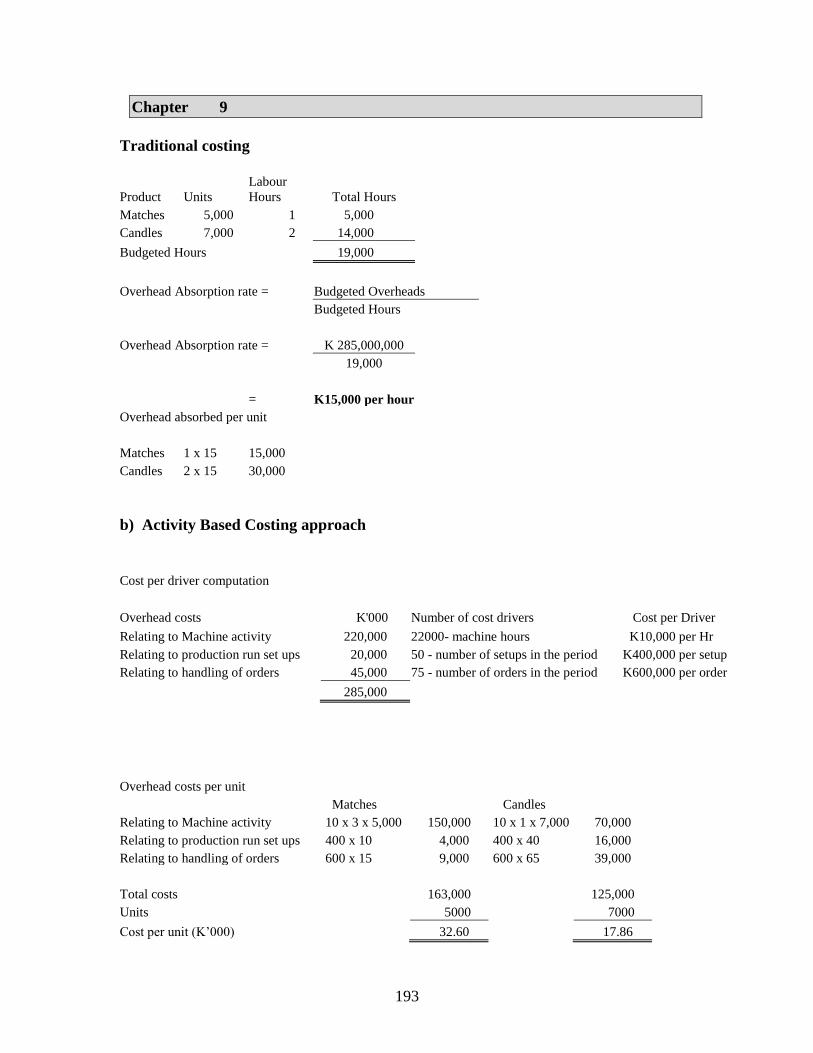
193
Chapter 9
Traditional costing
Product Units
Labour
Hours Total Hours
Matches 5,000 1 5,000
Candles 7,000 2 14,000
Budgeted Hours 19,000
Overhead Absorption rate = Budgeted Overheads
Budgeted Hours
Overhead Absorption rate = K 285,000,000
19,000
= K15,000 per hour
Overhead absorbed per unit
Matches 1 x 15 15,000
Candles 2 x 15 30,000
b) Activity Based Costing approach
Cost per driver computation
Overhead costs K'000 Number of cost drivers Cost per Driver
Relating to Machine activity 220,000 22000- machine hours K10,000 per Hr
Relating to production run set ups 20,000 50 - number of setups in the period K400,000 per setup
Relating to handling of orders 45,000 75 - number of orders in the period K600,000 per order
285,000
Overhead costs per unit
Matches Candles
Relating to Machine activity 10 x 3 x 5,000 150,000 10 x 1 x 7,000 70,000
Relating to production run set ups 400 x 10 4,000 400 x 40 16,000
Relating to handling of orders 600 x 15 9,000 600 x 65 39,000
Total costs 163,000 125,000
Units 5000 7000
Cost per unit (K’000) 32.60 17.86
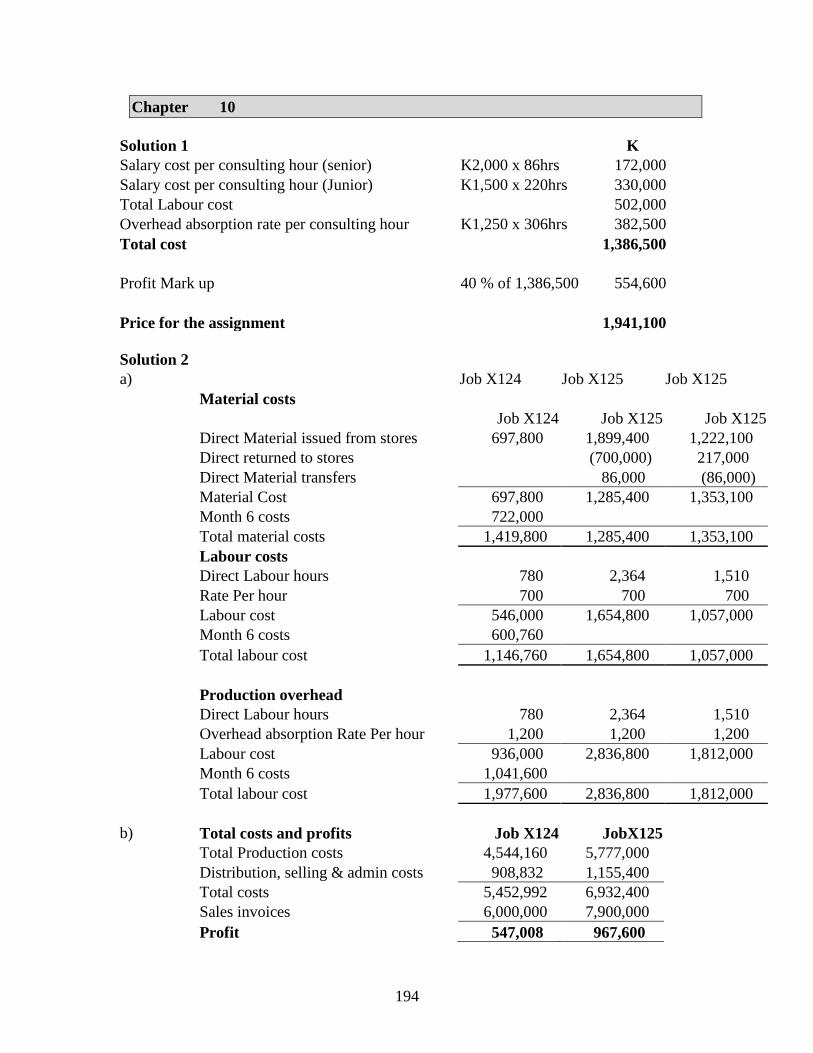
194
Chapter 10
Solution 1 K
Salary cost per consulting hour (senior) K2,000 x 86hrs 172,000
Salary cost per consulting hour (Junior) K1,500 x 220hrs 330,000
Total Labour cost 502,000
Overhead absorption rate per consulting hour K1,250 x 306hrs 382,500
Total cost 1,386,500
Profit Mark up 40 % of 1,386,500 554,600
Price for the assignment 1,941,100
Solution 2
a) Job X124 Job X125 Job X125
Material costs
Job X124 Job X125 Job X125
Direct Material issued from stores 697,800 1,899,400 1,222,100
Direct returned to stores (700,000) 217,000
Direct Material transfers 86,000 (86,000)
Material Cost 697,800 1,285,400 1,353,100
Month 6 costs 722,000
Total material costs 1,419,800 1,285,400 1,353,100
Labour costs
Direct Labour hours 780 2,364 1,510
Rate Per hour 700 700 700
Labour cost 546,000 1,654,800 1,057,000
Month 6 costs 600,760
Total labour cost 1,146,760 1,654,800 1,057,000
Production overhead
Direct Labour hours 780 2,364 1,510
Overhead absorption Rate Per hour 1,200 1,200 1,200
Labour cost 936,000 2,836,800 1,812,000
Month 6 costs 1,041,600
Total labour cost 1,977,600 2,836,800 1,812,000
b) Total costs and profits Job X124 JobX125
Total Production costs 4,544,160 5,777,000
Distribution, selling & admin costs 908,832 1,155,400
Total costs 5,452,992 6,932,400
Sales invoices 6,000,000 7,900,000
Profit 547,008 967,600
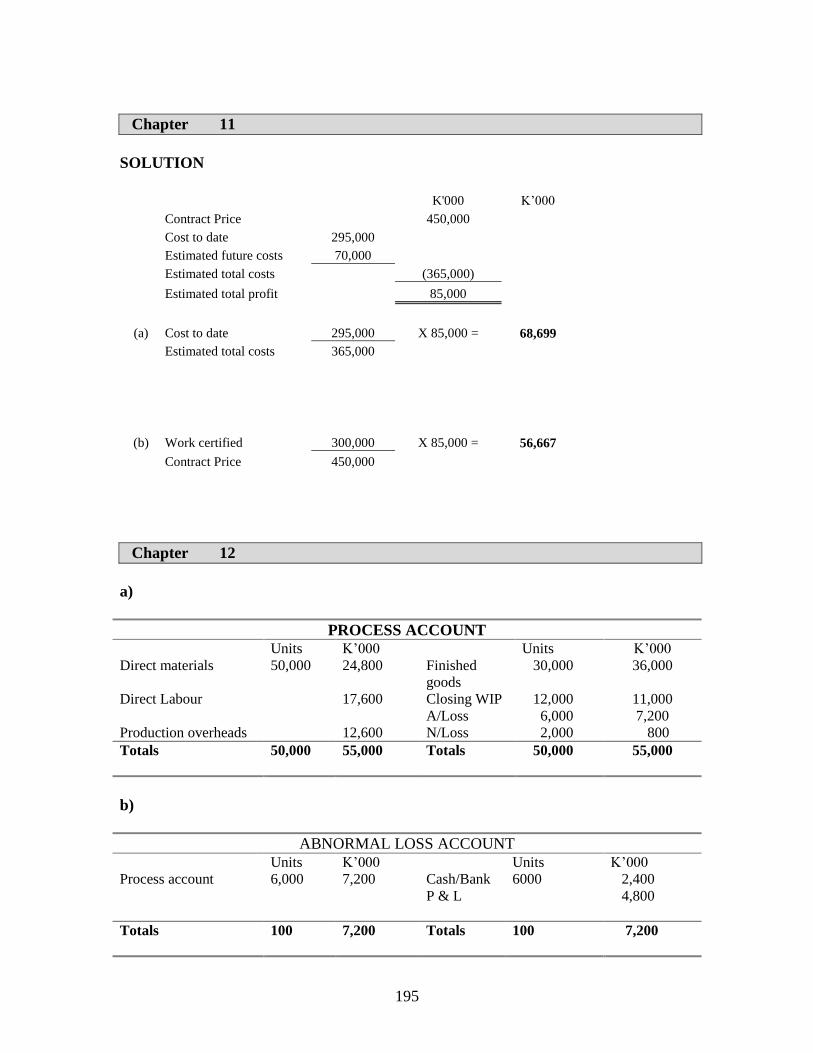
195
Chapter 11
SOLUTION
K'000 K’000
Contract Price 450,000
Cost to date 295,000
Estimated future costs 70,000
Estimated total costs (365,000)
Estimated total profit 85,000
(a) Cost to date 295,000 X 85,000 = 68,699
Estimated total costs 365,000
(b) Work certified 300,000 X 85,000 = 56,667
Contract Price 450,000
Chapter 12
a)
PROCESS ACCOUNT
Units K’000 Units K’000
Direct materials 50,000 24,800 Finished
goods
30,000 36,000
Direct Labour 17,600 Closing WIP 12,000 11,000
A/Loss 6,000 7,200
Production overheads 12,600 N/Loss 2,000 800
Totals
50,000 55,000 Totals 50,000 55,000
b)
ABNORMAL LOSS ACCOUNT
Units K’000 Units K’000
Process account 6,000 7,200 Cash/Bank 6000 2,400
P & L 4,800
Totals
100 7,200 Totals 100 7,200
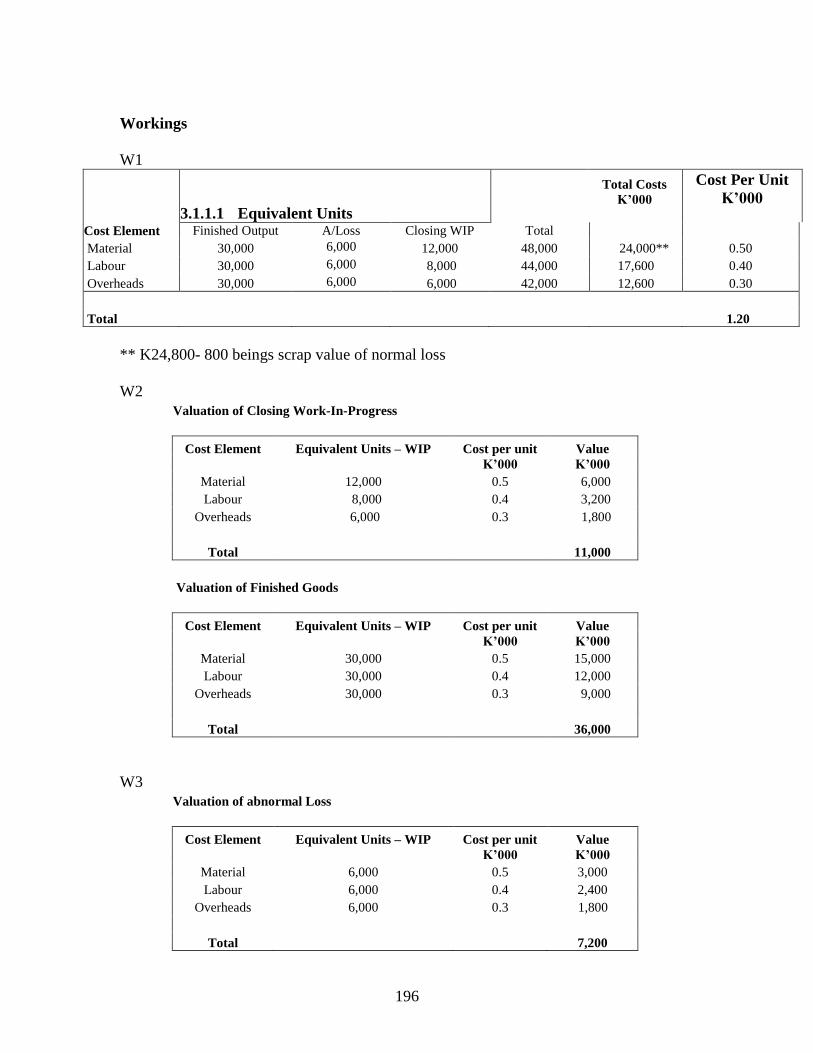
196
Workings
W1
Cost Element
3.1.1.1 Equivalent Units
Total Costs
K’000
Cost Per Unit
K’000
Finished Output A/Loss Closing WIP Total
Material 30,000 6,000 12,000 48,000 24,000** 0.50
Labour 30,000 6,000 8,000 44,000 17,600 0.40
Overheads 30,000 6,000 6,000 42,000 12,600 0.30
Total 1.20
** K24,800- 800 beings scrap value of normal loss
W2
Valuation of Closing Work-In-Progress
Cost Element
Equivalent Units – WIP
Cost per unit
K’000
Value
K’000
Material 12,000 0.5 6,000
Labour 8,000 0.4 3,200
Overheads 6,000 0.3 1,800
Total 11,000
Valuation of Finished Goods
Cost Element
Equivalent Units – WIP
Cost per unit
K’000
Value
K’000
Material 30,000 0.5 15,000
Labour 30,000 0.4 12,000
Overheads 30,000 0.3 9,000
Total 36,000
W3
Valuation of abnormal Loss
Cost Element
Equivalent Units – WIP
Cost per unit
K’000
Value
K’000
Material 6,000 0.5 3,000
Labour 6,000 0.4 2,400
Overheads 6,000 0.3 1,800
Total 7,200
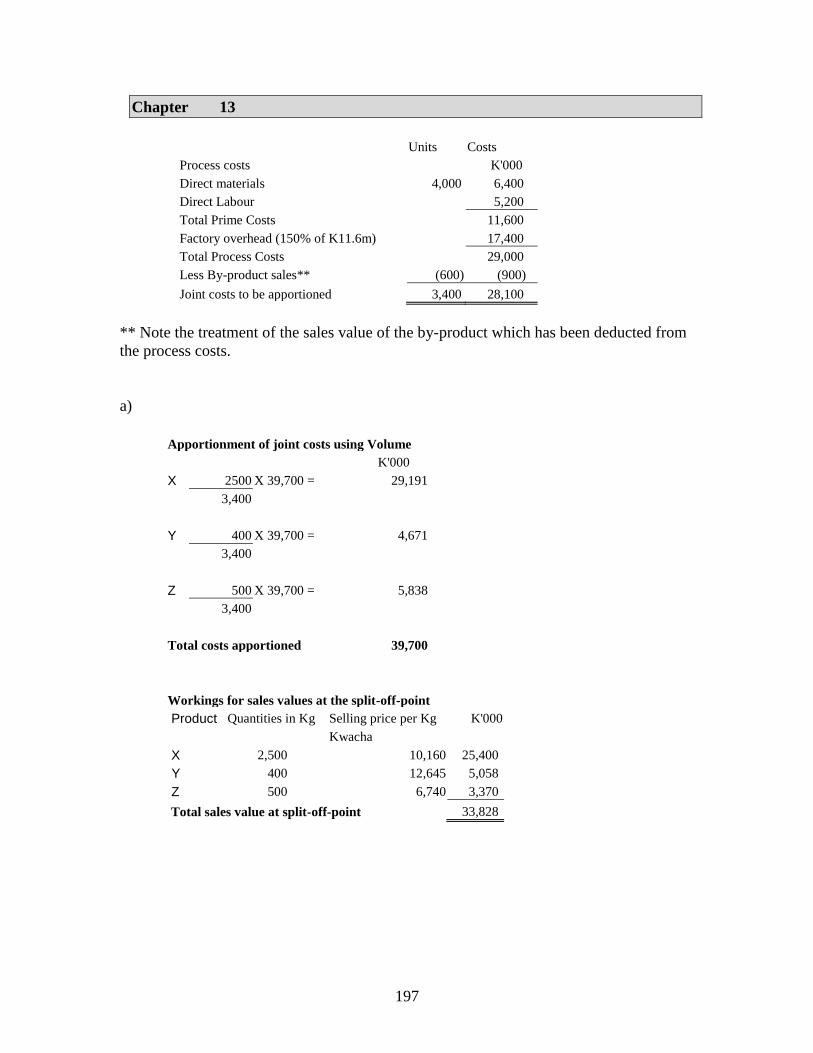
197
Chapter 13
Units Costs
Process costs K'000
Direct materials 4,000 6,400
Direct Labour 5,200
Total Prime Costs 11,600
Factory overhead (150% of K11.6m) 17,400
Total Process Costs 29,000
Less By-product sales** (600) (900)
Joint costs to be apportioned 3,400 28,100
** Note the treatment of the sales value of the by-product which has been deducted from
the process costs.
a)
Apportionment of joint costs using Volume
K'000
X 2500 X 39,700 = 29,191
3,400
Y 400 X 39,700 = 4,671
3,400
Z 500 X 39,700 = 5,838
3,400
Total costs apportioned 39,700
Workings for sales values at the split-off-point
Product Quantities in Kg Selling price per Kg K'000
Kwacha
X 2,500 10,160 25,400
Y 400 12,645 5,058
Z 500 6,740 3,370
Total sales value at split-off-point 33,828
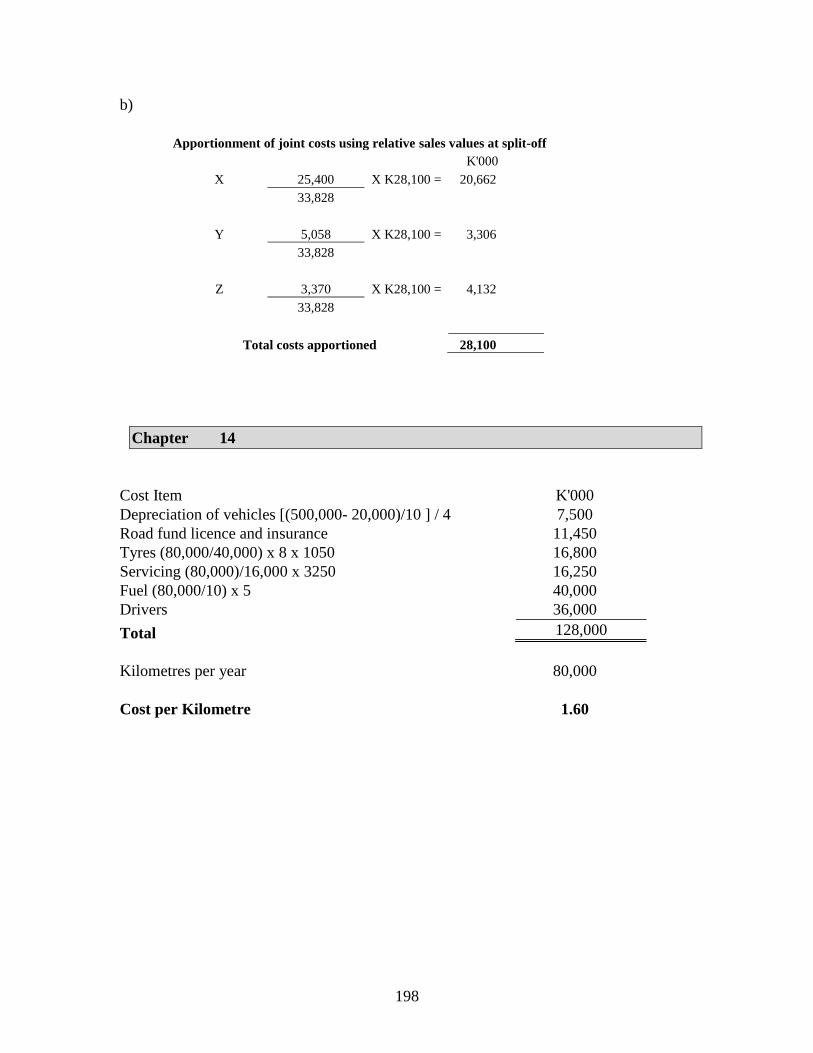
198
b)
Apportionment of joint costs using relative sales values at split-off
K'000
X 25,400 X K28,100 = 20,662
33,828
Y 5,058 X K28,100 = 3,306
33,828
Z 3,370 X K28,100 = 4,132
33,828
Total costs apportioned 28,100
Chapter 14
Cost Item K'000
Depreciation of vehicles [(500,000- 20,000)/10 ] / 4 7,500
Road fund licence and insurance 11,450
Tyres (80,000/40,000) x 8 x 1050 16,800
Servicing (80,000)/16,000 x 3250 16,250
Fuel (80,000/10) x 5 40,000
Drivers 36,000
Total 128,000
Kilometres per year 80,000
Cost per Kilometre 1.60
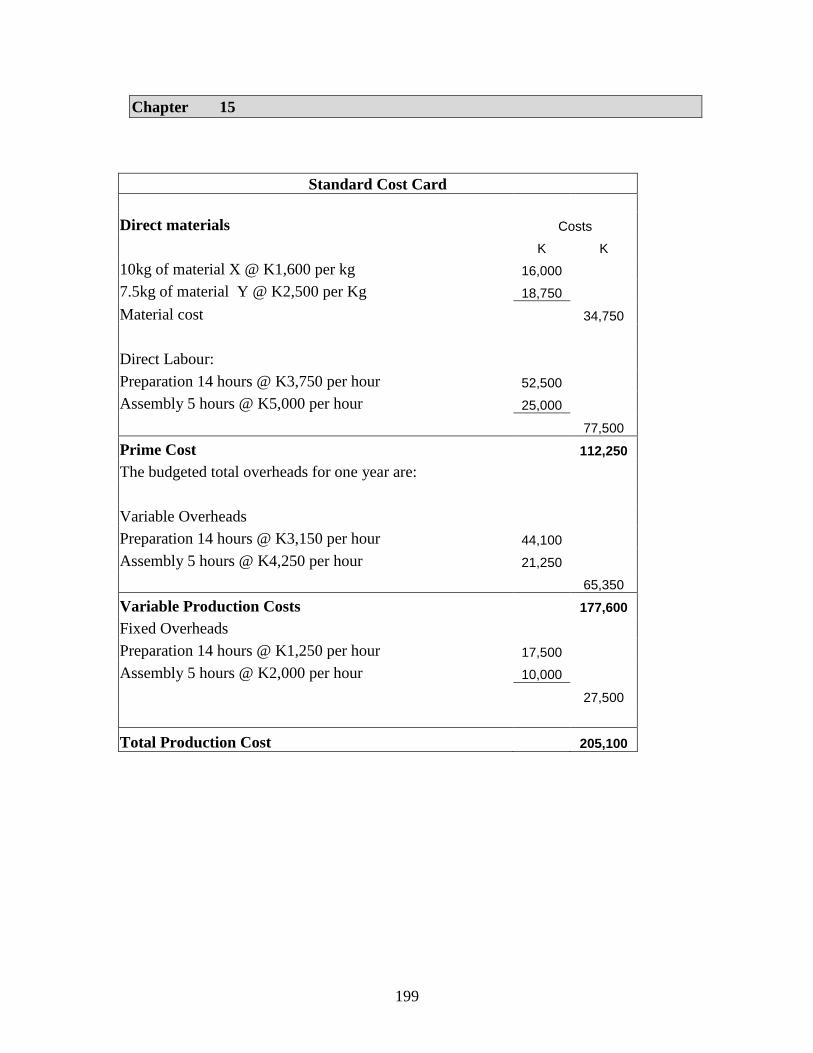
199
Chapter 15
Standard Cost Card
Direct materials Costs
K K
10kg of material X @ K1,600 per kg 16,000
7.5kg of material Y @ K2,500 per Kg 18,750
Material cost 34,750
Direct Labour:
Preparation 14 hours @ K3,750 per hour 52,500
Assembly 5 hours @ K5,000 per hour 25,000
77,500
Prime Cost 112,250
The budgeted total overheads for one year are:
Variable Overheads
Preparation 14 hours @ K3,150 per hour 44,100
Assembly 5 hours @ K4,250 per hour 21,250
65,350
Variable Production Costs 177,600
Fixed Overheads
Preparation 14 hours @ K1,250 per hour 17,500
Assembly 5 hours @ K2,000 per hour 10,000
27,500
Total Production Cost 205,100
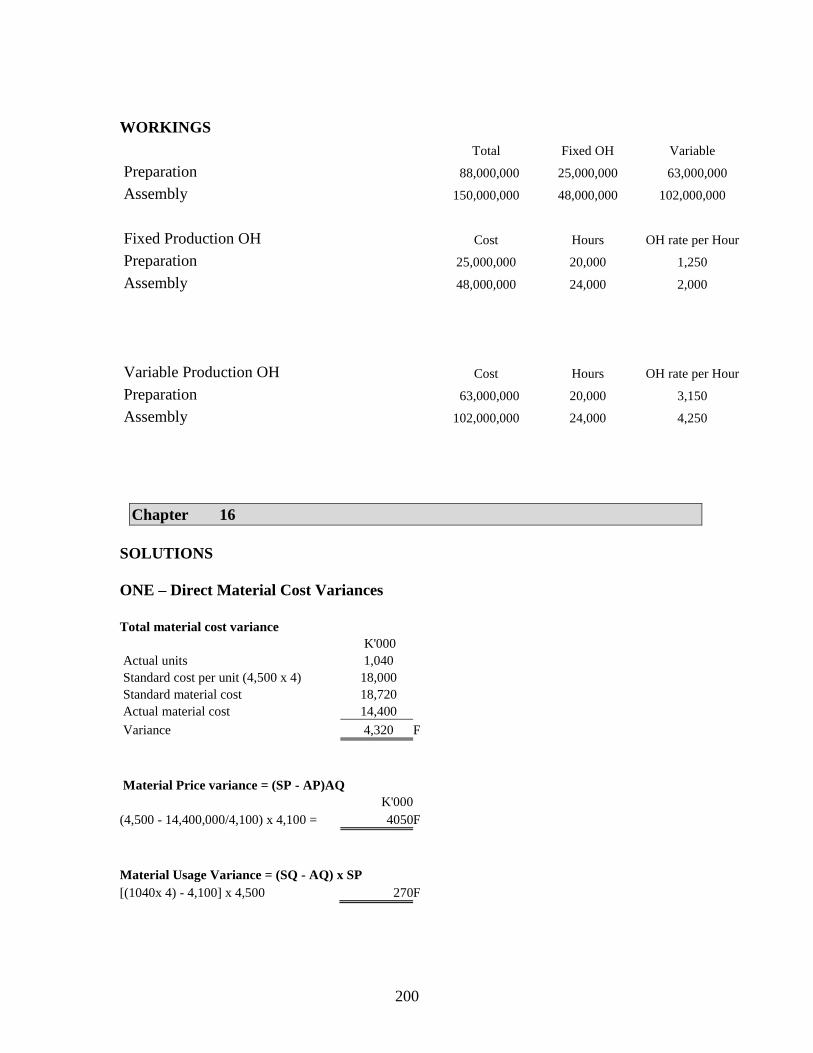
200
WORKINGS
Total Fixed OH Variable
Preparation 88,000,000 25,000,000 63,000,000
Assembly 150,000,000 48,000,000 102,000,000
Fixed Production OH Cost Hours OH rate per Hour
Preparation 25,000,000 20,000 1,250
Assembly 48,000,000 24,000 2,000
Variable Production OH Cost Hours OH rate per Hour
Preparation 63,000,000 20,000 3,150
Assembly 102,000,000 24,000 4,250
Chapter 16
SOLUTIONS
ONE – Direct Material Cost Variances
Total material cost variance
K'000
Actual units 1,040
Standard cost per unit (4,500 x 4) 18,000
Standard material cost 18,720
Actual material cost 14,400
Variance 4,320 F
Material Price variance = (SP - AP)AQ
K'000
(4,500 - 14,400,000/4,100) x 4,100 = 4050 F
Material Usage Variance = (SQ - AQ) x SP
[(1040x 4) - 4,100] x 4,500 270 F
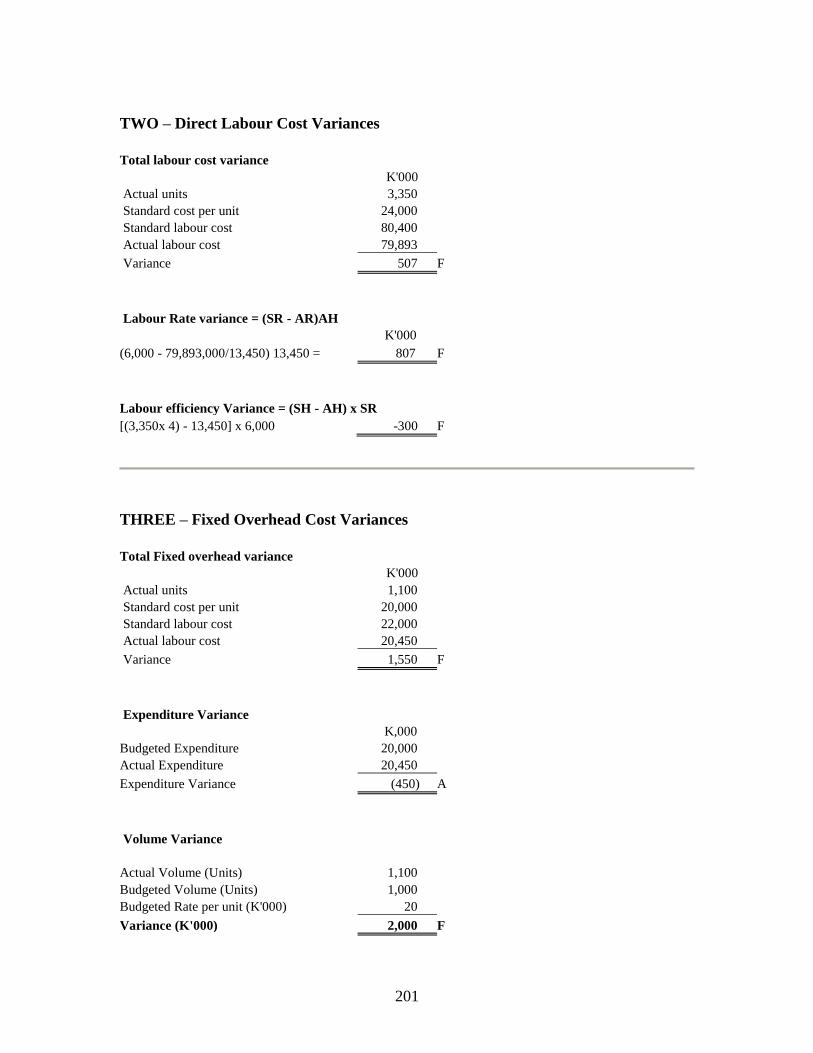
201
TWO – Direct Labour Cost Variances
Total labour cost variance
K'000
Actual units 3,350
Standard cost per unit 24,000
Standard labour cost 80,400
Actual labour cost 79,893
Variance 507 F
Labour Rate variance = (SR - AR)AH
K'000
(6,000 - 79,893,000/13,450) 13,450 = 807 F
Labour efficiency Variance = (SH - AH) x SR
[(3,350x 4) - 13,450] x 6,000 -300 F
THREE – Fixed Overhead Cost Variances
Total Fixed overhead variance
K'000
Actual units 1,100
Standard cost per unit 20,000
Standard labour cost 22,000
Actual labour cost 20,450
Variance 1,550 F
Expenditure Variance
K,000
Budgeted Expenditure 20,000
Actual Expenditure 20,450
Expenditure Variance (450) A
Volume Variance
Actual Volume (Units) 1,100
Budgeted Volume (Units) 1,000
Budgeted Rate per unit (K'000) 20
Variance (K'000) 2,000 F
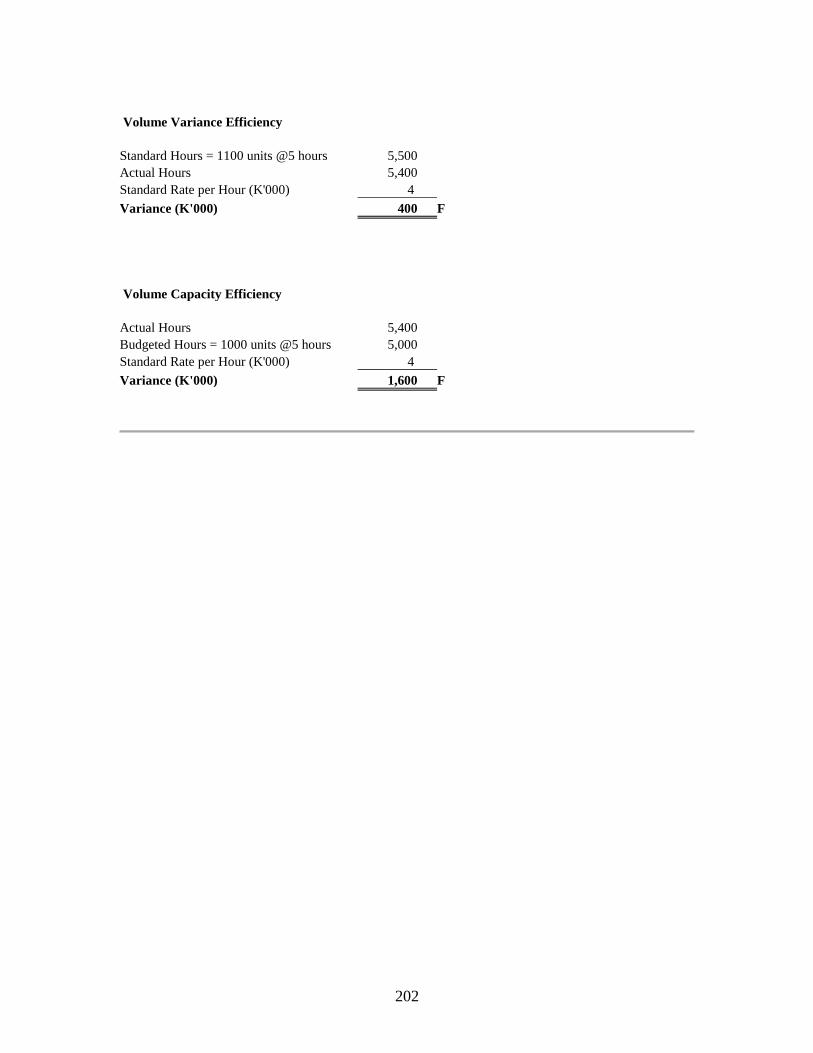
202
Volume Variance Efficiency
Standard Hours = 1100 units @5 hours 5,500
Actual Hours 5,400
Standard Rate per Hour (K'000) 4
Variance (K'000) 400 F
Volume Capacity Efficiency
Actual Hours 5,400
Budgeted Hours = 1000 units @5 hours 5,000
Standard Rate per Hour (K'000) 4
Variance (K'000) 1,600 F
203
Index
A
Abnormal gain 121
Abnormal loss 120
Absorption bases 67
Absorption costing 78
Activity Based Costing 88
Architects certificate 107
Attainable standard 157
Avoidable cost 12, 184
B
Basic standard 157
Batch costing 101
By products 136
C
Causes of Variances 171
Common costs 137
Contract costing 106
Contribution 80
Controllable costs 13
Continuous Stocktaking 39
Cost accounting 2
Cost behaviour 16
Cost bookkeeping 176
Cost centre 4
Cost classification 10
Cost driver 90
Cost objective 6
Cost unit 5
Costing methods 98
Current standard 157
D
Direct cost 10
Direct expense 11
Direct labour 53
Direct labour rate variance 165
Direct labour efficiency variance 166
Direct material 11
Direct material price variance 163
Direct material usage variance 164
Direct wages 11
Discretionary costs 13
E
Economic order quantity (EOQ) 42
Elimination method 66
Equivalent units 127
F
Financial accounting 3
First in first out (FIFO) 32
Fixed costs 12,17
Fixed overhead expenditure variance 169
Fixed overhead volume variance 169
Fixed overhead volume efficiency
variance 170
Fixed overhead volume capacity
variance 170
G
Goods received note (GRN) 29
H
Heterogeneity 146
High-low method 21
Holding costs 38
I
Ideal standard 157
Indirect costs 11
Intangibility 146
Integrated system 177
Interlocking system 180
Investment centre 4
J
Job costing 98
Job pricing 99
Job sheet 56
Joint costs 136
204
Joint products 136
L
Labour turnover 50
Last in first out (LIFO) 32
M
Management accounting 2
Marginal costing 78
Maximum stock level 40
Minimum stock level 40
N
Net Realisable Value method 139
Normal loss 120
Notion profit 109
O
Over absorption 69
Overhead absorption 67
Overhead allocation 63
Overhead apportionment 63
Overtime premium 47
P
Period costs 12
Periodic Stocktaking 39
Perishability 146
Piecework 48
Predetermined absorption rates 69
Process costing 119
Product costs 12
Production overheads 62
Profit centre 4
Purchase invoice 28
Purchase order 27
Purchase requisition 26
R
Re-order level 40
Repeated distribution method 67
Responsibility accounting 4
Responsibility centre 4
Retention Money 107
Revenue centre 4
S
Semi-variable costs 19
Service costing 146
Simultaneity 146
Specific order costing 98
Standard costing 154
Step cost 18
Stock control 26
Split-off point 136
T
Time Sheets 55
Two bin system 42
U
Unavoidable costs 12
Under absorption 69
V
Variance analysis 161
Variable costs 12,18
Variable overhead expenditure
variance 167
Variable overhead efficiency
variance 168
W
Weighted average method 130
Weighted average price 33
Work in progress 127