Embed Size (px)
Citation preview
Cosmic Rays Don’t Strike Twice:Understanding the Nature of DRAM Errors
and the Implications for System Design
Andy A. Hwang Ioan Stefanovici Bianca SchroederDepartment of Computer Science, University of Toronto
{hwang, ioan, bianca}@cs.toronto.edu
AbstractMain memory is one of the leading hardware causes for machinecrashes in today’s datacenters. Designing, evaluating and modelingsystems that are resilient against memory errors requires a goodunderstanding of the underlying characteristics of errors in DRAMin the field. While there have recently been a few first studies onDRAM errors in production systems, these have been too limitedin either the size of the data set or the granularity of the data toconclusively answer many of the open questions on DRAM errors.Such questions include, for example, the prevalence of soft errorscompared to hard errors, or the analysis of typical patterns of harderrors.
In this paper, we study data on DRAM errors collected on adiverse range of production systems in total covering nearly 300terabyte-years of main memory. As a first contribution, we providea detailed analytical study of DRAM error characteristics, includ-ing both hard and soft errors. We find that a large fraction of DRAMerrors in the field can be attributed to hard errors and we provide adetailed analytical study of their characteristics. As a second con-tribution, the paper uses the results from the measurement study toidentify a number of promising directions for designing more re-silient systems and evaluates the potential of different protectionmechanisms in the light of realistic error patterns. One of our find-ings is that simple page retirement policies might be able to maska large number of DRAM errors in production systems, while sac-rificing only a negligible fraction of the total DRAM in the system.
Categories and Subject Descriptors B.8.0 [Hardware]: Perfor-mance and Reliability
General Terms Reliability, Measurement
1. IntroductionRecent studies point to main memory as one of the leading hard-ware causes for machine crashes and component replacements intoday’s datacenters [13, 18, 20]. As the amount of DRAM inservers keeps growing and chip densities increase, DRAM errorsmight pose an even larger threat to the reliability of future genera-tions of systems.
Permission to make digital or hard copies of all or part of this work for personal orclassroom use is granted without fee provided that copies are not made or distributedfor profit or commercial advantage and that copies bear this notice and the full citationon the first page. To copy otherwise, to republish, to post on servers or to redistributeto lists, requires prior specific permission and/or a fee.
ASPLOS’12, March 3–7, 2012, London, England, UK.Copyright c© 2012 ACM 978-1-4503-0759-8/12/03. . . $10.00
As a testament to the importance of the problem, most serversystems provide some form of protection against memory errors.Most commonly this is done at the hardware level through the useof DIMMs with error correcting codes (ECC). ECC DIMMs eitherprovide single-bit error correction and double-bit error detection(SEC-DED); or use more complex codes in the chipkill family [4]that allow a system to tolerate an entire chip failure at the costof somewhat reduced performance and increased energy usage.In addition, some systems employ protection mechanisms at theoperating system level. For example, Solaris tries to identify andthen retire pages with hard errors [3, 20]. Researchers have alsoexplored other avenues, such as virtualized and flexible ECC at thesoftware level [24].
The effectiveness of different approaches for protecting againstmemory errors and the most promising directions for designing fu-ture systems that are resilient in the face of increased DRAM errorrates depend greatly on the nature of memory errors. For example,SEC-DED based ECC is most effective for protecting against tran-sient random errors, such as soft errors caused by alpha particles orcosmic rays. On the other hand, mechanisms based on page retire-ment have potential only for protecting against hard errors, whichare due to device defects and hence tend to be repeatable. In gen-eral, any realistic evaluation of system reliability relies on accurateassumptions about the underlying error process, including the rel-ative frequency of hard versus soft errors, and the typical modesof hard errors (e.g. device defects affecting individual cells, wholerows, columns, or an entire chip).
While there exists a large body of work on protecting systemsagainst DRAM errors, the nature of DRAM errors is not verywell understood. Most existing work focuses solely on soft er-rors [1, 6, 9, 12, 14, 15, 21, 22, 25, 27] as soft error rates are oftenassumed to be orders of magnitudes greater than typical hard-errorrates [5]. However, there are no large-scale field studies backingup this assumption. Existing studies on DRAM errors are quite oldand rely on controlled lab experiments, rather than production ma-chines [15, 25, 26, 28], and focus on soft errors only [10]. A notableexception is a recent study by Li et al. [11], which analyzes fielddata collected on 200 production machines and finds evidence thatthe rate of hard errors might be higher than commonly assumed.However, the limited size of their data set, which includes only atotal of 12 machines with errors, makes it hard to draw statisti-cally significant conclusions on the rate of hard versus soft errorsor common modes of hard errors. Another recent field study [19]speculates that the rate of hard errors might be significant basedon correlations they observe in error counts over time, but lacksmore fine-grained data, in the form of information on the locationof errors, to validate their hypothesis.
111
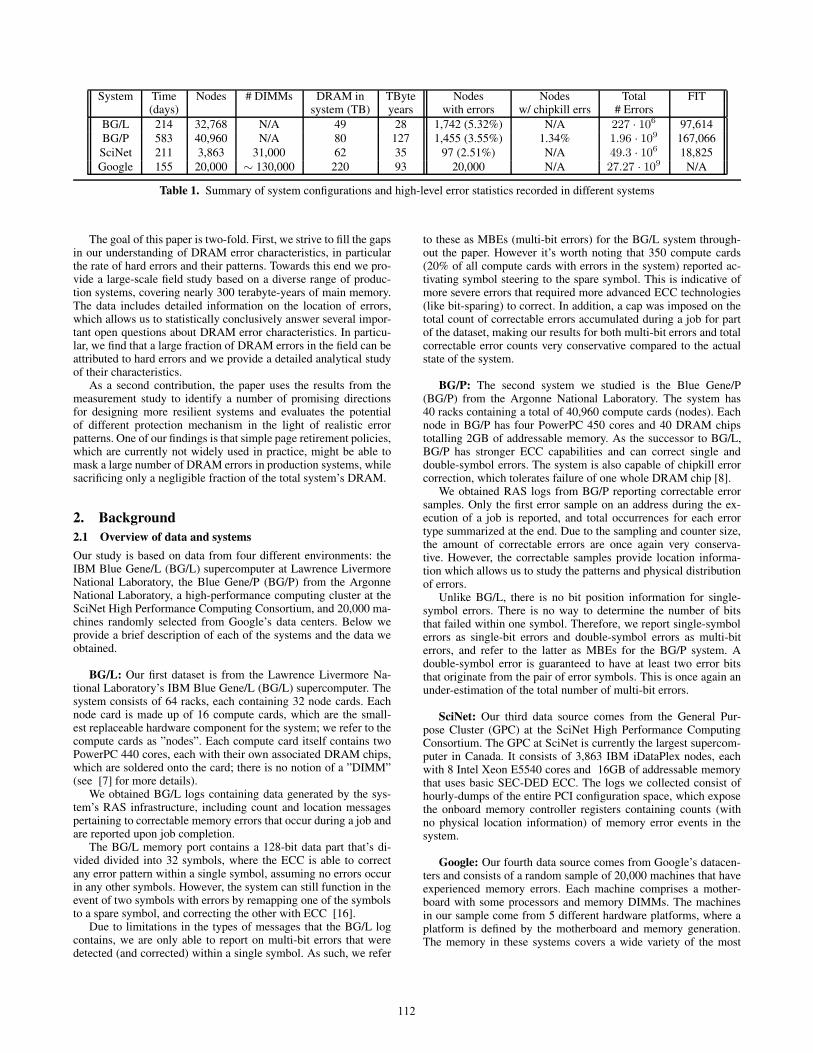
System Time Nodes # DIMMs DRAM in TByte Nodes Nodes Total FIT(days) system (TB) years with errors w/ chipkill errs # Errors
BG/L 214 32,768 N/A 49 28 1,742 (5.32%) N/A 227 · 106 97,614BG/P 583 40,960 N/A 80 127 1,455 (3.55%) 1.34% 1.96 · 109 167,066SciNet 211 3,863 31,000 62 35 97 (2.51%) N/A 49.3 · 106 18,825Google 155 20,000 ∼ 130,000 220 93 20,000 N/A 27.27 · 109 N/A
Table 1. Summary of system configurations and high-level error statistics recorded in different systems
The goal of this paper is two-fold. First, we strive to fill the gapsin our understanding of DRAM error characteristics, in particularthe rate of hard errors and their patterns. Towards this end we pro-vide a large-scale field study based on a diverse range of produc-tion systems, covering nearly 300 terabyte-years of main memory.The data includes detailed information on the location of errors,which allows us to statistically conclusively answer several impor-tant open questions about DRAM error characteristics. In particu-lar, we find that a large fraction of DRAM errors in the field can beattributed to hard errors and we provide a detailed analytical studyof their characteristics.
As a second contribution, the paper uses the results from themeasurement study to identify a number of promising directionsfor designing more resilient systems and evaluates the potentialof different protection mechanism in the light of realistic errorpatterns. One of our findings is that simple page retirement policies,which are currently not widely used in practice, might be able tomask a large number of DRAM errors in production systems, whilesacrificing only a negligible fraction of the total system’s DRAM.
2. Background2.1 Overview of data and systems
Our study is based on data from four different environments: theIBM Blue Gene/L (BG/L) supercomputer at Lawrence LivermoreNational Laboratory, the Blue Gene/P (BG/P) from the ArgonneNational Laboratory, a high-performance computing cluster at theSciNet High Performance Computing Consortium, and 20,000 ma-chines randomly selected from Google’s data centers. Below weprovide a brief description of each of the systems and the data weobtained.
BG/L: Our first dataset is from the Lawrence Livermore Na-tional Laboratory’s IBM Blue Gene/L (BG/L) supercomputer. Thesystem consists of 64 racks, each containing 32 node cards. Eachnode card is made up of 16 compute cards, which are the small-est replaceable hardware component for the system; we refer to thecompute cards as ”nodes”. Each compute card itself contains twoPowerPC 440 cores, each with their own associated DRAM chips,which are soldered onto the card; there is no notion of a ”DIMM”(see [7] for more details).
We obtained BG/L logs containing data generated by the sys-tem’s RAS infrastructure, including count and location messagespertaining to correctable memory errors that occur during a job andare reported upon job completion.
The BG/L memory port contains a 128-bit data part that’s di-vided divided into 32 symbols, where the ECC is able to correctany error pattern within a single symbol, assuming no errors occurin any other symbols. However, the system can still function in theevent of two symbols with errors by remapping one of the symbolsto a spare symbol, and correcting the other with ECC [16].
Due to limitations in the types of messages that the BG/L logcontains, we are only able to report on multi-bit errors that weredetected (and corrected) within a single symbol. As such, we refer
to these as MBEs (multi-bit errors) for the BG/L system through-out the paper. However it’s worth noting that 350 compute cards(20% of all compute cards with errors in the system) reported ac-tivating symbol steering to the spare symbol. This is indicative ofmore severe errors that required more advanced ECC technologies(like bit-sparing) to correct. In addition, a cap was imposed on thetotal count of correctable errors accumulated during a job for partof the dataset, making our results for both multi-bit errors and totalcorrectable error counts very conservative compared to the actualstate of the system.
BG/P: The second system we studied is the Blue Gene/P(BG/P) from the Argonne National Laboratory. The system has40 racks containing a total of 40,960 compute cards (nodes). Eachnode in BG/P has four PowerPC 450 cores and 40 DRAM chipstotalling 2GB of addressable memory. As the successor to BG/L,BG/P has stronger ECC capabilities and can correct single anddouble-symbol errors. The system is also capable of chipkill errorcorrection, which tolerates failure of one whole DRAM chip [8].
We obtained RAS logs from BG/P reporting correctable errorsamples. Only the first error sample on an address during the ex-ecution of a job is reported, and total occurrences for each errortype summarized at the end. Due to the sampling and counter size,the amount of correctable errors are once again very conserva-tive. However, the correctable samples provide location informa-tion which allows us to study the patterns and physical distributionof errors.
Unlike BG/L, there is no bit position information for single-symbol errors. There is no way to determine the number of bitsthat failed within one symbol. Therefore, we report single-symbolerrors as single-bit errors and double-symbol errors as multi-biterrors, and refer to the latter as MBEs for the BG/P system. Adouble-symbol error is guaranteed to have at least two error bitsthat originate from the pair of error symbols. This is once again anunder-estimation of the total number of multi-bit errors.
SciNet: Our third data source comes from the General Pur-pose Cluster (GPC) at the SciNet High Performance ComputingConsortium. The GPC at SciNet is currently the largest supercom-puter in Canada. It consists of 3,863 IBM iDataPlex nodes, eachwith 8 Intel Xeon E5540 cores and 16GB of addressable memorythat uses basic SEC-DED ECC. The logs we collected consist ofhourly-dumps of the entire PCI configuration space, which exposethe onboard memory controller registers containing counts (withno physical location information) of memory error events in thesystem.
Google: Our fourth data source comes from Google’s datacen-ters and consists of a random sample of 20,000 machines that haveexperienced memory errors. Each machine comprises a mother-board with some processors and memory DIMMs. The machinesin our sample come from 5 different hardware platforms, where aplatform is defined by the motherboard and memory generation.The memory in these systems covers a wide variety of the most
112

100
102
104
106
108
0
0.2
0.4
0.6
0.8
1
Errors on a node in one month
Fra
ctio
n of
err
or n
ode−
mon
th
Blue Gene/LBlue Gene/PGoogleSciNet
10−3
10−2
10−1
100
0.2
0.3
0.4
0.5
0.6
0.7
0.80.9
1
Top fraction of nodes with CEs
Fra
ctio
n of
tota
l CE
s
Blue Gene/LBlue Gene/PGoogleSciNet
0 5 10 15 200.5
0.6
0.7
0.8
0.9
1
Number of prior errors on a node
Pro
babi
lity
of fu
ture
err
ors
BG/LBG/PGoogleScinet
Figure 1. The left graph shows the CDF for the number of errors per month per machine. The middle graph shows the fraction y of all errorsthat is concentrated in the top x fraction of nodes with the most errors. The right graph shows the probability of a node developing futureerrors as a function of the number of prior errors.
commonly used types of DRAM. The DIMMs come from multiplemanufacturers and models, with three different capacities (1GB,2GB, 4GB), and cover the three most common DRAM technolo-gies: Double Data Rate (DDR1), Double Data Rate 2 (DDR2) andFully-Buffered (FBDIMM). We rely on error reports provided bythe chipset. Those reports include accurate accounts of the totalnumber of errors that occurred, but due to the limited number ofregisters available for storing addresses affected by errors onlyprovides samples for the addresses of errors. For this reason, thenumber of repeat errors we observe and the probability of errorsrepeating are very conservative estimates, since there might be re-peat errors that we missed because they were not sampled.
2.2 Methodology
A memory error only manifests itself upon an access to the affectedlocation. As such, some systems employ a memory scrubber (abackground processes that periodically scans through all of mem-ory) to proactively detect errors before they are encountered by anapplication. However, except for some of the Google systems, allthe systems we study rely solely on application-level memory ac-cesses without the use of a scrubber.
Categorizing errors observed in the field as either hard or soft isdifficult as it requires knowing their root cause. Obtaining a definiteanswer to the question of whether an observed error is hard andwhat type of hard error it is (e.g. a stuck bit or a bad column)would require some offline testing of the device in a lab or at leastperforming some active probing on the system, e.g. by running amemory test after each error occurrence to determine whether theerror is repeatable. Instead we have to rely on observational data,which means we will have to make some assumptions in orderto classify errors. Matters are complicated further by the fact thatmany hard errors start out as intermittent errors and only developinto permanent errors over time.
The key assumption that we rely on in our study is that repeaterrors at the same location are likely due to hard errors since itwould be statistically extremely unlikely that the same locationwould be hit twice within our measurement period by cosmic raysor other external sources of noise. We therefore view such repeaterrors as likely being caused by hard errors. Note however that inpractice, hard errors manifest themselves as intermittent rather thanon every access to a particular memory location.
We consider different granularities for locations at which errorscan repeat. We start by looking at repeats across nodes, but thenmainly focus at locations identified by lower-levels in the hard-ware. Recall that a DIMM comprises multiple DRAM chips, andeach DRAM chip is organized into multiple banks, typically 8 in
today’s systems. A bank consists of a number of two-dimensionalarrays of DRAM cells. A DRAM cell is the most basic unit of stor-age, essentially a simple capacitor representing one bit. The twodimensions of an array are also referred to as rows and columns.We look at repeats of errors at the level of physical addresses, butalso with respect to bank, rows and columns at the chip level.
3. Study of error characteristics3.1 High-level characteristics
We begin with a summary of the high-level characteristics of mem-ory errors at the node level. The right half of Table 1 summa-rizes the prevalence of memory errors in the four different sys-tems. We observe that memory errors happen at a significant ratein all four systems with 2.5-5.5% of nodes affected per system.For each system, our data covers at least tens of millions of errorsover a combined period of nearly 300 Terabyte years. In addition tocorrectable errors (CEs), we also observe a non-negligible rate of“non-trivial” errors, which required more than simple SEC-DEDstrategies for correction: 1.34% of the nodes in the BG/P systemsaw at least one error that required chipkill to correct it.
Figure 1 (left) and Figure 1 (middle) provide a more detailedview of how errors affect the nodes in a system. Figure 1 (left)shows the cumulative distribution function (CDF) of the number oferrors per node for those nodes that experience at least one error.We see that only a minority (2-20%) of those nodes experiencejust a single error occurrence. The majority experiences a largernumber of errors, with half of the nodes seeing more than 100 errorsand the top 5% of nodes each seeing more than a million errors.Figure 1 (middle) illustrates how errors are distributed across thenodes within each system. The graph shows for each system thefraction of all errors in the system (X-axis) that is concentrated onjust the y% of nodes in the system with the largest number of errors(Y-axis). In all cases we see a very skewed distribution with the top5% of error nodes accounting for more than 95 % of all errors.
Figure 1 (left) and (middle) indicate that errors happen in acorrelated fashion, rather than independently. This observation isvalidated in Figure 1 (right), which shows the probability of anode experiencing future errors as a function of the number ofpast errors. We see that even a single error on a node raises theprobability of future errors to more than 80%, and after seeing justa handful of errors this probability increases to more than 95%.
The correlations we observe above provide strong evidencefor hardware errors as a dominant error mechanisms, since onewould not expect soft errors to be correlated in space or time.Our observations agree with similar findings reported in [11, 19].However, the results in [11] were based on a small number of
113
machines (12 machines with errors) and the analysis in [19] waslimited to a relatively homogeneous set of systems; all machinesin the study were located in Google’s datacenters. Our resultsshow that these trends generalize to other systems as well and addstatistical significance.
In addition to error counts, the BG systems also record infor-mation on the mechanisms that were used to correct errors, whichwe can use as additional clues regarding the nature of errors. Inparticular, both BG/P and BG/L provide separate log messages thatallow us to distinguish multi-bit errors, and BG/P also records in-formation on chipkill errors (i.e. errors that required chipkill tocorrect them). We observe that a significant fraction of BG/P andBG/L nodes experiences multi-bit errors (22.08% and 2.07%, re-spectively) and that these errors account for 12.96% and 2.37% ofall observed errors, respectively. The fraction of nodes with chipkillerrors on BG/P only is smaller, with 1.34% of nodes affected, butstill significant. Interestingly, while seen only on a small numberof nodes, chipkill errors make up a large fraction of all observederrors: 17% of all errors observed on BG/P were not correctablewith simple SEC-DED, and required the use of chipkill ECC to becorrected.
We summarize our main points in the following three observa-tions which motivate us to take a closer look at hard errors and theirpatterns in the remainder of this paper.
Observation 1: There are strong correlations between errorsin space and time. These correlations are highly unlikely if softerrors were the dominating error mode, pointing to hard errors asthe leading cause of memory errors.
Observation 2: The significant frequency of multi-bit and chip-kill errors is another pointer towards hard errors as an importanterror mode, as these types of errors are unlikely to arise from softerrors.
Observation 3: A significant number of nodes with correctableerrors activated more advanced ECC mechanisms; 20%-45% acti-vated redundant bit-steering, and 15% activated Chipkill.
3.2 Error patterns
In this section, we attempt to categorize all banks with errors inour datasets into known error patterns related to hardware defects:single (transient) events, bad cells, bad rows, bad columns, and awhole chip error. A definite answer to the question which categorya device with an error falls into would require offline testing of thedevice in a lab setting. Instead we have to rely on observationaldata, which means we will have to make a few assumptions whenclassifying devices. We group all banks that have at least one errorinto one of the following categories:
repeat address: The bank has at least one error that repeats, i.e.there is at least one address on this bank that is reported twice.repeat row: The bank has at least one row that has experiencederrors at two different locations, i.e. two different addresses on therow.repeat column: The bank has at least one column that has experi-enced errors at two different locations, i.e. two different addresseson the column.corrupt row: The bank has at least one row that has experiencederrors at two different addresses on the row and one of these is arepeat address.corrupt column: The bank has at least one column that has expe-rienced errors at two different addresses on the column and one ofthese is a repeat address.
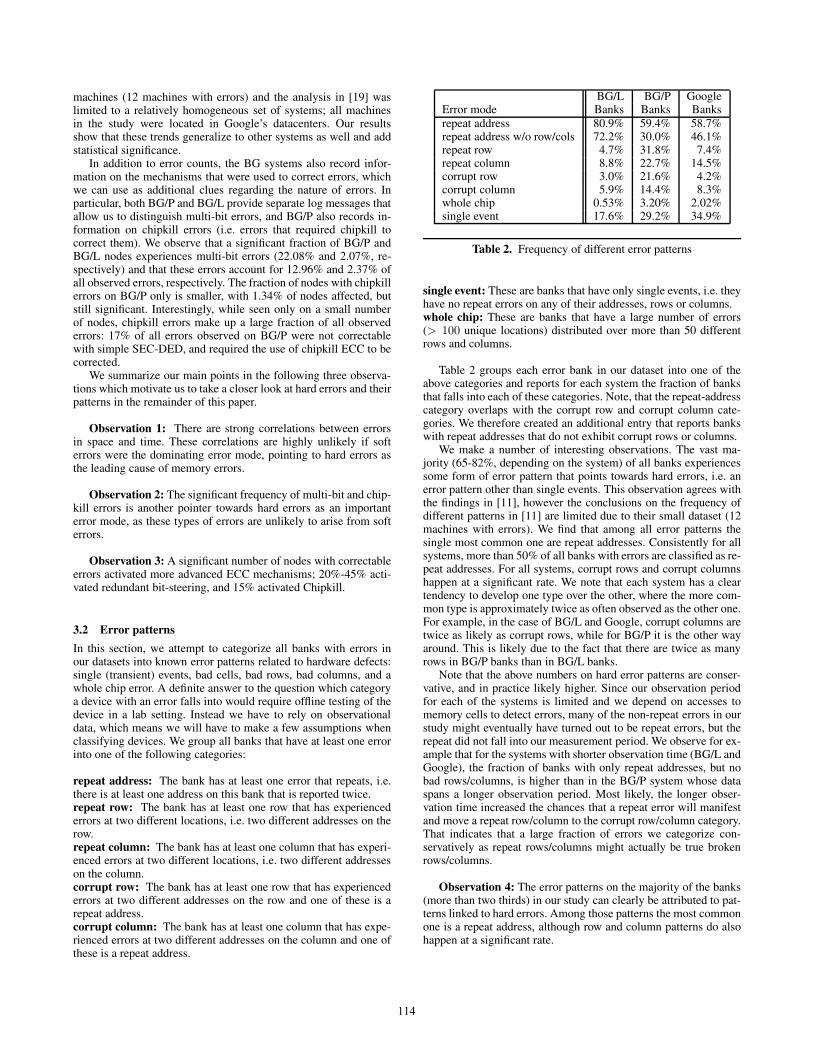
BG/L BG/P GoogleError mode Banks Banks Banksrepeat address 80.9% 59.4% 58.7%repeat address w/o row/cols 72.2% 30.0% 46.1%repeat row 4.7% 31.8% 7.4%repeat column 8.8% 22.7% 14.5%corrupt row 3.0% 21.6% 4.2%corrupt column 5.9% 14.4% 8.3%whole chip 0.53% 3.20% 2.02%single event 17.6% 29.2% 34.9%
Table 2. Frequency of different error patterns
single event: These are banks that have only single events, i.e. theyhave no repeat errors on any of their addresses, rows or columns.whole chip: These are banks that have a large number of errors(> 100 unique locations) distributed over more than 50 differentrows and columns.
Table 2 groups each error bank in our dataset into one of theabove categories and reports for each system the fraction of banksthat falls into each of these categories. Note, that the repeat-addresscategory overlaps with the corrupt row and corrupt column cate-gories. We therefore created an additional entry that reports bankswith repeat addresses that do not exhibit corrupt rows or columns.
We make a number of interesting observations. The vast ma-jority (65-82%, depending on the system) of all banks experiencessome form of error pattern that points towards hard errors, i.e. anerror pattern other than single events. This observation agrees withthe findings in [11], however the conclusions on the frequency ofdifferent patterns in [11] are limited due to their small dataset (12machines with errors). We find that among all error patterns thesingle most common one are repeat addresses. Consistently for allsystems, more than 50% of all banks with errors are classified as re-peat addresses. For all systems, corrupt rows and corrupt columnshappen at a significant rate. We note that each system has a cleartendency to develop one type over the other, where the more com-mon type is approximately twice as often observed as the other one.For example, in the case of BG/L and Google, corrupt columns aretwice as likely as corrupt rows, while for BG/P it is the other wayaround. This is likely due to the fact that there are twice as manyrows in BG/P banks than in BG/L banks.
Note that the above numbers on hard error patterns are conser-vative, and in practice likely higher. Since our observation periodfor each of the systems is limited and we depend on accesses tomemory cells to detect errors, many of the non-repeat errors in ourstudy might eventually have turned out to be repeat errors, but therepeat did not fall into our measurement period. We observe for ex-ample that for the systems with shorter observation time (BG/L andGoogle), the fraction of banks with only repeat addresses, but nobad rows/columns, is higher than in the BG/P system whose dataspans a longer observation period. Most likely, the longer obser-vation time increased the chances that a repeat error will manifestand move a repeat row/column to the corrupt row/column category.That indicates that a large fraction of errors we categorize con-servatively as repeat rows/columns might actually be true brokenrows/columns.
Observation 4: The error patterns on the majority of the banks(more than two thirds) in our study can clearly be attributed to pat-terns linked to hard errors. Among those patterns the most commonone is a repeat address, although row and column patterns do alsohappen at a significant rate.
114

100
101
102
103
0
0.2
0.4
0.6
0.8
1
Number of errors per address
Fra
ctio
n of
err
or a
ddre
sses
Blue Gene / LBlue Gene / PGoogle
10−4
10−3
10−2
10−1
100
0.1
0.2
0.30.40.5
1
Top fraction of addresses with CEs
Fra
ctio
n of
tota
l CE
s
Blue Gene/LBlue Gene/PGoogle
100
102
104
106
108
0
0.2
0.4
0.6
0.8
1
Time between successive errors (s)
Fra
ctio
n of
suc
cess
ive
erro
r pa
irs
Blue Gene/PGoogle
Figure 2. The left graph shows the CDF for the number of repeat errors per address (for those addresses with at least on repeat). The middlegraph shows the fraction y of all errors that is concentrated in the top x fraction of addresses with the most errors. The right graph shows theCDF of the time between successive errors on an address.
3.3 Repeat errors on addresses
The previous section identified repeat addresses as the dominanterror pattern, but did not provide any details on their characteristics.The only prior work that hints at repeat addresses as a commonerror pattern in the field is based on a data set (a dozen machineswith errors) that is too small for a detailed study of repeat errorcharacteristics [11]. We therefore study this question in more detailin this subsection.
BG/L BG/P Google# of error samples 201,206 308,170 1,091,777# of unique addresses 9,076 44,624 556,161% unique 4.5 14.5 50.9% of addresses with repeats 48.2 30.6 32.6Avg. # of errors / address 44.9 20.3 4.0
Table 3. Statistics on repeat addresses
We begin by providing some statistics on the frequency ofrepeat errors on addresses in Table 3 above. We observe that a highfraction of addresses with errors experience later repeat errors onthe same address: a third (for Google) to nearly a half (for BG/L).The average number of repeat errors per address ranges from 4for Google to as many as 44 for BG/L. For a more detailed view,Figure 2 (left) shows the cumulative distribution function (CDF)for the number of repeats per address. Most addresses with repeats(50-60%) see only a single repeat and another 20% see only tworepeats. However, the distribution is very skewed with a long tail,where a small fraction of addresses at the end of the tail experiencesa huge number of repeats. Figure 2 (middle) illustrates the skew inthe distribution by plotting the fraction of errors that is made up bythe top x% of addresses with the highest error count. It shows that10% of all addresses with errors account for more than 90% of allobserved errors.
When trying to protect against repeat errors it is useful to under-stand the temporal characteristics of errors. For example, a systemusing page retirement for pages with hard errors might want to waitbefore retiring a page that experiences an error until a repeat erroroccurs, providing some confidence that the problem is indeed dueto a hard error. An interesting question is therefore how long it willtake before a repeat error happens and an error can confidently beclassified as hard. To help answer this question, Figure 2 (right)plots the CDF of the time between repeat errors on the same ad-dress. The graph shows that, if there is a repeat error it typicallyhappens shortly after the first error occurrence. In BG/P more thanhalf of repeats happen within less than a couple of minutes afterthe first occurrence. The timing information in the Google data is
at a much coarser granularity (recall Section 2) and due to sam-pling we might not see all repeats, which leads to generally longertimes until a repeat error shows up. However, we can conclude thatmore than half of the repeats happen within less than 6 hours. In-terestingly, for larger timescales, e.g. on the order of days, wherethe timing granularity of the Google data should have less of aneffect the trends for both systems start to look very similar. In bothsystems, 90% of all repeat errors are detected within less than 2weeks.
When interpreting data regarding repeat of errors, it is importantto recall that repeat errors (or any errors) are not detected untileither the application or a hardware scrubber accesses the affectedcell. For the Blue Gene systems, we know that hardware scrubbersare implemented as a feature, but we were not able to determinewhether this feature was actually enabled in our systems understudy. On the other hand, for the Google machines we know that asubset of them does employ a hardware scrubber that periodicallyin the background reads through main memory to check for errors.This scrubber reads memory at a rate of 1GB per hour, which meansthat each memory cell should be touched at least once every day.
To determine how much earlier repeat errors could be detectedif a memory scrubber is used we compared the time until a repeaterror is detected for those systems with and without the hardwarescrubber separately. Interestingly, we find that the use of a scrub-ber does not significantly reduce the time until a repeat error isdetected. Even in the tail of the distribution, where it takes a rel-atively long time (e.g. several days or more) to identify a repeaterror, there is not much difference between systems with and with-out a scrubber. One possible explanation is that repeat errors mightnot always be due to stuck bits, where a cell is permanently stuckat a particular value. Instead, they might be due to weaknesses inthe hardware that get exposed only under certain access patterns.
The three points below summarize our main observations.
Observation 5: A large fraction of addresses with errors (30-50%) experience a later repeat error on the same address. Thispoints to hard errors as a dominant error mode.
Observation 6: If an address experiences multiple errors (indi-cating a hard error), then 90% of all repeat errors show up withinless than 2 weeks after the first error.
Observation 7: The use of a background scrubber does notsignificantly shorten the amount of time until a repeat error isdetected. This indicates that a significant fraction of errors areintermittent and only manifest themselves under certain accesspatterns.
115
100
101
102
103
0
0.2
0.4
0.6
0.8
1
Unique errors per repeat column
Fra
ction o
f err
or
colu
mns
Blue Gene / LBlue Gene / PGoogle
100
101
102
103
0
0.2
0.4
0.6
0.8
1
Unique errors per repeat rowF
raction o
f err
or
row
s
Blue Gene/LBlue Gene/PGoogle
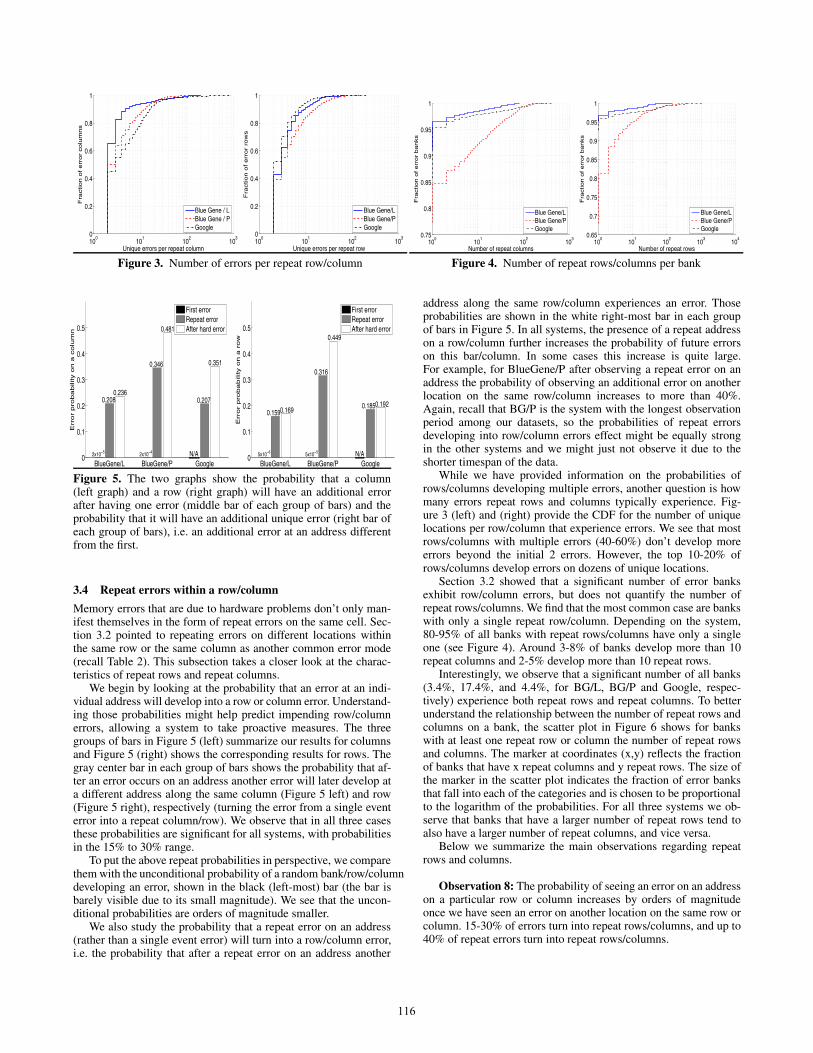
Figure 3. Number of errors per repeat row/column
100
101
102
103
0.75
0.8
0.85
0.9
0.95
1
Number of repeat columns
Fra
ction o
f err
or
banks
Blue Gene/LBlue Gene/PGoogle
100
101
102
103
104
0.65
0.7
0.75
0.8
0.85
0.9
0.95
1
Number of repeat rows
Fra
ction o
f err
or
banks
Blue Gene/LBlue Gene/PGoogle
Figure 4. Number of repeat rows/columns per bank
BlueGene/L BlueGene/P Google0
0.1
0.2
0.3
0.4
0.5
Err
or
pro
bability o
n a
colu
mn
2x10⁻⁵
0.2080.236
2x10⁻⁴
0.346
0.481
N/A
0.207
0.351
First errorRepeat errorAfter hard error
BlueGene/L BlueGene/P Google0
0.1
0.2
0.3
0.4
0.5
Err
or
pro
bability o
n a
row
5x10⁻⁶
0.1590.169
5x10⁻⁵
0.316
0.449
N/A
0.1850.192
First errorRepeat errorAfter hard error
Figure 5. The two graphs show the probability that a column(left graph) and a row (right graph) will have an additional errorafter having one error (middle bar of each group of bars) and theprobability that it will have an additional unique error (right bar ofeach group of bars), i.e. an additional error at an address differentfrom the first.
3.4 Repeat errors within a row/column
Memory errors that are due to hardware problems don’t only man-ifest themselves in the form of repeat errors on the same cell. Sec-tion 3.2 pointed to repeating errors on different locations withinthe same row or the same column as another common error mode(recall Table 2). This subsection takes a closer look at the charac-teristics of repeat rows and repeat columns.
We begin by looking at the probability that an error at an indi-vidual address will develop into a row or column error. Understand-ing those probabilities might help predict impending row/columnerrors, allowing a system to take proactive measures. The threegroups of bars in Figure 5 (left) summarize our results for columnsand Figure 5 (right) shows the corresponding results for rows. Thegray center bar in each group of bars shows the probability that af-ter an error occurs on an address another error will later develop ata different address along the same column (Figure 5 left) and row(Figure 5 right), respectively (turning the error from a single eventerror into a repeat column/row). We observe that in all three casesthese probabilities are significant for all systems, with probabilitiesin the 15% to 30% range.
To put the above repeat probabilities in perspective, we comparethem with the unconditional probability of a random bank/row/columndeveloping an error, shown in the black (left-most) bar (the bar isbarely visible due to its small magnitude). We see that the uncon-ditional probabilities are orders of magnitude smaller.
We also study the probability that a repeat error on an address(rather than a single event error) will turn into a row/column error,i.e. the probability that after a repeat error on an address another
address along the same row/column experiences an error. Thoseprobabilities are shown in the white right-most bar in each groupof bars in Figure 5. In all systems, the presence of a repeat addresson a row/column further increases the probability of future errorson this bar/column. In some cases this increase is quite large.For example, for BlueGene/P after observing a repeat error on anaddress the probability of observing an additional error on anotherlocation on the same row/column increases to more than 40%.Again, recall that BG/P is the system with the longest observationperiod among our datasets, so the probabilities of repeat errorsdeveloping into row/column errors effect might be equally strongin the other systems and we might just not observe it due to theshorter timespan of the data.
While we have provided information on the probabilities ofrows/columns developing multiple errors, another question is howmany errors repeat rows and columns typically experience. Fig-ure 3 (left) and (right) provide the CDF for the number of uniquelocations per row/column that experience errors. We see that mostrows/columns with multiple errors (40-60%) don’t develop moreerrors beyond the initial 2 errors. However, the top 10-20% ofrows/columns develop errors on dozens of unique locations.
Section 3.2 showed that a significant number of error banksexhibit row/column errors, but does not quantify the number ofrepeat rows/columns. We find that the most common case are bankswith only a single repeat row/column. Depending on the system,80-95% of all banks with repeat rows/columns have only a singleone (see Figure 4). Around 3-8% of banks develop more than 10repeat columns and 2-5% develop more than 10 repeat rows.
Interestingly, we observe that a significant number of all banks(3.4%, 17.4%, and 4.4%, for BG/L, BG/P and Google, respec-tively) experience both repeat rows and repeat columns. To betterunderstand the relationship between the number of repeat rows andcolumns on a bank, the scatter plot in Figure 6 shows for bankswith at least one repeat row or column the number of repeat rowsand columns. The marker at coordinates (x,y) reflects the fractionof banks that have x repeat columns and y repeat rows. The size ofthe marker in the scatter plot indicates the fraction of error banksthat fall into each of the categories and is chosen to be proportionalto the logarithm of the probabilities. For all three systems we ob-serve that banks that have a larger number of repeat rows tend toalso have a larger number of repeat columns, and vice versa.
Below we summarize the main observations regarding repeatrows and columns.
Observation 8: The probability of seeing an error on an addresson a particular row or column increases by orders of magnitudeonce we have seen an error on another location on the same row orcolumn. 15-30% of errors turn into repeat rows/columns, and up to40% of repeat errors turn into repeat rows/columns.
116

100
101
102
103
104
100
101
102
Blue Gene/L
Number of repeat rows
Num
ber
of r
epea
t col
umns
100
101
102
103
104
100
101
102
Blue Gene/P
Number of repeat rows
Num
ber
of r
epea
t col
umns
100
101
102
103
104
100
101
102
Number of repeat rows
Num
ber
of r
epea
t col
umns
Figure 6. The distribution of the number of repeat rows and repeat columns per bank
Column distance
Row
dis
tanc
e
Blue Gene/L
Log. of Probability
−200 −100 0 100 200
−400
−200
0
200
400 −5.5
−5
−4.5
−4
−3.5
−3
−2.5
−2
Figure 7. A visualization of correlations between errors as a func-tion of their distances in row/column space
Observation 9: Among error banks that have both repeat rowsand repeat columns, those banks that have a large number of repeatrows often also have a large number of repeat columns, and viceversa.
3.5 Correlations across rows/columns
While the previous subsection demonstrated that an error on a rowor column increases the probability of follow-up errors on the samerow/column, it does not tell us anything about correlations betweennearby rows/columns, e.g. do multiple errors on a row make itmore likely that also some nearby rows will have errors. In thissubsection we answer the more general question of how the errorprobabilities between cells are correlated depending on the physicaldistance in row and column space between those cells.
The heatmap in Figure 7 is an attempt to visualize those corre-lations. The pixel at the center of the plot at coordinates (0,0) repre-sents a cell with an error. The pixel at coordinates (x,y) representsthe probability that the cell that is x columns and y rows away fromthe original error cell (i.e. at row/column coordinates (a+x, b+y)where (a,b) are the row/column coordinates of the original error)has an error as well. Lighter colors represent higher probabilities.
Not surprisingly, we observe that cells along the same row orcolumn as the original error cell have increased error probabili-ties, as indicated by the bright vertical and horizontal line crossingthrough (0,0). This agrees with our previous observations that er-rors have a high probability of turning into repeat rows/columns.
But we also observe that the error probabilities are increased withina wide band of neighboring rows and columns. For example, acloser study of the error probabilities as a function of row/columndistance shows that rows and columns that are within a distance of10 of the original error have an error probability of 2-5%. Whilethis probability is clearly smaller than that of developing errors onthe same row/column, it is significantly larger than that of an av-erage row/column. We also find that the error probabilities showa roughly exponential drop-off as a function of the row/columndistance, and that the probabilities are still significantly increasedwithin a range of up to 50-100 rows/columns, compared to an av-erage row/column.
Our study of error probabilities as a function of distance fromanother error also shows evidence for other patterns, beyond justproximity. In particular, we observe for some systems that cellswhose column or row distance from the original error is a multi-ple of certain powers of two have increased likelihood of errors.Evidence for these regular patterns show up in the heatmap in theform of a grid-like background pattern. By studying the CDF of thepairwise distances between errors, we find for example that for allsystems (BG/P, BG/L, Google), cells with distances in row spacethat are multiples of 4 have noticeably increased error probabili-ties. Some systems also exhibit other patterns. For example, BG/Palso shows clearly increased probabilities at row distances that aremultiples of 128.
Observation 10: Errors do not only tend to cluster along thesame row or column. The probability of errors is also significantlyincreased along all cells in the band of nearby rows and columns.
3.6 Error density in different areas of a chip
In this subsection we look at the correlation between errors andtheir physical location on a chip, i.e. we are asking the question ofwhether some areas of a chip are more likely than others to expe-rience errors. As before, we use bank, row and column informa-tion to distinguish different locations on a chip. We first divide therow/column space of each bank into equal sized square areas of128x128 rows/columns, i.e. chunks of size 16KB. We then deter-mine for each of these square areas the probability of observing anerror in this area, i.e. the fraction of all unique banks in the system(across all nodes) that have at least one error in this area. Figure 8shows a graphical representation of the results. For this analysis, wereport results separately for BG/P and BG/L and for the four dif-ferent hardware platforms that the Google data covers. Each graphrepresents the row/column space for one of the systems, each di-vided into the 128x128 sized squares as described above. Eachsquare is colored according to the observed probability of errorsin this area, where darker colors correspond to higher probabilities.
117

Column
Row
Blue Gene/P
512 1024 1536 2048
2048
4096
6144
8192
Column
Row
Blue Gene/L
256 512 768 1024
2048
4096
6144
8192
Column
Row
Google Pf0
1024 2048 3072 4096
1024
2048
3072
4096
Column
Row
Google Pf1
256 512 768 1024
4096
8192
12288
16384
Column
Row
Google Pf2
256 512 768 1024
4096
8192
12288
16384
Column
Row
Google Pf4
256 512 768 1024
8192
16384
24576
32768
Figure 8. The error probabilities for different areas in the row/column space of a bank.
100
101
102
103
104
0
0.2
0.4
0.6
0.8
1
Errors per page
Fra
ction o
f err
ors
Unique errors − BG/LUnique errors − BG/PErrors − BG/LErrors − BG/P
10−3
10−2
10−1
100
0.1
0.2
0.3
0.4
0.5
0.60.70.80.9
1
Top fraction of pages with errors
Fra
ction o
f to
tal err
ors
BG/LBG/P
Figure 9. Error distribution over pages.
Figure 8 shows several interesting trends that are consistentacross systems. Focusing on the dark areas in each graph, whichpresent concentrations of errors, we first see that for all systemsconsistently the top left area shows increased error density. Thisarea tends to span at least the first 512 columns and the first 512rows. For several of the systems, a whole band along the very topof the row space, across all columns, shows increased error rates.For two of the six systems we observe similar concentrations oferrors at the end of the row/column space, i.e. in the bottom rightof the graphs at the highest numbered rows and columns. Secondly,we find that for three of the systems the entire rows in the center ofthe row space exhibit increased error probabilities.
Observation 11: Not all areas on a chip are equally likely tobe affected by errors. In particular, the top and the bottom of therow/column space on a bank seem to be more likely to experienceerrors. Additionally, the upper-left corner corresponds to memoryused by the OS, which may play a role in the increased error prob-abilities.
3.7 Hard errors from the OS’s point of view
Throughout this section we have observed different ways in whichDRAM errors tend to cluster in space. We have seen that errors tendto repeat on the same address, along the addresses of a row/columnand on certain areas of a chip. All these measures for spatial clus-tering were very hardware oriented. In order to explore protectionmechanisms at the OS level, an important question is how the clus-tering of errors translates to the operating system level. For exam-ple, retiring pages with errors would work most efficiently and ef-fectively if most of the errors tended to cluster on a small numberof pages. Unfortunately, error clusters at the hardware level do notdirectly translate to clusters on pages. For example, errors along thesame row or column do not necessarily lie on the same page.
To shed some light on how errors are distributed across pages,Figure 9 (left) shows the CDF for the number of errors per pageand the number of unique locations with errors per page for thosesystems for which the information is available (BG/L and BG/P).The number of unique locations with errors per page is low (onaverage 1.4 and 1.8 for BG/L and BG/P, respectively) and around90% of all pages have only a single one. However the total numberof errors observed per page is still quite large, most likely due to re-peat addresses. More than 60% of the pages experience more thanone error, and the average number of errors per page is 31 and 12,for BG/L and BG/P respectively. More importantly, the distribu-tion of errors across pages is very skewed, maybe not surprisinglygiven the frequency of repeat addresses that we observed earlier.Figure 9 (right) shows the fraction of all errors that is contributedby the fraction of the top x% of pages with the most errors. 1% ofall pages with errors account for 30-60% of all errors, dependingon the system, and the top 10% of all pages with errors account formore than 90% of all errors for both BG/L and BG/P. This skewin the number of errors page is good news for techniques relyingon page retirement, as it means that by retiring a small fraction ofpages a large number of errors can be prevented.
Observation 12: More than 60% of pages that experience anerror, experience at least on follow-up error. The distribution ofthe number of errors per page is highly skewed, with some pagesaccounting for a large fraction of errors.
Observation 13: An operating system that could identify andretire those pages that are likely to develop a large number of er-rors, would avoid a large fraction of errors (90%) by retiring only asmall fraction (10%) of pages with errors.
This observation motivates us to study the possible effectivenessof different page retirement policies in Section 4.
3.8 Hard errors and multi-bit / chipkill errors
From a systems point of view the most worrisome type of errorsare multi-bit and chipkill errors, as these are the errors that inthe absence of sufficiently powerful hardware ECC turn into un-correctable errors leading to a machine crash (or if undetected tothe use of corrupted data). Given the correlations we observed be-tween errors in the previous subsections, an interesting question iswhether it is possible to predict an increased likelihood of futuremulti-bit or chipkill errors based on the previous error behavior inthe system. In particular, one might speculate that prior repeat er-rors, which likely indicate hard errors, will increase the probabilityof later multi-bit or chipkill errors. Knowledge about the increasedlikelihood of future multi-bit or chipkill errors could be used byan adaptive system to take proactive measures to protect againsterrors.
118

BlueGene/L BlueGene/P0
0.2
0.4
0.6
0.8
1P
rob
ab
ility o
f M
BE
err
ors
on
a n
od
e
Any nodeNode w/ prior errorNode w/ prior repeatNode w/ repeat rowNode w/ repeat column
Blue Gene/L Blue Gene/P0
0.2
0.4
0.6
0.8
1
Fra
ction o
f M
BE
s w
/ prior
err
ors
Prior errorPrior repeat errorPrior repeat rowPrior repeat column
Figure 10. The relationship between multi-bit errors and prior errors.Blue Gene/P
0
0.05
0.1
0.15
0.2
0.25
Pro
bability o
f C
hip
kill err
ors
on a
node
Any nodeNode w/ prior errorNode w/ prior repeatNode w/ repeat rowNode w/ repeat column
BlueGene/P0
0.1
0.2
0.3
0.4
0.5
Fra
ction o
f C
hip
kill err
or
nodes w
/ prior
err
ors
Prior errorPrior repeat errorPrior repeat rowPrior repeat column
Figure 11. The relationship between chipkill errors and prior errors.
To shed some light on this question, we plot in Figure 10 (left)the probability that a node develops a multi-bit error after seeingprevious errors of different types for BG/L and BG/P. More pre-cisely, each set of 5 bars in the graph shows the following 5 proba-bilities: The first bar in each group of five bars represents the base-line probability of a random node seeing a multi-bit error. (Note,that this probability is so small that it is barely visible in the graph.)The second bar represents the probability that a node that has seen aprior error (of any type) will later experience a multi-bit error, Theother three bars show the probability that a node will experiencea later multi-bit error after experiencing a repeat address, a repeatrow or a repeat column, respectively. The figure clearly indicatesthat for both systems the probability of a multi-bit error increases,after seeing previous errors. It also shows that the probability in-creases dramatically if a previous error was a repeat error.
Figure 10 (left) tells us only that the probability of multi-biterrors increases after other errors have been observed. It does nottell us whether most multi-bit errors were in fact preceded byprior errors (which a system could use as an early warning signof impending multi-bit errors). In order to look at this side of thestory, Figure 10 (right) plots the fraction of multi-bit errors thatwere preceded be the four types of errors we considered previously(any error, repeat address, repeat row, repeat column). The graphshows that multi-bit errors don’t happen without prior warning: 60-80% of multi-bit errors were preceded by repeat addresses, 70-85%of multi-bit errors were preceded by a repeat row and 40-50% ofmulti-bit errors were preceded by a repeat column.
Figure 11 repeats the same analysis for chipkill errors, ratherthan multi-bit errors (for BG/P only, as chipkill errors do not applyto BG/L). While the overall probabilities are smaller (due to thelower rate of chipkill errors), we observe the same trends. Prior er-rors greatly increase the probability of a later chipkill error. Amongnodes with prior error the probability increases to 7%. If there is arepeat row or repeat column present in the system, the likelihoodof a later chipkill error increases to around 20%.
Observation 14: The incidence of errors in the system, inparticular repeat errors, increases the likelihood of later multi-bit and chipkill errors by more than an order of magnitude. Alarge fraction (more than half) of multi-bit and chipkill errors arepreceded by early warning signs in the form of repeat errors.
4. Implications for system designAn underlying theme throughout the previous section has beenthe study of hard errors as the dominating error mode amongDRAM errors in the field. Compared to soft errors, hard errors havea greater potential to increase error rates, due to their repetitivenature, and to increase the chance of future uncorrectable errors.
On the positive side, the repeating nature of hard errors makesthem also more predictable than soft errors creating a potentialfor taking proactive measures against them. In this section, wediscuss various implications on resilient system that follow fromthe insights derived from our measurement study.
4.1 Page retirement
While error protection at the hardware level in the form of ECC iseffective, it is not always the most desirable option. In addition tothe cost factor, another concern, in particular for the more powerfulECC codes, is the increase in energy consumption and the possibleimpact on performance.
As an alternative or extra level of protection in addition to theuse of ECC DIMMs, one could consider the retirement of pagesthat have experienced previous (hard) errors. Page retirement canbe accomplished by having the OS isolate pages containing errorsand prevent them from being allocated in the future. While thistechnique is not widely used in today’s data centers, some operatingsystems, such as Solaris [3, 20], offer build-in support for pageretirement. For the standard Linux kernel there exists a patch thatallows one to retire bad pages [17]. However, there is no rigorousstudy on the possible effectiveness of page retirement for realisticerror patterns and there is no published work comparing differentpolicies for deciding on when to retire a page.
The main trade-off in retiring pages is the amount of mem-ory lost due to retired pages versus the number of future errorsprevented. An ideal retirement policy detects as early as possiblepages that are likely to develop a large number of errors in thefuture and retires only those pages. We have observed several indi-cators that lend themselves well for such predictions. Below are afew simple policies that were directly derived from the findings inSection 3.
repeat-on-address: Once an address experiences a repeat errorthe corresponding page is retired.
1-error-on-page: Since a large fraction of addresses with errorsexperiences a repeat, this policy pessimistically assumes after thefirst occurrence of an error on a page that it will turn into a harderror and retire the page.
2-errors-on-page: This policy retires a page once two errorshave been observed on this page (either on the same address or ontwo different addresses on the page).
repeat-on-row: Since a row with 2 unique addresses has highchances of developing additional errors, this policy retires all thepages on a row after two errors have been observed.
repeat-on-column: Equivalent to repeat-on-row, but for columns.
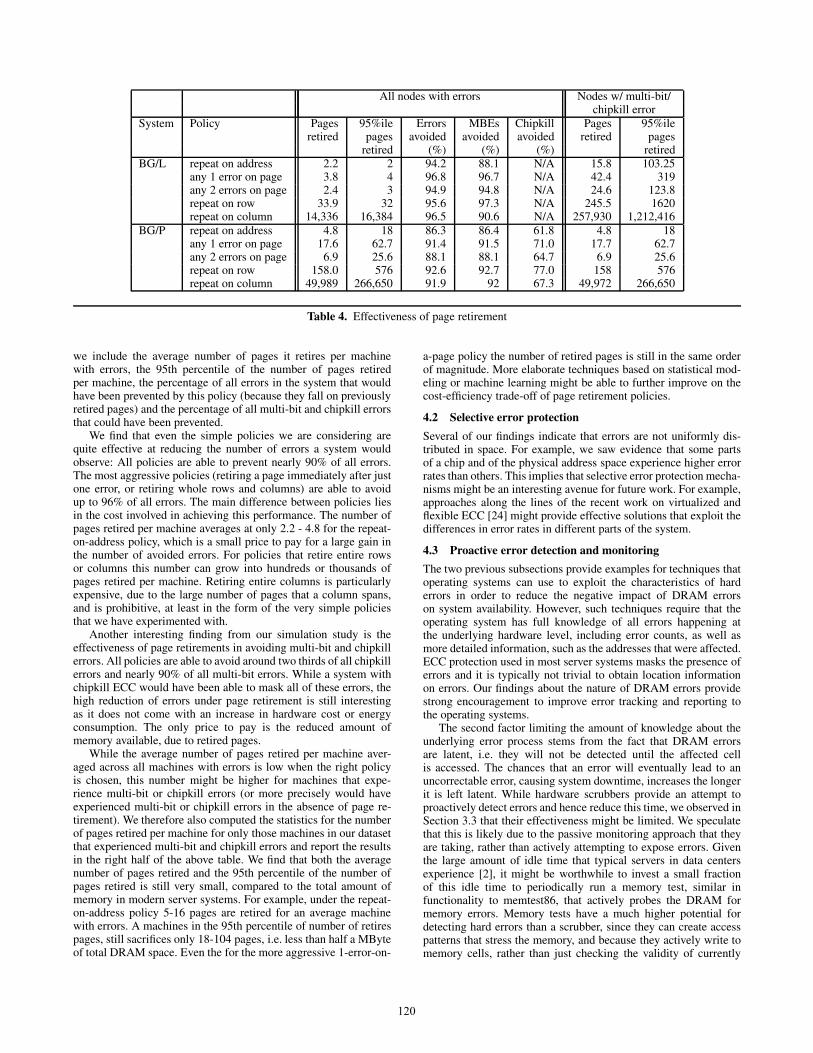
We simulate all of the above policies on our trace data forBG/L and BG/P and report the results in Table 4. For each policy
119
All nodes with errors Nodes w/ multi-bit/chipkill error
System Policy Pages 95%ile Errors MBEs Chipkill Pages 95%ileretired pages avoided avoided avoided retired pages
retired (%) (%) (%) retiredBG/L repeat on address 2.2 2 94.2 88.1 N/A 15.8 103.25
any 1 error on page 3.8 4 96.8 96.7 N/A 42.4 319any 2 errors on page 2.4 3 94.9 94.8 N/A 24.6 123.8repeat on row 33.9 32 95.6 97.3 N/A 245.5 1620repeat on column 14,336 16,384 96.5 90.6 N/A 257,930 1,212,416
BG/P repeat on address 4.8 18 86.3 86.4 61.8 4.8 18any 1 error on page 17.6 62.7 91.4 91.5 71.0 17.7 62.7any 2 errors on page 6.9 25.6 88.1 88.1 64.7 6.9 25.6repeat on row 158.0 576 92.6 92.7 77.0 158 576repeat on column 49,989 266,650 91.9 92 67.3 49,972 266,650
Table 4. Effectiveness of page retirement
we include the average number of pages it retires per machinewith errors, the 95th percentile of the number of pages retiredper machine, the percentage of all errors in the system that wouldhave been prevented by this policy (because they fall on previouslyretired pages) and the percentage of all multi-bit and chipkill errorsthat could have been prevented.
We find that even the simple policies we are considering arequite effective at reducing the number of errors a system wouldobserve: All policies are able to prevent nearly 90% of all errors.The most aggressive policies (retiring a page immediately after justone error, or retiring whole rows and columns) are able to avoidup to 96% of all errors. The main difference between policies liesin the cost involved in achieving this performance. The number ofpages retired per machine averages at only 2.2 - 4.8 for the repeat-on-address policy, which is a small price to pay for a large gain inthe number of avoided errors. For policies that retire entire rowsor columns this number can grow into hundreds or thousands ofpages retired per machine. Retiring entire columns is particularlyexpensive, due to the large number of pages that a column spans,and is prohibitive, at least in the form of the very simple policiesthat we have experimented with.
Another interesting finding from our simulation study is theeffectiveness of page retirements in avoiding multi-bit and chipkillerrors. All policies are able to avoid around two thirds of all chipkillerrors and nearly 90% of all multi-bit errors. While a system withchipkill ECC would have been able to mask all of these errors, thehigh reduction of errors under page retirement is still interestingas it does not come with an increase in hardware cost or energyconsumption. The only price to pay is the reduced amount ofmemory available, due to retired pages.
While the average number of pages retired per machine aver-aged across all machines with errors is low when the right policyis chosen, this number might be higher for machines that expe-rience multi-bit or chipkill errors (or more precisely would haveexperienced multi-bit or chipkill errors in the absence of page re-tirement). We therefore also computed the statistics for the numberof pages retired per machine for only those machines in our datasetthat experienced multi-bit and chipkill errors and report the resultsin the right half of the above table. We find that both the averagenumber of pages retired and the 95th percentile of the number ofpages retired is still very small, compared to the total amount ofmemory in modern server systems. For example, under the repeat-on-address policy 5-16 pages are retired for an average machinewith errors. A machines in the 95th percentile of number of retirespages, still sacrifices only 18-104 pages, i.e. less than half a MByteof total DRAM space. Even the for the more aggressive 1-error-on-
a-page policy the number of retired pages is still in the same orderof magnitude. More elaborate techniques based on statistical mod-eling or machine learning might be able to further improve on thecost-efficiency trade-off of page retirement policies.
4.2 Selective error protection
Several of our findings indicate that errors are not uniformly dis-tributed in space. For example, we saw evidence that some partsof a chip and of the physical address space experience higher errorrates than others. This implies that selective error protection mecha-nisms might be an interesting avenue for future work. For example,approaches along the lines of the recent work on virtualized andflexible ECC [24] might provide effective solutions that exploit thedifferences in error rates in different parts of the system.
4.3 Proactive error detection and monitoring
The two previous subsections provide examples for techniques thatoperating systems can use to exploit the characteristics of harderrors in order to reduce the negative impact of DRAM errorson system availability. However, such techniques require that theoperating system has full knowledge of all errors happening atthe underlying hardware level, including error counts, as well asmore detailed information, such as the addresses that were affected.ECC protection used in most server systems masks the presence oferrors and it is typically not trivial to obtain location informationon errors. Our findings about the nature of DRAM errors providestrong encouragement to improve error tracking and reporting tothe operating systems.
The second factor limiting the amount of knowledge about theunderlying error process stems from the fact that DRAM errorsare latent, i.e. they will not be detected until the affected cellis accessed. The chances that an error will eventually lead to anuncorrectable error, causing system downtime, increases the longerit is left latent. While hardware scrubbers provide an attempt toproactively detect errors and hence reduce this time, we observed inSection 3.3 that their effectiveness might be limited. We speculatethat this is likely due to the passive monitoring approach that theyare taking, rather than actively attempting to expose errors. Giventhe large amount of idle time that typical servers in data centersexperience [2], it might be worthwhile to invest a small fractionof this idle time to periodically run a memory test, similar infunctionality to memtest86, that actively probes the DRAM formemory errors. Memory tests have a much higher potential fordetecting hard errors than a scrubber, since they can create accesspatterns that stress the memory, and because they actively write tomemory cells, rather than just checking the validity of currently
120

written values. Such tests could either be done periodically on allmachines, or they could be used selectively in cases where there isa suspected hard error, e.g. after observing an earlier error in thesystem (that has not yet repeated).
4.4 Effectiveness of hardware mechanisms
While this was not the original focus of our study, our analysislets us also draw conclusions about the practical value of hardwaremechanisms, such as chipkill ECC, in reducing the rate of machinecrashes due to uncorrectable errors. In the presence of only softerrors, the occurrence of error patterns requiring chipkill ECCwould be extremely unlikely. Our observation that a large numberof errors observed in the field is likely due to hard errors providesfirmer grounding for using these techniques in practice, despitetheir added cost and energy overheads.
Only one earlier study [19] that is based on large-scale fielddata comments on the effectiveness of chipkill, however they onlyobserve that in their systems under study hardware platforms withchipkill show lower rates of uncorrectable errors than hardwareplatforms without chipkill. They are not able to quantify how muchof this difference in error rates is due to the use of chipkill versusother hardware differences between the platforms.
Our fine-grained data allowed us to quantify exactly the numberof errors that required chipkill to be corrected and that would haveled to a machine crash in the absence of chipkill. We find thata significant fraction of machines experienced chipkill errors, i.e.errors whose correction was only possible with the use of chipkilltechniques. In fact, among the errors in our study, a large fraction(17%) of them required the use of chipkill for correction providingsome tangible benefits of the use of chipkill. We can thereforeconclude that for systems with stringent availability requirementsthe reduction in machine crashes due to uncorrectable errors mightmake chipkill well worth the price.
4.5 System evaluation
Any evaluation of the impact of DRAM errors on system reliabilityor the effectiveness of mechanisms protecting against them relieson realistic assumptions about the characteristics of the underlyingerror process. In the absence of field data (or realistic models builtbased on field data), both analytical and experimental work typi-cally rely on very simplistic assumptions about errors. For example,analytical models often assume that errors follow a Markov processand experimental work often relies on injecting errors at uniformlyrandomly generated locations. Given the high occurrence rate ofhard errors, these simple approaches are likely to give misleadingresults (or results that represent only the less relevant scenario of asystem experiencing only soft errors), as they do not capture any ofthe correlations and patterns present in hard errors.
While we are hoping that the findings we report here will helpresearchers and practitioners to base their work on more realisticassumptions on DRAM errors, we believe that more work in thisdirection is necessary. Towards this end, we are currently workingon developing statistical models capturing the various properties ofDRAM error process that can be used to generate realistic patternsin simulation or for error injection. More importantly, it seems thatthe current lack of publicly available field data that researcherscan use to drive their experiments is a major roadblock. Li et al.have graciously made the data collected for their study on DRAMerrors [11] publicly available. While we were unfortunately notable to obtain permission to share the Google data used in thisstudy, we are currently preparing a public database of all errorpatterns that we have extracted from the data for the Blue Genesystems. This database and the raw logs for the Blue Gene systemswill be made publicly available as part of the Usenix Failure DataRepository [23].
5. ConclusionsWhile a large body of work has been dedicated to studying the char-acteristics of DRAM errors and how to best protect against them,the large majority of this work has focused on soft errors in DRAM.Our work presents the first study based on data from a large numberof production systems that shows that a large fraction of errors ob-served in the field can be traced back to hard errors. For all systemswe studied, more than a third of all memory banks that experiencederrors show signs of hard errors, most commonly in the form ofrepeating errors on the same physical address within less than 2weeks. Repeating errors on the same row/column are also commonerror modes. For some systems, as many as 95% of all observederrors can be attributed to hard errors. We also provide a detailedstudy of the statistical characteristics of hard errors. Some of theseprovide direct insights useful for protecting against errors. For ex-ample, we observe that not all areas in memory are equally likelyto be affected by errors; specific regions such as low rows/columnshave higher error probabilities. We speculate that this might be dueto different usage patterns in different memory areas, as we observefor example that those areas used by the OS tend to see larger errorcounts. Furthermore, from the perspective of the OS, a large frac-tion of the errors observed in a system is usually concentrated on asmall set of pages providing some motivation for proactively retir-ing pages after they experience errors. We also observed that errorsthat have the highest potential to be uncorrectable, such as multi-biterrors and errors that require chipkill for correction, are usually pre-ceded by more benign early warning signs, such as repeating errorson individual addresses, rows or columns. Finally, we observe thata significant number of errors is complex enough to require morethan simple SEC-DED error correction to be corrected. A signifi-cant number of nodes with correctable errors in our study activatedmore advanced ECC mechanisms (20%-45% activated redundantbit-steering, and 15% activated Chipkill) and a large fraction (17%)of all errors required the use of chipkill for error correction.
As a second contribution, we identify various implications onresilient system design that follow from the insights derived fromour measurement study. One of our findings is that simple page re-tirement policies can potentially mask a large number of errors withonly a small sacrifice in the amount of available DRAM. For exam-ple, a simple policy that retires a page after the first repeat error onan address on this page can mask up to 95% of all errors and upto 60% of errors that would require chipkill for correction, whilegiving up only a few dozen pages of main memory. This is an in-teresting finding, since based on discussions with administrators oflarge datacenters, the use of page retirement is not widely spread inpractice, although it has been implemented in some systems in thepast [3]. On the other hand, we find that a commonly used tech-nique for proactively detecting memory errors, the use of back-ground memory scrubbers, might not be as effective as one mightthink. We hypothesize that this is because a large fraction of errorsare intermittent, i.e. they manifest only under certain access pat-terns. This observation, together with the observed high frequencyof hard (and hence repeatable) errors, might make it worthwhileto use the idle time that most servers in datacenters experience toperiodically run a memory test to actively probe for errors, in par-ticular after observing prior errors on a node. Finally, the fact thatdifferent areas of memory experience different error rates and thatusage likely plays a role in error frequencies suggests an interestingavenue for future work might be selective error protection mecha-nisms, where different protection mechanisms are used for differentareas of memory.
121

AcknowledgmentsWe would like to thank Thomas Gooding, Mark Megerian, andRob Wisniewski from IBM for helping us acquire very detailedinformation about the BlueGene systems. We would also like tothank Pete Beckman, Rinku Gupta, Rob Ross and everybody elseat Argonne National Laboratory who was involved in collectingand making available the BG/P data and helped us interpret thedata. The third author thanks Google for hosting her as a visitingfaculty during the summer of 2009, where part of this work started.In particular, she would like to thank John Hawley, Xin Li, EduardoPinheiro, Nick Sanders, and Wolf-Dietrich Weber for their helpin accessing the data and answering questions about the data andsystems at Google. We thank Adam Oliner, Jon Stearley and SandiaNational Laboratories for making the BG/L data available. Finally,we would like to thank the members of SciNet, in partiular ChrisLoken and Ching-Hsing Yu, for providing us with the data fromtheir GPC system. This work has been funded by an NSERCdiscovery grant.
References[1] Soft errors in electronic memory – a white paper. Tezzaron Semi-
conductor. URL http://tezzaron.com/about/papes/soft_errors_1_1_secture.pdf.
[2] L. A. Barroso and U. Holzle. The case for energy-proportional com-puting. IEEE Computer, 40(12), 2007.
[3] T. M. Chalfant. Solaris operating system availability features. InSunBluePrints Online, 2004.
[4] T. J. Dell. A white paper on the benefits of chipkill-correct ECC forPC server main memory. IBM Microelectronics, 1997.
[5] T. J. Dell. System RAS implications of DRAM soft errors. IBM J.Res. Dev., 52(3), 2008.
[6] P. E. Dodd. Device simulation of charge collection and single-eventupset. IEEE Nuclear Science, 43:561–575, 1996.
[7] A. Gara. Overview of the Blue Gene/L system architecture. IBM J.Res. Dev., 49:195–212, March 2005.
[8] IBM journal of Research and Development staff. Overview of theIBM Blue Gene/P project. IBM J. Res. Dev., 52(1/2):199–220, January2008.
[9] H. Kobayashi, K. Shiraishi, H. Tsuchiya, H. Usuki, Y. Nagai, andK. Takahisa. Evaluation of lsi soft errors induced by terrestrial cosmicrays and alpha particles. Technical report, Sony corporation and RCNPOsaka University, 2001.
[10] X. Li, K. Shen, M. Huang, and L. Chu. A memory soft error mea-surement on production systems. In Proc. USENIX Annual TechnicalConference (ATC ’07), pages 21:1–21:6, 2007.
[11] X. Li, M. C. Huang, K. Shen, and L. Chu. A realistic evaluation ofmemory hardware errors and software system susceptibility. In Proc.USENIX Annual Technical Conference (ATC ’10), pages 75–88, 2010.
[12] T. C. May and M. H. Woods. Alpha-particle-induced soft errors indynamic memories. IEEE Transactions on Electron Devices, 26(1),1979.
[13] B. Murphy. Automating software failure reporting. ACM Queue, 2,2004.
[14] E. Normand. Single event upset at ground level. IEEE Transaction onNuclear Sciences, 6(43):2742–2750, 1996.
[15] T. J. O’Gorman, J. M. Ross, A. H. Taber, J. F. Ziegler, H. P. Muhlfeld,C. J. Montrose, H. W. Curtis, and J. L. Walsh. Field testing for cosmicray soft errors in semiconductor memories. IBM J. Res. Dev., 40(1),1996.
[16] M. Ohmacht. Blue Gene/L compute chip: memory and Ethernetsubsystem. IBM J. Res. Dev., 49:255–264, March 2005.
[17] R. V. Rein. BadRAM: Linux kernel support for broken RAM modules.URL http://rick.vanrein.org/linux/badram/.
[18] B. Schroeder and G. A. Gibson. A large scale study of failures in high-performance-computing systems. In Proc. Int’l Conf. DependableSystems and Networks (DSN 2006), pages 249–258, 2006.
[19] B. Schroeder, E. Pinheiro, and W.-D. Weber. DRAM errors in the wild:a large-scale field study. In Proc. 11th Int’l Joint Conf. Measurementand Modeling of Computer Systems (SIGMETRICS ’09), pages 193–204, 2009.
[20] D. Tang, P. Carruthers, Z. Totari, and M. W. Shapiro. Assessment ofthe effect of memory page retirement on system RAS against hardwarefaults. In Proc. Int’l Conf. Dependable Systems and Networks (DSN2006), pages 365–370, 2006.
[21] H. H. Tang. Semm-2: a new generation of single-event-effect model-ing tools. IBM J. Res. Dev., 52:233–244, May 2008.
[22] H. H. K. Tang, C. E. Murray, G. Fiorenza, K. P. Rodbell, M. S. Gordon,and D. F. Heidel. New simulation methodology for effects of radiationin semiconductor chip structures. IBM J. Res. Dev., 52:245–253, May2008.
[23] USENIX. The computer failure data repository (CFDR). URL http://cfdr.usenix.org/.
[24] D. H. Yoon and M. Erez. Virtualized and flexible ECC for main mem-ory. In Proc. 15th Int’l Conf. Architectural Support for ProgrammingLanguages and Operating Systems (ASPLOS ’10), pages 397–408,2010.
[25] J. Ziegler. IBM experiments in soft fails in computer electronics.Political Analysis, 40(1):3–18, 1996.
[26] J. F. Ziegler. Terrestrial cosmic rays. IBM J. Res. Dev., 40:19–39,January 1996.
[27] J. F. Ziegler and W. A. Lanford. Effect of Cosmic Rays on ComputerMemories. Science, 206:776–788, 1979.
[28] J. F. Ziegler, M. E. Nelson, J. D. Shell, R. J. Peterson, C. J. Gelderloos,H. P. Muhlfeld, and C. J. Montrose. Cosmic ray soft error rates of 16-Mb DRAM memory chips. IEEE J. Solid-state Circuits, 33:246–252,1998.
122