Embed Size (px)
Citation preview
Cosmic Cosmic Flows Flows
Mike Hudson
U. Waterloo / IAP
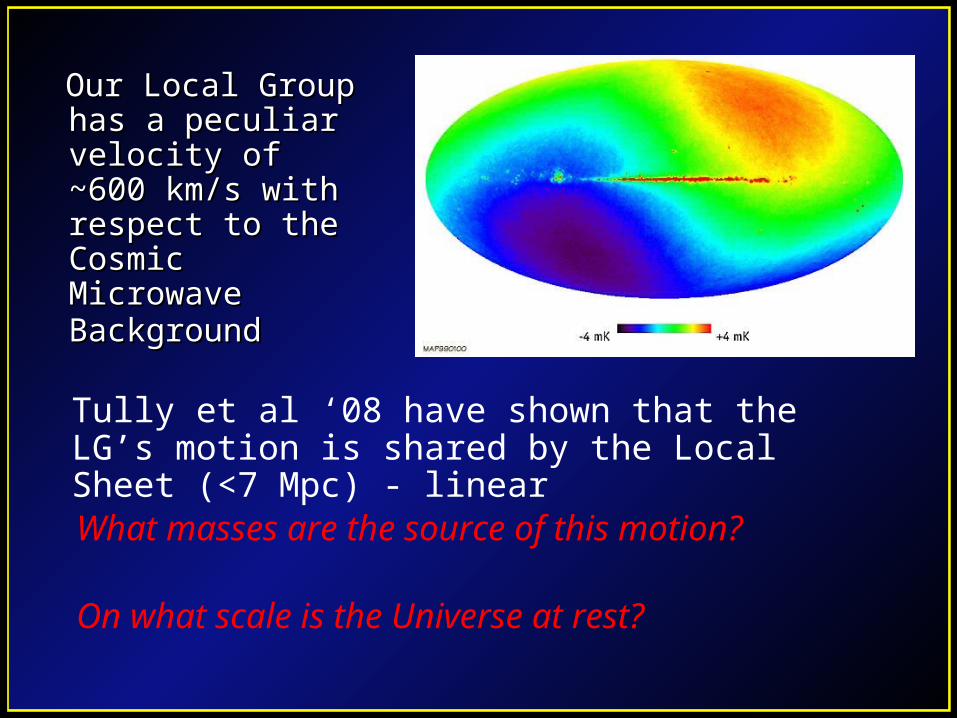
Our Local Group Our Local Group has a peculiar has a peculiar velocity of ~600 velocity of ~600 km/s with respect km/s with respect to the Cosmic to the Cosmic Microwave Microwave BackgroundBackground
What masses are the source of this motion?
On what scale is the Universe at rest?
Tully et al ‘08 have shown that the LG’s motion is shared by the Local Sheet (<7 Mpc) - linear
OutlineOutline
Two approaches:
Direct:
Peculiar velocity measurements
Parametric:
Density field predictions, and comparison to peculiar velocity measurements
Mapping the Peculiar Mapping the Peculiar Velocity FieldVelocity Field
Mapping the Peculiar Velocity FieldMapping the Peculiar Velocity Field
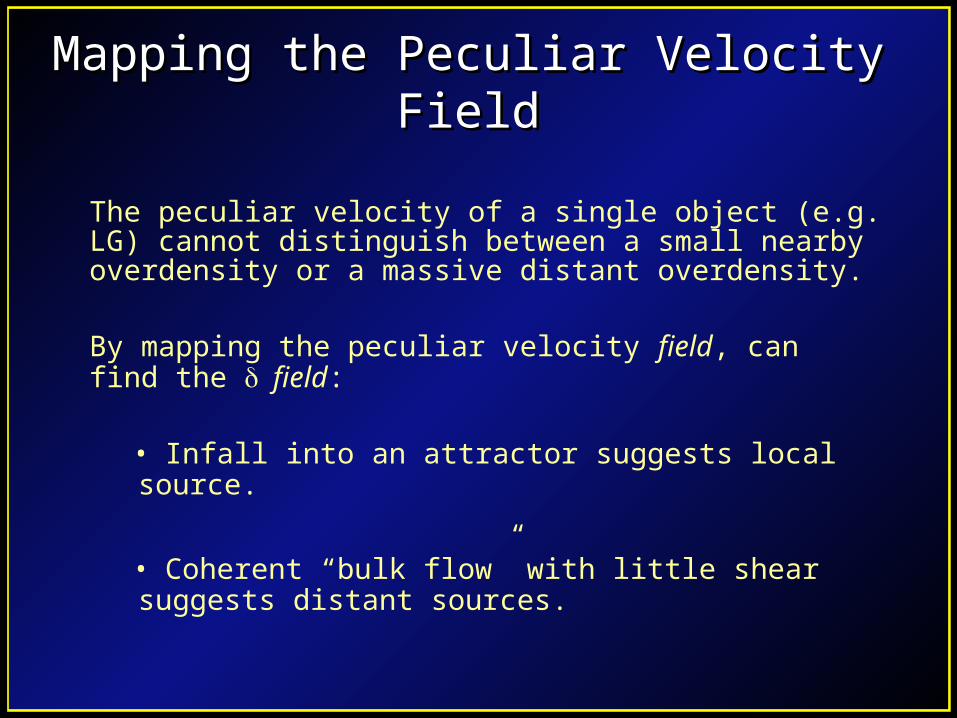
The peculiar velocity of a single object (e.g. LG) cannot distinguish between a small nearby overdensity or a massive distant overdensity.
By mapping the peculiar velocity field, can find the field:
• Infall into an attractor suggests local source.
• Coherent “bulk flow” with little shear suggests distant sources.

Measuring peculiar velocitiesMeasuring peculiar velocities
cz = H0 r + vpec
• Measuring redshifts (cz) is easy.
• Measuring r is much more difficult, and less accurate.• Tully-Fisher (~20% uncertainty per gal)• Fundamental Plane (~20% uncertainty)• Type Ia SNe (~10% uncertainty)
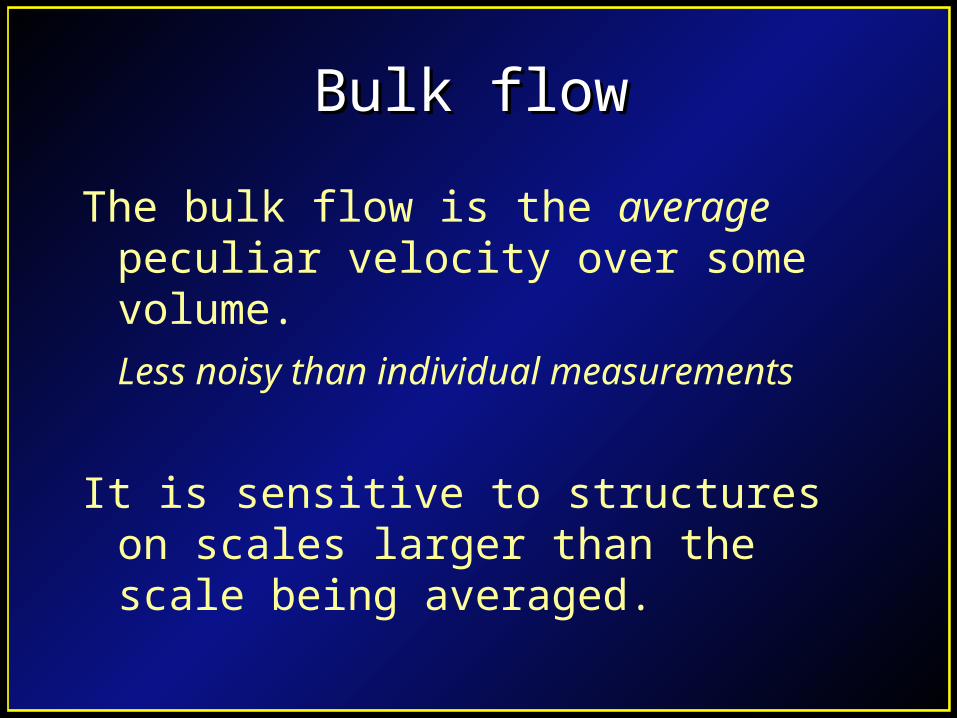
Bulk flowBulk flow
The bulk flow is the average peculiar velocity over some volume.
Less noisy than individual measurements
It is sensitive to structures on scales larger than the scale being averaged.
Some history…Some history…
• Rubin et al. (‘76) detected a large bulk motion of Sc galaxies.
• They assmed that Sc galaxies were standard candles. No dynamics (rotation curves or linewidths).
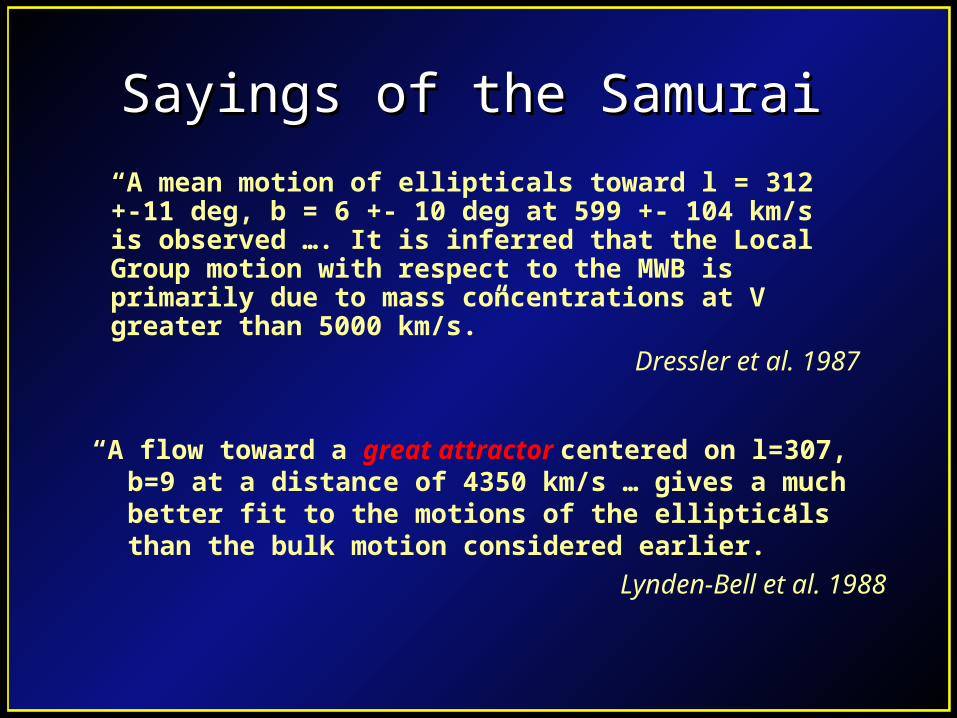
Sayings of the SamuraiSayings of the Samurai
“A flow toward a great attractor centered on l=307, b=9 at a distance of 4350 km/s … gives a much better fit to the motions of the ellipticals than the bulk motion considered earlier.”
Lynden-Bell et al. 1988
“A mean motion of ellipticals toward l = 312 +-11 deg, b = 6 +- 10 deg at 599 +- 104 km/s is observed …. It is inferred that the Local Group motion with respect to the MWB is primarily due to mass concentrations at V greater than 5000 km/s.”
Dressler et al. 1987
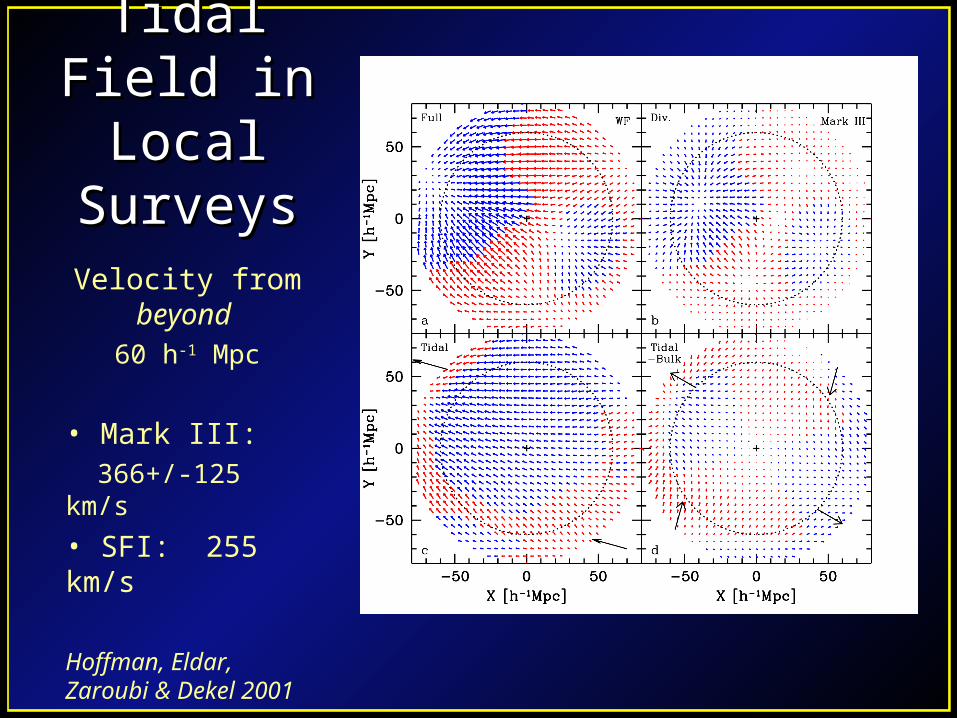
Tidal Field Tidal Field in Local in Local SurveysSurveysVelocity from
beyond 60 h-1 Mpc
• Mark III: 366+/-125 km/s
• SFI: 255 km/s
Hoffman, Eldar, Zaroubi & Dekel 2001
Bulk Flows on Larger ScalesBulk Flows on Larger Scales
Measure bulk motion on scales larger than the distance to the GA, (hope to) separate local (GA) from distant sources.
However, recent (1999+) large-scale surveys measured bulk flow statistics that are apparently in conflict.
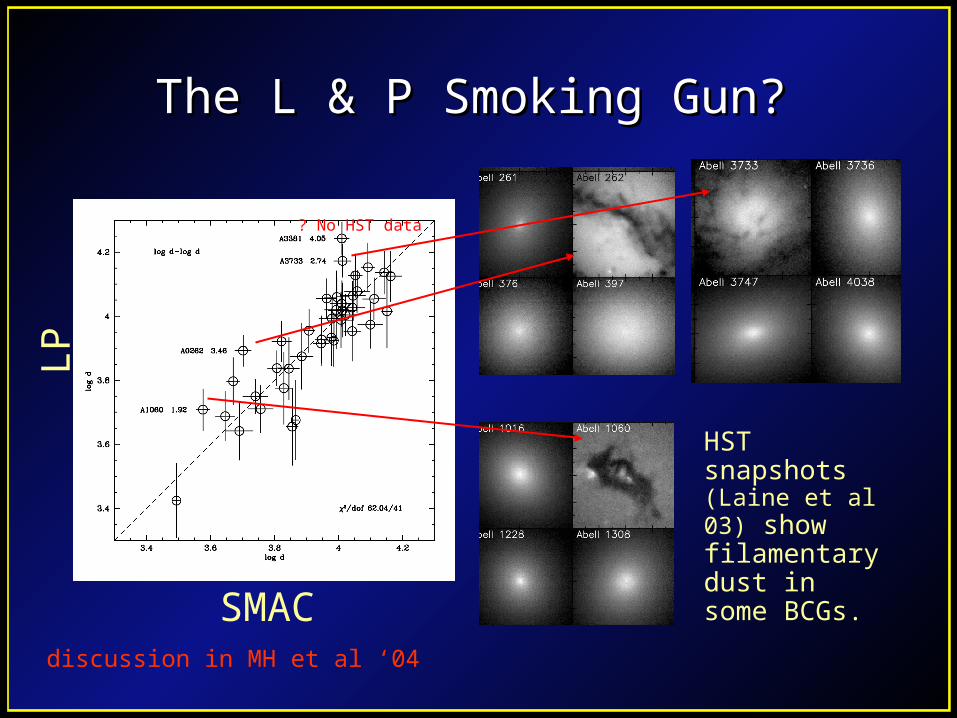
The L & P Smoking Gun?The L & P Smoking Gun?
HST snapshots (Laine et al 03) show filamentary dust in some BCGs.
? No HST data
SMAC
LP
discussion in MH et al ‘04
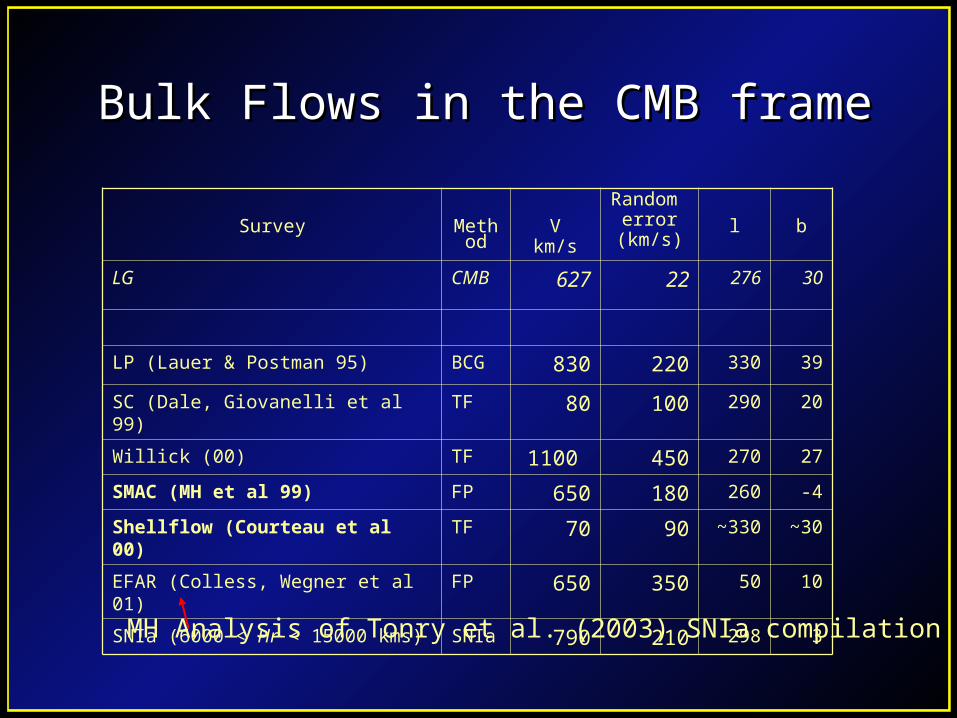
Bulk Flows in the CMB frameBulk Flows in the CMB frame
Survey Method
Vkm/s
Random error
(km/s)l b
LG CMB 627 22 276 30
LP (Lauer & Postman 95) BCG 830 220 330 39
SC (Dale, Giovanelli et al 99) TF 80 100 290 20
Willick (00) TF 1100 450 270 27
SMAC (MH et al 99) FP 650 180 260 -4
Shellflow (Courteau et al 00) TF 70 90 ~330 ~30
EFAR (Colless, Wegner et al 01) FP 650 350 50 10
SNIa (6000 < Hr < 15000 kms) SNIa 790 210 298 3
MH Analysis of Tonry et al. (2003) SNIa compilation
Errors?Errors?
At this stage, many people attributed the discrepancies to putative systematic errors.
BUT quoted errors are for bulk flows of the sample, not of the volume and the large-scale surveys are sparse.
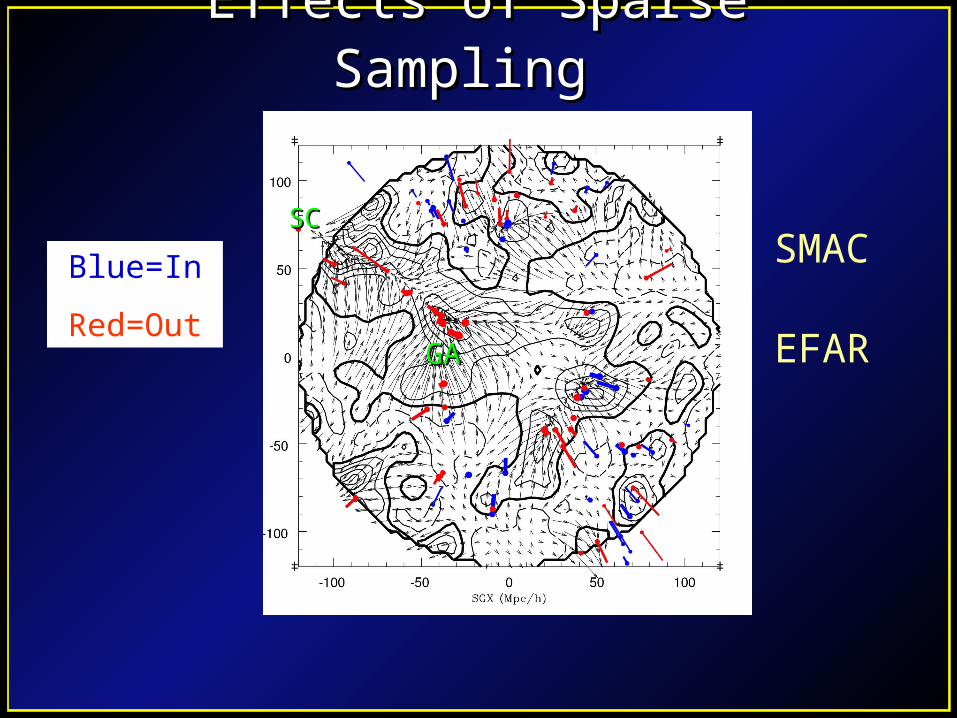
PP
SMAC
Effects of Sparse SamplingEffects of Sparse Sampling
EFAR
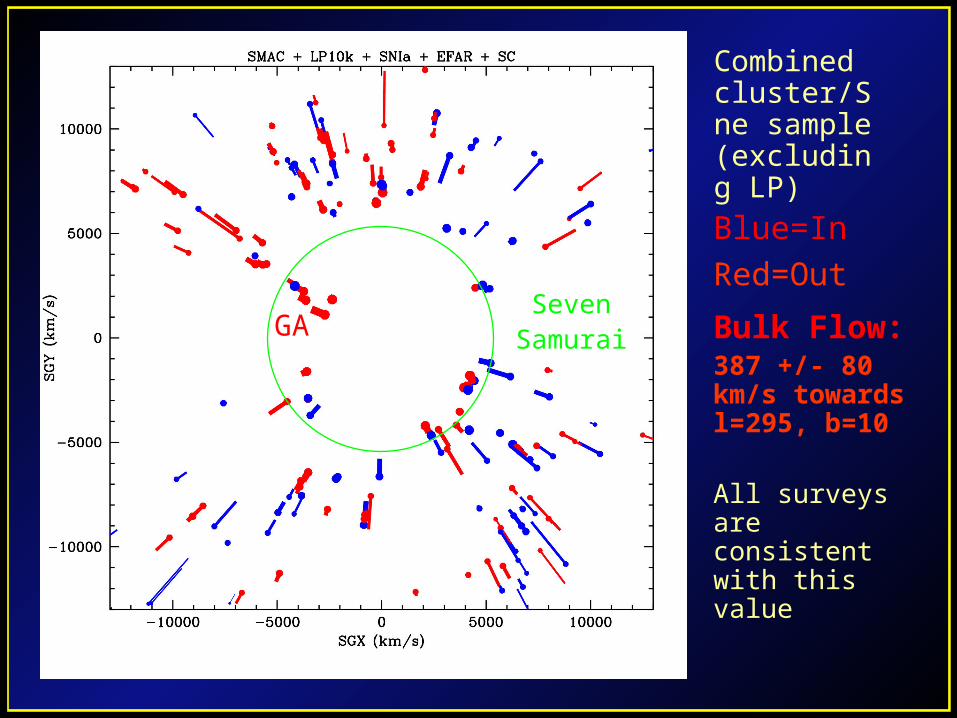
Blue=In
Red=OutGAGA
SCSC
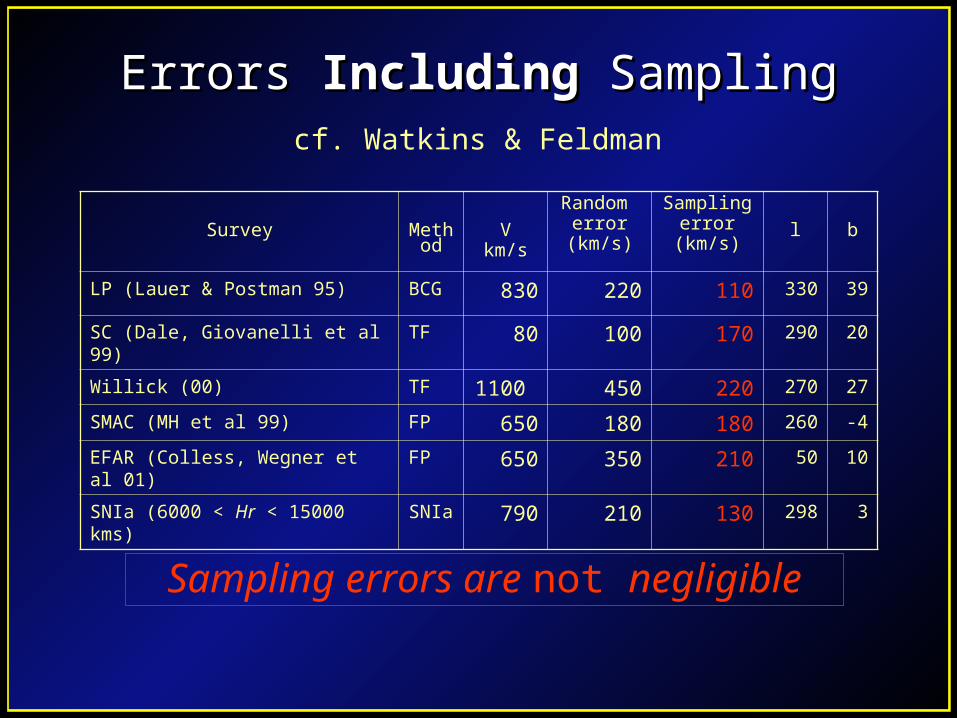
Errors Errors IncludingIncluding Sampling Sampling
Survey Method
Vkm/s
Random error
(km/s)
Sampling error
(km/s)l b
LP (Lauer & Postman 95) BCG 830 220 110 330 39
SC (Dale, Giovanelli et al 99) TF 80 100 170 290 20
Willick (00) TF 1100 450 220 270 27
SMAC (MH et al 99) FP 650 180 180 260 -4
EFAR (Colless, Wegner et al 01) FP 650 350 210 50 10
SNIa (6000 < Hr < 15000 kms) SNIa 790 210 130 298 3
Sampling errors are not negligible
cf. Watkins & Feldman
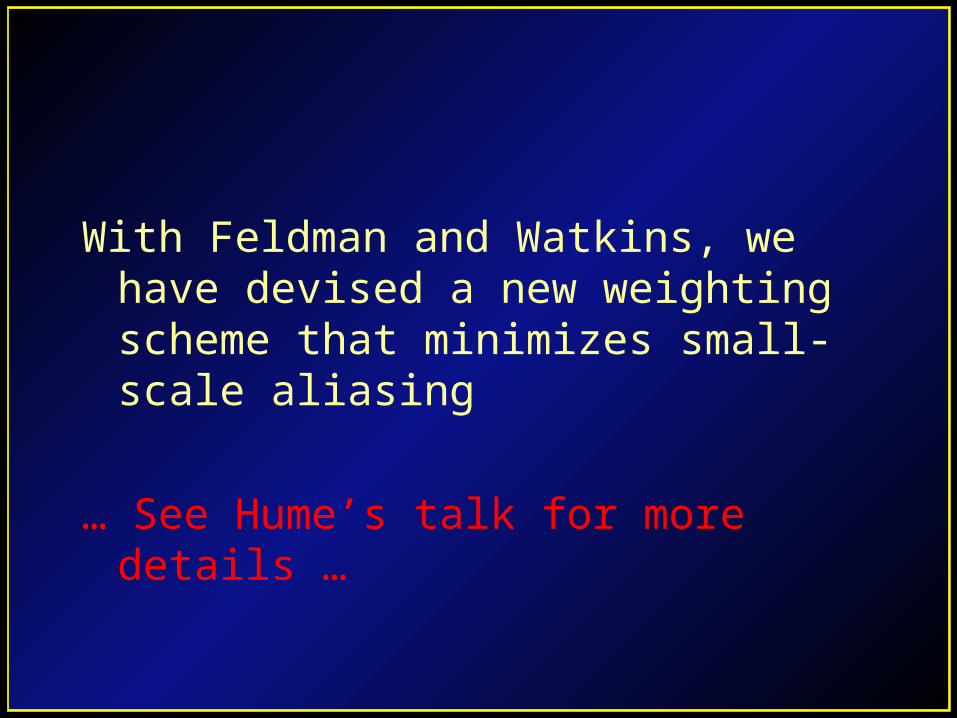
With Feldman and Watkins, we have devised a new weighting scheme that minimizes small-scale aliasing
… See Hume’s talk for more details …
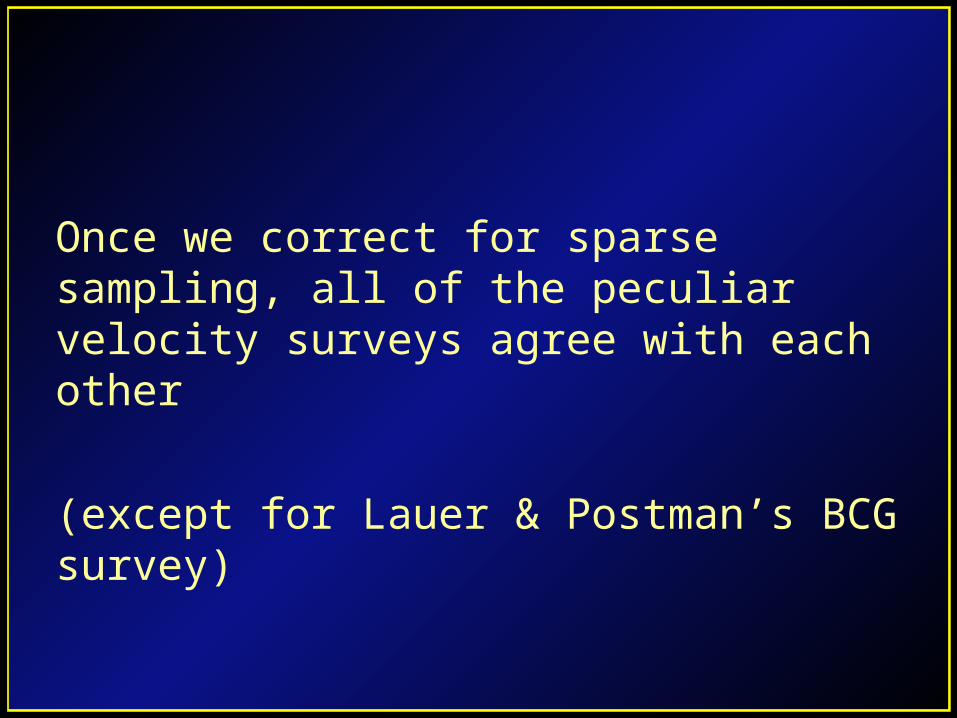
Once we correct for sparse sampling, all of the peculiar velocity surveys agree with each other
(except for Lauer & Postman’s BCG survey)
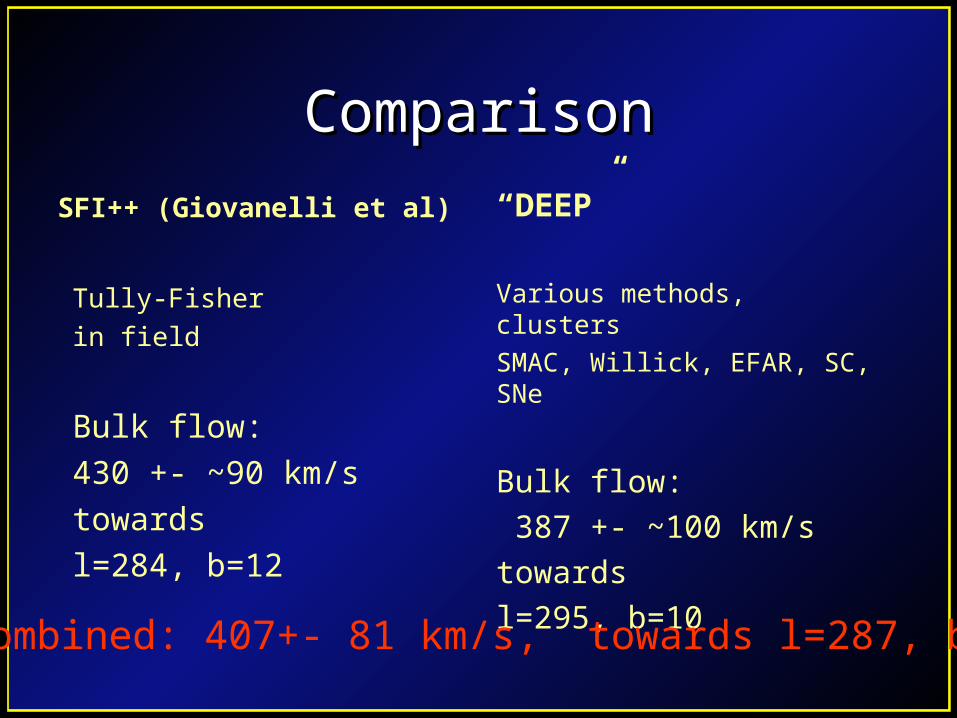
ComparisonComparison
SFI++ (Giovanelli et al)
Tully-Fisher
in field
Bulk flow:
430 +- ~90 km/s
towards
l=284, b=12
“DEEP”
Various methods, clusters
SMAC, Willick, EFAR, SC, SNe
Bulk flow:
387 +- ~100 km/s
towards
l=295, b=10
Combined: 407+- 81 km/s, towards l=287, b=8
Blue=In
Red=Out
Bulk Flow:387 +/- 80 km/s towards l=295, b=10
All surveys are consistent with this value
Combined cluster/Sne sample (excluding LP)
SevenSamuraiGA
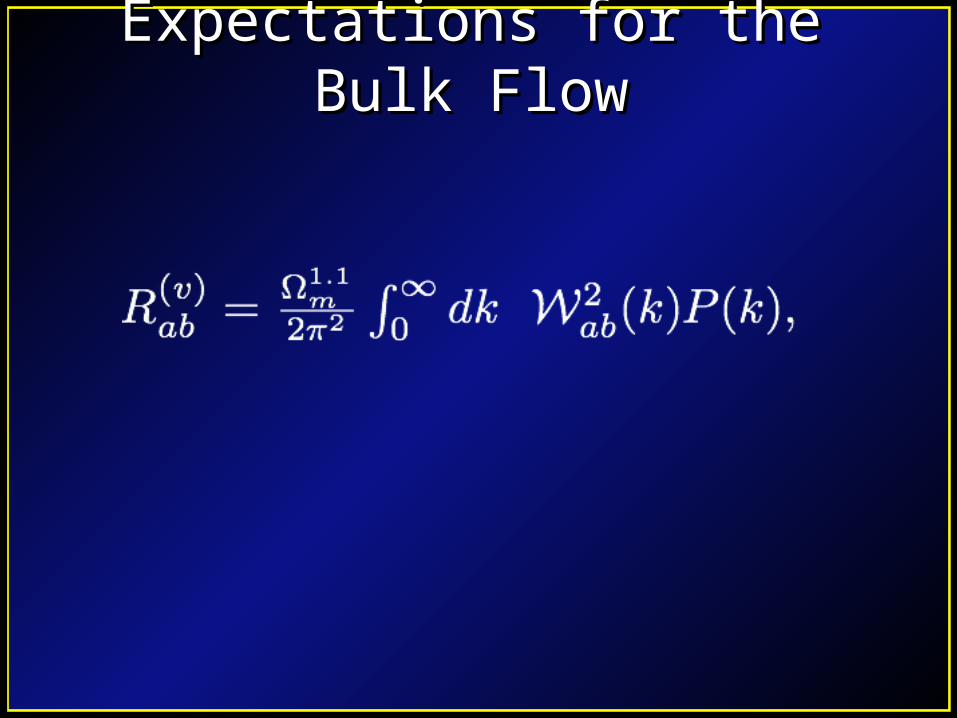
Expectations for the Bulk FlowExpectations for the Bulk Flow
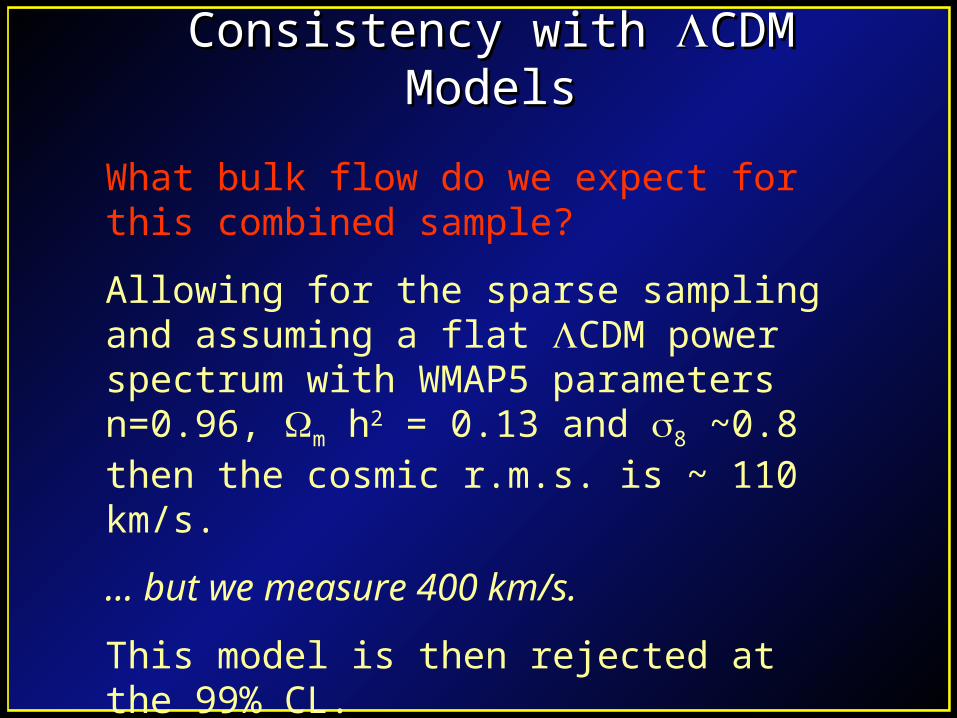
Consistency with Consistency with CDM ModelsCDM Models
What bulk flow do we expect for this combined sample?
Allowing for the sparse sampling and assuming a flat CDM power spectrum with WMAP5 parameters n=0.96, m h2 = 0.13 and 8 ~0.8 then the cosmic r.m.s. is ~ 110 km/s.
… but we measure 400 km/s.
This model is then rejected at the 99% CL.
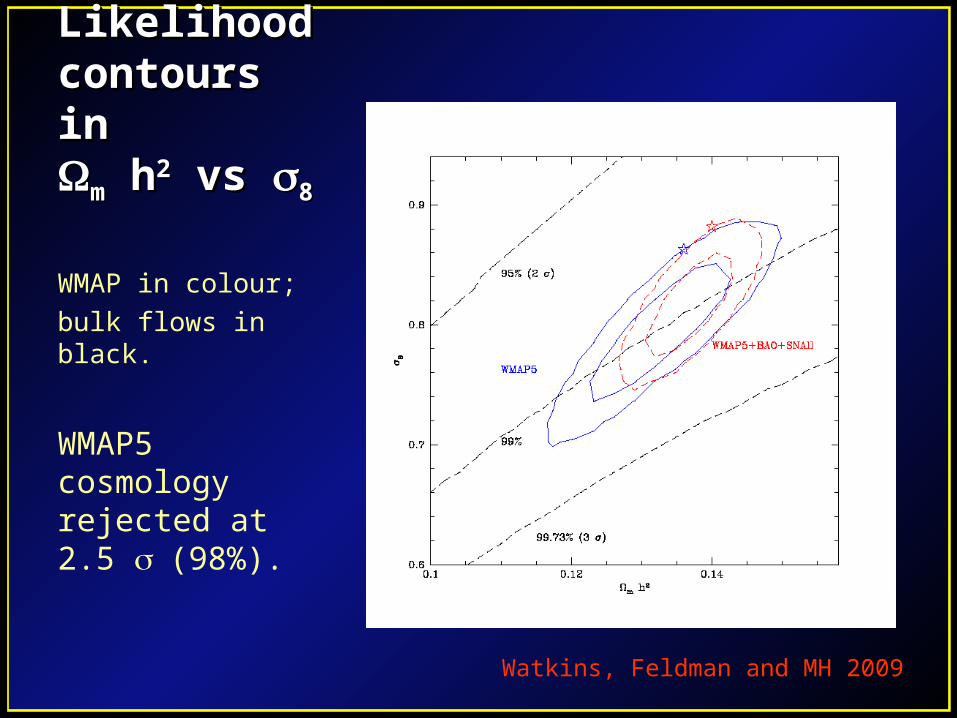
Likelihood Likelihood contours in contours in mm h h22 vs vs 88
WMAP in colour;
bulk flows in black.
WMAP5 cosmology rejected at 2.5 (98%).
Watkins, Feldman and MH 2009
Kinetic SZ effectKinetic SZ effect
The kinetic SZ (kSZ) effect: the CMB temperature decrement will depend on the velocity of the cluster w.r.t to the CMB frame.
The signal depends on the amount of hot plasma in the cluster and the cluster’s line-of-sight velocity.
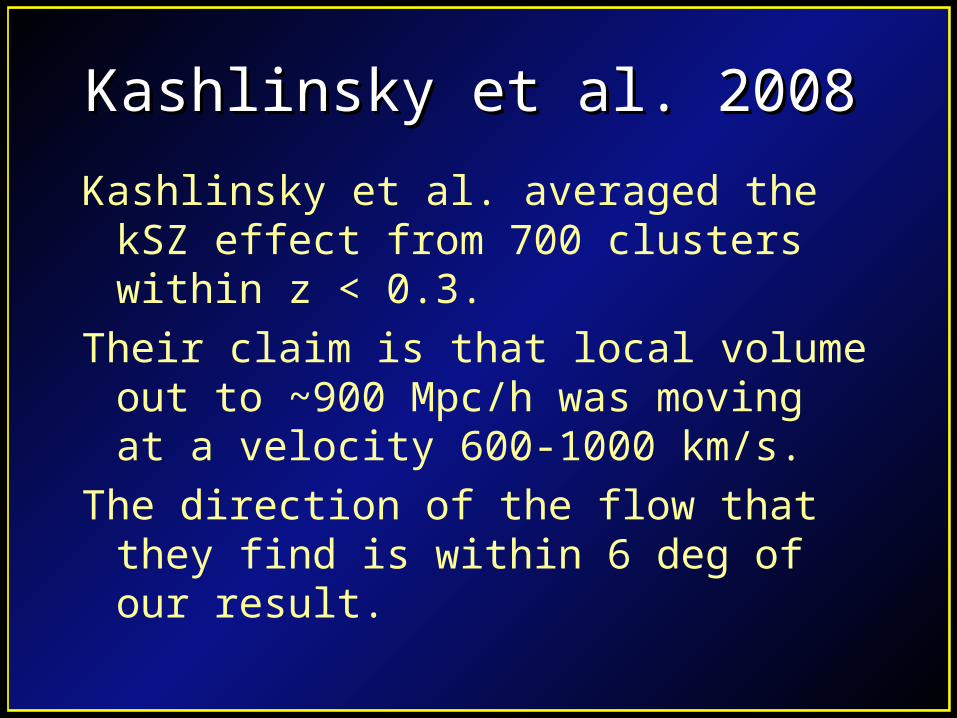
Kashlinsky et al. 2008Kashlinsky et al. 2008
Kashlinsky et al. averaged the kSZ effect from 700 clusters within z < 0.3.
Their claim is that local volume out to ~900 Mpc/h was moving at a velocity 600-1000 km/s.
The direction of the flow that they find is within 6 deg of our result.
Other probesOther probes
There are few independent ways to measure the fluctuations in the mass density on very large scales (~100 Mpc/h) in the nearby Universe.
• Integrated Sachs-Wolfe effect (decay of potential)
• SDSS galaxy power spectrum
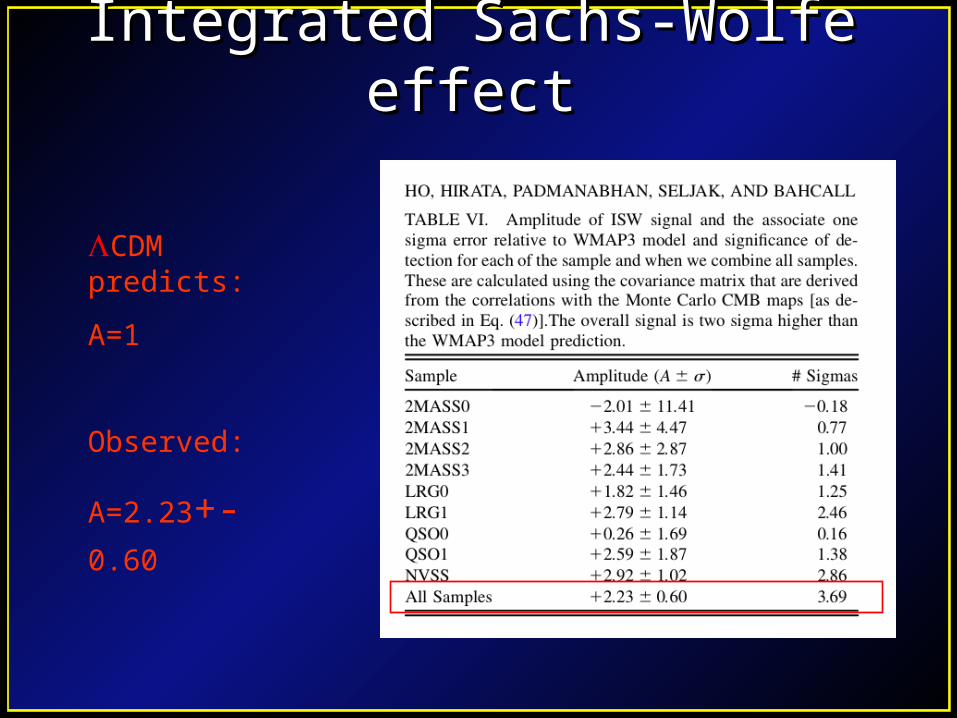
Integrated Sachs-Wolfe effectIntegrated Sachs-Wolfe effect
CDM predicts:
A=1
Observed:
A=2.23+-0.60
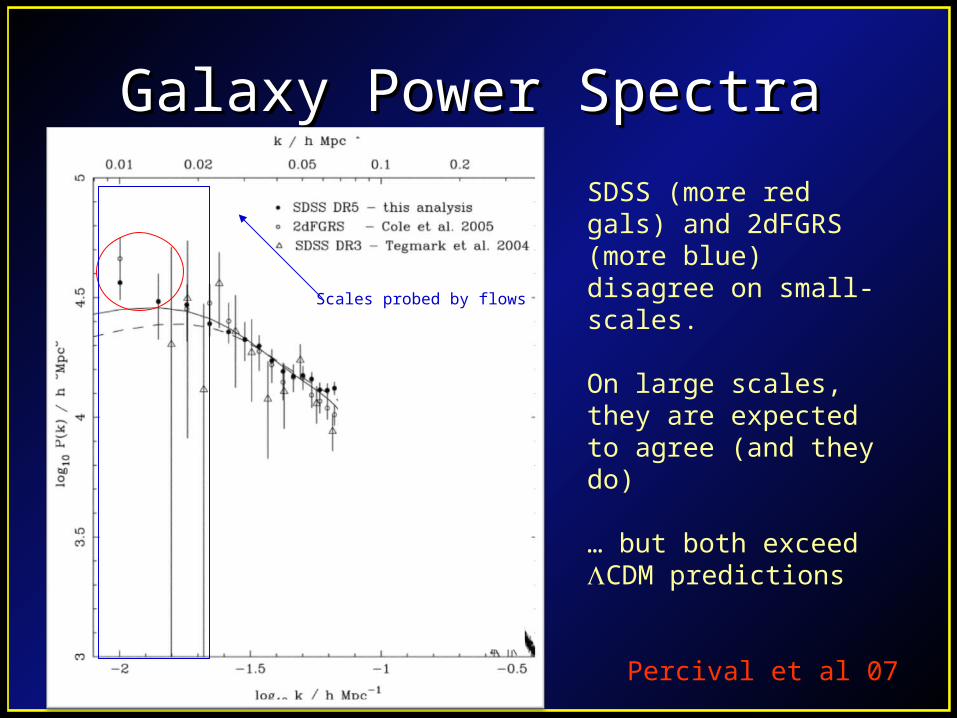
Galaxy Power SpectraGalaxy Power Spectra
SDSS (more red gals) and 2dFGRS (more blue) disagree on small-scales.
On large scales, they are expected to agree (and they do)
… but both exceed CDM predictions
Percival et al 07
Scales probed by flows
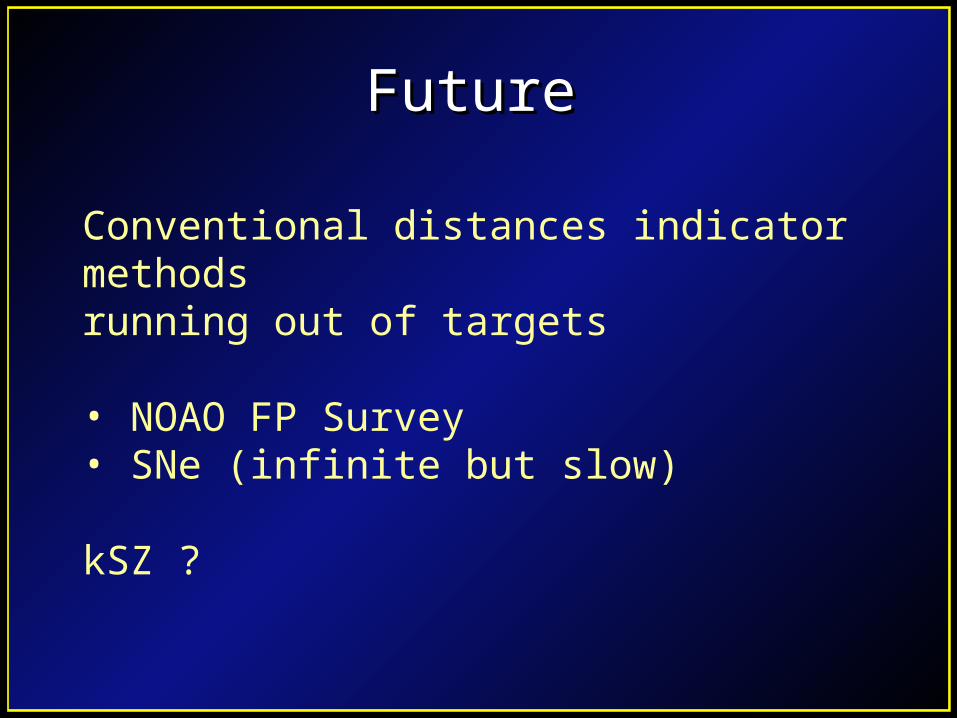
FutureFuture
Conventional distances indicator methods running out of targets
• NOAO FP Survey• SNe (infinite but slow)
kSZ ?
NOAO = National Optical Astronomical ObservatoriesPicture: Kitt Peak,Arizona
NOAO Fundamental Plane Survey
Conclusions IConclusions I• Once sampling effects are considered no conflict
between large-scale sparse peculiar velocity surveys (except possibly Lauer & Postman).
• Combined sample bulk flow (~100 Mpc):
• Combined: 407+- 81 km/s, towards l=287, b=8
• No convergence to CMB yet …
• Not clear what is causing the flow.
• Marginally inconsistent with CDM (98%)
• Some other measures also suggest large fluctuations on large scales.
Predicting Peculiar Predicting Peculiar Velocities using the Velocities using the Galaxy Density FieldGalaxy Density Field
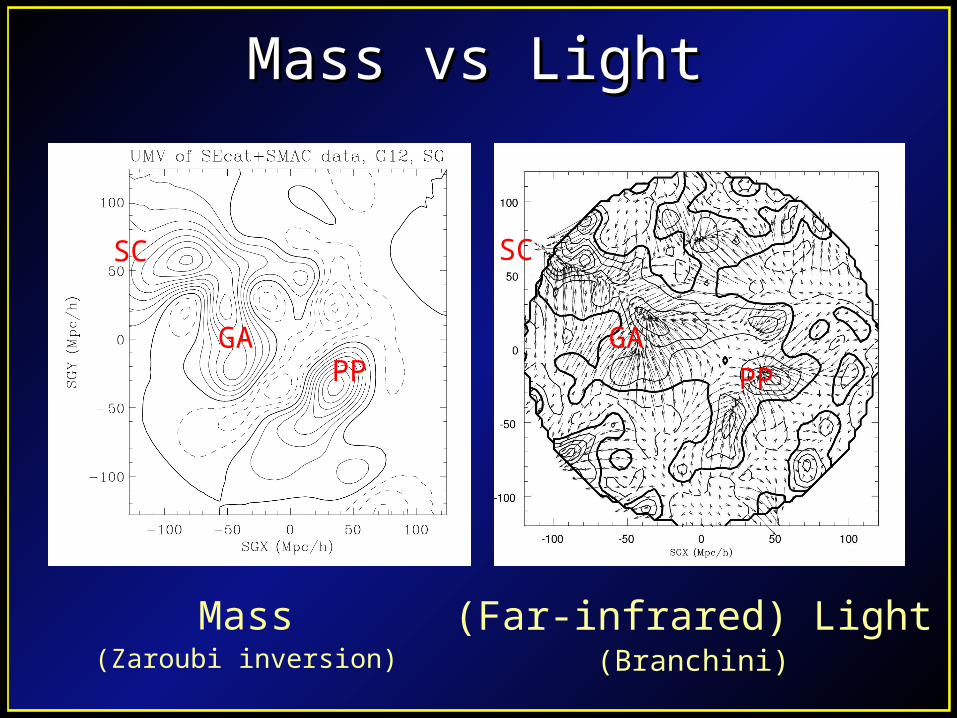
Mass vs LightMass vs Light
Mass(Zaroubi inversion)
(Far-infrared) Light(Branchini)
SC SC
GAGA
PPPP
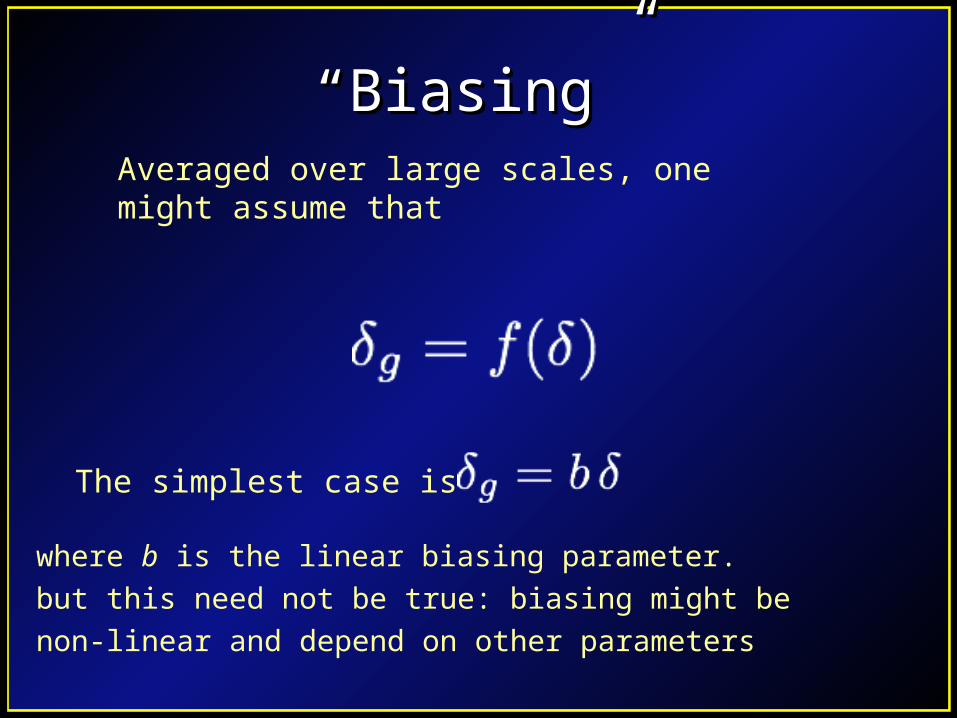
““Biasing”Biasing” Averaged over large scales, one might assume
that
The simplest case is
where b is the linear biasing parameter.
but this need not be true: biasing might be
non-linear and depend on other parameters
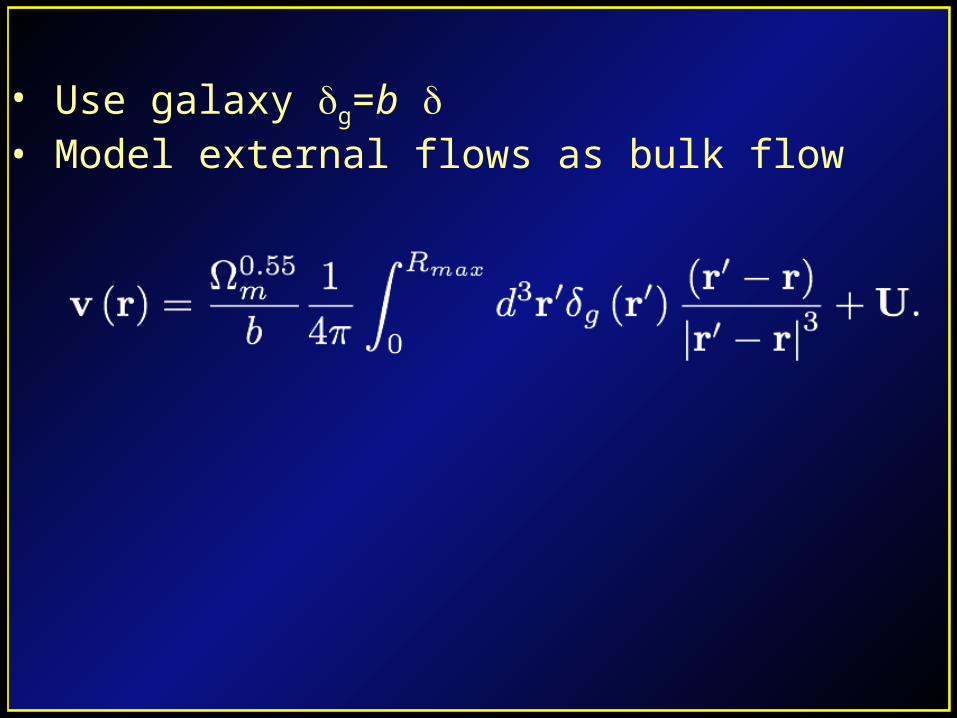
• Use galaxy g=b • Model external flows as bulk flow
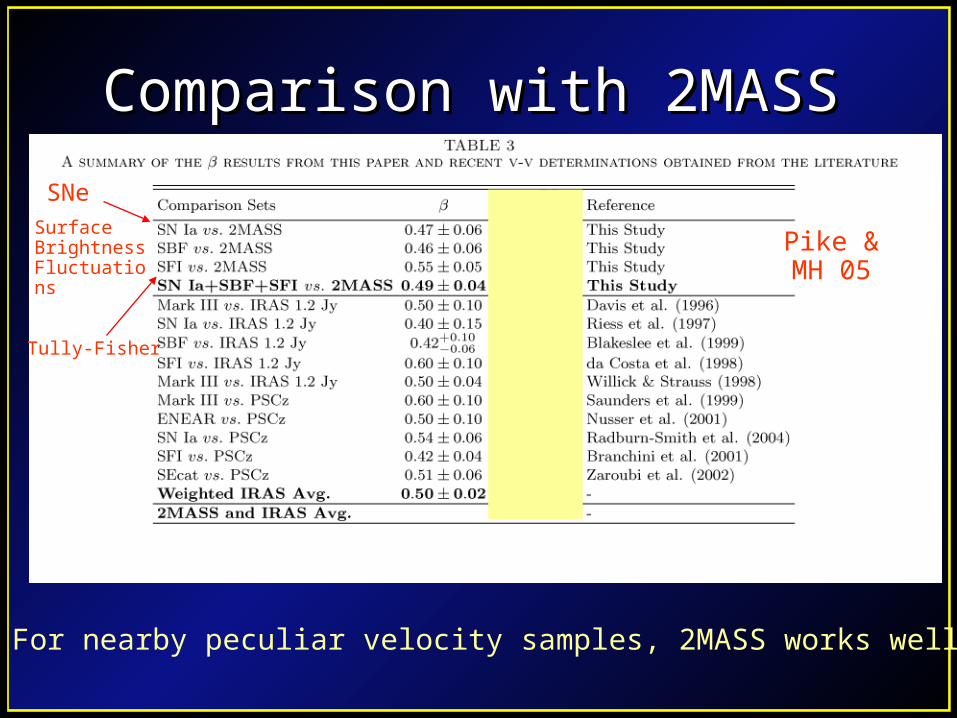
Comparison with 2MASSComparison with 2MASS
For nearby peculiar velocity samples, 2MASS works well
Pike & MH 05
SNeSurface Brightness Fluctuations
Tully-Fisher
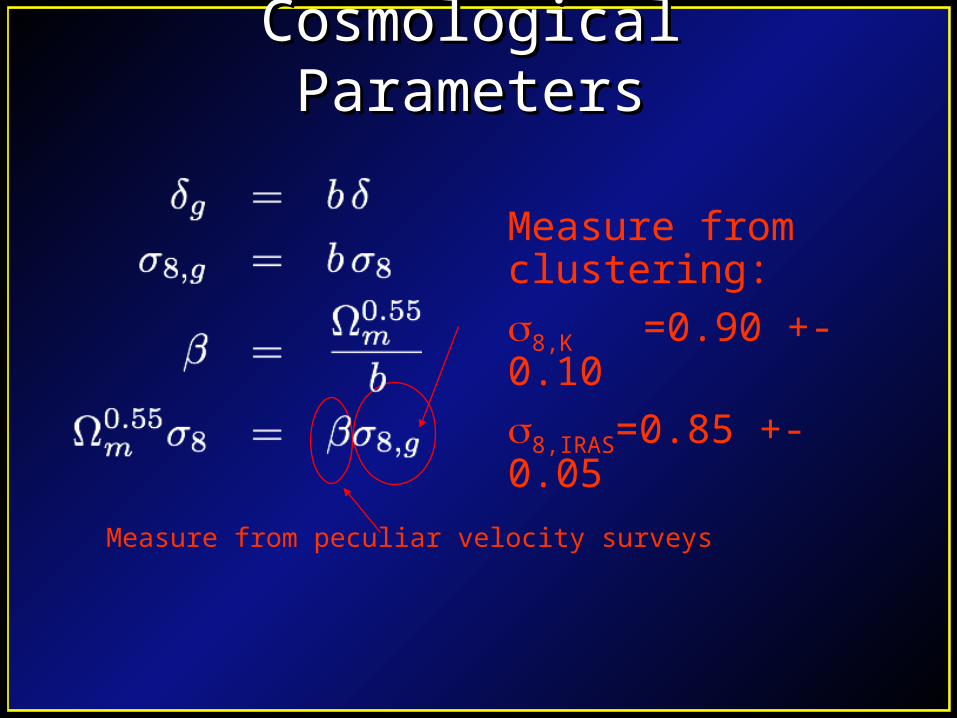
Cosmological ParametersCosmological Parameters
Measure from peculiar velocity surveys
Measure from clustering:
8,K =0.90 +- 0.10
8,IRAS=0.85 +- 0.05
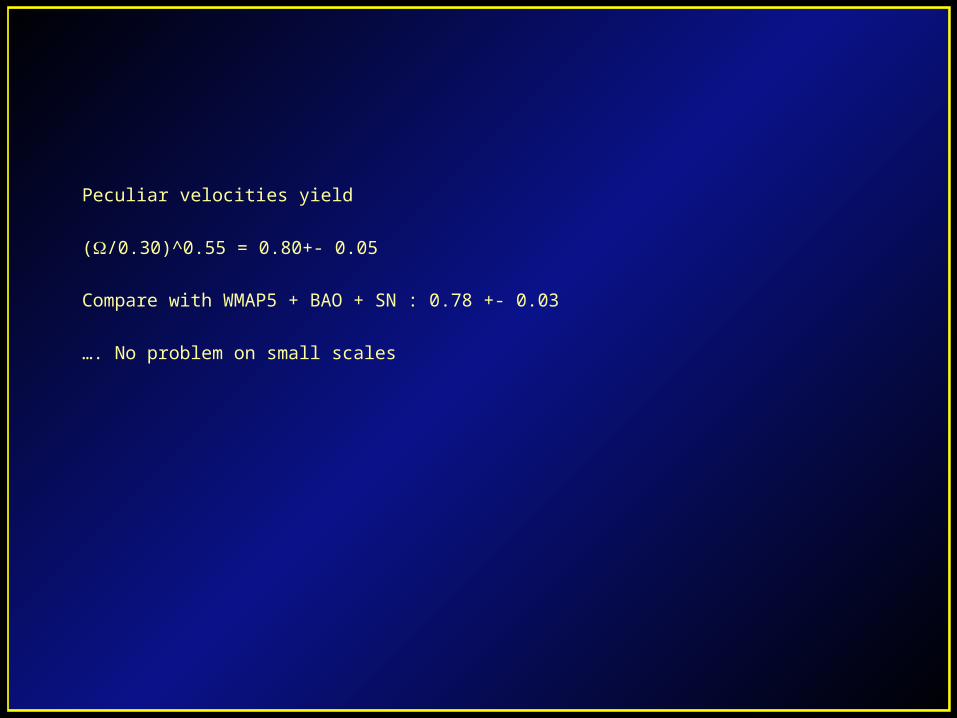
Peculiar velocities yield
(/0.30)^0.55 = 0.80+- 0.05
Compare with WMAP5 + BAO + SN : 0.78 +- 0.03
…. No problem on small scales
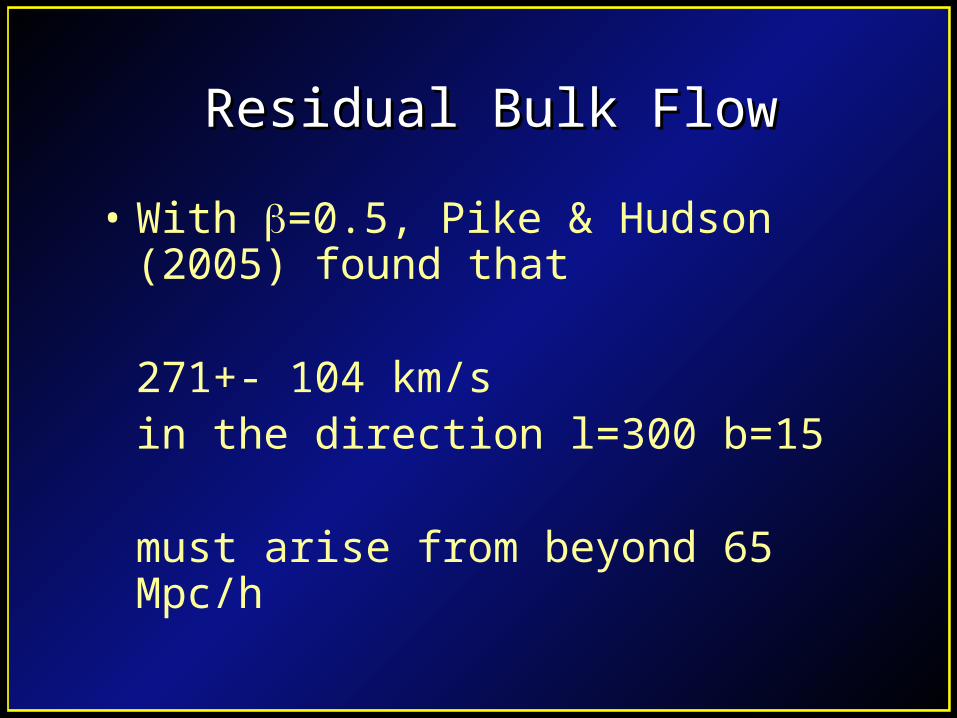
Residual Bulk FlowResidual Bulk Flow
• With =0.5, Pike & Hudson (2005) found that
271+- 104 km/s in the direction l=300 b=15
must arise from beyond 65 Mpc/h
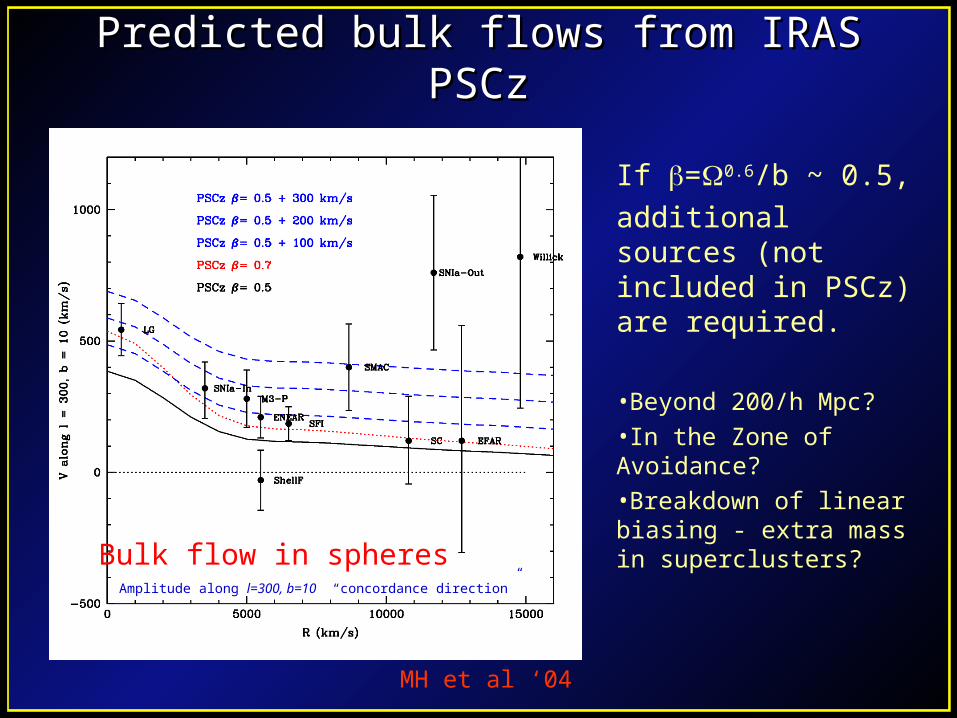
Bulk flow in spheresAmplitude along l=300, b=10 “concordance direction”
Predicted bulk flows from IRAS PSCzPredicted bulk flows from IRAS PSCz
If =0.6/b ~ 0.5,
additional sources (not included in PSCz) are required.
•Beyond 200/h Mpc?•In the Zone of Avoidance?•Breakdown of linear biasing - extra mass in superclusters?
MH et al ‘04
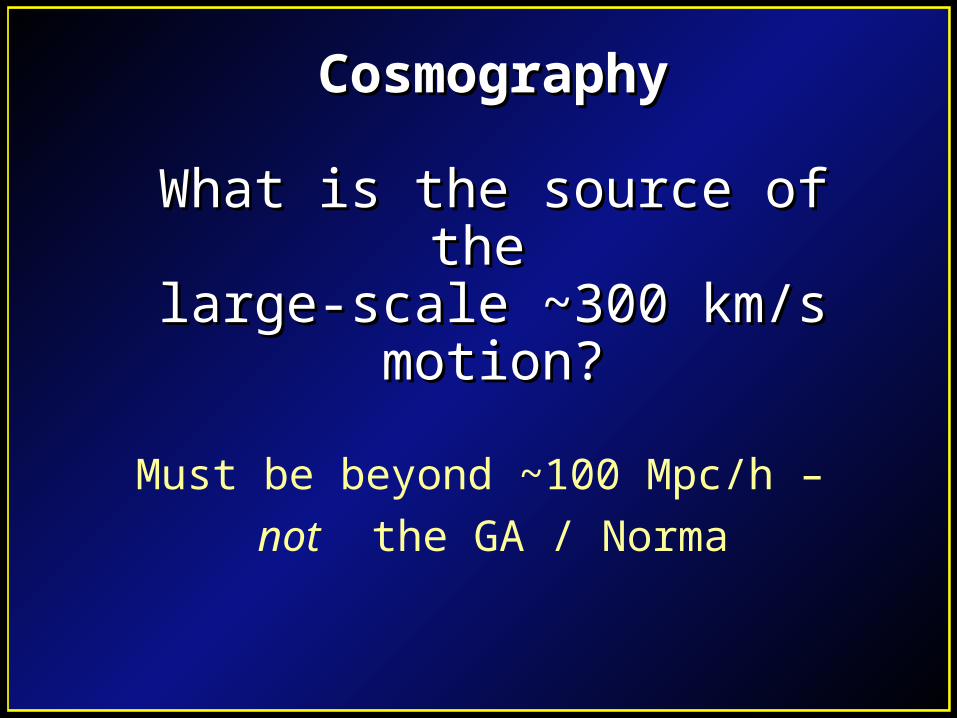
CosmographyCosmography
What is the source of the What is the source of the large-scale ~300 km/s motion?large-scale ~300 km/s motion?
Must be beyond ~100 Mpc/h –
not the GA / Norma
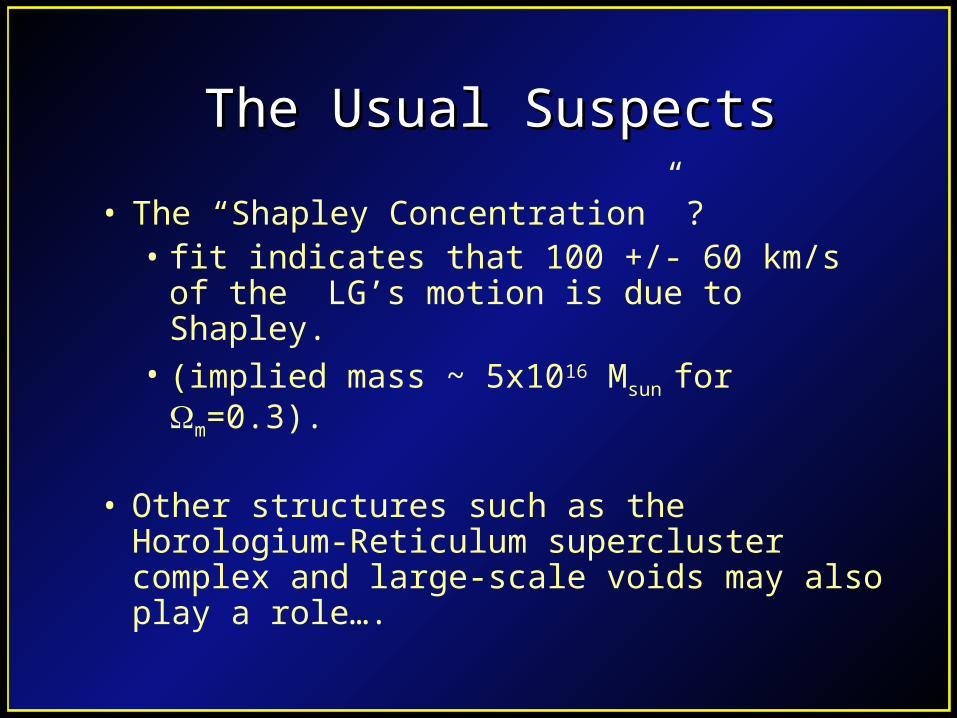
The Usual SuspectsThe Usual Suspects
• The “Shapley Concentration” ?• fit indicates that 100 +/- 60 km/s of the
LG’s motion is due to Shapley.• (implied mass ~ 5x10¹⁶ Msun for m=0.3).
• Other structures such as the Horologium-Reticulum supercluster complex and large-scale voids may also play a role….
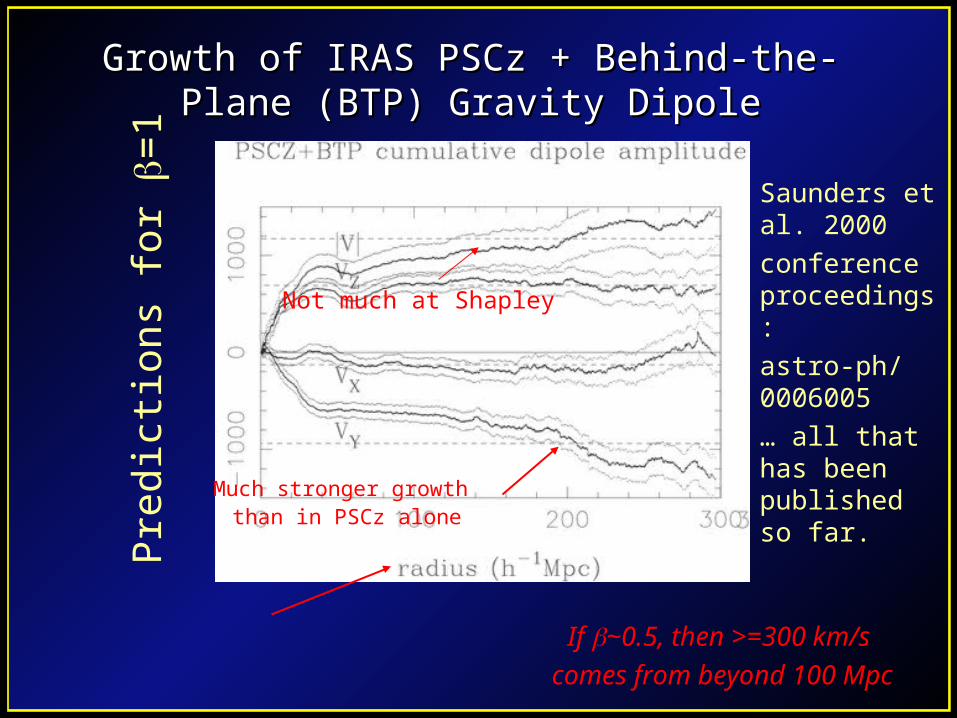
Growth of IRAS PSCz + Behind-the-Growth of IRAS PSCz + Behind-the-Plane (BTP) Gravity DipolePlane (BTP) Gravity Dipole
Saunders et al. 2000conference proceedings:astro-ph/ 0006005… all that has been published so far.
If ~0.5, then >=300 km/s
comes from beyond 100 Mpc
Much stronger growth than in PSCz alone
Not much at Shapley
Predictions for
=
1
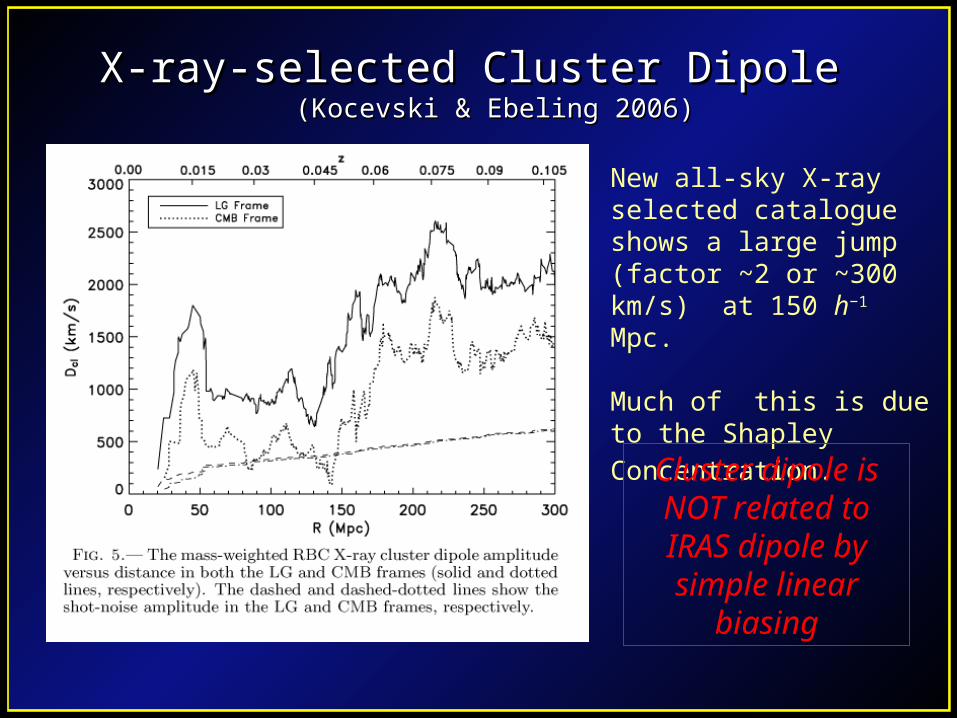
X-ray-selected Cluster Dipole X-ray-selected Cluster Dipole (Kocevski & Ebeling 2006)(Kocevski & Ebeling 2006)
New all-sky X-ray selected catalogue shows a large jump (factor ~2 or ~300 km/s) at 150 h−1
Mpc.
Much of this is due to the Shapley Concentration.
VLG = Dcl
Cluster dipole is NOT related to IRAS dipole by simple linear biasing
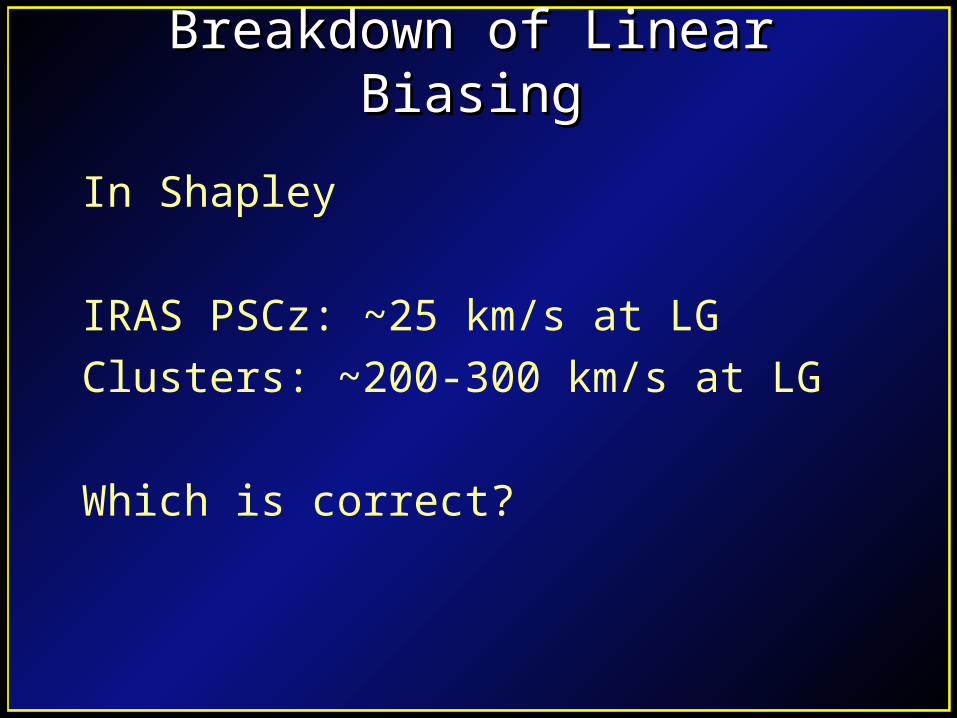
Breakdown of Linear BiasingBreakdown of Linear Biasing
In Shapley
IRAS PSCz: ~25 km/s at LG
Clusters: ~200-300 km/s at LG
Which is correct?
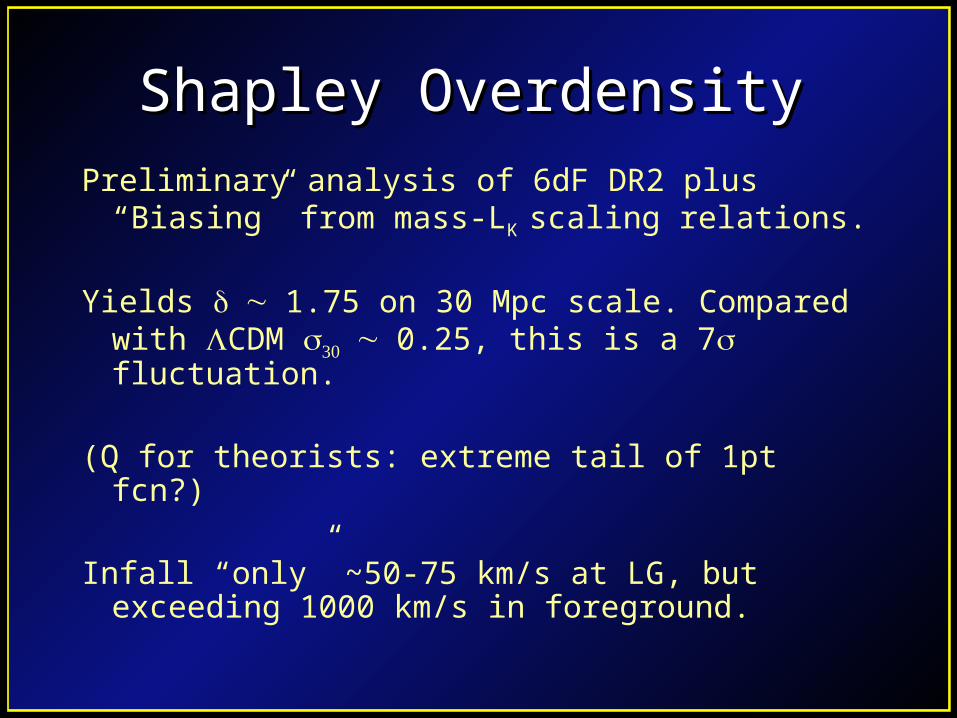
Shapley OverdensityShapley Overdensity
Preliminary analysis of 6dF DR2 plus “Biasing” from mass-LK scaling relations.
Yields 1.75 on 30 Mpc scale. Compared with CDM 0.25, this is a 7 fluctuation.
(Q for theorists: extreme tail of 1pt fcn?)
Infall “only” ~50-75 km/s at LG, but exceeding 1000 km/s in foreground.
Density tracers suggest existence of large-scale
structures, but do not agree on what the important
structures are …
FutureFuture
• Deeper all-sky redshift surveys … 6dF + ?
• Better treatments of “biasing” (halo model)
• Better treatment of predicted peculiar velocities (e.g. MAK)
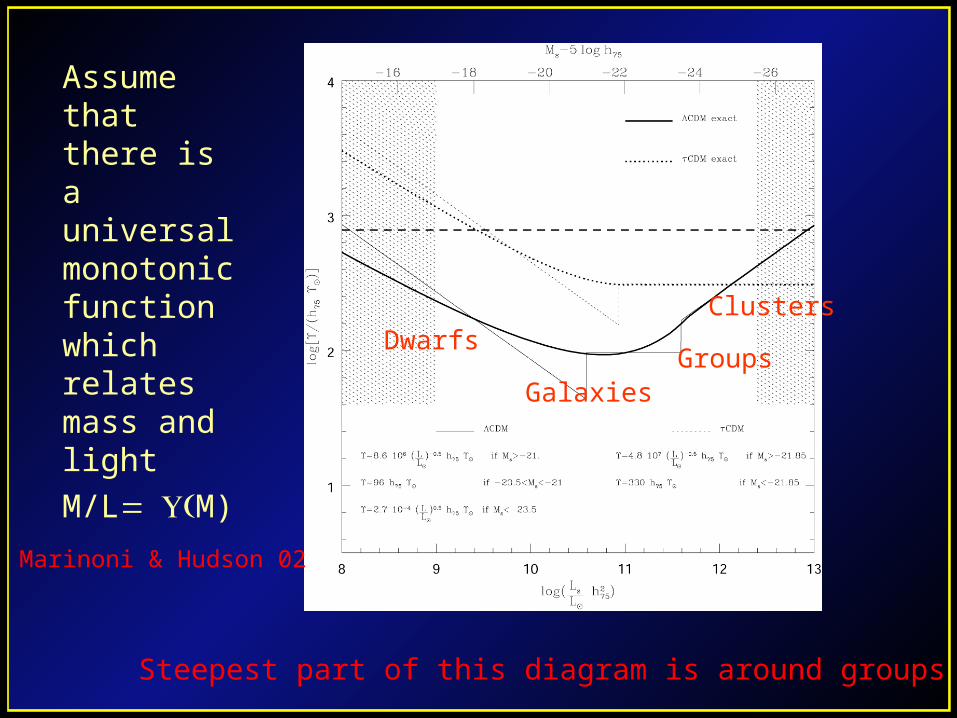
Assume that there is a universal monotonic function which relates mass and light
M/LM)
Clusters
GalaxiesGroups
Dwarfs
Steepest part of this diagram is around groups
Marinoni & Hudson 02
Conclusions IIConclusions II
• Studies of the density field are consistent with the idea that much of the local velocity field arises due to sources at large distance
• But what / where these sources are has not yet been determined.