Embed Size (px)
Citation preview

DISCLOSURE APPENDIX AT THE BACK OF THIS REPORT CONTAINS IMPORTANT DISCLOSURES, ANALYST
CERTIFICATIONS, AND THE STATUS OF NON-US ANALYSTS. US Disclosure: Credit Suisse does and seeks to do business with companies covered in its research reports. As a result, investors should be aware that the Firm may have a conflict of interest that could affect the objectivity of this report. Investors should consider this report as only a single factor in making their investment decision.
CREDIT SUISSE SECURITIES RESEARCH & ANALYTICS BEYOND INFORMATION®
Client-Driven Solutions, Insights, and Access
12 January 2016
Asia Pacific/Japan
Equity Research
Personal Products (Personal Products (Japan)) / MARKET WEIGHT
Cosmetics Sector THEME
Chinese and Japanese market trends in 2016
■ Two key themes in 2016: Japanese and Korean cosmetics companies have outperformed their Western rivals in share-price terms over the past three years, supported by the expansion of borderless consumer markets in China and the rest of Asia. Downtown duty-free stores and exports to China (including cross-border EC) will be critical growth factors for Japanese brands in 2016, in our view. Now ahead of the pack, the Korean brands are
worth studying.
■ Mid-to-high single digit growth for Chinese market in 2016: We estimate the Chinese cosmetics market grew about 9% YoY in 2015 (at the retail level). EC channels, which make up just under 20% of the market, achieved growth of roughly 40%, while department stores and other offline channels that make up over 80% of the market barely achieved 3% growth. We expect the cosmetics market in China to continue growing consistently amid current macroeconomic uncertainty, provided the structural shift from investment to consumption progresses. We think the three leading growth channels will stay (1) EC (notably for low-to-mid-priced items), (2) up-market department stores (notably for luxury brands that avoid online marketing), and (3) foreign imports (including products bought by Chinese tourists). We expect the market to polarize further between high-end products marketed through up-market department stores and low-to-mid-priced products promoted mainly
online.
■ Minimal growth for Japanese market: We think the Japanese cosmetics market achieved growth of about 2% YoY in 2015. Demand from visiting tourists roughly doubled, growing from just over 2% of the overall market in 2014 to around 4% in 2015. Judging by data from other markets, we think this figure is likely to head towards the 5–10% range over the next few years. The level of demand from foreign tourists to Japan will remain a key factor to
monitor.
■ Wait until mid-2016: Aside from a MERS-induced dip in tourist trade in the middle of 2015, Korean cosmetics companies have done well from DFS and exports to China. Japanese brands need to leverage DFS and cross-border EC as well. The fat margins in these channels will help to boost the channel mix. However, it is not clear when these factors might start to contribute to higher earnings. We think cosmetics shares will start to outperform again as
the degree of certainty on this point increases (probably after mid-2016).
■ Stock recommendations: KOSE (4922) is a stock to watch closely, in our view, due to the similarity of its business model to the Korean brands. It is also starting to look noticeably undervalued. Another stock to watch is Pola Orbis (4927), which we expect to perform well in 2016 as its brand profile in
Research Analysts
Masashi Mori
81 3 4550 9695

China grows. With Shiseido (4911) and Kao (4452), we are waiting to see progress with restructuring.

12 January 2016
Cosmetics Sector 3
EC channels and imports still making gains in China
EC market in China expected to grow solidly in 2016 vs. mid-to-high single digit
overall market growth
We estimate the Chinese cosmetics market grew about 9% YoY in 2015 (based on retail
sales). E-commerce (EC) channels, which account for a little less than 20% of the market,
posted growth of roughly 40%, while department stores and other offline channels that
make up over 80% of the market barely achieved 3% growth. We expect the cosmetics
market in China to continue growing consistently amid current macroeconomic uncertainty,
provided the structural transition from investment-led to consumption-led growth
progresses.
Figure 1: China cosmetics market monthly sales
0%
5%
10%
15%
20%
25%
Cosmetics monthly sales growth (y-y)
12-Month MA sales growth (y-y)
Source: National Bureau of Statistics of China
We think market growth in the mid-to-high single digits in 2016 would be a fairly decent
outcome, given the overall lack of optimism surrounding China. The cosmetics market has
been decelerating over the past few years according to the official national statistics, with
the annualized rate of growth slowing to 5–10% in 2H CY15. In feminine care, which is a
category with relatively similar products, slower volume growth in recent years has been
accompanied by an increase in ASP due to the growth of premium product categories, and
the result has been value growth of about 10%. We think the risk of a significant collapse
in the growth trend for cosmetics is largely mitigated by the fact they are consumables.
In 2016, we think the three most important growth channels will remain (1) EC (notably for
low-to-mid-priced items), (2) some up-market department stores (led by the luxury brands
that avoid online marketing), and (3) foreign imports (including any products purchased by
Chinese tourists). We expect the market to polarize between high-end products marketed
via up-market department stores and low-to-mid-priced products promoted mainly online.
12 January 2016
Cosmetics Sector 4
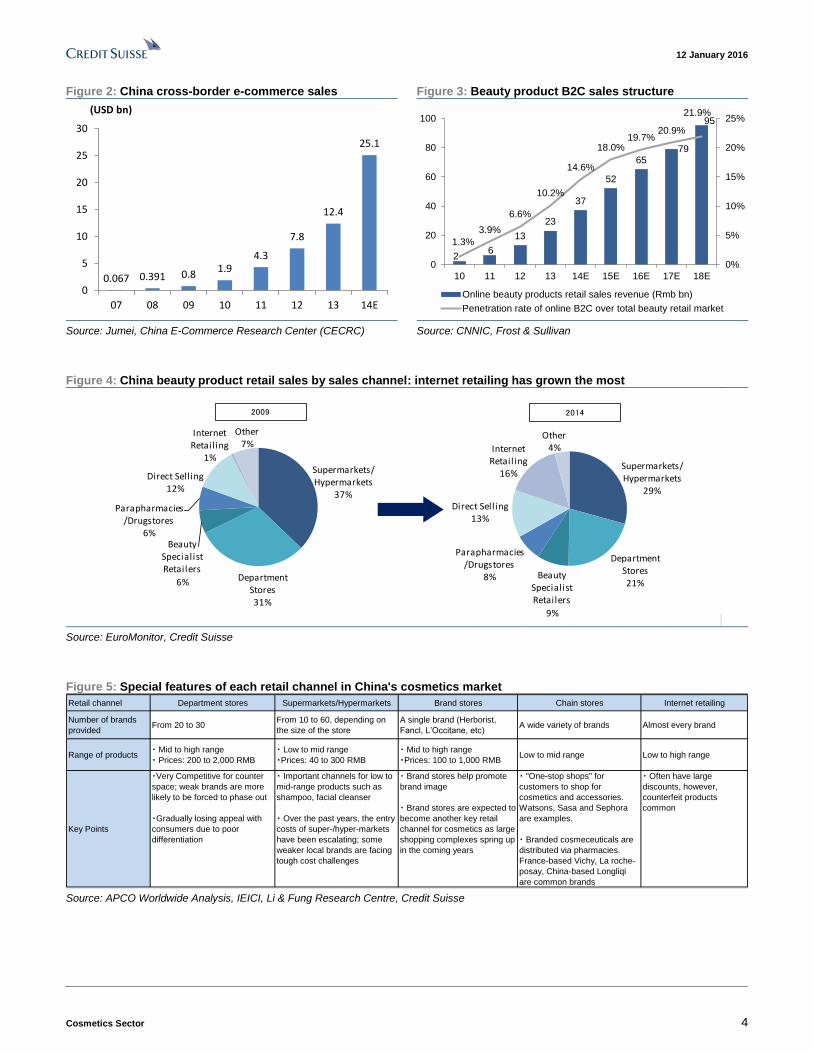
Figure 2: China cross-border e-commerce sales Figure 3: Beauty product B2C sales structure
0.067 0.391 0.81.9
4.3
7.8
12.4
25.1
0
5
10
15
20
25
30
07 08 09 10 11 12 13 14E
(USD bn)
26
13
23
37
52
6579
95
1.3%
3.9%
6.6%
10.2%
14.6%
18.0%19.7%
20.9%
21.9%
0%
5%
10%
15%
20%
25%
0
20
40
60
80
100
10 11 12 13 14E 15E 16E 17E 18E
Online beauty products retail sales revenue (Rmb bn)
Penetration rate of online B2C over total beauty retail market
Source: Jumei, China E-Commerce Research Center (CECRC) Source: CNNIC, Frost & Sullivan
Figure 4: China beauty product retail sales by sales channel: internet retailing has grown the most
Supermarkets/Hypermarkets
37%
Department Stores31%
Beauty Specialist Retailers
6%
Parapharmacies/Drugstores
6%
Direct Selling12%
Internet Retailing
1%
Other7%
Supermarkets/Hypermarkets
29%
Department Stores21%
Beauty Specialist Retailers
9%
Parapharmacies/Drugstores
8%
Direct Selling13%
Internet Retailing
16%
Other4%
2009 2014
Source: EuroMonitor, Credit Suisse
Figure 5: Special features of each retail channel in China's cosmetics market
Retail channel Department stores Supermarkets/Hypermarkets Brand stores Chain stores Internet retailing
Number of brands
providedFrom 20 to 30
From 10 to 60, depending on
the size of the store
A single brand (Herborist,
Fancl, L’Occitane, etc)A wide variety of brands Almost every brand
Range of products・ Mid to high range
・ Prices: 200 to 2,000 RMB
・ Low to mid range
・Prices: 40 to 300 RMB
・ Mid to high range
・Prices: 100 to 1,000 RMBLow to mid range Low to high range
Key Points
・Very Competitive for counter
space; weak brands are more
likely to be forced to phase out
・Gradually losing appeal with
consumers due to poor
differentiation
・ Important channels for low to
mid-range products such as
shampoo, facial cleanser
・ Over the past years, the entry
costs of super-/hyper-markets
have been escalating; some
weaker local brands are facing
tough cost challenges
・ Brand stores help promote
brand image
・ Brand stores are expected to
become another key retail
channel for cosmetics as large
shopping complexes spring up
in the coming years
・ "One-stop shops" for
customers to shop for
cosmetics and accessories.
Watsons, Sasa and Sephora
are examples.
・ Branded cosmeceuticals are
distributed via pharmacies.
France-based Vichy, La roche-
posay, China-based Longliqi
are common brands
・ Often have large
discounts, however,
counterfeit products
common
Source: APCO Worldwide Analysis, IEICI, Li & Fung Research Centre, Credit Suisse
12 January 2016
Cosmetics Sector 5
Korean cosmetics exports to China expected to grow significantly after overtaking
French brands for first time on volume basis in 2015
One of the key factors driving the rapid growth of the EC segment is the easy accessibility
(compared with offline channels) of popular international brands at reasonable prices. The
co-mingling of official and parallel imports complicates the gauging of supply and demand,
but we have tried to estimate Chinese cosmetic imports by country of origin.
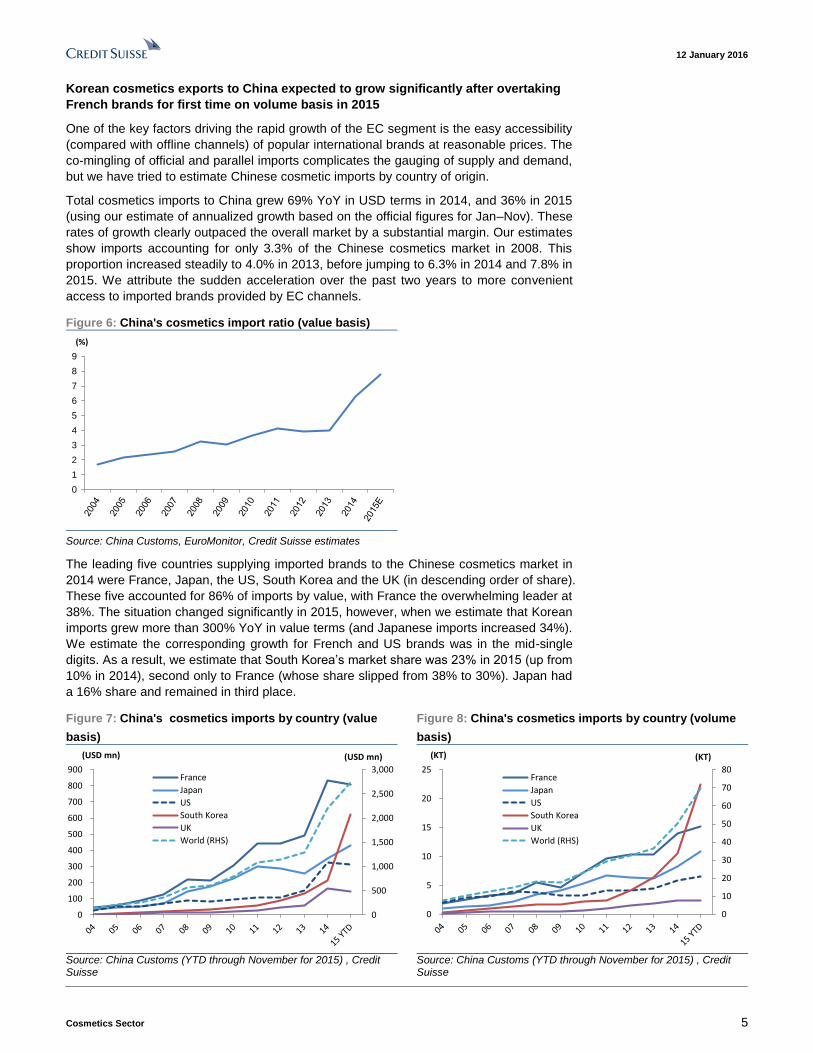
Total cosmetics imports to China grew 69% YoY in USD terms in 2014, and 36% in 2015
(using our estimate of annualized growth based on the official figures for Jan–Nov). These
rates of growth clearly outpaced the overall market by a substantial margin. Our estimates
show imports accounting for only 3.3% of the Chinese cosmetics market in 2008. This
proportion increased steadily to 4.0% in 2013, before jumping to 6.3% in 2014 and 7.8% in
2015. We attribute the sudden acceleration over the past two years to more convenient
access to imported brands provided by EC channels.
Figure 6: China's cosmetics import ratio (value basis)
0
1
2
3
4
5
6
7
8
9
(%)
Source: China Customs, EuroMonitor, Credit Suisse estimates
The leading five countries supplying imported brands to the Chinese cosmetics market in
2014 were France, Japan, the US, South Korea and the UK (in descending order of share).
These five accounted for 86% of imports by value, with France the overwhelming leader at
38%. The situation changed significantly in 2015, however, when we estimate that Korean
imports grew more than 300% YoY in value terms (and Japanese imports increased 34%).
We estimate the corresponding growth for French and US brands was in the mid-single
digits. As a result, we estimate that South Korea’s market share was 23% in 2015 (up from
10% in 2014), second only to France (whose share slipped from 38% to 30%). Japan had
a 16% share and remained in third place.
Figure 7: China's cosmetics imports by country (value
basis)
Figure 8: China's cosmetics imports by country (volume
basis)
0
500
1,000
1,500
2,000
2,500
3,000
0
100
200
300
400
500
600
700
800
900
(USD mn)
Mill
ion
s
(USD mn)
France
Japan
US
South Korea
UK
World (RHS)
0
10
20
30
40
50
60
70
80
0
5
10
15
20
25
(KT)(KT)
France
Japan
US
South Korea
UK
World (RHS)
Source: China Customs (YTD through November for 2015) , Credit Suisse
Source: China Customs (YTD through November for 2015) , Credit Suisse
12 January 2016
Cosmetics Sector 6
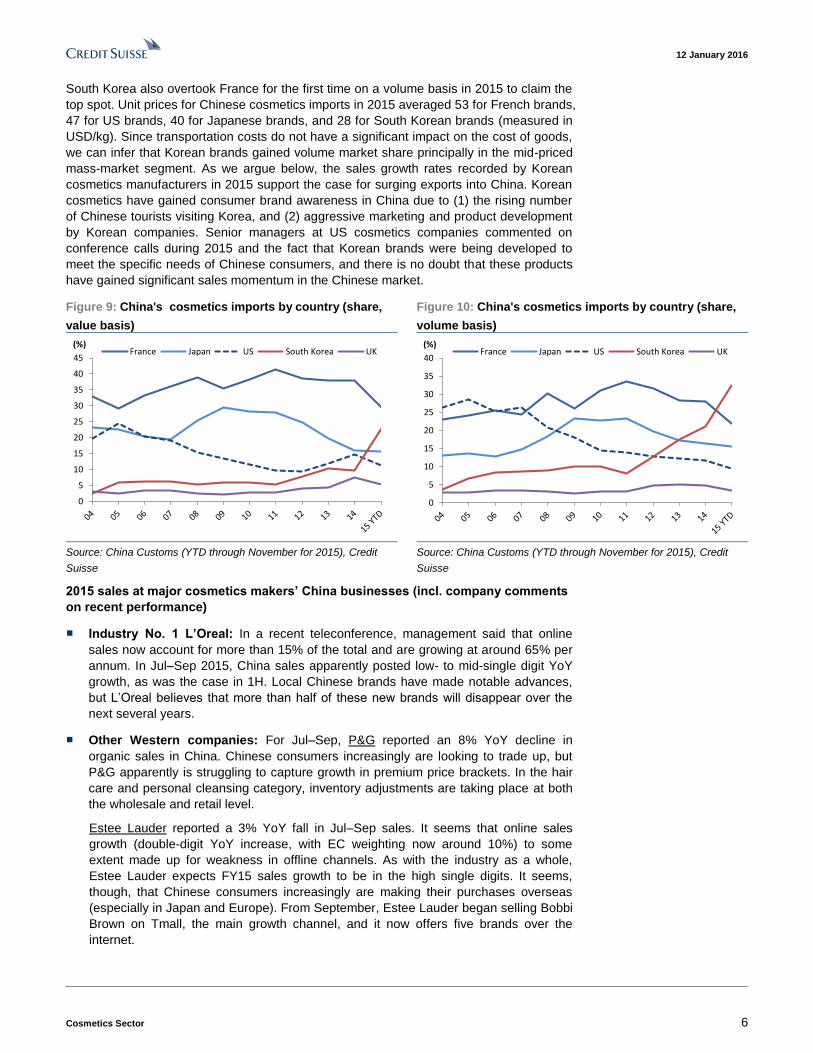
South Korea also overtook France for the first time on a volume basis in 2015 to claim the
top spot. Unit prices for Chinese cosmetics imports in 2015 averaged 53 for French brands,
47 for US brands, 40 for Japanese brands, and 28 for South Korean brands (measured in
USD/kg). Since transportation costs do not have a significant impact on the cost of goods,
we can infer that Korean brands gained volume market share principally in the mid-priced
mass-market segment. As we argue below, the sales growth rates recorded by Korean
cosmetics manufacturers in 2015 support the case for surging exports into China. Korean
cosmetics have gained consumer brand awareness in China due to (1) the rising number
of Chinese tourists visiting Korea, and (2) aggressive marketing and product development
by Korean companies. Senior managers at US cosmetics companies commented on
conference calls during 2015 and the fact that Korean brands were being developed to
meet the specific needs of Chinese consumers, and there is no doubt that these products
have gained significant sales momentum in the Chinese market.
Figure 9: China's cosmetics imports by country (share,
value basis)
Figure 10: China's cosmetics imports by country (share,
volume basis)
0
5
10
15
20
25
30
35
40
45
(%)France Japan US South Korea UK
0
5
10
15
20
25
30
35
40
(%)France Japan US South Korea UK
Source: China Customs (YTD through November for 2015), Credit
Suisse
Source: China Customs (YTD through November for 2015), Credit
Suisse
2015 sales at major cosmetics makers’ China businesses (incl. company comments
on recent performance)
■ Industry No. 1 L’Oreal: In a recent teleconference, management said that online
sales now account for more than 15% of the total and are growing at around 65% per
annum. In Jul–Sep 2015, China sales apparently posted low- to mid-single digit YoY
growth, as was the case in 1H. Local Chinese brands have made notable advances,
but L’Oreal believes that more than half of these new brands will disappear over the
next several years.
■ Other Western companies: For Jul–Sep, P&G reported an 8% YoY decline in
organic sales in China. Chinese consumers increasingly are looking to trade up, but
P&G apparently is struggling to capture growth in premium price brackets. In the hair
care and personal cleansing category, inventory adjustments are taking place at both
the wholesale and retail level.
Estee Lauder reported a 3% YoY fall in Jul–Sep sales. It seems that online sales
growth (double-digit YoY increase, with EC weighting now around 10%) to some
extent made up for weakness in offline channels. As with the industry as a whole,
Estee Lauder expects FY15 sales growth to be in the high single digits. It seems,
though, that Chinese consumers increasingly are making their purchases overseas
(especially in Japan and Europe). From September, Estee Lauder began selling Bobbi
Brown on Tmall, the main growth channel, and it now offers five brands over the
internet.
12 January 2016
Cosmetics Sector 7
When reporting Jul–Sep results, Unilever said sales were level with or below prior-
year levels in Tier 1 cities, but higher in Tier 2/3 cities. Online sales are up 80% YoY,
and now account for 6% of all sales in China. Including EC, Unilever is aiming for top
line growth in the mid-single digits in China. The company also said its strategic
partnership with Alibaba is proving beneficial.
Avon reported an 8% YoY decline in Asia Pacific sales for Jul–Sep. Sales were
particularly poor in China, prompting a rethink of the marketing structure. Nu Skin
sales in China were down 8% YoY in Jul–Sep, leading to inventory adjustments. Sales
in Hong Kong and Taiwan posted double-digit YoY declines, in part because of a high
base for YoY comparison.

12 January 2016
Cosmetics Sector 8
■ Two major Korean companies: The views outlined below are those of our Korean
analyst A-Hyung Cho. Jul–Sep sales at AmorePacific’s (AP) overseas operation were
up 60% YoY, which came as a positive surprise. Exports to China were strong, and
the company opened more shops exclusively selling its Innisfree and Sulwhasoo
brands.
LG H&H reported 65% YoY sales growth for its DFS channel. The Whoo brand is
becoming popular among Chinese travelers, and sales of SU:M are growing also. It
seems Chinese travel to Korea is now recovering.
■ Four major Japanese companies: In 1H FY12/15 (Jan–Jun), Shiseido’s China sales
fell 7.6% YoY on a local currency basis. While online sales were brisk, in-store sales
were poor, leading to inventory adjustments. At end-October 2015, the company
lowered its full-year forecast for China sales, calling for 3% growth rather than the 8%
increase previously projected.
Over 1–3Q FY12/15, cumulative sales of Pola Orbis’ Jurlique brand fell 5% YoY in
China and 15% in Hong Kong (both on a local currency basis).
In 1H FY12/15 (Jan–Jun), Kose’s China sales declined 17% YoY on a local currency
basis. Over the next few years, the company plans to shutter around 25% of the worst-
performing stores. It already has undertaken some structural reform in Taiwan, and
over the same period, sales apparently increased 15% YoY, similarly rising 21% in
Korea and posting double-digit growth in Hong Kong.
Fancl's 1H FY12/15 (Jan–Jun) China sales registered a low-single-digit YoY decrease
on a local currency basis, and 3Q saw a decline in the mid-single digits. In Hong Kong,
meanwhile, sales were flat YoY in 1H and fell by just over 10% in 3Q. In China,
genuine Fancl products are sold mostly in high-end department stores and are not
available online.
To sum up the current situation at major cosmetics companies: (1) among US/European
and Japanese companies in particular, while the EC channel in China continues to grow,
sales via offline channels are lackluster, (2) Japanese cosmetics companies benefited
from inbound Chinese tourism throughout 2015 but reported lackluster sales in China for
locally-manufactured products, and (3) Korean companies experienced a dip in sales to
inbound Chinese tourists because of the MERS outbreak but reported robust exports to
Chinese-speaking countries. As shown in Figure 11, at present, Korean cosmetics makers
are enjoying favorable sales in the middle-mass and high-end price brackets.

12 January 2016
Cosmetics Sector 9
Figure 11: Brand positioning in China based on country/region of origin
Cosmetics Market size image
price by product ragnge Japan South Korea China
- CHANEL - LANCOME - Global SHISEIDO
- Dior - Sisley - Clé de Peau Beauté (SHISEIDO)
- Estée Lauder - GUERLAIN - FANCL
- SK-Ⅱ - LA MER - POLA
- Helena Rubinstein - La Prairie
- ARTISTRY - CLARINS - AUPRES (SHISEIDO) - Sulwhasoo (Amore Pacific)
- VICHY - L'Occitane - Jurlique (Pola Orbis HD) - Whoo (LG H&H)
- BIOTHERM - Bobbi Brown - Sekkisei (KOSE) - LANEIGE (Amore Pacific)
- CLINIQUE - M.A.C - ALBION (KOSE) - SU:M37° (LG H&H)
- Nu Skin - Benefit - H2O Plus (Pola Orbis HD) - Sooryehan (LG H&H)
- DHC
- L'Oréal Paris - Maybelline - URARA (SHISEIDO) - innisfree (Amore Pacific) - HERBORIST (佰草集)
- Mary Kay - POND'S - Za (SHISEIDO) - Mamonde (Amore Pacific) - PROYA (珀莱雅)
- Olay - Kiehl's - Pure & Mild (SHISEIDO) - THE FACE SHOP (LG H&H) - MARUBI (丸美)
- Avene - AVON - Freeplus (KAO) - MISSHA - PECHOIN (百雀羚)
- Elizabeth Arden - YUESAI - SKIN FOOD - CHANDO (自然堂)
- ETUDE HOUSE (Amore Pacific) - INOHERB (相宜本草)
- MEIFUBAO (美肤宝)
- SANA (Noevir HD) - Dabao (大宝)
- LONGLIQI (隆力奇)
EU/US
Brand by country/region
Prestige(above CNY 500)
High-end(CNY 300-500)
Middle mass(CNY 100-300)
Low-end(below CNY
Note: Some brands included as although their sales on the Chinese mainland are modest, inbound sales are firm.
Source: Credit Suisse, partly based on company disclosures, EuroMonitor
According to the most recent (2014) data from EuroMonitor, in comparison with five years
ago, both P&G and Shiseido have lost market share in the skincare category. While some
US and European brands have gained market share, in 2015 there were notable advances
by Korean cosmetics companies (AP in particular), and on the whole, Japanese
companies struggled, as did their US and European counterparts. As most Chinese
brands are manufactured by unlisted companies, it is difficult to get a picture of sales
trends. It seems clear, though, that such companies are stepping up their marketing efforts,
especially in online channels. Chinese brands have made notable gains in the market for
organic skincare, with some building a brand image evocative of Korean and Japanese
brands. While a number of Chinese brands are making inroads into the market, we have
yet to hear anyone in the industry suggest at this stage that any such brand presents a
serious threat.
In the most expensive prestige category (sold almost entirely via high-end department
stores and DFS), US and European brands sell the most products, followed by Japanese
brands. The biggest challenge for Japanese companies would seem to be regaining
market share in the middle-mass volume zone and the high-end price bracket. Korean
companies have deftly harnessed pop culture in their marketing, to appeal to younger
consumers. This could prove difficult for Japanese companies to emulate; thus, from a
strategic perspective, we think it important that Japanese companies target younger
consumers via entry-level versions of products already well established in high-end and
prestige markets.
12 January 2016
Cosmetics Sector 10
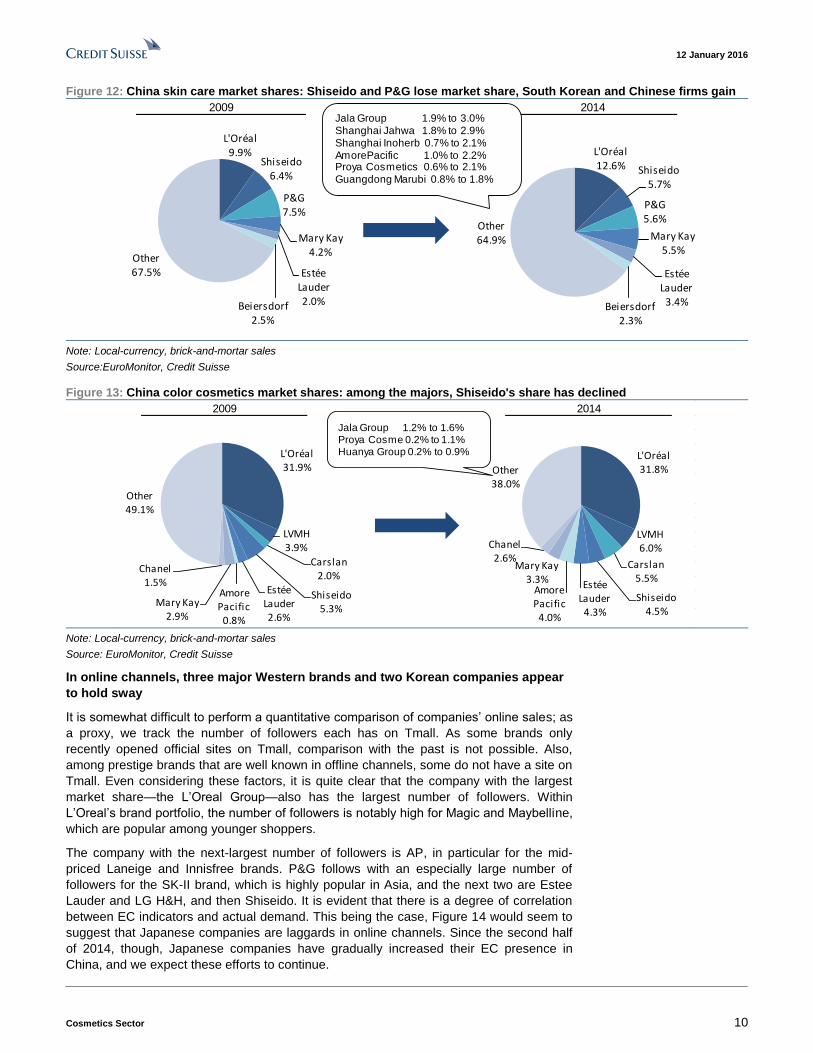
Figure 12: China skin care market shares: Shiseido and P&G lose market share, South Korean and Chinese firms gain
2009 2014
L'Oréal12.6% Shiseido
5.7%
P&G5.6%
Mary Kay5.5%
Estée Lauder
3.4%Beiersdorf2.3%
Other64.9%
L'Oréal9.9%
Shiseido6.4%
P&G7.5%
Mary Kay4.2%
Estée Lauder2.0%Beiersdorf
2.5%
Other67.5%
Jala Group 1.9% to 3.0% Shanghai Jahwa 1.8% to 2.9% Shanghai Inoherb 0.7% to 2.1%AmorePacific 1.0% to 2.2%Proya Cosmetics 0.6% to 2.1% Guangdong Marubi 0.8% to 1.8%
Note: Local-currency, brick-and-mortar sales
Source:EuroMonitor, Credit Suisse
Figure 13: China color cosmetics market shares: among the majors, Shiseido's share has declined
2009 2014
L'Oréal31.9%
LVMH3.9%
Carslan2.0%
Shiseido5.3%
Estée Lauder2.6%
AmorePacific
0.8%
Mary Kay2.9%
Chanel1.5%
Other49.1%
L'Oréal31.8%
LVMH6.0%
Carslan5.5%
Shiseido4.5%
Estée Lauder
4.3%
AmorePacific
4.0%
Mary Kay3.3%
Chanel2.6%
Other38.0%
Jala Group 1.2% to 1.6% Proya Cosme 0.2% to 1.1% Huanya Group 0.2% to 0.9%
Note: Local-currency, brick-and-mortar sales
Source: EuroMonitor, Credit Suisse
In online channels, three major Western brands and two Korean companies appear
to hold sway
It is somewhat difficult to perform a quantitative comparison of companies’ online sales; as
a proxy, we track the number of followers each has on Tmall. As some brands only
recently opened official sites on Tmall, comparison with the past is not possible. Also,
among prestige brands that are well known in offline channels, some do not have a site on
Tmall. Even considering these factors, it is quite clear that the company with the largest
market share—the L’Oreal Group—also has the largest number of followers. Within
L’Oreal’s brand portfolio, the number of followers is notably high for Magic and Maybelline,
which are popular among younger shoppers.
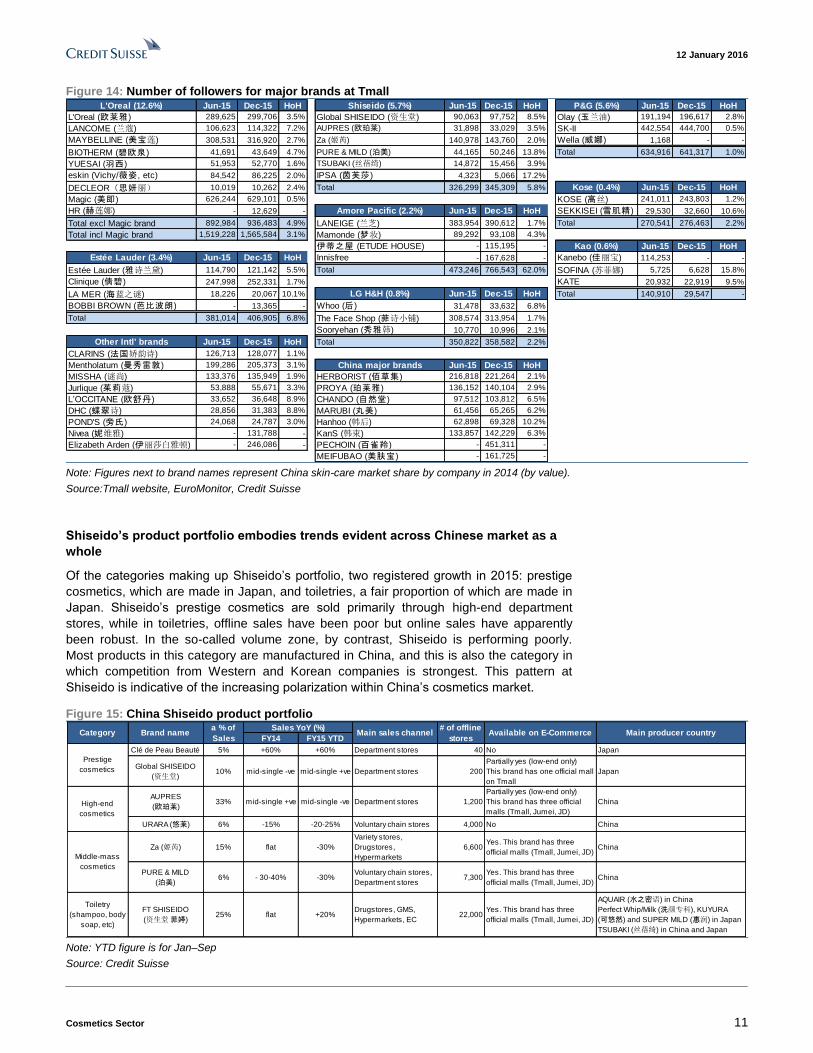
The company with the next-largest number of followers is AP, in particular for the mid-
priced Laneige and Innisfree brands. P&G follows with an especially large number of
followers for the SK-II brand, which is highly popular in Asia, and the next two are Estee
Lauder and LG H&H, and then Shiseido. It is evident that there is a degree of correlation
between EC indicators and actual demand. This being the case, Figure 14 would seem to
suggest that Japanese companies are laggards in online channels. Since the second half
of 2014, though, Japanese companies have gradually increased their EC presence in
China, and we expect these efforts to continue.
12 January 2016
Cosmetics Sector 11
Figure 14: Number of followers for major brands at Tmall
L'Oreal (12.6%) Jun-15 Dec-15 HoH Shiseido (5.7%) Jun-15 Dec-15 HoH P&G (5.6%) Jun-15 Dec-15 HoH
L'Oreal (欧莱雅) 289,625 299,706 3.5% Global SHISEIDO (资生堂) 90,063 97,752 8.5% Olay (玉兰油) 191,194 196,617 2.8%
LANCOME (兰蔻) 106,623 114,322 7.2% AUPRES (欧珀莱) 31,898 33,029 3.5% SK-II 442,554 444,700 0.5%
MAYBELLINE (美宝莲) 308,531 316,920 2.7% Za (姬芮) 140,978 143,760 2.0% Wella (威娜) 1,168 - -
BIOTHERM (碧欧泉) 41,691 43,649 4.7% PURE & MILD (泊美) 44,165 50,246 13.8% Total 634,916 641,317 1.0%
YUESAI (羽西) 51,953 52,770 1.6% TSUBAKI (丝蓓绮) 14,872 15,456 3.9%
eskin (Vichy/薇姿, etc) 84,542 86,225 2.0% IPSA (茵芙莎) 4,323 5,066 17.2%
DECLEOR(思妍丽) 10,019 10,262 2.4% Total 326,299 345,309 5.8% Kose (0.4%) Jun-15 Dec-15 HoH
Magic (美即) 626,244 629,101 0.5% KOSE (高丝) 241,011 243,803 1.2%
HR (赫莲娜) - 12,629 - Amore Pacific (2.2%) Jun-15 Dec-15 HoH SEKKISEI (雪肌精) 29,530 32,660 10.6%
Total excl Magic brand 892,984 936,483 4.9% LANEIGE (兰芝) 383,954 390,612 1.7% Total 270,541 276,463 2.2%
Total incl Magic brand 1,519,228 1,565,584 3.1% Mamonde (梦妆) 89,292 93,108 4.3%
伊蒂之屋 (ETUDE HOUSE) - 115,195 - Kao (0.6%) Jun-15 Dec-15 HoH
Estée Lauder (3.4%) Jun-15 Dec-15 HoH Innisfree - 167,628 - Kanebo (佳丽宝) 114,253 - -
Estée Lauder (雅诗兰黛) 114,790 121,142 5.5% Total 473,246 766,543 62.0% SOFINA (苏菲娜) 5,725 6,628 15.8%
Clinique (倩碧) 247,998 252,331 1.7% KATE 20,932 22,919 9.5%
LA MER (海蓝之谜) 18,226 20,067 10.1% LG H&H (0.8%) Jun-15 Dec-15 HoH Total 140,910 29,547 -
BOBBI BROWN (芭比波朗) - 13,365 - Whoo (后) 31,478 33,632 6.8%
Total 381,014 406,905 6.8% The Face Shop (菲诗小铺) 308,574 313,954 1.7%
Sooryehan (秀雅韩) 10,770 10,996 2.1%
Other Intl' brands Jun-15 Dec-15 HoH Total 350,822 358,582 2.2%
CLARINS (法国娇韵诗) 126,713 128,077 1.1%
Mentholatum (曼秀雷敦) 199,286 205,373 3.1% China major brands Jun-15 Dec-15 HoH
MISSHA (谜尚) 133,376 135,949 1.9% HERBORIST (佰草集) 216,818 221,264 2.1%
Jurlique (茱莉蔻) 53,888 55,671 3.3% PROYA (珀莱雅) 136,152 140,104 2.9%
L’OCCITANE (欧舒丹) 33,652 36,648 8.9% CHANDO (自然堂) 97,512 103,812 6.5%
DHC (蝶翠诗) 28,856 31,383 8.8% MARUBI (丸美) 61,456 65,265 6.2%
POND'S (旁氏) 24,068 24,787 3.0% Hanhoo (韩后) 62,898 69,328 10.2%
Nivea (妮维雅) - 131,788 - KanS (韩束) 133,857 142,229 6.3%
Elizabeth Arden (伊丽莎白雅顿) - 246,086 - PECHOIN (百雀羚) - 451,311 -
MEIFUBAO (美肤宝) - 161,725 - Note: Figures next to brand names represent China skin-care market share by company in 2014 (by value).
Source:Tmall website, EuroMonitor, Credit Suisse
Shiseido’s product portfolio embodies trends evident across Chinese market as a
whole
Of the categories making up Shiseido’s portfolio, two registered growth in 2015: prestige
cosmetics, which are made in Japan, and toiletries, a fair proportion of which are made in
Japan. Shiseido’s prestige cosmetics are sold primarily through high-end department
stores, while in toiletries, offline sales have been poor but online sales have apparently
been robust. In the so-called volume zone, by contrast, Shiseido is performing poorly.
Most products in this category are manufactured in China, and this is also the category in
which competition from Western and Korean companies is strongest. This pattern at
Shiseido is indicative of the increasing polarization within China’s cosmetics market.
Figure 15: China Shiseido product portfolio
FY14 FY15 YTD
Clé de Peau Beauté 5% +60% +60% Department stores 40 No Japan
Global SHISEIDO
(资生堂)10% mid-single -ve mid-single +ve Department stores 200
Partially yes (low-end only)
This brand has one official mall
on Tmall
Japan
AUPRES
(欧珀莱)33% mid-single +ve mid-single -ve Department stores 1,200
Partially yes (low-end only)
This brand has three official
malls (Tmall, Jumei, JD)
China
URARA (悠莱) 6% -15% -20-25% Voluntary chain stores 4,000 No China
Za (姬芮) 15% flat -30%
Variety stores,
Drugstores,
Hypermarkets
6,600Yes. This brand has three
official malls (Tmall, Jumei, JD)China
PURE & MILD
(泊美)6% - 30-40% -30%
Voluntary chain stores,
Department stores7,300
Yes. This brand has three
official malls (Tmall, Jumei, JD)China
Toiletry
(shampoo, body
soap, etc)
FT SHISEIDO
(资生堂 菲婷)25% flat +20%
Drugstores, GMS,
Hypermarkets, EC22,000
Yes. This brand has three
official malls (Tmall, Jumei, JD)
AQUAIR (水之密语) in China
Perfect Whip/Milk (洗颜专科), KUYURA
(可悠然) and SUPER MILD (惠润) in Japan
TSUBAKI (丝蓓绮) in China and Japan
a % of
Sales Main sales channel
# of offline
storesAvailable on E-Commerce Main producer country
Sales YoY (%)
Middle-mass
cosmetics
Prestige
cosmetics
High-end
cosmetics
Category Brand name
Note: YTD figure is for Jan–Sep
Source: Credit Suisse

12 January 2016
Cosmetics Sector 12
Japanese consumers favor domestic brands;
exports poised to reach all-time high in 2015
All four major cosmetics makers increase market share in Japan
Inbound consumption emerged a major focal point in the Japanese market in 2015, but the
focus of equity markets has now turned to the following four themes. Before discussing
these in detail, we would like to recap the current situation in the Japanese market. We
believe the Japanese cosmetics market grew by around 2% YoY in 2015. Two main
factors driving growth include (1) progress in trade-up fueled by an uplift in Japanese
consumer economic sentiment, and (2) increased purchases by overseas visitors to Japan.
Inbound demand, which accounted for just over 2% of the overall market in 2014, grew
nearly 2x in 2015 to around 4%. Based on the situation in other countries, we see a
likelihood of the ratio rising to at least high single-digits over the foreseeable future. Focus
on inbound demand will probably remain intact for the time being.
Figure 16: Domestic cosmetics market trend (sales value,
in local-currency terms)
Figure 17: Monthly cosmetics sales (value basis)
0
200
400
600
800
1,000
1,200
1,400
1,600
95 96 97 98 99 00 01 02 03 04 05 06 07 08 09 10 11 12 13 14
(bn Yen)Hair care Skincare Make-up Other
-15%
-10%
-5%
0%
5%
10%
15%
20%
100
105
110
115
120
125
130
135
140 Monthly shipment (3-month moving avg, lhs)
yoy (3-month moving avg, rhs)
(JPY bn)
Source: METI Source: METI
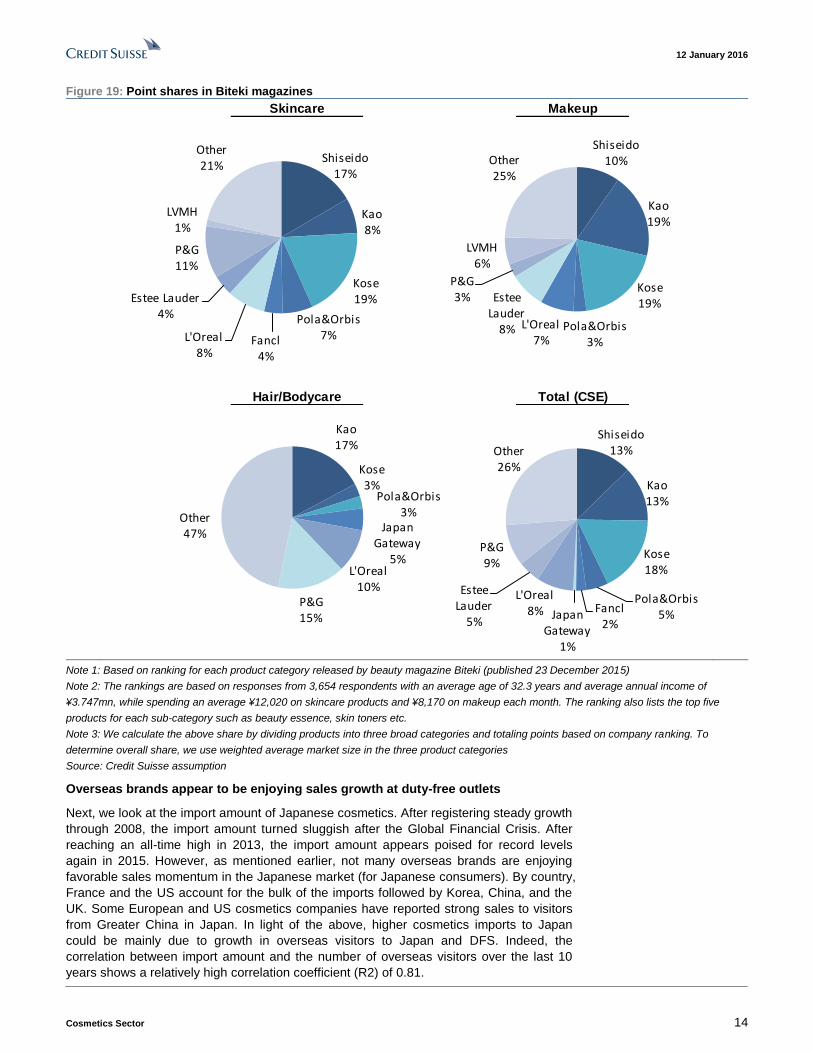
Changing tastes of Japanese consumers is also a key factor in Japan for obvious reasons.
Market conditions in the skincare category have turned relatively favorable, driven by the
recent boom in skin whitening products. Japanese cosmetics makers enjoy a relatively
strong sales momentum in Japan in this category due to their prominence over the
European and US makers from the outset. We refer to points earned by businesses (our
estimates) based on beauty magazine Biteki’s ranking for best cosmetics to back our view
with quantitative data. The exercise is purely for assessing Japanese consumers and is
not related to the effects from inbound demand.
Kose was ranked at the top with 18% in 2015 (+1ppt vs. 2014). The result also appears
reasonable looking at the sales trends for companies. Kose’s skin toner Cosme Decorte
Moisture Liposome is highly rated among new products. Shiseido was ranked No. 2 with
13% market share, up substantially from 8% in 2014. Shiseido’s HAKU brand is apparently
performing well in the skin toner and beauty essence category. Kao came in closely
behind Shiseido at No. 3, boosted by a steady strong performance in makeup products.
Pola Orbis jumped from 2% in 2014 to 5% in 2015, with the newly launched BA doing
particularly well. All four major cosmetics makers gained market share YoY in 2015.
Interestingly, Kose has registered the largest market share gains compared with the
earliest available data (2011).
Among overseas brands, P&G slightly raised its market share to 9%, with its SK-II
commanding a loyal user base. However, both L’Oreal (8%) and Estee Lauder (5%) lost
market share.

12 January 2016
Cosmetics Sector 13
At present, we see little that could alter this trend. Kao has already announced
restructuring of its cosmetics business in 2H 2015. In our view, catalysts for Kao will
probably be limited to the timing when restructuring starts to affect market conditions.
Figure 18: Scores of cosmetics companies in Biteki’s best cosmetics rankings (CS assumptions)
2012 20132011
2014 2015
Shiseido12%
Kao16%
Kose9%
Pola&Orbis
4%
Fancl3%
L'Oreal10%
Estee Lauder
8%
P&G8%
Other 30%
Shiseido13%
Kao18%
Kose7%
Pola&Orbis
3%
Fancl6%Japan
Gateway2%
L'Oreal8%
Estee Lauder
10%
P&G5%
Other 28%
Shiseido15%
Kao16%
Kose10%
Pola&Orbis2%
Fancl4%Japan
Gateway2%
L'Oreal10%
Estee Lauder
7%
P&G4%
Other 30%
Shiseido8%
Kao11%
Kose17%
Pola&Orbis2%Fancl
3%Japan
Gateway3%
L'Oreal11%
Estee Lauder
9%
P&G8%
Other 28%
Shiseido13%
Kao13%
Kose18%
Pola&Orbis5%
Fancl2%
Japan Gateway
1%
L'Oreal8%
Estee Lauder
5%
P&G9%
Other 26%
Source: Credit Suisse assumption
12 January 2016
Cosmetics Sector 14
Figure 19: Point shares in Biteki magazines
Skincare Makeup
Hair/Bodycare Total (CSE)
Shiseido17%
Kao8%
Kose19%
Pola&Orbis7%Fancl
4%
L'Oreal8%
Estee Lauder4%
P&G11%
LVMH1%
Other 21%
Shiseido10%
Kao19%
Kose19%
Pola&Orbis3%
L'Oreal7%
Estee Lauder
8%
P&G3%
LVMH6%
Other 25%
Kao17%
Kose3%
Pola&Orbis3%
Japan Gateway
5%L'Oreal
10%P&G15%
Other 47%
Shiseido13%
Kao13%
Kose18%
Pola&Orbis5%
Fancl2%
Japan Gateway
1%
L'Oreal8%
Estee Lauder
5%
P&G9%
Other 26%
Note 1: Based on ranking for each product category released by beauty magazine Biteki (published 23 December 2015)
Note 2: The rankings are based on responses from 3,654 respondents with an average age of 32.3 years and average annual income of
¥3.747mn, while spending an average ¥12,020 on skincare products and ¥8,170 on makeup each month. The ranking also lists the top five
products for each sub-category such as beauty essence, skin toners etc.
Note 3: We calculate the above share by dividing products into three broad categories and totaling points based on company ranking. To
determine overall share, we use weighted average market size in the three product categories
Source: Credit Suisse assumption
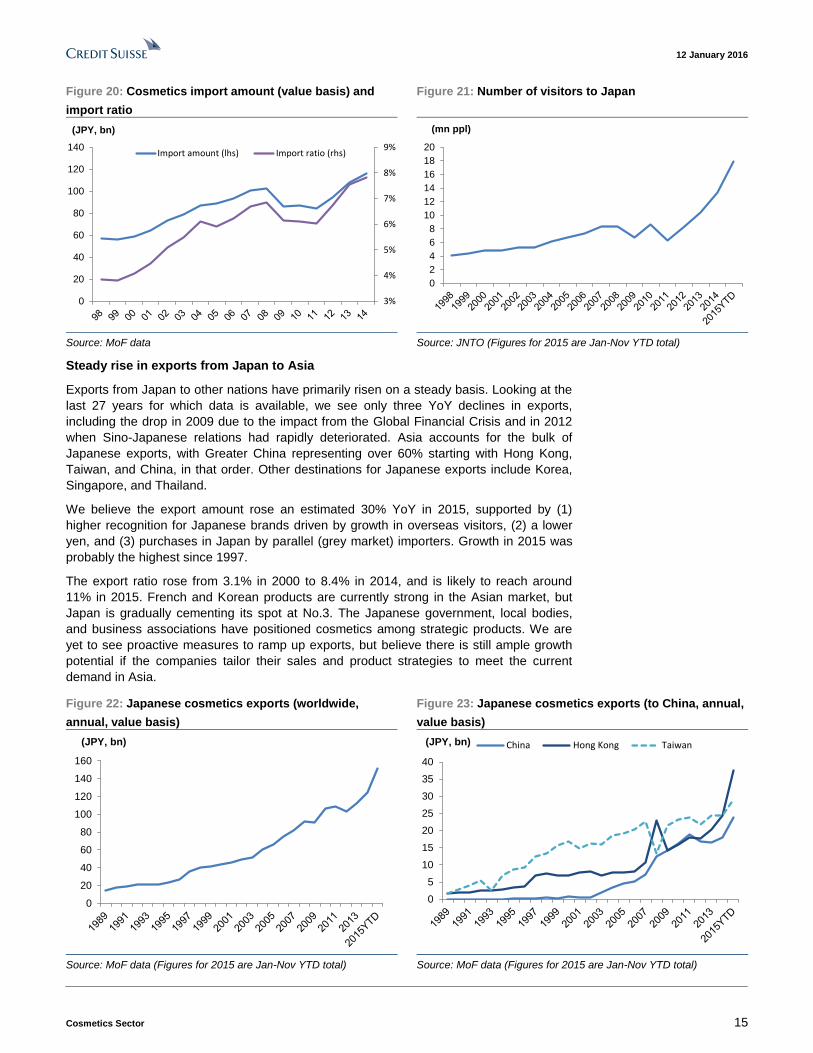
Overseas brands appear to be enjoying sales growth at duty-free outlets
Next, we look at the import amount of Japanese cosmetics. After registering steady growth
through 2008, the import amount turned sluggish after the Global Financial Crisis. After
reaching an all-time high in 2013, the import amount appears poised for record levels
again in 2015. However, as mentioned earlier, not many overseas brands are enjoying
favorable sales momentum in the Japanese market (for Japanese consumers). By country,
France and the US account for the bulk of the imports followed by Korea, China, and the
UK. Some European and US cosmetics companies have reported strong sales to visitors
from Greater China in Japan. In light of the above, higher cosmetics imports to Japan
could be mainly due to growth in overseas visitors to Japan and DFS. Indeed, the
correlation between import amount and the number of overseas visitors over the last 10
years shows a relatively high correlation coefficient (R2) of 0.81.
12 January 2016
Cosmetics Sector 15
Figure 20: Cosmetics import amount (value basis) and
import ratio
Figure 21: Number of visitors to Japan
3%
4%
5%
6%
7%
8%
9%
0
20
40
60
80
100
120
140
(JPY, bn)
Import amount (lhs) Import ratio (rhs)
0
2
4
6
8
10
12
14
16
18
20
(mn ppl)
Source: MoF data Source: JNTO (Figures for 2015 are Jan-Nov YTD total)
Steady rise in exports from Japan to Asia
Exports from Japan to other nations have primarily risen on a steady basis. Looking at the
last 27 years for which data is available, we see only three YoY declines in exports,
including the drop in 2009 due to the impact from the Global Financial Crisis and in 2012
when Sino-Japanese relations had rapidly deteriorated. Asia accounts for the bulk of
Japanese exports, with Greater China representing over 60% starting with Hong Kong,
Taiwan, and China, in that order. Other destinations for Japanese exports include Korea,
Singapore, and Thailand.
We believe the export amount rose an estimated 30% YoY in 2015, supported by (1)
higher recognition for Japanese brands driven by growth in overseas visitors, (2) a lower
yen, and (3) purchases in Japan by parallel (grey market) importers. Growth in 2015 was
probably the highest since 1997.
The export ratio rose from 3.1% in 2000 to 8.4% in 2014, and is likely to reach around
11% in 2015. French and Korean products are currently strong in the Asian market, but
Japan is gradually cementing its spot at No.3. The Japanese government, local bodies,
and business associations have positioned cosmetics among strategic products. We are
yet to see proactive measures to ramp up exports, but believe there is still ample growth
potential if the companies tailor their sales and product strategies to meet the current
demand in Asia.
Figure 22: Japanese cosmetics exports (worldwide,
annual, value basis)
Figure 23: Japanese cosmetics exports (to China, annual,
value basis)
0
20
40
60
80
100
120
140
160
(JPY, bn)
0
5
10
15
20
25
30
35
40
(JPY, bn) China Hong Kong Taiwan
Source: MoF data (Figures for 2015 are Jan-Nov YTD total) Source: MoF data (Figures for 2015 are Jan-Nov YTD total)

12 January 2016
Cosmetics Sector 16
Figure 24: Japanese cosmetics exports (worldwide,
monthly, value basis)
Figure 25: Japanese cosmetics exports (to China,
monthly, value basis)
5
7
9
11
13
15
17
19
(JPY bn)
0.0
1.0
2.0
3.0
4.0
5.0
6.0
(JPY bn)China Hong Kong Taiwan
Source: MoF data Source: MoF data
Figure 26: Export ratio versus value of sales in Japanese
market (FY basis)
Figure 27: Export ratio versus value of sales in Japanese
market (monthly basis)
0%
1%
2%
3%
4%
5%
6%
7%
8%
9%
5%
6%
7%
8%
9%
10%
11%
12%
13%
14%
Note: Trade statistics data divided by METI cosmetics sales statistics
data
Source: MoF data, METI data
Note: Trade statistics data divided by METI cosmetics sales statistics
data
Source: MoF data, METI data
Visit to a downtown duty-free shop in Korea; seeking
hints for Japan in 2016
Sales expansion in Korea to Chinese tourists, particularly at downtown DFS, is common
knowledge. Japan introduced consumption-tax exemption for overseas visitors in October
2014. Japan, too, plans to roll out new downtown DFS from 2016. In this section, we
examine whether Japan can derive similar benefits to Korea. We would like to provide
feedback on our visit to Korea in December 2015 before heading into specifics.
Lotte DFS, located in Myeongdong, a tourist hotspot in downtown Seoul, boasts total floor
area of more than 2,000 tsubo (roughly 6,600 square meters) and is divided into three
floors. The ninth floor is mainly cosmetics; with more than 70 brands, this is also the
largest cosmetics sales space in Korea. The 10th and 11
th floors showcase globally
renowned brands of jewelry and watches. Promenading through the floors over several
hours on a weekend morning in early-December, we noted a disproportionately large
number of tourists, mostly from Greater China, on the ninth floor and in front of the Korean
cosmetics products counter.
12 January 2016
Cosmetics Sector 17
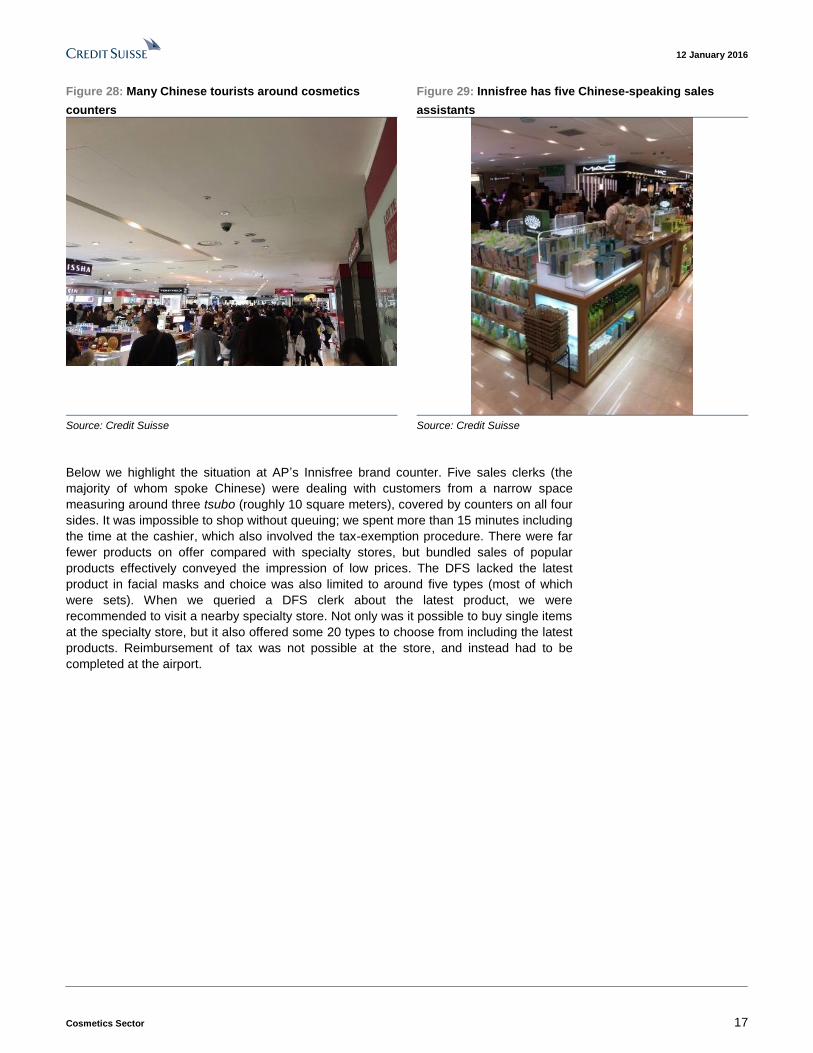
Figure 28: Many Chinese tourists around cosmetics
counters
Figure 29: Innisfree has five Chinese-speaking sales
assistants
Source: Credit Suisse Source: Credit Suisse
Below we highlight the situation at AP’s Innisfree brand counter. Five sales clerks (the
majority of whom spoke Chinese) were dealing with customers from a narrow space
measuring around three tsubo (roughly 10 square meters), covered by counters on all four
sides. It was impossible to shop without queuing; we spent more than 15 minutes including
the time at the cashier, which also involved the tax-exemption procedure. There were far
fewer products on offer compared with specialty stores, but bundled sales of popular
products effectively conveyed the impression of low prices. The DFS lacked the latest
product in facial masks and choice was also limited to around five types (most of which
were sets). When we queried a DFS clerk about the latest product, we were
recommended to visit a nearby specialty store. Not only was it possible to buy single items
at the specialty store, but it also offered some 20 types to choose from including the latest
products. Reimbursement of tax was not possible at the store, and instead had to be
completed at the airport.

12 January 2016
Cosmetics Sector 18
Figure 30: At downtown DFS there are no new facial
masks and only around five types; mostly sells sets
containing several masks
Figure 31: To purchase new products customers have to
move from the downtown DFS to a nearby specialty store
Source: Credit Suisse Source: Credit Suisse
Figure 32: At the specialty store, customers can purchase
masks singly; there are around 20 types, including new
products; tax can be refunded at airports
Figure 33: An airport DFS in Korea has the same product
line-up as its urban counterpart, and little customer traffic
Source: Credit Suisse Source: Credit Suisse

12 January 2016
Cosmetics Sector 19
Case for leveraging both downtown DFS and e-
commerce
The two leading Korean names represent an ideal benchmark for Japanese makers
We highlight AmorePacific (AP) and LG H&H, the leading Korean makers of cosmetics
and daily necessities, as companies Japanese businesses should focus on from the
standpoint of downtown DFS operations and exports to China (including cross-border e-
commerce).
AP hit a turning point in 2014 as its OP rose 52% YoY and its OPM improved 2.6ppt to
14.6%. Our medium-term outlook (CY15–17) calls for 32% annual OP growth. In addition
to growth in inbound tourists, we look for sales expansion in Travel Retail (domestic
downtown and overseas DFS) and higher exports to China to drive earnings growth.
Tourist volume is currently on a rebound after falling temporarily due to the impact from
MERS in 2015. The company’s China business is reportedly enjoying strong sales in
brands such as Innisfree, Sulwhasoo, and Laneige. Boosted by economies of scale and
quick rollout of new brands, OPM at the China business is expected to improve from 3% in
2013 to 14% in 2015.
We anticipate a 36% YoY increase in OP at LG H&H in 2015, and our medium-term
outlook (CY15–17) calls for 23% annual OP growth. Like AP, LG H&H is enjoying robust
cosmetics sales, and the company is gradually expanding sales of daily necessities in the
Chinese market.
Figure 34: AmorePacific – OP and OP margin Figure 35: LG H&H – OP and OP margin
0
5
10
15
20
0
200
400
600
800
1,000
1,200
1,400
06 07 08 09 10 11 12 13 14 15E 16E 17E
(%)(KRW bn)
Operating profits OP margin (RHS)
0
2
4
6
8
10
12
14
16
0
200
400
600
800
1,000
1,200
01 02 03 04 05 06 07 08 09 10 11 12 13 14 15E16E17E
(%)(KRW bn)
Operating profits OP margin (RHS)
Source: Company data, Credit Suisse estimates Source: Company data, Credit Suisse estimates

12 January 2016
Cosmetics Sector 20
Figure 36: DFS weighting among AP and LG H&H's sales,
OP
Figure 37: AP's China sales
Source: Company data, Credit Suisse estimates Source: Company data, Credit Suisse estimates
Figure 38: AP's China business sales, margins by brand Figure 39: LG H&H's cosmetics sales
0
200
400
600
800
1,000
1,200
2010 2011 2012 2013 2014 2015 2016
Su:m
Whoo
(Wbn)
Source: Company data, Credit Suisse estimates Source: Company data, Credit Suisse estimates
Korean DFS margins higher, leading to better channel mix
According to A-Hyung Cho, our analyst for Korea, cosmetics makers are aware of the
need for a difference in product category and price range to prevent cannibalization
between downtown duty-free shops (D-DFS) and department stores/specialty stores. Our
analyst estimates that for high-end cosmetics DFS enjoy around 15ppt higher OPM than
other existing sales channels (for example, OPM at department stores is 10–15%, but 25–
30% at DFS). In-store prices of Korean brands vary depending on channel promotions,
discounts and other factors, and they tend to be lower at DFS by around 12% (overseas
brands are lower by more than 20%). On the other hand, DFS have a unique advantage in
terms of a low SG&A burden mainly due to (1) high sales turnaround with fewer store
assistants (no skincare counseling), and (2) higher management cost efficiency due to a
narrower product range.
Dawn of downtown duty-free shops (D-DFS) in Japan in 2016
From 2016, we expect to see the launch of airport-type DFS in city centers or D-DFS
(exempt from import, alcohol/tobacco, and consumption taxes). Some observers may see
little advantage for Japanese cosmetics makers, considering many stores are already
exempt from consumption tax. However, consumers stand to gain from lower prices by
shopping at D-DFS. Higher traction for Japanese D-DFS among tourists could lead to a
situation similar to that in Korea through 2H 2016, in our view. We believe cosmetics
makers stand to gain from a potential improvement in channel mix.

12 January 2016
Cosmetics Sector 21
Figure 40: Downtown DFS' tax-exempt range and usage flow
ConsumptionImport
dutyLiquor Tobacco
○ ○ ○ ○DFS in airport DFS in airports ○ ○ ○ ○
Export goods sales
locations
(exempt from
consumption tax)
Downtown DFS ○ × × ×Foreigners who leave Japan
(including Japanese persons
resident overseas)
Type Example
Type of taxPersons eligible for tax
exemption
Japan Duty Free GINZA (airport-type DFS) Foreigners and Japanese who
leave Japan
① Purchase goods at
downtown DFS
② Receive goods
at Narita/Haneda airport
③ Leave for
destination overseas
Source: Hanbai Kakushin (April 2015 issue)
Present situation in Japan’s airport-type DFS
Japan’s airport-type DFS, in general, offer lower sales prices (excluding some luxury
brands) than regular retailers (ex-consumption tax). DFS offer around 10–30% lower
prices. Many brands are effectively offering discounts on single items, which are normally
not discounted, dubbing these as limited time offers at airport DFS. Discount methods
include (1) bundled sales and (2) same-price offers for larger volume.
Figure 41: Main products and duty-free prices at main Japanese brands of airport DFS
Company Brands
Difference between DFS duty-
free price and general retail price
in Japan (excluding
consumption tax)
Pola Orbis HD Three, Jurlique 10–20% cheaper
Fancl Fancl Prices basically the same
Kao Lunasol, Impress, RMK, Sofina, Est10–20% cheaper with the
exception of some luxury products
Shiseido
Elixir, White Lucent, Future Solution LX, Vital-
Perfection, Benefiance, Ultimune, The Ginza,
Haku, Maquillage, Anessa, cle de peau Beaute
Prices basically the same
KoseSekkisei, Infinity, Jilll Stuart, Cosme Decorte,
Anna Sui, Addiction
10–30% cheaper apart from
Cosme Decorte
Source: Credit Suisse
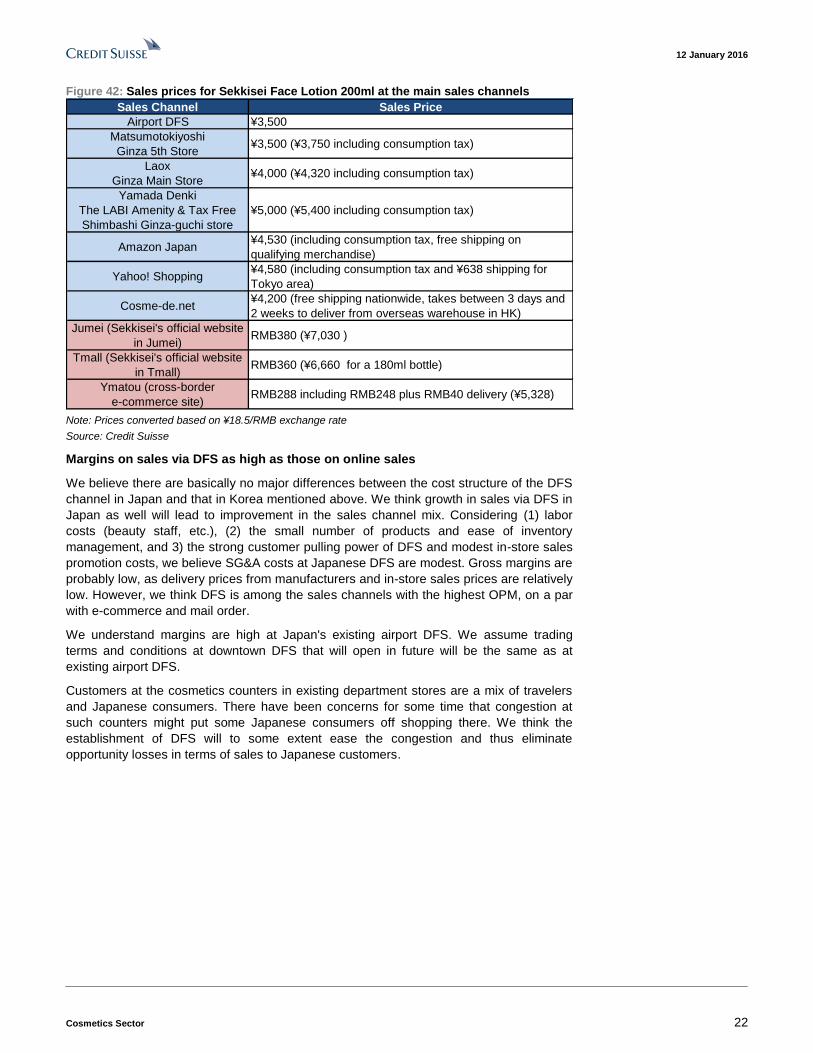
We take the example of Kose’s Sekkisei for a comparison of sales prices. Sekkisei skin
toner (200ml), at its lowest, is priced at ¥3,500 at airport DFS, on a par with prices offered
by large drugstores in Tokyo. This is more than 20% cheaper than the price offered by
Japan’s leading e-commerce operator. This price gap may be attractive for some
consumers and could be a strong incentive for them to buy at D-DFS.
12 January 2016
Cosmetics Sector 22
Figure 42: Sales prices for Sekkisei Face Lotion 200ml at the main sales channels
Sales Channel Sales Price
Airport DFS ¥3,500
Matsumotokiyoshi
Ginza 5th Store¥3,500 (¥3,750 including consumption tax)
Laox
Ginza Main Store¥4,000 (¥4,320 including consumption tax)
Yamada Denki
The LABI Amenity & Tax Free
Shimbashi Ginza-guchi store
¥5,000 (¥5,400 including consumption tax)
Amazon Japan¥4,530 (including consumption tax, free shipping on
qualifying merchandise)
Yahoo! Shopping¥4,580 (including consumption tax and ¥638 shipping for
Tokyo area)
Cosme-de.net¥4,200 (free shipping nationwide, takes between 3 days and
2 weeks to deliver from overseas warehouse in HK)
Jumei (Sekkisei's official website
in Jumei)RMB380 (¥7,030 )
Tmall (Sekkisei's official website
in Tmall)RMB360 (¥6,660 for a 180ml bottle)
Ymatou (cross-border
e-commerce site)RMB288 including RMB248 plus RMB40 delivery (¥5,328)
Note: Prices converted based on ¥18.5/RMB exchange rate
Source: Credit Suisse
Margins on sales via DFS as high as those on online sales
We believe there are basically no major differences between the cost structure of the DFS
channel in Japan and that in Korea mentioned above. We think growth in sales via DFS in
Japan as well will lead to improvement in the sales channel mix. Considering (1) labor
costs (beauty staff, etc.), (2) the small number of products and ease of inventory
management, and 3) the strong customer pulling power of DFS and modest in-store sales
promotion costs, we believe SG&A costs at Japanese DFS are modest. Gross margins are
probably low, as delivery prices from manufacturers and in-store sales prices are relatively
low. However, we think DFS is among the sales channels with the highest OPM, on a par
with e-commerce and mail order.
We understand margins are high at Japan's existing airport DFS. We assume trading
terms and conditions at downtown DFS that will open in future will be the same as at
existing airport DFS.
Customers at the cosmetics counters in existing department stores are a mix of travelers
and Japanese consumers. There have been concerns for some time that congestion at
such counters might put some Japanese consumers off shopping there. We think the
establishment of DFS will to some extent ease the congestion and thus eliminate
opportunity losses in terms of sales to Japanese customers.

12 January 2016
Cosmetics Sector 23
Figure 43: Cosmetics industry margins by sales channel (2014, Credit Suisse estimates
based on 2014 data)
a % of Sales
revenue
Average EC/mail orderDuty Free
StoreDrugstore
Beauty
Specialty
Store
Dept store GMS
Gross Profit 73 68 62 72 79 83 70
Personnel 20 15 15 16 30 35 17
Sales promotion 20 10 10 22 17 18 28
Advertising 6 7 3 7 5 3 7
Packing and freight 4 5 3 4 4 4 4
Other 11 12 11 11 11 11 11
Operating Profit 12 19 20 13 13 12 5 Source: Credit Suisse estimates
Whether cross-border e-commerce will make a major contribution to profits is
unknown, but we think it has substantial growth potential
We expect China's cross-border e-commerce to grow over the longer term. Figure 43
shows cosmetics margins by sales channel. Margins on online sales are high. The need to
protect their brand image and provide advice at the point of sales means online cosmetics
sales present problems for manufacturers of high-class cosmetics (although online sales
of relatively low-priced high-grade cosmetics have increased). In China, sales via general
merchandisers and department stores have been struggling due to structural reasons. The
number of companies that have switched to growing sales channels (online sales, DFS)
has increased, and we think this trend will continue. The ideal sales strategy at present is
to 1) sell high-price bracket cosmetics mainly via certain luxury department stores and
DFS, and 2) make extensive use of online sales for low- and middle-priced products. As
we noted above, online sales and sales via DFS carry high margins, and we expect
increased leverage of these channels to lead to mix improvement.
We believe cosmetics made by Japanese manufacturers, aside from locally produced
products sold via traditional retail channels, are mainly purchased as follows: (1) products
manufactured in China are sold via ordinary online sales (sold to agents, sold indirectly
online, delivered directly to online companies), (2) manufacturers sell made-in-Japan
products via ordinary online sales (using agents or selling via Chinese subsidiaries), (3)
manufacturers sell made-in-Japan products via cross-border e-commerce, (4) parallel
(grey market) traders purchase products in the Japanese market and sell them mainly via
online sales in China (some trades are between individuals, products being sent by post to
acquaintances in China), and (5) ordinary consumers purchase made-in-Japan products
for their own use in the Japanese market. As locally manufactured products, especially
low- and mid-priced items, are generally less popular than they were, we see little growth
potential in option 1 above. In option 2 above, costs are high (VAT, import duty, cost of
obtaining sales approvals), making it difficult to eliminate the feeling that the products are
overpriced. Option 4 above is the most common form of online sales. However, we are
starting to see cases where companies have moved to correct disparities between
domestic and overseas prices, lowering online sales prices by leveraging cross-border e-
commerce and effectively raising prices in the Japanese market. It is therefore highly
uncertain whether option 4 will remain the commonest form of online sales.
We think in the medium term, purchasing by parallel (grey market) traders and consumers
via retail outlets in Japan will likely decline, and sales mainly via cross-border e-commerce
will increase. Specifically, we think that if the destination for shipments of cosmetic
products shifts from department stores and drugstores in Japan to online sales in China,
the weighting of online sales, which carry high margins, as sales as a whole will likely
increase. As cosmetics are shipped to China mainly via container transportation, we do
not anticipate any major changes in the cost structure shown in Figure 43.
12 January 2016
Cosmetics Sector 24
Basic structure and current state of cross-border e-commerce
A special feature of cross-border e-commerce is that a lower tax rate than import duty and
VAT, namely personal postal articles tax, legally applies. There is also a tax break, with a
tax exemption when the amount of tax is below a certain level (RMB50). VAT is 17%,
while import duty varies by product category (2% on skincare products). In principle,
personal postal articles tax is 10%. We gather the consensus view is that the government
is aiming for growth in Chinese e-commerce and that there is little likelihood of a
substantial increase in personal postal articles tax. In addition, as many products
purchased online are priced at RMB500 or less, many are tax free. Products are stored in
bonded warehouses in free trade zones. They are shipped, passing through simple
customs formalities in response to orders from consumers. In addition to tax breaks, there
is also the advantage that various costs such as the cost of hygiene inspections to obtain
approval to sell products in China are modest.
According to manager comments about China cross-border e-commerce in the 28 October
2015 Nikkei Sangyo Shimbun, the number of Hai Tao shoppers, who frequently buy
products they like from overseas online retailers, has reached 40mn among China's
roughly 400mn internet users. We gather that many Hai Tao shoppers are women aged
25–32 with monthly incomes exceeding RMB4,000 (around ¥80,000). Hai Tao shoppers
who are unsatisfied by existing online sales services examine products very closely but
are prepared to pay if they think they are good. The company said that if it uses cross-
border e-commerce arrangements, it will be able to supply made-in-Japan products to
consumers at prices around 20% higher than actual prices in Japan.
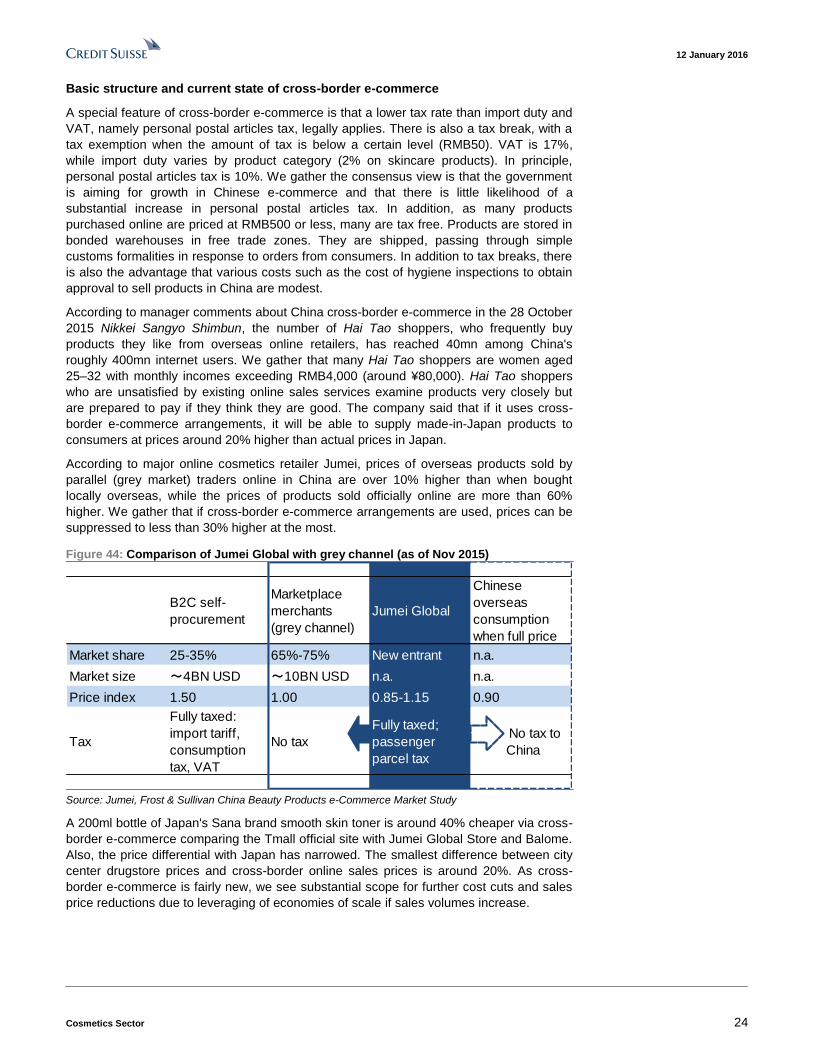
According to major online cosmetics retailer Jumei, prices of overseas products sold by
parallel (grey market) traders online in China are over 10% higher than when bought
locally overseas, while the prices of products sold officially online are more than 60%
higher. We gather that if cross-border e-commerce arrangements are used, prices can be
suppressed to less than 30% higher at the most.
Figure 44: Comparison of Jumei Global with grey channel (as of Nov 2015)
B2C self-
procurement
Marketplace
merchants
(grey channel)
Jumei Global
Chinese
overseas
consumption
when full price
Market share 25-35% 65%-75% New entrant n.a.
Market size ~4BN USD ~10BN USD n.a. n.a.
Price index 1.50 1.00 0.85-1.15 0.90
Tax
Fully taxed:
import tariff,
consumption
tax, VAT
No tax
Fully taxed;
passenger
parcel tax
No tax to
China
Source: Jumei, Frost & Sullivan China Beauty Products e-Commerce Market Study
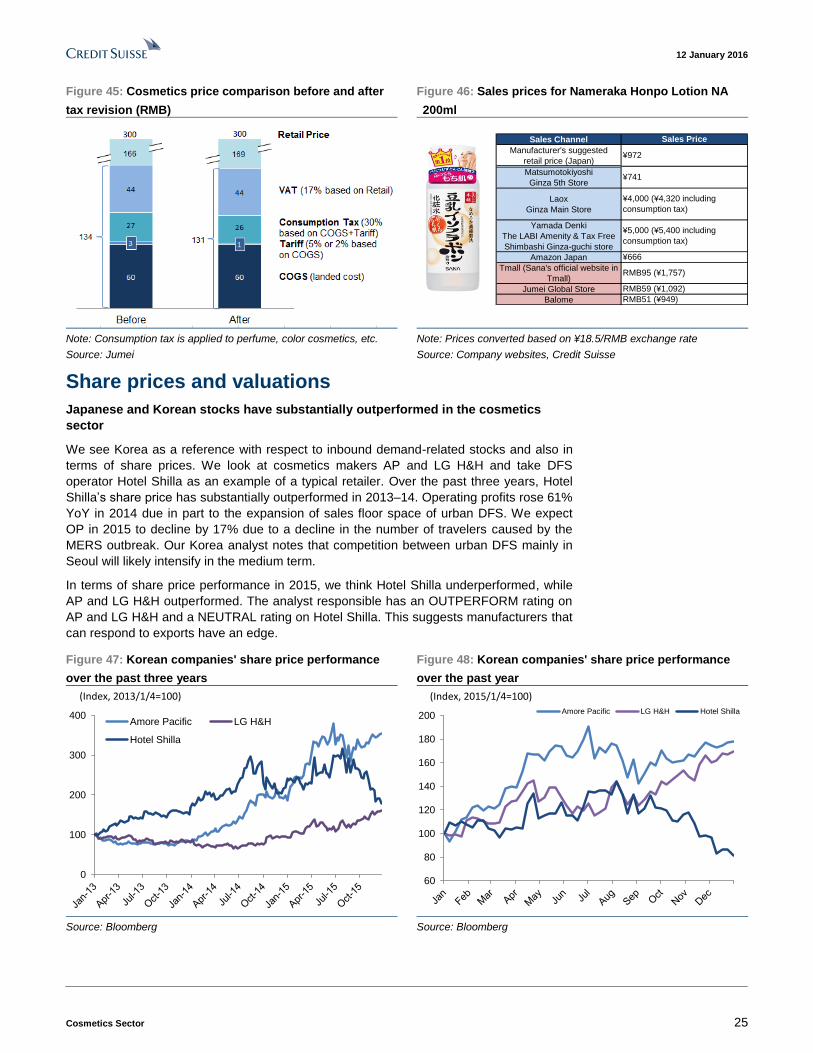
A 200ml bottle of Japan's Sana brand smooth skin toner is around 40% cheaper via cross-
border e-commerce comparing the Tmall official site with Jumei Global Store and Balome.
Also, the price differential with Japan has narrowed. The smallest difference between city
center drugstore prices and cross-border online sales prices is around 20%. As cross-
border e-commerce is fairly new, we see substantial scope for further cost cuts and sales
price reductions due to leveraging of economies of scale if sales volumes increase.
12 January 2016
Cosmetics Sector 25
Figure 45: Cosmetics price comparison before and after
tax revision (RMB)
Figure 46: Sales prices for Nameraka Honpo Lotion NA
200ml
Sales Channel
Manufacturer's suggested
retail price (Japan)
Matsumotokiyoshi
Ginza 5th Store
Laox
Ginza Main Store
Yamada Denki
The LABI Amenity & Tax Free
Shimbashi Ginza-guchi store
Amazon Japan
Tmall (Sana's official website in
Tmall)
Jumei Global Store
Balome
RMB95 (¥1,757)
RMB59 (¥1,092)
RMB51 (¥949)
Sales Price
¥972
¥741
¥4,000 (¥4,320 including
consumption tax)
¥5,000 (¥5,400 including
consumption tax)
¥666
Note: Consumption tax is applied to perfume, color cosmetics, etc.
Source: Jumei
Note: Prices converted based on ¥18.5/RMB exchange rate
Source: Company websites, Credit Suisse
Share prices and valuations
Japanese and Korean stocks have substantially outperformed in the cosmetics
sector
We see Korea as a reference with respect to inbound demand-related stocks and also in
terms of share prices. We look at cosmetics makers AP and LG H&H and take DFS
operator Hotel Shilla as an example of a typical retailer. Over the past three years, Hotel
Shilla’s share price has substantially outperformed in 2013–14. Operating profits rose 61%
YoY in 2014 due in part to the expansion of sales floor space of urban DFS. We expect
OP in 2015 to decline by 17% due to a decline in the number of travelers caused by the
MERS outbreak. Our Korea analyst notes that competition between urban DFS mainly in
Seoul will likely intensify in the medium term.
In terms of share price performance in 2015, we think Hotel Shilla underperformed, while
AP and LG H&H outperformed. The analyst responsible has an OUTPERFORM rating on
AP and LG H&H and a NEUTRAL rating on Hotel Shilla. This suggests manufacturers that
can respond to exports have an edge.
Figure 47: Korean companies' share price performance
over the past three years
Figure 48: Korean companies' share price performance
over the past year
0
100
200
300
400Amore Pacific LG H&H
Hotel Shilla
(Index, 2013/1/4=100)
60
80
100
120
140
160
180
200Amore Pacific LG H&H Hotel Shilla
(Index, 2015/1/4=100)
Source: Bloomberg Source: Bloomberg

12 January 2016
Cosmetics Sector 26
Comparing the share prices of Japan's three major cosmetics makers and three main
retailers, we find that over the past year and three years, share price performance of Kose,
Pola Orbis, and Matsumotokiyoshi has been relatively favorable, while that of Shiseido
and two department store operators has been less so. Development of DFS in Japan has
yet to begin in earnest. However, in the medium term, if the situation resembles that in
Korea, in terms of share prices, we think manufacturers might have an edge over retailers.
In the global cosmetics market as a whole over the past year and three years Kose has
been the largest outperformer followed by AP. Japanese and Korean companies have
generally beaten European and US companies. Share price multiples also reflect
valuations of companies able to benefit from growth in Asia.
Figure 49: Japanese companies' share price performance
over the past three years
Figure 50: Japanese companies' share price performance
over the past year
0
100
200
300
400
500
600
700
800Shiseido
Kose
Pola Orbis HD
J-Front
Matsukiyo HD
Mitsukoshi Isetan
(Index, 2013/1/4=100)
80
130
180
230
280 Shiseido
Kose
Pola Orbis HD
J-Front
Matsukiyo HD
Mitsukoshi Isetan
(Index, 2015/1/4=100)
Source: Bloomberg Source: Bloomberg
Figure 51: Cosmetics companies' share price
performance over the past three years
Figure 52: Cosmetics companies' share price
performance over the past year
0
100
200
300
400
500
600
700
800Shiseido
Kose
Pola Orbis HD
Amore Pacific
LG H&H
L'Oreal
Estee Lauder
Procter & Gamble
(Index, 2013/1/4=100)
80
130
180
230
280 Shiseido
Kose
Pola Orbis HD
Amore Pacific
LG H&H
L'Oreal
Estee Lauder
Procter & Gamble
(Index, 2015/1/4=100)
Source: Bloomberg Source: Bloomberg

12 January 2016
Cosmetics Sector 27
Figure 53: Cosmetics companies' EV/EBITDA
0
5
10
15
20
25
30
Shiseido Kose
Pola Orbis HD Amore Pacific
LG H&H L'Oreal
Estee Lauder Procter & Gamble
(EV/EBITDA, x)
Source: Bloomberg
Figure 54: Cosmetics companies' P/Es
10
20
30
40
50
60
70 Shiseido Kose
Pola Orbis HD Amore Pacific
LG H&H L'Oreal
Estee Lauder Procter & Gamble
(PER, x)
Source: Bloomberg
12 January 2016
Cosmetics Sector 28
Japan's main cosmetics companies
Shiseido (4911, UNDERPERFORM, TP ¥2,250)
Japan's largest cosmetics maker. Earnings in Japan have been picking up due to the
introduction of a brand management system, cost structure reforms, and growth in the
number of visitors to Japan from 2015. The company will start restructuring its business in
China in earnest in 2016, and we think that progress here will be the main focal point for
now.
Kao (4452, OUTPERFORM, TP ¥7,300)
Japan's second-largest cosmetics maker. While many companies are benefiting from
growth in inbound demand, Kao's skincare business is relatively weak. Sales of color
cosmetics in the Japanese market (to both Japanese customers and visitors to Japan)
have been firm, but we await a rebound in the lucrative skincare business. The company
plans to start restructuring its cosmetics business in 2016.
Kose (4922, OUTPERFORM, TP ¥14,500)
Most would agree that Kose is the most energetic cosmetics maker in the Japanese
market. Sales to both Japanese customers and visitors to Japan have increased. Kose is
restructuring its business in China, shifting gradually to a business model focused on
exporting made-in-Japan products. The company is due to launch sales of Cosme Decorte
products in North America in 2016. We think the main focal point for Kose in 2016 will be
the timing with which sales via new channels such as downtown DFS and cross-border e-
commerce contribute to earnings.
Pola Orbis Holdings (4927, OUTPERFORM, TP ¥9,500)
In addition to its popularity among Japanese customers, the high-price bracket POLA
brand has also started to become popular among some consumers in China. Pola Orbis is
a specialty cosmetics maker that started to feel the effects of growth in inbound demand
relatively late. In 2016, the company is due to 1) restructure costs for struggling overseas
brands, and 2) introduce changes in the Pola Lady system in Japan. We intend to focus on
the effects of these moves.
Rohto Pharmaceutical (4527, NEUTRAL, TP ¥2,200)
Rohto Pharmaceutical is strong in low- and mid-priced skincare products sold via
drugstores. Sales in Japan struggled in 2014, but new products sold well through 2H 2015,
putting sales on a recovery trend. In Greater China, the company commands the second-
highest share of the men's skincare product market. Earnings in Japan tend to be volatile
depending on new products and the weather. We intend to focus on whether the company
can maintain stable sales momentum for a second successive year in 2016.

12 January 2016
Cosmetics Sector 29
Fancl (4921, Not Rated)
Fancl makes additive-free cosmetics sold mainly via mail order. It also handles
supplements and health foods. The company has developed business in Greater China
mainly via department stores and has a high profile. Guidance calls for a sharp decline in
profits in FY15 due to substantial promotional spending, and we intend to focus on
whether these efforts have a positive impact from FY16.
Ci:z Holdings (4924, Not Rated)
Ci:z manages the Dr.Ci:Labo brand. It sells its products mainly via mail order. The
company has been strengthening sales via drugstores and department stores. It has also
been making substantial efforts to tap demand from visitors to Japan including entering
fully into cross-border e-commerce.
Noevir Holdings (4928, Not Rated)
Noevir is strong in door-to-door sales and over-the-counter cosmetics. The company sells
Sana brand toner, which also has a high profile in China. It also has a subsidiary that
handles nutritional supplements and functional drinks.

12 January 2016
Cosmetics Sector 30
Companies Mentioned (Price as of 12-Jan-2016)
Alibaba Group Holding Limited (BABA.N, $69.92) Amorepacific Corp (090430.KS, W405,500) Avon Products Inc (AVP.N, $2.64) Ci:z Holdings (4924.T, ¥2,014) Estee Lauder Companies Inc (EL.N, $82.88) Fancl Corporation (4921.T, ¥1,529) Hotel Shilla (008770.KS, W71,400) Isetan Mitsukoshi Holdings (3099.T, ¥1,513) J. Front Retailing (3086.T, ¥1,610) Japan Gateway (Unlisted) Jumei International Holding Limited (JMEI.N, $7.04) KOSE (4922.T, ¥9,660, OUTPERFORM, TP ¥14,500) Kao (4452.T, ¥5,643, OUTPERFORM, TP ¥7,300) L'Oreal (OREP.PA, €148.5) LG Household & Healthcare (051900.KS, W982,000) Lotte Shopping (023530.KS, W230,000) MatsumotoKysh HD (3088.T, ¥5,580) Noevir Holdings (4928.T, ¥3,185) Nu Skin Enter (NUS.N, $32.3) Pola Orbis HD (4927.T, ¥7,360, OUTPERFORM, TP ¥9,500) Procter & Gamble Co. (PG.N, $76.67) Rohto Pharma (4527.T, ¥2,291) Shiseido (4911.T, ¥2,259, UNDERPERFORM, TP ¥2,250) Tmall.com (Unlisted) Unilever (UNc.AS, €37.17)
Disclosure Appendix
Important Global Disclosures
I, Masashi Mori, certify that (1) the views expressed in this report accurately reflect my personal views about all of the subject companies and securities and (2) no part of my compensation was, is or will be directly or indirectly related to the specific recommendations or views expressed in this report.
3-Year Price and Rating History for KOSE (4922.T)
4922.T Closing Price Target Price
Date (¥) (¥) Rating
24-Feb-15 5,750 6,700 O *
03-Apr-15 7,170 8,200
16-Jun-15 8,780 10,200
14-Jul-15 10,650 13,000
19-Nov-15 12,040 14,500
* Asterisk signifies initiation or assumption of coverage.
O U T PERFO RM

12 January 2016
Cosmetics Sector 31
3-Year Price and Rating History for Kao (4452.T)
4452.T Closing Price Target Price
Date (¥) (¥) Rating
05-Feb-13 2,581 2,650 N
03-Apr-13 3,035 2,700
21-May-13 3,445 3,600
29-Jul-13 3,005 3,400
15-Jan-14 3,300 3,500
18-Apr-14 3,653 NR
28-Aug-14 4,470 5,000 O *
13-Jan-15 4,788 5,500
10-Mar-15 5,553 6,000
06-Apr-15 6,088 7,000
04-Sep-15 5,207 6,400
20-Nov-15 6,399 7,300
* Asterisk signifies initiation or assumption of coverage.
N EU T RA L
N O T RA T ED
O U T PERFO RM
3-Year Price and Rating History for Pola Orbis HD (4927.T)
4927.T Closing Price Target Price
Date (¥) (¥) Rating
18-Jan-13 2,571 3,000 O
28-Jan-13 2,730 3,200
01-Mar-13 2,899 3,300
13-May-13 3,670 4,200
10-Jan-14 3,740 4,400
18-Apr-14 3,960 NR
28-Aug-14 4,185 5,000 O *
23-Jan-15 5,020 5,350
06-Apr-15 6,920 8,300
31-Aug-15 7,260 8,200
19-Nov-15 8,260 9,500
* Asterisk signifies initiation or assumption of coverage.
O U T PERFO RM
N O T RA T ED
3-Year Price and Rating History for Shiseido (4911.T)
4911.T Closing Price Target Price
Date (¥) (¥) Rating
03-Apr-13 1,322 1,250 N
13-May-13 1,406 1,430
04-Oct-13 1,669 1,500
20-Nov-13 1,738 1,600
15-Jan-14 1,617 1,700
18-Apr-14 1,830 NR
28-Aug-14 1,956 2,150 N *
13-Jan-15 1,695 1,700
20-Feb-15 1,994 1,690 U
14-Jul-15 2,816 2,250
* Asterisk signifies initiation or assumption of coverage.
N EU T RA L
N O T RA T ED
U N D ERPERFO RM
The analyst(s) responsible for preparing this research report received Compensation that is based upon various factors including Credit Suisse's total revenues, a portion of which are generated by Credit Suisse's investment banking activities
As of December 10, 2012 Analysts’ stock rating are defined as follows:
Outperform (O) : The stock’s total return is expected to outperform the relevant benchmark* over the next 12 months.
Neutral (N) : The stock’s total return is expected to be in line with the relevant benchmark* over the next 12 months.
Underperform (U) : The stock’s total return is expected to underperform the relevant benchmark* over the next 12 months.

12 January 2016
Cosmetics Sector 32
*Relevant benchmark by region: As of 10th December 2012, Japanese ratings are based on a stock’s total return relative to the analyst's coverage universe which consists of all companies covered by the analyst within the relevant sector, with Outperforms representing the most attractive , Neutrals the less attractive, and Underperforms the least attractive investment opportunities. As of 2nd October 2012, U.S. and Canadian as well as European ratings are based on a stock’s total return relative to the analyst's coverage universe which consists of all companies covered by the analyst within the relevant sector, with Outperforms representing the most attractive, Neutrals the less attractive, and Underperforms the least attractive investment opportunities. For Latin American and non -Japan Asia stocks, ratings are based on a stock’s total return relative to the average total return of the relevant country or regional benchmark; prior to 2nd October 2012 U.S. and Canadian ratings were based on (1) a stock’s absolute total return potential to its current share price and (2) the relative attractiveness of a stock’s total return potential within an analyst’s coverage universe. For Australian and New Zealand stocks, the expected total return (ETR) calculation includes 12 -month rolling dividend yield. An Outperform rating is assigned where an ETR is greater than or equal to 7.5%; Underperform where an ETR less than or equal to 5%. A Neutral may be assigned where the ETR is between -5% and 15%. The overlapping rating range allows analysts to assign a rating that puts ETR in the context of associated risks. Prior to 18 May 2015, ETR ranges for Outperform and Underperform ratings did not overlap with Neutral thresholds between 15% and 7.5%, which was in operation from 7 July 2011.
Restricted (R) : In certain circumstances, Credit Suisse policy and/or applicable law and regulations preclude certain types of communications, including an investment recommendation, during the course of Credit Suisse's engagement in an investment banking transaction and in certain other circumstances.
Volatility Indicator [V] : A stock is defined as volatile if the stock price has moved up or down by 20% or more in a month in at least 8 of the past 24 months or the analyst expects significant volatility going forward.
Analysts’ sector weightings are distinct from analysts’ stock ratings and are based on the analyst’s expectations for the fundamentals and/or valuation of the sector* relative to the group’s historic fundamentals and/or valuation:
Overweight : The analyst’s expectation for the sector’s fundamentals and/or valuation is favorable over the next 12 months.
Market Weight : The analyst’s expectation for the sector’s fundamentals and/or valuation is neutral over the next 12 months.
Underweight : The analyst’s expectation for the sector’s fundamentals and/or valuation is cautious over the next 12 months.
*An analyst’s coverage sector consists of all companies covered by the analyst within the relevant sector. An analyst may cover multiple sectors.
Credit Suisse's distribution of stock ratings (and banking clients) is:
Global Ratings Distribution
Rating Versus universe (%) Of which banking clients (%)
Outperform/Buy* 55% (31% banking clients)
Neutral/Hold* 30% (27% banking clients)
Underperform/Sell* 14% (36% banking clients)
Restricted 1%
*For purposes of the NYSE and NASD ratings distribution disclosure requirements, our stock ratings of Outperform, Neutral, and Underperform most closely correspond to Buy, Hold, and Sell, respectively; however, the meanings are not the same, as our stock ratings are determined on a relative basis. (Please refer to definitions above.) An investor's decision to buy or sell a security should be based on investment objectives, current holdings, and other individual factors.
Credit Suisse’s policy is to update research reports as it deems appropriate, based on developments with the subject company, the sector or the market that may have a material impact on the research views or opinions stated herein.
Credit Suisse's policy is only to publish investment research that is impartial, independent, clear, fair and not misleading. For more detail please refer to Credit Suisse's Policies for Managing Conflicts of Interest in connection with Investment Research: http://www.csfb.com/research-and-analytics/disclaimer/managing_conflicts_disclaimer.html
Credit Suisse does not provide any tax advice. Any statement herein regarding any US federal tax is not intended or written to be used, and cannot be used, by any taxpayer for the purposes of avoiding any penalties.
Target Price and Rating Valuation Methodology and Risks: (12 months) for KOSE (4922.T)
Method: We base our ¥14,500 target price for Kose on EV/EBITDA of around 16x applied to our FY3/17 estimates. Our multiple is based on the FY2 Bloomberg consensus multiple for Kose as of November 2015. Implied P/E is roughly 32x (before goodwill amortization). This is below the past 10-year multiple plus two standard deviations (P/E of 37x). We think Kose does not look particularly overvalued compared with the Japanese industry average and some Asian cosmetics companies. The multiple is higher than the industry average, but we think this is fair as longer-term earnings momentum is also higher than the industry average. We see Kose as one of the Japanese cosmetics makers likely to benefit the most from growth in the number of visitors to Japan. We base our OUTPERFORM rating on our expectations for total returns and comparisons with our coverage universe over the next 12 months.
Risk: Risks to our ¥14,500 target price and our OUTPERFORM rating for KOSE Corporation include fiercer competition in domestic skincare market and significant decrease in the number of inbound travelers.
Target Price and Rating Valuation Methodology and Risks: (12 months) for Kao (4452.T)

12 January 2016
Cosmetics Sector 33
Method: Our ¥7,300 target price for Kao is based on EV/EBITDA of roughly 13.5x (as of Nov 2015) applied to our FY12/16 estimates. Our multiple is the market cap-weighted average for nine global HPC companies (Unicharm, Pigeon, Beiersdorf, L'Oreal, Unilever, Colgate-Palmolive, Estee Lauder, Kimberly-Clark and Procter & Gamble) based on Bloomberg FY2 consensus forecasts. We think this average multiple represents fair value, given that Kao's earnings momentum, margins, and capital efficiency are not particularly better or worse than its peers'. We also believe Kao shows strong growth potential in consumer staple businesses such as disposable diapers in Greater China. Our OUTPERFORM rating is based on a comparison of the company's 12-month potential total return versus our coverage universe.
Risk: Downside risks to our ¥7,300 target price and our OUTPERFORM rating for Kao include; (1) a shift toward low-price products and a decline in consumption in the domestic market, (2) a substantial increase in raw materials (crude oil, palm oil) prices, and (3) a slowdown in Asia business.
Target Price and Rating Valuation Methodology and Risks: (12 months) for Pola Orbis HD (4927.T)
Method: We base our ¥9,500 target price for Pola Orbis by applying an EV/EBITDA of around 14x to our FY12/16 forecasts. Inbound demand has started to boost earnings, albeit later than we had expected, and the company has started to benefit from growth in demand in Asia in real terms. We therefore use the global cosmetics industry average. We use the market-cap-weighted average for eight major manufacturers (Shiseido, Kose, Amorepacific, LG H&H, Beiersdorf, L'Oreal, Estee Lauder, and P&G), using Bloomberg FY2 consensus estimates. This group includes two companies each from Japan, Korea, Europe, and the Americas. We see application of the average as fair since the company's earnings momentum, profitability, and capital efficiency are at least not lower than, and in some cases substantially higher than, rivals'. We base our OUTPERFORM rating on our expectations for total returns and comparisons with our coverage universe over the next 12 months.
Risk: Risks to our ¥9,500 target price and our OUTPERFORM rating for Pola Orbis include; (1) greater competition in Japan; (2) sluggishness in rebuilding overseas operations; and (3) a slowdown in sales via the department store channel in China.
Target Price and Rating Valuation Methodology and Risks: (12 months) for Shiseido (4911.T)
Method: Our ¥2,250 target price for Shiseido is based on EV/EBITDA of approximately 12x (one standard deviation above the 10-year average) applied to our FY12/16 forecasts. Our target price reflects higher-than-anticipated market expectations for cosmetics makers such as Shiseido that have benefited from inbound demand. We cautiously use an EV/EBITDA below the global cosmetic sector's average of 14x and below Shiseido's 10-year EV/EBITDA average plus two standard deviations (13.3x) in view of uncertainty with regard to the restructuring of business in China and the sustainability of domestic operations' recent strong performance. We use the weighted average market cap for eight major cosmetics makers (Shiseido, Kose, AmorePacific, LG H&H, Beiersdorf, L'Oreal, Estee Lauder, and Procter & Gamble) based on FY2 Bloomberg consensus forecasts. The multiple is below the industry average. We see little likelihood of a rise in the valuation as the company's results have been less stable than its rivals' (sales in China and net profits tend to fluctuate). We base our UNDERPERFORM rating on our expectations for total returns and comparisons with our coverage universe over the next 12 months.
Risk: Upside risks to our ¥2,250 target price and our UNDERPERFORM rating for Shiseido include: (1) significant market share recovery in Japan and Greater China and (2) announcement of a drastic cost cutting plan.
Please refer to the firm's disclosure website at https://rave.credit-suisse.com/disclosures for the definitions of abbreviations typically used in the target price method and risk sections.
See the Companies Mentioned section for full company names
The subject company (BABA.N, JMEI.N, 051900.KS, 023530.KS) currently is, or was during the 12-month period preceding the date of distribution of this report, a client of Credit Suisse.
Credit Suisse provided investment banking services to the subject company (BABA.N, JMEI.N) within the past 12 months.
Credit Suisse has received investment banking related compensation from the subject company (BABA.N, JMEI.N) within the past 12 months
Credit Suisse expects to receive or intends to seek investment banking related compensation from the subject company (4922.T, 4911.T, 4452.T, BABA.N, 090430.KS, JMEI.N, 051900.KS, 023530.KS, 3099.T, 3086.T) within the next 3 months.
Credit Suisse has a material conflict of interest with the subject company (BABA.N) . Credit Suisse acted as the exclusive financial advisor to Alibaba Group in relation to its investment in Snapdeal.com.
Credit Suisse has a material conflict of interest with the subject company (023530.KS) . Credit Suisse is acting as exclusive financial advisor to Lotte for the acquisition of LuckyPai.
For other important disclosures concerning companies featured in this report, including price charts, please visit the website at https://rave.credit-suisse.com/disclosures or call +1 (877) 291-2683.
Important Regional Disclosures
Singapore recipients should contact Credit Suisse AG, Singapore Branch for any matters arising from this research report.

12 January 2016
Cosmetics Sector 34
The analyst(s) involved in the preparation of this report may participate in events hosted by the subject company, including site visits. Credit Suisse does not accept or permit analysts to accept payment or reimbursement for travel expenses associated with these events.
Restrictions on certain Canadian securities are indicated by the following abbreviations: NVS--Non-Voting shares; RVS--Restricted Voting Shares; SVS--Subordinate Voting Shares.
Individuals receiving this report from a Canadian investment dealer that is not affiliated with Credit Suisse should be advised that this report may not contain regulatory disclosures the non-affiliated Canadian investment dealer would be required to make if this were its own report.
For Credit Suisse Securities (Canada), Inc.'s policies and procedures regarding the dissemination of equity research, please visit https://www.credit-suisse.com/sites/disclaimers-ib/en/canada-research-policy.html.
The following disclosed European company/ies have estimates that comply with IFRS: (OREP.PA, UNc.AS).
Credit Suisse has acted as lead manager or syndicate member in a public offering of securities for the subject company (BABA.N) within the past 3 years.
As of the date of this report, Credit Suisse acts as a market maker or liquidity provider in the equities securities that are the subject of this report.
Principal is not guaranteed in the case of equities because equity prices are variable.
Commission is the commission rate or the amount agreed with a customer when setting up an account or at any time after that.
To the extent this is a report authored in whole or in part by a non-U.S. analyst and is made available in the U.S., the following are important disclosures regarding any non-U.S. analyst contributors: The non-U.S. research analysts listed below (if any) are not registered/qualified as research analysts with FINRA. The non-U.S. research analysts listed below may not be associated persons of CSSU and therefore may not be subject to the NASD Rule 2711 and NYSE Rule 472 restrictions on communications with a subject company, public appearances and trading securities held by a research analyst account.
Credit Suisse Securities (Japan) Limited ............................................................................................................................................. Masashi Mori
For Credit Suisse disclosure information on other companies mentioned in this report, please visit the website at https://rave.credit-suisse.com/disclosures or call +1 (877) 291-2683.
12 January 2016
Cosmetics Sector 35
References in this report to Credit Suisse include all of the subsidiaries and affiliates of Credit Suisse operating under its investment banking division. For more information on our structure, please use the following link: https://www.credit-suisse.com/who-we-are This report may contain material that is not directed to, or intended for distribution to or use by, any person or entity who is a citizen or resident of or located in any locality, state, country or other jurisdiction where such distribution, publication, availability or use would be contrary to law or regulation or which would subject Credit Suisse AG or its affiliates ("CS") to any registration or licensing requirement within such jurisdiction. All material presented in this report, unless specifically indicated otherwise, is under copyright to CS. None of the material, nor its content, nor any copy of it, may be altered in any way, transmitted to, copied or distributed to any other party, without the prior express written permission of CS. All trademarks, service marks and logos used in this report are trademarks or service marks or registered trademarks or service marks of CS or its affiliates. The information, tools and material presented in this report are provided to you for information purposes only and are not to be used or considered as an offer or the solicitation of an offer to sell or to buy or subscribe for securities or other financial instruments. CS may not have taken any steps to ensure that the securities referred to in this report are suitable for any particular investor. CS will not treat recipients of this report as its customers by virtue of their receiving this report. The investments and services contained or referred to in this report may not be suitable for you and it is recommended that you consult an independent investment advisor if you are in doubt about such investments or investment services. Nothing in this report constitutes investment, legal, accounting or tax advice, or a representation that any investment or strategy is suitable or appropriate to your individual circumstances, or otherwise constitutes a personal recommendation to you. CS does not advise on the tax consequences of investments and you are advised to contact an independent tax adviser. Please note in particular that the bases and levels of taxation may change. Information and opinions presented in this report have been obtained or derived from sources believed by CS to be reliable, but CS makes no representation as to their accuracy or completeness. CS accepts no liability for loss arising from the use of the material presented in this report, except that this exclusion of liability does not apply to the extent that such liability arises under specific statutes or regulations applicable to CS. This report is not to be relied upon in substitution for the exercise of independent judgment. CS may have issued, and may in the future issue, other communications that are inconsistent with, and reach different conclusions from, the information presented in this report. Those communications reflect the different assumptions, views and analytical methods of the analysts who prepared them and CS is under no obligation to ensure that such other communications are brought to the attention of any recipient of this report. Some investments referred to in this report will be offered solely by a single entity and in the case of some investments solely by CS, or an associate of CS or CS may be the only market maker in such investments. Past performance should not be taken as an indication or guarantee of future performance, and no representation or warranty, express or implied, is made regarding future performance. Information, opinions and estimates contained in this report reflect a judgment at its original date of publication by CS and are subject to change without notice. The price, value of and income from any of the securities or financial instruments mentioned in this report can fall as well as rise. The value of securities and financial instruments is subject to exchange rate fluctuation that may have a positive or adverse effect on the price or income of such securities or financial instruments. Investors in securities such as ADR's, the values of which are influenced by currency volatility, effectively assume this risk. Structured securities are complex instruments, typically involve a high degree of risk and are intended for sale only to sophisticated investors who are capable of understanding and assuming the risks involved. The market value of any structured security may be affected by changes in economic, financial and political factors (including, but not limited to, spot and forward interest and exchange rates), time to maturity, market conditions and volatility, and the credit quality of any issuer or reference issuer. Any investor interested in purchasing a structured product should conduct their own investigation and analysis of the product and consult with their own professional advisers as to the risks involved in making such a purchase. Some investments discussed in this report may have a high level of volatility. High volatility investments may experience sudden and large falls in their value causing losses when that investment is realised. Those losses may equal your original investment. Indeed, in the case of some investments the potential losses may exceed the amount of initial investment and, in such circumstances, you may be required to pay more money to support those losses. Income yields from investments may fluctuate and, in consequence, initial capital paid to make the investment may be used as part of that income yield. Some investments may not be readily realisable and it may be difficult to sell or realise those investments, similarly it may prove difficult for you to obtain reliable information about the value, or risks, to which such an investment is exposed. This report may provide the addresses of, or contain hyperlinks to, websites. Except to the extent to which the report refers to website material of CS, CS has not reviewed any such site and takes no responsibility for the content contained therein. Such address or hyperlink (including addresses or hyperlinks to CS's own website material) is provided solely for your convenience and information and the content of any such website does not in any way form part of this document. Accessing such website or following such link through this report or CS's website shall be at your own risk. This report is issued and distributed in Europe (except Switzerland) by Credit Suisse Securities (Europe) Limited, One Cabot Square, London E14 4QJ, England, which is authorised by the Prudential Regulation Authority and regulated by the Financial Conduct Authority and the Prudential Regulation Authority. This report is issued and distributed in Europe (except Switzerland) by Credit Suisse International, One Cabot Square, London E14 4QJ, England, which is authorised by the Prudential Regulation Authority and regulated by the Financial Conduct Authority and the Prudential Regulation Authority. This report is being distributed in Germany by Credit Suisse Securities (Europe) Limited Niederlassung Frankfurt am Main regulated by the Bundesanstalt fuer Finanzdienstleistungsaufsicht ("BaFin"). This report is being distributed in the United States and Canada by Credit Suisse Securities (USA) LLC; in Switzerland by Credit Suisse AG; in Brazil by Banco de Investimentos Credit Suisse (Brasil) S.A or its affiliates; in Mexico by Banco Credit Suisse (México), S.A. (transactions related to the securities mentioned in this report will only be effected in compliance with applicable regulation); in Japan by Credit Suisse Securities (Japan) Limited, Financial Instruments Firm, Director-General of Kanto Local Finance Bureau (Kinsho) No. 66, a member of Japan Securities Dealers Association, The Financial Futures Association of Japan, Japan Investment Advisers Association, Type II Financial Instruments Firms Association; elsewhere in Asia/ Pacific by whichever of the following is the appropriately authorised entity in the relevant jurisdiction: Credit Suisse (Hong Kong) Limited, Credit Suisse Equities (Australia) Limited, Credit Suisse Securities (Thailand) Limited, regulated by the Office of the Securities and Exchange Commission, Thailand, having registered address at 990 Abdulrahim Place, 27th Floor, Unit 2701, Rama IV Road, Silom, Bangrak, Bangkok 10500, Thailand, Tel. +66 2614 6000, Credit Suisse Securities (Malaysia) Sdn Bhd, Credit Suisse AG, Singapore Branch, Credit Suisse Securities (India) Private Limited (CIN no. U67120MH1996PTC104392) regulated by the Securities and Exchange Board of India as Research Analyst (registration no. INH 000001030) and as Stock Broker (registration no. INB230970637; INF230970637; INB010970631; INF010970631), having registered address at 9th Floor, Ceejay House, Dr.A.B. Road, Worli, Mumbai - 18, India, T- +91-22 6777 3777, Credit Suisse Securities (Europe) Limited, Seoul Branch, Credit Suisse AG, Taipei Securities Branch, PT Credit Suisse Securities Indonesia, Credit Suisse Securities (Philippines ) Inc., and elsewhere in the world by the relevant authorised affiliate of the above. Research on Taiwanese securities produced by Credit Suisse AG, Taipei Securities Branch has been prepared by a registered Senior Business Person. Research provided to residents of Malaysia is authorised by the Head of Research for Credit Suisse Securities (Malaysia) Sdn Bhd, to whom they should direct any queries on +603 2723 2020. This report has been prepared and issued for distribution in Singapore to institutional investors, accredited investors and expert investors (each as defined under the Financial Advisers Regulations) only, and is also distributed by Credit Suisse AG, Singapore branch to overseas investors (as defined under the Financial Advisers Regulations). By virtue of your status as an institutional investor, accredited investor, expert investor or overseas investor, Credit Suisse AG, Singapore branch is exempted from complying with certain compliance requirements under the Financial Advisers Act, Chapter 110 of Singapore (the "FAA"), the Financial Advisers Regulations and the relevant Notices and Guidelines issued thereunder, in respect of any financial advisory service which Credit Suisse AG, Singapore branch may provide to you. This information is being distributed by Credit Suisse AG (DIFC Branch), duly licensed and regulated by the Dubai Financial Services Authority (“DFSA”). Related financial services or products are only made available to Professional Clients or Market Counterparties, as defined by the DFSA, and are not intended for any other persons. Credit Suisse AG (DIFC Branch) is located on Level 9 East, The Gate Building, DIFC, Dubai, United Arab Emirates. This research may not conform to Canadian disclosure requirements. In jurisdictions where CS is not already registered or licensed to trade in securities, transactions will only be effected in accordance with applicable securities legislation, which will vary from jurisdiction to jurisdiction and may require that the trade be made in accordance with applicable exemptions from registration or licensing requirements. Non-U.S. customers wishing to effect a transaction should contact a CS entity in their local jurisdiction unless governing law permits otherwise. U.S. customers wishing to effect a transaction should do so only by contacting a representative at Credit Suisse Securities (USA) LLC in the U.S. Please note that this research was originally prepared and issued by CS for distribution to their market professional and institutional investor customers. Recipients who are not market professional or institutional investor customers of CS should seek the advice of their independent financial advisor prior to taking any investment decision based on this report or for any necessary explanation of its contents. This research may relate to investments or services of a person outside of the UK or to other matters which are not authorised by the Prudential Regulation Authority and regulated by the Financial Conduct Authority and the Prudential Regulation Authority or in respect of which the protections of the Prudential Regulation Authority and Financial Conduct Authority for private customers and/or the UK compensation scheme may not be available, and further details as to where this may be the case are available upon request in respect of this report. CS may provide various services to US municipal entities or obligated persons ("municipalities"), including suggesting individual transactions or trades and entering into such transactions. Any services CS provides to municipalities are not viewed as "advice" within the meaning of Section 975 of the Dodd-Frank Wall Street Reform and Consumer Protection Act. CS is providing any such services and related information solely on an arm's length basis and not as an advisor or fiduciary to the municipality. In connection with the provision of the any such services, there is no agreement, direct or indirect, between any municipality (including the officials, management, employees or agents thereof) and CS for CS to provide advice to the municipality. Municipalities should consult with their financial, accounting and legal advisors regarding any such services provided by CS. In addition, CS is not acting for direct or indirect compensation to solicit the municipality on behalf of an unaffiliated broker, dealer, municipal securities dealer, municipal advisor, or investment adviser for the purpose of obtaining or retaining an engagement by the municipality for or in connection with Municipal Financial Products, the issuance of municipal securities, or of an investment adviser to provide investment advisory services to or on behalf of the municipality. If this report is being distributed by a financial institution other than Credit Suisse AG, or its affiliates, that financial institution is solely responsible for distribution. Clients of that institution should contact that institution to effect a transaction in the securities mentioned in this report or require further information. This report does not constitute investment advice by Credit Suisse to the clients of the distributing financial institution, and neither Credit Suisse AG, its affiliates, and their respective officers, directors and employees accept any liability whatsoever for any direct or consequential loss arising from their use of this report or its content. Principal is not guaranteed. Commission is the commission rate or the amount agreed with a customer when setting up an account or at any time after that.
Copyright © 2016 CREDIT SUISSE AG and/or its affiliates. All rights reserved.
Investment principal on bonds can be eroded depending on sale price or market price. In addition, there are bonds on which investment principal can be eroded due to changes in redemption amounts. Care is required when investing in such instruments. When you purchase non-listed Japanese fixed income securities (Japanese government bonds, Japanese municipal bonds, Japanese government guaranteed bonds, Japanese corporate bonds) from CS as a seller, you will be requested to pay the purchase price only.
HPC cosmetics_011216_E.doc