Embed Size (px)
Citation preview

Int. J. Electrochem. Sci., 10 (2015) 5222 - 5237
International Journal of
ELECTROCHEMICAL SCIENCE
www.electrochemsci.org
Corrosion Prevention by Applied Coatings on Aluminum Alloys
in Corrosive Environments
Jingyi Yue, Yan Cao*
Institute for Combustion Science and Environmental Technology, Department of Chemistry, Western
Kentucky University, Bowling Green, KY 42101, USA
Phone number: (270) 779-0202 *E-mail: [email protected]
Received: 25 February 2015 / Accepted: 28 March 2015 / Published: 27 May 2015
In this study, the corrosion resistance of selected aluminum alloys with various combinations of
commercial coatings was investigated using the Tafel electrochemical method in water and simulated
salt water environments. The microtopography of the surfaces of the metals and applied coatings was
tested using atomic force microscopy (AFM) and optical microscopy (OM) analysis. The combination
of an environmentally friendly electrodeposited ceramic coating with a primer and topcoat, which
results in a chromium-free coating, exhibited a higher polarization resistance and a lower corrosion
rate than the traditional chromate conversion coating combination. Coating defects and pores, which
were revealed by the AFM images, were demonstrated to contribute to higher corrosion rates.
Keywords: Corrosion; Aluminum alloy; Coating; Tafel; AFM.
1. INTRODUCTION
Aluminum alloys are widely used in the chemical, aerospace, food, electronics and marine
industries due to their low price, low density and great strength. However, the application of aluminum
alloys is restricted by their high chemical activity and potentially poor corrosion resistance. Although
the formation of an oxide layer increases the corrosion resistance of the alloy, this layer is easily
eroded. This erosion can be attributed to defects in the oxide layers. Defects are more likely to be
exposed to the atmosphere and suffer attacks from chloride ions, leading to more serious corrosion
cracks [1]. Corrosion prevention for aluminum alloys has long been an important research area for
maintaining the use of this very abundant and easily machined element. Sea water is considered one of
the most corrosive natural environments, as it contains the highly corrosive chloride ion. The majority

Int. J. Electrochem. Sci., Vol. 10, 2015
5223
of corrosion protection studies focused on useful and economical coating methods [2-4]. Organic or
inorganic barrier layers are generally applied to effectively control the corrosion rates of applied
aluminum alloys, thus avoiding the occurrence of the cathode reaction [5]. Traditionally, corrosion
prevention coatings have been classified into three types, including chromium conversion coatings,
primers, and topcoats. The chromates are regarded as highly effective and widely used corrosion
inhibitors, especially for aluminum and its alloys in aerospace applications. The chromate conversion
coating is reported to contain primarily Cr6+
, which is capable of repairing imperfections and defects in
the coating [6-9]. Therefore, the chromate conversion coating is considered to be a more effective
coating for corrosion protection. However, these traditional coatings may consist of metals, such as
chromium and zinc, which are harmful for health during the ablation process in corrosive
environments and which also increase the manufacturing costs [10]. Taking environmental and
economic issues into consideration, a large number of studies concentrated on new coatings to avoid
the use of chromates [11-14]. This work aimed to investigate and compare the corrosion performance
of environmental electrodeposited ceramic coatings, which are chromium-free, and traditional toxic
conversion coatings. The corrosion rates of the coated aluminum alloys were determined using an
accurate electrochemical method based on the ASTM standard method under different simulated
corrosive environments.
2. EXPERIMENTAL
2.1 Coating materials
Materials:
The coated samples were made of aluminum alloys (AA5086), of which the composition is
listed in Table 1.
Table 1. Composition of aluminum alloys (wt%)
Element Si Fe Cu Mn Mg Cr Zn
Wt% 0.4 0.5 0.1 0.2 3.5 0.05 0.25
Table 2. Detailed description of commercial coating samples
Coating Description Thickness
(Min)
Thickness
(Max)
Comment
None Aluminum Alloy N/A N/A AA5086
Chromate Lyfanite (ALODINE® 713) 30 mg/ft² 90 mg/ft² Conversion coating
E-coating Electrodeposition Coating 0.0005 inch 0.0009 inch Cationic Epoxy Electrocoat
Primer Primer 0.0015 inch 0.003 inch Strontium Chromate Epoxy Primer
Topcoat Topcoat 0.0012 inch 0.0014 inch High Solids Acrylic Bake Enamel
EC² Alodine® EC 0.0002 inch 0.0003 inch Micron ceramic coating
(chromium-free)
Int. J. Electrochem. Sci., Vol. 10, 2015
5224
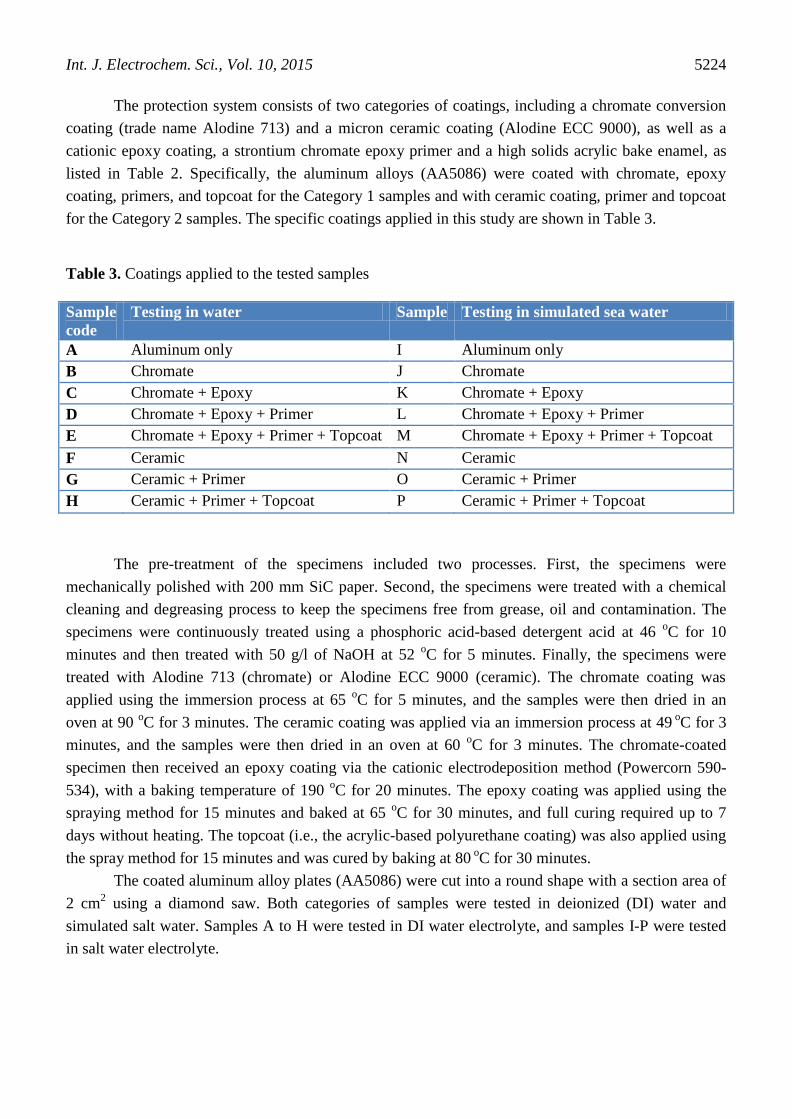
The protection system consists of two categories of coatings, including a chromate conversion
coating (trade name Alodine 713) and a micron ceramic coating (Alodine ECC 9000), as well as a
cationic epoxy coating, a strontium chromate epoxy primer and a high solids acrylic bake enamel, as
listed in Table 2. Specifically, the aluminum alloys (AA5086) were coated with chromate, epoxy
coating, primers, and topcoat for the Category 1 samples and with ceramic coating, primer and topcoat
for the Category 2 samples. The specific coatings applied in this study are shown in Table 3.
Table 3. Coatings applied to the tested samples
Sample
code
Testing in water Sample Testing in simulated sea water
A Aluminum only I Aluminum only
B Chromate J Chromate
C Chromate + Epoxy K Chromate + Epoxy
D Chromate + Epoxy + Primer L Chromate + Epoxy + Primer
E Chromate + Epoxy + Primer + Topcoat M Chromate + Epoxy + Primer + Topcoat
F Ceramic N Ceramic
G Ceramic + Primer O Ceramic + Primer
H Ceramic + Primer + Topcoat P Ceramic + Primer + Topcoat
The pre-treatment of the specimens included two processes. First, the specimens were
mechanically polished with 200 mm SiC paper. Second, the specimens were treated with a chemical
cleaning and degreasing process to keep the specimens free from grease, oil and contamination. The
specimens were continuously treated using a phosphoric acid-based detergent acid at 46 oC for 10
minutes and then treated with 50 g/l of NaOH at 52 oC for 5 minutes. Finally, the specimens were
treated with Alodine 713 (chromate) or Alodine ECC 9000 (ceramic). The chromate coating was
applied using the immersion process at 65 oC for 5 minutes, and the samples were then dried in an
oven at 90 oC for 3 minutes. The ceramic coating was applied via an immersion process at 49
oC for 3
minutes, and the samples were then dried in an oven at 60 oC for 3 minutes. The chromate-coated
specimen then received an epoxy coating via the cationic electrodeposition method (Powercorn 590-
534), with a baking temperature of 190 oC for 20 minutes. The epoxy coating was applied using the
spraying method for 15 minutes and baked at 65 oC for 30 minutes, and full curing required up to 7
days without heating. The topcoat (i.e., the acrylic-based polyurethane coating) was also applied using
the spray method for 15 minutes and was cured by baking at 80 oC for 30 minutes.
The coated aluminum alloy plates (AA5086) were cut into a round shape with a section area of
2 cm2 using a diamond saw. Both categories of samples were tested in deionized (DI) water and
simulated salt water. Samples A to H were tested in DI water electrolyte, and samples I-P were tested
in salt water electrolyte.

Int. J. Electrochem. Sci., Vol. 10, 2015
5225
2.2 Corrosion Testing (Potentiodynamic Polarization)
The corrosion resistance of the coatings was tested using a three-electrode system connected to
the electrochemical workstation Model CHI660 E, as shown in Figure 1 on the right. The samples
were loaded onto a U-tube corrosion chamber setup, which is shown in Figure 1 on the left.
Potentiodynamic polarization resistance measurement was based on ASTM Standard G59. Corrosion
resistance was estimated from the polarization curve that was generated using the Tafel technique.
Figure 1. U-tube chamber (left) and electrochemical workstation (right)
Table 4. Composition of simulated salt water
Components Wt % Solution Concentration (g/l)
NaCl 58.490 24.530
MgCl2·6H2O 26.460 5.200
Na2SO4 9.750 4.090
CaCl2 2.765 1.160
KCl 1.645 0.695
NaHCO3 0.477 0.201
KBr 0.238 0.101
H3BO3 0.071 0.027
SrCl2·6H2O 0.095 0.025
NaF 0.007 0.003
The sample was located in the center of the U-tube chamber, with the coated bottom side of the
loaded sample in contact with the selected electrolyte (i.e., either DI water or salt water in this study)
and the uncoated upper side of the sample connected to the working electrode. Prior to being loaded
onto the U-tube chamber, the sample was sequentially wet polished on the uncoated side using 240 grit
and 600 grit SiC paper. The sample was then degreased using acetone and rinsed using distilled water.
The counter electrode and reference electrode and the delivery of the purging gas are installed through

Int. J. Electrochem. Sci., Vol. 10, 2015
5226
another opening of the U-tube chamber. The counter and reference electrodes were a platinum strip
with a diameter of 0.3 mm and a saturated calomel electrode, respectively. The working area of the
working electrode was 2 cm2. The testing temperature was maintained at ambient temperature (25
oC).
The composition of the simulated salt water is listed in Table 4. The test cell was purged using
nitrogen, with a flow rate of 150 cm3/min. The purging started at least 30 minutes prior to sample
loading and was maintained throughout the test. The polarization measurements were carried out at a
scan rate of 1 mV/s, with a potential range from -300 mV to -900 mV.
2.3 Corrosion rate calculation
The corrosion potentials (Ecorr), anodic and cathodic Tafel slopes (ba and bc), and corrosion
current density (Icorr) could be determined using polarization curves obtained from the CHI 660E
software. The polarization resistance (Rp) of the corrosion process can be calculated according to Eq 1,
as follows:
Eq 1
The corrosion rate can be further determined according to Eq 2:
Eq 2
Where K=3.27×10⁻³
mm g/μA cm yr, the equivalent weight Ew = 9.09 for the specific
aluminum alloy, and ρ = 2.66 g/cm3 for the specific aluminum alloy.
2.4. Atomic Force Microscopy and Optical Microscopy Images
The microtopography of specific samples was identified using an Olympus BX60M confocal
optical microscope (OM). A Multimode Atomic Force Microscope (AFM) 5500 from Agilent was
used in contact mode under ambient conditions to characterize the coated samples. Silicon AFM
probes with an aluminum reflex coating were used in contact mode and purchased from TED PELLA,
INC. The radius of the probes was 30 nm, with a constant force of 0.2 N/m and a resonant frequency of
13 kHz.
3. RESULTS
3.1 Corrosion test
The polarization curves of the two categories of coated aluminum alloy samples and untreated
aluminum alloy samples are shown in Figure 2 and Figure 3. A summary of the results of the
polarization tests is shown in Table 5.
Int. J. Electrochem. Sci., Vol. 10, 2015
5227
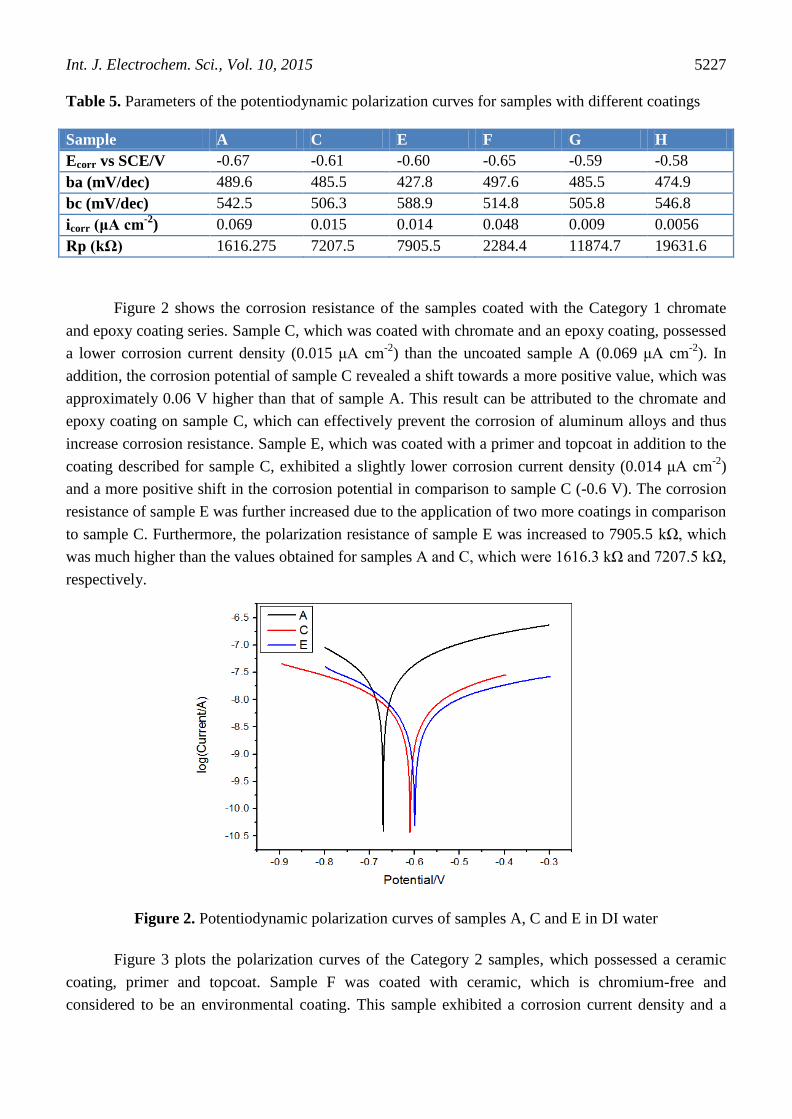
Table 5. Parameters of the potentiodynamic polarization curves for samples with different coatings
Sample A C E F G H
Ecorr vs SCE/V -0.67 -0.61 -0.60 -0.65 -0.59 -0.58
ba (mV/dec) 489.6 485.5 427.8 497.6 485.5 474.9
bc (mV/dec) 542.5 506.3 588.9 514.8 505.8 546.8
icorr (μA cm-2
) 0.069 0.015 0.014 0.048 0.009 0.0056
Rp (kΩ) 1616.275 7207.5 7905.5 2284.4 11874.7 19631.6
Figure 2 shows the corrosion resistance of the samples coated with the Category 1 chromate
and epoxy coating series. Sample C, which was coated with chromate and an epoxy coating, possessed
a lower corrosion current density (0.015 μA cm-2
) than the uncoated sample A (0.069 μA cm-2
). In
addition, the corrosion potential of sample C revealed a shift towards a more positive value, which was
approximately 0.06 V higher than that of sample A. This result can be attributed to the chromate and
epoxy coating on sample C, which can effectively prevent the corrosion of aluminum alloys and thus
increase corrosion resistance. Sample E, which was coated with a primer and topcoat in addition to the
coating described for sample C, exhibited a slightly lower corrosion current density (0.014 μA cm-2
)
and a more positive shift in the corrosion potential in comparison to sample C (-0.6 V). The corrosion
resistance of sample E was further increased due to the application of two more coatings in comparison
to sample C. Furthermore, the polarization resistance of sample E was increased to 7905.5 kΩ, which
was much higher than the values obtained for samples A and C, which were 1616.3 kΩ and 7207.5 kΩ,
respectively.
Figure 2. Potentiodynamic polarization curves of samples A, C and E in DI water
Figure 3 plots the polarization curves of the Category 2 samples, which possessed a ceramic
coating, primer and topcoat. Sample F was coated with ceramic, which is chromium-free and
considered to be an environmental coating. This sample exhibited a corrosion current density and a

Int. J. Electrochem. Sci., Vol. 10, 2015
5228
corrosion potential of 0.048 μA cm-2
and -0.65 V, respectively. Both of these values proved that the
corrosion resistance of sample F with the ceramic coating was slightly but not significantly better than
that of the uncoated sample A (0.069 μA cm-2
and -0.67 V, respectively). Sample G, which had an
additional primer coating on top of the ceramic coating described for sample F, exhibited significantly
improved corrosion resistance performance based on a significantly reduced corrosion current density
of 0.009 μA cm-2
and a large positive shift in corrosion potential to -0.59 V, as well as a significantly
increased polarization resistance of 11874.7 kΩ. This significant change in corrosion resistance (i.e.,
increased corrosion potential and decreased corrosion current density) may have occurred because the
effective combination of the ceramic coating and primer provided coverage that can significantly
reduce defects and limit corrosion attack. The corrosion resistance performance of sample H was only
slightly enhanced by the addition of one more topcoat onto sample G. The corrosion current density,
the corrosion potential and the polarization resistance of sample H were 0.0056 μA cm-2
, -0.58V and
19631.6 kΩ, respectively. These values were similar to those of sample G.
Figure 3. Potentiodynamic polarization curves of samples A, F, G and H in DI water
Figure 4 shows that the corrosion rates of commercial coatings on aluminum alloys in different
electrolytes varied, with an order of magnitude from 10-6
to 10-4
mpy. The corrosion rates of samples
A-E were tested in pure water. Sample E, which was coated with four layers, including chromate,
epoxy coating, primer, and topcoat, exhibited the lowest corrosion rate, with an order of magnitude of
10-6
mpy. The bare aluminum alloy (sample A) had the highest corrosion rate, on the order of 10-4
mpy. The reduction of the corrosion rate was largest between samples A (bare aluminum) and B
(coated with chromate oxide film), indicating that the chromate oxide film was very effective for
corrosion resistance. This resistance could be attributed to the fact that the rough surface of the bare
aluminum had many imperfections, rubs and scratches, which were healed when the chromate oxide

Int. J. Electrochem. Sci., Vol. 10, 2015
5229
film was applied. This finding is in accordance with the unique self-healing ability and electrochemical
protection of chromate oxide [15, 16]. Sample C had an additional epoxy coating in comparison to
sample B and exhibited a corrosion rate one order of magnitude lower than that of sample B. This
difference occurred because the coating on sample C provided better coverage for a continuous
reduction in the surface roughness, leading to improved corrosion resistance. However, no appreciable
difference in corrosion rates was observed between sample D (with one more primer coating than
Sample C) and sample E (with one more top coating than sample D). The corrosion rates of these
samples were 3.04E-5
and 3.01E-5
mm/y, respectively. Corrosion tests of samples I-M were conducted
in simulated salt water. For all of the samples, the corrosion rates in salt water were significantly
different than those obtained in DI water. The corrosion resistance of the samples was significantly
weaker in the salt water condition. This difference may be attributed to the high concentration of
chloride ions in the salt water, which increased the electric conductivity and resulted in a high
corrosion rate [17]. Sample I, which had no coatings, exhibited the highest corrosion rate of 0.01
mm/y.
Figure 4. Corrosion rates of Category 1 samples tested in salt water and DI water
From Figure 5, it was noted that sample N, which was coated with the ceramic coating,
exhibited a corrosion rate of 0.0016 mm/y in salt water; this value was ten times lower than that of the
original sample I (bare aluminum alloy). Correspondingly, the corrosion rate of sample F (9.69E-05
mm/y), which had the same ceramic coating, in DI water was three times lower than that of sample A.
Samples O and G have the same coatings (i.e., the ceramic coating plus primer), but these two samples
exhibited a large difference in corrosion resistance between salt water and DI water due to the
existence of chloride ions. The corrosion rates of samples O and G were 2.85E-04
and 2.16E-05
mm/y,
respectively. The primer coating was more effective for protecting against corrosion, especially in salt

Int. J. Electrochem. Sci., Vol. 10, 2015
5230
water. Both samples P and H were coated with one more layer of top coating than samples O and G;
the corrosion rates of these two samples were 1.39E-04
and 1.12E-05
mm/y, respectively, which were
nearly one times lower than those of samples O and G. This result revealed that the application of top
coatings could further reduce corrosion rates.
Figure 5. Corrosion rates of Category 2 samples in salt water and DI water
Based on Figure 6, the coating combination of the ceramic coating, primer and topcoat
significantly reduced the corrosion rate in comparison to the coating combination of chromate coating,
epoxy coating, primer and topcoat. Specifically, the corrosion rates of samples P and H, which had the
same coating combination in the ceramic series, in simulated salt water and pure water were 1.39E-04
and 1.12E-05
mm/y, respectively. These two corrosion rates were nearly two times lower than those of
the coating combination of chromate and epoxy (i.e., samples M and E), which had corrosion rates of
2.7E-04
and 3.02E-05
mm/y, respectively. Therefore, the chromium-free environmental ceramic coating
appeared to have better corrosion resistance than the chromate and epoxy coating. The excellent
corrosion resistance of the ceramic coating series can be attributed to the superior adhesion of ceramic
and to the effective combination of the ceramic with the strontium chromate primer. The primer has a
strong anti-corrosion capability when the aluminum is coated with another material that is porous or
can provide excellent adhesion [18]. Ceramic served as a better base for the primer than the chromate
and epoxy coating. The unique porous surface of the ceramic coating on aluminum was revealed by the
AFM images, as shown in Figure 11a.

Int. J. Electrochem. Sci., Vol. 10, 2015
5231
Figure 6. Comparison of the corrosion rates of specific samples in salt water and DI water
4. DISCUSSION
The cathodic reaction for aluminum alloys in pure water or saline electrolyte solution has been
proved to be the reduction of oxygen, as follows [19]:
2H2O + O2 + 4e- → 4OH
- Eq. 3
The anodic reaction for aluminum alloys occurs as the following reaction:
Al → Al3+
+ 3e-
Eq. 4
Al3+
+ 3OH- → Al(OH)3 Eq. 5
2Al + 6OH
- → Al2O3 + 3H2O + 6e
- Eq. 6
The corrosion of uncoated bare aluminum alloys, especially in the saline electrolyte solution, is
much more severe than that of the coated metal. The existence of chloride ions increases the corrosion
process by dissolving the Al and forming aluminum oxide on the surface [20]. For coated samples, the
anodic reactions (shown in Eq.4, Eq.5 and Eq.6) were significantly restricted due to the mass-transfer
barrier effect of the coatings. Therefore, the corrosion rate of the coated samples was significantly
reduced in comparison to the bare metal. The coating layers function as barrier films to slow the
transport of ions from the outer environment toward the bare metal. Increasing the coating layers
improves the corrosion resistance of the bare metal, although the corrosion cannot be fully eliminated.
Further studies that used AFM revealed the formation or the existence of pores during the coating
process; the pores could be eliminated by increasing the coating layers. This result is presented and
discussed in detail later.
Sketches and corrosion resistance schematics of the Category 2 coatings that were applied to
the aluminum alloys are shown in Figure 7. The first coating was applied via micron ceramic coating.
The formation of the porous structure of this layer during the coating process is of interest. The second

Int. J. Electrochem. Sci., Vol. 10, 2015
5232
coating was an epoxy primer, which significantly reduced the porous surface. Because the distribution
of pores is irregular, the positions of the pores in each of the two layers are not exactly matched [21].
The top layer is generally less porous to restrict the mass transfer of ions. The application of multiple
coats forms a special structure that improves the anti-corrosion capabilities of the underlying bare
metal. However, this process cannot completely avoid electrolyte ion transport through the coating.
Figure 7. Sketches of the pore distributions of coatings on the aluminum alloys in the context of
polarization resistance
The polarization resistance, which was obtained from polarization curves, can be used to
investigate the influence of functional coatings on corrosion and to determine the resistance
capabilities of anti-corrosion coatings. The incremental percentage of polarization resistance achieved
with various coatings can be expressed by the following equation:
where θ indicates the increment of polarization resistance. Rp’ and Rp represent the
polarization resistance of the coated sample and uncoated sample, respectively.
Figure 8. The increment of polarization resistance values for the Category 1 coating that was applied
to aluminum in salt and pure water.

Int. J. Electrochem. Sci., Vol. 10, 2015
5233
The polarization resistance values of the Category 1 coated samples in water are shown in
Figure 8. The polarization resistance of the chromate-coated sample was only increased by 30%,
although the chromate coating exhibits a good adhesion capability and is thus always used as the first
and required base for the next coat. However, this coating is less likely to have good coverage on the
bare aluminum alloy. The second epoxy coating was applied over the chromate coating and exhibited a
77% increment of Rp. The defects and roughness of the chromate coating were significantly improved
by this second layer. The high increment of Rp also indicates that the less porous epoxy coating tends
to be a more effective barrier for preventing electrolyte ion transport. However, in terms of commercial
application, the epoxy coating is typically coated with one more topcoat because the epoxy coating is
vulnerable and degradable under ultraviolet light [19, 22]. Thus, the specimen with the primer and
topcoat exhibited no significant differences in Rp in this study.
The Category 1 coated samples tested in salt water are shown in Figure 8. Notably, the
chromate-coated sample exhibits a large percentage increase in Rp. The chromate conversion coating
was much more efficient as a resistant barrier in the salt water environment than in water. The
chromate, which is retained in the conversion coating, is the king of soluble, oxidizing, and high-
valence ions (in CrO42-
or Cr2O72-
) [9]. The protective layer is formed when the ion is converted to an
insoluble and low-valence form (Cr2O3 or Cr(OH)3) [23]. The reduction reaction of this process is as
follows:
Cr2O72-
+ 8H+ + 6e
- → 2Cr(OH)3 + H2O Eq. 7
The existence of Cl- would accelerate the chromate reduction, in which the reduction products
serve as inhibitors [15]. This effect was observed in previous studies, as the Cr(VI) content of the
coating decreased and the content of Cr(III) increased when the coating was exposed to NaCl or salt
water [9, 24]. The serious localized pin corrosion of bare aluminum can be significantly reduced by the
reduction of chromate. Similarly, this study demonstrated that the chromate coating significantly
reduced the corrosion rate in salt water in comparison to the bare metal.
Figure 9. The increment of polarization resistance values of the Category 2 coating that was applied to
aluminum in salt and pure water.
The polarization resistance values of the Category 2 coatings in water are shown in Figure 9.
The ceramic coating only increased the Rp value by 29.24%. The principal property of the ceramic

Int. J. Electrochem. Sci., Vol. 10, 2015
5234
coating is its excellent adhesion capability, despite its porous surface. The porous surface generates a
weaker barrier for restricting the transportation of electrolyte ions, leading to a lower Rp. However, the
good adhesion properties of this layer enable the primer coating to be applied tightly. As expected, the
Rp value of the primer coating increased by 86.38% in comparison to the bare metal specimen. The
outermost coating (i.e., the topcoat) serves as a seal and decoration and contributes a small increment
of Rp. Figure 9 shows the same coating system tested in salt water. Similar to the results obtained for
the Category 1 coating, the Rp values of the ceramic coating were increased by 88.81% in salt water.
This result demonstrated the necessity and importance of the ceramic coating, in addition to the primer
and topcoat, in the salt water environment. The environmental benefits of using the ceramic coating
were apparent in comparison to the chromate-based coating. As expected, the combined primer and
topcoat only resulted in a limited improvement in Rp (99.55%) in the salty water environment.
However, the effectiveness of these coats for improving the Rp was still desired to nearly stop the
transportation of electrolyte ions and subsequent corrosion.
The microtopography of different samples has a significant impact on the corrosion
performance of the samples. Typical samples, which were tested using AFM and OM analysis, are
shown in Figure 10 and Figure 11. The same scale was applied to the images of two different samples
using the same magnification method. The maximum resolution of the images using OM is
approximately 500 um based on the confocal optical technology; in comparison, AFM can achieve a
much higher resolution of below 1 um (10-100 nm), depending on the scan time and the diameter of
the AFM tips. Images (a) and (b) were obtained using OM for samples A and C, respectively, and
images (c) and (d) were obtained using AFM for samples A and C, respectively.
Figure 10. OM and AFM images of sample A (bare aluminum alloy) and sample C (coated with
chromate and epoxy coating)

Int. J. Electrochem. Sci., Vol. 10, 2015
5235
A comparison of the AFM images and the OM images provides a good example of how more
detailed local information can be obtained by using AFM to explore the microtopography,
homogeneity and defects of applied coatings. The images of sample A that were obtained using both
AFM (Figure 10c) and OM (Figure 10a) clearly revealed the existence of rougher surfaces on sample
A than on sample C (Figure 10b and Figure 10d), which had the applied coatings. For rougher
surfaces, the specific surface area was larger, leading to the acceleration of the corrosion reaction
kinetics. This effect partially contributed to the higher corrosion rates that were observed for sample A
than for sample C, consistent with the aforementioned corrosion rates of sample A and sample C.
Further investigations of the obtained sample images indicated that the coating on sample C had a
good coverage over the whole surface in the investigated area, indicating an acceptable homogeneity
of the coating application. Furthermore, no defects were detected on the surface of sample C on a
nanometer scale, although a few spots were identified that were more or less thick than other parts of
the surface.
Figure 11. OM images of (a, b) samples F (coated with ceramic) and G (coated with ceramic and
primer), and AFM images (c, d) of samples H (coated with ceramic, primer and topcoat) and M
(coated with chromate, epoxy, primer and topcoat).
Figure 11 shows OM images typical of samples F and G and AFM images typical of samples H
and M. Sample F, which had a ceramic coating, exhibited porous surfaces with a pore diameter near 20
um (shown in Figure 11a). This porous topography was beneficial and appropriate for the adherence of
new coatings [25]. That finding was consistent with the former result concerning the good corrosion
resistance of sample G, which has an additional primer coating on this primary porous surface. The

Int. J. Electrochem. Sci., Vol. 10, 2015
5236
porous surface promoted good deposition of the primer. The newly formed coverage eliminated
surface roughness and covered surface defects, leading to a significant reduction in the corrosion rate
in comparison to the initial coating, even though some size-reduced submicron pores can still be seen
on the surface pores (shown in Figure 11b). Figure 11c depicts sample H, which has one more topcoat
than sample G. The topography of this sample was much smoother and flatter than that of sample G,
and the corrosion rate of sample H was reduced further. This result again provided evidence that low
surface roughness provides less surface area for attack by the corrosive environment. Sample M, which
is shown in Figure 11d, possessed numerous holes on its surface, which might be caused by the coating
process. Defects in the surface provided more chances for electrolyte ions to attack the surface; thus,
the corrosion rate of sample M was slightly higher than those discussed above.
4. CONCLUSIONS
An investigation of the corrosion resistance of different combinations of coatings on aluminum
alloys was conducted. The major conclusions of this study were:
1. The corrosion resistance experiment that was conducted in simulated salt water resulted
in more serious corrosion for all of the tested samples than the experiment conducted in distilled water.
Especially for rare aluminum alloy samples, the difference in the corrosion rate between these two
electrolyte environments was significant; the corrosion rate values obtained in salt water were two
orders of magnitude higher than those obtained in distilled water.
2. The environmentally friendly coating combination (i.e., the ceramic coating, primer and
topcoat (samples P and H)) exhibited excellent corrosion resistance in comparison to the coating
combination of chromate, epoxy coating, primer and topcoat (samples M and E). The corrosion rates
of these coatings were as low as 1.39E-4
and 1.12E-5
mm/y in salt water and distilled water,
respectively. The overall polarization resistance exhibited high increments of 91.76% in the water
environment and 99.55% in the salty water environment.
3. The unique properties of the ceramic coating, which exhibited a porous surface in the
OM investigations, can provide excellent adherence for subsequent coatings. By adding new primer
coatings on the ceramic layer (sample G), the size of the pores on the surface was significantly
reduced, thus further decreasing the corrosion rate.
ACKNOWLEDGEMENTS
This work was supported by the Kentucky Energy And Environment Cabinet (KEEC) Research Funds,
under contracts of the term 2014-2015, PON2 127 1300002875, and the U.S. Department of
Agriculture (6445-12 630-003-00D).
References
1. S.-I. Pyun and W.-J. Lee, Corros. Sci., 43 (2001) 353-363
2. J. Prakash, B. Tripathi and S. K. Ghosh, Intelligent Coatings for Corrosion Control, (2014) 93

Int. J. Electrochem. Sci., Vol. 10, 2015
5237
3. D. oriso a, H. hwald and D. G. Shchukin, Acs. Appl. Mater. Inter., 4 (2012) 2931-2939
4. E. A. Esfahani, H. Salimijazi, M. A. Golozar, J. Mostaghimi and L. Pershin, J. Therm. Spray Techn.,
21 (2012) 1195-1202
5. C. Vargel, Corrosion of Aluminium, Elsevier (2004)
6. W. G. Fahrenholtz, M. J. O'Keefe, H. Zhou and J. Grant, Surf. Coat. Tech., 155 (2002) 208-213
7. H. Isaacs, K. Sasaki, C. Jeffcoate, V. Laget and R. Buchheit, J. Electrochem. Soc., 152 (2005) B441-
B447
8. M. Kendig, A. J. Davenport and H. Isaacs, Corros. Sci., 34 (1993) 41-49
9. J. Zhao, L. Xia, A. Sehgal, D. Lu, R. McCreery and G.S., Surf. Coat. Tech., 140 (2001) 51-57
10. S. Bertling, Identification of thin surface films on aluminium with FTIR spectroscopy, Report
NTIS 96(4), 1996.
11. M. E. Nanna and G. P. Bierwagen, JCT. Res., 1 (2004) 69-80
12. I. Aziz, Q. Zhang and M. Xiang, J. Rare Earth, 28 (2010) 109-116
13. R. G. Buchheit, M. Bode and G. Stoner, Corrosion, 50 (1994) 205-214
14. M. Bethencourt, F. Botana, J. Calvino, M. Marcos and M. Rodriguez-Chacon, Corros. Sci., 40
(1998) 1803-1819
15. M. Kendig and R. Buchheit, Corrosion, 59 (2003) 379-400
16. L. Xia and R. L. McCreery, J. Electrochem. Soc., 145 (1998) 3083-3089
17. H. Altun and S. Sen, Mater. Design., 25 (2004) 637-643
18. J. D. Minford, Handbook of aluminum bonding technology and data, CRC Press (1993)
19. C. Dong, H. Sheng, Y. An, X. Li, K. Xiao and Y. Cheng, Prog. Org. Coat., 67 (2010) 269-273
20. E. McCafferty, Uptake of Chloride Ions and the Pitting of Aluminum, Surface Chemistry of
Aqueous Corrosion Processes, Springer (2015) pp. 71-75
21. B. Fernandez-Perez, J. Gonzalez-Guzman, S. Gonzalez and R. Souto, Int. J. Electrochem. Sci., 9
(2014) 2067-2079
22. A. Rezig, T. Nguyen, D. Martin, L. Sung, X. Gu, J. Jasmin and J. W. Martin, J. Coat. Technol.
Res., 3 (2006) 173-184
23. S. Pommiers-Belin, J. Frayret, A. Uhart, J. Ledeuil, J.-C. Dupin, A. Castetbon and M. Potin-
Gautier, Appl. Surf. Sci., 298 (2014) 199-207
24. G. S. Frankel, DTIC Document, (2001)
25. M. Popa, C. Vasilescu, S. I. Drob, P. Osiceanu, M. Anastasescu and J. M. Calderon-Moreno, J.
Brazil. Chem. Soc., 24 (2013) 1123-1134
© 2015 The Authors. Published by ESG (www.electrochemsci.org). This article is an open access
article distributed under the terms and conditions of the Creative Commons Attribution license
(http://creativecommons.org/licenses/by/4.0/).