Embed Size (px)
Citation preview
Corrosion Prevention and Control
Integrated Product Team
Maintenance Symposium Eric Herzberg
November 14, 2012
Impact of Corrosion on Cost
and Availability to DoD
Cleared For Public Release
Corrosion –
The deterioration of a material or its properties due to a
reaction of that material with its chemical environment
Outline
• Background – Why Estimate the Impact of Corrosion?
– Results Summary
• Methodology – Top down and Bottom up Approach
– Data trees
– Data conversion process and search algorithm
• Maintenance and corrosion data warehouse – Data structure
– Assessment Guidebook
Why Estimate DoD’s Cost of Corrosion?
• Previous annual DoD corrosion cost estimate of $10B - $20B was too vague
• LMI developed the DoD impact of corrosion methodology – approved by CPCIPT
• GAO recommended DoD develop an action plan to use study results (GAO-07-618, April 2007)
• Cost and availability of weapon systems are interrelated
• Now part of Department of Defense Instruction (DODI 5000.67) for Services to review results
“………reliable corrosion cost estimates are necessary to identify
areas that require aggressive action and to justify the expenditure
of resources for prevention and mitigation strategy.”
DoD Corrosion Executive in 2005 Corrosion Report to Congress
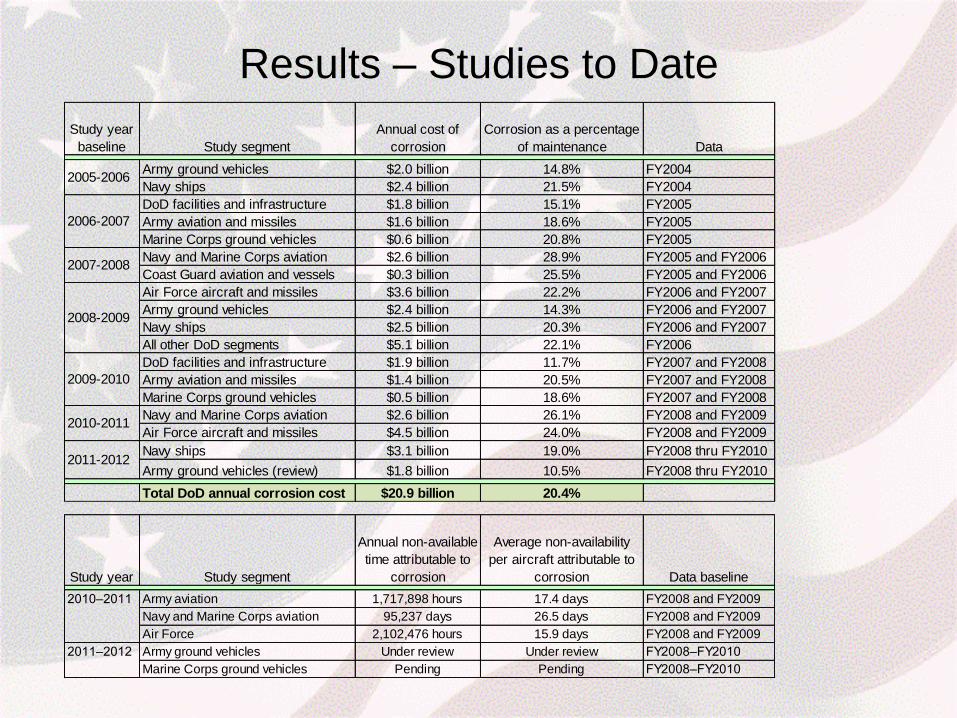
Results – Studies to Date
Study year
baseline Study segment
Annual cost of
corrosion
Corrosion as a percentage
of maintenance Data
Army ground vehicles $2.0 billion 14.8% FY2004
Navy ships $2.4 billion 21.5% FY2004
DoD facilities and infrastructure $1.8 billion 15.1% FY2005
Army aviation and missiles $1.6 billion 18.6% FY2005
Marine Corps ground vehicles $0.6 billion 20.8% FY2005
Navy and Marine Corps aviation $2.6 billion 28.9% FY2005 and FY2006
Coast Guard aviation and vessels $0.3 billion 25.5% FY2005 and FY2006
Air Force aircraft and missiles $3.6 billion 22.2% FY2006 and FY2007
Army ground vehicles $2.4 billion 14.3% FY2006 and FY2007
Navy ships $2.5 billion 20.3% FY2006 and FY2007
All other DoD segments $5.1 billion 22.1% FY2006
DoD facilities and infrastructure $1.9 billion 11.7% FY2007 and FY2008
Army aviation and missiles $1.4 billion 20.5% FY2007 and FY2008
Marine Corps ground vehicles $0.5 billion 18.6% FY2007 and FY2008
Navy and Marine Corps aviation $2.6 billion 26.1% FY2008 and FY2009
Air Force aircraft and missiles $4.5 billion 24.0% FY2008 and FY2009
Navy ships $3.1 billion 19.0% FY2008 thru FY2010
Army ground vehicles (review) $1.8 billion 10.5% FY2008 thru FY2010
Total DoD annual corrosion cost $20.9 billion 20.4%
2009-2010
2008-2009
2011-2012
2005-2006
2006-2007
2007-2008
2010-2011
Study year Study segment
Annual non-available
time attributable to
corrosion
Average non-availability
per aircraft attributable to
corrosion Data baseline
Army aviation 1,717,898 hours 17.4 days FY2008 and FY2009
Navy and Marine Corps aviation 95,237 days 26.5 days FY2008 and FY2009
Air Force 2,102,476 hours 15.9 days FY2008 and FY2009
Army ground vehicles Under review Under review FY2008–FY2010
Marine Corps ground vehicles Pending Pending FY2008–FY2010
2011–2012
2010–2011
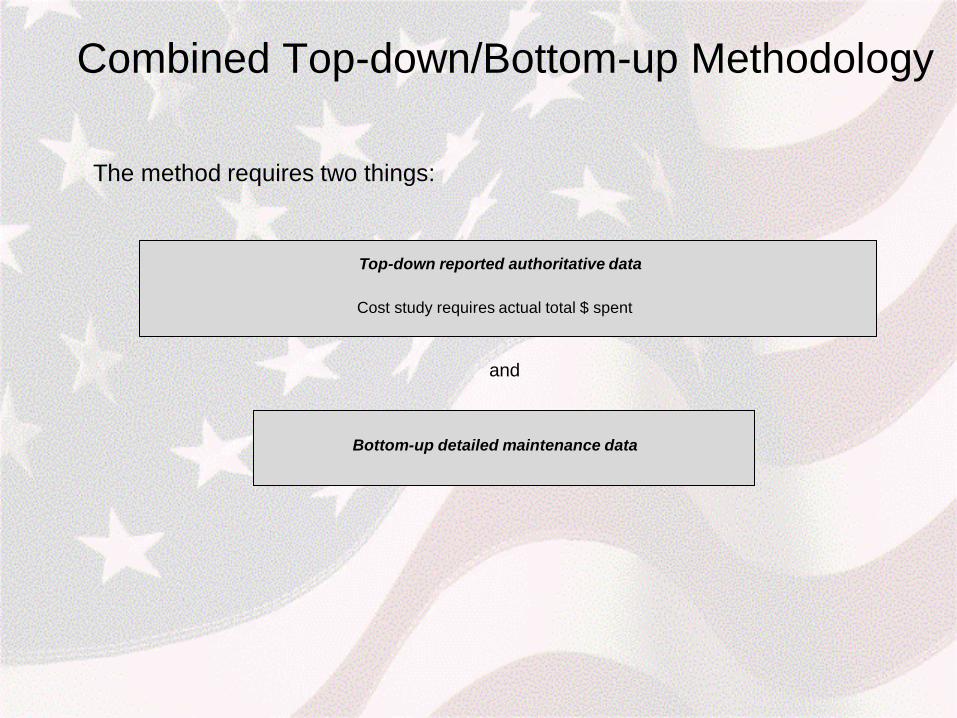
Combined Top-down/Bottom-up Methodology
The method requires two things:
Top-down reported authoritative data
Cost study requires actual total $ spent
and
Bottom-up detailed maintenance data
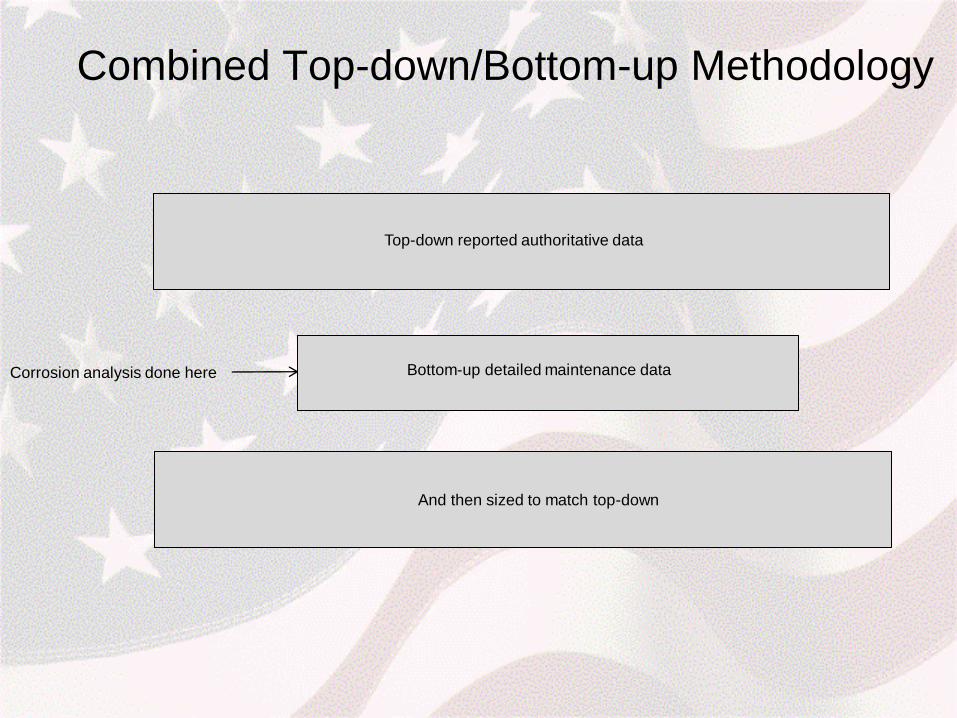
Combined Top-down/Bottom-up Methodology
Top-down reported authoritative data
Corrosion analysis done here Bottom-up detailed maintenance data
And then sized to match top-down
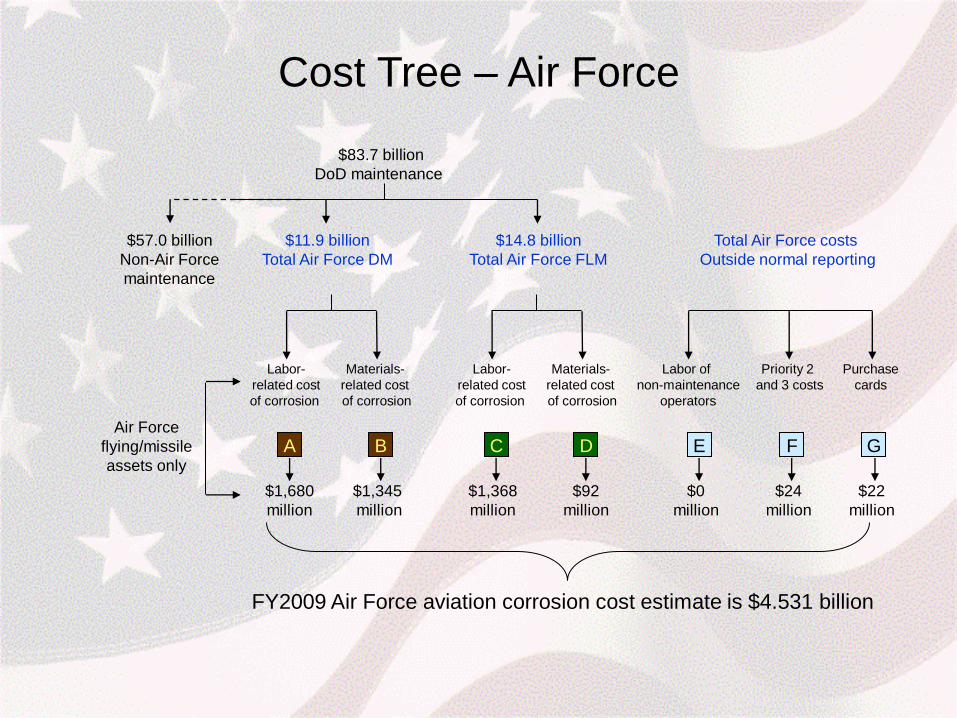
$83.7 billion
DoD maintenance
Labor of
non-maintenance
operators
Total Air Force costs
Outside normal reporting
Priority 2
and 3 costs
Purchase
cards
$11.9 billion
Total Air Force DM
$14.8 billion
Total Air Force FLM
Labor-
related cost
of corrosion
Materials-
related cost
of corrosion
Labor-
related cost
of corrosion
Materials-
related cost
of corrosion
$57.0 billion
Non-Air Force
maintenance
Air Force
flying/missile
assets only
$1,680
million
A B
$1,345
million
C
$1,368
million
D
$92
million
E
$0
million
F
$24
million
G
$22
million
FY2009 Air Force aviation corrosion cost estimate is $4.531 billion
Cost Tree – Air Force
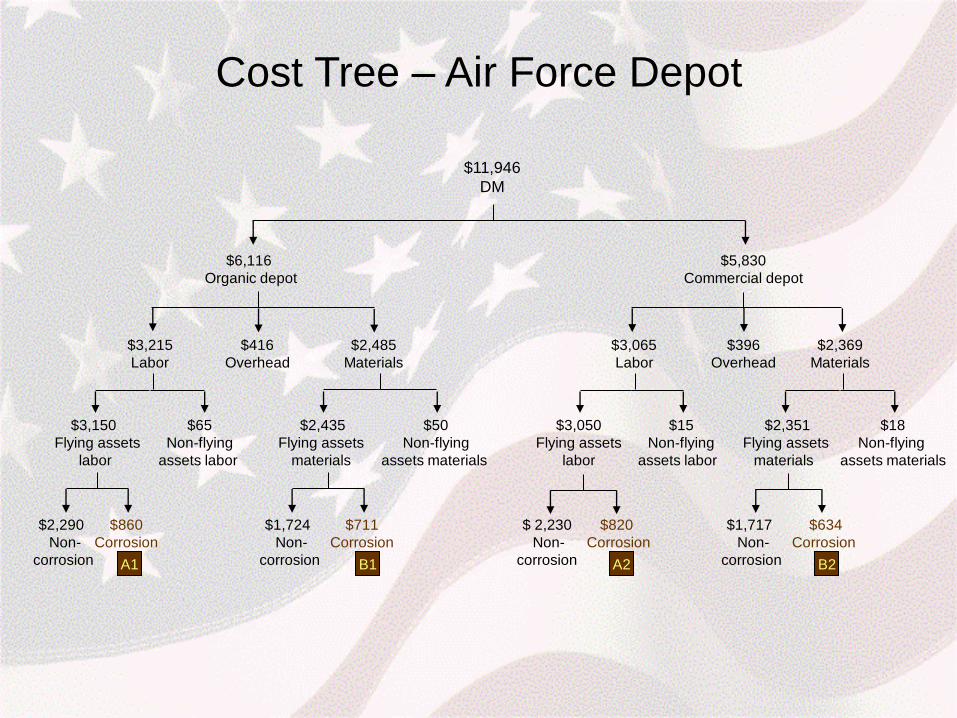
$11,946
DM
$6,116
Organic depot
$2,485
Materials
$416
Overhead
$3,215
Labor
$3,150
Flying assets
labor
$65
Non-flying
assets labor
$50
Non-flying
assets materials
$2,435
Flying assets
materials
$5,830
Commercial depot
$2,351
Flying assets
materials
$2,369
Materials
$396
Overhead
$3,065
Labor
$15
Non-flying
assets labor
$3,050
Flying assets
labor
$18
Non-flying
assets materials
$1,724
Non-
corrosion
$2,290
Non-
corrosion
$860
Corrosion
A1
$711
Corrosion
B1
$1,717
Non-
corrosion
$ 2,230
Non-
corrosion
$820
Corrosion
A2
$634
Corrosion
B2
Cost Tree – Air Force Depot
10
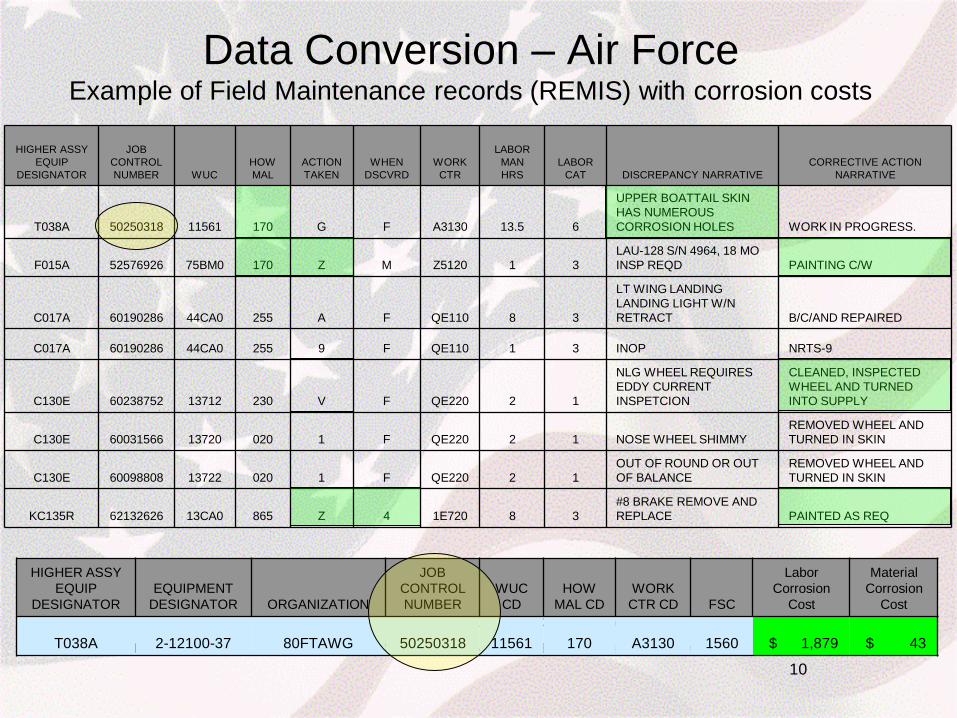
Data Conversion – Air Force Example of Field Maintenance records (REMIS) with corrosion costs
HIGHER ASSY
EQUIP
DESIGNATOR
JOB
CONTROL
NUMBER WUC
HOW
MAL
ACTION
TAKEN
WHEN
DSCVRD
WORK
CTR
LABOR
MAN
HRS
LABOR
CAT DISCREPANCY NARRATIVE
CORRECTIVE ACTION
NARRATIVE
T038A 50250318 11561 170 G F A3130 13.5 6
UPPER BOATTAIL SKIN
HAS NUMEROUS
CORROSION HOLES WORK IN PROGRESS.
F015A 52576926 75BM0 170 Z M Z5120 1 3
LAU-128 S/N 4964, 18 MO
INSP REQD PAINTING C/W
C017A 60190286 44CA0 255 A F QE110 8 3
LT WING LANDING
LANDING LIGHT W/N
RETRACT B/C/AND REPAIRED
C017A 60190286 44CA0 255 9 F QE110 1 3 INOP NRTS-9
C130E 60238752 13712 230 V F QE220 2 1
NLG WHEEL REQUIRES
EDDY CURRENT
INSPETCION
CLEANED, INSPECTED
WHEEL AND TURNED
INTO SUPPLY
C130E 60031566 13720 020 1 F QE220 2 1 NOSE WHEEL SHIMMY
REMOVED WHEEL AND
TURNED IN SKIN
C130E 60098808 13722 020 1 F QE220 2 1
OUT OF ROUND OR OUT
OF BALANCE
REMOVED WHEEL AND
TURNED IN SKIN
KC135R 62132626 13CA0 865 Z 4 1E720 8 3
#8 BRAKE REMOVE AND
REPLACE PAINTED AS REQ
HOW MALFUNCTION CODE: 170 = Corroded Mild/Moderate
ACTION TAKEN CODE: Z = Corrosion Treatment
WHEN DISCOVERED CODE: 4= Corrosion Control Inspection
DISCREPANCY NARRATIVE and CORRECTIVE ACTION NARRATIVE: Keywords = “Corrosion”; “Paint”, “Clean”
HIGHER ASSY
EQUIP
DESIGNATOR
EQUIPMENT
DESIGNATOR ORGANIZATION
JOB
CONTROL
NUMBER
WUC
CD
HOW
MAL CD
WORK
CTR CD FSC
Labor
Corrosion
Cost
Material
Corrosion
Cost
T038A 2-12100-37 80FTAWG 50250318 11561 170 A3130 1560 $ 1,879 $ 43
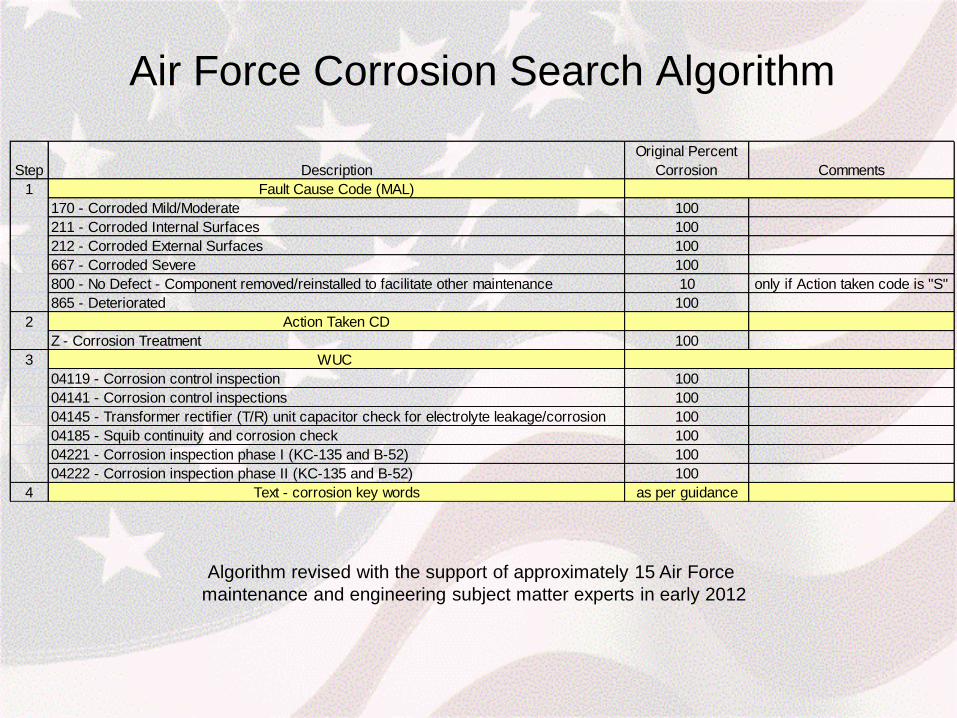
Air Force Corrosion Search Algorithm
Step Description
Original Percent
Corrosion Comments
1 Fault Cause Code (MAL)
170 - Corroded Mild/Moderate 100
211 - Corroded Internal Surfaces 100
212 - Corroded External Surfaces 100
667 - Corroded Severe 100
800 - No Defect - Component removed/reinstalled to facilitate other maintenance 10 only if Action taken code is "S"
865 - Deteriorated 100
2 Action Taken CD
Z - Corrosion Treatment 100
3 WUC
04119 - Corrosion control inspection 100
04141 - Corrosion control inspections 100
04145 - Transformer rectifier (T/R) unit capacitor check for electrolyte leakage/corrosion 100
04185 - Squib continuity and corrosion check 100
04221 - Corrosion inspection phase I (KC-135 and B-52) 100
04222 - Corrosion inspection phase II (KC-135 and B-52) 100
4 Text - corrosion key words as per guidance
Algorithm revised with the support of approximately 15 Air Force
maintenance and engineering subject matter experts in early 2012
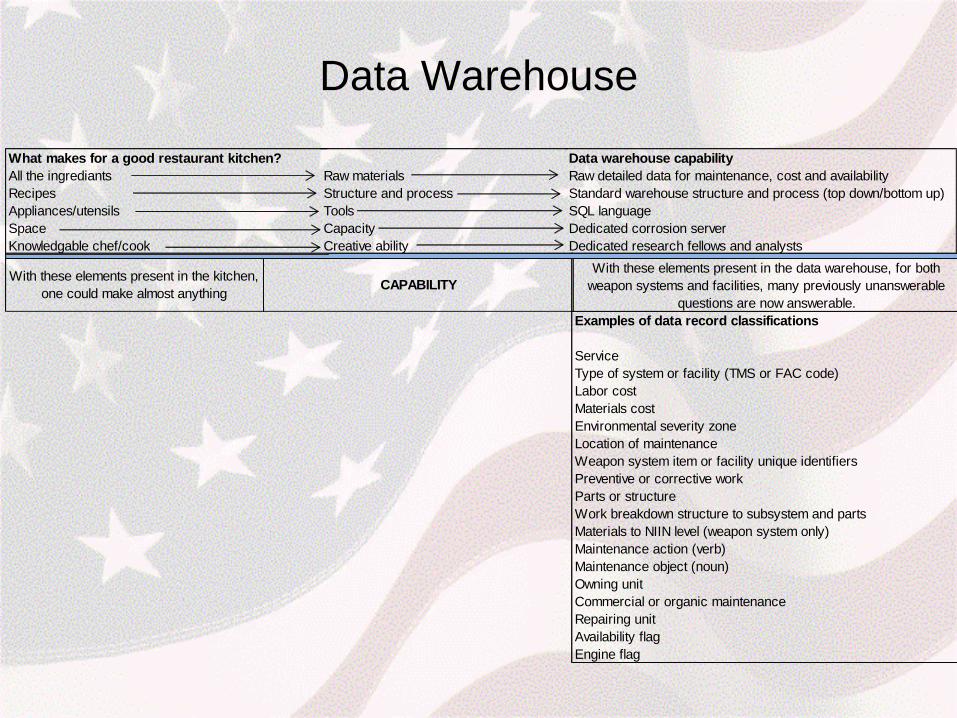
Data Warehouse
Raw materials
Structure and process
Tools
Capacity
Creative ability
Data warehouse capability
Raw detailed data for maintenance, cost and availability
Standard warehouse structure and process (top down/bottom up)
SQL language
Dedicated corrosion server
Dedicated research fellows and analysts
CAPABILITYWith these elements present in the kitchen,
one could make almost anything
What makes for a good restaurant kitchen?
All the ingrediants
Recipes
Appliances/utensils
Space
Knowledgable chef/cook
Examples of data record classifications
Service
Type of system or facility (TMS or FAC code)
Labor cost
Materials cost
Environmental severity zone
Location of maintenance
Weapon system item or facility unique identifiers
Preventive or corrective work
Parts or structure
Work breakdown structure to subsystem and parts
Materials to NIIN level (weapon system only)
Maintenance action (verb)
Maintenance object (noun)
Owning unit
Commercial or organic maintenance
Repairing unit
Availability flag
Engine flag
With these elements present in the data warehouse, for both
weapon systems and facilities, many previously unanswerable
questions are now answerable.
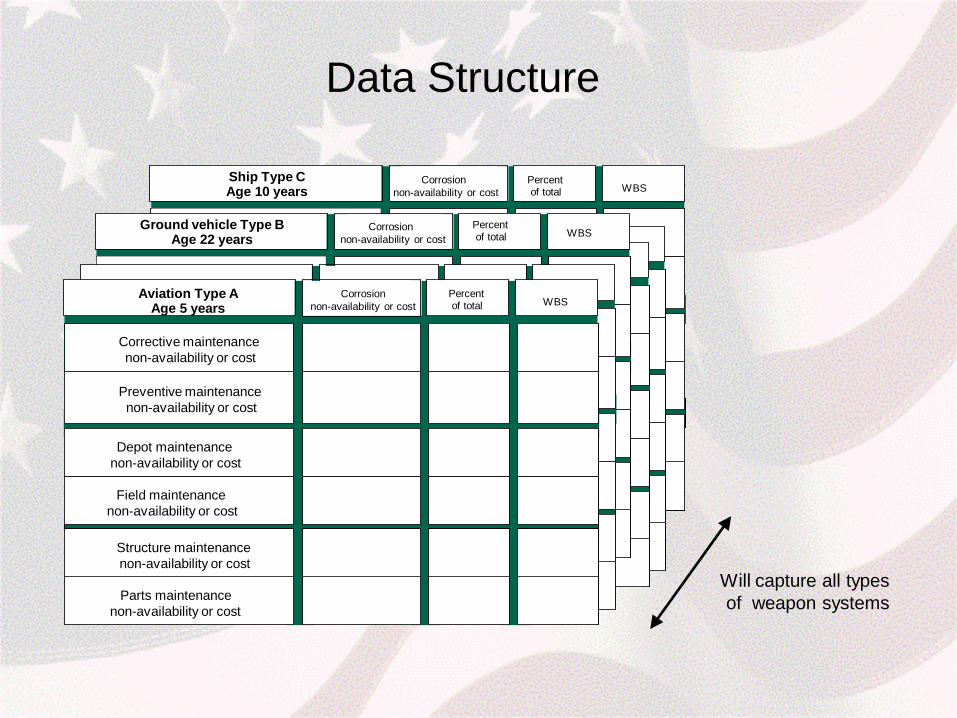
Will capture all types
of weapon systems
Structure non-available days
Parts non-available days
Corrective non-available days
Preventive non-available days
Field non-available days
Depot non-available days
Structure non-available days
Parts non-available days
Corrective non-available days
Preventive non-available days
Field non-available days
Depot non-available days
Structure non-available days
Parts non-available days
Corrective non-available days
Preventive non-available days
Field non-available days
Depot non-available days
Structure non-available days
Parts non-available days
Corrective non-available days
Preventive non-available days
Field non-available days
Depot non-available days
Structure non-available days
Parts non-available days
Corrective non-available days
Preventive non-available days
Field non-available days
Depot non-available days
WBS Percent of total
Structure maintenance
non-availability or cost
Parts maintenance
non-availability or cost
Corrective maintenance
non-availability or cost
Preventive maintenance
non-availability or cost
Field maintenance
non-availability or cost
Depot maintenance
non-availability or cost
Aviation Type A Age 5 years
Corrosion
non-availability or cost
Corrosion
non-availability or cost
WBS Percent of total
Ground vehicle Type B Age 22 years
WBS Percent of total
Ship Type C Age 10 years
Data Structure
Corrosion
non-availability or cost
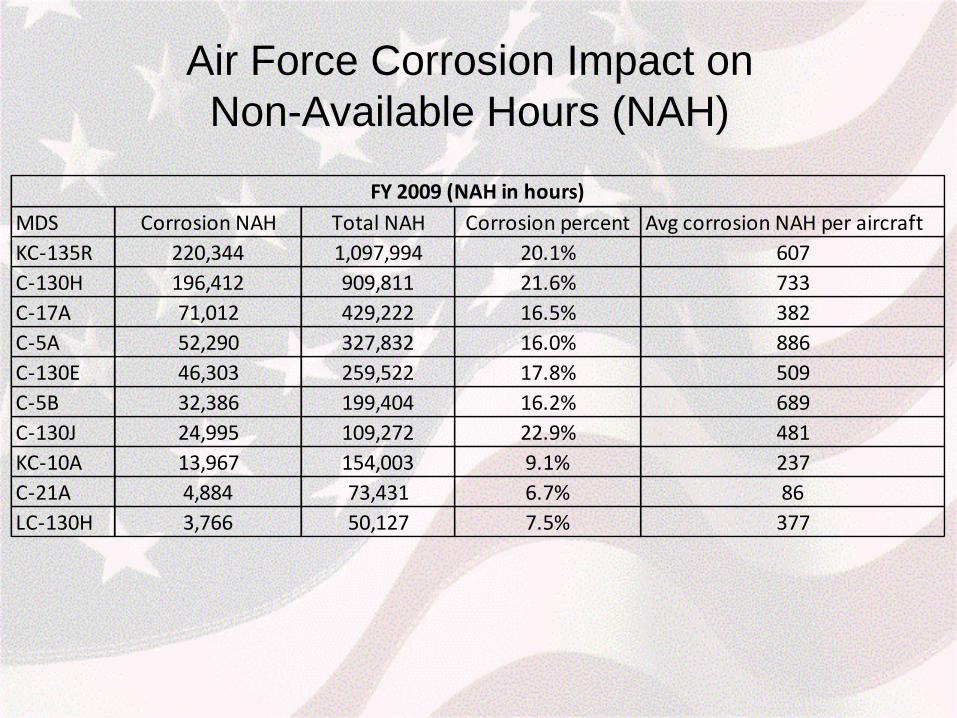
Air Force Corrosion Impact on
Non-Available Hours (NAH)
MDS Corrosion NAH Total NAH Corrosion percent Avg corrosion NAH per aircraft
KC-135R 220,344 1,097,994 20.1% 607
C-130H 196,412 909,811 21.6% 733
C-17A 71,012 429,222 16.5% 382
C-5A 52,290 327,832 16.0% 886
C-130E 46,303 259,522 17.8% 509
C-5B 32,386 199,404 16.2% 689
C-130J 24,995 109,272 22.9% 481
KC-10A 13,967 154,003 9.1% 237
C-21A 4,884 73,431 6.7% 86
LC-130H 3,766 50,127 7.5% 377
FY 2009 (NAH in hours)
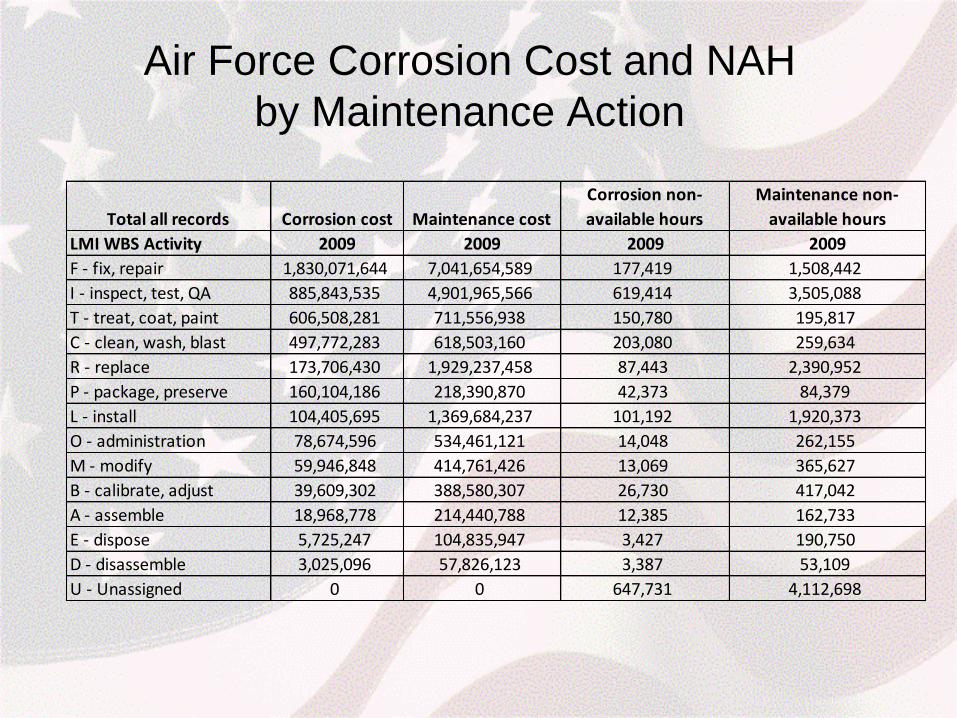
Air Force Corrosion Cost and NAH
by Maintenance Action
LMI WBS Activity 2009 2009 2009 2009
F - fix, repair 1,830,071,644 7,041,654,589 177,419 1,508,442
I - inspect, test, QA 885,843,535 4,901,965,566 619,414 3,505,088
T - treat, coat, paint 606,508,281 711,556,938 150,780 195,817
C - clean, wash, blast 497,772,283 618,503,160 203,080 259,634
R - replace 173,706,430 1,929,237,458 87,443 2,390,952
P - package, preserve 160,104,186 218,390,870 42,373 84,379
L - install 104,405,695 1,369,684,237 101,192 1,920,373
O - administration 78,674,596 534,461,121 14,048 262,155
M - modify 59,946,848 414,761,426 13,069 365,627
B - calibrate, adjust 39,609,302 388,580,307 26,730 417,042
A - assemble 18,968,778 214,440,788 12,385 162,733
E - dispose 5,725,247 104,835,947 3,427 190,750
D - disassemble 3,025,096 57,826,123 3,387 53,109
U - Unassigned 0 0 647,731 4,112,698
Total all records Corrosion cost Maintenance cost
Corrosion non-
available hours
Maintenance non-
available hours
Corrosion Assessment Guidebook
CPC IPT product developed with Service involvement to provide a
guide for how to best exploit the cost of corrosion study data.
Next Steps
Services exploit impact of corrosion data
Continue schedule of impact of corrosion studies –
each study every year?
Use data warehouse availability and cost data to help services
by developing predictive tools.