Embed Size (px)
Citation preview
CORROSION POTENTIALS OF LIGHTWEIGHT CONCRETE WRAPPED WITH
FIBER REINFORCED POLYMERS (FRP)
by
ERIC GOUCHER
Presented to the Faculty of the Graduate School of
The University of Texas at Arlington in Partial Fulfillment
of the Requirements
for the Degree of
MASTER OF SCIENCE IN CIVIL ENGINEERING
THE UNIVERSITY OF TEXAS AT ARLINGTON
December 2013

ii
Copyright © by Eric Goucher 2013
All Rights Reserved

iii
Acknowledgements
I would like to thank Jack Sinclair of Trinity ES&C for donating the lightweight aggregates
for use on this project.
I would like to thank Dr. Yazdani and Dr. Chao for all of their help they have given me
during my time at UTA. Dr. Yazdani in particular has given me some very insightful ideas that
have helped me to do this research. I would also like to thank Dr. Prabakar for his assistance.
I want to thank Istiaque Hasan and Joseph Williams for both of their help with me while
doing this experiment. Istiaque's knowledge and Joseph's hard work made this research
possible.
I want to thank everyone at UTA who I have been fortunate to become friends with over
the past two years. It made the journey all the much more enjoyable.
Finally, thanks to my family: my parents and my brother, whose support has always
enabled me to keep moving forward.
November 25, 2013
iv
Abstract
CORROSION POTENTIALS OF LIGHTWEIGHT CONCRETE
WRAPPED WITH FIBER REINFORCED
POLYMERS (FRP)
Eric Goucher, M.S.
The University of Texas at Arlington, 2013
Supervising Professor: Nur Yazdani
The purpose of this research was to investigate the effects of Fiber Reinforced Polymer
wraps on corrosion protection of lightweight concrete. Many studies have been undertaken for
normal density concrete, but there are very few studies regarding lightweight concrete and
externally bonded FRP wraps. This experiment involved the use of an accelerated corrosion test
to determine the corrosion protection that FRP would afford lightweight concrete, while making a
comparison with a similarly proportioned normalweight mix. 42 cylinders were subject to an
constant 12 V power from a DC Power Supply while being immersed in a 5% NaCl for a period of
50 days. Samples were removed from the tank after failure and analyzed for chloride content and
rebar mass loss. Current measurements were taken daily. The results indicated that both
lightweight concrete and normalweight concrete greatly benefited from FRP wrapping in terms of
increased time to failure and a reduction in rebar mass loss. Lightweight concrete generally
performed better when wrapped with CFRP, whereas normalweight concrete generally performed
better when wrapped with GFRP.
v
Table Of Contents
Acknowledgements .......................................................................................................................... iii
Abstract ........................................................................................................................................... iv
List Of Illustrations ........................................................................................................................... vii
List Of Tables ................................................................................................................................. viii
Chapter 1 Introduction…………………………………..………..….................................................... 1
1.1 Background ............................................................................................................................. 1
1.2 Research Objectives ............................................................................................................... 3
Chapter 2 Literature Review ........................................................................................................... 4
2.1 Structural Lightweight Aggregate Concrete ............................................................................ 4
2.1.1 History of Structural Lightweight Aggregate Concrete .................................................... 4
2.1.2 Structural Lightweight Aggregate Properties .................................................................. 5
2.1.3 Permeability of Lightweight Concrete ............................................................................. 6
2.1.4 Types of Structural Lightweight Concrete ....................................................................... 7
2.1.5 Structural Lightweight Concrete Applications ................................................................. 8
2.1.6 Structural Lightweight Concrete Use in Texas................................................................ 9
2.2 Fiber Reinforced Polymers ................................................................................................... 11
2.2.1 History of FRP Composites........................................................................................... 11
2.2.2 FRP Composite Properties ........................................................................................... 12
2.2.2.1 FRP Fibers............................................................................................................12
2.2.2.2 Resin Matrix..........................................................................................................13
2.2.3 Externally Bonded FRPs ............................................................................................... 14
2.2.4 Application methods of FRP ......................................................................................... 15
2.2.5 Uses of FRP in the construction industry ...................................................................... 15
2.3 Corrosion of Steel Embedded in Concrete ........................................................................... 17
2.3.1 Corrosion Mechanics .................................................................................................... 17
vi
2.3.2 Properties of concrete that affect corrosion .................................................................. 19
2.3.3 Corrosion studies of Structural Lightweight Concrete .................................................. 20
2.3.4 Corrosion studies of concrete treated with FRP strengthening systems ...................... 22
2.3.4.1 Accelerated Corrosion Tests Using Impressed Current........................................23
Chapter 3 Procedure ...................................................................................................................... 30
3.1 Background on the experiment ............................................................................................. 30
3.2 Specimen Preparation .......................................................................................................... 31
3.2.2 Concrete mix design ..................................................................................................... 33
3.2.2.1 Design Considerations..........................................................................................33
3.2.2.2 Concrete mixing....................................................................................................34
3.2.2.3 Determination of concrete properties....................................................................36
3.2.2.4 Reinforcing Bars....................................................................................................38
3.2.3 FRP application ............................................................................................................. 40
3.2.3.1 FRP properties......................................................................................................40
3.2.3.2 FRP wrap configurations and specimen labeling..................................................47
3.2.3.3 FRP wrapping procedure......................................................................................48
3.3 Accelerated Corrosion Test .................................................................................................. 51
3.3.1 Background on the test ................................................................................................. 51
3.3.2 Test Setup ..................................................................................................................... 52
3.3.3 Current Measurements ................................................................................................. 56
3.3.4 ASTM C1152 Standard Test Method for Acid-Soluble Chloride in Mortar and
Concrete..........................................................................................................................58
3.3.5 Rebar Mass Loss .......................................................................................................... 62
Chapter 4 Results and Discussion ................................................................................................. 66
4.1 Test Life.... ............................................................................................................................ 66
4.1.1 Sample Identification ..................................................................................................... 66
4.1.2 Length of time until sample removal (Test Life) ............................................................ 67
vii
4.1.2.1 Wrapped Lightweight Concrete vs Control Samples.............................................68
4.1.2.2 Wrapped Normalweight Concrete vs Control Samples.........................................69
4.1.2.3 Lightweight Concrete vs Normalweight Concrete.................................................70
4.1.3 Types of Sample Failures ............................................................................................. 71
4.1.3.1 Cracking in concrete substrate..............................................................................72
4.1.3.2 Delamination of the FRP from the Substrate.........................................................72
4.1.3.3 FRP Rupture.........................................................................................................74
4.1.3.4 Excessive Localized Current.................................................................................74
4.1.3.5 End of the test.......................................................................................................76
4.2 Chloride Content.... ............................................................................................................... 77
4.3 Rebar Mass Loss.... .............................................................................................................. 80
4.4 Current Measurements.... ..................................................................................................... 83
4.5 Discussion.... ......................................................................................................................... 85
Chapter 5 Conclusions and Recommendations..........………..….................................................. 89
Appendix A Concrete Properties..........………..…......................................................................... 92
Appendix B ASTM C1152 Example Calculation............................................................................ 95
References..................................................................................................................................... 97
Biographical Information.............................................................................................................. 102
viii
List Of Illustrations
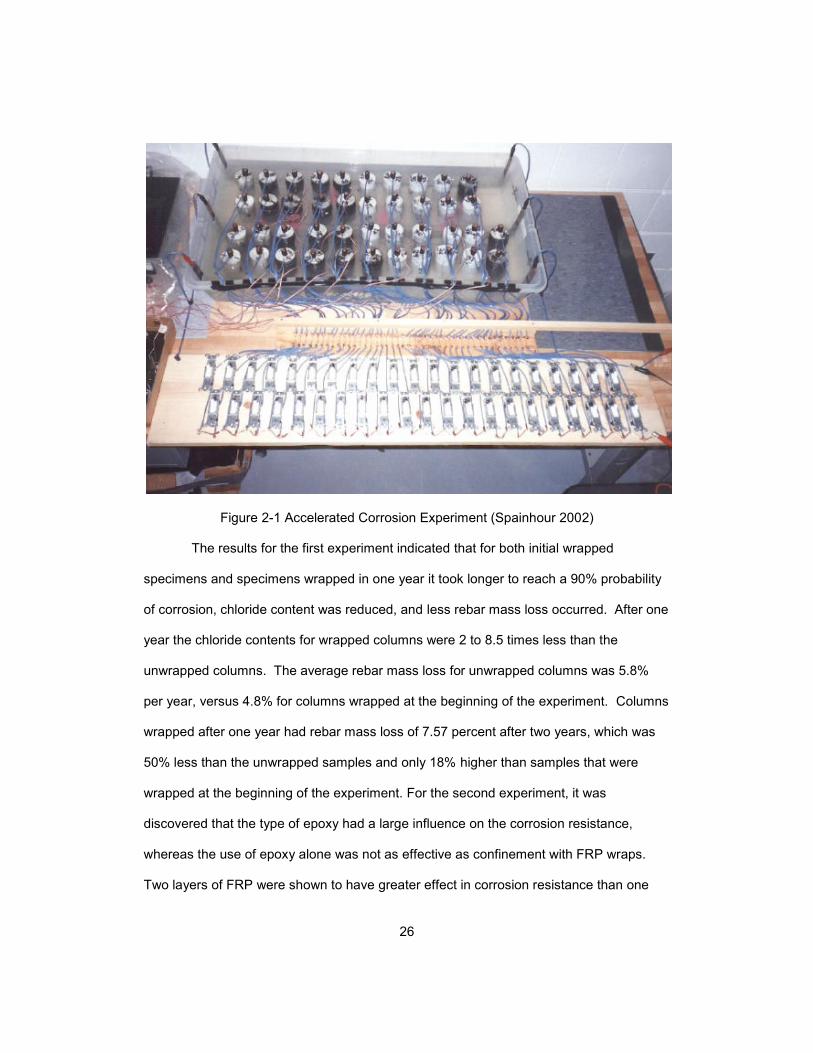
Figure 2-1 Accelerated Corrosion Experiment (Spainhour 2002) .................................................. 25
Figure 3-1 3/4" Expanded Shale Streetman Aggregate from ESCSI ............................................ 32
Figure 3-2 Normalweight Aggregates from UTA stock, sieved to 3/4" maximum size .................. 32
Figure 3-3 Lightweight Aggregates Soaking .................................................................................. 35
Figure 3-4 Fresh Lightweight Concrete Mix ................................................................................... 36
Figure 3-5 Concrete in the Curing Chamber .................................................................................. 39
Figure 3-6 Tyfo SEH-51A Glass Composite Laminate .................................................................. 44
Figure 3-7 Tyfo SCH-41 Carbon Composite Laminate .................................................................. 44
Figure 3-8 DC Power Supply ......................................................................................................... 52
Figure 3-9 Experiment Setup ......................................................................................................... 53
Figure 3-10 Wiring in parallel ......................................................................................................... 54
Figure 3-11 Samples completely wired and partially submerged in salt solution .......................... 54
Figure 3-12 Ammeter connected as part of the circuit ................................................................... 57
Figure 3-13 Concrete sample dispersed with water (NW on left, LW on right) .............................. 61
Figure 3-14 Lightweight Concrete sample cooling. ........................................................................ 62
Figure 3-15 Normalweight Concrete titration ................................................................................. 62
Figure 3-16 Rebar submerged in acid ........................................................................................... 63
Figure 3-17 Rebar before corrosion removal ................................................................................. 64
Figure 3-18 Rebar after corrosion removal .................................................................................... 64
Figure 3-19 Weighing the cleaned rebar ........................................................................................ 65
Figure 4-1 Lightweight Concrete Sample Test Life ........................................................................ 67
Figure 4-2 Normalweight Concrete Sample Test Life .................................................................... 67
Figure 4-3 Concrete Cracking ........................................................................................................ 72
Figure 4-4 Debonding of the FRP from the substrate .................................................................... 73
Figure 4-5 FRP rupture in Sample 21 ............................................................................................ 74
ix
Figure 4-6 Localized Corrosion at the Concrete-Rebar Interface .................................................. 76
Figure 4-7 Rebar subjected to extreme localized corrosion .......................................................... 76
Figure 4-8 Percent Chloride in Lightweight Concrete Samples ..................................................... 78
Figure 4-9 Percent Chloride in Normalweight Concrete Samples ................................................. 78
Figure 4-10 Average Rebar Mass Loss ......................................................................................... 81
x
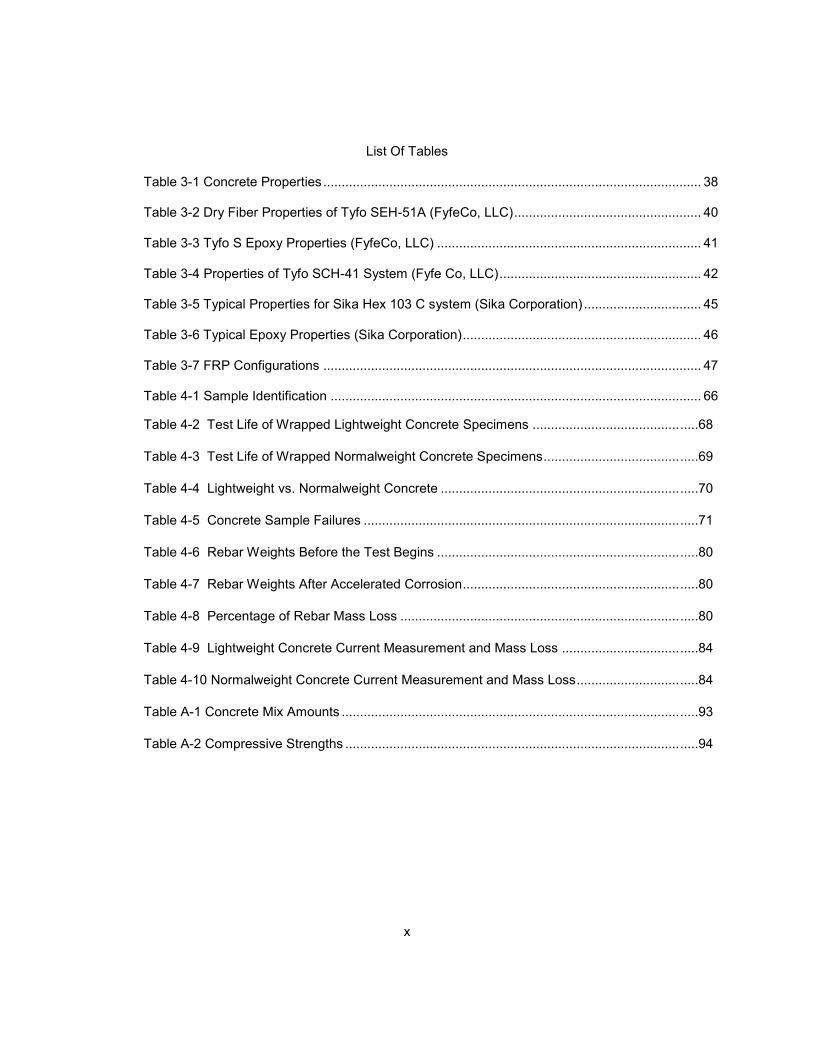
List Of Tables
Table 3-1 Concrete Properties ....................................................................................................... 38
Table 3-2 Dry Fiber Properties of Tyfo SEH-51A (FyfeCo, LLC) ................................................... 40
Table 3-3 Tyfo S Epoxy Properties (FyfeCo, LLC) ........................................................................ 41 Table 3-4 Properties of Tyfo SCH-41 System (Fyfe Co, LLC) ....................................................... 42 Table 3-5 Typical Properties for Sika Hex 103 C system (Sika Corporation) ................................ 45 Table 3-6 Typical Epoxy Properties (Sika Corporation) ................................................................. 46 Table 3-7 FRP Configurations ....................................................................................................... 47 Table 4-1 Sample Identification ..................................................................................................... 66
Table 4-2 Test Life of Wrapped Lightweight Concrete Specimens ........................................ .....68
Table 4-3 Test Life of Wrapped Normalweight Concrete Specimens ..................................... .....69
Table 4-4 Lightweight vs. Normalweight Concrete ................................................................. .....70
Table 4-5 Concrete Sample Failures ...................................................................................... .....71
Table 4-6 Rebar Weights Before the Test Begins .................................................................. .....80
Table 4-7 Rebar Weights After Accelerated Corrosion ........................................................... .....80
Table 4-8 Percentage of Rebar Mass Loss ............................................................................ .....80
Table 4-9 Lightweight Concrete Current Measurement and Mass Loss ................................ .....84
Table 4-10 Normalweight Concrete Current Measurement and Mass Loss ............................ .....84
Table A-1 Concrete Mix Amounts ............................................................................................ .....93
Table A-2 Compressive Strengths ........................................................................................... .....94
1
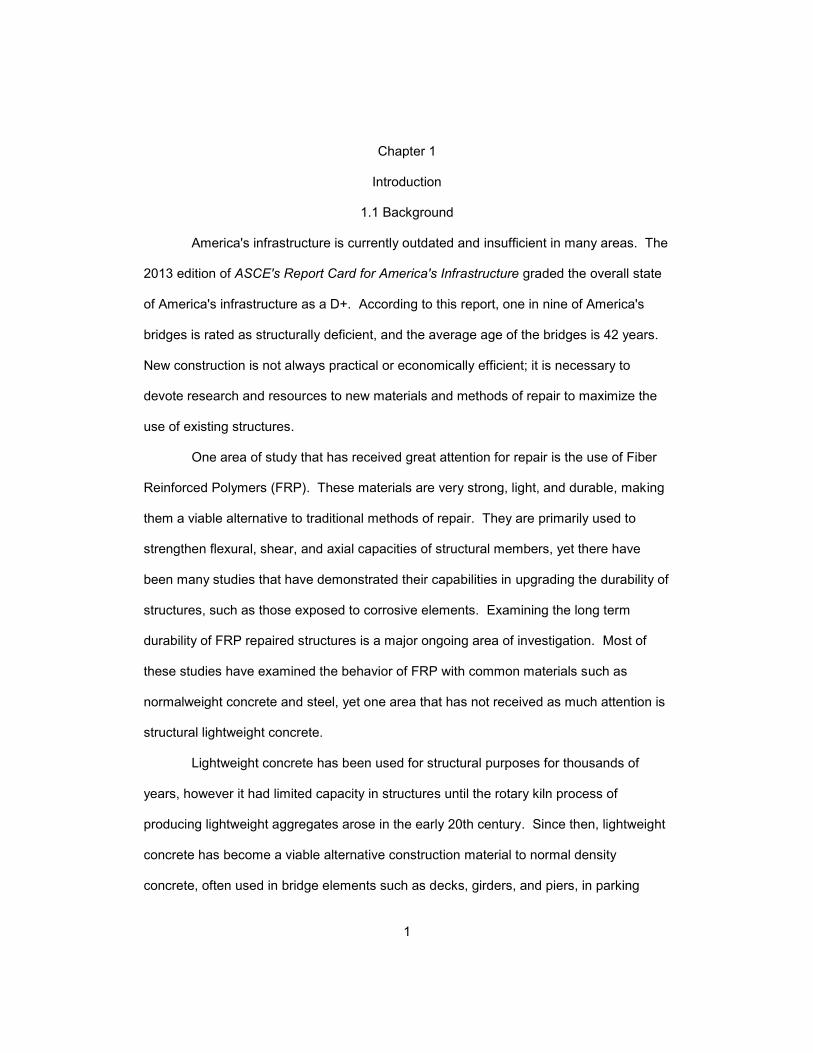
Chapter 1
Introduction
1.1 Background
America's infrastructure is currently outdated and insufficient in many areas. The
2013 edition of ASCE's Report Card for America's Infrastructure graded the overall state
of America's infrastructure as a D+. According to this report, one in nine of America's
bridges is rated as structurally deficient, and the average age of the bridges is 42 years.
New construction is not always practical or economically efficient; it is necessary to
devote research and resources to new materials and methods of repair to maximize the
use of existing structures.
One area of study that has received great attention for repair is the use of Fiber
Reinforced Polymers (FRP). These materials are very strong, light, and durable, making
them a viable alternative to traditional methods of repair. They are primarily used to
strengthen flexural, shear, and axial capacities of structural members, yet there have
been many studies that have demonstrated their capabilities in upgrading the durability of
structures, such as those exposed to corrosive elements. Examining the long term
durability of FRP repaired structures is a major ongoing area of investigation. Most of
these studies have examined the behavior of FRP with common materials such as
normalweight concrete and steel, yet one area that has not received as much attention is
structural lightweight concrete.
Lightweight concrete has been used for structural purposes for thousands of
years, however it had limited capacity in structures until the rotary kiln process of
producing lightweight aggregates arose in the early 20th century. Since then, lightweight
concrete has become a viable alternative construction material to normal density
concrete, often used in bridge elements such as decks, girders, and piers, in parking
2
garages, for office buildings, and for offshore platforms (ACI Committee 213). One
prominent example is the Benicia-Martinez Bridge in California which uses high strength,
sand-lightweight concrete in the entire superstructure, except at the pier caps (Murugesh,
2008). This bridge was the most cost effective of the options specified. Lightweight
aggregate concrete, as its name suggests, contains lighter aggregates than normal
density concrete, which can lead to advantages such as lesser dead load on structures
which lowers the total weight of the structure. This can involve savings in both costs and
weight, which can have advantages in reducing seismic forces. The National
Cooperative Highway Research Program released report 733 (NCHRP, 2013) for high-
performance/high-strength lightweight concrete for bridge girders and decks. This report
suggested changes to parts of the AASHTO code in aspects such as creep and
shrinkage losses, as well as equations to predict the modulus of elasticity and modulus of
rupture. This report demonstrates the interest in using lightweight concrete as an
alternative material to normal density concrete as the strength of lightweight concrete to
reach comparable levels to normal weight concrete.
Despite these advantages, there are some drawbacks to the use of structural
lightweight concrete. Many of these drawbacks are described in the construction of the
Benicia-Martinez Bridge (Murugesh, 2008). Lightweight concrete in general has a lower
modulus of elasticity and higher creep and shrinkage than normal density concrete. In
seismic regions, high-performance concrete is often required to obtain the necessary
strength and modulus of elasticity. For lightweight concrete this requires a very high
amount of cement, which can make concrete brittle. Higher shrinkage can lead to
cracking in concrete. Many of these issues can be mitigated through the use of
supplementary cementitious materials and strong quality control measures, however
instances where poor practices and inexperience with the use of new materials can lead
3
to cracking and problems where repair may be needed. This makes it necessary to
research materials such as FRP to examine their behavior when used on lightweight
concrete, in particular with regard to the aspect of enhanced durability when exposed to
corrosive elements.
1.2 Research Objectives
The objective of this research is to examine the corrosion potentials of lightweight
concrete with and without FRP. A lightweight concrete mix and a similarly proportioned
normalweight concrete mix will be examined with and without FRP wraps. The samples
therein will be exposed to an electric current and chloride solution. The corrosion activity
will be monitored through impressed current flows, and reinforcement mass loss and
chloride content will be examined. The effects of lightweight aggregate concrete
reinforced with externally bonded FRP are not well known. ACI report 440.2 R-08 (ACI
Committee 440, 2008) notes this, and recommends examining the these effects in its
areas of future research. Since there is little information on this subject, this research is a
preliminary investigation into the effects of FRP and lightweight concrete with respect to
corrosion protection.
4
Chapter 2 Literature Review
2.1 Structural Lightweight-Aggregate Concrete
Structural lightweight concrete is defined as concrete which is made with
lightweight aggregates conforming to ASTM C330, has a compressive strength in excess
of 2500 psi at 28 days of age when tested in accordance with methods stated in ASTM C
330, and has an equilibrium weight not exceeding 115 lb/ft3 as determined by ASTM C
567 (ACI Committee 211, 1998). This definition is not a specification but rather a
guideline of sorts, as most projects containing lightweight concrete have densities in the
range of 105-120 lb/ft3. Densities in the range of 70-105 lb/ft
3 are not frequently used
(ACI Committee 213, 2003).
The passages below will explain some of the history, properties, and applications
of lightweight aggregates and lightweight concrete.
2.1.1 History of Structural Lightweight-Aggregate Concrete
Lightweight concrete has been used in structures for thousands of years. The
Mediterranean region used natural lightweight aggregates from volcanic material to
produce some early lightweight concrete structures. However, it wasn't until the 1900's
and the invention of the rotary kiln process to manufacture lightweight aggregates that
the material would become available for widespread commercial use. Ships and barges
were some of the early adopters of reinforced lightweight concrete. The late 1940s
brought about the use of lightweight concrete for home construction. In the 1950s multi
story structures began using lightweight concrete, particularly in floor slabs, to reduce
dead loads on the foundations. These different applications brought about an interest in
studying the properties of lightweight concrete to produce concrete in applications that
require high strength and performance. Research to produce high-strength lightweight
concrete began in the 1980's, with the results produced in 1992. This research has
5
allowed lightweight concrete to be considered in areas that require high strength and
durability, allowing it to be considered as a viable alternative to normalweight concrete in
many applications (ACI Committee 213, 2003).
2.1.2 Structural Lightweight-Aggregate Properties
The rotary kiln process of manufacturing lightweight aggregates involves slowly
heating a small particle of shale, clay, or slate in order to remove gases from the
aggregate. These gases leave behind small cavities or pores that are retained after the
aggregate has cooled. Thus, when lightweight aggregate is manufactured it develops a
cellular structure, containing a system of pores in the range of 5 to 300 m (ACI
committee 213, 2003). This structure allows the lightweight aggregate to have much
lower bulk and relative densities than its normalweight counterpart. Another effect of this
pore system is that water absorption occurs directly into the aggregate itself, versus
normalweight aggregate in which it occurs primarily on the surface. Lightweight
aggregates can absorb from 5 to 25% of water by mass of the dry aggregate, whereas
normalweight aggregates can absorb only around 2%.
The absorptive properties of lightweight aggregates create a condition known as
internal curing when concrete is produced. Internal curing is a time-dependent process
where moisture absorbed in the pores of lightweight concrete are slowly released into the
cementitious portion of the concrete. This creates further hydration of the cement matrix
in lightweight concrete over a long period of time, leading to long term strength
improvements. (ACI Committee 213, 2003). The lengthened curing time increases the
volume of cementitious products formed, which makes the pores in the cement paste
closed or segmented (ACI Committee 213, 2003). Pores must be connected for harmful
agents such as chlorides to have a path to the reinforcing bar. If these pores are
segmented, there is no path for chlorides to travel, which reduces permeability.
6
2.1.3 Permeability of Lightweight Concrete
Lightweight aggregates are porous, therefore it would be a logical assumption
that the permeability of lightweight concretes would be higher than for similarly
proportioned normalweight concretes. However, ACI Report 213R (ACI Committee 213,
2003) notes several research studies that have shown that lightweight concrete has
equal or lesser permeability than its normalweight counterpart .The primary reason for
this is the superior interfacial transition zone between the aggregate and cement binder
for lightweight concrete as opposed to the interface in normalweight concrete. Concrete
permeability is generally a function of the quality of the cement matrix; lower quality
pastes may develop micro cracks at the aggregate-cement matrix interface when
stresses are applied that increase the susceptibility of the concrete to the intrusion of
corrosive liquids. The improved aggregate-cement binder interface for lightweight
concrete relies on various properties of the lightweight aggregate. The interface is a
product of both mechanical interlocking between the lightweight aggregate and cement
binder as well as a chemical interaction (Chandra and Bertsson, 2003). The chemical
interaction involves a pozzolanic reaction between the lightweight aggregate and the
cement binder. Aluminum and silicate products form on the surface of lightweight
aggregates when they are fired at high temperatures during manufacturing. These
products combine with calcium hydroxide to form new chemical products that help
improve the interface. Another reason for the improved interface is the hygrol equilibrium
that occurs in lightweight aggregates and the surrounding concrete paste (ACI
Committee 213, 2003). In normal density concrete the aggregates contain very little
absorption (around 2%). The surrounding cement matrix will contain much more water
than the normal density aggregate, which will surround the particle instead of being
absorbed into it and therefore will result in water bleeding. This bleeding can cause small
7
voids to occur. Lightweight aggregates due to their porous nature will contain water in
them. This creates a balance between the water of the cement matrix and the water of
the aggregate, which will in turn reduce the amount of bleeding which occurs and thus
reduce the number of voids that occur. The similar elastic properties of the lightweight
aggregate and the cement matrix also contributes to the interface zone (ACI Committee
213, 2003. The elastic properties in normal density aggregate are greater than the
surrounding cement matrix. When stresses are applied to the concrete, this causes a
differential stress in the cement matrix and the stiffer aggregate to occur, resulting in
micro cracking. In lightweight concrete, the closer properties of the aggregate and
cement matrix result in reduced or eliminated differential stresses. Also, as mentioned in
the previous section, internal curing can extend the curing time of the cement products,
which improves the cement paste and reduces the amount of connected pores that allow
harmful substances to pass through to the reinforcing steel.
2.1.4 Types of Structural Lightweight Concrete
There are two different types of concrete that are made with lightweight
aggregates: sand-lightweight concrete and all-lightweight concrete. Sand-lightweight
concrete contains coarse lightweight aggregates and normalweight fine aggregates,
generally sand. This is the most commonly used lightweight aggregate for structural
purposes, due to the fact that it provides a weight reduction at a reduced cost compared
to all-lightweight concrete .All-lightweight concrete contains lightweight aggregates in
both the coarse and fine aggregate portions of the concrete mix. This type of concrete is
generally lighter than sand-lightweight concrete, but is more expensive. Due to the
porous nature of the lightweight aggregates, all-lightweight concrete is also much more
porous than sand-lightweight concrete, which can lead to greater chloride penetration.
8
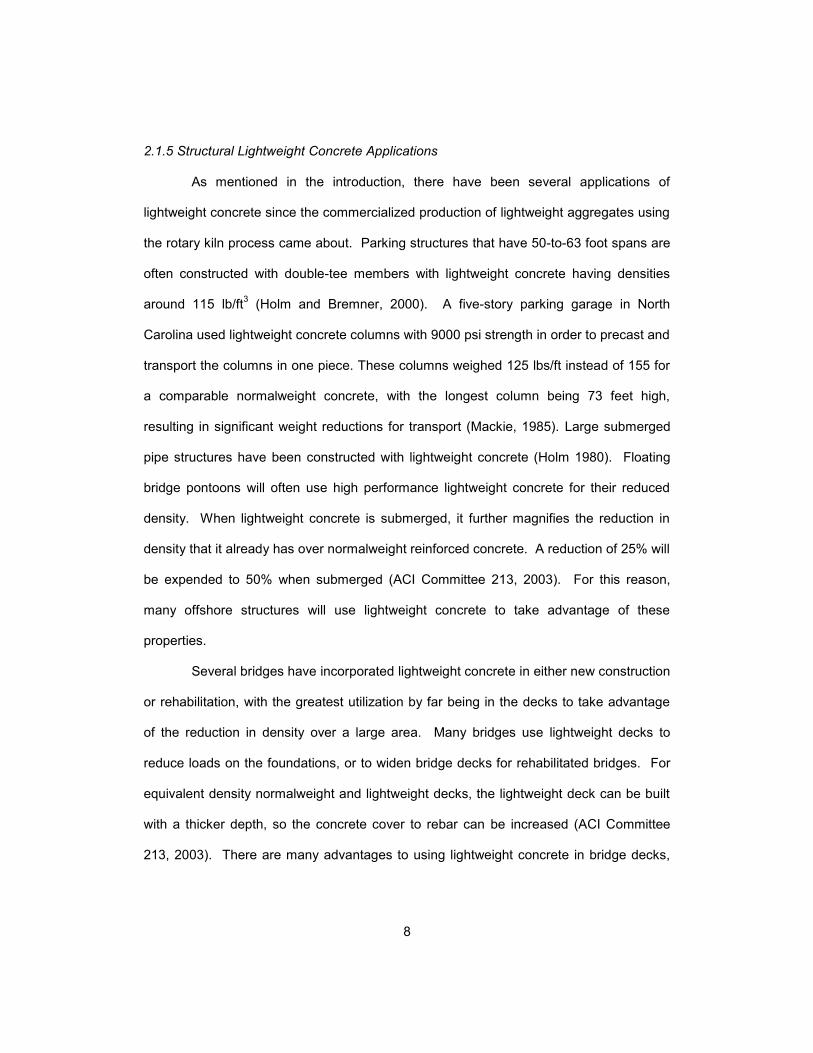
2.1.5 Structural Lightweight Concrete Applications
As mentioned in the introduction, there have been several applications of
lightweight concrete since the commercialized production of lightweight aggregates using
the rotary kiln process came about. Parking structures that have 50-to-63 foot spans are
often constructed with double-tee members with lightweight concrete having densities
around 115 lb/ft3 (Holm and Bremner, 2000). A five-story parking garage in North
Carolina used lightweight concrete columns with 9000 psi strength in order to precast and
transport the columns in one piece. These columns weighed 125 lbs/ft instead of 155 for
a comparable normalweight concrete, with the longest column being 73 feet high,
resulting in significant weight reductions for transport (Mackie, 1985). Large submerged
pipe structures have been constructed with lightweight concrete (Holm 1980). Floating
bridge pontoons will often use high performance lightweight concrete for their reduced
density. When lightweight concrete is submerged, it further magnifies the reduction in
density that it already has over normalweight reinforced concrete. A reduction of 25% will
be expended to 50% when submerged (ACI Committee 213, 2003). For this reason,
many offshore structures will use lightweight concrete to take advantage of these
properties.
Several bridges have incorporated lightweight concrete in either new construction
or rehabilitation, with the greatest utilization by far being in the decks to take advantage
of the reduction in density over a large area. Many bridges use lightweight decks to
reduce loads on the foundations, or to widen bridge decks for rehabilitated bridges. For
equivalent density normalweight and lightweight decks, the lightweight deck can be built
with a thicker depth, so the concrete cover to rebar can be increased (ACI Committee
213, 2003). There are many advantages to using lightweight concrete in bridge decks,
9
and oftentimes their advantages in weight reductions have offset the increased costs that
lightweight aggregates have over normalweight concrete.
With greater strengths being realized by lightweight concretes, bridge girders
have also been able to take advantage of the use of lightweight concrete. The Parrotts
Ferry Bridge in California used precast, post-tensioned single cell box girders in the
bridge (Mackie, 1985). This bridge was built in the 1970s and at the time was the longest
span built in the US by the segmental cantilever construction method, at 640 feet. The
Benicia-Martinez Bridge mentioned in the introduction contains lightweight concrete
throughout the superstructure. This bridge is another segmental bridge with span lengths
from 525 to 663 feet, for a total 1.4 mile long crossing (Murugesh 2008). In regions of
seismic activity lightweight concrete is particularly being utilized due to the reduction in
dead load.
The Guide for Structural Lightweight-Aggregate Concrete (ACI Committee 213,
2003) has also mentioned that lightweight concrete has been used for bridge piers, but
specific instances of that have been very difficult to find in the literature. It is certainly
much less common to use lightweight concrete for the bridge substructure as it is for the
superstructure.
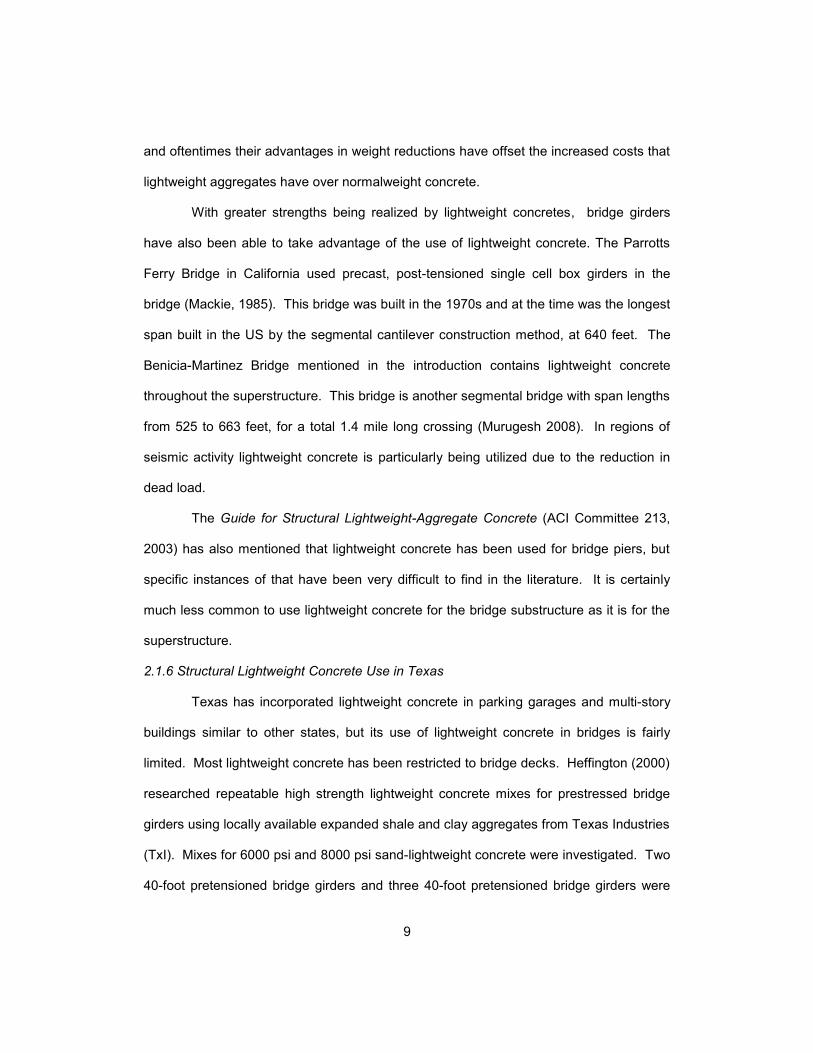
2.1.6 Structural Lightweight Concrete Use in Texas
Texas has incorporated lightweight concrete in parking garages and multi-story
buildings similar to other states, but its use of lightweight concrete in bridges is fairly
limited. Most lightweight concrete has been restricted to bridge decks. Heffington (2000)
researched repeatable high strength lightweight concrete mixes for prestressed bridge
girders using locally available expanded shale and clay aggregates from Texas Industries
(TxI). Mixes for 6000 psi and 8000 psi sand-lightweight concrete were investigated. Two
40-foot pretensioned bridge girders and three 40-foot pretensioned bridge girders were
10
fabricated from the 6000 psi and 8000 psi mixes, respectively. Strength, creep,
shrinkage, and workability tests were carried out. The results of the research indicated
the 6000 psi mix performed very well and could be respecified as a 7000 psi mix,
whereas the 8000 psi mix did not perform adequately and was changed to a 7500 psi
mix. The research recommended that lightweight deck panels be considered as an
alternative to normalweight deck panels, and that lightweight girders be used as an
alternative to normalweight girders if necessary. In February 2002 TxDoT stated it would
not implement deck panels due to questions regarding economic feasibility and tensile
stress limits (Heffington et al., 2001). Information on the current status of high
performance precast lightweight concrete use in Texas is not readily available.
11
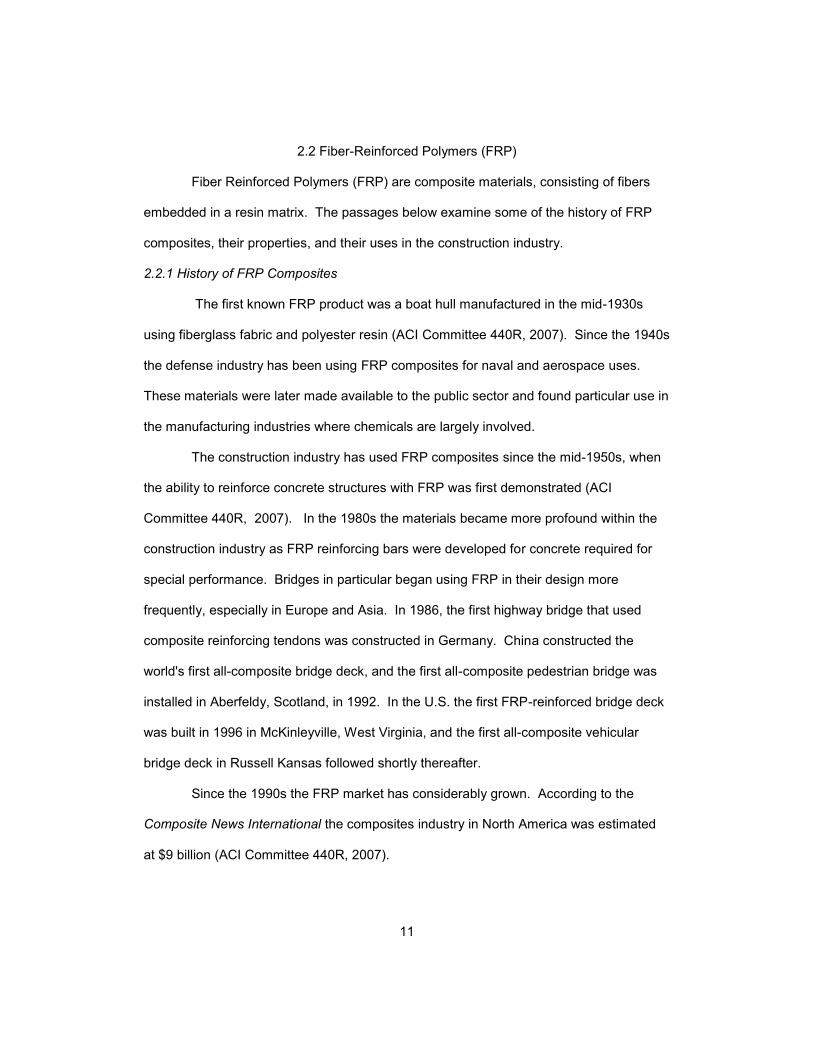
2.2 Fiber-Reinforced Polymers (FRP)
Fiber Reinforced Polymers (FRP) are composite materials, consisting of fibers
embedded in a resin matrix. The passages below examine some of the history of FRP
composites, their properties, and their uses in the construction industry.
2.2.1 History of FRP Composites
The first known FRP product was a boat hull manufactured in the mid-1930s
using fiberglass fabric and polyester resin (ACI Committee 440R, 2007). Since the 1940s
the defense industry has been using FRP composites for naval and aerospace uses.
These materials were later made available to the public sector and found particular use in
the manufacturing industries where chemicals are largely involved.
The construction industry has used FRP composites since the mid-1950s, when
the ability to reinforce concrete structures with FRP was first demonstrated (ACI
Committee 440R, 2007). In the 1980s the materials became more profound within the
construction industry as FRP reinforcing bars were developed for concrete required for
special performance. Bridges in particular began using FRP in their design more
frequently, especially in Europe and Asia. In 1986, the first highway bridge that used
composite reinforcing tendons was constructed in Germany. China constructed the
world's first all-composite bridge deck, and the first all-composite pedestrian bridge was
installed in Aberfeldy, Scotland, in 1992. In the U.S. the first FRP-reinforced bridge deck
was built in 1996 in McKinleyville, West Virginia, and the first all-composite vehicular
bridge deck in Russell Kansas followed shortly thereafter.
Since the 1990s the FRP market has considerably grown. According to the
Composite News International the composites industry in North America was estimated
at $9 billion (ACI Committee 440R, 2007).
12
2.2.2 FRP Composite Properties
As noted earlier, FRP composites consist of strong fibers embedded in a resin
matrix. The role of the fibers in the composites is to provide strength/load-bearing
capacity and stiffness, whereas the role of the polymer matrix is to keep the fibers in
place, allow stress transfer between fibers, and provide protection from the environment.
FRP composites are anisotropic materials. They are typically strongest along the
length of the fiber itself, and weakest along the transverse direction of the fiber. This is
different from isotropic materials such as steel where their mechanical properties are the
same regardless of orientation. They also differ from steel by exhibiting elastic behavior
until failure. When FRP fails it is generally a very brittle form of failure, whereas steel will
go through a plastic state of failure and yield before it fails.
2.2.2.1 FRP Fibers
As a composite material, FRP properties are a function of both the fiber and
polymer matrix. The selection of materials that comprise the FRP composite must be
made with an understanding of what the material will be used for. There are three
common fiber types used for FRP systems: glass, carbon, and aramid.
Glass fibers are the most commonly used type, due to the fact that they are less
expensive than carbon fibers while still providing high strength properties. Commercial
glass fibers are available as electrical grade (E-glass), which is the most commonly used
general-purpose FRP fiber; high strength (S-2) glass, improved acid resistance (ECR
glass), and alkali resistant (AR glass). Glass is denser than carbon and aramid fiber
types, and is a very good electrical and thermal insulator (ACI Committee 440R, 2007).
Carbon fibers are about five to ten times more expensive than glass fibers, but
they have twice the strength and four times the stiffness of glass fibers (ACI Committee
13
440R, 2007). They are also very durable. Since they are very expensive, they are most
suitable in situations such as bridge repair where high strength may be needed.
Aramid fibers are organic fibers. They have very low density, high strength, and
provide impact resistance. They degrade under exposure to ultraviolet radiation, and
they absorb moisture up to 10% of their fiber weight (Gangarao et. al., 2006). As such,
they are not suited as well as carbon fibers for applications in harsh environments.
ACI 440R-07 gives typical properties of the different types of fibers. E-glass has
a tensile strength of 500 ksi and a tensile modulus of 10,500 ksi. Carbon fibers range
from 275 to 820 ksi in tensile strength and 32,000 to 110,000 ksi in tensile modulus.
Aramid kevlar has a tensile strength of 525 ksi and a tensile modulus of 19, 000 ksi (ACI
Committee 440R, 2007). For comparison purposes, a common reinforcing steel bar has
a tensile strength of 60 ksi, whereas a steel prestressing strand has a tensile strength of
270 ksi. While the FRP will not be as strong as the fiber itself since it is a composite
material, the resulting composite is extremely strong, thus showing its attractiveness as
an alternative to other repair materials for structural member strengthening.
2.2.2.2 Resin matrix
Resins can either be thermoset or thermoplastic. Thermoplastic resins become
soft when heated, and can then be shaped or formed while in that state. Once they cool
they become rigid. Thermoset resins, on the other hand, are initially liquids or low
melting point solids that harden once they have been heated (ACI Committee 440R,
2007).
FRPs generally contain thermoset resins. They include epoxy, esters,
polyesters, vinyl esters, and phenolic materials, with polyester, epoxy and vinyl ester
being used frequently. Polyester resins are inexpensive, but have problems adhering to
many surfaces and can emit harmful air emissions. Epoxy resins have excellent
14
mechanical properties, and also provide resistance to several environmental effects such
as corrosion and elevated temperatures. They provide a strong adhesive to a substrate,
making it very useful for concrete repair where the material must be bonded to the
concrete surface. Vinyl ester is a combination of polyester and epoxy, so it has
characteristics of both, although it emits air pollutants similar to polyester resins (Park et.
al, 2002).
2.2.3 Externally Bonded FRPs
FRPs can be used in both new construction or as a repair material. New
construction typically involves reinforcing bars made of FRP used in place of normal steel
reinforcement, such as in bridge decks. This is known as internal FRP reinforcement.
Externally bonded FRPs are generally used as repair materials, and bond to the concrete
surface or substrate.
There are a number of different externally bonded FRP repair systems. One is
using the FRP as a jacket, essentially creating a form around a structural member and
filling it with concrete or mortar. This method usually fails due to an installation or
material deficiency, such as delamination of either the FRP or the filler material from the
substrate (Wootton et. al., 2003). Another repair system, and the most common type, is
applying the FRP as a laminate or sheet, and bonding it directly to the surface of the
structural member using a wet layup system. This will be detailed in the next section.
Near surface mounting is another technique that involves placing FRP bars or strips into
small grooves or slots cut into the concrete cover. This method is typically easier to
apply than the laminate method. A newer technique is known as mechanically fastened
FRP, in which strips of FRP material are bolted into the concrete material itself. This
method is the easiest to apply and can be done with tools on the jobsite, but it can cause
stresses at the points where the bolts are applied. The research pertaining to this thesis
15
involves FRP sheets, otherwise known as "FRP wraps", so the rest of the information
contained in this document will apply to this type of FRP system.
2.2.4 Application methods of FRP
FRP sheets can be applied to a structure through three methods. The first
method is known as wet lay-up. This involves taking dry fibers and thoroughly saturating
them on site, using tools such as trowels, and then directly applying the composite to the
structure. The resin may also be applied to the structure first to ensure a good bond. In
this method, the composite will cure on site. The performance of wet lay-up systems
depends on the quality of the bond performed on site.
Another method is the use of prepreg systems. In this system the fiber sheets
are saturated off site at a manufacturing plant, then applied in the same way as the wet
lay-up system. They will also cure on site after application. These systems are generally
of better quality than FRP applied via the wet lay-up method (Park et al, 2002).
The third method involves precured systems. In this case, the resin is applied off
site similar to the prepreg system and cured as well. However, since they are already
cured, there can be problems achieving a strong bond to the surface (Park et al., 2002).
For any of these methods, it is imperative to achieve good bond. The concrete
surface must be cleaned and free of any dust or small particles that can interfere in the
bonding process. The concrete is also usually roughened to expose the aggregate in
order to help bonding.
2.2.5 Uses of FRP in the construction industry
FRPs are typically used to repair, rehabilitate and strengthen damaged and
deficient structures. They have been used to strengthen concrete beams in flexure and
shear, slabs in flexure, and columns in compression, flexure, and shear (ACI Committee
440R, 2007).
16
Where FRP is applied on the member depends on the intent of repair. For
example, beams strengthened in flexure will have FRP sheets applied on the tension
side. For shear strengthening, FRP may be applied to both sides of the member, three
sides of the member (U-wrapping), or on all four sides. Wrapping on all four sides will
lead to the greatest increase in shear strength (Park, 2002). Columns that are
completely wrapped with FRP can achieve great increases in capacity due to the effects
of confinement that FRP can provide.
There has been considerable research regarding the strengthening effects that
FRP materials provide. What is less clear is the long-term durability effects of structures
reinforced with FRP. As the use of FRP for structural repair is relatively new, long term
data is not yet available on these systems, so universal acceptance of FRPs is still
ongoing . Since FRPs are used for bridges, parking garages, and other locations where
the environment is present, there is interest for continuing research on the effects of
moisture, ultraviolet radiation, alkaline solutions, extreme temperatures, and other
potentially harmful factors on FRP systems. Corrosion in particular is an area where FRP
materials have proved beneficial in mitigating its effects. Investigations of the use of
FRP to protect against corrosion will be examined in greater detail in the next section.
17
2.3 Corrosion of Steel Embedded in Concrete
2.3.1 Corrosion Mechanics
The corrosion of metal is an electrochemical process that involves the transfer of
electrons between an anodic site and a cathodic site. The anode produces electrons
while the cathode consumes them. Two half-cell reactions much take place for an
electrochemical reaction to occur. For reinforced steel in concrete, this includes the
anodic reaction in the oxidation of iron, as well as the cathodic reaction in the formation of
hydroxyl ions, OH-. The following half-cell reactions occur for steel embedded in
concrete (ACI Committee 222R, 2001):
Anodic Reactions:
Fe→ Fe++
+ 2e- (2.3.1)
2Fe++
+ 4OH-→ 2Fe(OH)2 (2.3.2)
2Fe(OH)2 + 1/2O2 → 2FeOOH + H2O (2.3.3)
Fe + OH- + H2O → HFeO2
- + H2 (2.3.4)
Cathodic Reactions:
2H2O + O2 + 4e- → 4 (OH)
- (2.3.5)
2H+ + 2e
- → H2 (2.3.6)
Concrete naturally contains a high alkalinity environment with a pH of
approximately 13. This high alkalinity environment allows the generation of a protective
passive film around the reinforcement that occurs from the iron oxide reactions that occur
during the hydration of concrete. This passive film forms a barrier against corrosion.
Corrosion initiates by the breakdown of this barrier. The two processes that can remove
this barrier are attack of ions such as chlorides, or the reduction of pH in the system
through carbonation.
18
The removal of the passive film with chloride ions is the most common cause of
corrosion in reinforced concrete. Structures in marine environments are subject to
seawater salts that contain chloride ions. Deicing salts that are used on roads can also
subject the concrete to chlorides. These chloride ions breakdown the passive film and
react with the ferrous ions from the rebar; this creates an iron hydroxide compound once
it reaches the high pH of the concrete. This breakdown of the passive film is generally
locally concentrated, becoming anodic which attracts more chloride ions from the
cathode. The iron hydroxides react to oxygen to create rust. These hydroxides occupy a
volume greater than the material that they come from, as much as two to six times, so
which places internal stresses from the rebar to the surrounding concrete, leading to
cracking (ACI Committee 222R, 2001). Therefore, in order for corrosion to occur due to
chloride attack, it is necessary to have moisture to provide the chloride ions to remove
the passive film, and oxygen to react with the iron hydroxides.
Carbonation is the other process which leads to corrosion. With carbonation, the
passive film of the concrete is reduced due to the reaction of the alkaline in cement and
carbon dioxide in the atmosphere. Carbonation is generally not very common, however
areas that contain high levels of CO2 in the atmosphere, such as industrial zones, are at
increased risk of this happening. Carbonation and chloride ions can work together to
destroy the passive film surrounding the rebar.
Depending on the location of the anode and cathode, a system where the
electrochemical process occurs may be deemed as a macrocell or microcell. For a
macrocell the location of the anode and cathode are far away from each other. Daily
(2003) provides an example of a macrocell through the application of de-icing salts on a
bridge deck. If the deck has an upper mat of steel and lower mat of steel, the upper mat
of steel will naturally have a greater concentration of chloride ions. Therefore, the
19
passive film of the upper mat will be removed first, causing the upper mat to become an
anode and the lower mat to become a cathode.
2.3.2 Properties of concrete that affect corrosion
There are several properties of concrete that can influence the corrosion of
reinforcing steel. A properly designed mix can enhance the corrosion resistance of the
reinforcing steel. The cement paste of concrete contains several small pores that can
connect together to lead a path for water and gases to flow to the reinforcing steel. A low
water/cement (w/cm) ratio can reduce the sizes of these pores to reduce the amount of
flow that can occur. Cement contains C3A, tricalcium aluminate, which can react with
chloride ions, thereby reducing the number of chloride ions that can reach the reinforcing
steel. High alkalinity cement can increase the alkalinity of the concrete which helps
produce the passive barrier around the steel, although too much can lead to a negative
alkali-aggregate reaction. Different type of aggregates have different properties and
sizes, which can affect the interface between the cement paste and the aggregate and
the pores that can occur in the paste. Chemical and mineral admixtures are often used in
concrete. Air-entraining admixtures and water-reducing admixtures both have the ability
to reduce the water needed in a concrete mix, which lowers the w/cm ratio. Accelerating
admixtures can reduce concrete setting times and improve strength, however many
accelerators use calcium chloride, which can lead to chloride ions in the concrete mix that
attack the passive film. Corrosion inhibiting admixtures are often used to delay and
reduce the corrosion of reinforcing steel. Mineral admixtures such as fly ash have very
small particles which can fill the pores in the cement paste, thus the number of pores that
the chloride ions can pass through is reduced. These are often very effective in corrosion
protection and are used in practically all environments that are expected to be subject to
corrosion.
20
Along with the actual concrete itself, there are other factors that can influence
corrosion. This includes concrete clear cover, where an increased distance from the
concrete surface leads to longer paths for liquids and gases to flow to get to the rebar.
Other corrosion prevention measures such as epoxies are often used on the rebar
themselves. FRP has been found to have excellent corrosion resisting properties; these
will be detailed later in this section.
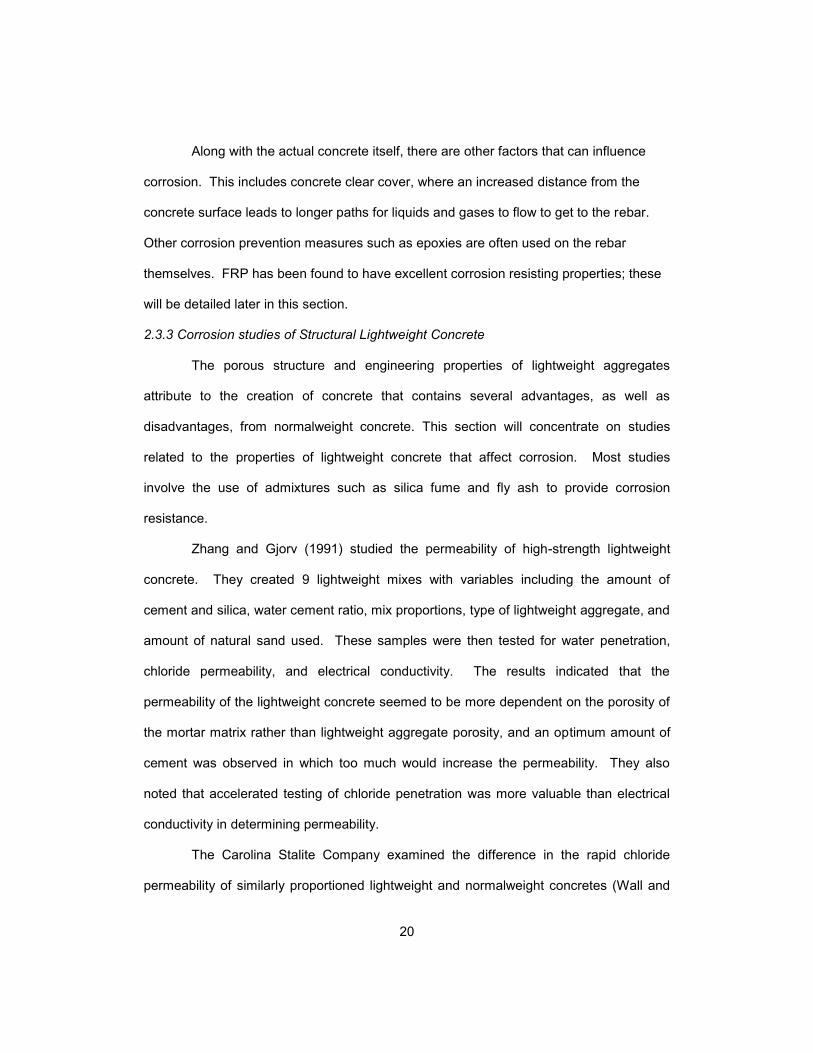
2.3.3 Corrosion studies of Structural Lightweight Concrete
The porous structure and engineering properties of lightweight aggregates
attribute to the creation of concrete that contains several advantages, as well as
disadvantages, from normalweight concrete. This section will concentrate on studies
related to the properties of lightweight concrete that affect corrosion. Most studies
involve the use of admixtures such as silica fume and fly ash to provide corrosion
resistance.
Zhang and Gjorv (1991) studied the permeability of high-strength lightweight
concrete. They created 9 lightweight mixes with variables including the amount of
cement and silica, water cement ratio, mix proportions, type of lightweight aggregate, and
amount of natural sand used. These samples were then tested for water penetration,
chloride permeability, and electrical conductivity. The results indicated that the
permeability of the lightweight concrete seemed to be more dependent on the porosity of
the mortar matrix rather than lightweight aggregate porosity, and an optimum amount of
cement was observed in which too much would increase the permeability. They also
noted that accelerated testing of chloride penetration was more valuable than electrical
conductivity in determining permeability.
The Carolina Stalite Company examined the difference in the rapid chloride
permeability of similarly proportioned lightweight and normalweight concretes (Wall and
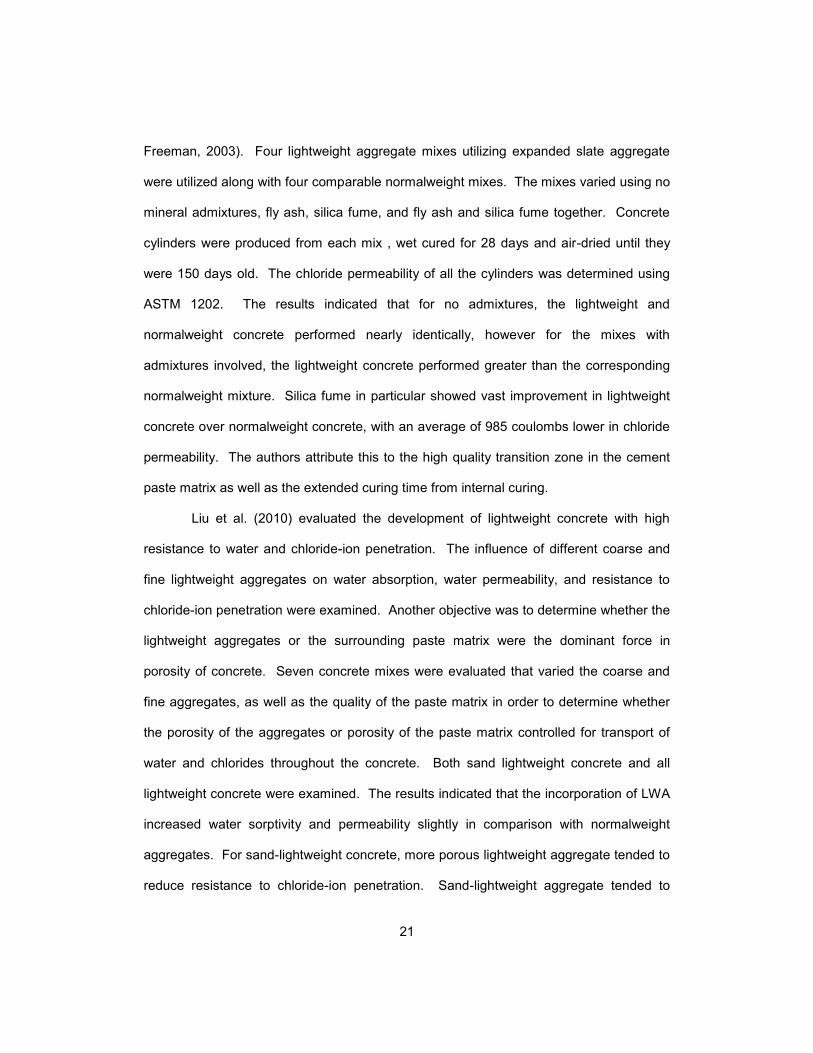
21
Freeman, 2003). Four lightweight aggregate mixes utilizing expanded slate aggregate
were utilized along with four comparable normalweight mixes. The mixes varied using no
mineral admixtures, fly ash, silica fume, and fly ash and silica fume together. Concrete
cylinders were produced from each mix , wet cured for 28 days and air-dried until they
were 150 days old. The chloride permeability of all the cylinders was determined using
ASTM 1202. The results indicated that for no admixtures, the lightweight and
normalweight concrete performed nearly identically, however for the mixes with
admixtures involved, the lightweight concrete performed greater than the corresponding
normalweight mixture. Silica fume in particular showed vast improvement in lightweight
concrete over normalweight concrete, with an average of 985 coulombs lower in chloride
permeability. The authors attribute this to the high quality transition zone in the cement
paste matrix as well as the extended curing time from internal curing.
Liu et al. (2010) evaluated the development of lightweight concrete with high
resistance to water and chloride-ion penetration. The influence of different coarse and
fine lightweight aggregates on water absorption, water permeability, and resistance to
chloride-ion penetration were examined. Another objective was to determine whether the
lightweight aggregates or the surrounding paste matrix were the dominant force in
porosity of concrete. Seven concrete mixes were evaluated that varied the coarse and
fine aggregates, as well as the quality of the paste matrix in order to determine whether
the porosity of the aggregates or porosity of the paste matrix controlled for transport of
water and chlorides throughout the concrete. Both sand lightweight concrete and all
lightweight concrete were examined. The results indicated that the incorporation of LWA
increased water sorptivity and permeability slightly in comparison with normalweight
aggregates. For sand-lightweight concrete, more porous lightweight aggregate tended to
reduce resistance to chloride-ion penetration. Sand-lightweight aggregate tended to
22
have greater resistance than all-lightweight due to the increased porosity from the
inclusion of the porous fine lightweight aggregate. Finally, the water accessible porosity
tended to have a greater effect on the transport properties of the concrete than the
overall concrete porosity, which was measured by concrete unit weight.
These research experiments represent some of the aspects that make
lightweight concrete particularly attractive in corrosive environments. New construction
with high strength lightweight aggregate concrete enhanced with admixtures can exhibit
high corrosion resistance. For existing deteriorated structures and structures in need of
repair, the use of systems such as FRP can be used to provide corrosion resistance.
These studies are detailed in the next section.
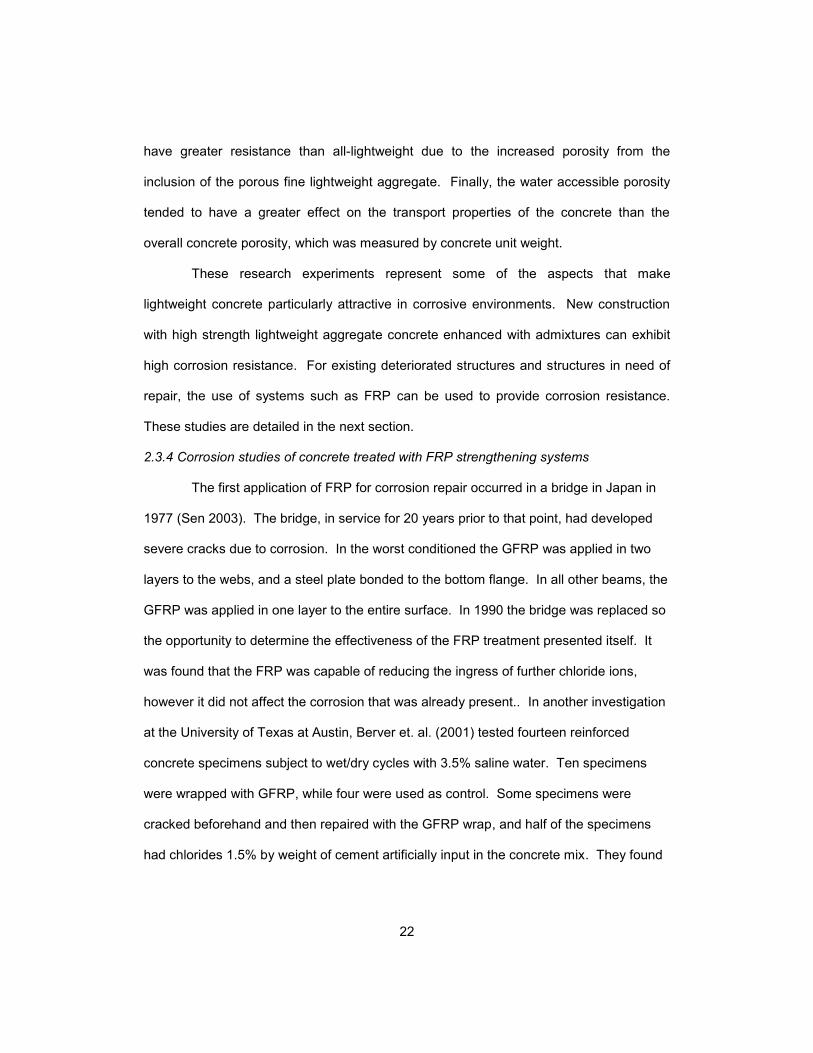
2.3.4 Corrosion studies of concrete treated with FRP strengthening systems
The first application of FRP for corrosion repair occurred in a bridge in Japan in
1977 (Sen 2003). The bridge, in service for 20 years prior to that point, had developed
severe cracks due to corrosion. In the worst conditioned the GFRP was applied in two
layers to the webs, and a steel plate bonded to the bottom flange. In all other beams, the
GFRP was applied in one layer to the entire surface. In 1990 the bridge was replaced so
the opportunity to determine the effectiveness of the FRP treatment presented itself. It
was found that the FRP was capable of reducing the ingress of further chloride ions,
however it did not affect the corrosion that was already present.. In another investigation
at the University of Texas at Austin, Berver et. al. (2001) tested fourteen reinforced
concrete specimens subject to wet/dry cycles with 3.5% saline water. Ten specimens
were wrapped with GFRP, while four were used as control. Some specimens were
cracked beforehand and then repaired with the GFRP wrap, and half of the specimens
had chlorides 1.5% by weight of cement artificially input in the concrete mix. They found
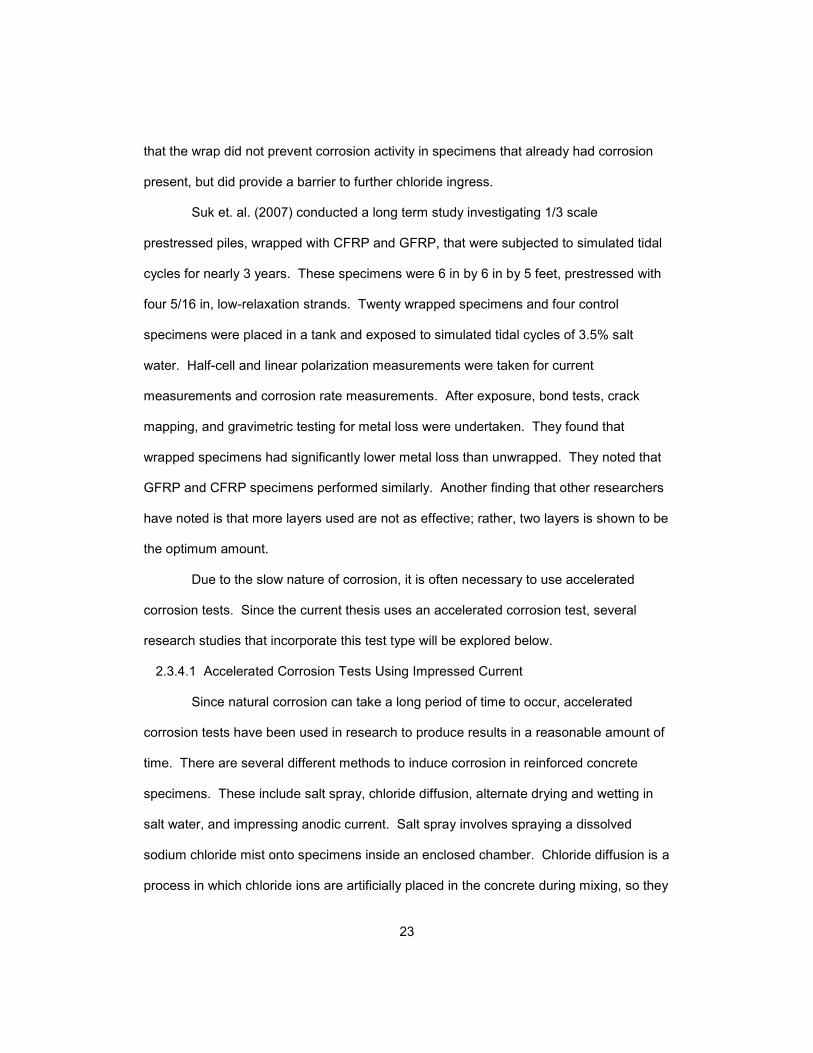
23
that the wrap did not prevent corrosion activity in specimens that already had corrosion
present, but did provide a barrier to further chloride ingress.
Suk et. al. (2007) conducted a long term study investigating 1/3 scale
prestressed piles, wrapped with CFRP and GFRP, that were subjected to simulated tidal
cycles for nearly 3 years. These specimens were 6 in by 6 in by 5 feet, prestressed with
four 5/16 in, low-relaxation strands. Twenty wrapped specimens and four control
specimens were placed in a tank and exposed to simulated tidal cycles of 3.5% salt
water. Half-cell and linear polarization measurements were taken for current
measurements and corrosion rate measurements. After exposure, bond tests, crack
mapping, and gravimetric testing for metal loss were undertaken. They found that
wrapped specimens had significantly lower metal loss than unwrapped. They noted that
GFRP and CFRP specimens performed similarly. Another finding that other researchers
have noted is that more layers used are not as effective; rather, two layers is shown to be
the optimum amount.
Due to the slow nature of corrosion, it is often necessary to use accelerated
corrosion tests. Since the current thesis uses an accelerated corrosion test, several
research studies that incorporate this test type will be explored below.
2.3.4.1 Accelerated Corrosion Tests Using Impressed Current
Since natural corrosion can take a long period of time to occur, accelerated
corrosion tests have been used in research to produce results in a reasonable amount of
time. There are several different methods to induce corrosion in reinforced concrete
specimens. These include salt spray, chloride diffusion, alternate drying and wetting in
salt water, and impressing anodic current. Salt spray involves spraying a dissolved
sodium chloride mist onto specimens inside an enclosed chamber. Chloride diffusion is a
process in which chloride ions are artificially placed in the concrete during mixing, so they
24
are always present in that concrete. Alternate wet-dry cycles can simulate splash zones
and are often used in studies. However, the quickest method is using impressed current
(Gadve et. al, 2008). This involves placing concrete into a salt solution and passing a
direct current with a power supply through the rebar. A nobler metal to rebar such as
stainless steel is used as a cathode and connected to the other terminal of the power
supply.
Detwiler et. al. (1991) looked at the effects that curing concrete at different
temperatures had on resistance to chloride intrusion. Three different mixes with water
cement ratios of 0.40, 0.50, and 0.58 were utilized with curing temperatures of 5, 20, and
50 C. The mixes were reproduced three times in order to cure at the three listed
temperatures, therefore there were nine mixes in total. A chloride diffusion test was
performed on one 4 in by 8 in cylinder, and a chloride penetration test was done on three
4 in by 11 in cylinders. The penetration test was an accelerated corrosion test using
induced current. The lollipop specimens were placed in a tank and connected to a 12 V
power source. The rebars of the specimens acted as anodes, whereas steel plate
electrodes were used as cathodes so that corrosion could begin occurring. A data logger
was used to collect current measurements in order to ensure everything was working
properly. The results of these tests found that concrete cured at higher temperatures
were less durable than at lower temperatures. Also, lower w/c ratios were influenced by
curing temperatures more intensely than higher ratios. They also noted that the effects of
poor consolidation and bleeding had greater impact than w/c ratios and curing
temperatures.
Spainhour et. al. et. al. (2002) investigated the use of CFRP wraps to reduce the
intrusion of chloride ions into steel reinforced concrete , and as a result would provide
protection against the onset of these ions. The theory behind the use of FRP wrapping
25
directly to a surface , versus a system such as FRP jacketing, is that the wraps would
bond better to the surface and provide a confinement effect to the concrete, which would
help prevent concrete from spalling due to the volume expansion of the concrete from
corrosive products forming on the reinforcing bars. This investigation comprised two
different studies. In the first part, large reinforced column samples were wrapped with
CFRP and long-term durability studies with heated wet/dry cycles for up to 2.5 years
were conducted. These studies included half-cell measurements, reinforcing bar mass
loss, and chloride content investigations. The effect of wrapping initially before applying
corrosion and wrapping after a one year period of time had elapsed were investigated. In
the second part of the experiment, accelerated short term corrosion studies similar to the
one by Detwiler were carried out. Forty-two 2 in by 4 in cylinders were subjected to
accelerated corrosion testing through impressed current for approximately two months.
Similar to the Detwiler experiment, the cylinders were submerged in a tank with a 5% by
weight NaCl solution. The samples were wired so that the rebars were anodic and steel
plates were used as cathodes, with a 12 volt charge passing through the system from a
power supply. The test variables included wrap orientation (radially, axially, or at a 45
degree angle), two different types of epoxy, the use of epoxy only, and the use of one or
multiple layers (up to 3) of CFRP. The setup for the short term studies is detailed below.
This experiment is the basis for the current investigation in this thesis.
26
Figure 2-1 Accelerated Corrosion Experiment (Spainhour 2002)
The results for the first experiment indicated that for both initial wrapped
specimens and specimens wrapped in one year it took longer to reach a 90% probability
of corrosion, chloride content was reduced, and less rebar mass loss occurred. After one
year the chloride contents for wrapped columns were 2 to 8.5 times less than the
unwrapped columns. The average rebar mass loss for unwrapped columns was 5.8%
per year, versus 4.8% for columns wrapped at the beginning of the experiment. Columns
wrapped after one year had rebar mass loss of 7.57 percent after two years, which was
50% less than the unwrapped samples and only 18% higher than samples that were
wrapped at the beginning of the experiment. For the second experiment, it was
discovered that the type of epoxy had a large influence on the corrosion resistance,
whereas the use of epoxy alone was not as effective as confinement with FRP wraps.
Two layers of FRP were shown to have greater effect in corrosion resistance than one
27
layer, but three layers were not necessarily any more effective than two layers. It was
also shown in the results that samples with CFRP wrapping performed better than
samples with epoxy alone. In addition, FRP wrapped radially showed the best results in
terms of corrosion resistance due to the effects of confinement that the wraps provided.
Gadve et.al. (2009) investigated the use of FRP wraps in providing active and
passive protection to steel reinforcement in concrete that had already been damaged by
corrosion. Concrete cylinders with dimensions of 4 in by 9 in embedded steel
reinforcement were subjected to accelerated corrosion to initiate cracking, then wrapped
with either GFRP or CFRP, then subjected to further accelerated corrosion. The initial
accelerated corrosion involved placing the specimens in a 3.5% solution and impressed
with a constant 100mA direct current for up to 8 days. After cracking, the cylinders were
wrapped and the experiment continued for a total duration of 24 days. The results
showed wrapping dramatically decreased the rate of corrosion and loss of mass in the
steel reinforcing bars, while increases were observed in pullout strength and corrosion
current. Cell voltages of wrapped specimens were seen to have increased by
approximately 300%. Also of note was that GFRP appeared to impede corrosion more
than carbon. A possible explanation is that glass has higher electrical resistance than
carbon. Another explanation is that GFRP sheets are typically thicker than CFRP sheets.
Maaddawy et. al. (2006) subjected thirty five 4 in by 8 in concrete cylinders to
accelerated corrosion, while varying the level of applied potential, presence of FRP
wraps, and bar diameter. Normal strength concrete of approximately 5000 psi
compressive strength was used, with 3% NaCl by weight of cement added to the mixture.
SikaWrap Hex103C Fibers and Sikadur Hex 300 resin were used for CFRP and epoxy.
The voltage applied was low using 15 V or high using 60 V, with bars ranging from No. 10
to No. 20. The results indicated that under the same applied fixed potential, CFRP wraps
28
reduced current and mass loss, with mass loss on average 36% lower than unwrapped
specimens. For the same applied potential fixed potential and cathodic surface area,
reducing bar diameter increased current density level. Raising the potential level four
times raised the current level the same amount, however, the steel mass loss increase
was only around 37% and 57% for unwrapped and wrapped specimens. CFRP delayed
the time from corrosion initiation to initial cracking about 20 times longer than that for
unwrapped specimens. The theoretical mass loss by Faraday's Law was in good
agreement with actual corrosion up to 10% mass loss, but were lower than that predicted
by Faraday's Law for higher mass losses.
Masoud and Soudki (2006) looked at corrosion activity of FRP wrapped beams.
Ten beams of dimensions 6 in by 12 in by 10.5 feet were cast. One beam was used as a
reference, three corroded and not repaired, and the other six corroded and repaired with
FRP sheets, followed by further accelerated corrosion for all of the beams. To accelerate
the corrosion, 2.15% NaCL by weight was used in the flexural zone of the beams and an
impressed current was applied. Both CFRP and GFRP sheets were used for this test,
which lasted up to 200 days. Two repair schemes were used; one included wrapping the
beam cross section with GFRP in a U-wrap scheme, whereas the other added CFRP for
flexural strengthening along with the U-wrapped GFRP. Half-cell measurements and
mass loss of the bars were monitored. They concluded that the mass loss of the bars
were 16% for the repaired specimens versus the control. In addition, the U-wrapped
GFRP was the main deterrent for the corrosion, whereas the flexural strengthening for
the CFRP had no significant effects on corrosion activity.
Several research experiments regarding corrosion of concrete wrapped with FRP
have had several findings in common. FRP wraps can be used to provide a barrier for
against chloride penetration, however chlorides that are already in the concrete will
29
continue to corrode the reinforcing steel inside. Both CFRP and GFRP wraps have been
investigated in regards to corrosion resistance, and both have been found to provide
good protection against corrosion. The use of multiple layers is largely ineffective against
further corrosion protection beyond the use of two layers. The choice of epoxy is very
important when determining which FRP system is used. Finally, it appears that wrapping
schemes that incorporate some kind of confinement, such as complete wrapping for
columns or U-wrapping for beams, are more effective at controlling corrosion than
wrapping schemes that involve only a portion of the structure, such as flexural
reinforcement schemes for a beam.
Although the effects of corrosion have been investigated in several research
papers in regard to normalweight concrete, very little information if any has been
presented on lightweight concrete that utilizes FRP wraps. Since lightweight concrete
has been used in structures with exposure to corrosive environments since the mid-
1900s, and higher strengths of lightweight concrete is being realized for structures built
today, there is benefit to understanding the properties of FRP wrapped lightweight
concrete. The research below will attempt to investigate the behavior of these systems
together with regards to corrosion.
30
Chapter 3
Procedure
3.1 Background on the experiment
The purpose of the experiment was to examine the effects of FRP wrapped
lightweight concrete in regards to corrosion protection. There have been several
corrosion experiments on normalweight concrete with FRP wraps. Normalweight
concrete has a density in the range of 140-155 lb/ft3 and is made with ordinary
aggregates such as sand, gravel, crushed stone, limestone, etc. As detailed in the
literature review, lightweight concrete used for structural purposes has a density in the
range of 105-120 lb/ft3, and is made of manufactured clay, shale, or slate. For the
purposes of the rest of this thesis, lightweight concrete will mean sand-lightweight
concrete, which is what is typically used for structural applications. All-lightweight
concrete was not considered for this experiment, and so the term lightweight concrete will
only apply to sand-lightweight concrete in this paper.
Since natural corrosion is a very slow process, an accelerated corrosion test was
applied in this experiment. The experiment was modeled after the one employed by
Spainhour mentioned in the literature review. The type of accelerated corrosion test that
is employed has been used in several research reports, as mentioned in the literature
review. Using the principles of electrolytic corrosion, this experiment employs an anode,
cathode, electrolyte, and a contact between the anode and cathode, which are all the
necessary components for corrosion to occur. The experimental procedure is detailed in
the following sections.
31
3.2 Specimen Preparation
In total, there were forty-two specimens used for this experiment. The
specimens were 2" by 4" cylinders with a single #4 rebar protruding from the center. This
is known as a "lollipop" sample, and is commonly used in accelerated corrosion tests that
examine reinforced concrete corrosion. The small sample dimensions were chosen in
order to ensure corrosion would occur in a short period of time through the use of minimal
concrete cover. Two concrete mixes were utilized in the testing; a lightweight concrete,
and a similarly proportioned normalweight concrete. The mix for the lightweight concrete
was determined first, after which a normalweight concrete mix was produced by
exchanging the coarse lightweight aggregates for normalweight aggregates. The sand,
water, and cement contents of the two mixes were kept identical; that way, only the type
of coarse aggregate differed in the mix designs.
3.2.1 Concrete mix materials
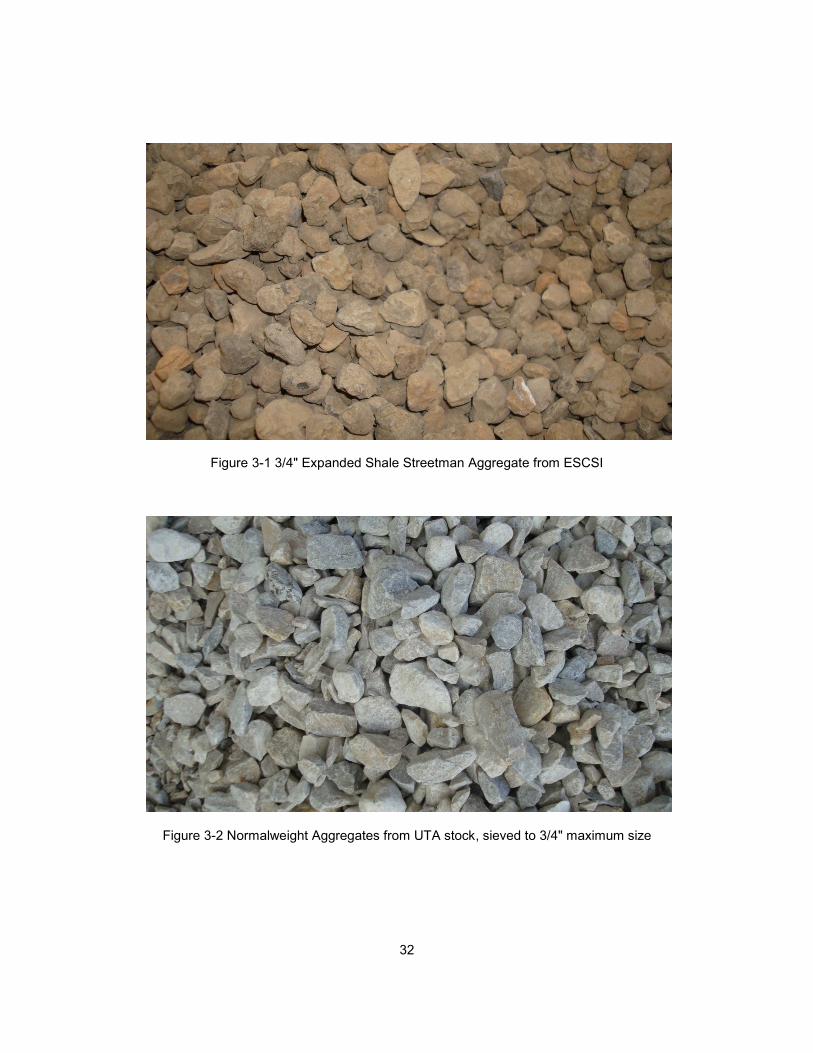
The lightweight aggregate used was Streetman aggregate donated by the
Expanded Shale, Clay and Slate Institute (ESCSI). Streetman is an expanded shale that
has been used in Texas for double-tee members for parking garages (Heffington, 2000).
The aggregates received were well graded with 3/4" maximum size.
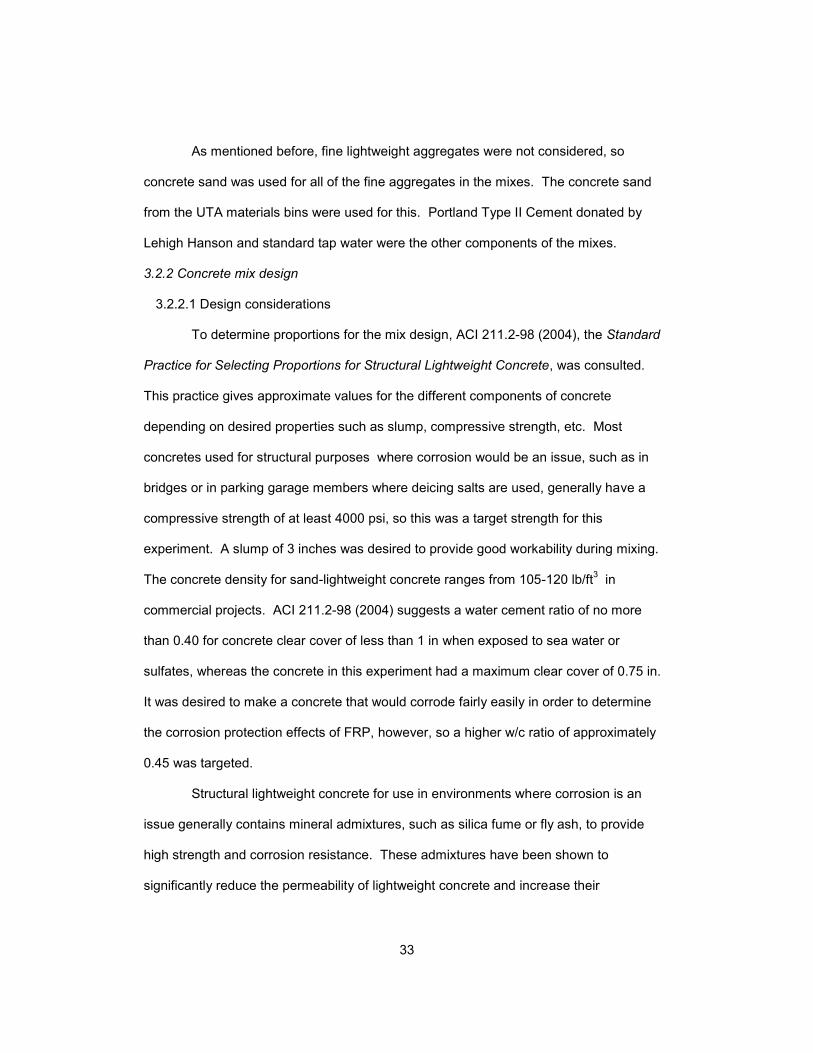
The normalweight aggregate was crushed stone available outside the Civil
Engineering Lab Building at the University of Texas at Arlington in storage bins. The bin
contained both coarse and fine aggregates with a great range of sizes. In order to
remove the fine aggregate and obtain coarse aggregates similar in size and grade to the
lightweight aggregate for mixing, gradation using wire mesh sieves took place. Figures
3-1 and 3-2 show samples of the Streetman aggregate and the crushed stone aggregate,
respectively.
32
Figure 3-1 3/4" Expanded Shale Streetman Aggregate from ESCSI
Figure 3-2 Normalweight Aggregates from UTA stock, sieved to 3/4" maximum size
33
As mentioned before, fine lightweight aggregates were not considered, so
concrete sand was used for all of the fine aggregates in the mixes. The concrete sand
from the UTA materials bins were used for this. Portland Type II Cement donated by
Lehigh Hanson and standard tap water were the other components of the mixes.
3.2.2 Concrete mix design
3.2.2.1 Design considerations
To determine proportions for the mix design, ACI 211.2-98 (2004), the Standard
Practice for Selecting Proportions for Structural Lightweight Concrete, was consulted.
This practice gives approximate values for the different components of concrete
depending on desired properties such as slump, compressive strength, etc. Most
concretes used for structural purposes where corrosion would be an issue, such as in
bridges or in parking garage members where deicing salts are used, generally have a
compressive strength of at least 4000 psi, so this was a target strength for this
experiment. A slump of 3 inches was desired to provide good workability during mixing.
The concrete density for sand-lightweight concrete ranges from 105-120 lb/ft3
in
commercial projects. ACI 211.2-98 (2004) suggests a water cement ratio of no more
than 0.40 for concrete clear cover of less than 1 in when exposed to sea water or
sulfates, whereas the concrete in this experiment had a maximum clear cover of 0.75 in.
It was desired to make a concrete that would corrode fairly easily in order to determine
the corrosion protection effects of FRP, however, so a higher w/c ratio of approximately
0.45 was targeted.
Structural lightweight concrete for use in environments where corrosion is an
issue generally contains mineral admixtures, such as silica fume or fly ash, to provide
high strength and corrosion resistance. These admixtures have been shown to
significantly reduce the permeability of lightweight concrete and increase their
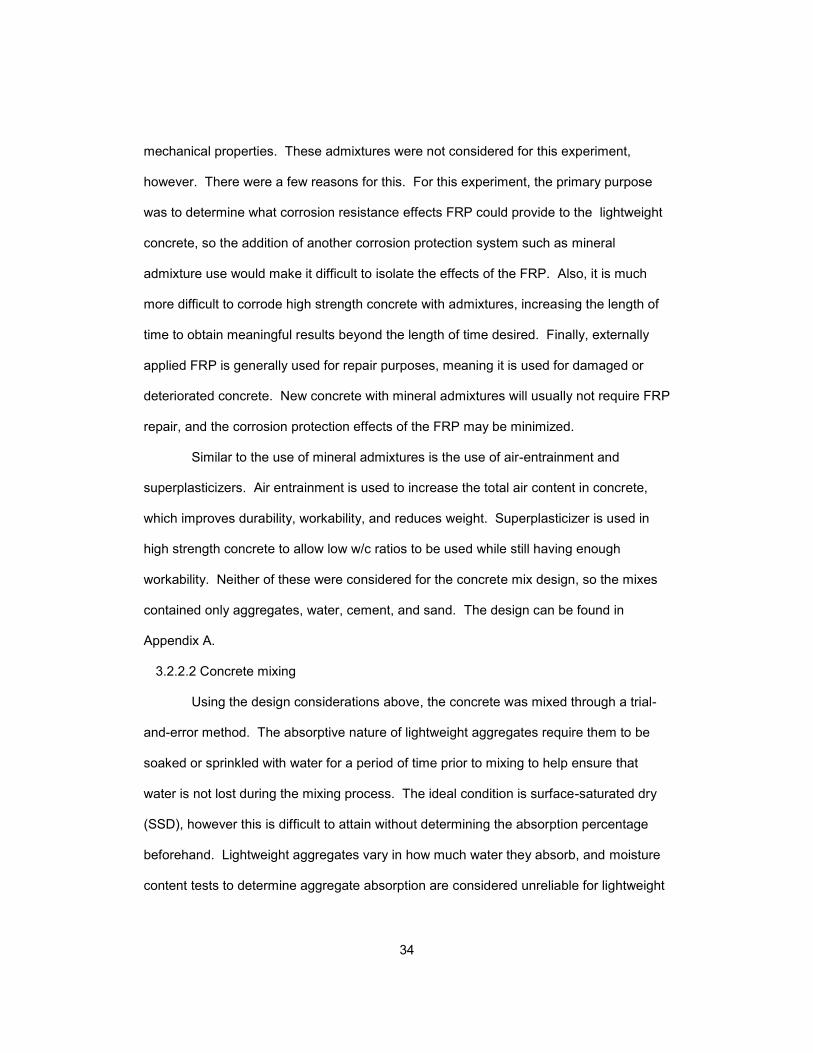
34
mechanical properties. These admixtures were not considered for this experiment,
however. There were a few reasons for this. For this experiment, the primary purpose
was to determine what corrosion resistance effects FRP could provide to the lightweight
concrete, so the addition of another corrosion protection system such as mineral
admixture use would make it difficult to isolate the effects of the FRP. Also, it is much
more difficult to corrode high strength concrete with admixtures, increasing the length of
time to obtain meaningful results beyond the length of time desired. Finally, externally
applied FRP is generally used for repair purposes, meaning it is used for damaged or
deteriorated concrete. New concrete with mineral admixtures will usually not require FRP
repair, and the corrosion protection effects of the FRP may be minimized.
Similar to the use of mineral admixtures is the use of air-entrainment and
superplasticizers. Air entrainment is used to increase the total air content in concrete,
which improves durability, workability, and reduces weight. Superplasticizer is used in
high strength concrete to allow low w/c ratios to be used while still having enough
workability. Neither of these were considered for the concrete mix design, so the mixes
contained only aggregates, water, cement, and sand. The design can be found in
Appendix A.
3.2.2.2 Concrete mixing
Using the design considerations above, the concrete was mixed through a trial-
and-error method. The absorptive nature of lightweight aggregates require them to be
soaked or sprinkled with water for a period of time prior to mixing to help ensure that
water is not lost during the mixing process. The ideal condition is surface-saturated dry
(SSD), however this is difficult to attain without determining the absorption percentage
beforehand. Lightweight aggregates vary in how much water they absorb, and moisture
content tests to determine aggregate absorption are considered unreliable for lightweight
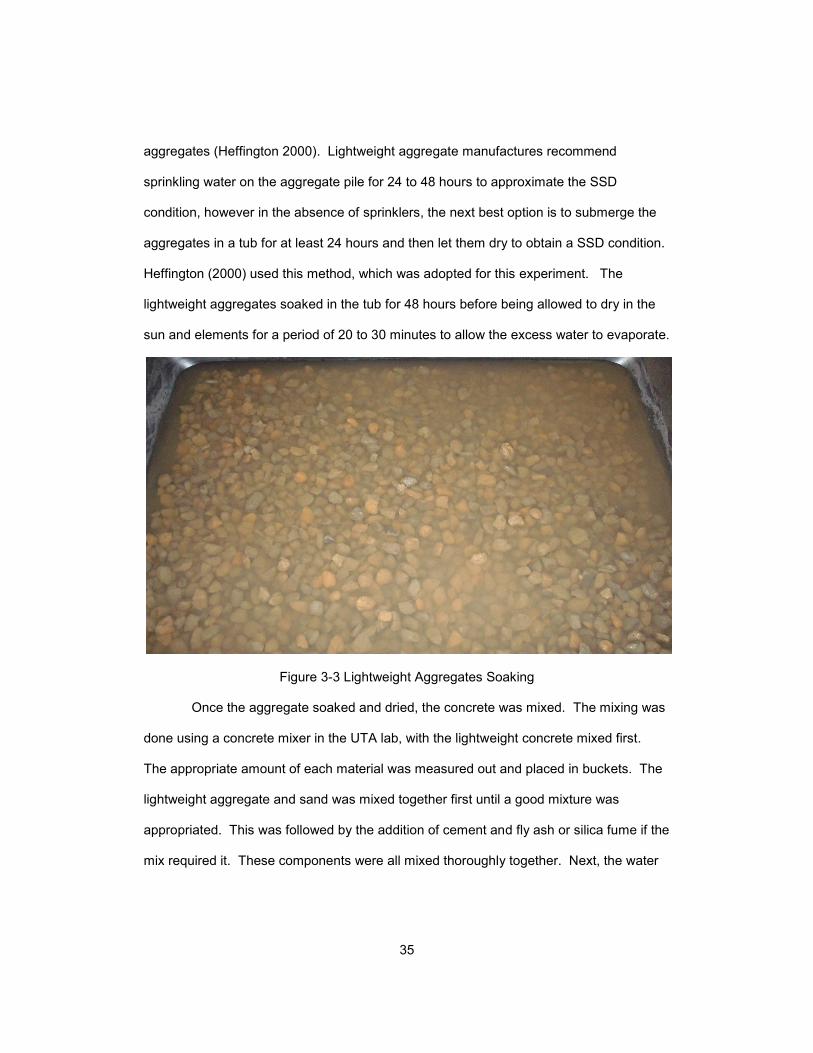
35
aggregates (Heffington 2000). Lightweight aggregate manufactures recommend
sprinkling water on the aggregate pile for 24 to 48 hours to approximate the SSD
condition, however in the absence of sprinklers, the next best option is to submerge the
aggregates in a tub for at least 24 hours and then let them dry to obtain a SSD condition.
Heffington (2000) used this method, which was adopted for this experiment. The
lightweight aggregates soaked in the tub for 48 hours before being allowed to dry in the
sun and elements for a period of 20 to 30 minutes to allow the excess water to evaporate.
Figure 3-3 Lightweight Aggregates Soaking
Once the aggregate soaked and dried, the concrete was mixed. The mixing was
done using a concrete mixer in the UTA lab, with the lightweight concrete mixed first.
The appropriate amount of each material was measured out and placed in buckets. The
lightweight aggregate and sand was mixed together first until a good mixture was
appropriated. This was followed by the addition of cement and fly ash or silica fume if the
mix required it. These components were all mixed thoroughly together. Next, the water
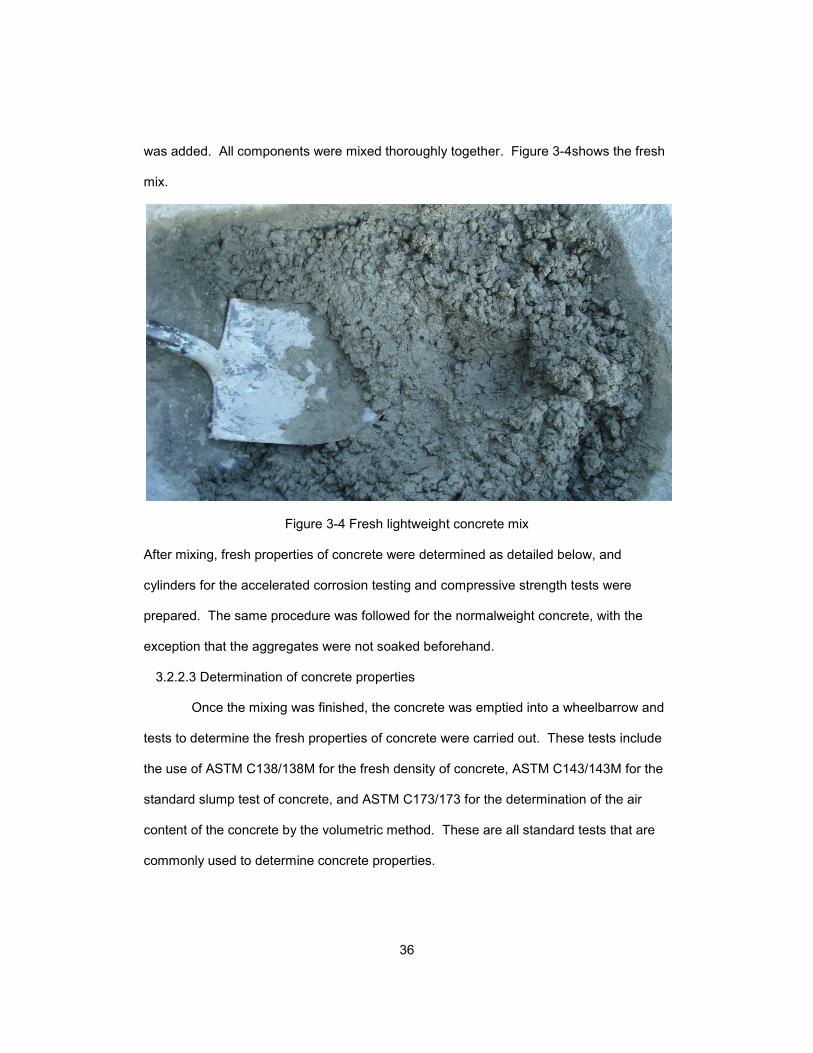
36
was added. All components were mixed thoroughly together. Figure 3-4shows the fresh
mix.
Figure 3-4 Fresh lightweight concrete mix
After mixing, fresh properties of concrete were determined as detailed below, and
cylinders for the accelerated corrosion testing and compressive strength tests were
prepared. The same procedure was followed for the normalweight concrete, with the
exception that the aggregates were not soaked beforehand.
3.2.2.3 Determination of concrete properties
Once the mixing was finished, the concrete was emptied into a wheelbarrow and
tests to determine the fresh properties of concrete were carried out. These tests include
the use of ASTM C138/138M for the fresh density of concrete, ASTM C143/143M for the
standard slump test of concrete, and ASTM C173/173 for the determination of the air
content of the concrete by the volumetric method. These are all standard tests that are
commonly used to determine concrete properties.
37
Another property that must be determined for lightweight concrete alone is the
equilibrium density. Since lightweight concrete absorbs water, the fresh density of
lightweight concrete will be heavier initially then it will in service after a period of time.
Some water will be lost due to evaporation from drying or internal curing, and so the
concrete will reach a condition between oven-dry and saturated in which it is likely to
operate at in service. This is equilibrium density, which is determined by ASTM C567.
To approximate this condition through measurements, the ASTM requires 6 in x 12 in
cylinders to be submerged for 24 hours in water at 23 ± 2o C (73.5 ± 3.5
o F) after being
removed from their molds 7 days after curing begins. The mass of these cylinders is
measured, and then they are dried in a controlled humidity enclosure for a period of time
and the mass measured until the difference in measurements is less than 0.5%. Oven-
dry density is another condition that can be measured for lightweight concrete. This is
done by removing the cylinders from their molds after 24 hours and submerging them in
water. The mass of these submerged cylinders is measured. The cylinders are then
removed from submersion, dried and drained, and measured in a saturated surface dry
condition. They are then placed in an oven at 110 ± 5o C (230 ± 9
o F) and dried for 72
hours. After the cylinders cool for 30 minutes, the mass is measured, and the process is
repeated until successive mass measurements differ by less than 0.5%.
Measuring these properties for lightweight concrete can be very time consuming,
so ASTM C567 allows the determination of an approximate oven dry and equilibrium
density through the use of equations, if the mixture quantities and volume of concrete
produced is known. These equations were used for the determination of equilibrium
density in this experiment. The procedure and calculations for this determination can be
found in Appendix A. The full properties of the lightweight and concrete produced are
summarized in the following table.
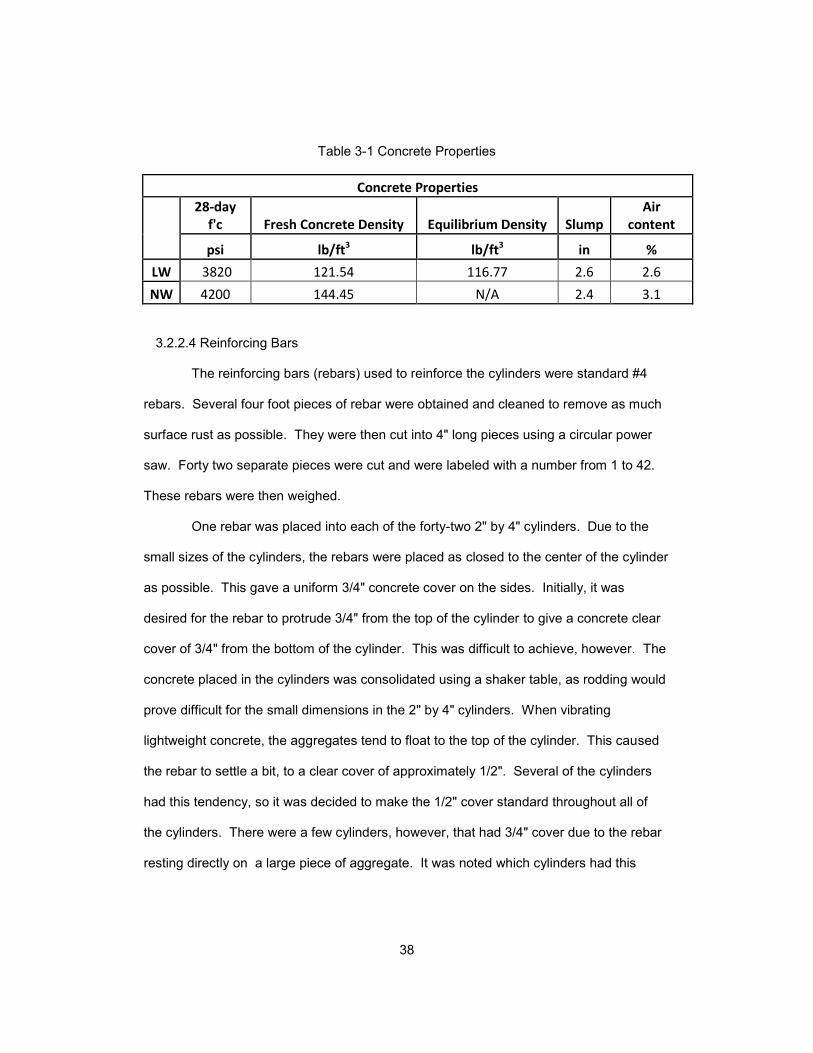
38
Table 3-1 Concrete Properties
Concrete Properties
28-day f'c Fresh Concrete Density Equilibrium Density Slump
Air content
psi lb/ft3 lb/ft3 in %
LW 3820 121.54 116.77 2.6 2.6
NW 4200 144.45 N/A 2.4 3.1
3.2.2.4 Reinforcing Bars
The reinforcing bars (rebars) used to reinforce the cylinders were standard #4
rebars. Several four foot pieces of rebar were obtained and cleaned to remove as much
surface rust as possible. They were then cut into 4" long pieces using a circular power
saw. Forty two separate pieces were cut and were labeled with a number from 1 to 42.
These rebars were then weighed.
One rebar was placed into each of the forty-two 2" by 4" cylinders. Due to the
small sizes of the cylinders, the rebars were placed as closed to the center of the cylinder
as possible. This gave a uniform 3/4" concrete cover on the sides. Initially, it was
desired for the rebar to protrude 3/4" from the top of the cylinder to give a concrete clear
cover of 3/4" from the bottom of the cylinder. This was difficult to achieve, however. The
concrete placed in the cylinders was consolidated using a shaker table, as rodding would
prove difficult for the small dimensions in the 2" by 4" cylinders. When vibrating
lightweight concrete, the aggregates tend to float to the top of the cylinder. This caused
the rebar to settle a bit, to a clear cover of approximately 1/2". Several of the cylinders
had this tendency, so it was decided to make the 1/2" cover standard throughout all of
the cylinders. There were a few cylinders, however, that had 3/4" cover due to the rebar
resting directly on a large piece of aggregate. It was noted which cylinders had this
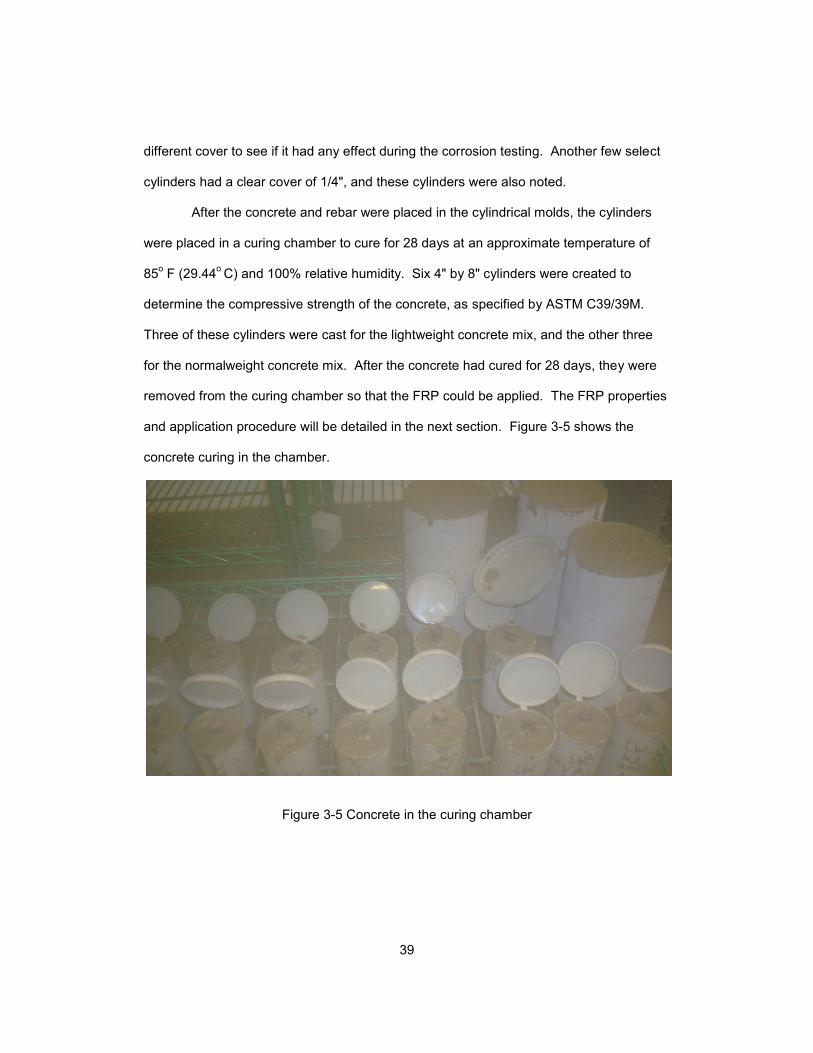
39
different cover to see if it had any effect during the corrosion testing. Another few select
cylinders had a clear cover of 1/4", and these cylinders were also noted.
After the concrete and rebar were placed in the cylindrical molds, the cylinders
were placed in a curing chamber to cure for 28 days at an approximate temperature of
85o F (29.44
o C) and 100% relative humidity. Six 4" by 8" cylinders were created to
determine the compressive strength of the concrete, as specified by ASTM C39/39M.
Three of these cylinders were cast for the lightweight concrete mix, and the other three
for the normalweight concrete mix. After the concrete had cured for 28 days, they were
removed from the curing chamber so that the FRP could be applied. The FRP properties
and application procedure will be detailed in the next section. Figure 3-5 shows the
concrete curing in the chamber.
Figure 3-5 Concrete in the curing chamber
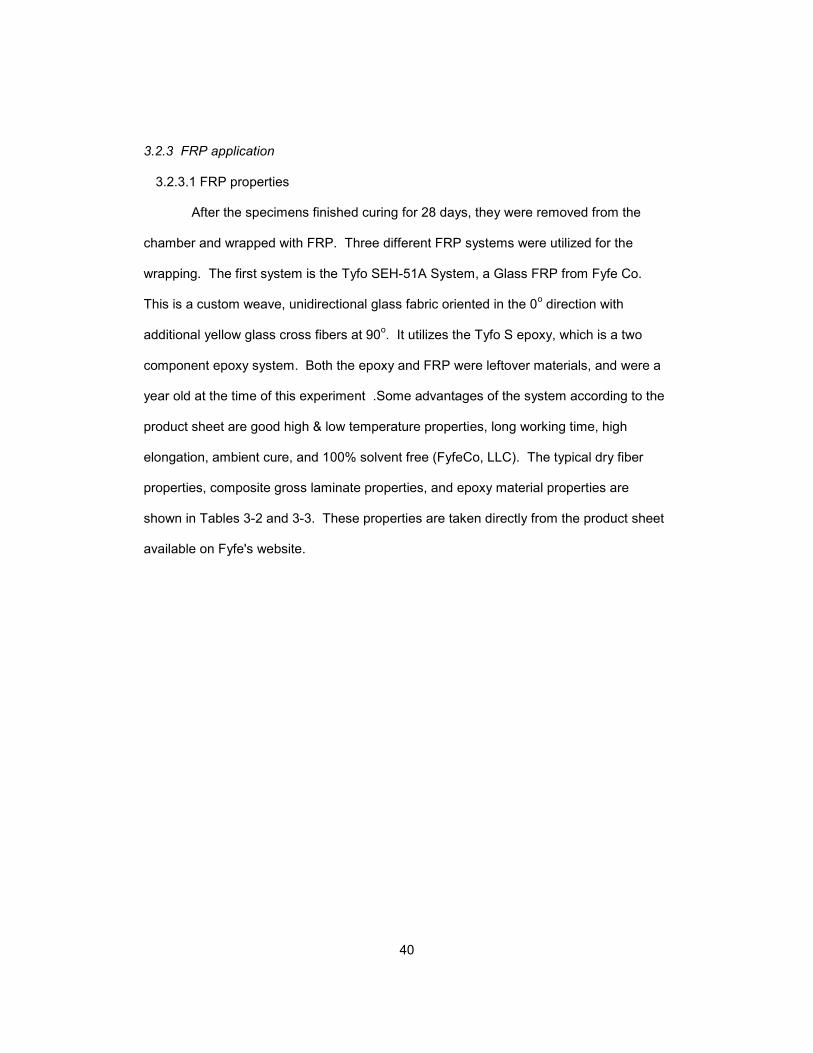
40
3.2.3 FRP application
3.2.3.1 FRP properties
After the specimens finished curing for 28 days, they were removed from the
chamber and wrapped with FRP. Three different FRP systems were utilized for the
wrapping. The first system is the Tyfo SEH-51A System, a Glass FRP from Fyfe Co.
This is a custom weave, unidirectional glass fabric oriented in the 0o direction with
additional yellow glass cross fibers at 90o. It utilizes the Tyfo S epoxy, which is a two
component epoxy system. Both the epoxy and FRP were leftover materials, and were a
year old at the time of this experiment .Some advantages of the system according to the
product sheet are good high & low temperature properties, long working time, high
elongation, ambient cure, and 100% solvent free (FyfeCo, LLC). The typical dry fiber
properties, composite gross laminate properties, and epoxy material properties are
shown in Tables 3-2 and 3-3. These properties are taken directly from the product sheet
available on Fyfe's website.
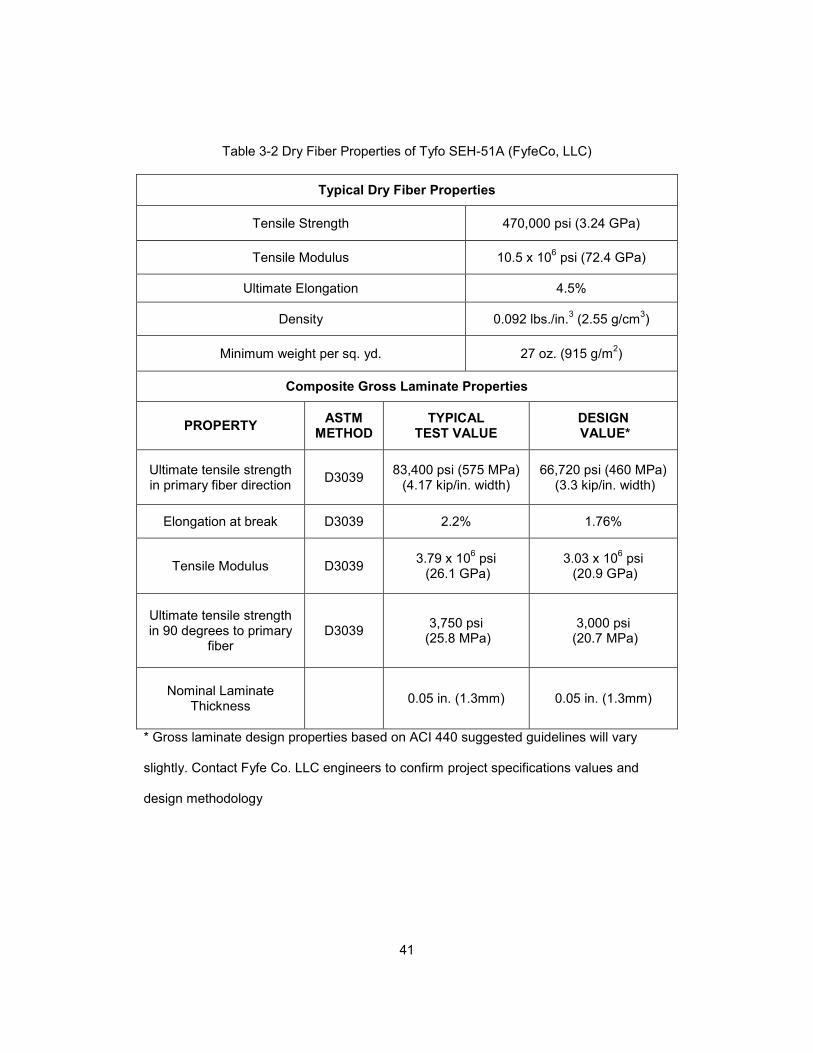
41
Table 3-2 Dry Fiber Properties of Tyfo SEH-51A (FyfeCo, LLC)
Typical Dry Fiber Properties
Tensile Strength 470,000 psi (3.24 GPa)
Tensile Modulus 10.5 x 10⁶ psi (72.4 GPa)
Ultimate Elongation 4.5%
Density 0.092 lbs./in.3 (2.55 g/cm
3)
Minimum weight per sq. yd. 27 oz. (915 g/m2)
Composite Gross Laminate Properties
PROPERTY ASTM
METHOD TYPICAL
TEST VALUE DESIGN VALUE*
Ultimate tensile strength in primary fiber direction
D3039 83,400 psi (575 MPa)
(4.17 kip/in. width) 66,720 psi (460 MPa)
(3.3 kip/in. width)
Elongation at break D3039 2.2% 1.76%
Tensile Modulus D3039 3.79 x 10
6 psi
(26.1 GPa) 3.03 x 10
6 psi
(20.9 GPa)
Ultimate tensile strength in 90 degrees to primary
fiber D3039
3,750 psi (25.8 MPa)
3,000 psi (20.7 MPa)
Nominal Laminate Thickness
0.05 in. (1.3mm) 0.05 in. (1.3mm)
* Gross laminate design properties based on ACI 440 suggested guidelines will vary
slightly. Contact Fyfe Co. LLC engineers to confirm project specifications values and
design methodology
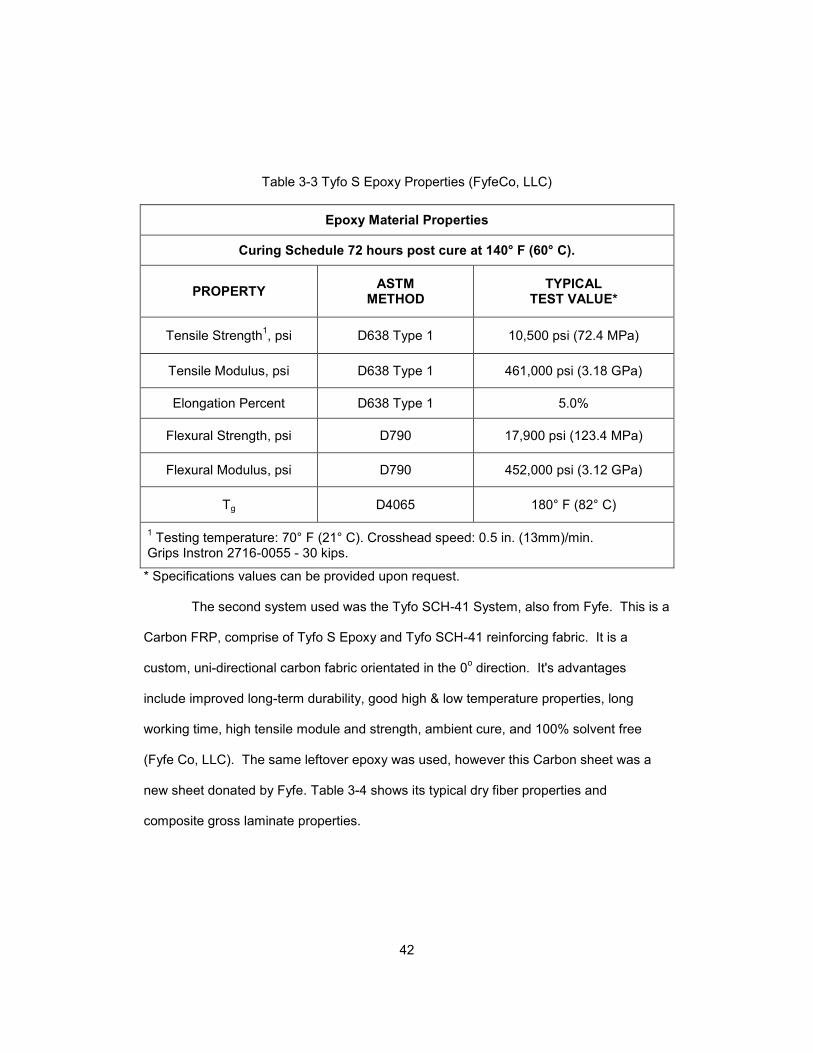
42
Table 3-3 Tyfo S Epoxy Properties (FyfeCo, LLC)
Epoxy Material Properties
Curing Schedule 72 hours post cure at 140° F (60° C).
PROPERTY ASTM
METHOD TYPICAL
TEST VALUE*
Tensile Strength1, psi D638 Type 1 10,500 psi (72.4 MPa)
Tensile Modulus, psi D638 Type 1 461,000 psi (3.18 GPa)
Elongation Percent D638 Type 1 5.0%
Flexural Strength, psi D790 17,900 psi (123.4 MPa)
Flexural Modulus, psi D790 452,000 psi (3.12 GPa)
Tg D4065 180° F (82° C)
1 Testing temperature: 70° F (21° C). Crosshead speed: 0.5 in. (13mm)/min.
Grips Instron 2716-0055 - 30 kips.
* Specifications values can be provided upon request.
The second system used was the Tyfo SCH-41 System, also from Fyfe. This is a
Carbon FRP, comprise of Tyfo S Epoxy and Tyfo SCH-41 reinforcing fabric. It is a
custom, uni-directional carbon fabric orientated in the 0o direction. It's advantages
include improved long-term durability, good high & low temperature properties, long
working time, high tensile module and strength, ambient cure, and 100% solvent free
(Fyfe Co, LLC). The same leftover epoxy was used, however this Carbon sheet was a
new sheet donated by Fyfe. Table 3-4 shows its typical dry fiber properties and
composite gross laminate properties.
43
Table 3-4 Properties of Tyfo SCH-41 System (Fyfe Co, LLC)
Typical Dry Fiber Properties
Tensile Strength 550,000 psi (3.79 GPa)
Tensile Modulus 33.4 x 10⁶ psi (230 GPa)
Ultimate Elongation 1.7%
Density 0.063 lbs./in.3 (1.74 g/cm
3)
Minimum weight per sq. yd. 19 oz. (644 g/m2)
Composite Gross Laminate Properties
PROPERTY ASTM
METHOD TYPICAL
TEST VALUE DESIGN VALUE*
Ultimate tensile strength in primary fiber direction
D3039 143,000 psi (986
MPa) (5.7 kip/in. width)
121,000 psi (834 MPa)
(4.8 kip/in. width)
Elongation at break D3039 1.0% 0.85%
Tensile Modulus D3039 13.9 x 10
6 psi
(95.8 GPa) 11.9 x 10
6 psi
(82 GPa)
Flexural Strength D790 17,900 psi
(123.4 MPa) 15,200 psi
(104.8 MPa)
Flexural Modulus D790 452,000 psi (3.12 GPa)
384,200 psi (2.65 GPa)
Longitudinal Compressive Strength
D3410 50,000 psi
(344.8 MPa) 42,500 psi (293 MPa)
Longitudinal Compressive Modulus
D3410 11.2 x 10
6 psi
(77.2 GPa) 9.5 x 10
6 psi
(65.5 GPa)
Longitudinal Coefficient of Thermal Expansion
D696 3.6 ppm./°F
Transverse Coefficient of Thermal Expansion
D696 20.3 ppm./°F
Nominal Laminate Thickness
0.04 in. (1.0mm) 0.04 in. (1.0mm)
* Gross laminate design properties based on ACI 440 suggested guidelines will vary slightly. Contacted Fyfe Co. LLC engineers to confirm project specifications values and design methodology
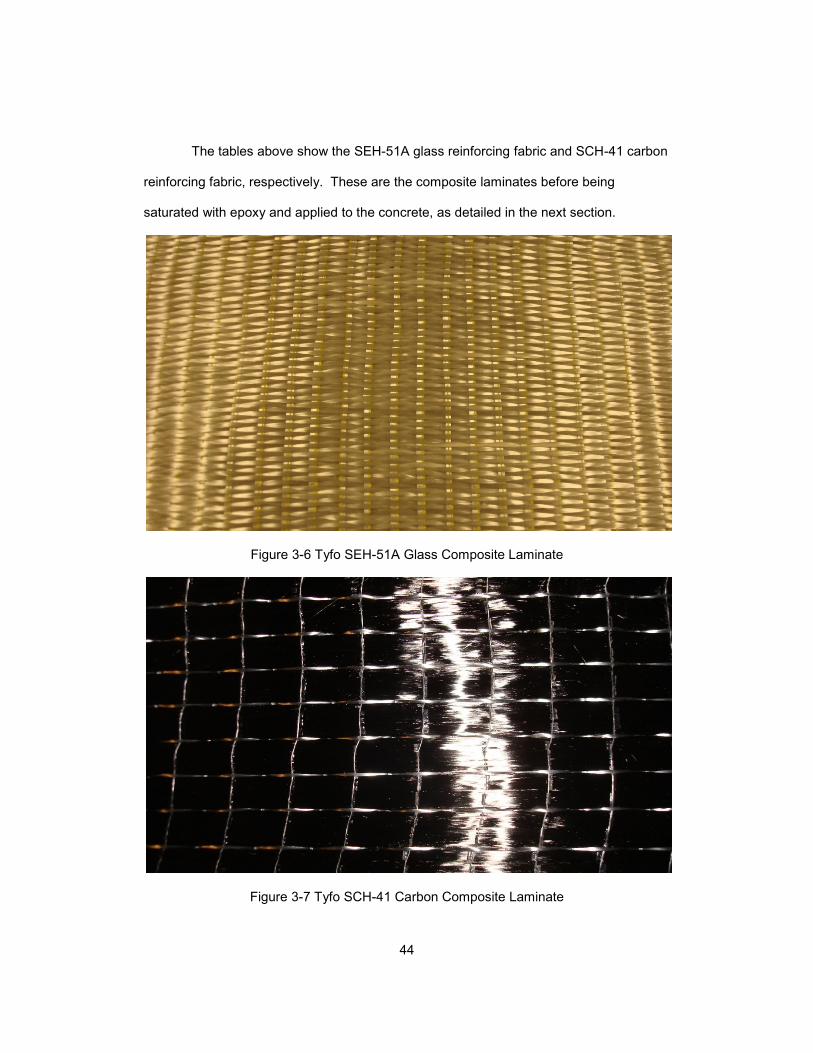
44
The tables above show the SEH-51A glass reinforcing fabric and SCH-41 carbon
reinforcing fabric, respectively. These are the composite laminates before being
saturated with epoxy and applied to the concrete, as detailed in the next section.
Figure 3-6 Tyfo SEH-51A Glass Composite Laminate
Figure 3-7 Tyfo SCH-41 Carbon Composite Laminate
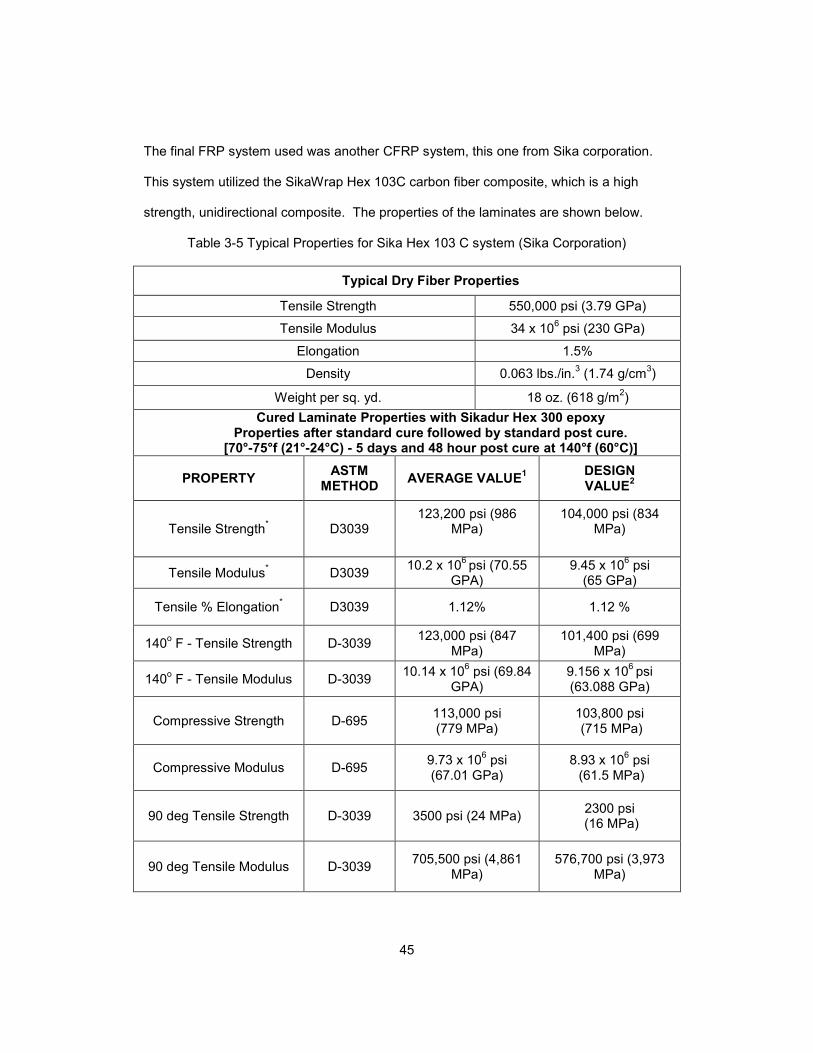
45
The final FRP system used was another CFRP system, this one from Sika corporation.
This system utilized the SikaWrap Hex 103C carbon fiber composite, which is a high
strength, unidirectional composite. The properties of the laminates are shown below.
Table 3-5 Typical Properties for Sika Hex 103 C system (Sika Corporation)
Typical Dry Fiber Properties
Tensile Strength 550,000 psi (3.79 GPa)
Tensile Modulus 34 x 106 psi (230 GPa)
Elongation 1.5%
Density 0.063 lbs./in.3 (1.74 g/cm
3)
Weight per sq. yd. 18 oz. (618 g/m2)
Cured Laminate Properties with Sikadur Hex 300 epoxy Properties after standard cure followed by standard post cure.
[70°-75°f (21°-24°C) - 5 days and 48 hour post cure at 140°f (60°C)]
PROPERTY ASTM
METHOD AVERAGE VALUE
1 DESIGN VALUE
2
Tensile Strength*
D3039 123,200 psi (986
MPa)
104,000 psi (834 MPa)
Tensile Modulus*
D3039 10.2 x 10
6 psi (70.55
GPA) 9.45 x 10
6 psi
(65 GPa)
Tensile % Elongation*
D3039 1.12% 1.12 %
140o F - Tensile Strength D-3039
123,000 psi (847 MPa)
101,400 psi (699 MPa)
140o F - Tensile Modulus D-3039
10.14 x 10⁶ psi (69.84
GPA) 9.156 x 10
6 psi
(63.088 GPa)
Compressive Strength D-695 113,000 psi (779 MPa)
103,800 psi (715 MPa)
Compressive Modulus D-695 9.73 x 10
6 psi
(67.01 GPa) 8.93 x 10
6 psi
(61.5 MPa)
90 deg Tensile Strength D-3039 3500 psi (24 MPa) 2300 psi
(16 MPa)
90 deg Tensile Modulus D-3039 705,500 psi (4,861
MPa) 576,700 psi (3,973
MPa)
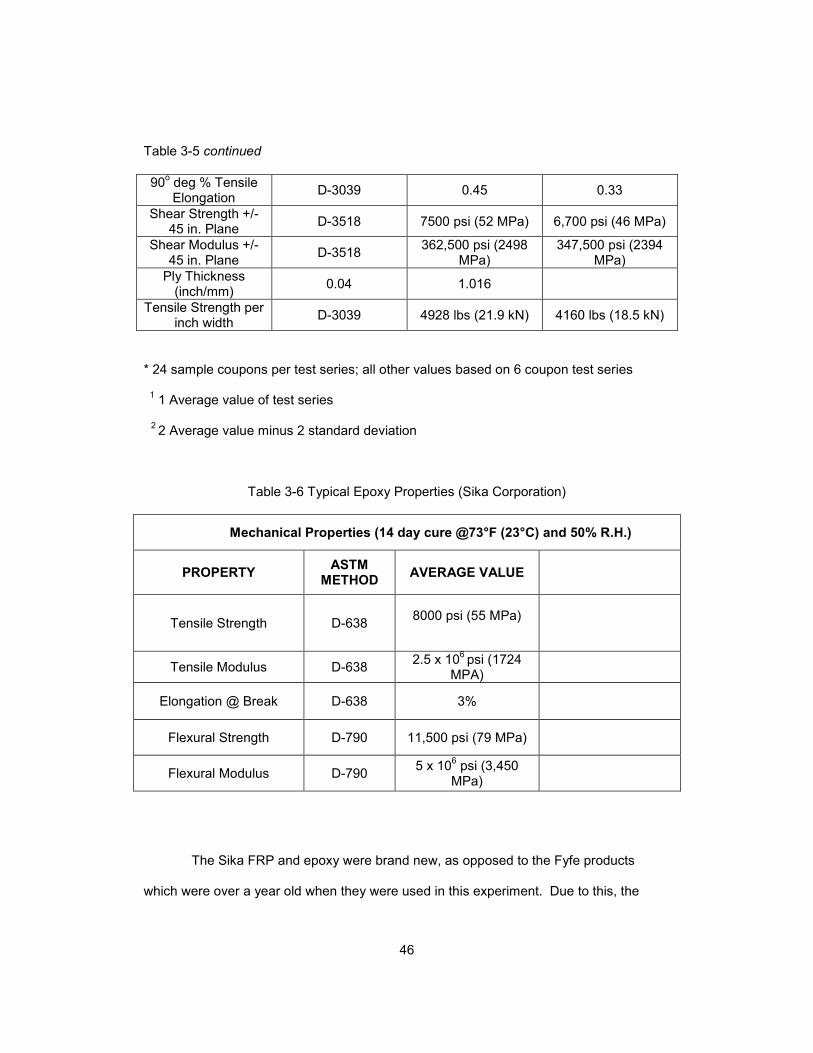
46
Table 3-5 continued
90o deg % Tensile Elongation
D-3039 0.45 0.33
Shear Strength +/- 45 in. Plane
D-3518 7500 psi (52 MPa) 6,700 psi (46 MPa)
Shear Modulus +/- 45 in. Plane
D-3518 362,500 psi (2498
MPa) 347,500 psi (2394
MPa)
Ply Thickness (inch/mm)
0.04 1.016
Tensile Strength per inch width
D-3039 4928 lbs (21.9 kN) 4160 lbs (18.5 kN)
* 24 sample coupons per test series; all other values based on 6 coupon test series
1 1 Average value of test series
2 2 Average value minus 2 standard deviation
Table 3-6 Typical Epoxy Properties (Sika Corporation)
Mechanical Properties (14 day cure @73°F (23°C) and 50% R.H.)
PROPERTY ASTM
METHOD AVERAGE VALUE
Tensile Strength
D-638 8000 psi (55 MPa)
Tensile Modulus
D-638 2.5 x 10
6 psi (1724
MPA)
Elongation @ Break
D-638 3%
Flexural Strength D-790 11,500 psi (79 MPa)
Flexural Modulus D-790 5 x 10
6 psi (3,450
MPa)
The Sika FRP and epoxy were brand new, as opposed to the Fyfe products
which were over a year old when they were used in this experiment. Due to this, the
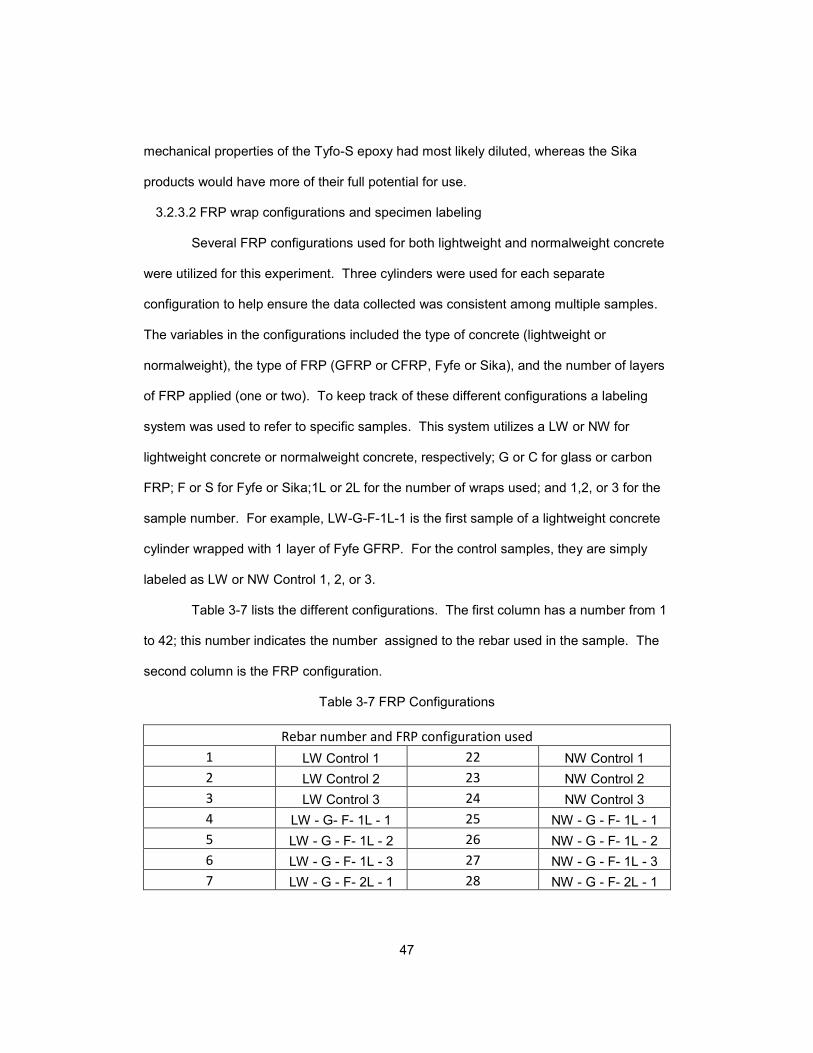
47
mechanical properties of the Tyfo-S epoxy had most likely diluted, whereas the Sika
products would have more of their full potential for use.
3.2.3.2 FRP wrap configurations and specimen labeling
Several FRP configurations used for both lightweight and normalweight concrete
were utilized for this experiment. Three cylinders were used for each separate
configuration to help ensure the data collected was consistent among multiple samples.
The variables in the configurations included the type of concrete (lightweight or
normalweight), the type of FRP (GFRP or CFRP, Fyfe or Sika), and the number of layers
of FRP applied (one or two). To keep track of these different configurations a labeling
system was used to refer to specific samples. This system utilizes a LW or NW for
lightweight concrete or normalweight concrete, respectively; G or C for glass or carbon
FRP; F or S for Fyfe or Sika;1L or 2L for the number of wraps used; and 1,2, or 3 for the
sample number. For example, LW-G-F-1L-1 is the first sample of a lightweight concrete
cylinder wrapped with 1 layer of Fyfe GFRP. For the control samples, they are simply
labeled as LW or NW Control 1, 2, or 3.
Table 3-7 lists the different configurations. The first column has a number from 1
to 42; this number indicates the number assigned to the rebar used in the sample. The
second column is the FRP configuration.
Table 3-7 FRP Configurations
Rebar number and FRP configuration used
1 LW Control 1 22 NW Control 1
2 LW Control 2 23 NW Control 2
3 LW Control 3 24 NW Control 3
4 LW - G- F- 1L - 1 25 NW - G - F- 1L - 1
5 LW - G - F- 1L - 2 26 NW - G - F- 1L - 2
6 LW - G - F- 1L - 3 27 NW - G - F- 1L - 3
7 LW - G - F- 2L - 1 28 NW - G - F- 2L - 1
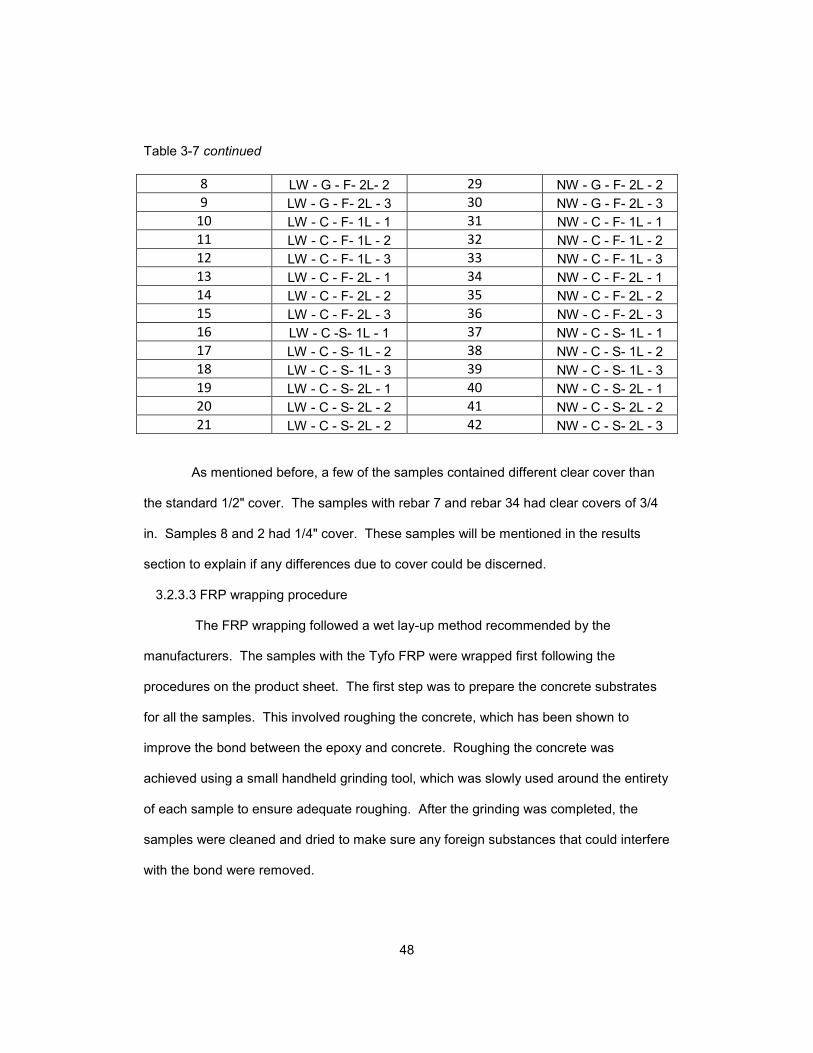
48
Table 3-7 continued
8 LW - G - F- 2L- 2 29 NW - G - F- 2L - 2
9 LW - G - F- 2L - 3 30 NW - G - F- 2L - 3
10 LW - C - F- 1L - 1 31 NW - C - F- 1L - 1
11 LW - C - F- 1L - 2 32 NW - C - F- 1L - 2
12 LW - C - F- 1L - 3 33 NW - C - F- 1L - 3
13 LW - C - F- 2L - 1 34 NW - C - F- 2L - 1
14 LW - C - F- 2L - 2 35 NW - C - F- 2L - 2
15 LW - C - F- 2L - 3 36 NW - C - F- 2L - 3
16 LW - C -S- 1L - 1 37 NW - C - S- 1L - 1
17 LW - C - S- 1L - 2 38 NW - C - S- 1L - 2
18 LW - C - S- 1L - 3 39 NW - C - S- 1L - 3
19 LW - C - S- 2L - 1 40 NW - C - S- 2L - 1
20 LW - C - S- 2L - 2 41 NW - C - S- 2L - 2
21 LW - C - S- 2L - 2 42 NW - C - S- 2L - 3
As mentioned before, a few of the samples contained different clear cover than
the standard 1/2" cover. The samples with rebar 7 and rebar 34 had clear covers of 3/4
in. Samples 8 and 2 had 1/4" cover. These samples will be mentioned in the results
section to explain if any differences due to cover could be discerned.
3.2.3.3 FRP wrapping procedure
The FRP wrapping followed a wet lay-up method recommended by the
manufacturers. The samples with the Tyfo FRP were wrapped first following the
procedures on the product sheet. The first step was to prepare the concrete substrates
for all the samples. This involved roughing the concrete, which has been shown to
improve the bond between the epoxy and concrete. Roughing the concrete was
achieved using a small handheld grinding tool, which was slowly used around the entirety
of each sample to ensure adequate roughing. After the grinding was completed, the
samples were cleaned and dried to make sure any foreign substances that could interfere
with the bond were removed.
49
Following the surface preparation, the FRP sheets were cut to the desired
lengths to be able to wrap around the entire cylinder. The sheets were cut into strips of 4
in by 8 in dimensions, in order to wrap around the full height of the cylinder and around
the circumference. The sheets were made sure to be long enough so that when they
wrapped around the cylinder there would be an overlap of at least 1 in; this would help
ensure that delamination,, in which the FRP becomes detached from the surface it is
being applied to, would be minimized. For cylinders with multiple layers of FRP, the
second layer had to be slightly longer than the first due to the added circumference the
first layer created on the sample.
Once the samples were prepared and the sheets cut, the FRP application
process could begin. First the epoxy had to prepared. The Tyfo S epoxy is comprised of
two components which must be mixed together. The mix comprises of 100 parts of
Component A to 34.5 parts of Component B by weight. Approximately three pounds of
epoxy were mixed, using 2.2 pounds of component A and 0.76 pounds of component B.
Only low amounts of epoxy were needed for the small cylinders used, so a small mixer
was used. The mixer ran for 5 minutes at 400 rpm until a uniform blend was observed.
After this was done, one quarter of this mixture was removed and placed in a small
container. Silica powder was added to this portion at approximately 7% by weight and
mixed together by hand. The purpose of this thickened epoxy is to fill any voids in the
concrete substrate so that FRP bonding can occur over an even surface. After the epoxy
was prepared, the FRP was applied to the cylinders one at a time. First a priming coat of
the epoxy without the silica was applied on the sides and bottom of the sample using a
roller; the top of the cylinder where the rebar was protruding was left untreated. A layer
of the thickened epoxy was then applied over the priming layer to fill the voids in the
concrete. The FRP fabric was saturated on both sides with several coats of the epoxy so
50
that it seeped all the way through the fibers. Pressure was applied using the roller to
make sure the entire fabric was saturated. The FRP was then slowly and carefully
wrapped around the cylinder, utilizing hand pressure between the fabric and the concrete
so that a good bond could take place.
FRP is a very stiff material, so before it cures the ends of the material have a
tendency to try to separate from the concrete. For larger samples this separation is not
as pronounced, but for the small samples used in this experiment the FRP would not stay
bonded without applying constant pressure while it cured. Therefore, two or three rubber
bands were used to constrict the FRP so that it would be forced to bond to the concrete.
Some of the epoxy became attached to the rubber bands, so they were left on the
samples throughout the experiment so that the epoxy would not be stripped.
After the FRP was applied and constricted so that it would not separate, another
coat of epoxy was applied. If multiple layers of FRP were used, the second layer was
saturated and applied over the first layer. Rubber bands were applied again to prevent
separation. Both the Tyfo SEH-51A and SCH-41 systems were applied using this
procedure.
The SIkaDur epoxy was mixed similarly to the Fyfe, except a ratio of 1:1 for
components A and B were mixed as according to the directions of the manufacturer. The
silica was also used for this application in the same amount as for the Tyfo-S epoxy.
After all of the samples were wrapped, they were left undisturbed to cure for 48
hours. The Tyfo samples were wrapped first and cured for approximately 4 or 5 days
before the Sika FRP and epoxy were available in the laboratory to use. Therefore, the
Tyfo wrapped samples had more time to cure than the Sika wrapped samples. The Sika
samples were able to cure for 48 hours, and after enough time had elapsed all 42
samples were placed in a plastic tank to begin the accelerated corrosion test.
51
3.3 Accelerated Corrosion Test
3.3.1 Background on the test
As mentioned before, corrosion can take place with the presence of an anode, a
cathode, an electrolyte, and an electrical contact path between two different metals. This
is known as galvanic corrosion. Electrolytic corrosion is similar to galvanic corrosion
except that the current is produced by an external power source. This type of corrosion
forms the basis for this experimental setup. This type of setup has been used in several
accelerated corrosion tests, as mentioned in the literature review.
Galvanic corrosion occurs when two dissimilar metals are in contact, which
creates a galvanic cell. The potential difference between the two metals in this cell
creates a current from the anode through the electrolyte to the cathode, then back to the
anode through the electric path (AWWA, 2002). The more noble metal in this cell
becomes the cathode, in which electrons are consumed, whereas the less noble metal
becomes the anode, where electrons are produced. Therefore, the flow of electrons is
from the anode to the cathode. The loss of electrons in the rebar leaves positively
charged atoms that combine with oxygen and moisture to form hydroxyl ions, which
combine with ferrous ions to form ferrous hydroxide and ferrous oxide (Spainhour, 2002).
Ferrous oxide and ferrous hydroxide occupy greater volumes than what they were
created with, which creates radial pressures causing cracking.
When two metals create a galvanic cell, they create their own current. In
electrolytic corrosion, a direct current from an external source can drive the corrosion
reaction by supplying the current in the electric return path. These external currents,
known as stray currents, are generally much stronger than the ones produced in the
galvanic cell and may cause corrosion much faster (Smiths Power, 2013).
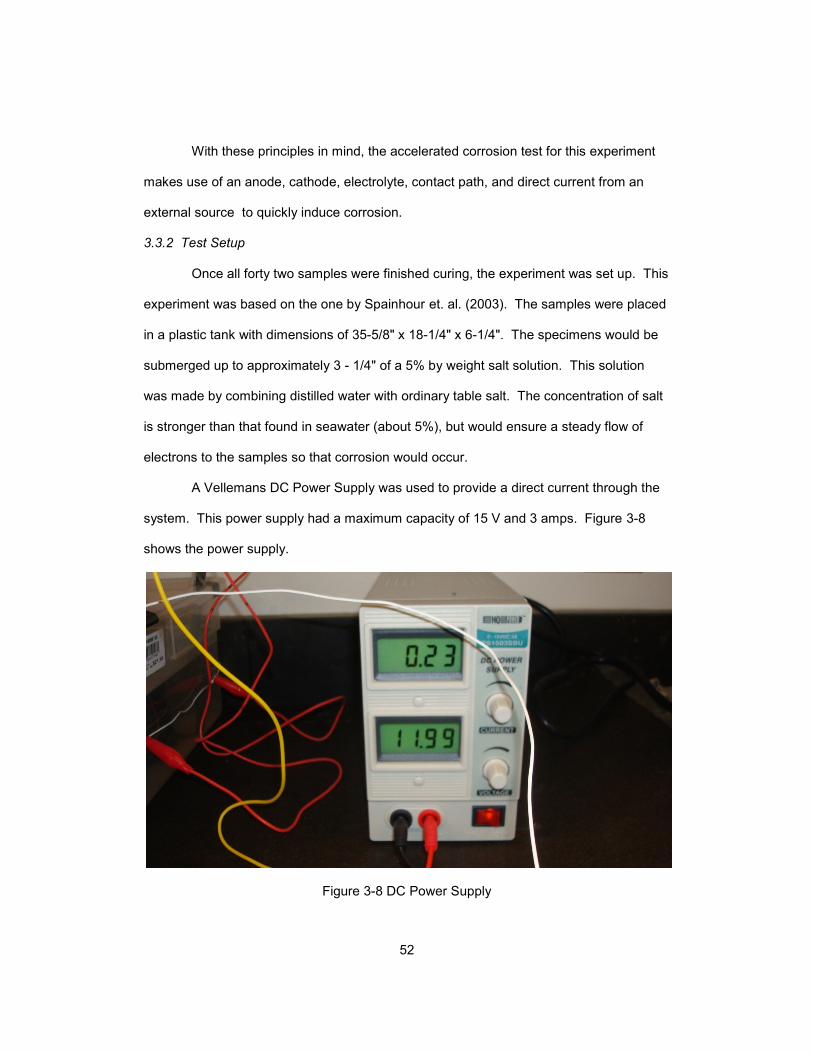
52
With these principles in mind, the accelerated corrosion test for this experiment
makes use of an anode, cathode, electrolyte, contact path, and direct current from an
external source to quickly induce corrosion.
3.3.2 Test Setup
Once all forty two samples were finished curing, the experiment was set up. This
experiment was based on the one by Spainhour et. al. (2003). The samples were placed
in a plastic tank with dimensions of 35-5/8" x 18-1/4" x 6-1/4". The specimens would be
submerged up to approximately 3 - 1/4" of a 5% by weight salt solution. This solution
was made by combining distilled water with ordinary table salt. The concentration of salt
is stronger than that found in seawater (about 5%), but would ensure a steady flow of
electrons to the samples so that corrosion would occur.
A Vellemans DC Power Supply was used to provide a direct current through the
system. This power supply had a maximum capacity of 15 V and 3 amps. Figure 3-8
shows the power supply.
Figure 3-8 DC Power Supply
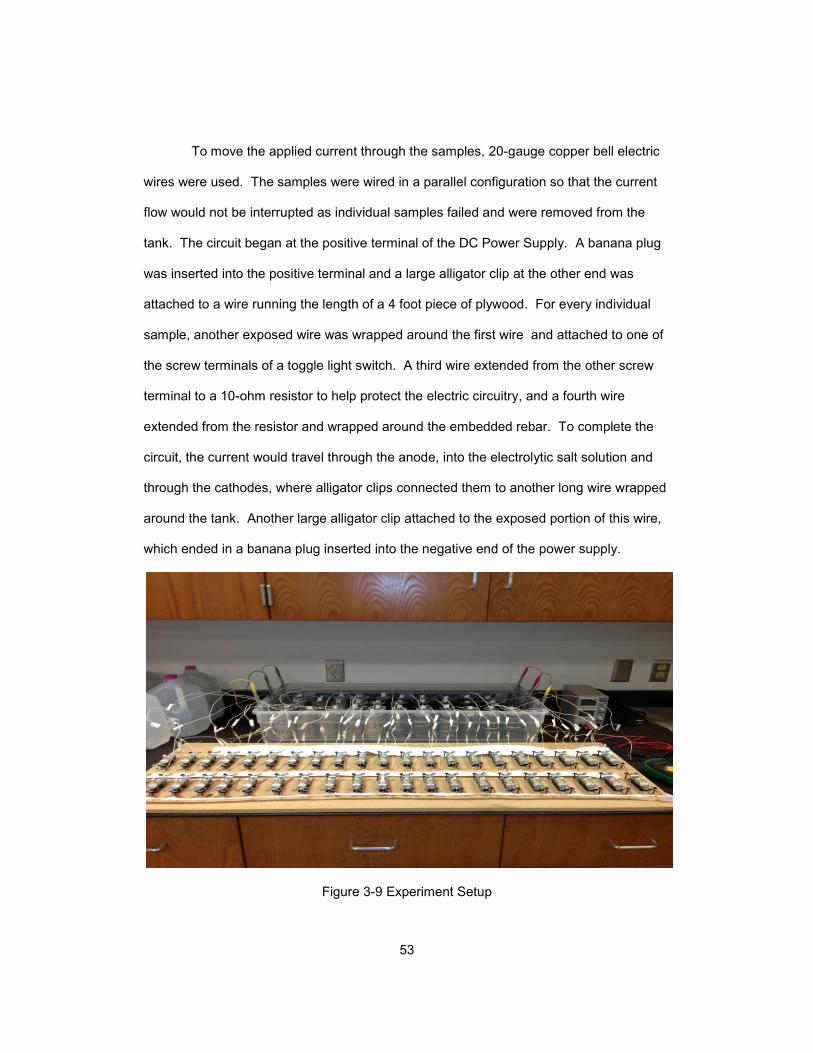
53
To move the applied current through the samples, 20-gauge copper bell electric
wires were used. The samples were wired in a parallel configuration so that the current
flow would not be interrupted as individual samples failed and were removed from the
tank. The circuit began at the positive terminal of the DC Power Supply. A banana plug
was inserted into the positive terminal and a large alligator clip at the other end was
attached to a wire running the length of a 4 foot piece of plywood. For every individual
sample, another exposed wire was wrapped around the first wire and attached to one of
the screw terminals of a toggle light switch. A third wire extended from the other screw
terminal to a 10-ohm resistor to help protect the electric circuitry, and a fourth wire
extended from the resistor and wrapped around the embedded rebar. To complete the
circuit, the current would travel through the anode, into the electrolytic salt solution and
through the cathodes, where alligator clips connected them to another long wire wrapped
around the tank. Another large alligator clip attached to the exposed portion of this wire,
which ended in a banana plug inserted into the negative end of the power supply.
Figure 3-9 Experiment Setup
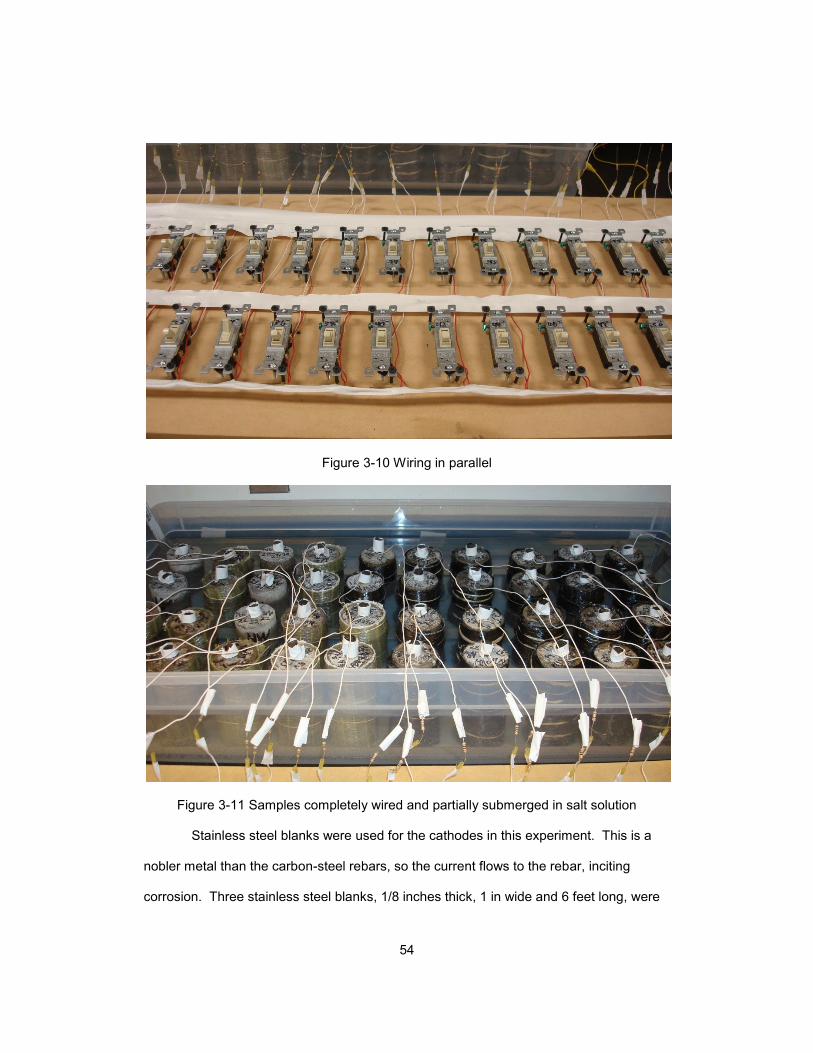
54
Figure 3-10 Wiring in parallel
Figure 3-11 Samples completely wired and partially submerged in salt solution
Stainless steel blanks were used for the cathodes in this experiment. This is a
nobler metal than the carbon-steel rebars, so the current flows to the rebar, inciting
corrosion. Three stainless steel blanks, 1/8 inches thick, 1 in wide and 6 feet long, were
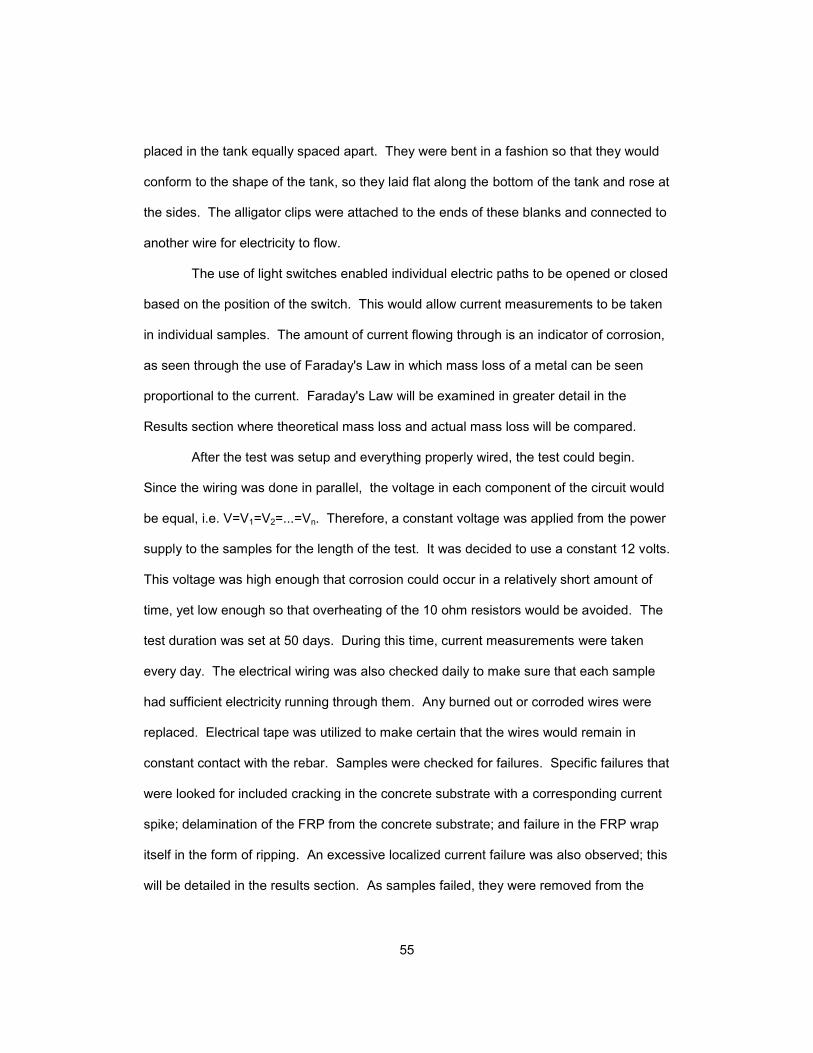
55
placed in the tank equally spaced apart. They were bent in a fashion so that they would
conform to the shape of the tank, so they laid flat along the bottom of the tank and rose at
the sides. The alligator clips were attached to the ends of these blanks and connected to
another wire for electricity to flow.
The use of light switches enabled individual electric paths to be opened or closed
based on the position of the switch. This would allow current measurements to be taken
in individual samples. The amount of current flowing through is an indicator of corrosion,
as seen through the use of Faraday's Law in which mass loss of a metal can be seen
proportional to the current. Faraday's Law will be examined in greater detail in the
Results section where theoretical mass loss and actual mass loss will be compared.
After the test was setup and everything properly wired, the test could begin.
Since the wiring was done in parallel, the voltage in each component of the circuit would
be equal, i.e. V=V1=V2=...=Vn. Therefore, a constant voltage was applied from the power
supply to the samples for the length of the test. It was decided to use a constant 12 volts.
This voltage was high enough that corrosion could occur in a relatively short amount of
time, yet low enough so that overheating of the 10 ohm resistors would be avoided. The
test duration was set at 50 days. During this time, current measurements were taken
every day. The electrical wiring was also checked daily to make sure that each sample
had sufficient electricity running through them. Any burned out or corroded wires were
replaced. Electrical tape was utilized to make certain that the wires would remain in
constant contact with the rebar. Samples were checked for failures. Specific failures that
were looked for included cracking in the concrete substrate with a corresponding current
spike; delamination of the FRP from the concrete substrate; and failure in the FRP wrap
itself in the form of ripping. An excessive localized current failure was also observed; this
will be detailed in the results section. As samples failed, they were removed from the
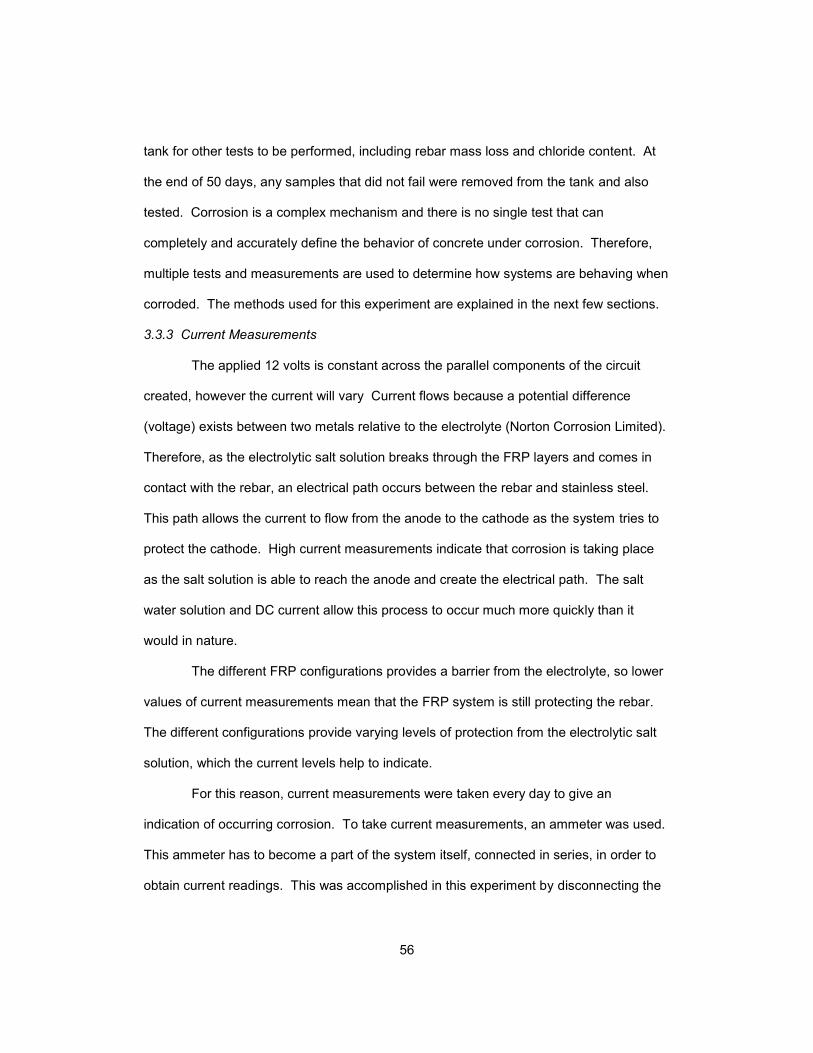
56
tank for other tests to be performed, including rebar mass loss and chloride content. At
the end of 50 days, any samples that did not fail were removed from the tank and also
tested. Corrosion is a complex mechanism and there is no single test that can
completely and accurately define the behavior of concrete under corrosion. Therefore,
multiple tests and measurements are used to determine how systems are behaving when
corroded. The methods used for this experiment are explained in the next few sections.
3.3.3 Current Measurements
The applied 12 volts is constant across the parallel components of the circuit
created, however the current will vary Current flows because a potential difference
(voltage) exists between two metals relative to the electrolyte (Norton Corrosion Limited).
Therefore, as the electrolytic salt solution breaks through the FRP layers and comes in
contact with the rebar, an electrical path occurs between the rebar and stainless steel.
This path allows the current to flow from the anode to the cathode as the system tries to
protect the cathode. High current measurements indicate that corrosion is taking place
as the salt solution is able to reach the anode and create the electrical path. The salt
water solution and DC current allow this process to occur much more quickly than it
would in nature.
The different FRP configurations provides a barrier from the electrolyte, so lower
values of current measurements mean that the FRP system is still protecting the rebar.
The different configurations provide varying levels of protection from the electrolytic salt
solution, which the current levels help to indicate.
For this reason, current measurements were taken every day to give an
indication of occurring corrosion. To take current measurements, an ammeter was used.
This ammeter has to become a part of the system itself, connected in series, in order to
obtain current readings. This was accomplished in this experiment by disconnecting the
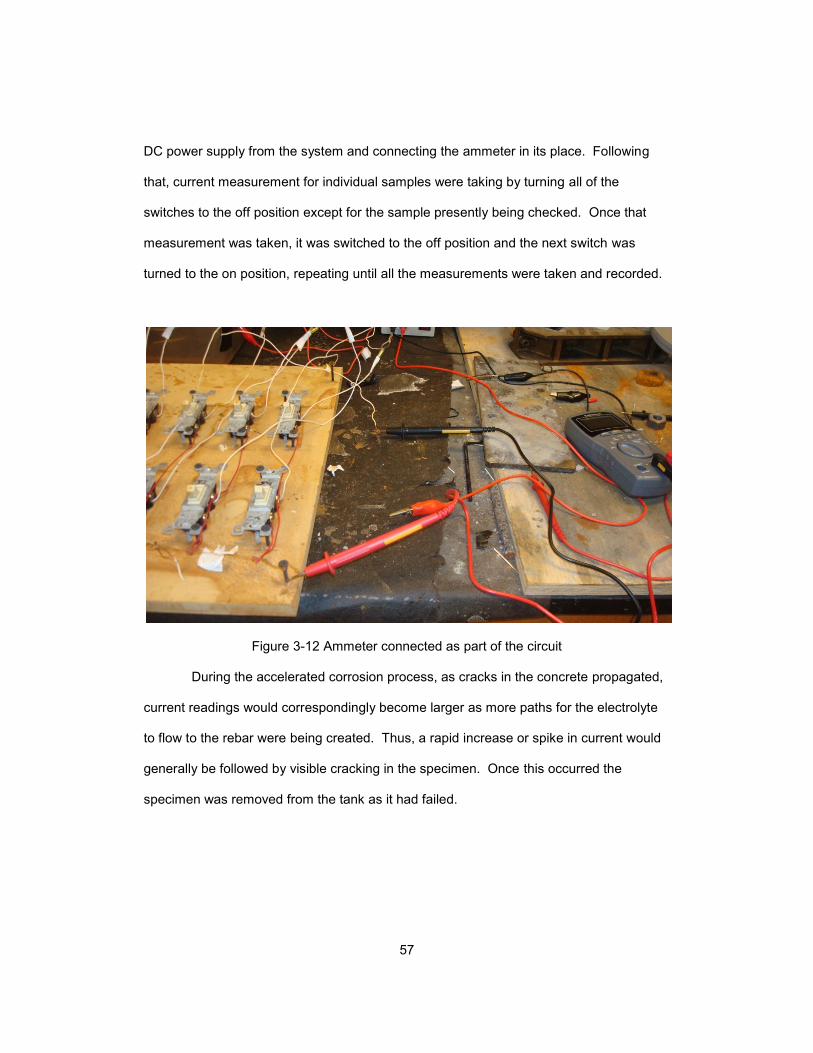
57
DC power supply from the system and connecting the ammeter in its place. Following
that, current measurement for individual samples were taking by turning all of the
switches to the off position except for the sample presently being checked. Once that
measurement was taken, it was switched to the off position and the next switch was
turned to the on position, repeating until all the measurements were taken and recorded.
Figure 3-12 Ammeter connected as part of the circuit
During the accelerated corrosion process, as cracks in the concrete propagated,
current readings would correspondingly become larger as more paths for the electrolyte
to flow to the rebar were being created. Thus, a rapid increase or spike in current would
generally be followed by visible cracking in the specimen. Once this occurred the
specimen was removed from the tank as it had failed.
58
3.3.4 ASTM C1152 - Standard Test Method for Acid-Soluble Chloride in Mortar and
Concrete
After specimens were removed from the tank they were subject to further
analysis. One form of analysis was the determination of the activity of chlorides in the
concrete. The ability to measure the penetrability of chloride ions by measuring electrical
charge or determining the chloride content through chemical analysis can be used as a
measurement of corrosion activity. Due to the fact that these cylinders are wrapped with
FRP, chloride penetration tests that use electrical indication for penetration are difficult to
perform. For instance, ASTM C1202 is the Standard Test Method for Electrical Indication
of Concretes Ability to Resist Chloride Ion Penetration. This test is commonly used as a
quick indicator of chloride penetration. It involves applying a DC voltage to a cylindrical
specimen placed between two reservoirs; one filled with a 3% NaCl solution and the
other with a 0.3 M NaOH solution. The voltage is applied and the total charge is
measured after 6 hours. The test, however, requires specimens of 4 in diameter and 2 in
thickness. Due to the fact that the cylinders in this experiment are 2 in diameter
specimens, the requisite thickness would not be attainable with these cylinders. Another
issue with the test is that it depends on the conductivity of the materials, so a highly
conductive material such as carbon FRP will give results that are erroneously high
(Stanish et. al., 1997).
It was determined for this experiment that the best way to find the ability of the
FRP to resist chloride penetration was to determine the chloride content using a chemical
titration analysis. ASTM C1152 is the Standard Test Method for Acid-Soluble Chloride in
Mortar and Concrete. This test measures the amount of chloride in a concrete or mortar
system with nitric acid to free the acid-soluble chloride in the system and then measuring
the amount of chloride using a chemical titration. This method is useful for determining
59
the effectiveness of admixtures or protection systems such as FRP in reducing chloride
penetration in one sample of concrete. However, this test method is not useful for
comparing different concrete mixes that utilize different aggregates, since the amount of
acid-soluble material is different. In this particular experiment, the lightweight aggregate
used in not acid-soluble, so the acid-soluble chloride is restricted to the cement faction of
the concrete. What this test was intended to do for this experiment is compare the
effectiveness of the different FRP systems and FRP configurations for each mix.
Therefore, the lightweight concrete control samples were compared to the wrapped
lightweight samples, and the wrapped samples were compared to each other. The same
comparison was made for the normalweight samples. No direct comparison was made
between lightweight and normalweight samples.
The concrete samples were drilled using a handheld drill. The cylinders were
drilled at the center of the sides of the sample, 2 inches from the top and bottom of the
cylinder, to a depth of 3/4", or to the location of the face of the rebar. This location was
chosen because all of the cylinders had a cover of 3/4" on the sides, while some of the
rebars had variable concrete cover from the bottom of the cylinder. The test requires
gathering 20 grams of a sample and testing 10 grams. To get enough material, different
drill bit sizes had to be used. Before each sample of material was gathered, the drill bits
were cleaned with isopropyl alcohol to avoid contamination. A 1/8" drill bit was used first,
where the first 0.5 grams of material was discarded. The hole was drilled to the rebar,
then a 3/8" drill bit was used to widen the hole. Again, the first 0.5 grams of material was
discarded, then the rest collected. Finally, a 5/8" drill bit was used until enough material
was gathered. Another 10 grams of sample was obtained at the same location on the
opposite side of the cylinder using the same method. The sample was pulverized and
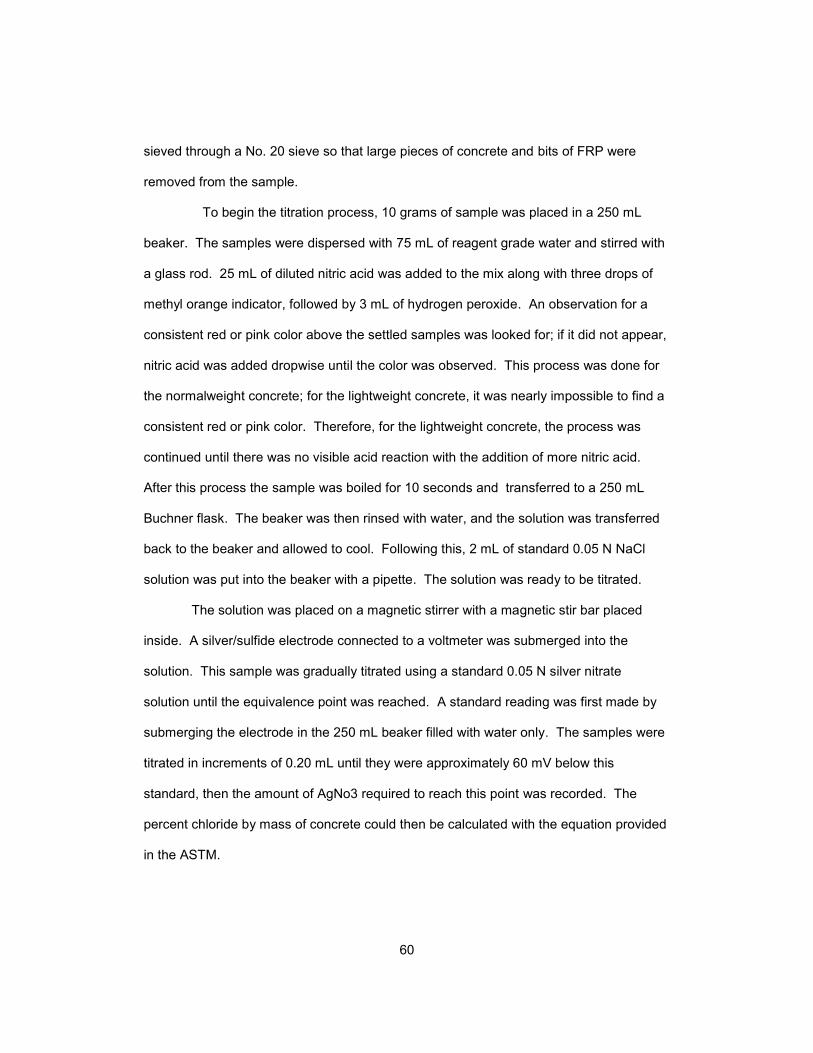
60
sieved through a No. 20 sieve so that large pieces of concrete and bits of FRP were
removed from the sample.
To begin the titration process, 10 grams of sample was placed in a 250 mL
beaker. The samples were dispersed with 75 mL of reagent grade water and stirred with
a glass rod. 25 mL of diluted nitric acid was added to the mix along with three drops of
methyl orange indicator, followed by 3 mL of hydrogen peroxide. An observation for a
consistent red or pink color above the settled samples was looked for; if it did not appear,
nitric acid was added dropwise until the color was observed. This process was done for
the normalweight concrete; for the lightweight concrete, it was nearly impossible to find a
consistent red or pink color. Therefore, for the lightweight concrete, the process was
continued until there was no visible acid reaction with the addition of more nitric acid.
After this process the sample was boiled for 10 seconds and transferred to a 250 mL
Buchner flask. The beaker was then rinsed with water, and the solution was transferred
back to the beaker and allowed to cool. Following this, 2 mL of standard 0.05 N NaCl
solution was put into the beaker with a pipette. The solution was ready to be titrated.
The solution was placed on a magnetic stirrer with a magnetic stir bar placed
inside. A silver/sulfide electrode connected to a voltmeter was submerged into the
solution. This sample was gradually titrated using a standard 0.05 N silver nitrate
solution until the equivalence point was reached. A standard reading was first made by
submerging the electrode in the 250 mL beaker filled with water only. The samples were
titrated in increments of 0.20 mL until they were approximately 60 mV below this
standard, then the amount of AgNo3 required to reach this point was recorded. The
percent chloride by mass of concrete could then be calculated with the equation provided
in the ASTM.
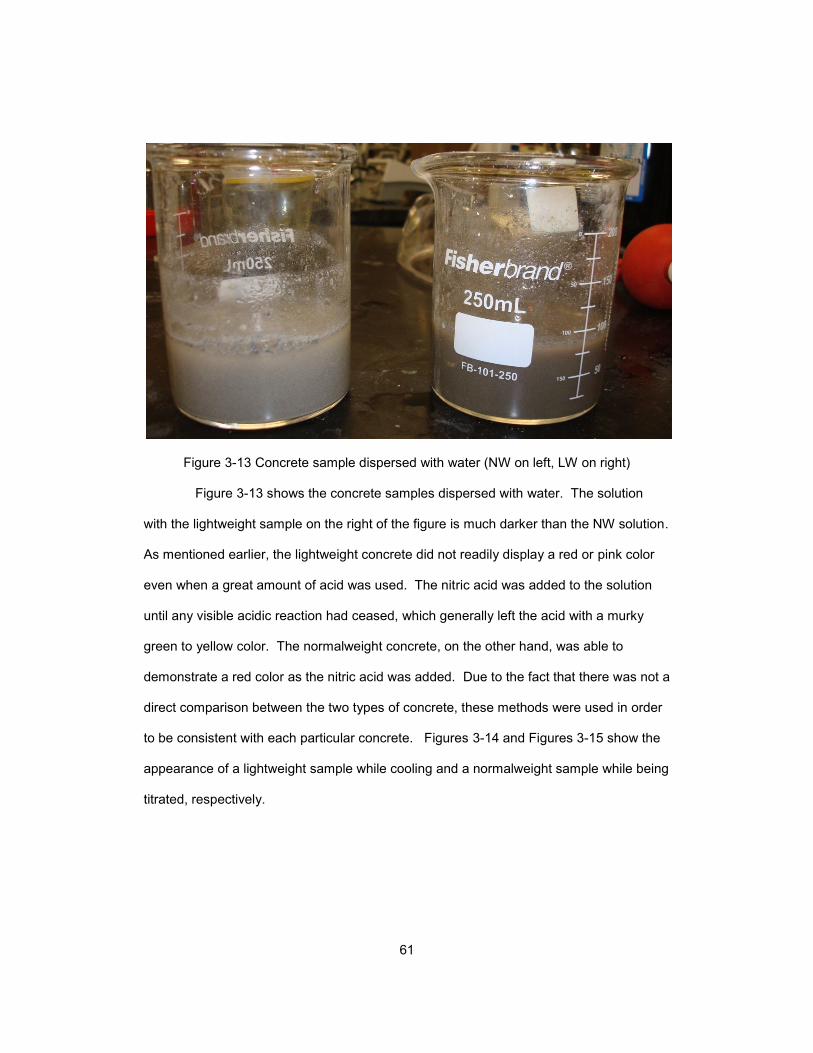
61
Figure 3-13 Concrete sample dispersed with water (NW on left, LW on right)
Figure 3-13 shows the concrete samples dispersed with water. The solution
with the lightweight sample on the right of the figure is much darker than the NW solution.
As mentioned earlier, the lightweight concrete did not readily display a red or pink color
even when a great amount of acid was used. The nitric acid was added to the solution
until any visible acidic reaction had ceased, which generally left the acid with a murky
green to yellow color. The normalweight concrete, on the other hand, was able to
demonstrate a red color as the nitric acid was added. Due to the fact that there was not a
direct comparison between the two types of concrete, these methods were used in order
to be consistent with each particular concrete. Figures 3-14 and Figures 3-15 show the
appearance of a lightweight sample while cooling and a normalweight sample while being
titrated, respectively.
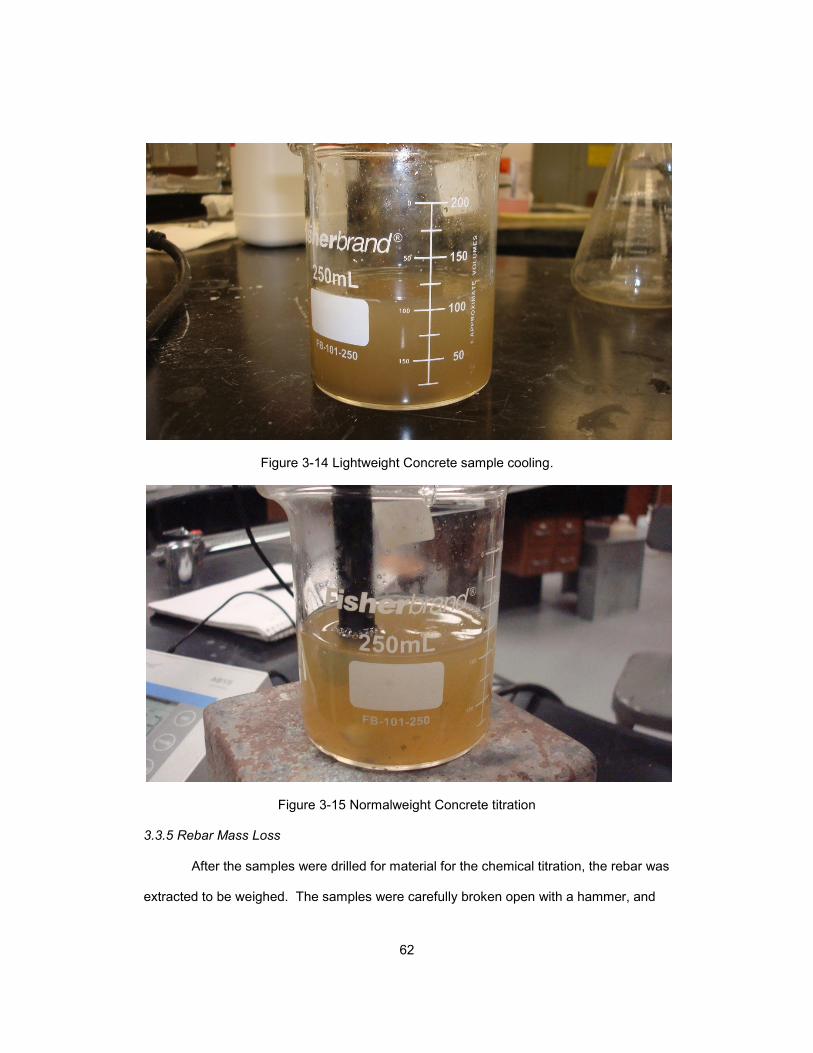
62
Figure 3-14 Lightweight Concrete sample cooling.
Figure 3-15 Normalweight Concrete titration
3.3.5 Rebar Mass Loss
After the samples were drilled for material for the chemical titration, the rebar was
extracted to be weighed. The samples were carefully broken open with a hammer, and
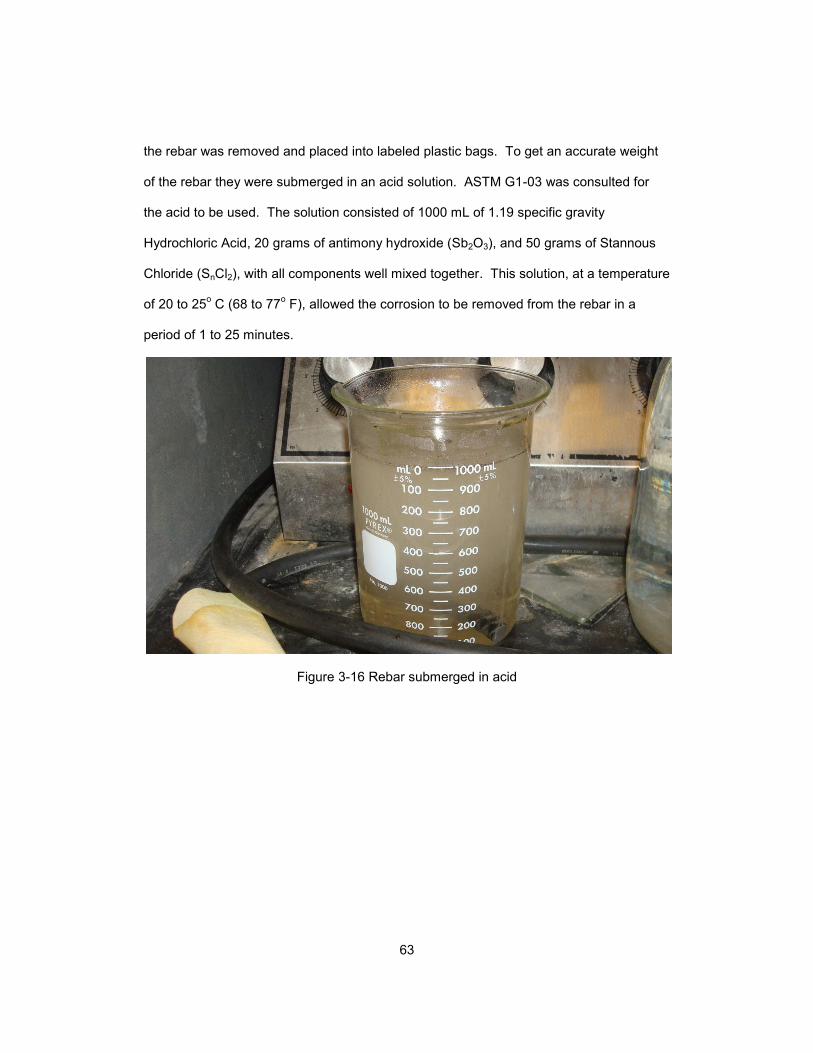
63
the rebar was removed and placed into labeled plastic bags. To get an accurate weight
of the rebar they were submerged in an acid solution. ASTM G1-03 was consulted for
the acid to be used. The solution consisted of 1000 mL of 1.19 specific gravity
Hydrochloric Acid, 20 grams of antimony hydroxide (Sb2O3), and 50 grams of Stannous
Chloride (SnCl2), with all components well mixed together. This solution, at a temperature
of 20 to 25o C (68 to 77
o F), allowed the corrosion to be removed from the rebar in a
period of 1 to 25 minutes.
Figure 3-16 Rebar submerged in acid
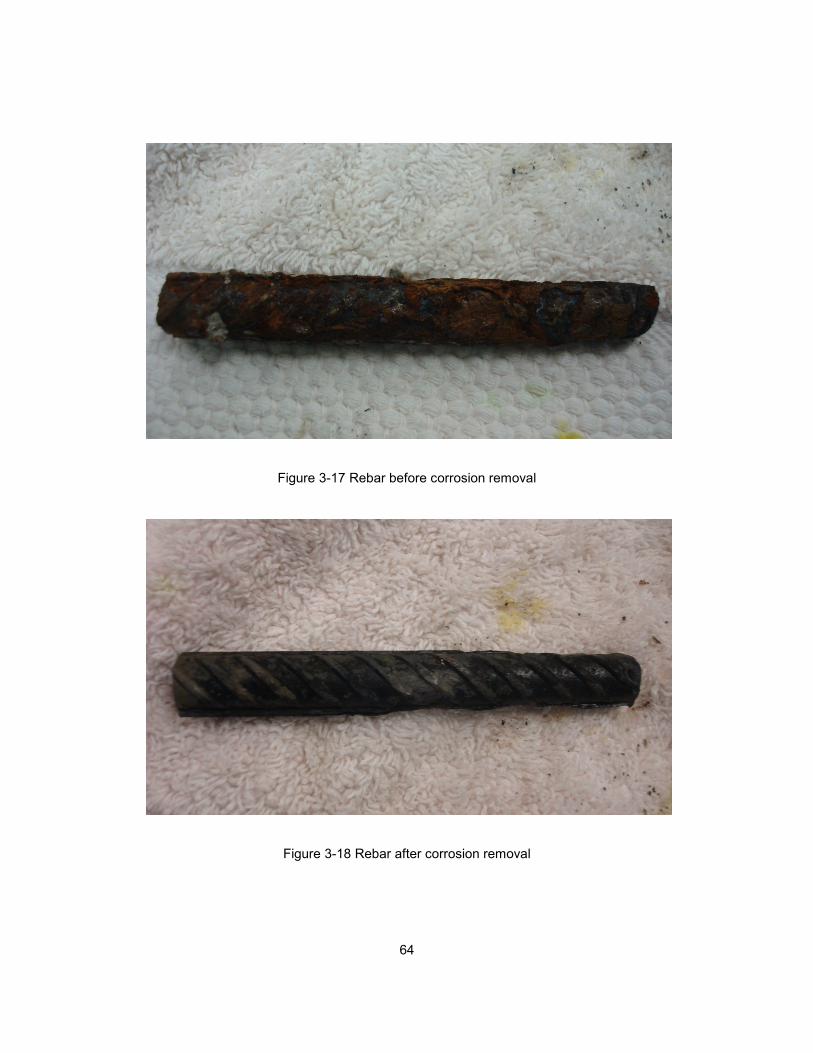
64
Figure 3-17 Rebar before corrosion removal
Figure 3-18 Rebar after corrosion removal
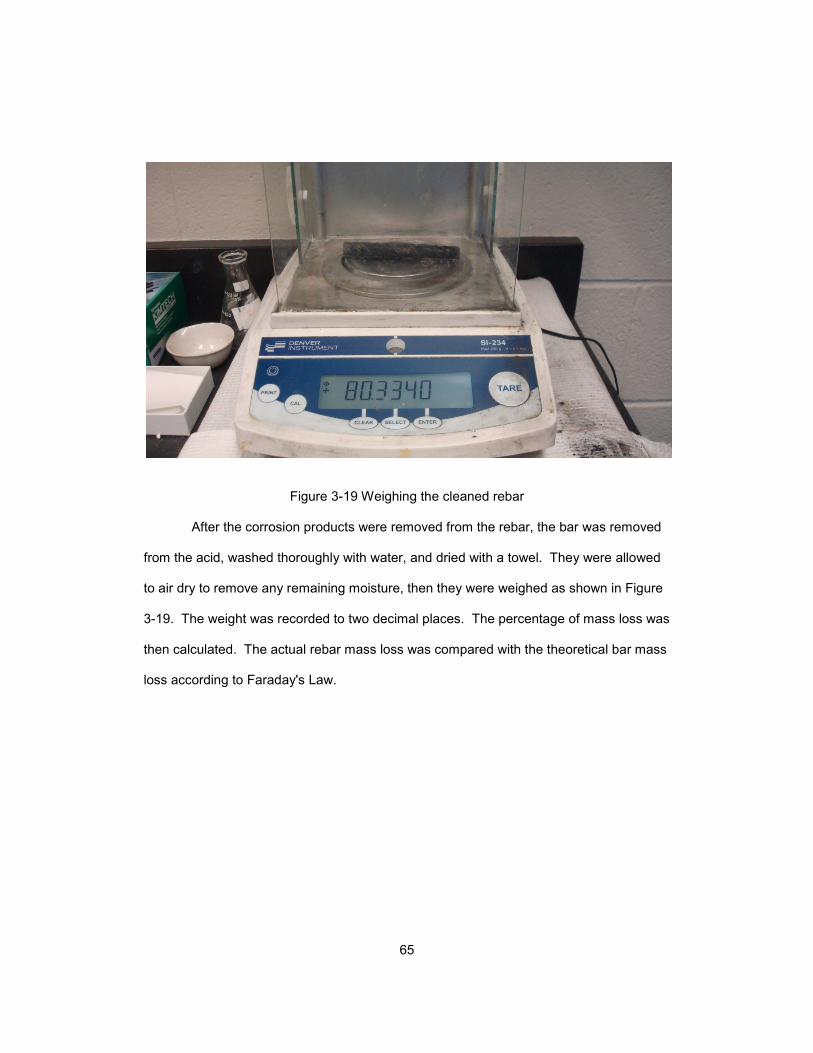
65
Figure 3-19 Weighing the cleaned rebar
After the corrosion products were removed from the rebar, the bar was removed
from the acid, washed thoroughly with water, and dried with a towel. They were allowed
to air dry to remove any remaining moisture, then they were weighed as shown in Figure
3-19. The weight was recorded to two decimal places. The percentage of mass loss was
then calculated. The actual rebar mass loss was compared with the theoretical bar mass
loss according to Faraday's Law.
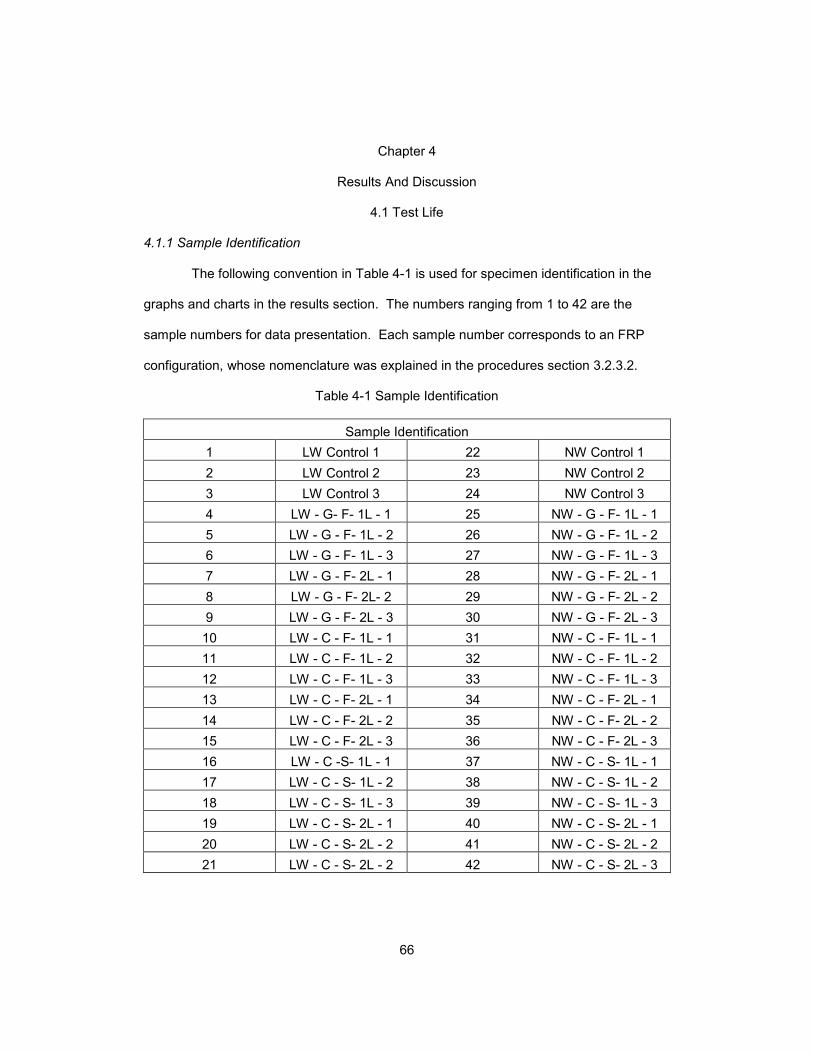
66
Chapter 4
Results And Discussion
4.1 Test Life
4.1.1 Sample Identification
The following convention in Table 4-1 is used for specimen identification in the
graphs and charts in the results section. The numbers ranging from 1 to 42 are the
sample numbers for data presentation. Each sample number corresponds to an FRP
configuration, whose nomenclature was explained in the procedures section 3.2.3.2.
Table 4-1 Sample Identification
Sample Identification
1 LW Control 1 22 NW Control 1
2 LW Control 2 23 NW Control 2
3 LW Control 3 24 NW Control 3
4 LW - G- F- 1L - 1 25 NW - G - F- 1L - 1
5 LW - G - F- 1L - 2 26 NW - G - F- 1L - 2
6 LW - G - F- 1L - 3 27 NW - G - F- 1L - 3
7 LW - G - F- 2L - 1 28 NW - G - F- 2L - 1
8 LW - G - F- 2L- 2 29 NW - G - F- 2L - 2
9 LW - G - F- 2L - 3 30 NW - G - F- 2L - 3
10 LW - C - F- 1L - 1 31 NW - C - F- 1L - 1
11 LW - C - F- 1L - 2 32 NW - C - F- 1L - 2
12 LW - C - F- 1L - 3 33 NW - C - F- 1L - 3
13 LW - C - F- 2L - 1 34 NW - C - F- 2L - 1
14 LW - C - F- 2L - 2 35 NW - C - F- 2L - 2
15 LW - C - F- 2L - 3 36 NW - C - F- 2L - 3
16 LW - C -S- 1L - 1 37 NW - C - S- 1L - 1
17 LW - C - S- 1L - 2 38 NW - C - S- 1L - 2
18 LW - C - S- 1L - 3 39 NW - C - S- 1L - 3
19 LW - C - S- 2L - 1 40 NW - C - S- 2L - 1
20 LW - C - S- 2L - 2 41 NW - C - S- 2L - 2
21 LW - C - S- 2L - 2 42 NW - C - S- 2L - 3
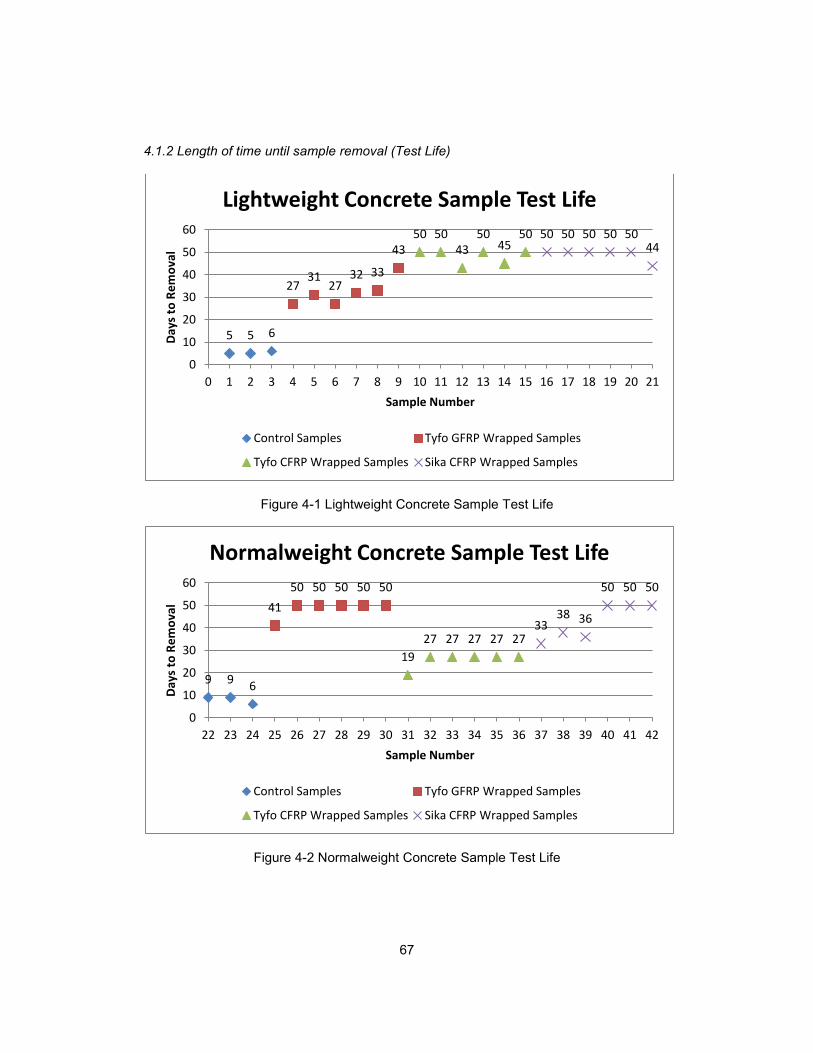
67
4.1.2 Length of time until sample removal (Test Life)
Figure 4-1 Lightweight Concrete Sample Test Life
Figure 4-2 Normalweight Concrete Sample Test Life
5 5 6
27 31
27 32 33
43 50 50
43 50
45 50 50 50 50 50 50
44
0
10
20
30
40
50
60
0 1 2 3 4 5 6 7 8 9 10 11 12 13 14 15 16 17 18 19 20 21
Day
s to
Re
mo
val
Sample Number
Lightweight Concrete Sample Test Life
Control Samples Tyfo GFRP Wrapped Samples
Tyfo CFRP Wrapped Samples Sika CFRP Wrapped Samples
9 9 6
41
50 50 50 50 50
19
27 27 27 27 27 33
38 36
50 50 50
0
10
20
30
40
50
60
22 23 24 25 26 27 28 29 30 31 32 33 34 35 36 37 38 39 40 41 42
Day
s to
Re
mo
val
Sample Number
Normalweight Concrete Sample Test Life
Control Samples Tyfo GFRP Wrapped Samples
Tyfo CFRP Wrapped Samples Sika CFRP Wrapped Samples
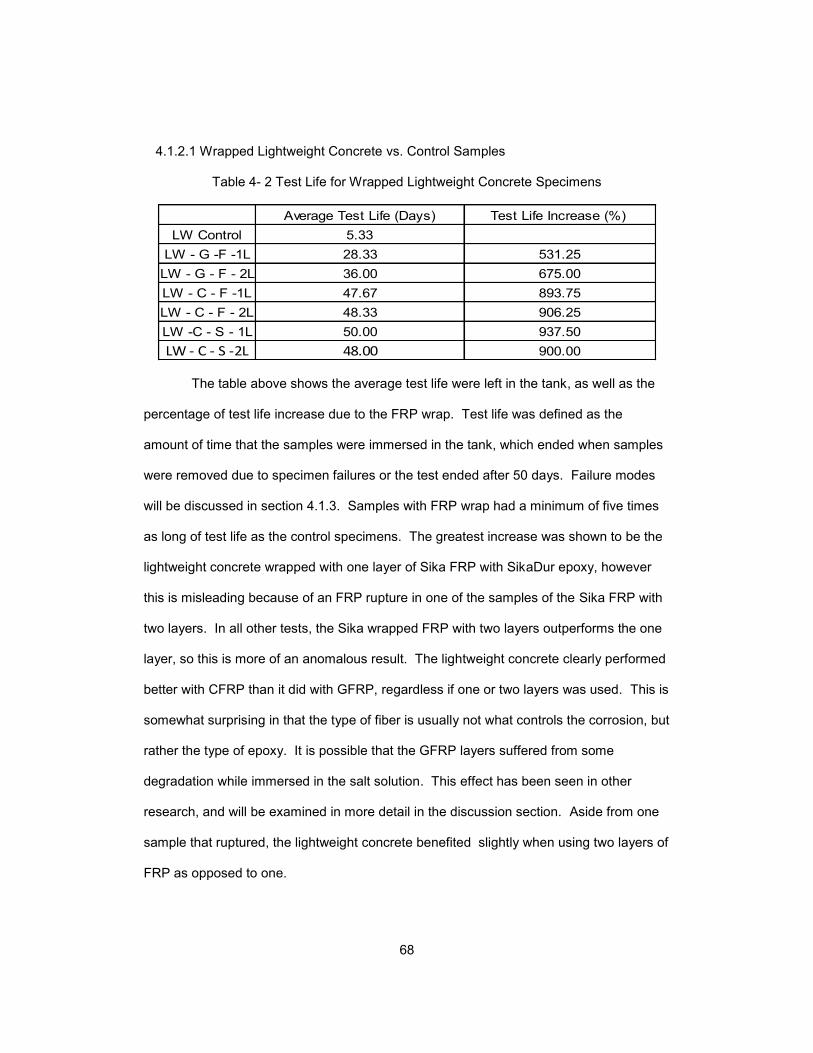
68
4.1.2.1 Wrapped Lightweight Concrete vs. Control Samples
Table 4- 2 Test Life for Wrapped Lightweight Concrete Specimens
Average Test Life (Days) Test Life Increase (%)
LW Control 5.33
LW - G -F -1L 28.33 531.25
LW - G - F - 2L 36.00 675.00
LW - C - F -1L 47.67 893.75
LW - C - F - 2L 48.33 906.25
LW -C - S - 1L 50.00 937.50
LW - C - S -2L 48.00 900.00
The table above shows the average test life were left in the tank, as well as the
percentage of test life increase due to the FRP wrap. Test life was defined as the
amount of time that the samples were immersed in the tank, which ended when samples
were removed due to specimen failures or the test ended after 50 days. Failure modes
will be discussed in section 4.1.3. Samples with FRP wrap had a minimum of five times
as long of test life as the control specimens. The greatest increase was shown to be the
lightweight concrete wrapped with one layer of Sika FRP with SikaDur epoxy, however
this is misleading because of an FRP rupture in one of the samples of the Sika FRP with
two layers. In all other tests, the Sika wrapped FRP with two layers outperforms the one
layer, so this is more of an anomalous result. The lightweight concrete clearly performed
better with CFRP than it did with GFRP, regardless if one or two layers was used. This is
somewhat surprising in that the type of fiber is usually not what controls the corrosion, but
rather the type of epoxy. It is possible that the GFRP layers suffered from some
degradation while immersed in the salt solution. This effect has been seen in other
research, and will be examined in more detail in the discussion section. Aside from one
sample that ruptured, the lightweight concrete benefited slightly when using two layers of
FRP as opposed to one.
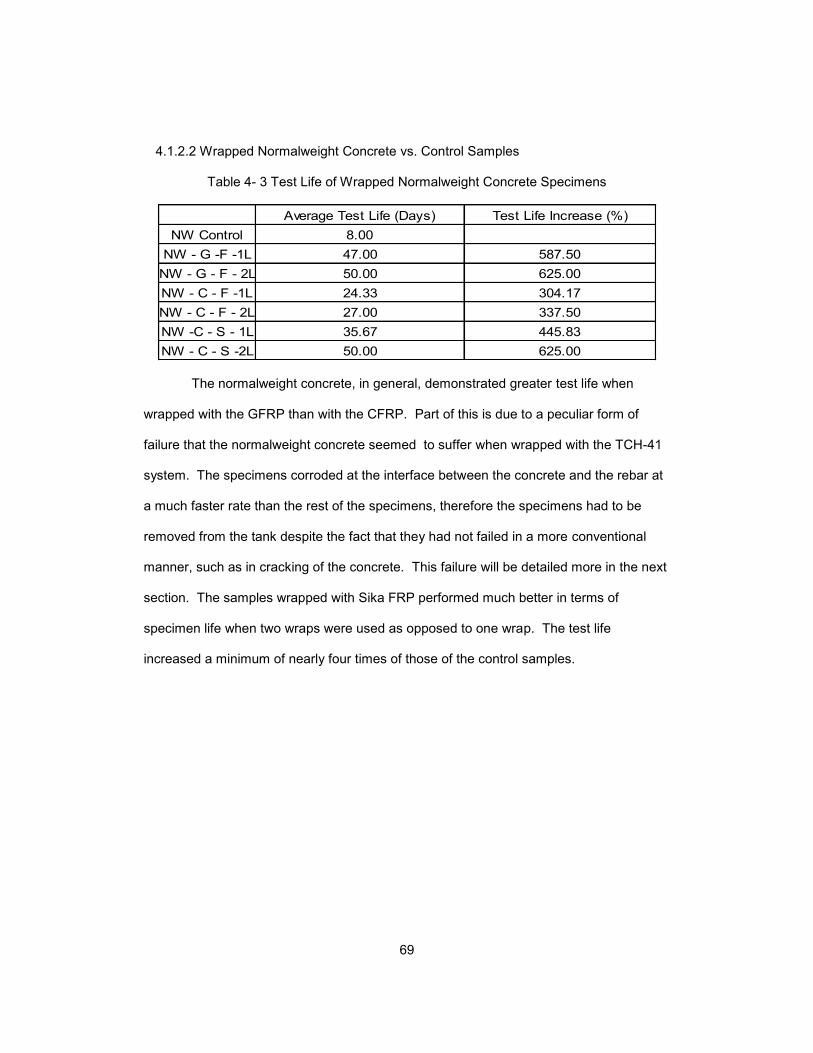
69
4.1.2.2 Wrapped Normalweight Concrete vs. Control Samples
Table 4- 3 Test Life of Wrapped Normalweight Concrete Specimens
Average Test Life (Days) Test Life Increase (%)
NW Control 8.00
NW - G -F -1L 47.00 587.50
NW - G - F - 2L 50.00 625.00
NW - C - F -1L 24.33 304.17
NW - C - F - 2L 27.00 337.50
NW -C - S - 1L 35.67 445.83
NW - C - S -2L 50.00 625.00
The normalweight concrete, in general, demonstrated greater test life when
wrapped with the GFRP than with the CFRP. Part of this is due to a peculiar form of
failure that the normalweight concrete seemed to suffer when wrapped with the TCH-41
system. The specimens corroded at the interface between the concrete and the rebar at
a much faster rate than the rest of the specimens, therefore the specimens had to be
removed from the tank despite the fact that they had not failed in a more conventional
manner, such as in cracking of the concrete. This failure will be detailed more in the next
section. The samples wrapped with Sika FRP performed much better in terms of
specimen life when two wraps were used as opposed to one wrap. The test life
increased a minimum of nearly four times of those of the control samples.
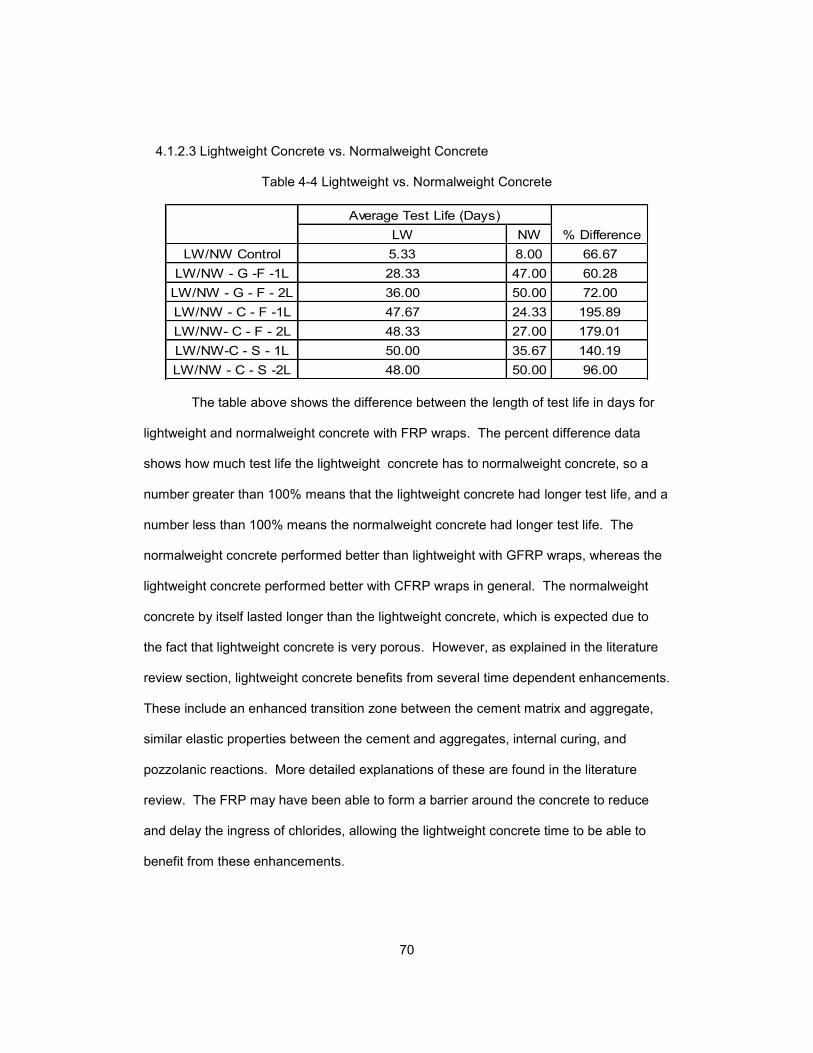
70
4.1.2.3 Lightweight Concrete vs. Normalweight Concrete
Table 4-4 Lightweight vs. Normalweight Concrete
LW NW
LW/NW Control 5.33 8.00 66.67
LW/NW - G -F -1L 28.33 47.00 60.28
LW/NW - G - F - 2L 36.00 50.00 72.00
LW/NW - C - F -1L 47.67 24.33 195.89
LW/NW- C - F - 2L 48.33 27.00 179.01
LW/NW-C - S - 1L 50.00 35.67 140.19
LW/NW - C - S -2L 48.00 50.00 96.00
Average Test Life (Days)
% Difference
The table above shows the difference between the length of test life in days for
lightweight and normalweight concrete with FRP wraps. The percent difference data
shows how much test life the lightweight concrete has to normalweight concrete, so a
number greater than 100% means that the lightweight concrete had longer test life, and a
number less than 100% means the normalweight concrete had longer test life. The
normalweight concrete performed better than lightweight with GFRP wraps, whereas the
lightweight concrete performed better with CFRP wraps in general. The normalweight
concrete by itself lasted longer than the lightweight concrete, which is expected due to
the fact that lightweight concrete is very porous. However, as explained in the literature
review section, lightweight concrete benefits from several time dependent enhancements.
These include an enhanced transition zone between the cement matrix and aggregate,
similar elastic properties between the cement and aggregates, internal curing, and
pozzolanic reactions. More detailed explanations of these are found in the literature
review. The FRP may have been able to form a barrier around the concrete to reduce
and delay the ingress of chlorides, allowing the lightweight concrete time to be able to
benefit from these enhancements.
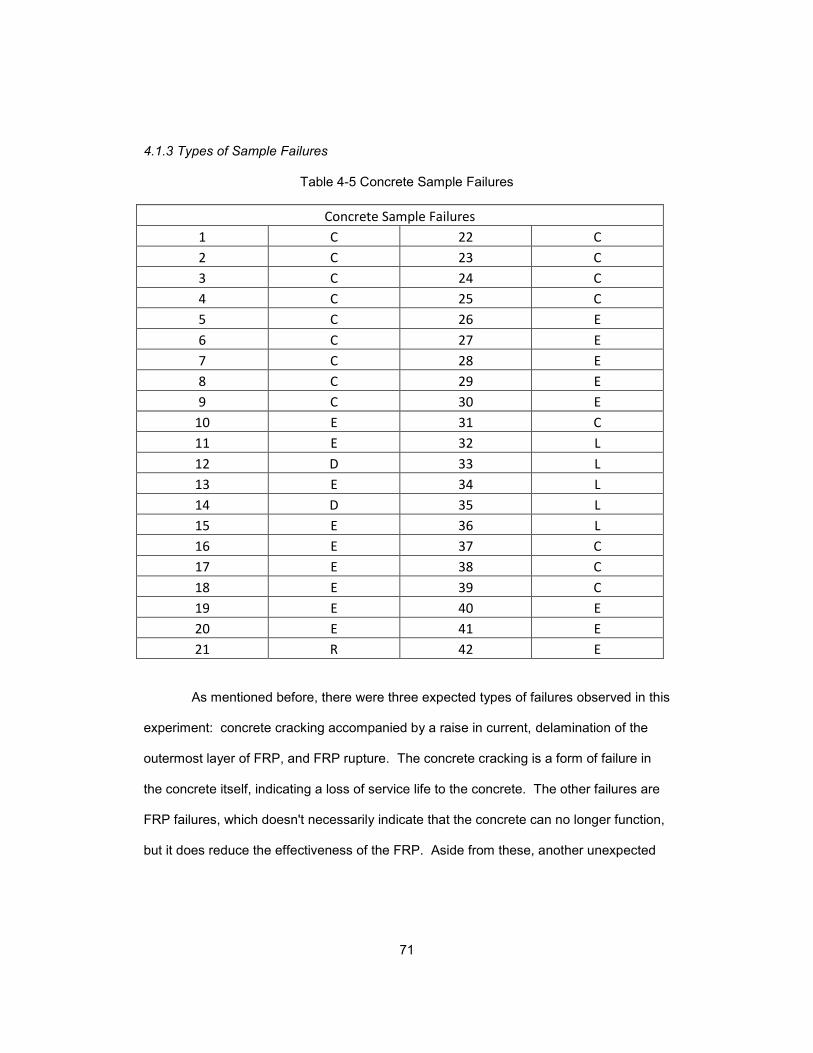
71
4.1.3 Types of Sample Failures
Table 4-5 Concrete Sample Failures
Concrete Sample Failures
1 C 22 C
2 C 23 C
3 C 24 C
4 C 25 C
5 C 26 E
6 C 27 E
7 C 28 E
8 C 29 E
9 C 30 E
10 E 31 C
11 E 32 L
12 D 33 L
13 E 34 L
14 D 35 L
15 E 36 L
16 E 37 C
17 E 38 C
18 E 39 C
19 E 40 E
20 E 41 E
21 R 42 E
As mentioned before, there were three expected types of failures observed in this
experiment: concrete cracking accompanied by a raise in current, delamination of the
outermost layer of FRP, and FRP rupture. The concrete cracking is a form of failure in
the concrete itself, indicating a loss of service life to the concrete. The other failures are
FRP failures, which doesn't necessarily indicate that the concrete can no longer function,
but it does reduce the effectiveness of the FRP. Aside from these, another unexpected
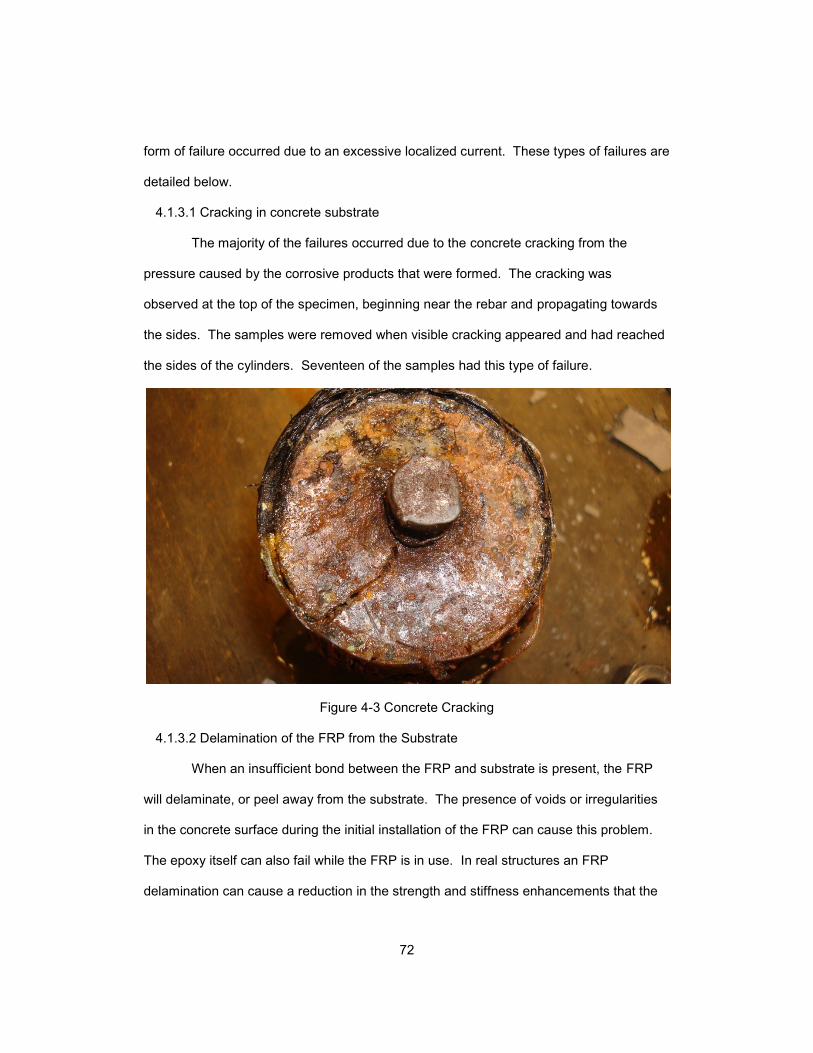
72
form of failure occurred due to an excessive localized current. These types of failures are
detailed below.
4.1.3.1 Cracking in concrete substrate
The majority of the failures occurred due to the concrete cracking from the
pressure caused by the corrosive products that were formed. The cracking was
observed at the top of the specimen, beginning near the rebar and propagating towards
the sides. The samples were removed when visible cracking appeared and had reached
the sides of the cylinders. Seventeen of the samples had this type of failure.
Figure 4-3 Concrete Cracking
4.1.3.2 Delamination of the FRP from the Substrate
When an insufficient bond between the FRP and substrate is present, the FRP
will delaminate, or peel away from the substrate. The presence of voids or irregularities
in the concrete surface during the initial installation of the FRP can cause this problem.
The epoxy itself can also fail while the FRP is in use. In real structures an FRP
delamination can cause a reduction in the strength and stiffness enhancements that the
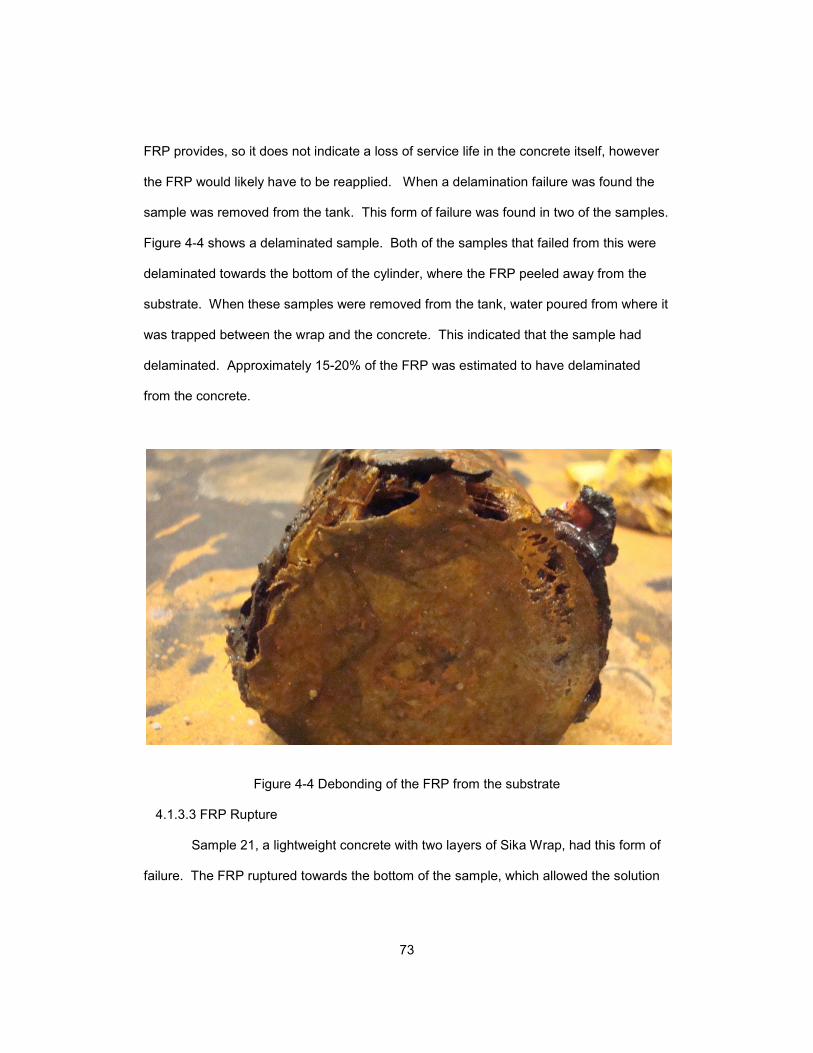
73
FRP provides, so it does not indicate a loss of service life in the concrete itself, however
the FRP would likely have to be reapplied. When a delamination failure was found the
sample was removed from the tank. This form of failure was found in two of the samples.
Figure 4-4 shows a delaminated sample. Both of the samples that failed from this were
delaminated towards the bottom of the cylinder, where the FRP peeled away from the
substrate. When these samples were removed from the tank, water poured from where it
was trapped between the wrap and the concrete. This indicated that the sample had
delaminated. Approximately 15-20% of the FRP was estimated to have delaminated
from the concrete.
Figure 4-4 Debonding of the FRP from the substrate
4.1.3.3 FRP Rupture
Sample 21, a lightweight concrete with two layers of Sika Wrap, had this form of
failure. The FRP ruptured towards the bottom of the sample, which allowed the solution
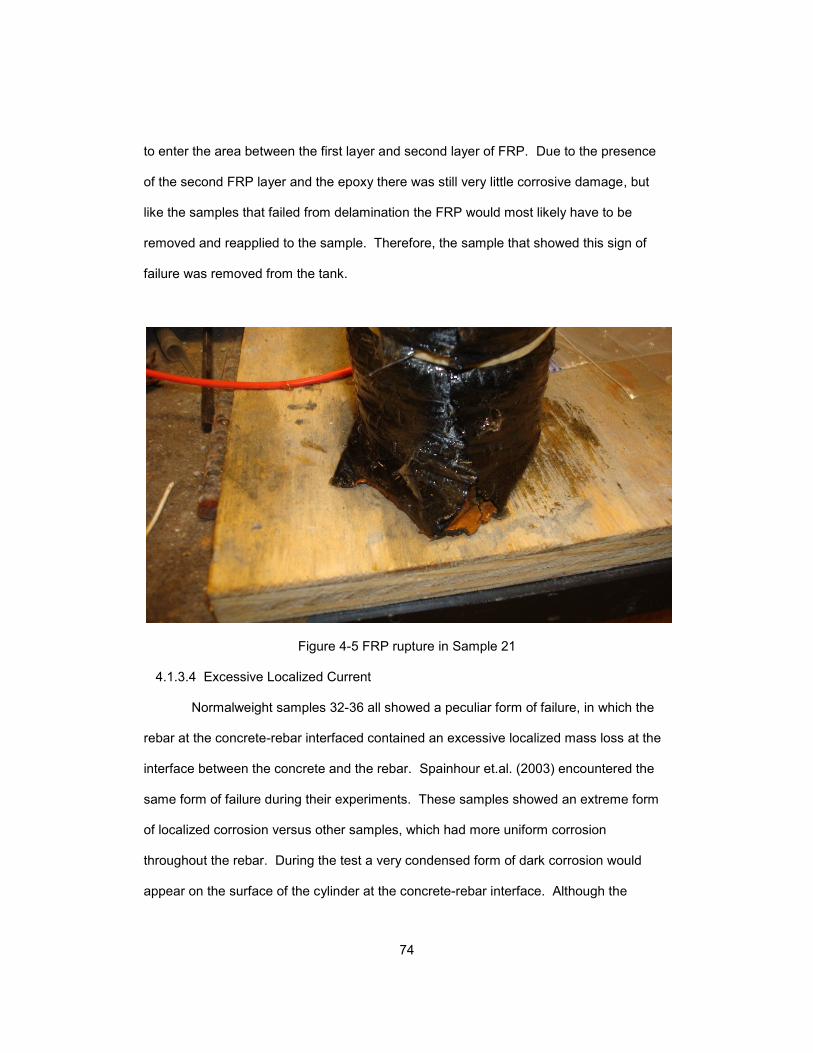
74
to enter the area between the first layer and second layer of FRP. Due to the presence
of the second FRP layer and the epoxy there was still very little corrosive damage, but
like the samples that failed from delamination the FRP would most likely have to be
removed and reapplied to the sample. Therefore, the sample that showed this sign of
failure was removed from the tank.
Figure 4-5 FRP rupture in Sample 21
4.1.3.4 Excessive Localized Current
Normalweight samples 32-36 all showed a peculiar form of failure, in which the
rebar at the concrete-rebar interfaced contained an excessive localized mass loss at the
interface between the concrete and the rebar. Spainhour et.al. (2003) encountered the
same form of failure during their experiments. These samples showed an extreme form
of localized corrosion versus other samples, which had more uniform corrosion
throughout the rebar. During the test a very condensed form of dark corrosion would
appear on the surface of the cylinder at the concrete-rebar interface. Although the
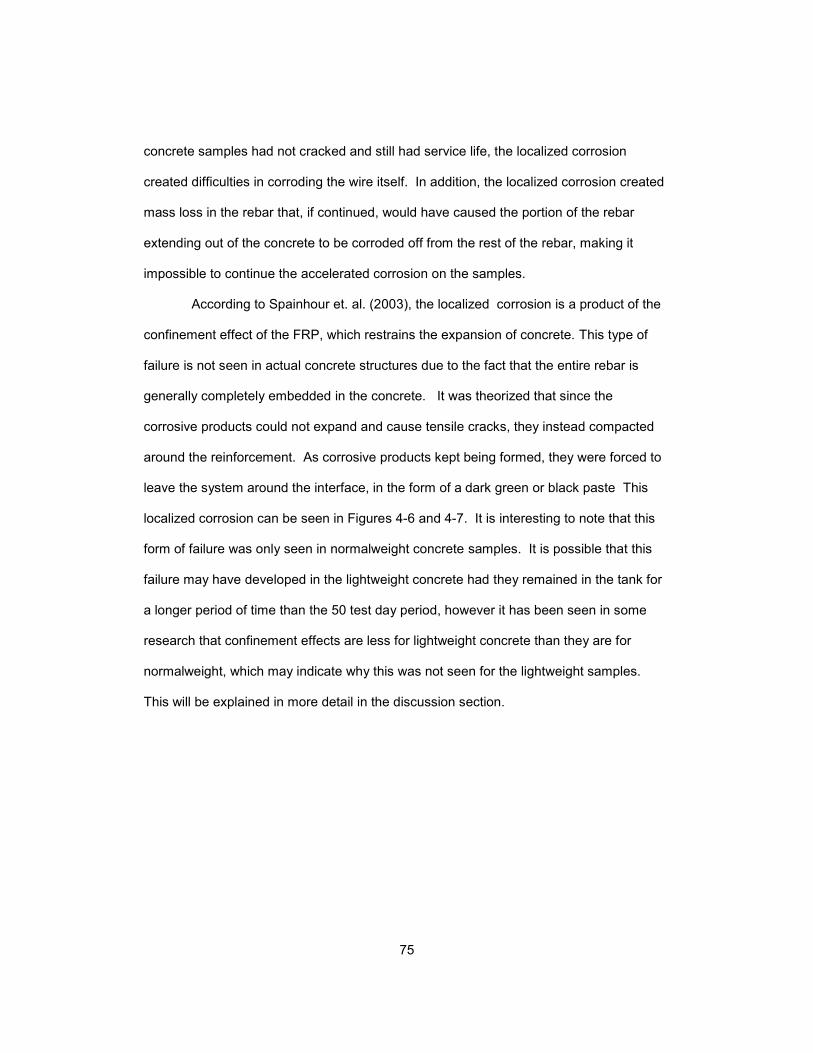
75
concrete samples had not cracked and still had service life, the localized corrosion
created difficulties in corroding the wire itself. In addition, the localized corrosion created
mass loss in the rebar that, if continued, would have caused the portion of the rebar
extending out of the concrete to be corroded off from the rest of the rebar, making it
impossible to continue the accelerated corrosion on the samples.
According to Spainhour et. al. (2003), the localized corrosion is a product of the
confinement effect of the FRP, which restrains the expansion of concrete. This type of
failure is not seen in actual concrete structures due to the fact that the entire rebar is
generally completely embedded in the concrete. It was theorized that since the
corrosive products could not expand and cause tensile cracks, they instead compacted
around the reinforcement. As corrosive products kept being formed, they were forced to
leave the system around the interface, in the form of a dark green or black paste This
localized corrosion can be seen in Figures 4-6 and 4-7. It is interesting to note that this
form of failure was only seen in normalweight concrete samples. It is possible that this
failure may have developed in the lightweight concrete had they remained in the tank for
a longer period of time than the 50 test day period, however it has been seen in some
research that confinement effects are less for lightweight concrete than they are for
normalweight, which may indicate why this was not seen for the lightweight samples.
This will be explained in more detail in the discussion section.
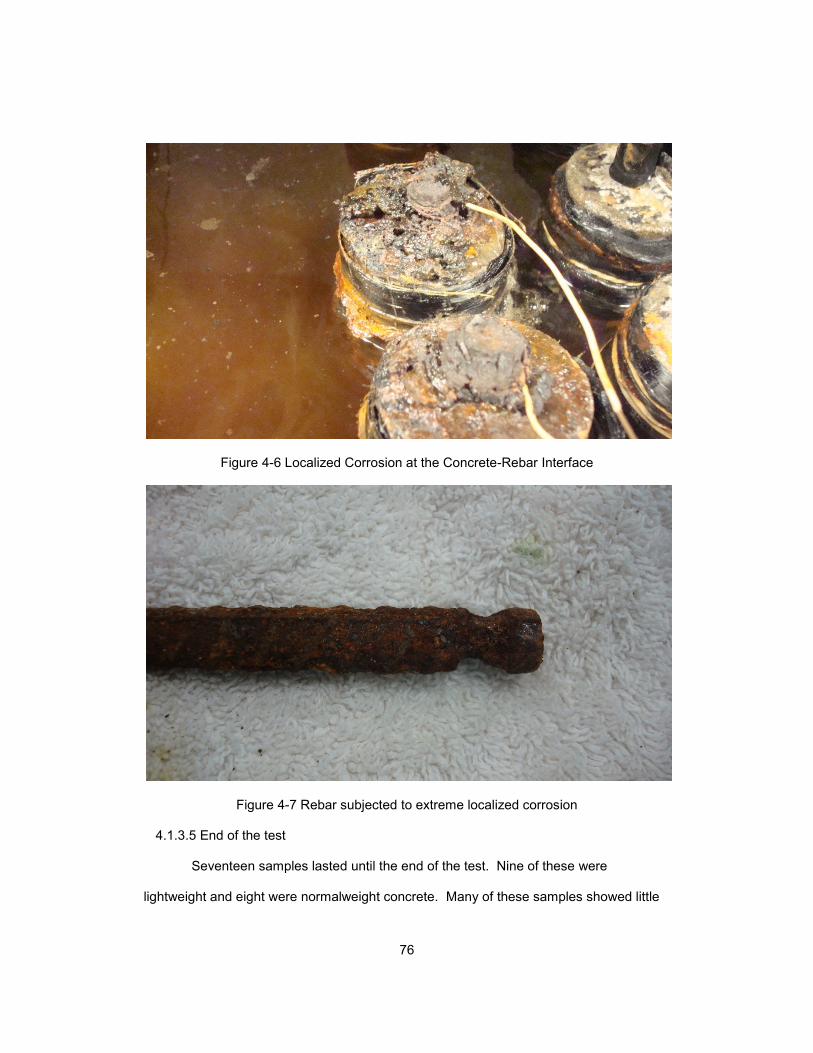
76
Figure 4-6 Localized Corrosion at the Concrete-Rebar Interface
Figure 4-7 Rebar subjected to extreme localized corrosion
4.1.3.5 End of the test
Seventeen samples lasted until the end of the test. Nine of these were
lightweight and eight were normalweight concrete. Many of these samples showed little
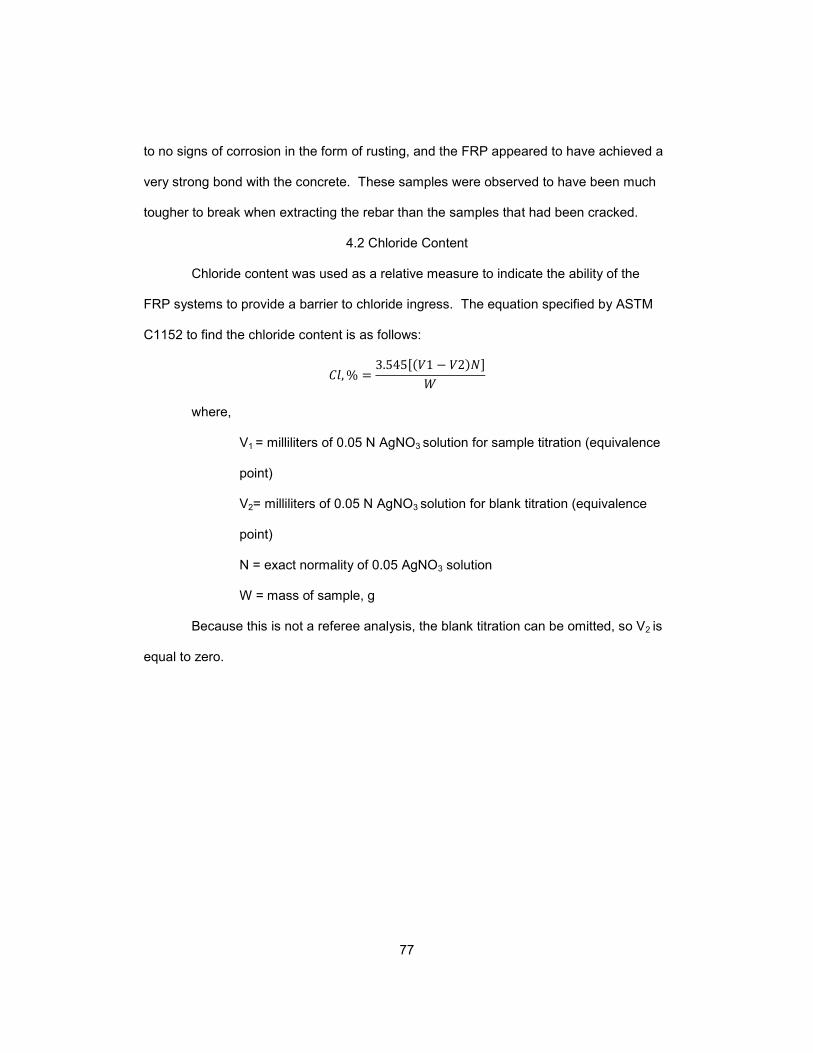
77
to no signs of corrosion in the form of rusting, and the FRP appeared to have achieved a
very strong bond with the concrete. These samples were observed to have been much
tougher to break when extracting the rebar than the samples that had been cracked.
4.2 Chloride Content
Chloride content was used as a relative measure to indicate the ability of the
FRP systems to provide a barrier to chloride ingress. The equation specified by ASTM
C1152 to find the chloride content is as follows:
where,
V1 = milliliters of 0.05 N AgNO3 solution for sample titration (equivalence
point)
V2= milliliters of 0.05 N AgNO3 solution for blank titration (equivalence
point)
N = exact normality of 0.05 AgNO3 solution
W = mass of sample, g
Because this is not a referee analysis, the blank titration can be omitted, so V2 is
equal to zero.
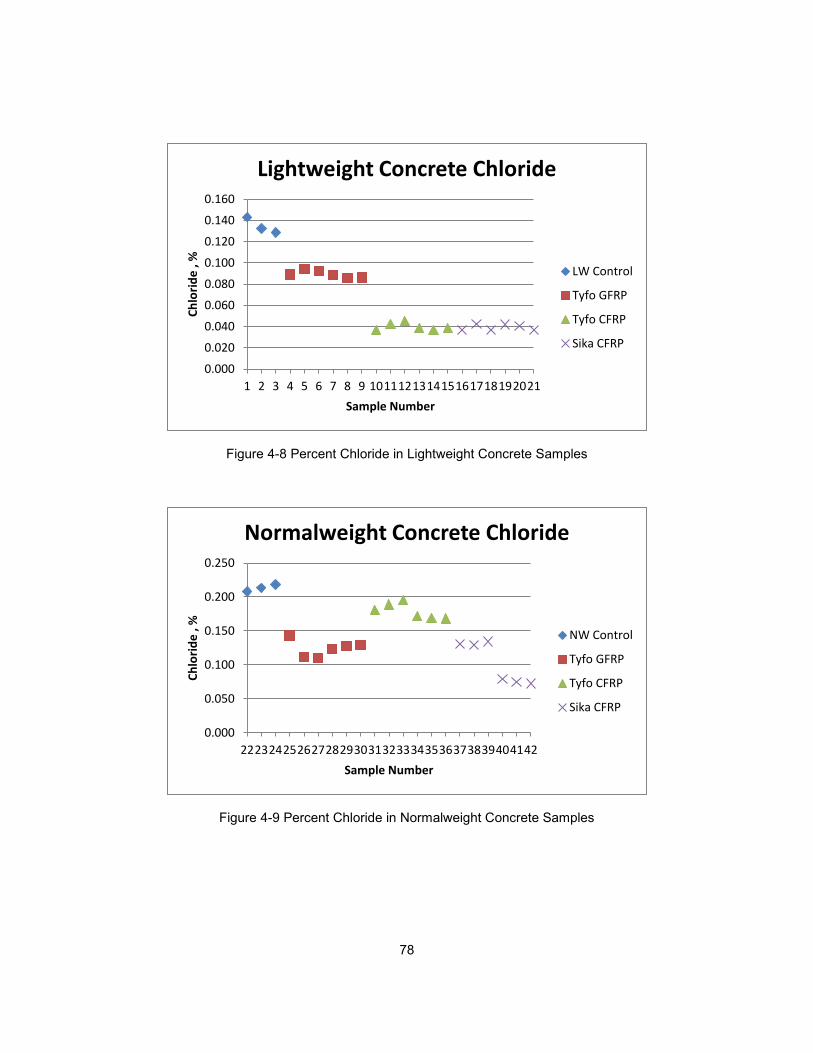
78
Figure 4-8 Percent Chloride in Lightweight Concrete Samples
Figure 4-9 Percent Chloride in Normalweight Concrete Samples
0.000
0.020
0.040
0.060
0.080
0.100
0.120
0.140
0.160
1 2 3 4 5 6 7 8 9 10 11 12 13 14 15 16 17 18 19 20 21
Ch
lori
de
, %
Sample Number
Lightweight Concrete Chloride
LW Control
Tyfo GFRP
Tyfo CFRP
Sika CFRP
0.000
0.050
0.100
0.150
0.200
0.250
22 23 24 25 26 27 28 29 30 31 32 33 34 35 36 37 38 39 40 41 42
Ch
lori
de
, %
Sample Number
Normalweight Concrete Chloride
NW Control
Tyfo GFRP
Tyfo CFRP
Sika CFRP
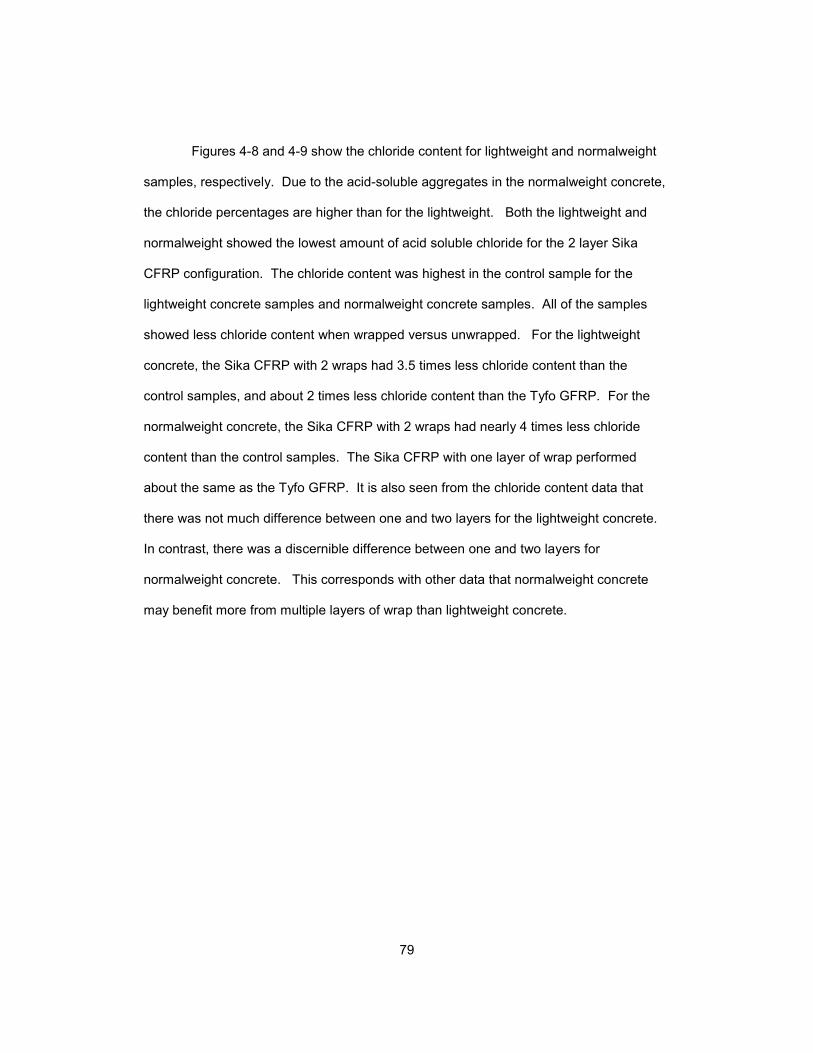
79
Figures 4-8 and 4-9 show the chloride content for lightweight and normalweight
samples, respectively. Due to the acid-soluble aggregates in the normalweight concrete,
the chloride percentages are higher than for the lightweight. Both the lightweight and
normalweight showed the lowest amount of acid soluble chloride for the 2 layer Sika
CFRP configuration. The chloride content was highest in the control sample for the
lightweight concrete samples and normalweight concrete samples. All of the samples
showed less chloride content when wrapped versus unwrapped. For the lightweight
concrete, the Sika CFRP with 2 wraps had 3.5 times less chloride content than the
control samples, and about 2 times less chloride content than the Tyfo GFRP. For the
normalweight concrete, the Sika CFRP with 2 wraps had nearly 4 times less chloride
content than the control samples. The Sika CFRP with one layer of wrap performed
about the same as the Tyfo GFRP. It is also seen from the chloride content data that
there was not much difference between one and two layers for the lightweight concrete.
In contrast, there was a discernible difference between one and two layers for
normalweight concrete. This corresponds with other data that normalweight concrete
may benefit more from multiple layers of wrap than lightweight concrete.
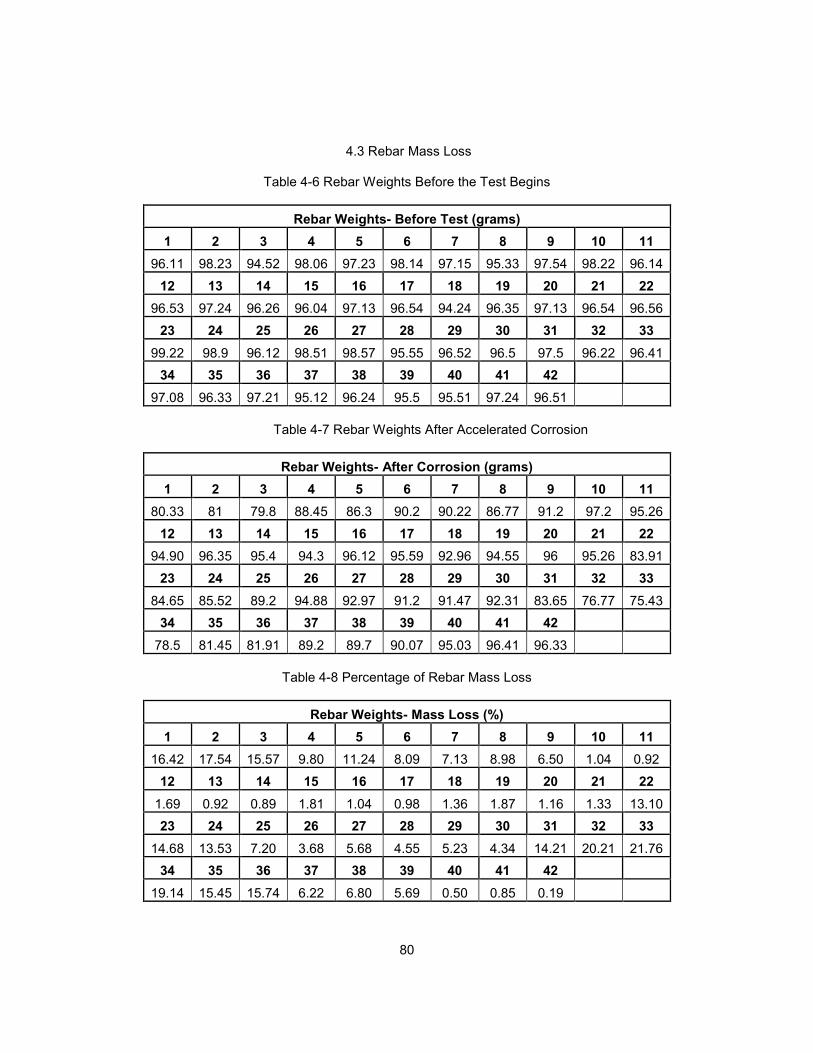
80
4.3 Rebar Mass Loss
Table 4-6 Rebar Weights Before the Test Begins
Rebar Weights- Before Test (grams)
1 2 3 4 5 6 7 8 9 10 11
96.11 98.23 94.52 98.06 97.23 98.14 97.15 95.33 97.54 98.22 96.14
12 13 14 15 16 17 18 19 20 21 22
96.53 97.24 96.26 96.04 97.13 96.54 94.24 96.35 97.13 96.54 96.56
23 24 25 26 27 28 29 30 31 32 33
99.22 98.9 96.12 98.51 98.57 95.55 96.52 96.5 97.5 96.22 96.41
34 35 36 37 38 39 40 41 42
97.08 96.33 97.21 95.12 96.24 95.5 95.51 97.24 96.51
Table 4-7 Rebar Weights After Accelerated Corrosion
Rebar Weights- After Corrosion (grams)
1 2 3 4 5 6 7 8 9 10 11
80.33 81 79.8 88.45 86.3 90.2 90.22 86.77 91.2 97.2 95.26
12 13 14 15 16 17 18 19 20 21 22
94.90 96.35 95.4 94.3 96.12 95.59 92.96 94.55 96 95.26 83.91
23 24 25 26 27 28 29 30 31 32 33
84.65 85.52 89.2 94.88 92.97 91.2 91.47 92.31 83.65 76.77 75.43
34 35 36 37 38 39 40 41 42
78.5 81.45 81.91 89.2 89.7 90.07 95.03 96.41 96.33
Table 4-8 Percentage of Rebar Mass Loss
Rebar Weights- Mass Loss (%)
1 2 3 4 5 6 7 8 9 10 11
16.42 17.54 15.57 9.80 11.24 8.09 7.13 8.98 6.50 1.04 0.92
12 13 14 15 16 17 18 19 20 21 22
1.69 0.92 0.89 1.81 1.04 0.98 1.36 1.87 1.16 1.33 13.10
23 24 25 26 27 28 29 30 31 32 33
14.68 13.53 7.20 3.68 5.68 4.55 5.23 4.34 14.21 20.21 21.76
34 35 36 37 38 39 40 41 42
19.14 15.45 15.74 6.22 6.80 5.69 0.50 0.85 0.19
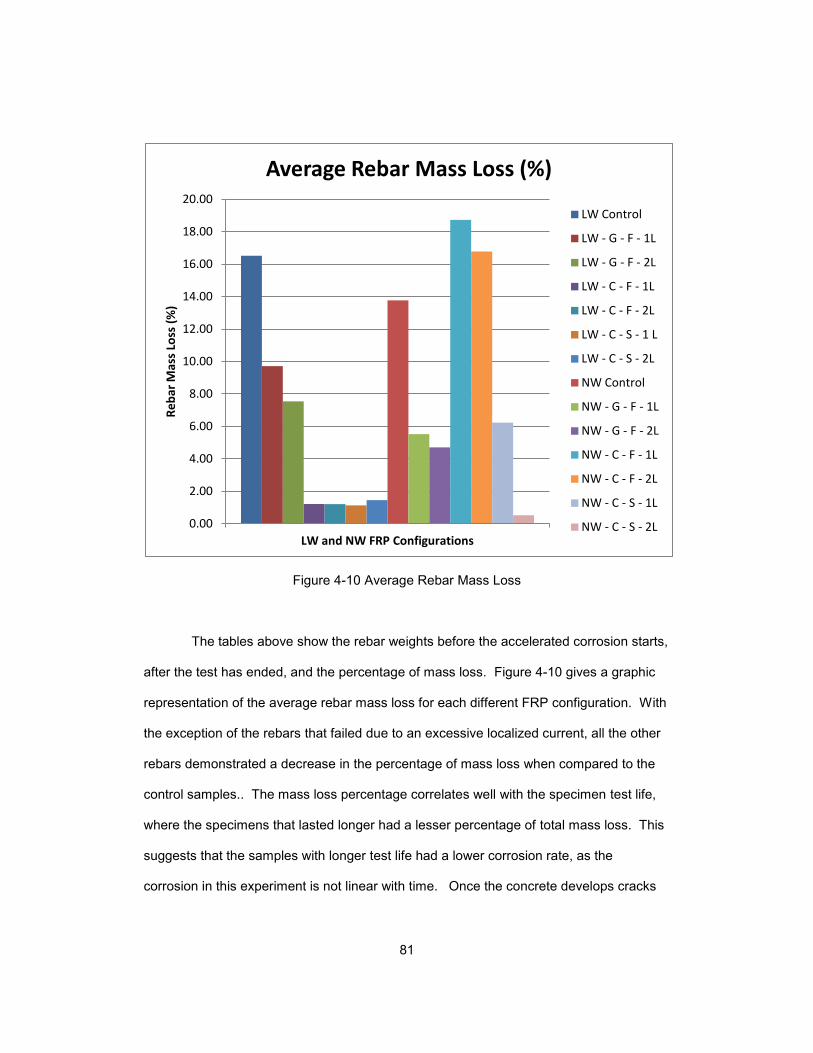
81
Figure 4-10 Average Rebar Mass Loss
The tables above show the rebar weights before the accelerated corrosion starts,
after the test has ended, and the percentage of mass loss. Figure 4-10 gives a graphic
representation of the average rebar mass loss for each different FRP configuration. With
the exception of the rebars that failed due to an excessive localized current, all the other
rebars demonstrated a decrease in the percentage of mass loss when compared to the
control samples.. The mass loss percentage correlates well with the specimen test life,
where the specimens that lasted longer had a lesser percentage of total mass loss. This
suggests that the samples with longer test life had a lower corrosion rate, as the
corrosion in this experiment is not linear with time. Once the concrete develops cracks
0.00
2.00
4.00
6.00
8.00
10.00
12.00
14.00
16.00
18.00
20.00
LW and NW FRP Configurations
Re
bar
Mas
s Lo
ss (
%)
Average Rebar Mass Loss (%)
LW Control
LW - G - F - 1L
LW - G - F - 2L
LW - C - F - 1L
LW - C - F - 2L
LW - C - S - 1 L
LW - C - S - 2L
NW Control
NW - G - F - 1L
NW - G - F - 2L
NW - C - F - 1L
NW - C - F - 2L
NW - C - S - 1L
NW - C - S - 2L
82
the chlorides flow to the rebar and create a current flow that exacerbates the corrosion.
The FRP helps provide a barrier to reduce the number of these chlorides that can reach
the rebar, whereas the control samples have no barrier to the ingress of chlorides, so
once they crack the corrosion in the samples escalate rapidly.
As mentioned previously, samples 32-36 had an excessive localized current
which corroded the rebar at the concrete interface. This localized corrosion created
extensive mass loss in one location, due to the leached corrosive product that was forced
through the interface. This mass loss is greater than that of the control samples,
indicating that without the confinement it is likely these samples would have cracked,
rather than the corrosion leaching at the concrete-rebar interface. This shows the effect
confinement can have in assisting in corrosion protection and increasing concrete life, so
although the epoxy type is the greatest factor in resisting corrosion, the wrap can become
a factor once corrosion has initiated and corrosion products are beginning to form.
The effects of using one or two wraps appeared to have more pronounced
effects in the normalweight concrete than it did for the lightweight concrete, which was
also seen in the chloride content data. The mass loss for the normalweight concrete with
one layer of Sika CFRP was much higher than it was for two layers. The lightweight
concrete, however, appeared to be more consistent whether one or two layers were
used. This may indicate that the effects of the confinement for using multiple layers are
more pronounced for normalweight concrete than they are for lightweight concrete.
Samples 2, 7, 8, and 34 had different concrete clear covers than the standard
1/2", as mentioned before. Sample 2, with a 1/4" cover, had a slightly greater mass loss
at 17.54% than samples 1 and 3 at 16.42% and 15.57%, respectively. Sample 7 with a
3/4" cover had a greater mass loss than sample 9, which had 1/2" cover, but less than
sample 8, which had 1/4" cover. Sample 34 had a 3/4" cover, yet had greater mass loss
83
than samples 35 and 36, which had 1/2" cover. Sample 34 failed by localized corrosion
current, which is not a form of failure found in the field, so it is not appropriate to draw
conclusions of cover based on that sample. The other samples indicate that concrete
clear cover had some impact on the mass loss of samples, yet the values were still close
to other similar samples. The samples with 1/4" cover appeared to experience slightly
more mass loss than the 1/2" samples, while there did not appear to be a noticeable
difference between the bars with 1/2" cover and 3/4" cover, although this was a small
sample size.
4.4 Current Measurements
The current measurements were taken for the worst case for each FRP
configuration. These measurements are correlated with the actual mass loss and the
theoretical mass loss using Faraday's Law. The equation for Faraday's Law is
(Maaddawy and Soudki, 2003):
where M = mass of metal dissolved or converted to oxide, grams
I = current, Amps
t = time, seconds
Aw = atomic weight (56 for iron)
n = valency (2)
F = Faraday's constant (96,500 coulombs/equivalent mass)
According to Maaddawy and Soudki, Faraday's Law should be able to accurately
predict metal loss up to approximately 7.5%, then as the loss of steel gets higher ,
Faraday's Law tends to overestimate the amount of metal loss.
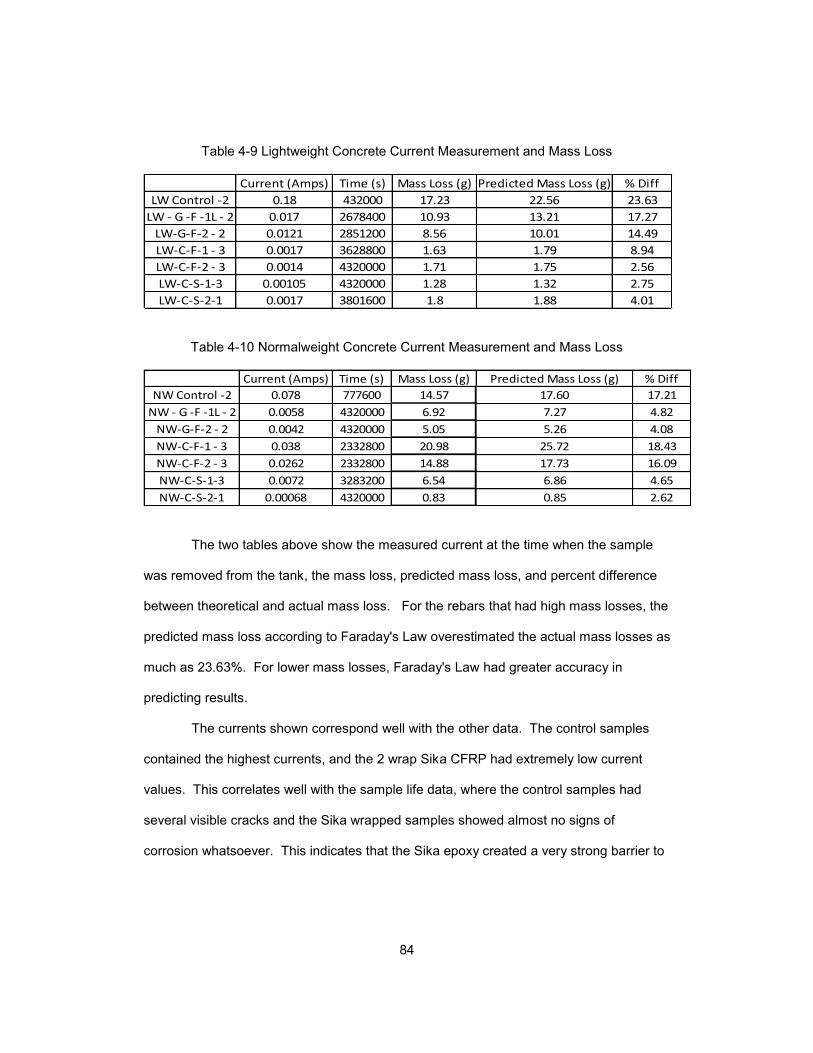
84
Table 4-9 Lightweight Concrete Current Measurement and Mass Loss
Current (Amps) Time (s) Mass Loss (g) % Diff
LW Control -2 0.18 432000 17.23 23.63
LW - G -F -1L - 2 0.017 2678400 10.93 17.27
LW-G-F-2 - 2 0.0121 2851200 8.56 14.49
LW-C-F-1 - 3 0.0017 3628800 1.63 8.94
LW-C-F-2 - 3 0.0014 4320000 1.71 2.56
LW-C-S-1-3 0.00105 4320000 1.28 2.75
LW-C-S-2-1 0.0017 3801600 1.8 4.01
1.32
1.88
Predicted Mass Loss (g)
22.56
13.21
10.01
1.79
1.75
Table 4-10 Normalweight Concrete Current Measurement and Mass Loss
Current (Amps) Time (s) Mass Loss (g) % Diff
NW Control -2 0.078 777600 14.57 17.21
NW - G -F -1L - 2 0.0058 4320000 6.92 4.82
NW-G-F-2 - 2 0.0042 4320000 5.05 4.08
NW-C-F-1 - 3 0.038 2332800 20.98 18.43
NW-C-F-2 - 3 0.0262 2332800 14.88 16.09
NW-C-S-1-3 0.0072 3283200 6.54 4.65
NW-C-S-2-1 0.00068 4320000 0.83 2.62
6.86
0.85
Predicted Mass Loss (g)
17.60
7.27
5.26
25.72
17.73
The two tables above show the measured current at the time when the sample
was removed from the tank, the mass loss, predicted mass loss, and percent difference
between theoretical and actual mass loss. For the rebars that had high mass losses, the
predicted mass loss according to Faraday's Law overestimated the actual mass losses as
much as 23.63%. For lower mass losses, Faraday's Law had greater accuracy in
predicting results.
The currents shown correspond well with the other data. The control samples
contained the highest currents, and the 2 wrap Sika CFRP had extremely low current
values. This correlates well with the sample life data, where the control samples had
several visible cracks and the Sika wrapped samples showed almost no signs of
corrosion whatsoever. This indicates that the Sika epoxy created a very strong barrier to
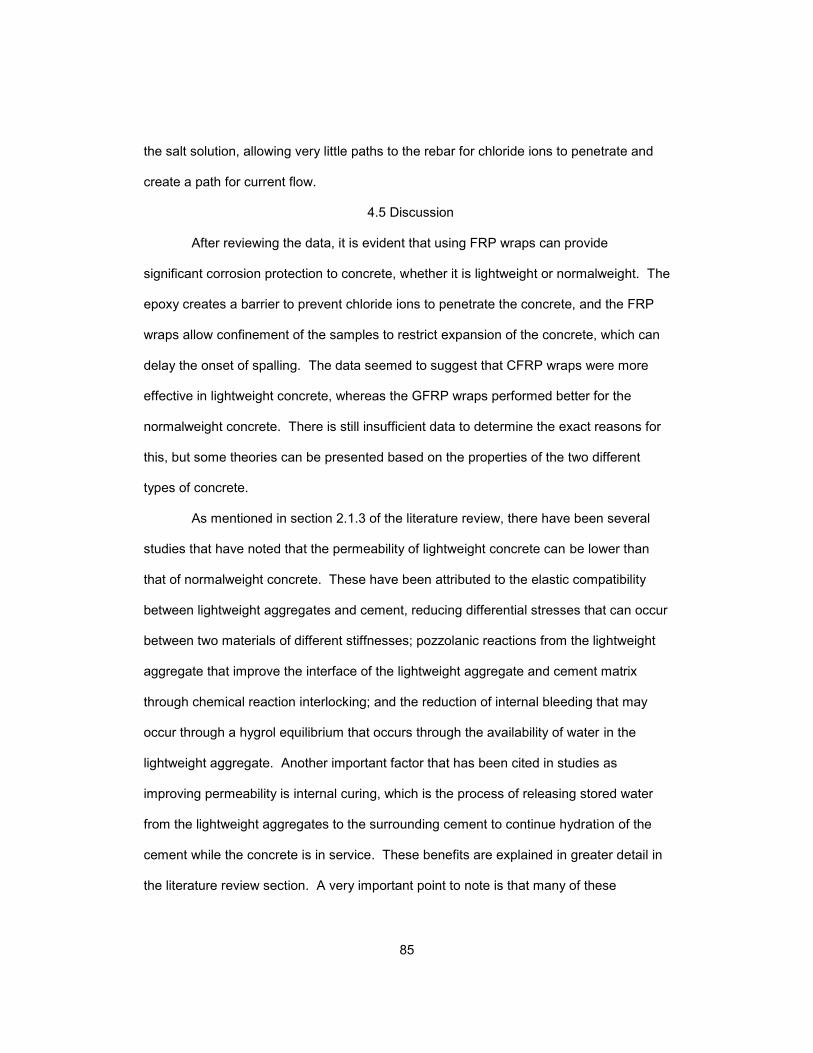
85
the salt solution, allowing very little paths to the rebar for chloride ions to penetrate and
create a path for current flow.
4.5 Discussion
After reviewing the data, it is evident that using FRP wraps can provide
significant corrosion protection to concrete, whether it is lightweight or normalweight. The
epoxy creates a barrier to prevent chloride ions to penetrate the concrete, and the FRP
wraps allow confinement of the samples to restrict expansion of the concrete, which can
delay the onset of spalling. The data seemed to suggest that CFRP wraps were more
effective in lightweight concrete, whereas the GFRP wraps performed better for the
normalweight concrete. There is still insufficient data to determine the exact reasons for
this, but some theories can be presented based on the properties of the two different
types of concrete.
As mentioned in section 2.1.3 of the literature review, there have been several
studies that have noted that the permeability of lightweight concrete can be lower than
that of normalweight concrete. These have been attributed to the elastic compatibility
between lightweight aggregates and cement, reducing differential stresses that can occur
between two materials of different stiffnesses; pozzolanic reactions from the lightweight
aggregate that improve the interface of the lightweight aggregate and cement matrix
through chemical reaction interlocking; and the reduction of internal bleeding that may
occur through a hygrol equilibrium that occurs through the availability of water in the
lightweight aggregate. Another important factor that has been cited in studies as
improving permeability is internal curing, which is the process of releasing stored water
from the lightweight aggregates to the surrounding cement to continue hydration of the
cement while the concrete is in service. These benefits are explained in greater detail in
the literature review section. A very important point to note is that many of these
86
enhanced properties are time dependent. For instance, a long term extension in curing
due to internal curing can develop a reduction in permeability (ACI Committee 213,
2003). The results in this research indicated that the control lightweight concrete failed
before the normalweight concrete, which means it can be deduced that the lightweight
control concrete was more permeable than the normalweight control concrete at an early
age. The concrete wrapped with FRP, however, may have been effective in providing an
early barrier to chloride ingress, allowing the lightweight concrete an opportunity to
benefit from the time-dependent effects noted above. This may be a reason why the
lightweight concrete tended to perform better with the CFRP than the normalweight
concrete.
As noted before, the GFRP did not perform as well as the CFRP for the
lightweight concrete. One possible reason may have been due to deterioration in the
GFRP sheets from the salt water solution. Gharachorlou and Ramezanianpour (2010)
noted differences in the performance of GFRP and CFRP wrapped beams when exposed
to an accelerated corrosion test, where the CFRP beams performed better in terms of .
They noted this effect was likely due to the degradation of glass fibers that were
continually immersed, as glass fibers can be damaged from continuous immersion in
moisture, whereas carbon fibers are not susceptible to this. Salt solutions are known to
cause attack on glass composites by leaching alkali from the glass fiber (GangaRao et.
al., 2006). This may have reduced the effectiveness of the GFRP wrapped lightweight
concrete cylinders in this experiment and caused them to fail earlier than the CFRP
wrapped specimens. However, this was not the case for the normalweight concrete,
which tended to perform better with GFRP wrapping versus CFRP wrapping. Thus, there
may have been some incompatibility with the specific GFRP used and the specific
lightweight concrete used. As noted before, the GFRP fibers and epoxy were not new
87
materials, so they may have lost some properties that could help provide greater
corrosion protection to the lightweight concrete. More research utilizing different
manufacturer materials is necessary to verify the compatibility between GFRP and
lightweight concrete as it pertains to corrosion.
Another aspect that is unclear is the absorption of epoxy into the lightweight
aggregate particles themselves. It is likely that some epoxy was absorbed into the
aggregate, however whether this absorption was limited to mostly surface aggregates or
aggregates throughout the concrete is not readily apparent. How the absorption affects
the bond between the concrete substrate and the FRP is a point for future research. The
absorption of the epoxy into the aggregates could potentially lead to less epoxy being
available for bond between the FRP and concrete substrate, leading to a reduction in
bond. This may explain why some debonding failures were found in some of the
lightweight concrete samples in the experiment. Some epoxy manufactures have
recommended the application of more than one coat of epoxy for porous substrates such
as lightweight concrete (ChemCo Systems). The bond for lightweight concrete with FRP
should be examined in greater detail.
The effects of using multiple layers of FRP for the lightweight concrete did not
appear to be as pronounced for the lightweight concrete as they were for the
normalweight concrete samples, in terms of bar mass loss or chloride ingress. The use
of multiple layers generally provides more confinement to the concrete, which assists in
resisting the cracks that occur from the corrosion products. Other research has indicated
that the effects of confinement are not as pronounced for lightweight concrete as they are
for normalweight concrete (Axson, 2008; Shah et. al., 1983; Fu et. al., 2011). It is
possible for this study that the confining effects of the use of multiple layers of FRP may
not have been realized as well as they were for the normalweight concrete. This could
88
mean that for lightweight concrete, there is a greater reduction in permeability due to the
improved aggregate cement matrix mentioned earlier, however, when corrosion is
initiated, it may take longer for the normalweight concrete to crack due to better confining
effects. It should also be mentioned that several of the lightweight concrete samples had
yet to fail for the CFRP samples. It is possible that had they been allowed to corrode until
cracking, the benefits of confinement could be more easily seen. For future research,
longer periods of corrosion time until cracking should be examined to determine if there
are differences in the time to initiation of corrosion until cracking for lightweight concrete
wrapped with CFRP.
It is important to note that the discussion here is mostly theoretical based on
observations from the experiment and available literature. Much more research is
needed to determine the validity of these points and to more accurately ascertain the
capabilities of lightweight concrete with externally bonded FRP wraps. Due to the
variable nature of lightweight aggregates and lightweight concrete, different effects may
be observed than the ones that were found in this experiment. The lack of available
literature on lightweight concrete and FRP in terms of corrosion protection means that
more research is necessary to determine the terms of the behavior of FRP and
lightweight concrete. Nevertheless, this experiment did demonstrate that FRPs can be
beneficial for both types of concrete for protection against corrosion.
89
Chapter 5
Conclusion And Recommendations
The research presented herein attempted to examine the effects of FRP in terms
of corrosion protection afforded to lightweight concrete. The following conclusions were
found from this research:
Both lightweight concrete and normalweight concrete demonstrated
increased length of test life, lower chloride content, and lower rebar mass
loss when wrapped with FRP versus unwrapped samples
Lightweight concrete wrapped with CFRP demonstrated longer test life
overall than CFRP wrapped normalweight concrete, whereas
normalweight concrete wrapped with GFRP demonstrated longer test life
than GFRP wrapped lightweight concrete. Previous research on the
permeability of lightweight concrete has indicated that lightweight
concrete benefits from several time dependent improvements that
reduce its permeability to levels equal to or lower than normalweight
concrete. These include better elastic compatibility between lightweight
aggregates and cement, improved hydration of cement from internal
curing, pozzolanic reactions from the lightweight aggregates that improve
the quality of the concrete, and reduction of internal bleeding. The FRP
wraps may have provided an early barrier to the ingress of chlorides,
allowing the lightweight concrete to realize some of these improvements
over time.
Mass loss appeared to correlate well with test life and chloride content.
Wrapped specimens had less mass loss than the control samples, with
the exception of the normalweight concrete samples wrapped with Tyfo
90
CFRP. These samples showed localized corrosion, likely occurring due
to confinement from the CFRP wraps.
It was observed that the use of multiple layers of wrap had more
apparent effects in reduction in mass loss and chloride content for
normalweight concrete than for lightweight concrete. Based on this and
the previous conclusion points, it may indicate that the lightweight
concrete had reduced permeability versus the normalweight concrete,
whereas the normalweight concrete may have benefitted more from
confinement effects.
Based on the results of this research, the following future research is
recommended:
Investigation of the absorption of epoxy in lightweight concrete. This
may include testing the bond between the concrete substrate and the
FRP to determine if the excess water in the lightweight aggregates
affects the bond.
The effects of confinement as it relates to corrosion should be further
investigated, particularly in the differences between lightweight concrete
and normalweight concrete.
Larger specimens than the ones used in this research should be
investigated. Longer periods of corrosion with conditions closer related
to the field should be used in order to more accurately gauge corrosion
effects.
Investigating lightweight specimens that have already been corroded
and repaired with FRP can be examined to gauge the effects of FRP
after post repair.
91
The concretes used in this study contained no admixtures of any kind.
Mineral admixtures such as fly ash and silica fume are often used in
construction in corrosive environments to increase strength and provide
increased durability. The combined effects of admixtures and FRP
should be looked at to provide a more accurate determination of field
conditions.
This study only used one type of lightweight aggregate, an expanded
shale from ESCSI. Other lightweight aggregates should be studied due
to their different properties, including absorption. These aggregates may
demonstrate different effect than the ones utilized in this study. FRP
materials from other manufacturers should also be tested.

92
Appendix A
Concrete Properties
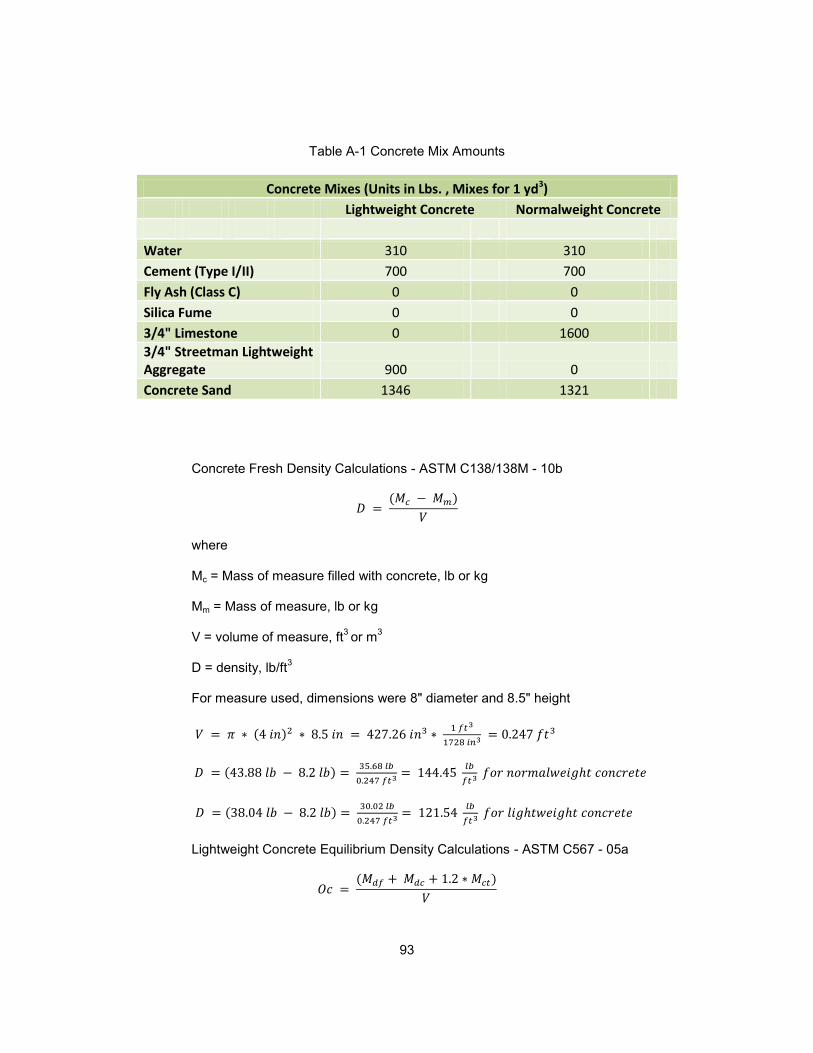
93
Table A-1 Concrete Mix Amounts
Concrete Mixes (Units in Lbs. , Mixes for 1 yd3)
Lightweight Concrete Normalweight Concrete
Water 310 310
Cement (Type I/II) 700 700
Fly Ash (Class C) 0 0
Silica Fume 0 0
3/4" Limestone 0 1600
3/4" Streetman Lightweight Aggregate 900 0
Concrete Sand 1346 1321
Concrete Fresh Density Calculations - ASTM C138/138M - 10b
where
Mc = Mass of measure filled with concrete, lb or kg
Mm = Mass of measure, lb or kg
V = volume of measure, ft3 or m
3
D = density, lb/ft3
For measure used, dimensions were 8" diameter and 8.5" height
Lightweight Concrete Equilibrium Density Calculations - ASTM C567 - 05a
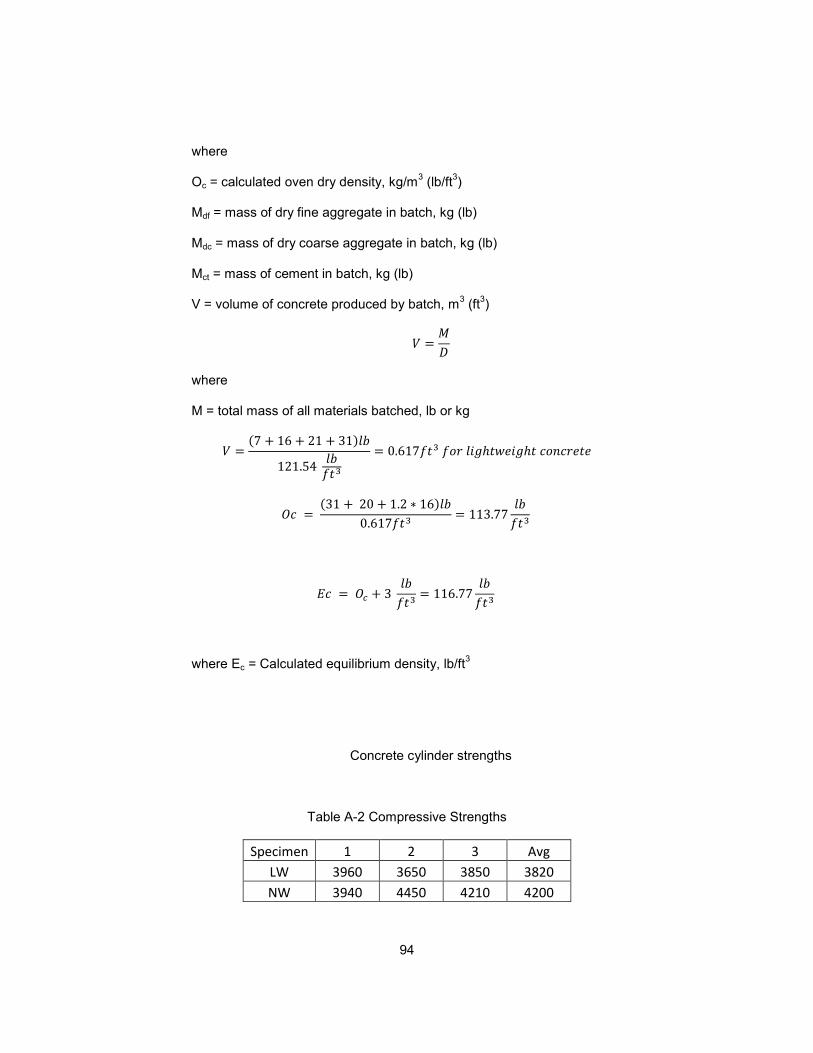
94
where
Oc = calculated oven dry density, kg/m3 (lb/ft
3)
Mdf = mass of dry fine aggregate in batch, kg (lb)
Mdc = mass of dry coarse aggregate in batch, kg (lb)
Mct = mass of cement in batch, kg (lb)
V = volume of concrete produced by batch, m3 (ft
3)
where
M = total mass of all materials batched, lb or kg
where Ec = Calculated equilibrium density, lb/ft3
Concrete cylinder strengths
Table A-2 Compressive Strengths
Specimen 1 2 3 Avg
LW 3960 3650 3850 3820
NW 3940 4450 4210 4200
95
Appendix B
ASTM C1152 Example Calculation
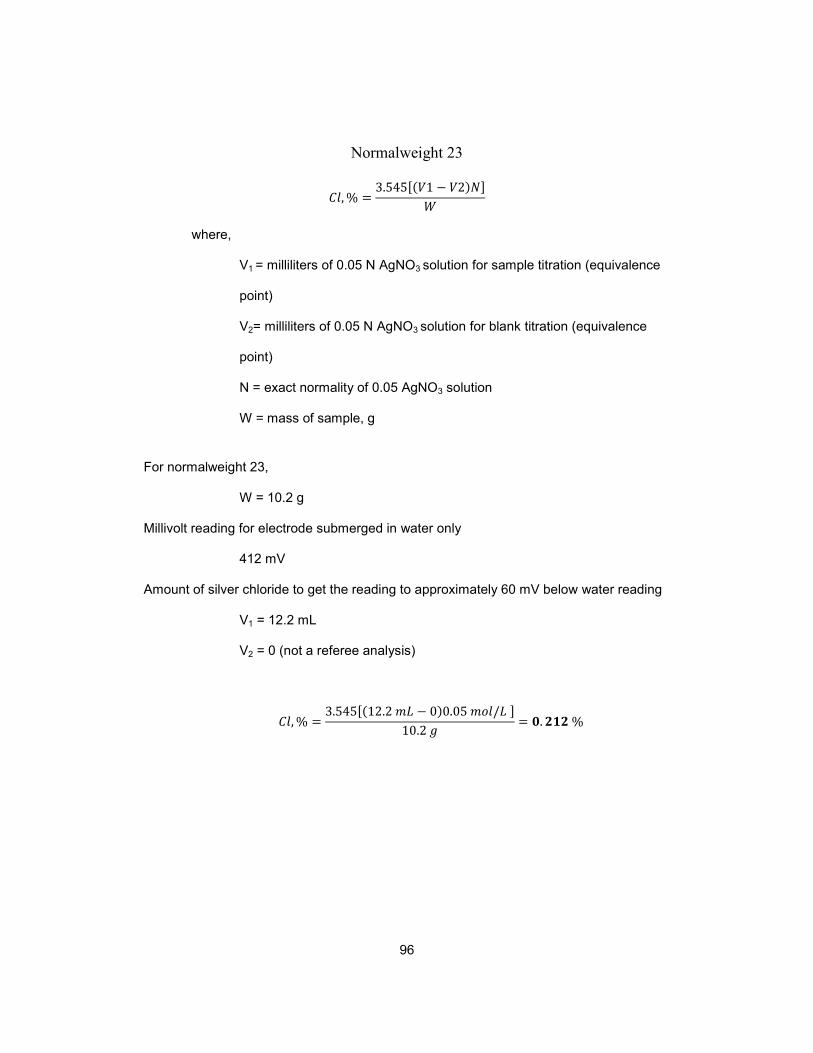
96
Normalweight 23
where,
V1 = milliliters of 0.05 N AgNO3 solution for sample titration (equivalence
point)
V2= milliliters of 0.05 N AgNO3 solution for blank titration (equivalence
point)
N = exact normality of 0.05 AgNO3 solution
W = mass of sample, g
For normalweight 23,
W = 10.2 g
Millivolt reading for electrode submerged in water only
412 mV
Amount of silver chloride to get the reading to approximately 60 mV below water reading
V1 = 12.2 mL
V2 = 0 (not a referee analysis)
97
References
ACI Committee 211, (1998), Standard Practice for Selecting Proportions for Structural
Lightweight Concrete, ACI 211.2-98, American Concrete Institute.
ACI Committee 213, (2003), Guide for Structural Lightweight Aggregate Concrete, ACI
213R-03, American Concrete Institute.
ACI Committee 222R, (2001), Protection of Metals in Concrete against Corrosion,ACI
222R-01, American Concrete Institute.
ACI Committee 440R, (2007), Report on Fiber-Reinforced Polymer (FRP) Reinforcement
for Concrete Structures, ACI 440R-07, American Concrete Institute.
ACI Committee 440, (2008), Guide for the Design and Construction of Externally Bonded
FRP Systems for Strengthening Concrete Structures, ACI 440.2R-08, American
Concrete Institute.
American Water Works Association. Ductile Iron Pipe and Fittings, 2nd ed.
American Water Works Association, Denver, CO, pg. 166-169.
ASTM. (2011). Standard Test Method for Acid-Soluble Chloride in Mortar and
Concrete,ASTM C1543, Philadelphia. pg. 645-648
ASTM. (2011). Standard Practice for Preparing, Cleaning, and Evaluating Corrosion Test
Specimens, ASTM G1-03, Philadelphia. pg. 20-28.
ASTM. (2011). Standard Test Method for Determining Density of Structural Lightweight
Concrete, ASTM C567-05a, Philadelphia. pg. 318-320.
ASTM. (2011). Standard Specification for Lightweight Aggregates for Structural
Concrete, ASTM C330/300M-09, Philadelphia. pg. 318-320.
Axson, D. (2008). "Ultimate Bearing Strength of Post-tensioned Local Anchorage Zones
in Lightweight Concrete," Master's Thesis, Virginia Polytech Institute and State
University, Blacksburg
98
Berver, E., Jirsa, J., Fowler, D., Wheat, H. and Moon, T. (2001). “Effects of
Wrapping Chloride Contaminated Concrete with Fiber Reinforced Plastics”.
FHWA/TX-03/1774-2, Austin, TX.
Chandra, S and Berntsson, L. (2003). Lightweight aggregate concrete: science,
technology, and applications. Nowrich, N.Y.: Noyes Publications/William Andrew
Pub., c 2003. pg. 134-138.
http://chemcosystems.com/tech_bondingcon.html
Daily, Steven F. (2003). "Understanding corrosion and cathodic protection of reinforced
concrete structures". Corrpro Companies, Incorporated, 2003.
Detwiler, R. J., Kjellsen, K. O., and Gjorv, O. E., (1991), ‘‘Resistance to
chloride intrusion of concrete cured at different temperatures.’’ ACI
Materials Hournal, Vol. 88, No. 1, pp. 19-24, 1991
Fu, Z., Ji, B., Lv, L., and Yang, M. (2011) The Mechanical Properties of Lightweight
Aggregate Concrete Confined by Steel Tube. Design, Construction,
Rehabilitation, and Maintenance of Bridges: pp. 33-39.
Gadve, S and Mukherjee, A. ( 2008). "Active Protection of Fiber Reinforced Polymer
Wrapped Reinforced Concrete Structures Against Corrosion". Proquest Science
Journals, Vol. 67, No. 2, pp. 1-11.
GangaRao, Hota V.S., Taly, Narendra, and Vijay, P.V. (2007). Reinforced Concrete
Design With FRP Composites, Taylor & Francis Group, Boca Raton, FL,
Durability: Aging of Composites, pg.53-54, 87.
Gharachorlou, A. and Akbar , A. (2009), "Resistance of concrete specimens strengthened
with FRP sheets to the penetration of chloride ions", The Arabian J.for Sci and
Engg., 35, Number 1B, pg. 141-154.
99
Heffington, J. A., 2000, "Development of High Performance Lightweight Concrete Mixes
for Prestressed Bridge Girders," Master's Thesis, The University of Texas,
Austin, May
Holm, T.A. (1980). "Performance of Structural Lightweight Concrete in a Marine
Environment." International Symposium, St. Andrews-By-the-Sea, Canada,
August 1980.
Holm, Thomas A. and Bremner, Theodore w. (2000). "State-of-the-Art Report on High-
Strength, High-Durability Structural Low-Density Concrete for Applications in
Severe Marine Environments." ERDC/SL TR-00-3, U.S. Army Engineer
Research and Development Center, Vicksburg, MS.
http://www.fyfeco.com
Xuemei Liu , KokSeng Chia, Min-Hong Zhang (2010). "Development of lightweight
concrete with high resistance to water and chloride-ion penetration." Cement and
Concrete Composites, V. 32(I.10), November, pp.: 757-766.
Mackie, G. K., (1985) “Recent Uses of Structural Lightweight Concrete,” Concrete
Construction, Vol. 30, No. 6 (Jun. 1985) pp. 497-502.
Masoud S, Soudki KA. (2006). "Evaluation of Corrosion Activity in FRP Repaired RC
beams". Cem Concr Compos 2006;28:9 69–77
Murugesh, Ganapathy. (2008). “Lightweight Concrete and the New Benicia-Martinez
Bridge.” Concrete Bridge Views. 49: 1-13. HPCBridgeViews.
Norton Corrosion Limited, "Fundamentals of Cathodic Protection," Norton Corrosion
Limited, LLC, Woodinville, WA
100
Park, Si-Hwan; Robertson, Ian N,; and Riggs, Ronald H. (2002). "A Primer for FRP
Strengthening of Structurally Deficient Bridges". University of Hawaii, College of
Engineering. Research Report UHM/CE/02-03.
Protection Technology Group, "Dissimilar Metals May Take Away Your Protection,"
PolyPhaser, Hayden, ID, 1485-007, 2011.
S.P. Shah, A.E. Naaman, J. Moreno, (1983) " Effect of confinement on the ductility of
lightweight concrete", International Journal of Cement Composites and
Lightweight Concrete, Volume 5, Issue 1, February 1983, Pages 15-25, ISSN
0262-5075,
Sen, R. (2003), “Advances in the Application of FRP for Repairing Corrosion Damage”,
Progress in Structural Engineering and Materials, Vol. 5, No. 2, pp.
99-113.
Stanish KD, Hooton RD, Thomas MDA, (1997), "Testing the chloride
penetration resistance of concrete: a literature review", FHWA
contract DTFH61, Department of Civil Engineering, University
of Toronto, Canada
Spainhour, Lisa K. and Yazdani, Nur. (2002). "Composite Fiber Wrapping for Protection,
Strengthening, and Repair of Bridge Elements in the Splash Zone". National
Science Foundation Report. Final Report: 9504193.
Spainhour, L. K., & Wootton, I. A. (2008). "Corrosion process and abatement in
reinforced concrete wrapped by fiber reinforced polymer". Cement and Concrete
Composites, 30(6), 535-543.
Suh, K., Mullins, G., Sen, R., and Winters, D. (2007). “Effectiveness of FRP in reducing
corrosion in a marine environment.” ACI Struct. J. 104, 76–83.
101
Tamer A, Maaddawy E, Soudki KA. (2003). "Effectiveness of impressed current
technique to simulate corrosion of steel reinforcement in concrete," J Mater Civil
Eng;15(1):41–7.
United States. National Cooperative Highway Research Program. Transportation
Research Board of the National Academies. (2013). High-Performance/High-
Strength Lightweight Concrete for Bridge Girders and Decks. (NCHRP Report
733).
usa.sika.com
Wall and Freeman. (2003). " Rapid Chloride Permeability of Structural Lightweight
Aggregate Concrete Compared with Normal Density Concrete Having Similar
Proportions." Carolina Stalite Company Research Lab, Gold Hill, North Carolina.
Wootton, I. A., Spainhour, L. K., & Yazdani, N. (2003). "Corrosion of steel reinforcement
in carbon fiber-reinforced polymer wrapped concrete cylinders". Journal of
Composites for Construction, 7(4), 339-347.
www.ESCSI.org
102
Biographical Information
Eric Goucher earned his Bachelor's of Science Degree in Civil Engineering at
Texas A&M University in December of 2009. He worked for two years at a construction
company until he decided to go back to school to earn his master's degree. He decided
to focus on Structures as that was what he was interested in.
Eric currently works at Innovative Engineering Associates as a Structural EIT.
He plans to get his PE license and continue learning and gaining experience in the work
force.