Embed Size (px)
Citation preview
Journal of Research of the National Bureau of Standards Vol. 49, No. 5, November 1952 Research Paper 2366
Corrosion of Galvanized Steel in SoilsIrving A. Denison and Melvin Romanoff
The results of measurements of the corrosion of galvanized steel and of bare steel andzinc as reference materials after exposure to different soil conditions for a maximum of 13years are reported. The magnitude and progress of corrosion of galvanized steel as deter-mined by weight loss and pitting is interpreted in terms of the environmental conditions towhich the specimens were exposed. From analysis of data on the corrosion of galvanizedspecimens having different weights of coating, minimum coating requirements for differentenvironmental conditions are suggested.
1. IntroductionIn order to evaluate the effectiveness of zinc coat-
ings in protecting iron and steel from corrosion under-ground, test specimens of iron and steel coated withdifferent thicknesses of zinc, applied by the hot-dipprocess, were included in the extensive field-exposuretests undertaken by the National Bureau of Stand-ards in 1924. The thinner coatings did not preventcorrosion in the more corrosive soils, but coatingshaving a nominal weight of 3 oz/ft2 of exposed surfaceprevented the development of measurable pits onthe specimens at all but one of the 47 test sites forthe entire period of exposure [1, 2].1 Although thesites represented a wide range of soil conditions, itwas considered desirable to expose specimens withthe heavier zinc coatings to additional soil environ-ments in which some dominant corrosive factor,such as chloride content, acidity, etc., was theapparent cause of corrosion. Accordingly, speci-mens having the same nominal weight of coating,namely, 3 oz/ft2 of surface were buried at 15 addi-tional sites in 1937. A sufficient number of specimensof galvanized steel and of the reference materials,steel and zinc, were buried to provide for removalof two specimens of each material after each offive periods of exposure. This paper deals with thecondition of the specimens of the three materialsexposed for different periods up to 13 yr.
2. Properties of the Soils at the Test SitesThe test sites represent a wide range of environ-
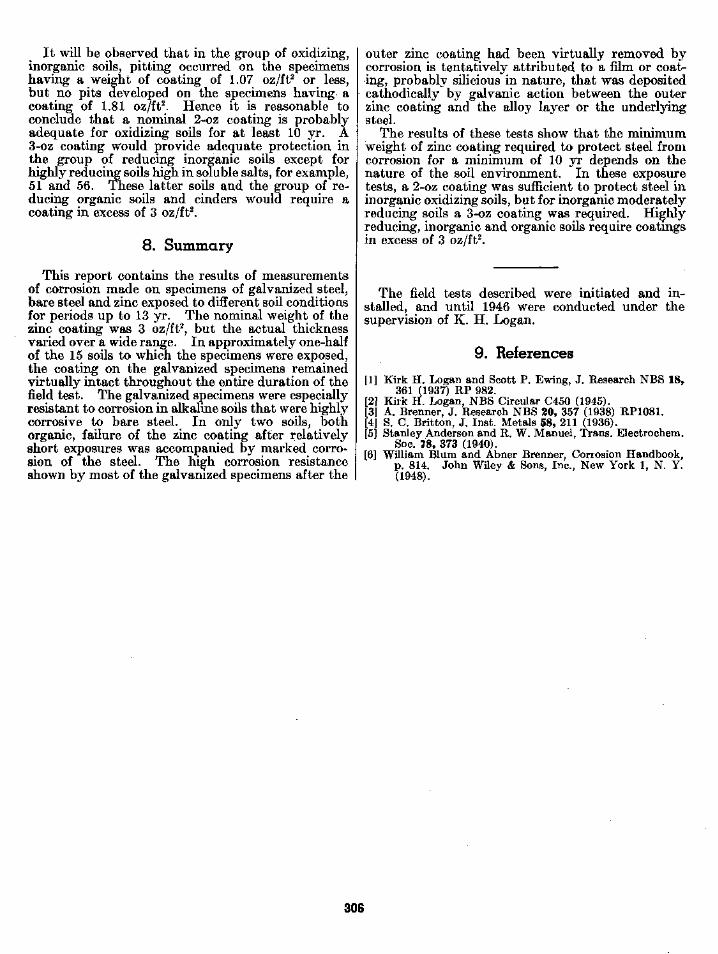
mental conditions with respect to both the chemicaland physical properties of the soils (table 1). Forexample, the hydrogen-ion concentration of the soilsranges from pH 2.6 to 9.4, and the resistivity from62 to 17,800 ohm-cm. At several of the test sitesthe soils are highly oxidized to considerable depths,whereas in others the permanent water table isclose to the surface. The environmental conditionsat several of the test sites are illustrated in figure 1.
3. MaterialsThe galvanized and bare steel specimens were
14-in. (35-cm) lengths of pipe 1.5 in. (3.8 cm) indiameter cut from the same lots of commercial mate-
i Figures in brackets indicate the literature references at the end of this paper.
rials. The nominal weight of the zinc coating on thegalvanized specimens was 3.08 oz/ft2.2 The impuri-ties in the spelter in percent were: Al, 0.008; Fe,0.07; and Pb, 0.78. The steel, both galvanized andbare, was AISI No. B1010, with the nominal com-position in percent as follows: C, 0.13 max; Mn,0.30 to 0.60; P, 0.07 to 0.12; S, 0.06 max. Theinterior of the specimens was coated with heavygrease, and the ends were closed in order to preventinternal corrosion.
The zinc specimens were plates having the dimen-sions 12 in. (30.5 cm) by 2.3 in. (5.8 cm) by 0.15 in.(0.4 cm). The impurities determined in the zincin percent were: Fe, 0.009; Pb, 0.095; Cd, 0.0038.
4. Distribution of the Coating on the Gal-vanized Specimens
The distribution of the coating on the galvanizedspecimens was measured by a magnetic method [3].The measurements were made on one 14-in. (35 cm)length of galvanized pipe selected at random fromthe lot of specimens before burial, and on a 6-in.(15 cm) section cut from a second specimen fromthe same lot. A total of 389 measurements of thick-ness were made on the 14-in. length of pipe (identi-fied as specimen A), and 162 measurements weremade on the 6-in. section (identified as specimen B).
The measurements of coating thickness are shownas frequency distribution curves in figure 2. Thesecurves indicate not only that the specimens differedwidely in coating thickness, but that the distribu-tion of the coating on the individual specimens washighly variable as well. The variation did not fallin any particular pattern.
5. Thickness of the Outer Zinc Coating andof the Alloy Layer
The thickness of the outer zinc coating and of thealloy layer was measured by modifications of theelectrolytic stripping methods described by Britton[4] and by Anderson and Manuel [5].
The electrolytic cell consisted of a 4-oz (120-ml)plastic bottle from which the bottom had been re-
2 This is the weight of coating on one side of the pipe. Each ounce per squarefoot of coating is equivalent to 0.00172 in. in thickness.
299
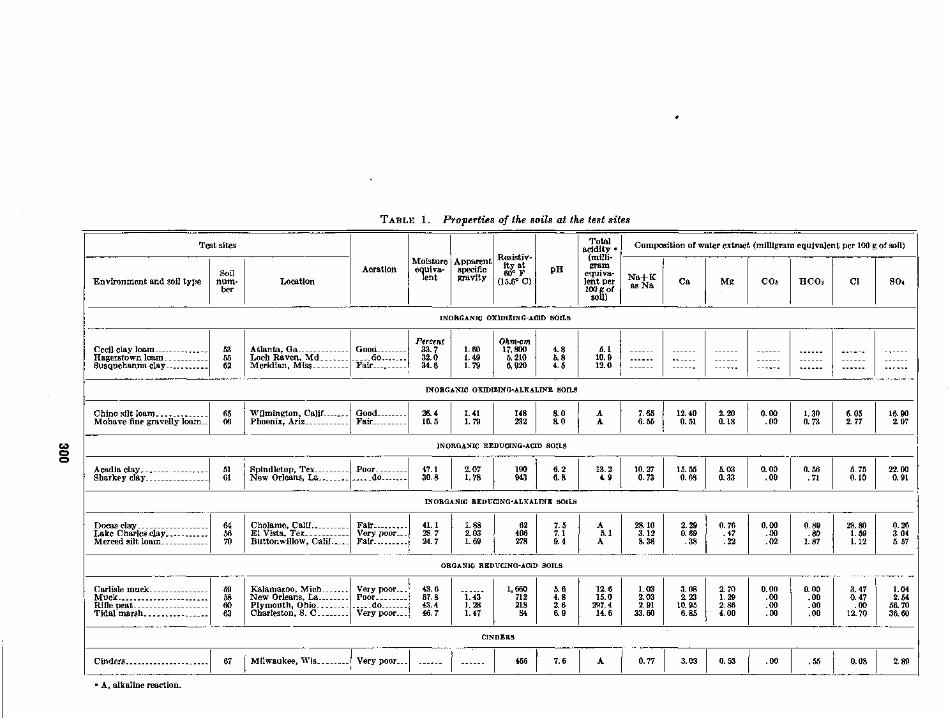
TABLE 1. Properties of the soils at the test sites
Test sites
Environment and soil typeSoil
num-ber
LocationAeration
Moistureequiva-
lent
Apparentspecificgravity
Resistiv-ity at60° F
(15.6° C)PH
Totalacidity «
(milli-gram
equiva-lent per100 g of
soil)
Composition of water extract (milligram equivalent per 100 g of soil)
N a + Kas Na Ca M g COs HC03 Cl SO4
INORGANIC OXIDIZING-ACID SOILS
Cecil clay loamHagerstown loamSusquehanna clay
Chino silt loamMohave fine gravelly loam
Acadia claySharkey clay
Docas clayLake Charles clayMerced silt loam
Carlisle muckMuckRifle peatTidal marsh . . . .
Cinders
535562
Atlanta, GaLoch Raven, Md.Meridian, Miss
Good-do..
Fair.
Percent33.732.034.6
1.601.491.79
Ohm-cm17,8005,210
4.85.84.5
5.110.912.0
INORGANIC OXIDIZING-ALKALINE SOILS
65 Wilmington, Calif-Phoenix, Ariz
Good-.Fair...
26.416.5
1.411.79
148232
8.08.0
AA
7.656.55
12.400.51
2.200.18
0.00.00
1.300.73
6.052.77
16.902.97
COoo
INORGANIC REDUCING-ACID SOILS
5161
Spindletop, Tex...New Orleans, La_.
Poor. 47.130.8
2.071.78
190943
6.26.8
13.24.9
10.270.73
15.550.68
5.030.33
0.00.00
0.56.71
5.750.10
22.000.91
INORGANIC REDUCING-ALKALINE SOILS
645670
Cholame, CalifEl Vista, TexButtonwillow, Calif..
FairVery poor..Fair
41.128.724.7
1.882.031.69
62406278
7.57.19.4
A5.1A
28.103.128.38
2.290.69.38
0.76.47.22
0.00.00.02
0.89.801.87
28.801.591.12
0.263.045.57
ORGANIC REDUCING-ACID SOILS
586063
Kalamazoo, Mich.New Orleans, La__Plymouth, Ohio..Charleston, S. C__
Very poor..Poor
.do-Very poor...
43.657.843.446.7
1.431.281.47
1,66071221884
5.64.82.66.9
12.615.0297.414.6
1.032.032.9133.60
3.082.2310.956.85
2.701.292.864.00
0.00.00.00.00
0.00.00.00.00
3.470.47.00
12.70
1.042.54
56.7036.60
67 Milwaukee, Wis. Very poor.. 455 7.6 0.77 3.03 0.53 .00 .55 0.08 2.89
0 A, alkaline reaction.
moved. The cathode was a strip of zinc 1.5 in.(38 mm) in width formed so as to fit tightly aroundthe inner periphery of the bottle. Contact with thecoating was made by means of a hole 0.19 in. (5 mm)in diameter in a No. 8 rubber stopper. A larger holebored partly through one end of the stopper per-mitted the stopper to be placed over the mouth ofthe bottle. The electrolyte was a solution contain-ing 20 g of NaCl, 10 g of ZnSO4, and 100 g of H2O.
In operation, the bottle was inverted and the testpiece placed in contact with the hole in the stopperwith sufficient pressure to prevent leakage of theelectrolyte. By means of a 6-v storage batteryshunted by a variable voltage divider, an initialcurrent of 25 ma was passed through the cell withthe test piece as the anode, the current being readon a recording milliammeter. As the outer zinccoating was removed by electrolysis and differentphases of zinc-iron alloy and finally steel were ex-posed, the changes in potential associated with eachphase produced corresponding changes in the re-corded current.
The interpretation of the current-time curves interms of coating thickness is illustrated by figure 3.The minimum thickness of the zinc layer is measuredby the horizontal part of the curve at point A. Onexposure of an alloy layer locally, the counter emfincreases, and the current proportionally decreasesuntil the zinc is completely removed and a uniformlayer of the first phase of the alloy layer is exposed(point B). The current then remains unchangeduntil a second phase of the alloy layer is exposed andso on through the various phases until the under-lying steel is completely exposed. The minimumthickness of the alloy layer, including the inter-mediate phases, is represented by the distance BC,and the maximum thickness by the distance AD.The reported thicknesses were computed from theareas under the curve. For the present investiga-tion the thickness of the zinc coating was taken asthe maximum thickness, that is, to point B, and thethickness of the alloy layer was taken as beingrepresented by the distance BD.
The maximum thickness of the outer zinc coatingand of the alloy layer at several points on twospecimens are recorded in table 2. These data indi-cate that a large part of the zinc applied to the steelpipe was converted to alloy layer.
TABLE 2. Thickness of the outer zinc coating, of the alloy layer,and of the total coating on galvanized specimens
[In mils]
Specimen
AAAA
BB
Zinclayer
1.80.92.02.0
2.72.8
Alloylayer
2.33.42.33.0
3.23.2
Totalcoating
4.14.34.35.0
5.96.0
6. Condition of Coating, Weight Loss, andPitting of Galvanized Steel, Bare Steel,and Zinc
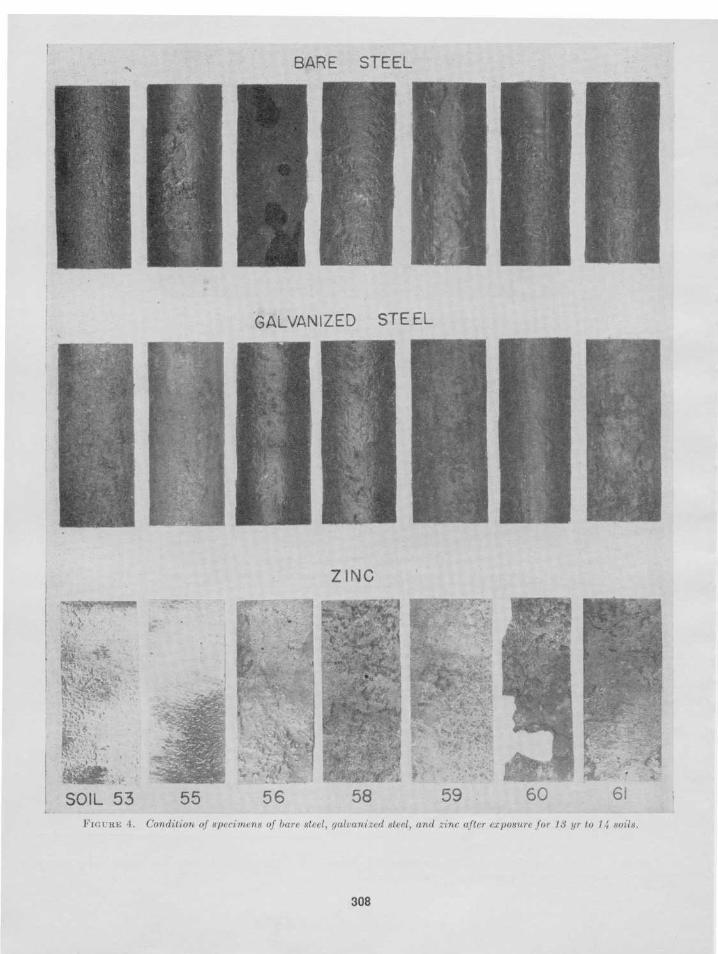
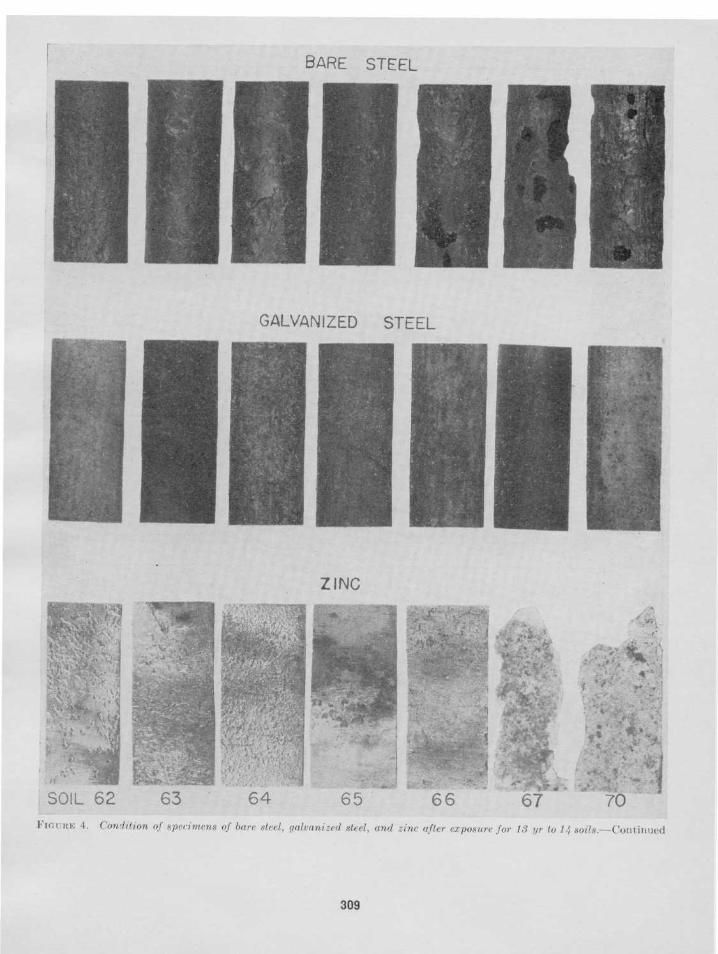
After each exposure period, one set of specimenswas removed, returned to the laboratory, and cleanedfree of corrosion products by previously describedmethods [2]. Photographs of the specimens of gal-vanized steel, bare steel, and zinc removed from thedifferent sites after exposure for 13 yr are shown infigure 4.
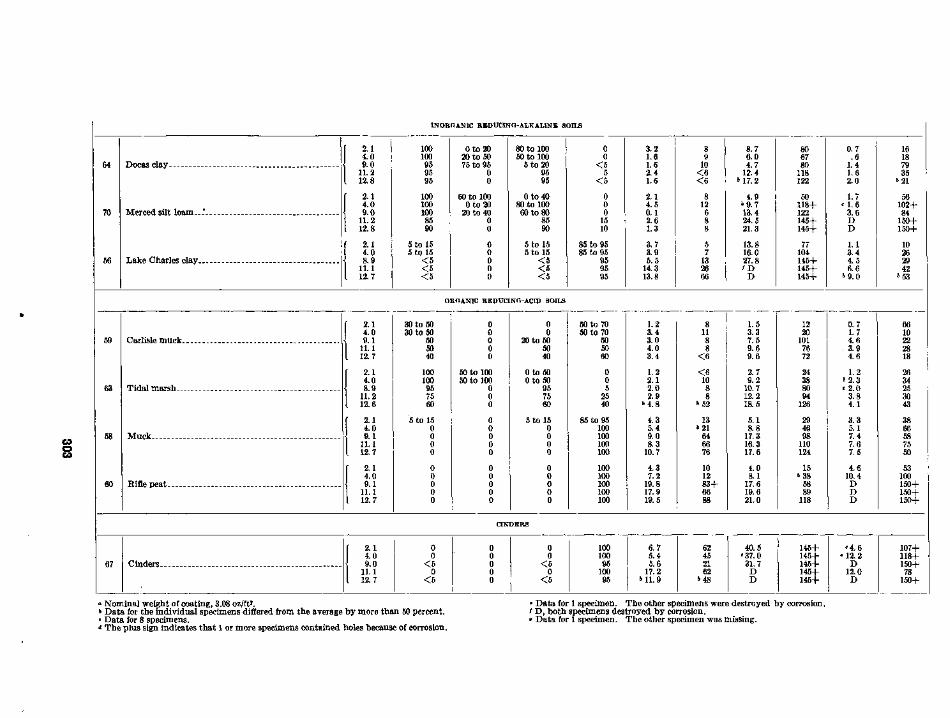
The losses in weight and the depths of the deepestpits on the specimens, together with the percentageof the area of the galvanized specimens on whichcoating remained, are recorded in table 3 for thedifferent periods of exposure. Except as indicated,each value is the average of measurements made ontwo specimens.
The data of table 3 reveal that in nearly one-halfof the total number of soils (53, 55, 61, 62, 64, 65, 66,and 70) the coating remained virtually intact andconsequently provided complete protection to theunderlying steel for the maximum period of exposure.However, in the highly reducing soils (51, 56, 58, and60) and in cinders (67) little, if any, of the coatingremained at the conclusion of the test.
In certain soils, such as 58 and 60, failure of thecoating during the first few years of exposure re-sulted in a rate of corrosion of the galvanizedspecimens comparable to that of bare steel. But inother soils, contrary to expectations, destruction ofthe coating was not accompanied by rapid corrosionof the underlying steel. For example, the galva-nized specimens in soils 51 and 56 corroded relativelyslowly during the greater part of the exposure periodin spite of the fact that the coating was almostcompletely removed by corrosion during the firstfew years of exposure. Even in the highly corrosivecinders, soil 67, the galvanized specimens corrodedmuch more slowly than the specimens of bare steel.
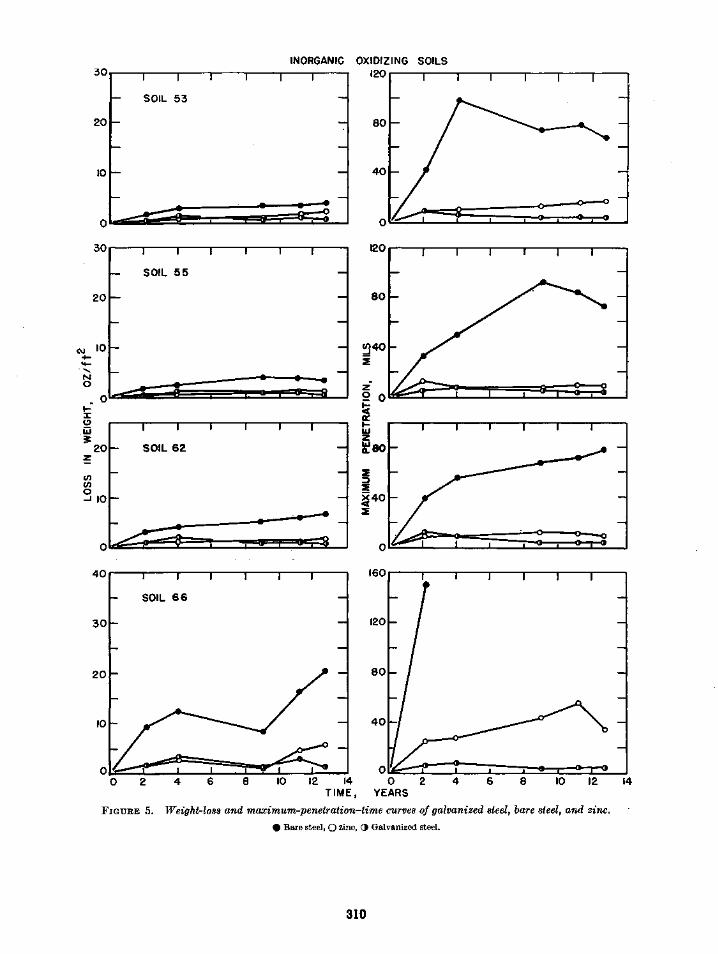
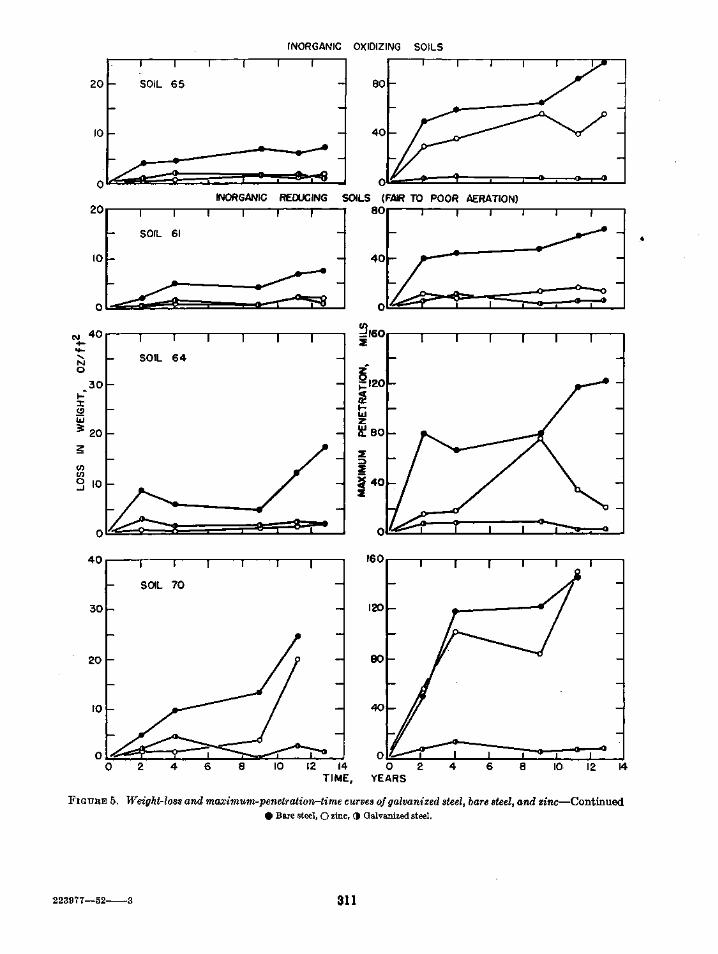
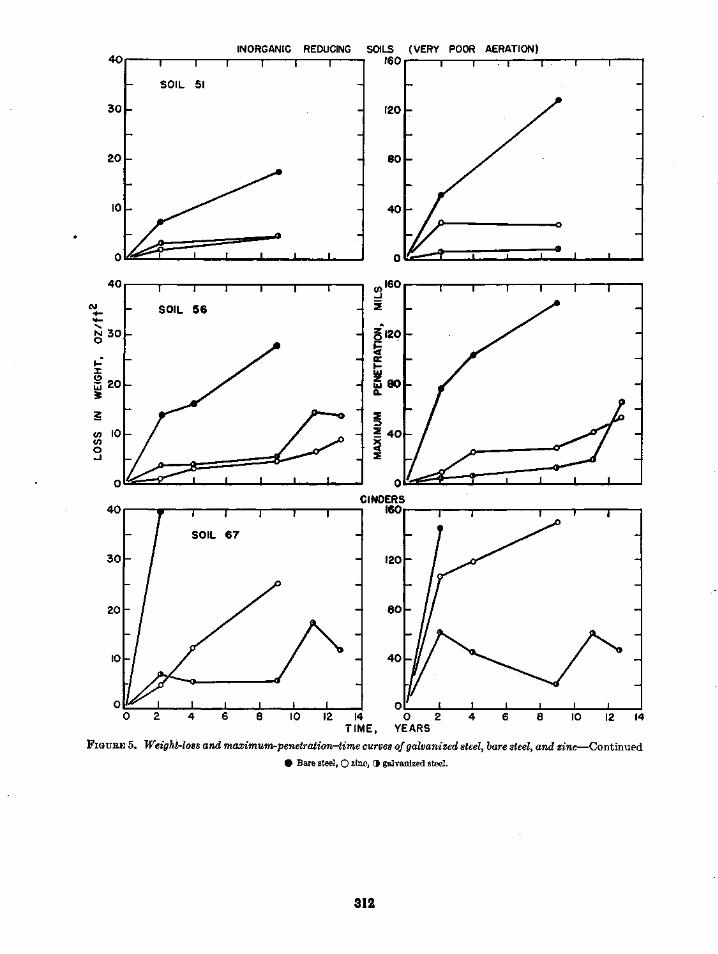
The progress of corrosion of galvanized steel, baresteel, and zinc in the different soils is shown by theweight loss and pit depth-time curves of figure 5.The values for weight loss and pitting of the gal-vanized specimens on which the coating remainedintact naturally apply to the coating and not to thebasis metal.
The weight loss and pit-depth—time curves forthe galvanized specimens in soils 64, 65, 66, and 70are of particular interest in indicating that zinccoatings were effective in protecting steel againstcorrosion in soils that are highly corrosive to steel,For example, in spite of the fact that the steel speci-mens in soil 66 were perforated by corrosion after-exposure for a few years, the coating on the galva-nized specimens in this soil remained perfectly con-tinuous throughout the entire period of the test.In soil 70, the specimens of both zinc and steelwere severely corroded, but the coating on thegalvanized specimens provided complete protectionto the underlying steel.
301
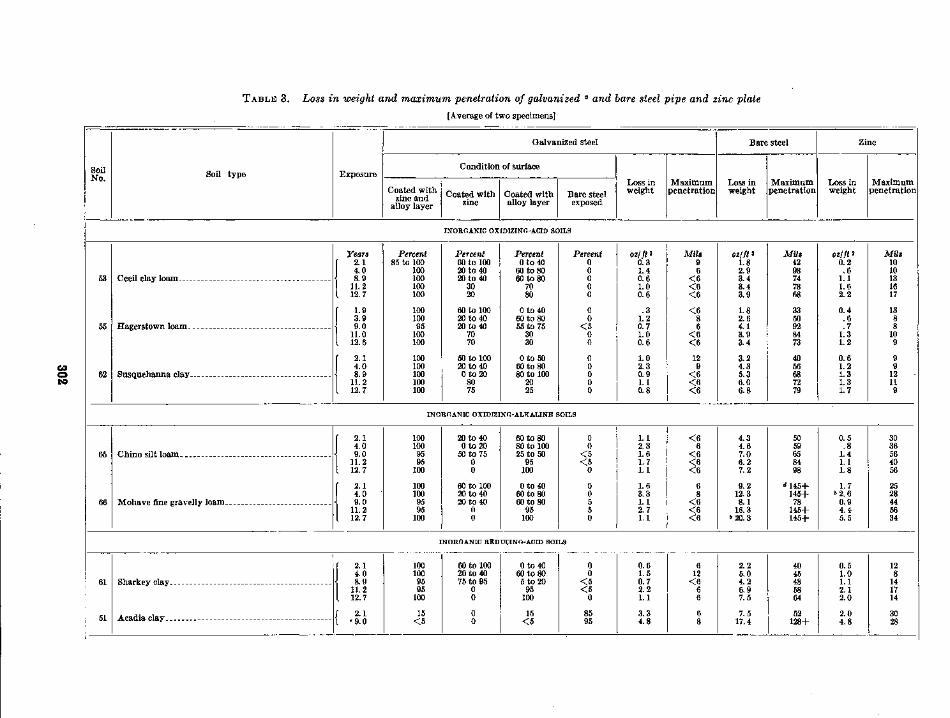
TABLE 3. Loss in weight and maximum penetration of galvanized ° and bare steel pipe and zinc plate[Average of two specimens]
SoilNo. Soil type Exposure
Galvanized steel
Condition of surface
Coated withzinc and
alloy layerCoated with
zincCoated withalloy layer
Bare steelexposed
Loss inweight
Maximumpenetration
Bare steel
Loss inweight
Maximumpenetration
Zinc
Loss inweight
Maximumpenetration
CO
g
53
55
62
Cecil clay loam.
Hagerstown loam_
Susquehanna clay..
INORGANIC OXIDIZING-ACID SOILS
Years2.14.08.9
11.212.7
1.93.99.0
11.012.6
2.14.08.9
11.212.7
Percent85 to 100
100100100100
10010095
100100
100100100100100
Percent60 to 10020 to 4020 to 40
3020
60 to 10020 to 4020 to 40
7070
50 to 10020 to 400to20
8075
Percent0to40
60 to 8060 to 80
7080
0to4060 to 8055 to 75
3030
0to5060 to 8080 to 100
2025
Percent00000
00
<500
00000
oz/ft*0.31.40.61.00.6
.31.20.71.00.6
1.02.30.91.10.8
Mils96
< 6< 6< 6
< 686
< 6< 6
129
< 6< 6< 6
oz/ft 21.82.93.43.43.9
1.82.64.13.93.4
3.24.35.36.06.8
Mils4298747868
3350928473
4056687279
OZfft 20.2
.61.11.62.2
0.4.6. 7
.1.31.2
0.61.21.31.31.7
Mils1010131617
1388
109
99
12119
INORGANIC OXIDIZING-ALTCALINE SOILS
65
66
Chino silt loam_
Mohave fine gravelly loam.
2.14.09.011.212.7
2.14.09.011.212.7
1001009595100
1001009595100
20 to 400to2050 to 75
00
60 to 10020 to 4020 to 40
00
60 to 8080 to 10025 to 5095100
0to4060 to 8060 to 8095100
00
<5<50
00550
1.12.31.61.71.1
1.63.31.12.71.1
< 66
< 6< 6< 6
68
< 6< 6< 6
4.34.67.06.27.2
9.212.38.1
16.3&20.3
5059658498
d145+145+78
145+145+
0.5.8
1.41.11.8
1.7b 2. 6
0.94.45.5
3036564056
2528445634
INORGANIC REDUCING-ACID SOILS
61 Sharkey clay.
Acadia clay.
2.14.08.9
11.212.7
2.1c 9.0
1001009595
100
15<5
60 to 10020 to 4075 to 95
00
00
0to4060 to 80
5 to 2095
100
15<5
00
<5<5
0
8595
0.61.50.72.21.1
3.34.8
612
< 666
68
2.25.04.26.97.5
7.517.4
4045485864
52128+
0.51.01.12.12.0
2.04.8
141714
30
INORGANIC REDUCING-ALKALINE SOILS
64
70
56
Docas clay.
Merced silt loam.
Lake Charles clay..
2.14.09.011.212.8
2.14.09.011.212.8
2.14.08.911.112.7
100100959595
1001001008590
5 to 155 to 15
<5<5<5
0to2020 to 5075 to 95
00
60 to 1000to2020 to 40
00
00000
80 to 10050 to 1005 to 20
9595
0to4080 to 10060 to 80
8590
5 to 155 to 15
<5<5<5
00
<55
<5
0001510
85 to 9585 to 95
959595
3.21.61.62.41.6
2.14.50.12.61.3
3.73.95.514.313.8
8910<6<6
812688
57132666
8.76.04.712.4
" 17.2
4.9* 9. 713.424.521.3
13.816.027.8/DD
806780118122
50118+122145+145+
77104145+145+145+
0.7.61.41.62.0
1.7c 1.63.6I)D1.13.44.56.6
"9.0
16187935"21
56102+84150+150+
10262942
6 53
ORGANIC REDUCING-ACID SOILS
59
58
60
Carlisle muck.
Tidal marsh.
Muck..
Rifle peat.
2.14.09.1
11.112.7
2.14.08.9
11.212.6
2.14.09.1
11.112.7
2.14.09.1
11.112.7
30 to 5030 to 50
505040
100100957560
5 to 150000
00000
00000
50 to 10050 to 100
000
00000
00000
00
20 to 505040
0to500to50
957560
5 to 150000
00000
50 to 7050 to 70
505060
005
2540
85 to 95100100100100
100100100100100
1.23.43.04.03.4
1.22.12.02.9
"4.8
4.35.49.08.3
10.7
4.37.2
19.817.919.5
81188
<6
<61088
"52
13"21
646676
101283+6688
1.53.37.59.69.6
2.79.2
10.712.218.5
5.18.8
17.316.317.6
4.08.1
17.619.621.0
1220
1017672
24388094
126
294698
110124
15"38
5889
118
0.71.74.6
. 3.94.6
1.2"2.3* 2.0
3.84.1
3.35.17.47.67.5
4.610.4
DDD
10222818
2634253043
3866587550
53100150+150+150+
67 Cinders.
2.14.09.0
11.112.7
00
<50
<5
00
<50
<5
10010095
10095
6.75.45.6
17.2^ 11.9
6245216248
40.5e37.031.7DD
145+145+145+145+145+
«4. 6e12.2
D12.0D
* Nominal weight of coating, 3.08 oz/ft2." Data for the individual specimens differed from the average by more than 50 percent.« Data for 8 specimens.<* The plus sign indicates that 1 or more specimens contained holes because of corrosion.
• Data for 1 specimen. The other specimens were destroyed by corrosion./ D, both specimens destroyed by corrosion.s Data for 1 specimen. The other specimen was missing.
107+118+150+78
150+
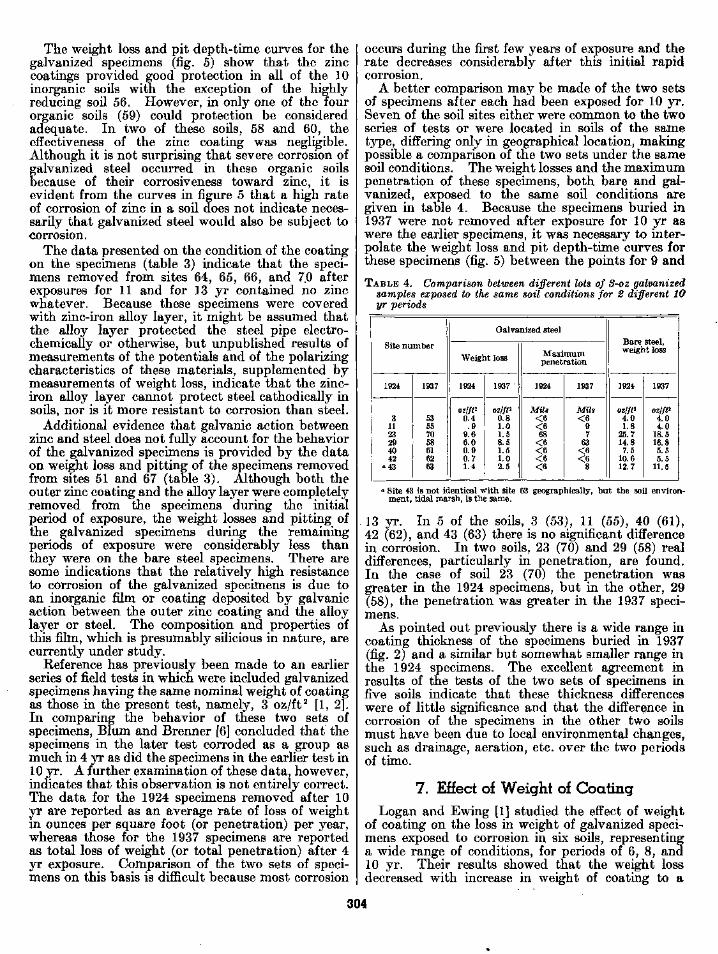
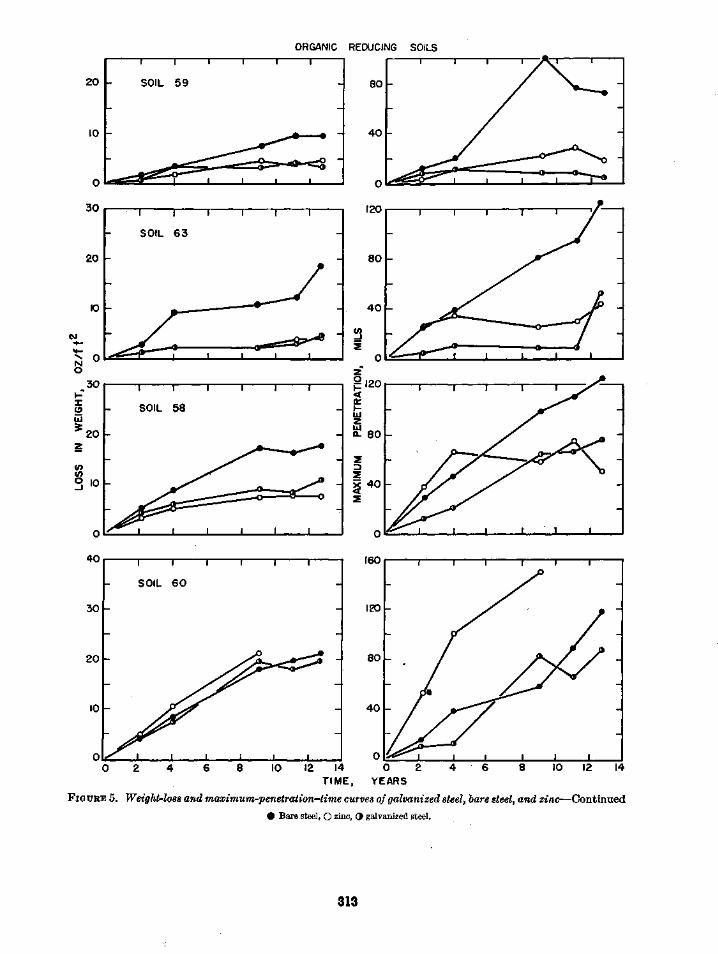
The weight loss and pit depth-time curves for thegalvanized specimens (fig. 5) show that the zinccoatings provided good protection in all of the 10inorganic soils with the exception of the highlyreducing soil 56. However, in only one of the fourorganic soils (59) could protection be consideredadequate. In two of these soils, 58 and 60, theeffectiveness of the zinc coating was negligible.Although it is not surprising that severe corrosion ofgalvanized steel occurred in these organic soilsbecause of their corrosiveness toward zinc, it isevident from the curves in figure 5 that a high rateof corrosion of zinc in a soil does not indicate neces-sarily that galvanized steel would also be subject tocorrosion.
The data presented on the condition of the coatingon the specimens (table 3) indicate that the speci-mens removed from sites 64, 65, 66, and 70 afterexposures for 11 and for 13 yr contained no zincwhatever. Because these specimens were coveredwith zinc-iron alloy layer, it might be assumed thatthe alloy layer protected the steel pipe electro-chemically or otherwise, but unpublished results ofmeasurements of the potentials and of the polarizingcharacteristics of these materials, supplemented bymeasurements of weight loss, indicate that the zinc-iron alloy layer cannot protect steel cathodically insoils, nor is it more resistant to corrosion than steel.
Additional evidence that galvanic action betweenzinc and steel does not fully account for the behaviorof the galvanized specimens is provided by the dataon weight loss and pitting of the specimens removedfrom sites 51 and 67 (table 3). Although both theouter zinc coating and the alloy layer were completelyremoved from the specimens during the initialperiod of exposure, the weight losses and pitting ofthe galvanized specimens during the remainingperiods of exposure were considerably less thanthey were on the bare steel specimens. There aresome indications that the relatively high resistanceto corrosion of the galvanized specimens is due toan inorganic film or coating deposited by galvanicaction between the outer zinc coating and the alloylayer or steel. The composition and properties ofthis film, which is presumably silicious in nature, arecurrently under study.
Reference has previously been made to an earlierseries of field tests in which were included galvanizedspecimens having the same nominal weight of coatingas those in the present test, namely, 3 oz/ft2 [1, 2].In comparing the behavior of these two sets ofspecimens, Blum and Brenner [6] concluded that thespecimens in the later test corroded as a group asmuch in 4 yr as did the specimens in the earlier test in10 yr. A further examination of these data, however,indicates that this observation is not entirely correct.The data for the 1924 specimens removed after 10yr are reported as an average rate of loss of weightin ounces per square foot (or penetration) per year,whereas those for the 1937 specimens are reportedas total loss of weight (or total penetration) after 4yr exposure. Comparison of the two sets of speci-mens on this basis is difficult because most corrosion
occurs during the first few years of exposure and therate decreases considerably after this initial rapidcorrosion.
A better comparison may be made of the two setsof specimens after each had been exposed for 10 yr.Seven of the soil sites either were common to the twoseries of tests or were located in soils of the sametype, differing only in geographical location, makingpossible a comparison of the two sets under the samesoil conditions. The weight losses and the maximumpenetration of these specimens, both bare and gal-vanized, exposed to the same soil conditions aregiven in table 4. Because the specimens buried in1937 were not removed after exposure for 10 yr aswere the earlier specimens, it was necessary to inter-polate the weight loss and pit depth-time curves forthese specimens (fig. 5) between the points for 9 and
TABLE 4. Comparison between different lots of S-oz galvanizedsamples exposed to the same soil conditions for 2 different 10yr periods
Site number
1924
31123294042
«43
1937
53557058616263
Galvanized steel
Weight loss
1924
oz/ft*0.4
. 99.66.00.90.71.4
1937
ozlft*0.81.01.58.51.51.02.5
Maximumpenetration
1924
Mils< 6< 668
< 6< 6< 6< 6
1937
Mils< 6
97
63< 6< 6
8
Bare steel,weight loss
1924
oz/ft*4.01.8
25.714.8
7.510.612.7
1937
ozlfP4.04.0
18.516.85.55.5
11.5
o Site 43 is not identical with site 63 geographically, but the soil environ-ment, tidal marsh, is the same.
13 yr. In 5 of the soils, 3 (53), 11 (55), 40 (61),42 (62), and 43 (63) there is no significant differencein corrosion. In two soils, 23 (70) and 29 (58) realdifferences, particularly in penetration, are found.In the case of soil 23 (70) the penetration wasgreater in the 1924 specimens, but in the other, 29(58), the penetration was greater in the 1937 speci-mens.
As pointed out previously there is a wide range incoating thickness of the specimens buried in 1937(fig. 2) and a similar but somewhat smaller range inthe 1924 specimens. The excellent agreement inresults of the tests of the two sets of specimens infive soils indicate that these thickness differenceswere of little significance and that the difference incorrosion of the specimens in the other two soilsmust have been due to local environmental changes,such as drainage, aeration, etc. over the two periodsof time.
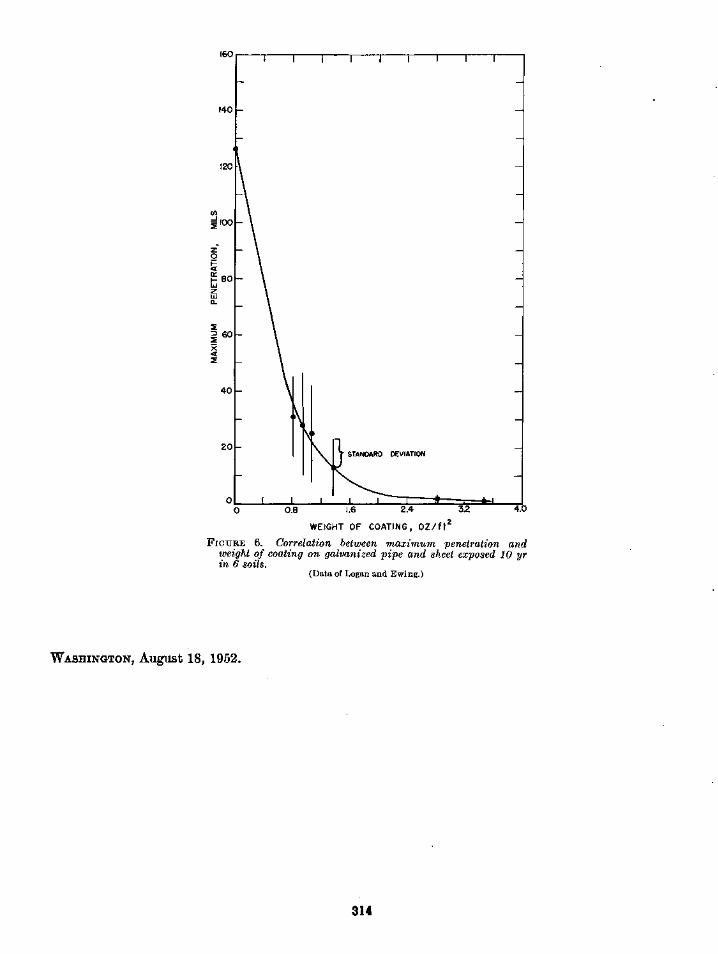
7. Effect of Weight of CoatingLogan and Ewing [1] studied the effect of weight
of coating on the loss in weight of galvanized speci-mens exposed to corrosion in six soils, representinga wide range of conditions, for periods of 6, 8, and10 yr. Their results showed that the weight lossdecreased with increase in weight of coating to a
304
certain limiting value beyond which it was constant.On the basis of this relation and other considerations,the conclusion was drawn that galvanized coatingsfor underground use should have a weight of notless than 2 oz/ft2 of exposed surface. AlthoughLogan and Ewing showed a rough correlation be-tween weight loss and pitting, no attempt was madeto relate the rate of pitting of the specimens directlyto coating weight.
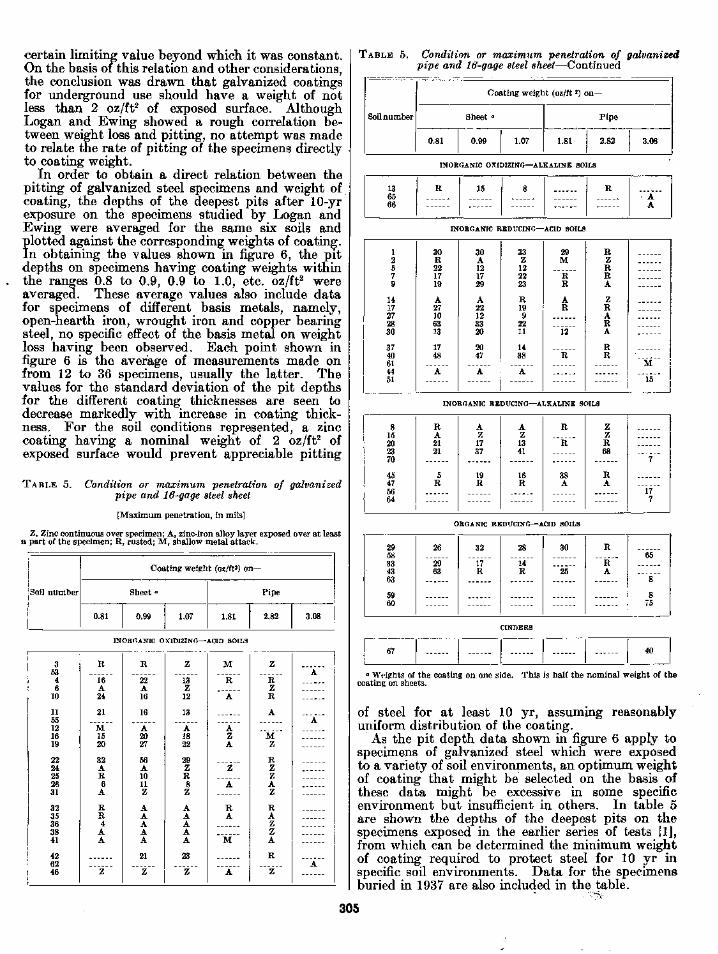
In order to obtain a direct relation between thepitting of galvanized steel specimens and weight ofcoating, the depths of the deepest pits after 10-yrexposure on the specimens studied by Logan andEwing were averaged for the same six soils andplotted against the corresponding weights of coating.In obtaining the values shown in figure 6, the pitdepths on specimens having coating weights withinthe ranges 0.8 to 0.9, 0.9 to 1.0, etc. oz/ft2 wereaveraged. These average values also include datafor specimens of different basis metals, namely,open-hearth iron, wrought iron and copper bearingsteel, no specific effect of the basis metal on weightloss having been observed. Each point shown infigure 6 is the average of measurements made onfrom 12 to 36 specimens, usually the latter. Thevalues for the standard deviation of the pit depthsfor the different coating thicknesses are seen todecrease markedly with increase in coating thick-ness. For the soil conditions represented, a zinccoating having a nominal weight of 2 oz/ft2 ofexposed surface would prevent appreciable pitting
TABLE 5. Condition or maximum 'penetration of galvanizedpipe and 16-gage steel sheet
[Maximum penetration, in mils]
Z, Zinc continuous over specimen; A, zinc-iron alloy layer exposed over at leasta part of the specimen; R, rusted; M, shallow metal attack.
Soil number
Coating weight (oz/ft») on—
0.81
Sheet «
0.99 1.07
Pipe
1.81 2.82 3.08
INORGANIC OXIDIZING—ACID SOILS
353
j 4i 61 io
1155121619
2224252631
3235363841
426246
R
16A24
21
M1520
32AR6
A
RR4
AA
Z
R
22A16
16
A2027
56A1011
zAAAAA
21
Z
Z
13Z12
13
A1822
29ZR8Z
AAAAA
23
Z
M
R______
AZA
______
" A "
RA
~~M~~
A
Z
RZR
A
MZ
RZZAZ
RAZZA
R
Z
______
______
______
TABLE 5. Condition or maximum penetration of galvanizedpipe and 16-gage steel sheet—Continued
Soil number
Coating weight (oz/ft 2) on—
Sheet «
0.81 0.99 1.07
Pipe
1.81 2.82 3.08
INORGANIC OXIDIZING—ALKALINE SOILS
136566
R 15 8 R• A
A
INORGANIC REDUCING—ACID SOILS
12579
1417272830
3740614451
30R221719
A27106313
1748
A
30A121729
A22123320
2047
A
33Z122223
R199
2211
1438
A
29M
RR
AR
12
~~R~~
RZRRA
ZRARA
RR
" M " 115
INORGANIC REDUCING—ALKALINE SOILS
ORGANIC REDUCING—ACID SOILS
815202370
45475664
RA2121
5R
AZ1737
19R
AZ1341
16R
R
R
38A
ZZR68
RA
7
177
2958334363
5960
26
2963
32
17R
28
14R
30
25
R
RA
" 6 5 "
. . . . . .
875
67
CINDERS
40
0 Weights of the coating on one side. This is half the nominal weight of thecoating on sheets.
of steel for at least 10 yr, assuming reasonablyuniform distribution of the coating.
As the pit depth data shown in figure 6 apply tospecimens of galvanized steel which were exposedto a variety of soil environments, an optimum weightof coating that might be selected on the basis ofthese data might be excessive in some specificenvironment but insufficient in others. In table 5are shown the depths of the deepest pits on thespecimens exposed in the earlier series of tests fl],from which can be determined the minimum weightof coating required to protect steel for 10 yr inspecific soil environments. Data for the specimensburied in 1937 are also included in the table.
305
It will be observed that in the group of oxidizing,inorganic soils, pitting occurred on the specimenshaving a weight of coating of 1.07 oz/ft2 or less,but no pits developed on the specimens having acoating of 1.81 oz/ft2. Hence it is reasonable toconclude that a nominal 2-oz coating is probablyadequate for oxidizing soils for at least 10 yr. A3-oz coating would provide adequate protection inthe group of reducing inorganic soils except forhighly reducing soils high in soluble salts, for example,51 and 56. These latter soils and the group of re-ducing organic soils and cinders would require acoating in excess of 3 oz/ft2.
8. Summary
This report contains the results of measurementsof corrosion made on specimens of galvanized steel,bare steel and zinc exposed to different soil conditionsfor periods up to 13 yr. The nominal weight of thezinc coating was 3 oz/ft2, but the actual thicknessvaried over a wide range. In approximately one-halfof the 15 soils to which the specimens were exposed,the coating on the galvanized specimens remainedvirtually intact throughout the entire duration of thefield test. The galvanized specimens were especiallyresistant to corrosion in alkaline soils that were highlycorrosive to bare steel. In only two soils, bothorganic, failure of the zinc coating after relativelyshort exposures was accompanied by marked corro-sion of the steel. The high corrosion resistanceshown by most of the galvanized specimens after the
outer zinc coating had been virtually removed bycorrosion is tentatively attributed to a film or coat-ing, probably silicious in nature, that was depositedcathodically by galvanic action between the outerzinc coating and the alloy layer or the underlyingsteel.
The results of these tests show that the minimumweight of zinc coating required to protect steel fromcorrosion for a minimum of 10 yr depends on thenature of the soil environment. In these exposuretests, a 2-oz coating was sufficient to protect steel ininorganic oxidizing soils, but for inorganic moderatelyreducing soils a 3-oz coating was required. Highlyreducing, inorganic and organic soils require coatingsin excess of 3 oz/ft2.
The field tests described were initiated and in-stalled, and until 1946 were conducted under thesupervision of K. H. Logan.
9. References[1] Kirk H. Logan and Scott P. Ewing, J. Research NBS 18,
361 (1937) RP 982.[2] Kirk H. Logan, NBS Circular C450 (1945).3] A. Brenner, J. Research NBS 20, 357 (1938) RP1081.A] S. C. Britton, J. Inst. Metals 58, 211 (1936).5] Stanley Anderson and R. W. Manuel, Trans. Electrochem.
Soc. 78, 373 (1940).[6] William Blum and Abner Brenner, Corrosion Handbook,
p. 814. John Wiley & Sons, Inc., New York 1, N. Y.(1948).
306
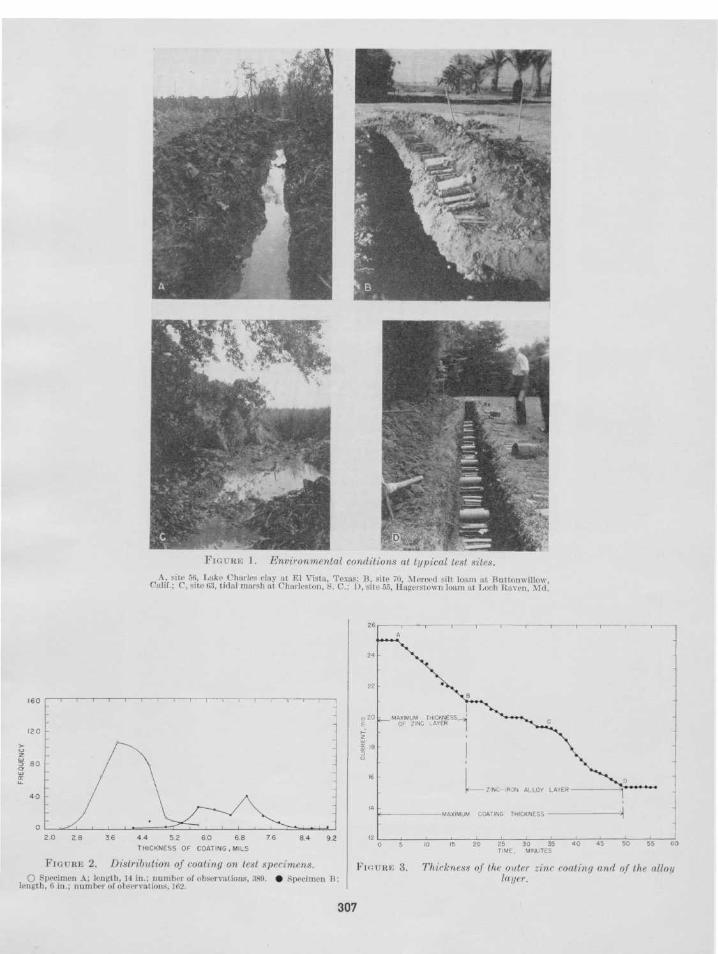
FIGURE 1. Environmental conditions at typical test sites.
A, site 56, Lake Charles clay at El Vista, Texas; B, site 70, Merced silt loam at ButtonwillowCalif.; C, site 63, tidal marsh at Charleston, S. C ; D, site 55, Hagerstown loam at Loch Raven, Md.
2.0 2.8 36 4.4 5.2 6.0 68 76 8.4 9.2THICKNESS OF COATING , MILS
FIGURE 2. Distribution of coating on test specimens.O Specimen A; length, 14 in.; number of observations, 389. • Specimen B;
length, 6 in.; number of observations. lf>2.
20 25 30 35 40 45 50 55 60
FIGURE 3. Thickness of the older zinc coating and of the alloylayer.
307
BARE STEEL
GALVANIZED STEEL
ZINC
• . ,
SOIL 53 55 56 58 59 60 6!FIGURE 4. Condition of specimens of bare steel, galvanized steel, and zinc after exposure for 13 yr to 14 soils.
308
BARE STEEL
GALVANIZED STEEL
'"/ ' -ZINC
I SOIL 62 63 64 65 66 67 70FIGURE 4. Condition of specimens of bare steel, galvanized steel, and zinc after exposure for 13 yr to 14 soils.—Continued
309
INORGANIC OXIDIZING SOILS120
4 6 8 10 12 14 0 2 4 6 8 10 12 14TIME, YEARS
FIGURE 5. Weight-loss and maximum-penetration-time curves of galvanized steel, bare steel, and zinc.
• Bare steel, O zinc, 3 Galvanized steel.
310
INORGANIC OXIDIZING SOILS
20 -
I I I I
INORGANIC REDUCING SOILS (FAIR TO POOR AERATION)8 0
I I I I I I
SOIL 6 4
I I I I
30
20
10
0
1 1 1
SOIL 70
-
-
M "
^ ^ g f f Q " ^ " " ^
1 1 1
-
- 120
8 0
4 0
0
1 1
-
\ 1 3 r 9 i
0 2 4 6 8 10 12 14 0 2 4 6 8 10 12 14TIME, YEARS
FIGURE 5. Weight-loss and maximum-penetration-time curves of galvanized steel, bare steely and zinc—Continued# Bare steel, O zinc, 3 Galvanized steel.
223977—52 3 311
INORGANIC REDUCING SOILS (VERY POOR AERATION)160
30
20
10
0
7 '/ SOIL
/
- / /
1
67
i
I
y
i
i i
-
-
AI I
6 8
40 -
10 12 1410 12 14 0 2
TIME, YEARS
FIGURE 5. Weight-loss and maximum-penetration—time curves of galvanized steely bare steel, and zinc—Continued
# Bare steel, O zinc, 3 galvanized steel.
312
20 -
10 -
ORGANIC REDUCING SOILS
80
T V
30
20
10
0
I
SOIL
-
-
1 1 1 1 1
6 0
-
i i i i i
40 -
4 4 6 8 10 12 146 8 10 12 14 0 2TIME, YEARS
FIGURE 5. Weight-loss and maximum-penetration-time curves of galvanized steel, bare steel, and zinc—Continued
# Bare steel, O zinc, 3 galvanized steel.
313
WEIGHT OF COATING, OZ/ f t
FIGURE 6. Correlation between maximum penetration andweight of coating on galvanized pipe and sheet exposed 10 yrin 6 soils.
(Data of Logan and Ewing.)
WASHINGTON, August 18, 1952.
314


![Corrosion of Galvanized Steel Under Different Soil ... · The Brazilian standard NBR 6323 [17] recommends 74 µm as a minimum thickness for hot dip galvanized coating. However, in](https://img.pdfslide.us/doc/110x75/5c47656409d3f2134d8b4df3/corrosion-of-galvanized-steel-under-different-soil-the-brazilian-standard.jpg)