Embed Size (px)
Citation preview

Corrosion Science xxx (2014) xxx–xxx
Contents lists available at ScienceDirect
Corrosion Science
journal homepage: www.elsevier .com/ locate /corsc i
Corrosion of copper and steel alloys in a simulated undergroundstorage-tank sump environment containing acid-producing bacteria q
http://dx.doi.org/10.1016/j.corsci.2014.07.0090010-938X/Published by Elsevier Ltd.
q Contribution of NIST, an agency of the U.S. government. Not subject tocopyright.⇑ Corresponding author. Tel.: +1 303 497 7960.
E-mail address: [email protected] (J.W. Sowards).
Please cite this article in press as: J.W. Sowards, E. Mansfield, Corrosion of copper and steel alloys in a simulated underground storage-tank sumronment containing acid-producing bacteria, Corros. Sci. (2014), http://dx.doi.org/10.1016/j.corsci.2014.07.009
Jeffrey W. Sowards ⇑, Elisabeth MansfieldApplied Chemicals and Materials Division, National Institute of Standards and Technology, 325 Broadway, Boulder, CO 80305, USA
a r t i c l e i n f o
Article history:Received 7 January 2014Accepted 7 July 2014Available online xxxx
Keywords:C. Atmospheric corrosionA. Carbon steelA. CopperC. Microbiological corrosionB. Weight loss
a b s t r a c t
We simulate corrosion observed in underground fuel storage tank systems by headspace and aqueousexposure to biotic organic acid. Carbon steel and copper were exposed to Acetobacter sp. inoculated intoaqueous-ethanol solutions over a period of approximately 30 days. The steel alloy exhibited pittingcorrosion and the copper alloy exhibited pitting and intergranular corrosion due to acetic acid producedby the microbes. Corrosion rates were dependent on formation of corrosion products and are ranked asfollows in order of increasing magnitude: Copper-aqueous < Steel-aqueous < Copper-headspace < Steel-headspace. The laboratory test method developed here reproduces corrosion observed in practice.
Published by Elsevier Ltd.
1. Introduction
Production and consumption rates of ethanol, biodiesel fuel,and other alternative fuels are projected to increase significantlyin the U.S. in the coming years [1]. Usage of ethanol as an additiveto gasoline is already quite high. In as recently as 2010, over 90% ofthe gasoline sold in the U.S. was reportedly blended with ethanol[2]. However, much of the current fuel infrastructure was designedfor unblended gasoline, and there is growing concern that some ofthe materials used in the past may not be compatible with theemerging blended fuels [3,4]. One of the main concerns regardingmaterial incompatibility is the potential for corrosion of fuelstorage and dispensing infrastructure, which may result in leakageof fuels and subsequent pollution of the ground water supplyrequiring expensive clean-up and mitigation.
Since as early as 2008, inspectors in nine different U.S. stateshave reported an increasing number of incidents where under-ground storage tank (UST) components exhibited sudden and rapidcorrosion [5]. The UST components that exhibited unexpected cor-rosion included sump pumps, submersible turbine pumps, risers,and ventilation pipes. Measurements of headspace chemistryrevealed that high ethanol–vapor concentrations were associatedwith the corrosion, although the occurrence of corrosion was notexclusive to storage scenarios involving ethanol-blended gasoline
fuels. The presence of acetic acid (measured in the form of acetate)and microbiological activity in the sump–pump environments wasnoted where corrosion occurred. Rapid corrosion of USTcomponents associated with handling and dispensing of ultra-low-sulfur diesel (ULSD) fuels has also occurred [6]. In fuel storagescenarios involving ULSD, ethanol contamination was observed atmany of the UST test sites [6]. The U.S. Environmental ProtectionAgency analyzed UST sump waters and vapors from many loca-tions across the U.S., finding that high acetate concentrations(>1000 mg L�1) were associated with the presence of ethanol in avariety of ethanol-blended gasoline and other fuels [7]. The levelsof acetate were correlated to rust tubercles on steel and blue cor-rosion product on copper [7]. Analysis of all the UST componentsrevealed the presence of acetic acid-producing bacteria (e.g., Aceto-bacter sp.) [5–7], a class of common microorganism that convertsethanol to acetic acid. These microorganisms likely caused or con-tributed to the accelerated corrosion [5–7] and were even identi-fied as the predominant microbes found in the ULSD fuelsystems [6].
Microbiologically-influenced corrosion (MIC) and microbialcontamination have been associated with the usage and distribu-tion of various liquid fuels for many years [8,9] and thus are notnew problems in fuel-handling and dispensing scenarios. Withrespect to ethanol fuel in particular, industrial storage tanks havereportedly sustained microbial life including acid-producing bacte-ria (APB) and sulfate-reducing bacteria (SRB) [10]. APB, includingAcetobacter sp., secrete organic acids during the fermentation oforganic compounds, and are known to influence corrosion of met-als [11]. Acetobacter sp. in particular, oxidize ethanol during the
p envi-

2 J.W. Sowards, E. Mansfield / Corrosion Science xxx (2014) xxx–xxx
fermentation process, resulting in acetic-acid production accordingto the following reaction:
C2H5OHþ O2 ! CH3CO2HþH2O: ð1ÞAPB have been shown to promote localized corrosion of steels at
inclusion sites where the observed corrosion damage exhibits adistinct appearance from corrosion produced by a protic acid ofthe same pH [12]. Acetic acid is known to corrode metals whilein its vapor form and when dissolved in an aqueous solution. Bioticacetic acid vapor that emanated from wood samples was shown toinfluence corrosion of copper, lead, and brass coupons [13]; how-ever, most corrosion experiments to-date have considered aceticacid from abiotic sources. Abiotic acetic acid vapor has been shownto promote the corrosion of copper [14] and mild steel [15,16],which are two metallic materials used in mechanical componentsexposed to fuel vapors and aqueous phases contained in UST sumpsystems. The corrosion rate of mild steel exposed to aqueous mix-tures of acetic acid was found to be quite high, and exhibiteddependence on acid concentration, temperature, and the periodof exposure [17]. The rate of copper corrosion exposed to aqueousacetic acid solutions was shown to be dependent on acid concen-tration [18], and was strongly influenced by relative humiditywhen exposed to acetic acid vapor [19].
This work reports on a corrosion evaluation study performedwith a new testing methodology developed to simulate the MICobserved in UST systems. A headspace testing chamber wasdesigned so that corrosion of sump–pump component alloys couldbe evaluated during exposure to ethanol and acetic-acid vaporcomponents. Acetobacter aceti were used here to generate aceticacid in a simulated ethanol fuel environment to confirm that MICis a plausible mechanism for the corrosion seen on UST sump–pump components. The biotic source of acetic acid is critical sinceabiotic substitutes might not replicate corrosion induced bymicrobes [12]. The use of A. aceti also provides information on bio-logical properties (e.g., bacterial attachment) that would not beachieved with the addition of acetic acid solution alone. This test,while it did not incorporate blended fuels (e.g., E15, E85), couldprove useful in evaluating MIC in fuel samples collected from fieldstudies, including non-ethanol blended fuels. Furthermore, the testmethod could prove useful in investigating the growing number ofmicrobes in fuels and crude oils that may be contributing to biode-terioration of fuels and fuel infrastructure [20,21].
2. Materials and methods
2.1. Materials
Two rod alloys (19.05 mm diameter) were obtained for thisstudy from a commercial vendor, including a Type 1018 cold-drawn steel rod conforming to ASTM A108 specifications [22]and an Alloy 110 (H04 hard temper) copper rod conforming toASTM B187 specifications [23]. Chemical compositions of bothmaterials are reported in Table 1. Metal rods were saw-cut intodisk-shaped coupons with a thickness of approximately 2.8 mmfor corrosion tests.
2.2. Bacterial growth
Environmental isolates of A. aceti were cultivated from a fuelingterminal tank [24]; samples were identified by 16S rRNA gene
Table 1Chemical composition limits of 1018 steel and copper alloy 110 (wt.%).
Alloy Fe C Si Mn Cu
1018 Bal. 0.16 0.15 0.79 –110 – – – – Bal.
Please cite this article in press as: J.W. Sowards, E. Mansfield, Corrosion of copronment containing acid-producing bacteria, Corros. Sci. (2014), http://dx.doi.o
sequencing. A. aceti were maintained in a medium containing yeastextract (0.5 g L�1), peptone (0.3 g L�1), and sodium chloride(1 g L�1) in distilled water [25] at pH 6. Ethanol (5% by volume)was added as a carbon source. A concentrated Acetobacter culturewas established by growing the bacteria in 100 mL of culturemedia for 1 week. This established culture, which is in a stationaryphase, was diluted for headspace experiments.
2.3. Preparation of headspace chambers
Saw-cut coupons were prepared according to ASTM G-1 Stan-dard Practice for Preparing, Cleaning, and Evaluating CorrosionTest Specimens [26]. Coupons were progressively ground to a600 grit finish with SiC paper immediately prior to testing, thendegreased in acetone, then ethanol, and dried under flowing nitro-gen gas. Coupons were weighed with a precision digital balance tothe nearest 0.1 mg, then mounted in PTFE corrosion fixtures withpolyethylene screws. Polymers were used for all coupon fixturesto prevent galvanic interactions. The fixtures were in turn placedin polyethylene test chambers as shown in Fig. 1. Fig. 1a and bshows the coupon placement during headspace exposure. All testchamber components were sterilized in an autoclave prior to cor-rosion tests. Fig. 1c shows the coupon placement during aqueousexposure; three coupons were placed in each test chamber, as indi-cated. Three chambers were loaded with coupons (3 coupons ineach chamber, 9 total) during the headspace tests, and a singlechamber (containing 3 coupons) was loaded during aqueous expo-sure tests. After coupons were secured in each chamber, 225 mL ofgrowth media was poured into the bottom of each headspacechamber. An additional 25 mL of established A. aceti culture waspipetted into the growth media solution after lids were securedon chamber tops. The aqueous exposure chamber contained450 mL of growth media inoculated with 50 mL of A. aceti cultureto maintain an adequate solution volume-to-surface-area ratiosuggested by the standard test method [27].
2.4. Sample collection
Acidity and solution optical density (proportional to cell con-centration) were monitored periodically through the duration ofthe test by extracting test solution through a pipette after agitatingthe tank to ensure even distribution of the cultured cells. Uncer-tainty in pH measurements was ±0.03 pH units (1 s.d.) and opticaldensity uncertainty was ±1 � 10�3 absorbance units for all mea-surements reported here. Optical density was measured with aUV–VIS spectrometer set at 600 nm wavelength. Growth mediasolution was replenished every two to three days by replacingthe solution volume (typically 10 mL) extracted for pH and opticaldensity measurements.
One coupon was collected from each headspace chamber attime points selected based on pH and absorbance readings (dis-cussed below). The copper coupons were collected at 292 h,550 h, and 863 h from the time of test initiation and the steel cou-pons were collected at 355 h, 643 h, and 932 h from the time of testinitiation. All three coupons were pulled simultaneously from theaqueous exposure test chamber after 863 h (copper) and 932 h(steel) exposure time. The coupon mass was determined while cor-rosion product was still intact to determine mass gain due to filmformation. Corrosion product was then removed according to
Pb Bi O S P
– – – <0.05 <0.04<0.005 <0.005 <0.04 – –
per and steel alloys in a simulated underground storage-tank sump envi-rg/10.1016/j.corsci.2014.07.009

Inoculated Test Solution
Pipette
CouponFixture
QCMFixture
Tank(1 L)
250 mL
(a)
CouponFixture500 mL
Pipette
Tank(1 L)
Inoculated Test Solution
(c)(b)
TestCoupon
View looking UP from Tank Bottom
Coated QCM
diameter = 19 mmthickness = 2.8 mm
Fig. 1. Corrosion test chambers for headspace exposure testing shown from side view (a) and bottom view (b). Test chamber for aqueous exposure testing is shown in (c).
J.W. Sowards, E. Mansfield / Corrosion Science xxx (2014) xxx–xxx 3
ASTM G1 and the coupons were weighed again to determine totalmass loss. Coupons were dried and stored in a desiccator for met-allurgical analysis with standard techniques for optical microscopyand scanning electron microscopy (SEM). The corrosion rate wasdetermined with gravimetric analysis according to ASTM G31Standard Practice for Laboratory Immersion Corrosion Testing ofMetals [27]. Corrosion rates reported here are average values ofthose determined with three specimens tested at each condition.
2.5. Quartz crystal microbalances
Quartz-crystal microbalances (QCMs) were obtained withcoatings of 400 nm of iron on a 5 MHz QCM. QCMs were mountedin a crystal holder. The instrument was used to measure the funda-mental frequency of the QCM in the headspace over time. This fre-quency was monitored until failure (due to acid corrosion). TheSauerbrey equation [28] was used to calculate mass of the ironfilm. This loss of mass over time to failure was used to calculatea corrosion rate.
2.6. Coupon characterization
Corrosion product scraped from the coupons was evaluatedusing thermogravimetric analysis (TGA), X-ray diffraction (XRD),optical microscopy and SEM. Dried corrosion product was groundto a fine powder with a mortar and pestle for both TGA and XRD.TGA samples (approximately 5 mg) were analyzed by heating thesamples in alumina crucibles at a rate of 10 �C min�1 to 1000 �Cin a 20 mL min�1 flowing-air environment. Corrosion product pow-der (approximately 1 mg) was mounted to glass slides by use ofdouble-stick tape for XRD. XRD spectra were obtained by use of aCu Ka source with a monochromator and 2h goniometer arrange-ment. Scans were stepped from 20� to 90� at a step interval of0.04� and dwell time of 30 s at each interval. SEM imaging andenergy-dispersive spectroscopy (EDS) were performed at 10 and15 kV accelerating voltage. Coupon and QCM surfaces were imagedon a low-power optical microscope at 7� to 30� magnification.Localized corrosion was evaluated by measuring pit depths onSEM micrographs with calibrated digital image analysis softwarefollowing standard techniques for pitting analysis [29].
2.7. Calculation of headspace acid concentration
Concentration of acetic acid in the solution and the headspaceduring corrosion tests were approximated with the solution
Please cite this article in press as: J.W. Sowards, E. Mansfield, Corrosion of copronment containing acid-producing bacteria, Corros. Sci. (2014), http://dx.doi.o
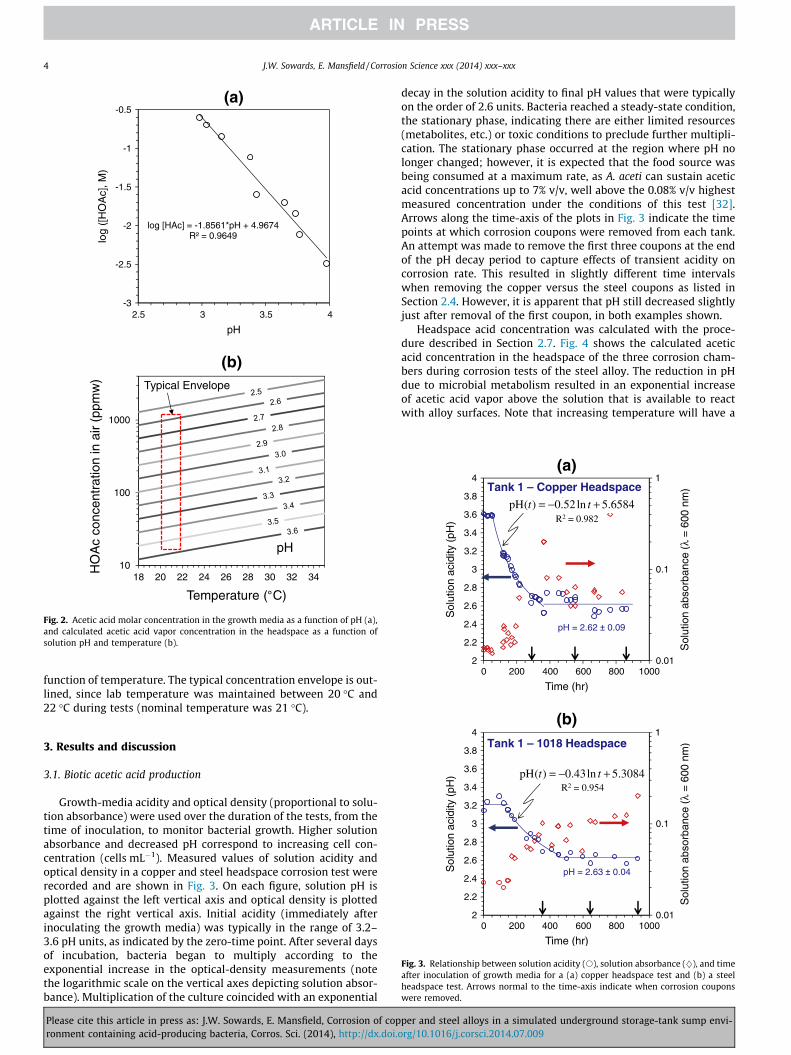
acidity, which was determined by submerging a pH probe intopipetted samples. Acetic acid is a weak acid, which does not com-pletely dissociate in water (pKa = 4.76) or water–ethanol mixtures.Also, growth medium was present; therefore, development of acalibration curve was necessary to determine the relationshipbetween pH and acetic-acid concentration. Reagent-grade aceticacid was mixed at known concentrations into sterile growth-mediasolution in the presence of 5% ethanol to determine the pH valuesas shown in Fig. 2a. A linear fit was used to correlate aqueous con-centration of acetic acid and the measured pH.
There is proportionality between the acetic acid concentrationin the growth media and the concentration of acetic acid in theheadspace. Acetic acid is assumed to be a solvent in the growth-media solution, and is assumed to have a concentration abovethe solution that is dependent on its partial pressure. Acetic acidvapor pressure, P0, is dependent on temperature, T, and obeys Eq.(2) [30,31]:
log P0 ¼ 4:68206� 164;254�39:764þ T
; ð2Þ
where vapor pressure is in bar and temperature in K. We assumethat evaporation of acetic acid (HOAc) obeys Raoult’s Law [14],where its partial pressure, PHOAc is proportional to its mole fractionin solution, vHOAc according to:
PHOAc ¼ vHOAc � P0; ð3Þ
where vapor pressure, P0 is described by Eq. (2).The concentration of acetic acid in the growth media solution is
determined with the empirical relationship developed in Fig. 2a,and is described by Eq. (4):
log½HOAc� ¼ �1:8561 � pHþ 4:9674: ð4Þ
As an estimate, we assume that the headspace is a mixture ofideal gases and that the concentration of acetic acid (xHOAc) in partsper million by mass is described by Eq. (5):
xHOAc ¼ 106 PHOAc �MWHOAc
Pair �MWair; ð5Þ
where Pair is 0.867 bar (typical pressure at 1655 m elevation inBoulder, CO) and the molecular weights of acetic acid and air are60.05 g mol�1 and 28.966 g mol�1, respectively.
Combining Eqs. (2)–(5) results in a relationship that describesacetic acid concentration in the headspace as a function of bothtemperature and pH. Fig. 2b shows a plot of the calculatedconcentration for constant pH values (between 2.5 and 3.6) as a
per and steel alloys in a simulated underground storage-tank sump envi-rg/10.1016/j.corsci.2014.07.009
log [HAc] = -1.8561*pH + 4.9674R² = 0.9649
-3
-2.5
-2
-1.5
-1
-0.5
2.5 3 3.5 4
log
([H
OA
c], M
)
pH
(a)
10
100
1000
18 20 22 24 26 28 30 32 34
HO
Ac
conc
entr
atio
n in
air
(ppm
w)
Temperature (°C)
(b)Typical Envelope
pH
Fig. 2. Acetic acid molar concentration in the growth media as a function of pH (a),and calculated acetic acid vapor concentration in the headspace as a function ofsolution pH and temperature (b).
(a)
4 J.W. Sowards, E. Mansfield / Corrosion Science xxx (2014) xxx–xxx
function of temperature. The typical concentration envelope is out-lined, since lab temperature was maintained between 20 �C and22 �C during tests (nominal temperature was 21 �C).
(b)
Fig. 3. Relationship between solution acidity (s), solution absorbance (}), and timeafter inoculation of growth media for a (a) copper headspace test and (b) a steelheadspace test. Arrows normal to the time-axis indicate when corrosion couponswere removed.
3. Results and discussion
3.1. Biotic acetic acid production
Growth-media acidity and optical density (proportional to solu-tion absorbance) were used over the duration of the tests, from thetime of inoculation, to monitor bacterial growth. Higher solutionabsorbance and decreased pH correspond to increasing cell con-centration (cells mL�1). Measured values of solution acidity andoptical density in a copper and steel headspace corrosion test wererecorded and are shown in Fig. 3. On each figure, solution pH isplotted against the left vertical axis and optical density is plottedagainst the right vertical axis. Initial acidity (immediately afterinoculating the growth media) was typically in the range of 3.2–3.6 pH units, as indicated by the zero-time point. After several daysof incubation, bacteria began to multiply according to theexponential increase in the optical-density measurements (notethe logarithmic scale on the vertical axes depicting solution absor-bance). Multiplication of the culture coincided with an exponential
Please cite this article in press as: J.W. Sowards, E. Mansfield, Corrosion of copronment containing acid-producing bacteria, Corros. Sci. (2014), http://dx.doi.o
decay in the solution acidity to final pH values that were typicallyon the order of 2.6 units. Bacteria reached a steady-state condition,the stationary phase, indicating there are either limited resources(metabolites, etc.) or toxic conditions to preclude further multipli-cation. The stationary phase occurred at the region where pH nolonger changed; however, it is expected that the food source wasbeing consumed at a maximum rate, as A. aceti can sustain aceticacid concentrations up to 7% v/v, well above the 0.08% v/v highestmeasured concentration under the conditions of this test [32].Arrows along the time-axis of the plots in Fig. 3 indicate the timepoints at which corrosion coupons were removed from each tank.An attempt was made to remove the first three coupons at the endof the pH decay period to capture effects of transient acidity oncorrosion rate. This resulted in slightly different time intervalswhen removing the copper versus the steel coupons as listed inSection 2.4. However, it is apparent that pH still decreased slightlyjust after removal of the first coupon, in both examples shown.
Headspace acid concentration was calculated with the proce-dure described in Section 2.7. Fig. 4 shows the calculated aceticacid concentration in the headspace of the three corrosion cham-bers during corrosion tests of the steel alloy. The reduction in pHdue to microbial metabolism resulted in an exponential increaseof acetic acid vapor above the solution that is available to reactwith alloy surfaces. Note that increasing temperature will have a
per and steel alloys in a simulated underground storage-tank sump envi-rg/10.1016/j.corsci.2014.07.009

0
0.01
0.02
0.03
0.04
0.05
0.06
0.07
0.08
0.09
0.1
0 200 400 600 800 1000
Cor
rosi
on R
ate
(mm
/y)
Exposure period (hr)
(a) Copper
031.00086.0)(R tt ⋅=R2 = 0.998
0.4
0.6
0.8
1
1.2
osio
n R
ate
(mm
/y)
(b) Steel
308.0128.0)(R tt ⋅=R2 = 0.999
J.W. Sowards, E. Mansfield / Corrosion Science xxx (2014) xxx–xxx 5
significant effect on evaporation of acetic acid (Fig. 2b), in additionto its potential to increase bacteria activity. Therefore, it isexpected that higher temperatures would promote significantincreases in headspace acetic acid concentration, although notunder the relatively isothermal conditions within the testconditions reported here. The chambers were kept at an ambienttemperature of 21 ± 1 �C, which was used in Eq. (2).
The headspace acetic acid concentration calculations were per-formed for the copper corrosion tests (although not shown), andthey exhibited similar trends and reproducibility to that of thesteel tests. This is not surprising since the same chambers wereused for both series of tests. Variability in the headspace composi-tion between the three test chambers used for corrosion testing isdemonstrated by the average values and error bars (showing stan-dard deviation) plotted against the secondary vertical axis of Fig. 4.Calculated headspace concentration typically varied 20–30%among the three tanks. This is caused by the variation in pH ofthe test solution which is used as a primary input for thecalculation.
The solution containing immersed copper coupons had variablepH levels within the range of 3.2–3.6 over test duration. These val-ues correspond to acetic acid concentrations of 0.11 M and 0.02 M,respectively according to Eq. (4). The solution containingimmersed steel coupons decayed from pH levels of 3.2–2.65 overthe duration of the test, corresponding to an acetic acid concentra-tion increase from 0.11 M to 1.39 M.
0
0.2
0 200 400 600 800 1000
Cor
r
Exposure period (hr)
Fe Thin Film Depositedon QCM
Fig. 5. Relationship between exposure period in the headspace environment andthe corrosion rates of (a) copper and (b) steel determined with the gravimetric andQCM methods.
3.2. Gravimetric analyses
3.2.1. Headspace couponsThe corrosion rates (mm year�1) of the copper and steel
exposed to vapor phase in the headspace were determined withgravimetric analysis and are reported in Fig. 5. Bacteria inoculationwas performed at the zero-time point. Since three test chamberswere inoculated simultaneously during testing of both alloys, eachdata point represents the average corrosion rate of three coupons(one pulled from each of the three test chambers) at each timepoint. Standard deviations of each corrosion rate data-set are indi-cated with error bars. The corrosion rate of the copper, which ini-tially increased rapidly, reached a maximum value ofapproximately 0.06 mm year�1 half way through the exposure per-iod (Fig. 5a). Corrosion rates of the steel, which were an order ofmagnitude higher than those determined for copper, also increasedrapidly near the beginning of the test, compared to the end, whererates exceeded 1 mm year�1 (Fig. 5b).
0
200
400
600
800
1,000
1,200
1,400
1,600
1,800
2,000
10
100
1,000
0 200 400 600 800 1000
Ave
rage
HO
Ac
conc
entr
atio
n (p
pmw
)
HO
Ac
conc
entr
atio
n (p
pmw
)
Exposure Period (hr)
Tank 1 Tank 2
Tank 3 Average
T = 21 °C
Fig. 4. Calculated acetic acid concentration as a function of time in the test chamberheadspace during steel coupon exposure.
Please cite this article in press as: J.W. Sowards, E. Mansfield, Corrosion of copronment containing acid-producing bacteria, Corros. Sci. (2014), http://dx.doi.o
Two of the test chambers produced similar corrosion-rate data,while the third chamber produced significantly lower corrosionrates during the first half of the copper corrosion tests. Thisresulted in the large standard deviation in measured copper corro-sion rates shown in Fig. 5a. Variability in headspace concentrationbetween the tanks was demonstrated in Fig. 4 with calculations.The particular chamber that produced lower corrosion had fewerportals for sampling and pipetting, which potentially reduced oxy-gen concentrations in that particular tank and could potentiallyhave led to slower bacteria metabolism of the aerobic A. aceti.The particular chamber also exhibited lower optical density mea-surements in comparison to the other two tanks resulting inslightly lower acidity in the growth-media solution. Note thatwhen corrosion rate was higher in the case of the carbon steel,the sensitivity to this variability in metabolism was significantlyreduced.
The plots of headspace corrosion rate show a parabolic relation-ship between corrosion rate and exposure period, which is a char-acteristic typically observed in atmospheric corrosion of carbonsteels and copper alloys [33]. An empirical relationship betweenthe corrosion rate, R, initial corrosion rate, A, and exposure time,t is given by Eq. (6):
R ¼ A � tn; ð6Þ
where the exponent n describes the ability of corrosion productsformed on the alloy surface to protect against corrosion. This modelhas been fitted to the experimental data as indicated in Fig. 5, wherethe fitted equations show a high coefficient of determination (R2) inboth cases, indicating good fit. It has been suggested [33] that whenthe n-values are below 0.6, the corrosion product possesses
per and steel alloys in a simulated underground storage-tank sump envi-rg/10.1016/j.corsci.2014.07.009

6 J.W. Sowards, E. Mansfield / Corrosion Science xxx (2014) xxx–xxx
protective ability, whereas as n-values approach unity, the film pro-vides little protective ability. The fitted models in Fig. 5 demon-strated that the protectiveness of the copper corrosion product(n = 0.031) is an order of magnitude higher than that formed onthe surface of the steel (n = 0.308), which is expected, given thehigher corrosion rates produced on the steel. This has importantpractical implications regarding corrosion of sump componentsobserved in field inspections. Removal of corrosion product wouldlikely be detrimental to corrosion rate even though its visualappearance may be quite undesirable to inspectors or operators.
Corrosion rates of copper [14] and steel [16] are both dependenton abiotic acetic-acid content in the vapor phase. Copper corrosionrate, as a function of acetic-acid vapor content, increases sharplywith concentration until the vapor content reaches saturation atapproximately 150 ppm; further increases are not appreciableabove �200 ppm [14]. Bacteria within the test chambers herelikely produce acetic-acid vapor concentrations (�900 ppm atpH = 2.6) well above the levels previously demonstrated to achievethe saturated corrosion rates of copper, at least after the initialdecay in pH. Steel corrosion rate depends strongly on acetic-acidcontent, even at concentrations up to 300 ppm, and exhibits nosuch saturated corrosion rate at a given concentration of acetic acid[16] as seen in studies of copper corrosion. Since corrosion rate hasshown dependence on acid concentration, future parametric stud-ies evaluating headspace concentration and temperature wouldenable more robust corrosion models of the alloys studied here.
3.2.2. Quartz crystal microbalanceQuartz-crystal microbalances were used to establish corrosion
rates on a shorter time scale than those used in the coupon test,i.e., they were used to evaluate initial transient mass change. Theselow initial corrosion rates are indicative of exposure to the 8 h cul-ture, which has been grown in an ethanol-containing environmentand already contains dilute acetic acid. An iron-coated QCM wassuspended in the headspace at approximately the same height asthe coupons. Corrosion of the iron film was monitored as a changein frequency. After approximately 8 h, the 400 nm iron film wasdegraded and signal quality was diminished. A corrosion ratewas determined for these first 8 h by calculating the change inmass from the change in frequency, f using the Sauerbrey equation(briefly, Df = constant * Dmass) for the given mass of iron over theactive area of the QCM. The corrosion rate (0.092 mm year�1) wasplotted in Fig. 5b and used in the data fitting for steel as an initialcorrosion rate.
3.2.3. Immersed couponsSteel and copper coupons were submerged into freshly inocu-
lated ethanol growth media in a fourth tank. Gravimetric analysisrevealed corrosion rates of 0.051 ± 0.010 mm year�1 (863 h expo-sure) and 0.061 ± 0.003 mm year�1 (932 h exposure) on the copperand steel, respectively. The corrosion rate of the copper immersedin solution is on the order of that observed in the headspace,whereas the corrosion rate of steel was significantly lower whenimmersed as compared to vapor-phase exposure. Given the simi-larity in corrosion rates of copper exposed to aqueous and vaporphases, the vapor phase corrosion is controlled by continuouslayers of condensed acetic acid available for surface reaction.
Carbon-steel corrosion rates were determined in abiotic acetic-acid solutions with concentrations similar to those studied here[34]. The steel corrosion rates previously reported (approximately1.2–1.8 mm year�1 [34]) are much higher than observed herewhen steel was immersed in the biotic acetic acid. Such low corro-sion rates reported in the current work are indeed surprising sincethe solution pH reaches levels of approximately 2.65. In general,corrosion rate of steel increases significantly below pH levels of
Please cite this article in press as: J.W. Sowards, E. Mansfield, Corrosion of copronment containing acid-producing bacteria, Corros. Sci. (2014), http://dx.doi.o
approximately 4 under aerated conditions, due to availability ofsufficient H+ for reduction by [35]:
2Hþ þ 2e� ! H2; ð7Þ
or by
O2 þ 4Hþ þ 4e� ! 2H2O; ð8Þ
in the presence of dissolved oxygen.During post-test coupon analysis in this study, A. aceti biofilms
were observed on the surface of carbon steel exposed to the aque-ous environment. It is likely that anoxic conditions were producedat the interface of the biofilm and the steel coupon as the Acetobac-ter colony thickened, precluding Reaction (8). Low corrosion ratesof steel observed here could thus likely be attributed to the protec-tive nature of the biofilm in the inoculated growth media as aresult of aerobic consumption of molecular oxygen [36] and itscapacity to serve as a corrosion reactant at the steel surface. Alter-natively, the biofilm coverage may preclude the adsorption of ace-tate ions on the steel surface, which is a necessary step in theformation of cathodic hydrogen for Reaction (7) to commence[34]. Test media used for maintaining a bacteria culture can influ-ence microbial binding and may accelerate corrosion reactions[37]. A combination of all of these potential contributions is likely.
Copper, having an antimicrobial effect [38], did not exhibit thesame protective biofilm observed visually on the steel coupons. Inthe chamber used for the copper immersion tests, the microbe-containing solution had a distinct blue color (due presumably toformation of copper acetate), and a biofilm suspended in the solu-tion had distinct morphology. During steel corrosion testing, A.aceti formed clumpy films within the solution, but formed a thinsurface film on the water–air interface in the chamber containingcopper coupons. No significant clumps were observed in the solu-tion and no biofilm was observed on the surfaces of the coppercoupons.
3.3. Corrosion product analyses
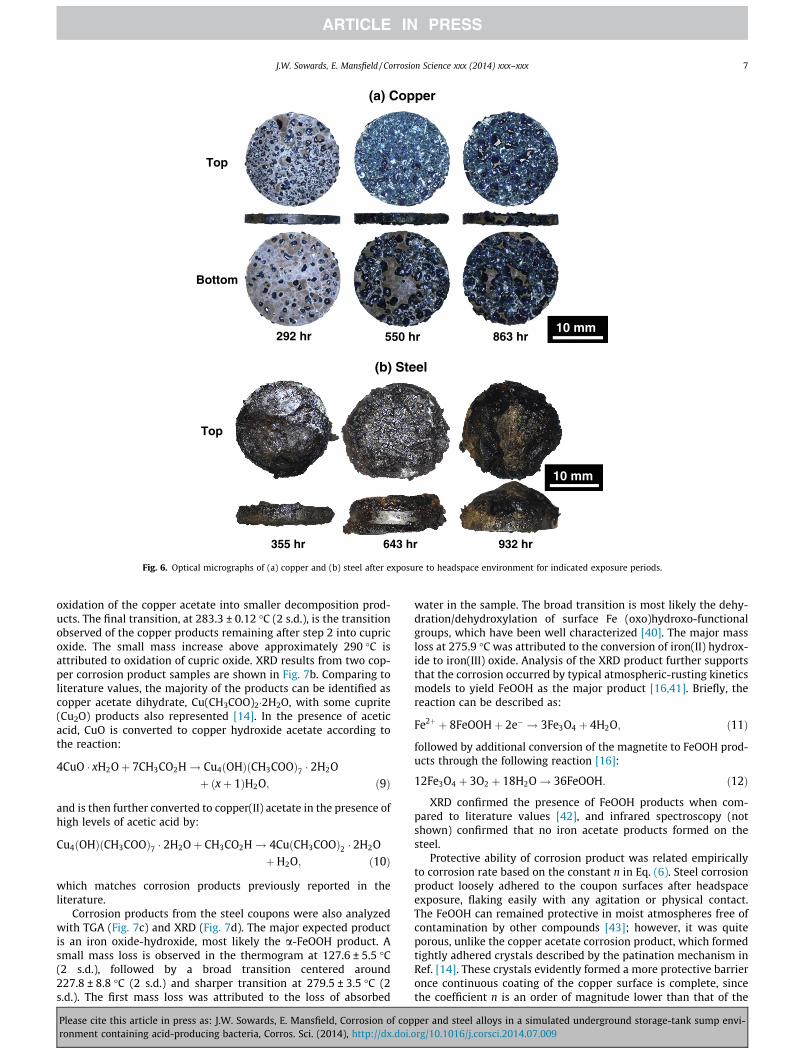
The typical appearance of the copper and steel coupons afterremoval from the headspace chambers are shown in Fig. 6a andb, respectively. Note the different exposure times. Blue corrosionproduct spread over the entire surface of the copper with increas-ing exposure time. The crystallite morphology of this productmatched that seen on copper tubing contained on sump compo-nents in underground storage tanks reported elsewhere [7]. Topsurfaces of the copper coupons appeared to have greater surfacecoverage of corrosion product and it was noted that during testing,greater condensation appeared on the top surfaces also, sinceradial direction of the coupons was oriented parallel to the inocu-lated solution. Such condensation would lead to higher acetateconcentrations on the top surface of the coupons, resulting ingreater surface area coverage of reactant. The copper corrosionproduct was quite hard compared to the steel corrosion product,which flaked easily from the coupons. Steel corrosion productwas greater in thickness than the coupon at the later time pointsand also reproduced the nature of the corrosion seen on submersi-ble turbine-pump cases in the underground storage-tank sumps[7].
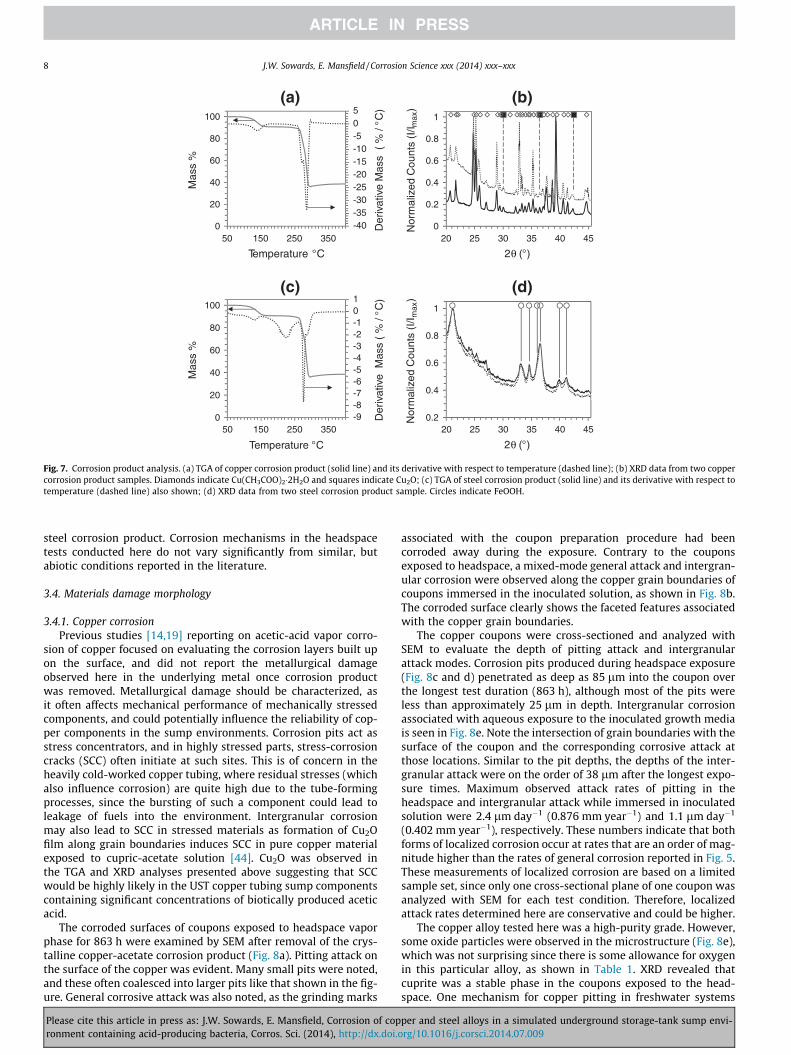
Corrosion products were removed from the copper coupons andanalyzed by TGA and XRD to determine phase content. Coppercorrosion products demonstrated three major oxidation tempera-tures by TGA (Fig. 7a), representative of copper acetate transitionspreviously reported [39]. The first oxidation step, at 139.3 ± 1.9 �C(2 s.d.), was a mass loss attributed to the dehydration of copperacetate and formation of copper acetate peroxides. The secondtransition, at 270.6 ± 0.12 �C (2 s.d.), was attributed to the further
per and steel alloys in a simulated underground storage-tank sump envi-rg/10.1016/j.corsci.2014.07.009
(a) Copper
Top
Bottom
355 hr 643 hr 932 hr
10 mm
(b) Steel
Top
292 hr 550 hr 863 hr10 mm
Fig. 6. Optical micrographs of (a) copper and (b) steel after exposure to headspace environment for indicated exposure periods.
J.W. Sowards, E. Mansfield / Corrosion Science xxx (2014) xxx–xxx 7
oxidation of the copper acetate into smaller decomposition prod-ucts. The final transition, at 283.3 ± 0.12 �C (2 s.d.), is the transitionobserved of the copper products remaining after step 2 into cupricoxide. The small mass increase above approximately 290 �C isattributed to oxidation of cupric oxide. XRD results from two cop-per corrosion product samples are shown in Fig. 7b. Comparing toliterature values, the majority of the products can be identified ascopper acetate dihydrate, Cu(CH3COO)2�2H2O, with some cuprite(Cu2O) products also represented [14]. In the presence of aceticacid, CuO is converted to copper hydroxide acetate according tothe reaction:
4CuO � xH2Oþ 7CH3CO2H! Cu4ðOHÞðCH3COOÞ7 � 2H2Oþ ðxþ 1ÞH2O; ð9Þ
and is then further converted to copper(II) acetate in the presence ofhigh levels of acetic acid by:
Cu4ðOHÞðCH3COOÞ7 � 2H2Oþ CH3CO2H! 4CuðCH3COOÞ2 � 2H2OþH2O; ð10Þ
which matches corrosion products previously reported in theliterature.
Corrosion products from the steel coupons were also analyzedwith TGA (Fig. 7c) and XRD (Fig. 7d). The major expected productis an iron oxide-hydroxide, most likely the a-FeOOH product. Asmall mass loss is observed in the thermogram at 127.6 ± 5.5 �C(2 s.d.), followed by a broad transition centered around227.8 ± 8.8 �C (2 s.d.) and sharper transition at 279.5 ± 3.5 �C (2s.d.). The first mass loss was attributed to the loss of absorbed
Please cite this article in press as: J.W. Sowards, E. Mansfield, Corrosion of copronment containing acid-producing bacteria, Corros. Sci. (2014), http://dx.doi.o
water in the sample. The broad transition is most likely the dehy-dration/dehydroxylation of surface Fe (oxo)hydroxo-functionalgroups, which have been well characterized [40]. The major massloss at 275.9 �C was attributed to the conversion of iron(II) hydrox-ide to iron(III) oxide. Analysis of the XRD product further supportsthat the corrosion occurred by typical atmospheric-rusting kineticsmodels to yield FeOOH as the major product [16,41]. Briefly, thereaction can be described as:
Fe2þ þ 8FeOOHþ 2e� ! 3Fe3O4 þ 4H2O; ð11Þ
followed by additional conversion of the magnetite to FeOOH prod-ucts through the following reaction [16]:
12Fe3O4 þ 3O2 þ 18H2O! 36FeOOH: ð12Þ
XRD confirmed the presence of FeOOH products when com-pared to literature values [42], and infrared spectroscopy (notshown) confirmed that no iron acetate products formed on thesteel.
Protective ability of corrosion product was related empiricallyto corrosion rate based on the constant n in Eq. (6). Steel corrosionproduct loosely adhered to the coupon surfaces after headspaceexposure, flaking easily with any agitation or physical contact.The FeOOH can remained protective in moist atmospheres free ofcontamination by other compounds [43]; however, it was quiteporous, unlike the copper acetate corrosion product, which formedtightly adhered crystals described by the patination mechanism inRef. [14]. These crystals evidently formed a more protective barrieronce continuous coating of the copper surface is complete, sincethe coefficient n is an order of magnitude lower than that of the
per and steel alloys in a simulated underground storage-tank sump envi-rg/10.1016/j.corsci.2014.07.009
(c)
-9-8-7-6-5-4-3-2-101
0
20
40
60
80
100
50 150 250 350
Der
ivat
ive
Mas
s (
% /
° C)
Mas
s %
Temperature °C
(a)
-40-35-30-25-20-15-10-505
0
20
40
60
80
100
50 150 250 350
Der
ivat
ive
Mas
s (
% /
°C)
Mas
s %
Temperature °C
0.2
0.4
0.6
0.8
1
20 25 30 35 40 45
Nor
mal
ized
Cou
nts
(I/I m
ax)
(d)
0
0.2
0.4
0.6
0.8
1
20 25 30 35 40 45
Nor
mal
ized
Cou
nts
(I/I m
ax)
(b)
2 (°)θ
2 (°)θ
Fig. 7. Corrosion product analysis. (a) TGA of copper corrosion product (solid line) and its derivative with respect to temperature (dashed line); (b) XRD data from two coppercorrosion product samples. Diamonds indicate Cu(CH3COO)2�2H2O and squares indicate Cu2O; (c) TGA of steel corrosion product (solid line) and its derivative with respect totemperature (dashed line) also shown; (d) XRD data from two steel corrosion product sample. Circles indicate FeOOH.
8 J.W. Sowards, E. Mansfield / Corrosion Science xxx (2014) xxx–xxx
steel corrosion product. Corrosion mechanisms in the headspacetests conducted here do not vary significantly from similar, butabiotic conditions reported in the literature.
3.4. Materials damage morphology
3.4.1. Copper corrosionPrevious studies [14,19] reporting on acetic-acid vapor corro-
sion of copper focused on evaluating the corrosion layers built upon the surface, and did not report the metallurgical damageobserved here in the underlying metal once corrosion productwas removed. Metallurgical damage should be characterized, asit often affects mechanical performance of mechanically stressedcomponents, and could potentially influence the reliability of cop-per components in the sump environments. Corrosion pits act asstress concentrators, and in highly stressed parts, stress-corrosioncracks (SCC) often initiate at such sites. This is of concern in theheavily cold-worked copper tubing, where residual stresses (whichalso influence corrosion) are quite high due to the tube-formingprocesses, since the bursting of such a component could lead toleakage of fuels into the environment. Intergranular corrosionmay also lead to SCC in stressed materials as formation of Cu2Ofilm along grain boundaries induces SCC in pure copper materialexposed to cupric-acetate solution [44]. Cu2O was observed inthe TGA and XRD analyses presented above suggesting that SCCwould be highly likely in the UST copper tubing sump componentscontaining significant concentrations of biotically produced aceticacid.
The corroded surfaces of coupons exposed to headspace vaporphase for 863 h were examined by SEM after removal of the crys-talline copper-acetate corrosion product (Fig. 8a). Pitting attack onthe surface of the copper was evident. Many small pits were noted,and these often coalesced into larger pits like that shown in the fig-ure. General corrosive attack was also noted, as the grinding marks
Please cite this article in press as: J.W. Sowards, E. Mansfield, Corrosion of copronment containing acid-producing bacteria, Corros. Sci. (2014), http://dx.doi.o
associated with the coupon preparation procedure had beencorroded away during the exposure. Contrary to the couponsexposed to headspace, a mixed-mode general attack and intergran-ular corrosion were observed along the copper grain boundaries ofcoupons immersed in the inoculated solution, as shown in Fig. 8b.The corroded surface clearly shows the faceted features associatedwith the copper grain boundaries.
The copper coupons were cross-sectioned and analyzed withSEM to evaluate the depth of pitting attack and intergranularattack modes. Corrosion pits produced during headspace exposure(Fig. 8c and d) penetrated as deep as 85 lm into the coupon overthe longest test duration (863 h), although most of the pits wereless than approximately 25 lm in depth. Intergranular corrosionassociated with aqueous exposure to the inoculated growth mediais seen in Fig. 8e. Note the intersection of grain boundaries with thesurface of the coupon and the corresponding corrosive attack atthose locations. Similar to the pit depths, the depths of the inter-granular attack were on the order of 38 lm after the longest expo-sure times. Maximum observed attack rates of pitting in theheadspace and intergranular attack while immersed in inoculatedsolution were 2.4 lm day�1 (0.876 mm year�1) and 1.1 lm day�1
(0.402 mm year�1), respectively. These numbers indicate that bothforms of localized corrosion occur at rates that are an order of mag-nitude higher than the rates of general corrosion reported in Fig. 5.These measurements of localized corrosion are based on a limitedsample set, since only one cross-sectional plane of one coupon wasanalyzed with SEM for each test condition. Therefore, localizedattack rates determined here are conservative and could be higher.
The copper alloy tested here was a high-purity grade. However,some oxide particles were observed in the microstructure (Fig. 8e),which was not surprising since there is some allowance for oxygenin this particular alloy, as shown in Table 1. XRD revealed thatcuprite was a stable phase in the coupons exposed to the head-space. One mechanism for copper pitting in freshwater systems
per and steel alloys in a simulated underground storage-tank sump envi-rg/10.1016/j.corsci.2014.07.009
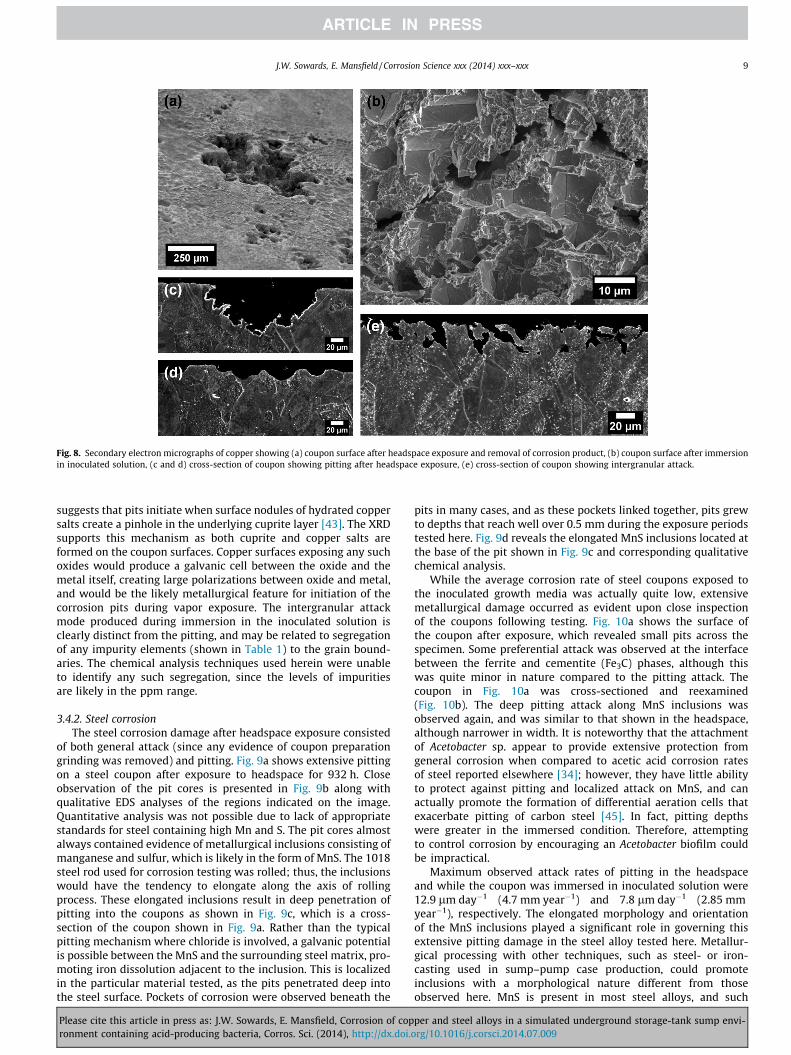
Fig. 8. Secondary electron micrographs of copper showing (a) coupon surface after headspace exposure and removal of corrosion product, (b) coupon surface after immersionin inoculated solution, (c and d) cross-section of coupon showing pitting after headspace exposure, (e) cross-section of coupon showing intergranular attack.
J.W. Sowards, E. Mansfield / Corrosion Science xxx (2014) xxx–xxx 9
suggests that pits initiate when surface nodules of hydrated coppersalts create a pinhole in the underlying cuprite layer [43]. The XRDsupports this mechanism as both cuprite and copper salts areformed on the coupon surfaces. Copper surfaces exposing any suchoxides would produce a galvanic cell between the oxide and themetal itself, creating large polarizations between oxide and metal,and would be the likely metallurgical feature for initiation of thecorrosion pits during vapor exposure. The intergranular attackmode produced during immersion in the inoculated solution isclearly distinct from the pitting, and may be related to segregationof any impurity elements (shown in Table 1) to the grain bound-aries. The chemical analysis techniques used herein were unableto identify any such segregation, since the levels of impuritiesare likely in the ppm range.
3.4.2. Steel corrosionThe steel corrosion damage after headspace exposure consisted
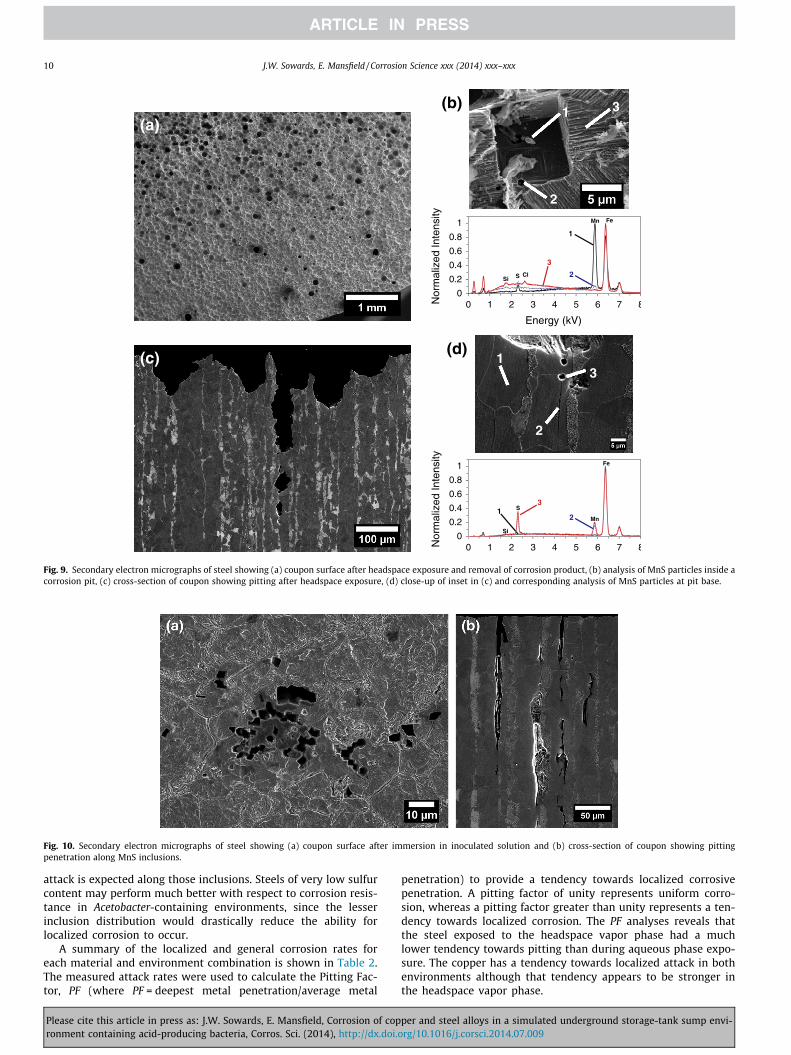
of both general attack (since any evidence of coupon preparationgrinding was removed) and pitting. Fig. 9a shows extensive pittingon a steel coupon after exposure to headspace for 932 h. Closeobservation of the pit cores is presented in Fig. 9b along withqualitative EDS analyses of the regions indicated on the image.Quantitative analysis was not possible due to lack of appropriatestandards for steel containing high Mn and S. The pit cores almostalways contained evidence of metallurgical inclusions consisting ofmanganese and sulfur, which is likely in the form of MnS. The 1018steel rod used for corrosion testing was rolled; thus, the inclusionswould have the tendency to elongate along the axis of rollingprocess. These elongated inclusions result in deep penetration ofpitting into the coupons as shown in Fig. 9c, which is a cross-section of the coupon shown in Fig. 9a. Rather than the typicalpitting mechanism where chloride is involved, a galvanic potentialis possible between the MnS and the surrounding steel matrix, pro-moting iron dissolution adjacent to the inclusion. This is localizedin the particular material tested, as the pits penetrated deep intothe steel surface. Pockets of corrosion were observed beneath the
Please cite this article in press as: J.W. Sowards, E. Mansfield, Corrosion of copronment containing acid-producing bacteria, Corros. Sci. (2014), http://dx.doi.o
pits in many cases, and as these pockets linked together, pits grewto depths that reach well over 0.5 mm during the exposure periodstested here. Fig. 9d reveals the elongated MnS inclusions located atthe base of the pit shown in Fig. 9c and corresponding qualitativechemical analysis.
While the average corrosion rate of steel coupons exposed tothe inoculated growth media was actually quite low, extensivemetallurgical damage occurred as evident upon close inspectionof the coupons following testing. Fig. 10a shows the surface ofthe coupon after exposure, which revealed small pits across thespecimen. Some preferential attack was observed at the interfacebetween the ferrite and cementite (Fe3C) phases, although thiswas quite minor in nature compared to the pitting attack. Thecoupon in Fig. 10a was cross-sectioned and reexamined(Fig. 10b). The deep pitting attack along MnS inclusions wasobserved again, and was similar to that shown in the headspace,although narrower in width. It is noteworthy that the attachmentof Acetobacter sp. appear to provide extensive protection fromgeneral corrosion when compared to acetic acid corrosion ratesof steel reported elsewhere [34]; however, they have little abilityto protect against pitting and localized attack on MnS, and canactually promote the formation of differential aeration cells thatexacerbate pitting of carbon steel [45]. In fact, pitting depthswere greater in the immersed condition. Therefore, attemptingto control corrosion by encouraging an Acetobacter biofilm couldbe impractical.
Maximum observed attack rates of pitting in the headspaceand while the coupon was immersed in inoculated solution were12.9 lm day�1 (4.7 mm year�1) and 7.8 lm day�1 (2.85 mmyear�1), respectively. The elongated morphology and orientationof the MnS inclusions played a significant role in governing thisextensive pitting damage in the steel alloy tested here. Metallur-gical processing with other techniques, such as steel- or iron-casting used in sump–pump case production, could promoteinclusions with a morphological nature different from thoseobserved here. MnS is present in most steel alloys, and such
per and steel alloys in a simulated underground storage-tank sump envi-rg/10.1016/j.corsci.2014.07.009
(a)1
2
3
0
0.2
0.4
0.6
0.8
1
0 1 2 3 4 5 6 7 8Nor
mal
ized
Inte
nsity
Energy (kV)
S
Mn Fe
SiCl
1
2
3
(b)
(c)
0
0.2
0.4
0.6
0.8
1
0 1 2 3 4 5 6 7 8Nor
mal
ized
Inte
nsity
S
Mn
Fe
Si
12
3
1
2
3
(d)
Fig. 9. Secondary electron micrographs of steel showing (a) coupon surface after headspace exposure and removal of corrosion product, (b) analysis of MnS particles inside acorrosion pit, (c) cross-section of coupon showing pitting after headspace exposure, (d) close-up of inset in (c) and corresponding analysis of MnS particles at pit base.
Fig. 10. Secondary electron micrographs of steel showing (a) coupon surface after immersion in inoculated solution and (b) cross-section of coupon showing pittingpenetration along MnS inclusions.
10 J.W. Sowards, E. Mansfield / Corrosion Science xxx (2014) xxx–xxx
attack is expected along those inclusions. Steels of very low sulfurcontent may perform much better with respect to corrosion resis-tance in Acetobacter-containing environments, since the lesserinclusion distribution would drastically reduce the ability forlocalized corrosion to occur.
A summary of the localized and general corrosion rates foreach material and environment combination is shown in Table 2.The measured attack rates were used to calculate the Pitting Fac-tor, PF (where PF = deepest metal penetration/average metal
Please cite this article in press as: J.W. Sowards, E. Mansfield, Corrosion of copronment containing acid-producing bacteria, Corros. Sci. (2014), http://dx.doi.o
penetration) to provide a tendency towards localized corrosivepenetration. A pitting factor of unity represents uniform corro-sion, whereas a pitting factor greater than unity represents a ten-dency towards localized corrosion. The PF analyses reveals thatthe steel exposed to the headspace vapor phase had a muchlower tendency towards pitting than during aqueous phase expo-sure. The copper has a tendency towards localized attack in bothenvironments although that tendency appears to be stronger inthe headspace vapor phase.
per and steel alloys in a simulated underground storage-tank sump envi-rg/10.1016/j.corsci.2014.07.009
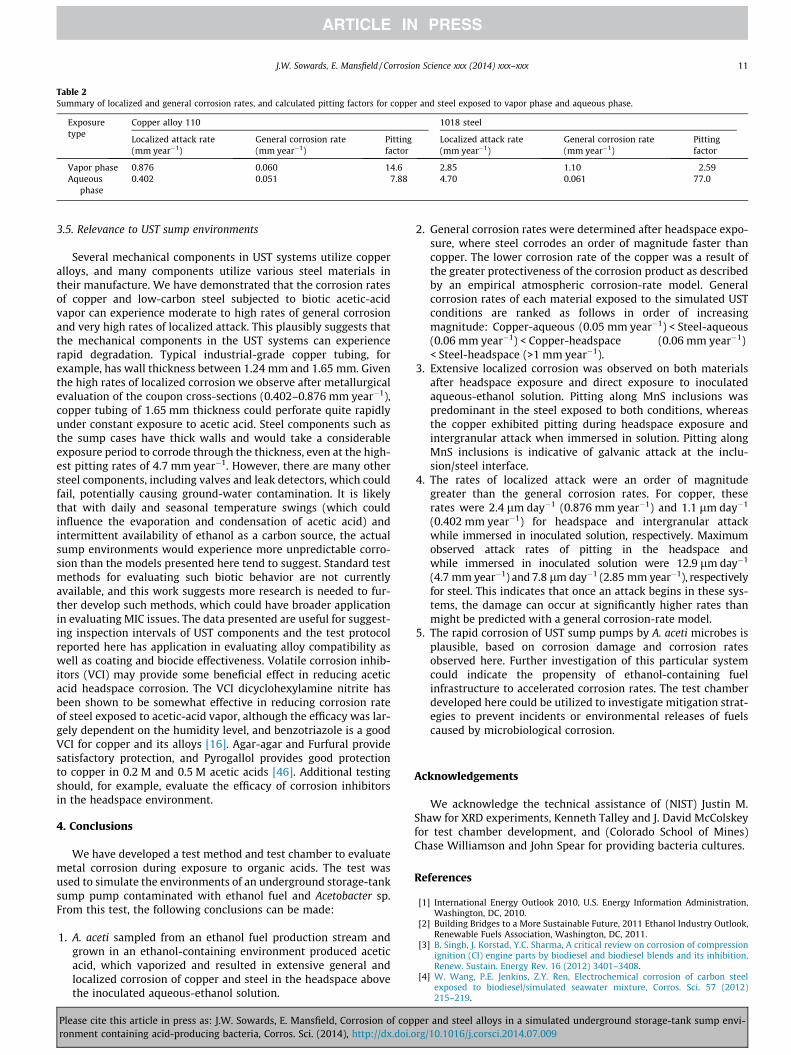
Table 2Summary of localized and general corrosion rates, and calculated pitting factors for copper and steel exposed to vapor phase and aqueous phase.
Exposuretype
Copper alloy 110 1018 steel
Localized attack rate(mm year�1)
General corrosion rate(mm year�1)
Pittingfactor
Localized attack rate(mm year�1)
General corrosion rate(mm year�1)
Pittingfactor
Vapor phase 0.876 0.060 14.6 2.85 1.10 2.59Aqueous
phase0.402 0.051 7.88 4.70 0.061 77.0
J.W. Sowards, E. Mansfield / Corrosion Science xxx (2014) xxx–xxx 11
3.5. Relevance to UST sump environments
Several mechanical components in UST systems utilize copperalloys, and many components utilize various steel materials intheir manufacture. We have demonstrated that the corrosion ratesof copper and low-carbon steel subjected to biotic acetic-acidvapor can experience moderate to high rates of general corrosionand very high rates of localized attack. This plausibly suggests thatthe mechanical components in the UST systems can experiencerapid degradation. Typical industrial-grade copper tubing, forexample, has wall thickness between 1.24 mm and 1.65 mm. Giventhe high rates of localized corrosion we observe after metallurgicalevaluation of the coupon cross-sections (0.402–0.876 mm year�1),copper tubing of 1.65 mm thickness could perforate quite rapidlyunder constant exposure to acetic acid. Steel components such asthe sump cases have thick walls and would take a considerableexposure period to corrode through the thickness, even at the high-est pitting rates of 4.7 mm year�1. However, there are many othersteel components, including valves and leak detectors, which couldfail, potentially causing ground-water contamination. It is likelythat with daily and seasonal temperature swings (which couldinfluence the evaporation and condensation of acetic acid) andintermittent availability of ethanol as a carbon source, the actualsump environments would experience more unpredictable corro-sion than the models presented here tend to suggest. Standard testmethods for evaluating such biotic behavior are not currentlyavailable, and this work suggests more research is needed to fur-ther develop such methods, which could have broader applicationin evaluating MIC issues. The data presented are useful for suggest-ing inspection intervals of UST components and the test protocolreported here has application in evaluating alloy compatibility aswell as coating and biocide effectiveness. Volatile corrosion inhib-itors (VCI) may provide some beneficial effect in reducing aceticacid headspace corrosion. The VCI dicyclohexylamine nitrite hasbeen shown to be somewhat effective in reducing corrosion rateof steel exposed to acetic-acid vapor, although the efficacy was lar-gely dependent on the humidity level, and benzotriazole is a goodVCI for copper and its alloys [16]. Agar-agar and Furfural providesatisfactory protection, and Pyrogallol provides good protectionto copper in 0.2 M and 0.5 M acetic acids [46]. Additional testingshould, for example, evaluate the efficacy of corrosion inhibitorsin the headspace environment.
4. Conclusions
We have developed a test method and test chamber to evaluatemetal corrosion during exposure to organic acids. The test wasused to simulate the environments of an underground storage-tanksump pump contaminated with ethanol fuel and Acetobacter sp.From this test, the following conclusions can be made:
1. A. aceti sampled from an ethanol fuel production stream andgrown in an ethanol-containing environment produced aceticacid, which vaporized and resulted in extensive general andlocalized corrosion of copper and steel in the headspace abovethe inoculated aqueous-ethanol solution.
Please cite this article in press as: J.W. Sowards, E. Mansfield, Corrosion of copronment containing acid-producing bacteria, Corros. Sci. (2014), http://dx.doi.o
2. General corrosion rates were determined after headspace expo-sure, where steel corrodes an order of magnitude faster thancopper. The lower corrosion rate of the copper was a result ofthe greater protectiveness of the corrosion product as describedby an empirical atmospheric corrosion-rate model. Generalcorrosion rates of each material exposed to the simulated USTconditions are ranked as follows in order of increasingmagnitude: Copper-aqueous (0.05 mm year�1) < Steel-aqueous(0.06 mm year�1) < Copper-headspace (0.06 mm year�1)< Steel-headspace (>1 mm year�1).
3. Extensive localized corrosion was observed on both materialsafter headspace exposure and direct exposure to inoculatedaqueous-ethanol solution. Pitting along MnS inclusions waspredominant in the steel exposed to both conditions, whereasthe copper exhibited pitting during headspace exposure andintergranular attack when immersed in solution. Pitting alongMnS inclusions is indicative of galvanic attack at the inclu-sion/steel interface.
4. The rates of localized attack were an order of magnitudegreater than the general corrosion rates. For copper, theserates were 2.4 lm day�1 (0.876 mm year�1) and 1.1 lm day�1
(0.402 mm year�1) for headspace and intergranular attackwhile immersed in inoculated solution, respectively. Maximumobserved attack rates of pitting in the headspace andwhile immersed in inoculated solution were 12.9 lm day�1
(4.7 mm year�1) and 7.8 lm day�1 (2.85 mm year�1), respectivelyfor steel. This indicates that once an attack begins in these sys-tems, the damage can occur at significantly higher rates thanmight be predicted with a general corrosion-rate model.
5. The rapid corrosion of UST sump pumps by A. aceti microbes isplausible, based on corrosion damage and corrosion ratesobserved here. Further investigation of this particular systemcould indicate the propensity of ethanol-containing fuelinfrastructure to accelerated corrosion rates. The test chamberdeveloped here could be utilized to investigate mitigation strat-egies to prevent incidents or environmental releases of fuelscaused by microbiological corrosion.
Acknowledgements
We acknowledge the technical assistance of (NIST) Justin M.Shaw for XRD experiments, Kenneth Talley and J. David McColskeyfor test chamber development, and (Colorado School of Mines)Chase Williamson and John Spear for providing bacteria cultures.
References
[1] International Energy Outlook 2010, U.S. Energy Information Administration,Washington, DC, 2010.
[2] Building Bridges to a More Sustainable Future, 2011 Ethanol Industry Outlook,Renewable Fuels Association, Washington, DC, 2011.
[3] B. Singh, J. Korstad, Y.C. Sharma, A critical review on corrosion of compressionignition (CI) engine parts by biodiesel and biodiesel blends and its inhibition,Renew. Sustain. Energy Rev. 16 (2012) 3401–3408.
[4] W. Wang, P.E. Jenkins, Z.Y. Ren, Electrochemical corrosion of carbon steelexposed to biodiesel/simulated seawater mixture, Corros. Sci. 57 (2012)215–219.
per and steel alloys in a simulated underground storage-tank sump envi-rg/10.1016/j.corsci.2014.07.009

12 J.W. Sowards, E. Mansfield / Corrosion Science xxx (2014) xxx–xxx
[5] S. Pollock, Accelerated corrosion of UST equipment (an ethanol hangover), in:23rd National Tank Conference, 2012.
[6] Corrosion in Systems Storing and Dispensing Ultra Low Sulfur Diesel (ULSD),Hypotheses Investigation, Battelle Memorial Institute, Columbus, OH, 2012.
[7] J. Wilson, C. Adair, J. Skender, A. Barbery, L. Thompson, E. Fowler, R. Strauss, K.West, J. Hickey, R. Hansen, E. French, J. Owens, B. Kowalski, E. Humlie, B.Jergenson, Corrosion in STP sumps: what causes it and what can be done aboutit?, Petrol Equip. Inst. J. 7 (2013) 26–34.
[8] E.C. Hill, G.C. Hill, Microbial contamination and associated corrosion in fuels,during storage, distribution and use, in: V. Agarwala, F. Bellucci, M. Montuori,J. Lppolito (Eds.), Corrosion in the Military, Trans Tech Publications Ltd., Stafa-Zurich, 2008, pp. 257–268.
[9] C.C. Gaylarde, F.M. Bento, J. Kelley, Microbial contamination of storedhydrocarbon fuels and its control, Rev. Microbiol. 30 (1999) 1–10.
[10] L. Jain, C. Williamson, S.M. Bhola, R. Bhola, J.R. Spear, B. Mishra, D.L. Olson, R.Kane, Microbiological and electrochemical evaluation of corrosion andmicrobiologically influenced corrosion of steel in ethanol fuel environments,in: NACE/10, NACE International, San Antonio, TX, 2010.
[11] B.J. Little, J.S. Lee, Microbiologically Influenced Corrosion, John Wiley & Sons,New Jersey, 2007.
[12] D.H. Pope, D. Zintel, A.K. Kuruvilla, O.W. Siebert, Organic acid corrosion ofcarbon steel: a mechanism of microbiologically influenced corrosion,Corrosion 88 (1988) 79.
[13] L.T. Gibson, C.M. Watt, Acetic and formic acids emitted from wood samplesand their effect on selected materials in museum environments, Corros. Sci. 52(2010) 172–178.
[14] A. Lopez-Delgado, E. Cano, J.M. Bastidas, F.A. Lopez, A laboratory study of theeffect of acetic acid vapor on atmospheric copper corrosion, J. Electrochem.Soc. 145 (1998) 4140–4147.
[15] S. Nesic, Key issues related to modelling of internal corrosion of oil and gaspipelines – a review, Corros. Sci. 49 (2007) 4308–4338.
[16] J.M. Bastidas, E.M. Mora, A laboratory study of mild steel vapour phasecorrosion and its inhibition by dicyclohexylamine nitrite, Can. Metall. Quart.37 (1998) 57–65.
[17] S.K. Singh, A.K. Mukherjee, Kinetics of mild steel corrosion in aqueous aceticacid solutions, J. Mater. Sci. Technol. 26 (2010) 264–269.
[18] V.B. Singh, R.N. Singh, Corrosion and inhibition studies of copper in aqueoussolutions of formic acid and acetic acid, Corros. Sci. 37 (1995) 1399–1410.
[19] E. Cano, J.M. Bastidas, J.L. Polo, N. Mora, Study of the effect of acetic acid vaporon copper corrosion at 40 and 80% relative humidity, J. Electrochem. Soc. 148(2001) B431–B437.
[20] M.E. Rauch, H.W. Graef, S.M. Rozenzhak, S.E. Jones, C.A. Bleckmann, R.L. Kruger,R.R. Naik, M.O. Stone, Characterization of microbial contamination in UnitedStates Air Force aviation fuel tanks, J. Ind. Microbiol. Biotechnol. 33 (2006) 29–36.
[21] N. Yemashova, V. Murygina, D. Zhukov, A. Zakharyantz, M. Gladchenko, V.Appanna, S. Kalyuzhnyi, Biodeterioration of crude oil and oil derived products:a review, Rev. Environ. Sci. Biotechnol. 6 (2007) 315–337.
[22] ASTM A108-13 Standard Specification for Steel Bar, Carbon and Alloy, Cold-Finished, ASTM International, West Conshohocken, PA, 2013.
[23] ASTM B187/B187M-11 Standard Specification for Copper, Bus Bar, Rod, andShapes and General Purpose Rod, Bar, and Shapes, ASTM International, WestConshohocken, PA, 2011.
[24] C. Williamson, An Investigation of Microbial Diversity and MicrobiologicallyInfluenced Corrosion in Automotive Fuel Environments, Dept. of
Please cite this article in press as: J.W. Sowards, E. Mansfield, Corrosion of copronment containing acid-producing bacteria, Corros. Sci. (2014), http://dx.doi.o
Environmental Science & Engineering, Colorado School of Mines, Golden, CO,2013.
[25] P. Lisdiyanti, K. Katsura, W. Potacharoen, R.R. Navarro, Y. Yamada, T. Uchimura,K. Komagata, Diversity of acetic acid bacteria in Indonesia, Thailand, and thePhilippines, Microbiol. Cult. Collect. 19 (2003) 91–99.
[26] ASTM G1-03(2011) Standard Practice for Preparing, Cleaning, and EvaluatingCorrosion Test Specimens, ASTM International, West Conshohocken, PA, 2011.
[27] ASTM NACE/ASTMG31 – 12a Standard Guide for Laboratory ImmersionCorrosion Testing of Metals, ASTM International, West Conshohocken, PA,2012.
[28] G. Sauerbrey, Verwendung von Schwingquarzen zur Wägung dünnerSchichten und zur Mikrowägung, Z. Phys. 155 (1959) 206–222.
[29] ASTM G46-94(2013) Standard Guide for Examination and Evaluation of PittingCorrosion, ASTM International, West Conshohocken, PA, 2013.
[30] R. McDonald, S. Shrader, D. Stull, Vapor pressures and freezing points of thirtypure organic compounds, J. Chem. Eng. Data 4 (1959) 311–313.
[31] NIST Chemistry WebBook, NIST Standard Reference Database Number 69,National Institute of Standards and Technology, Gaithersburg, MD (retrieved21.08.13).
[32] J. Krisch, B. Szajani, Ethanol and acetic acid tolerance in free and immobilizedcells of Saccharomyces cerevisiae and Acetobacter aceti, Biotechnol. Lett. 19(1997) 525–528.
[33] C. Leygraf, Atmospheric corrosion, Encyclopedia of Electrochemistry, Wiley-VCH, 2007.
[34] M.M. Singh, A. Gupta, Corrosion behavior of mild steel in acetic acid solutions,Corrosion 56 (2000) 371–379.
[35] G.W. Whitman, R.P. Russell, V.J. Altieri, Effect of hydrogen-ion concentrationon the submerged corrosion of steel, Ind. Eng. Chem. 16 (1924) 665–670.
[36] B. Little, R. Ray, A perspective on corrosion inhibition by biofilms, Corrosion 58(2002) 424–428.
[37] M.A. Javed, P.R. Stoddart, E.A. Palombo, S.L. McArthur, S.A. Wade, Inhibition oracceleration: bacterial test media can determine the course ofmicrobiologically influenced corrosion, Corros. Sci. 86 (2014) 149–158.
[38] G. Grass, C. Rensing, M. Solioz, Metallic copper as an antimicrobial surface,Appl. Environ. Microbiol. 77 (2011) 1541–1547.
[39] Z. Lin, D. Han, S. Li, Study on thermal decomposition of copper(II) acetatemonohydrate in air, J. Therm. Anal. Calorim. 107 (2012) 471–475.
[40] R.G. Ford, P.M. Bertsch, Distinguishing between surface and bulk dehydration–dehydroxylation reactions in synthetic goethites by high-resolutionthermogravimetric analysis, Clays Clay Miner. 47 (1999) 329–337.
[41] U. Evans, Electrochemical mechanism of atmospheric rusting, Nature 206(1965) 980–982.
[42] M. Legodi, D. De Waal, The preparation of magnetite, goethite, hematite andmaghemite of pigment quality from mill scale iron waste, Dyes Pigm. 74(2007) 161–168.
[43] D.A. Jones, Principles and Prevention of Corrosion, Prentice-Hall Inc., NJ, 1996.[44] E. Escalante, J. Kruger, Stress corrosion cracking of pure copper, J. Electrochem.
Soc. 118 (1971) 1062–1066.[45] L.A. Jain, Evaluation of the Propensity for Microbiologically Influenced
Corrosion of Steels in Fuel Grade Ethanol Environments, PhD. Dissertation,Department of Metallurgical and Materials Engineering, Colorado School ofMines, 2011, pp. 269.
[46] M. Desai, Corrosion inhibitors for copper, Mater. Corros. 23 (1972) 483–487.
per and steel alloys in a simulated underground storage-tank sump envi-rg/10.1016/j.corsci.2014.07.009