Embed Size (px)
Citation preview
Page 1 of 1
Corrosion-Induced Gas Generation in a Nuclear Waste Repository:
Reactive Geochemistry and Multiphase Flow Effects
Tianfu Xu1, Rainer Senger2, and Stefan Finsterle1
1Earth Sciences Division, Lawrence Berkeley National Laboratory, Berkeley, CA 94720, USA
2INTERA Inc., 1812 Centre Creek Drive, Suite 300, Austin, Texas 78754, USA Abstract. Corrosion of steel canisters, stored in a repository for spent fuel and high-level nuclear wastes, leads to the generation and accumulation of hydrogen gas in the backfilled emplacement tunnels, which may significantly affect long-term repository safety. Previous studies used H2 generation rates based on the volume of the waste or canister material and the stochiometry of the corrosion reaction. However, iron corrosion and H2 generation rates vary with time, depending on factors such as amount of iron, water availability, water contact area, and aqueous and solid chemistry. To account for these factors and feedback mechanisms, we developed a chemistry model related to iron corrosion, coupled with two-phase (liquid and gas) flow phenomena that are driven by gas-pressure buildup associated with H2 generation and water consumption. Results indicate that by dynamically calculating H2 generation rates based on a simple model of corrosion chemistry, and by coupling this corrosion reaction with two-phase flow processes, the degree and extent of gas pressure buildup could be much smaller compared to a model that neglects the coupling between flow and reactive transport mechanisms. By considering the feedback of corrosion chemistry, the gas pressure increases initially at the canister, but later decreases and eventually returns to a stabilized pressure that is slightly higher than the background pressure. The current study focuses on corrosion under anaerobic conditions for which the coupled hydrogeochemical model was used to examine the role of selected physical parameters on the H2 gas generation and corresponding pressure buildup in a nuclear waste repository. The developed model can be applied to evaluate the effect of water and mineral chemistry of the buffer and host rock on the corrosion reaction for future site-specific studies. Key words. Nuclear waste repository, Canister corrosion, Hydrogen gas generation, Reactive geochemistry, Two-phase flow.
Page 2 of 2
1. Introduction
After closure of an underground nuclear waste repository, anaerobic conditions
will be reached rapidly in the repository (within a few hundred years) and gases mainly
H2 will form by anoxic corrosion of steel canister (Galle, 2000; Ortiz et al., 2002).
Corrosion of iron and degradation of waste canisters leads to the generation and
accumulation of hydrogen gas in the backfilled emplacement tunnels, which may
significantly affect long-term repository safety.
Many investigators have performed experimental and modeling studies on steel
canister corrosion and H2 generation and migration. Galle (2000) reported controlled H2
gas migration experiments with Fo–Ca clay, possible candidate for the disposal clay-
engineered barrier in France. Their results suggest that gas issue cannot be
underestimated for the long-term engineered clay barrier stability. Ortiz et al. (2002)
presented a conceptual model describing the interaction between the generated gas and
the geosphere for Boom Clay, a proposed host formation for nuclear waste storage in
Belgium. Their numerical simulations indicate that a hydrogen phase generated by the
anaerobic corrosion could be formed and its pressure could exceed the local total stress,
leading to a mechanical deformation of the rock and to the formation of a preferential
pathway for the migration of gas and possibly contaminated water. de Combarieu et al.
(2007) presented studies on iron corrosion in Callovo–Oxfordian argillite, France. Batch
experiments for the corrosion of pure iron in the raw argillite were carried out at 90 oC
for a maximum of six months, under oxygen-free atmosphere. XRD measurements
determined that the main phase formed from the iron corrosion is magnetite. In the field
of remediation of groundwater contamination by halogenated hydrocarbons, permeable
iron reactive barriers are commonly used, iron corrosion and H2 gas generation have been
also studied (Reardon, 2005).
In this paper, we examine specific corrosion reactions and their dependence on
hydrogeochemical and two-phase flow conditions at the canister and in the surrounding
(man-made and geologic) materials. Site-specific and detailed information will be
required to assess the coupled processes and their impact at any particular site, and to

Page 3 of 3
develop engineering designs. Before moving into site-specific investigations, general
features and issues representing characteristics that are common and essential for many
such systems are explored. The present study is not related to any particular site.
However, the geometric configuration and the hydraulic parameters of the clayey
formation are abstracted from a nuclear waste repository concept considered in
Switzerland (NAGRA, 2002). The reference design for canisters to be stored in a
repository for spent fuel and high-level waste (SF/HLW) involves a cast steel body with
about 20 cm wall thickness. The canisters are about 1 m in diameter and are surrounded
by a 0.75-m thick bentonite buffer in emplacement tunnels which are 2.5 m in diameter
(Fig. 1). The repository tunnel is assumed to be in the water-saturated zone at a depth of
650 m below the land surface; the host rock is referred to as Opalinus clay.
Fig. 1. Schematic representation of a nuclear waste repository with a single waste
canister, bentonite backfill, and Opalinus clay host rock (NAGRA, 2002).
For the safety analysis, a series of simulations was performed to evaluate the
sensitivity of assumed gas generation rates for different scenarios, as well as site-specific
Waste canister
1 m
2.5 m
BentoniteTunnel wall
Bentonite
Host rock (Opalinus clay)
650 m depth from land surface

Page 4 of 4
conditions (NAGRA, 2004). The simulation results indicate that gas pressures in the
emplacement tunnels are unlikely to exceed the minimum stress, which is considered a
threshold value for the onset of irreversible deformation of the intact host rock (NAGRA,
2004). A detailed assessment of two-phase flow in a SF/HLW repository was conducted
by Senger et al. (2007), who examined different phenomena of hydrogen gas migration
and water consumption associated with the corrosion of a waste canister, including the
transport of gas, water, and vapor.
These previous studies were carried out using a constant H2 generation rate.
However, iron corrosion and H2 generation rates potentially vary with time, depending on
factors such as the amount of iron, water availability, water contact area, and water
chemistry. To accurately account for these factors and feedback mechanisms, we
developed a chemistry model related to iron corrosion and H2 generation, coupled with
two-phase (liquid and gas) flow phenomena that are driven by gas-pressure buildup and
water consumption. Uncoupled batch geochemical modeling and flow simulation as
carried out previously are inadequate to describe the complex physical and chemical
interactions expected to occur. The purpose of this work is to develop and apply a
coupled reactive chemical and two-phase flow model to evaluate the impact of corrosion
reaction on H2 generation and associated gas migration on the system state in a nuclear
waste repository. A number of simplifications and assumptions are made in the present
modeling analysis (see Section 2.4). This paper is not intended to fully evaluate
mechanical and chemical impacts on the bentonite buffer and on the Opalinus clay host
rock. Instead, it investigates select physical parameters that affect H2 gas generation and
its impacts on a generic repository system. The study focuses on the long-term post-
closure conditions after the repository is fully water saturated, characterized by anaerobic
conditions. Furthermore, temperature effects associated with heat generation from
radioactive decay, which are assumed to dissipate within a few hundred years after
repository closure, are not considered.
Page 5 of 5
2. Process Model
2.1. Chemical Reactions
It is generally accepted that the largest gas generation source will be the anaerobic
corrosion of the iron contained in the steel canister (Neretnieks, 1985; Ortiz et al., 2002).
The following chemical reactions are involved in anaerobic corrosion (Reardon, 1995;
Ortiz et al., 2002):
Fe + 2 H2O ↔ Fe2+ + 2OH- + H2 (1a)
Part of OH- generated in Reaction (1a) may be involved in dissolving the bentonite or
precipitating carbonates or hydroxides (more discussion is given in Section 2.4). The
other part of OH- involves in reaction (1b),
Fe2+ + 2OH- ↔ Fe(OH)2 (1b)
The ferrous hydroxide (Fe(OH)2) is metastable in anaerobic groundwater environments
(Reardon, 1995) and converts thermodynamically to magnetite (Fe3O4) according to the
Shikorr reaction:
3 Fe(OH)2 ↔ Fe3O4 + 2 H2O + H2 (2)
By combining Reactions (1a), (1b), and (2), the overall iron corrosion reaction can be
expressed as:
3 Fe + 4 H2O ↔ Fe3O4 + 4 H2 (3)
Laboratory experiments on corrosion of iron metal under atmospheric conditions indicate
that the corrosion rate decreases drastically if relative humidity decreases from 90% to
60% (Brown and Masters, 1982). Thermodynamic considerations predict that the gas
production stops when the H2 partial pressure increases above 40 MPa (Neretnieks,
1985). Even though pressure buildup is expected to be less than the 40 MPa and relative

Page 6 of 6
humidity is likely to remain above 90%, the corrosion rate is likely affected by water
availability, water contact area, and water and material chemistry.
Table 1 summarizes chemical reactions among aqueous, gaseous and mineral
phases considered in our present study. Thermodynamic data for these reactions were
taken from the EQ3/6 V7.2b database (Wolery, 1992). Aqueous-aqueous and aqueous-
gaseous reactions are assumed at local equilibrium. Iron dissolution (corrosion) and
magnetite precipitation are considered under kinetic conditions. The kinetic rate
expression is given in the next section.
Table 1. List of chemical reactions among aqueous, gaseous and mineral phases considered in the present simulations. In the chemical model, aqueous species at the right-hand side are considered as primary species; all other aqueous species, gases and minerals are secondary species. Aqueous reactions:
)(22)(2
)(5.034)(
33)(
)(5.023)()(
)(5.02)(
22)()(
)(5.0
2
22
4
23
22
3
22
2
22
223
2
2
2
2
2
2
2
aqHOHaqO
aqHFeHOHOHFe
FeHOHOHFe
aqHFeHOHaqOHFe
aqHFeHOHOHFe
FeHOHaqOHFe
aqHFeHFe
HOHOH
−=
−+−=
+−=
−+−=
−+−=
+−=
−+=
+=
++−
++−
++
+++
++
+++
+−
Gaseous reactions:
)()()()(
22
22
aqOgOaqHgH
==
Mineral reactions:
)(643)(2)()(
22
43
22
2 aqHHOHFeOFemagnetiteHaqHFeFeiron
−−+=
−+=++
++

Page 7 of 7
2.2. Kinetic Rate Expression
Similar to dissolution and precipitation of common mineral phases in geochemical
modeling (Xu et al., 2006), we employed a transition state rate law (Lasaga et al., 1994)
for iron dissolution and magnetite precipitation:
⎥⎦
⎤⎢⎣
⎡⎟⎠⎞
⎜⎝⎛
KQkA=r -1 . (4)
Here, r is the kinetic rate (positive values indicate dissolution and negative values
precipitation), k is the rate constant (moles per unit mineral surface area and unit time), A
is the total reactive surface area for the grid block representing a steel canister, K is the
equilibrium constant for the mineral-water reaction written for the destruction of one
mole of mineral, and Q is the reaction quotient. For iron dissolution (corrosion), the rate
can be expressed as (according to the iron reaction equation written in Table 1):
⎥⎦
⎤⎢⎣
⎡⎟⎟⎠
⎞⎜⎜⎝
⎛−= +
+
KHaqHFekAriron 2
22
][)](][[1 . (5)
The surface area can be calculated from
)(0
0 wSfVVAA = , (6)
where 0A is the initial surface area, and 0V and V are mineral (iron) volume fractions at
initial and current times, respectively. The factor f, ranging from 0 to 1, accounts for the
area contacted by water divided by the total surface area. Here, we assume that f depends
on the water saturation ( wS ). At fully water-saturated conditions, f = 1. At partially water-
saturated conditions, the surface area of the mineral contacted by water is smaller than
Page 8 of 8
the total surface area, or f < 1. The following relation of f depending on wS is used in the
present model:
( )nww SSf =)( . (7)
In Eq. (7), n is a parameter controlling the dependence of f on wS . We used n values
ranging from zero to two in the simulations (see Section 4.4). By substituting Eqs. (6) and
(7) into Eq. (5), the overall rate can be obtained from
⎥⎦
⎤⎢⎣
⎡⎟⎟⎠
⎞⎜⎜⎝
⎛−⋅⎥
⎦
⎤⎢⎣
⎡⋅= +
+
KHaqHFeS
VVAkr n
wiron 22
2
00 ][
)](][[1 . (8)
The initial total surface area can be calculated from
)/()/()1()()( 23320 gmAmgfmVmA svE ⋅⋅⋅−⋅= ρφ , (9)
where EV is the volume of the grid block containing the steel canister, φ is the porosity,
vf is the initial volume fraction of iron in the solid phase, ρ is the density of the steel
canister, and sA is specific surface per unit iron mass (Section 4.3).
2.3. Two-Phase Flow
Gas generated due to the corrosion of the steel canister leads to a number of two-
phase flow phenomena. Initially, H2 gas is dissolved in the water present in the canister
and in the surrounding buffer and host rock. As pore water becomes fully gas saturated
and no more gas can be dissolved, the increase in gas partial pressure causes a free gas
phase to form. Driven by the pressure buildup, gas starts to migrate into the surrounding,
initially fully water-saturated bentonite buffer and further into the Opalinus clay host
rock. There is a potential for some displacement of pore water as the gas front migrates
from the canister through the buffer into the surrounding clay host rock.
Page 9 of 9
Corrosion continues as long as sufficient water is available for the redox reaction.
The processes associated with the corrosion of the steel canister are focused on the
surface of the canister that is in contact with the surrounding bentonite buffer, which is
assumed to be initially fully water saturated. The water involved in the corrosion reaction
is initially taken from the water in the waste canister or adjacent bentonite, and later by
water and vapor transport toward the canister. Note that H2O consumed by Reaction (2)
can be either water or vapor. The pressure buildup from gas generation produces a gas
pressure gradient and gas flow away from the canister. This process is controlled by the
hydraulic properties of the bentonite and Opalinus clay. Depending on the gas-pressure
distribution and capillary pressure-saturation relationship of the canister, surrounding
bentonite, and Opalinus clay, a liquid pressure gradient develops, allowing liquid water to
flow toward the canister. Water vapor (generated by evaporation of liquid according to
the equilibrium conditions at the given gas pressure and temperature) can be transported
by diffusion toward the canister. This is because vapor is in equilibrium with the liquid
phase as defined by the gas phase pressure: at higher H2 pressure the vapor concentration
is smaller, leading to a vapor concentration gradient toward the canister, where the
pressure is greatest. However, the gas pressure buildup from H2 generation results in
advection of gas (H2 and vapor) away from the canister, which produces a net flow of
vapor away from the canister. At later times, after the H2 gas front extends into the buffer
and surrounding Opalinus clay, water consumed by the corrosion reaction is provided
largely by water flow toward the waste canister.
2.4. Assumptions and Limitations
A number of simplifying assumptions have been made in this preliminary
analysis. We did not attempt to develop a detailed mechanistic corrosion model rather
than considered a simple bulk chemistry model from the H2 mass balance point of view.
The current corrosion model only considers iron oxidation by water, which can occur (the
hydrolysis of water) but under reducing conditions. We also did not account for H2
production by the radiolysis of water (Lapuerta et al., 2007). In addition, the produced H2
could become a donor for other redox reactions and thus would be in part consumed.
Experimental results of Ortiz et al. (2002) indicate that the presence of methane-forming

Page 10 of 10
bacteria in Boom Clay (Belgium) can reduce the H2 gas source term, as the bacteria use
four molecules of hydrogen in their metabolic reactions to form one molecule of methane
(CH4). Excluding the microbial reactions likely underestimates the total gas pressure and
its mechanical consequences. According to these investigators, sulfate-reducing bacteria
were found in Boom Clay, but no release of hydrogen sulfide has ever been established
during gas generation experiments performed in batch reactors. By calculating the
corrosion rate constants based on the experimental H2 production rates as discussed in
Section 2.2, we probably limit the estimation errors of H2 production.
Releases of chemical constituents from surrounding waste materials, bentonite
buffer, and host Opalinus clay can potentially influence iron corrosion and gas
generation. For example, silicon released from waste glass can adsorb on the surface of
magnetite and other corrosion products of iron (Philippini et al., 2006). In addition,
bentonite dissolution can be enhanced at high pH (Bauer and Berger, 1998). The
consumption of OH- enhances the progress of Reaction (1a), and then may modify the
amount of magnetite predicted by Reaction (3). During the simulation time, changes in
water chemistry are dynamically calculated from the coupled model. Data on porewater
chemistry and mineralogy of the Opalinus Clay are available in Pearson et al. (2003),
Fernández et al. (2006), and Gaucher et al. (2006). These data could be the starting point
of a more elaborate chemical modeling of the interaction between the canister and the
clayey materials. In the current study, an initial dilute water was assumed.
Heat generation from the waste package was not considered in the current model.
A constant temperature of 40 oC was used throughout the model domain and simulation
time, representative of long-term post-closure conditions when the repository is fully
water saturated and anaerobic conditions prevail. The early-time elevated temperatures
are assumed to dissipate within a few hundred years. The potential corrosion under
oxidizing conditions (Davydov et al., 2005) at early time was not considered in the
current study (when the repository is partially saturated and the waste containers are at
relatively high temperatures). Compared to the longer-term anaerobic corrosion, the
early-time aerobic corrosion may be not significant.
3. Numerical Implementation
Page 11 of 11
The previous modeling of processes associated with a constant H2 gas generation
due to corrosion of the waste canister and the potential impact of H2O consumption is
implemented in iTOUGH2 (Finsterle, 1999; 2004), which is an inverse code coupled to
the nonisothermal two-phase fluid and heat flow code TOUGH2 (Pruess, 1991).
TOUGH2 considers different fluid mixtures (i.e., water and air; water and
hydrogen), which are given in different fluid property modules (also referred to as
“equation-of-state” or “EOS” modules). TOUGH2 simulates flow in both liquid and
gaseous phases occurring under pressure, viscous, and gravity forces according to Darcy's
law. Interference between the phases is represented by means of relative permeability and
capillary pressure functions. The code includes Klinkenberg effects and binary diffusion
in the gas phase, and capillary and phase adsorption effects for the liquid phase.
Thermophysical properties of water (i.e., density and viscosities) are represented by
steam table equations provided by the International Formulation Committee (1967). The
basic equations and numerical implementation are described in detail in Pruess (1991).
In a first approximation, the water consumption associated with corrosion is
represented by an equivalent water withdrawal rate, which is prescribed together with the
corresponding gas generation rate to the grid blocks representing the canister hull. The
detailed physico-chemical processes at the interface between the canister surface and the
surrounding bentonite are approximated in the numerical model by prescribing the
reaction products in terms of constant gas-generation and water-consumption rates over
time.
In the present work, H2 gas generation rates and corresponding H2O consumption
rates due to iron corrosion are dynamically calculated from the chemistry model
presented above. The reactive geochemical transport part of TOUGHREACT (Xu and
Pruess, 2001) was linked to iTOUGH2. TOUGHREACT is a nonisothermal reactive
geochemical transport program that was developed by introducing reactive geochemistry
into TOUGH2. TOUGHREACT can deal with a wide range of subsurface coupled
thermal-physical-chemical processes under various thermal-hydrological and
geochemical conditions (Xu et al., 2006). It can accommodate any number of chemical
species present in aqueous, gaseous, and solid phases. A variety of equilibrium chemical
reactions are considered, such as aqueous complexation, gas dissolution and exsolution,
Page 12 of 12
and cation exchange. Mineral dissolution and precipitation can proceed either subject to
local equilibrium or kinetic conditions. Chemical components can undergo linear
adsorption and radioactive decay.
The modeling of flow and transport in geologic media is based on space
discretization by means of integral finite differences (IFD; Narasimhan and Witherspoon,
1976). The IFD method provides for flexible discretization using irregular grids, which is
well suited for simulation of flow, transport, and fluid-rock interaction in heterogeneous
and fractured rock systems with varying petrology and complex model boundaries due to
the presence of engineered structures. For regular grids, the IFD method is equivalent to
the conventional finite difference method. An implicit time-weighting scheme is used for
modeling flow, transport, and kinetic geochemical reactions. The TOUGH suite of codes
can be applied to one-, two-, or three-dimensional porous single- or multiple-continuum
media, with physical and chemical heterogeneity.
4. Problem Setup 4.1. Model Geometry
Given the radial geometry of the repository (Fig. 1), a simplified model
previously used by Senger et al. (2007) was employed here for the coupled modeling.
The model is represented by a radially-symmetric geometry, ignoring the lateral no flow
boundary and gravity effects (Fig. 2).

Page 13 of 13
Fig. 2. Radially-symmetric model used in the current study, representing a single waste canister, canister hull, bentonite backfill, and the Opalinus clay host rock.
4.2. Thermo-Physical Conditions and Parameters
The repository is located 650 m below the land surface. For the current modeling,
the system is assumed to be initially fully water-saturated with a background pressure of
65 bar. The outer boundary at a radial distance of 75 m was prescribed with a constant
pressure of 65 bar. Heat generation from the waste package was not considered in the
current model; a constant temperature of 40 oC was used throughout the model domain
and simulation time, representative of late-time conditions. The thermo-physical
properties for the different materials (waste canister, bentonite buffer, and Opalinus clay)
are summarized in Table 2. A porosity of 0.1 was used for the grid block representing the
container hull, which includes the portion of water at the interface between the canister
and the buffer contacting the canister surface. The van Genuchten model (van Genuchten,
1980; Mualem, 1976) is used to describe the functional relationships between relative
permeability and saturation, and capillary pressure and saturation for the different
materials (Table 2).

Page 14 of 14
Table 2. Thermo-physical parameters used for the different materials modified from NAGRA (2004). Waste Canister Bentonite Opalinus Clay
Porosity [-] 0.1 0.40 ("MX-80") 0.12
Permeability [m2] 1 × 10-19 1 × 10-19 1 × 10-20
Pore compressibility (α/φ) [Pa-1] 2.14 × 10⁻⁹ 3.58 × 10⁻⁹ 1.83 × 10⁻⁹
Two-Phase Parameter Model1 Van Genuchten Van Genuchten Van Genuchten
Residual liquid saturation [-] 0.0 0.3 0.5
Initial liquid saturation [-] 1.0 1.0 1.0
Residual gas saturation [-] 0.0 0.0 0.0
Van Genuchten parameter n [-] 2.0 1.82 1.67
Gas entry pressure [Pa] 1.0 1.8 × 10⁷ 1.8 × 10⁷ 1 van Genuchten (1980), Mualem (1976).
4.3. Chemical Conditions and Parameters
An initial dilute water with very low ion concentrations was assumed. Constant
aqueous concentrations (also dilute water) are specified at the outer boundary. Initially, a
volume fraction of iron of 0.8 in terms of solid phase was assumed available for the
corrosive reactions. By accounting for a porosity of 0.1, the initial iron volume fraction in
terms of medium is 0.72, which is used in the simulation result presentation (Fig. 9).
NAGRA (2002, 2004) gave a range of H2 generation rates from a realistic rate of
0.0112 m3/a per tunnel meter (tm) (2.938×10⁻¹¹ kg/s) to a very conservative rate of 0.4
m3/a/tm (1.049×10⁻⁹ kg/s), which correspond to H2O consumption rates of 2.644×10⁻¹⁰
kg/s and 9.441×10⁻⁹ kg/s, respectively. This range depends on the variation in the loading
of canisters and the geometry of the cavern and canister in the drift (NAGRA, 2004).
The current study used two simulation cases based on the lower (pessimistic) H2

Page 15 of 15
generation rate of 0.04 m3/a/tm and the higher (very conservative) H2 generation rate of
0.4 m3/a/tm, and corresponding H2O consumption rates.
The chemical model requires input in terms of the corrosion or iron dissolution
rate constant (k) according to Eq. (8). The iron dissolution rate can be calculated
stoichometrically from the corresponding measured H2 generation rates, according to
Reaction (2), or generated four moles of H2 consumes three moles of Fe. For a water
solution far from equilibrium, the dissolution rate of Eq. (5) becomes kAriron = . By
applying Eq. (9) and using a canister grid block volume of 0.2827 m3, a density of 7,874
kg/m3 and a specific surface area of 121.8 cm2/g, the two constant H2 generation rates of
0.04 and 0.4 m3/a/tm correspond to iron dissolution rate constants (k) of 2.0×10⁻¹² and
2.0×10⁻¹¹ mol/m2/s, respectively. Ortiz et al. (2002) reported an iron dissolution rate
constant determined from experiment of 2.4×10⁻¹² mol/m2/s for 316L stainless steel
contacting with pure water (they reported in terms of a H2 generation rate constant, in this
paper we converted to iron dissolution rate constant and normalized using our specific
surface area). The lower iron dissolution (corrosion) rate constant we used is very close
to their experimental value. The actual corrosion rate may decrease over time mainly
because of (1) reduction of iron volume, and (2) reduction of water contact areas, which
is dynamically calculated according to Eq. (9).
4.4. Simulations
Two sets of simulations were performed for a time period of 5,000 years using the
two iron dissolution rate constants of 2.0×10⁻¹² and 2.0×10⁻¹¹ mol/m2/s, derived above. In
a series of simulations different controls on the corrosion rate are examined using
different values of the exponent n (Eq. 7), which affects the water contact area factor f
and then the effective surface area A (Eq. 6). For the base-case simulation, the water
contact area factor f is assumed to be one by setting the exponent n = 0 (Eq. 7),
indicating that the iron dissolution rate does not depend on the water saturation, but only
on the iron volume fraction (V), which directly affects the reactive surface area (Eq. 6).
The sensitivity simulations assume that f varies as a function of saturation using different
values of the exponent n (Eq. 7). For n = 1 the fraction of water contact area f equals the
Page 16 of 16
water saturation wS ; for 0 < n < 1, f is greater than wS ; for n > 1, f is less than wS . In the
present work, the following n values are used: 0, 0.1, 0.2, 0.5, 1, and 2.
5. Results and Discussion
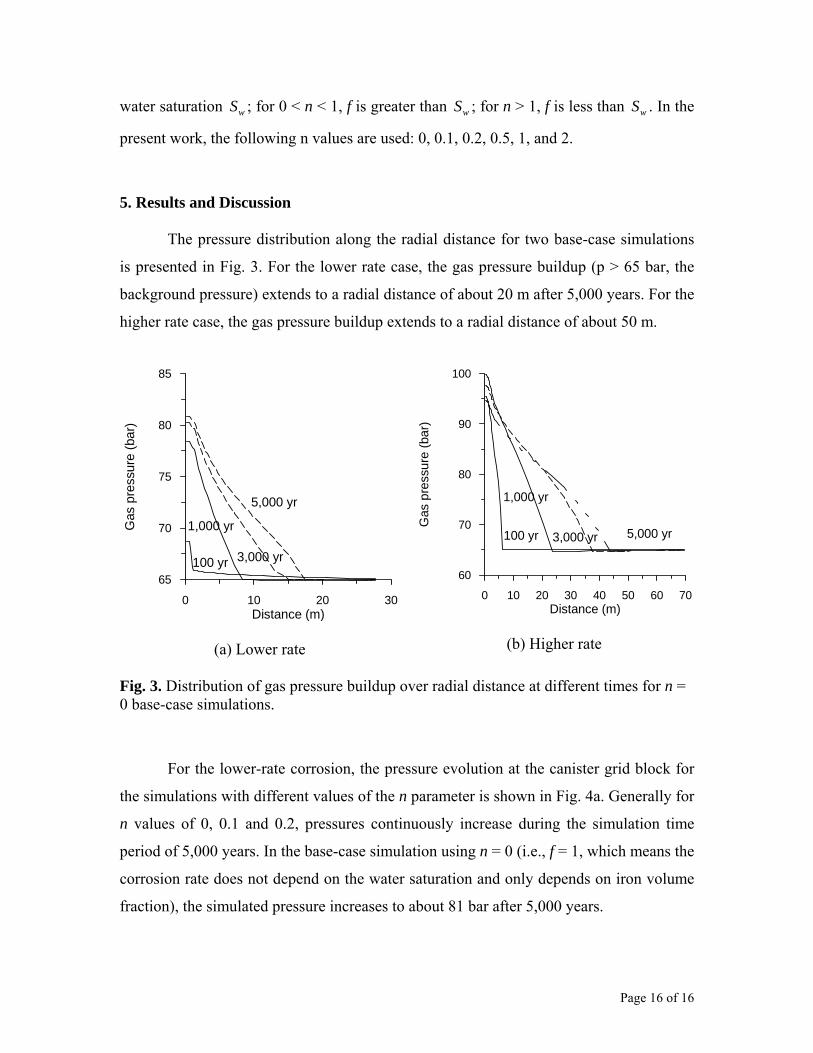
The pressure distribution along the radial distance for two base-case simulations
is presented in Fig. 3. For the lower rate case, the gas pressure buildup (p > 65 bar, the
background pressure) extends to a radial distance of about 20 m after 5,000 years. For the
higher rate case, the gas pressure buildup extends to a radial distance of about 50 m.
0 10 20 30Distance (m)
65
70
75
80
85
Gas
pre
ssur
e (b
ar)
100 yr
1,000 yr
3,000 yr
5,000 yr
(a) Lower rate
0 10 20 30 40 50 60 70Distance (m)
60
70
80
90
100
Gas
pre
ssur
e (b
ar)
100 yr
1,000 yr
3,000 yr 5,000 yr
(b) Higher rate Fig. 3. Distribution of gas pressure buildup over radial distance at different times for n = 0 base-case simulations.
For the lower-rate corrosion, the pressure evolution at the canister grid block for
the simulations with different values of the n parameter is shown in Fig. 4a. Generally for
n values of 0, 0.1 and 0.2, pressures continuously increase during the simulation time
period of 5,000 years. In the base-case simulation using n = 0 (i.e., f = 1, which means the
corrosion rate does not depend on the water saturation and only depends on iron volume
fraction), the simulated pressure increases to about 81 bar after 5,000 years.
Page 17 of 17
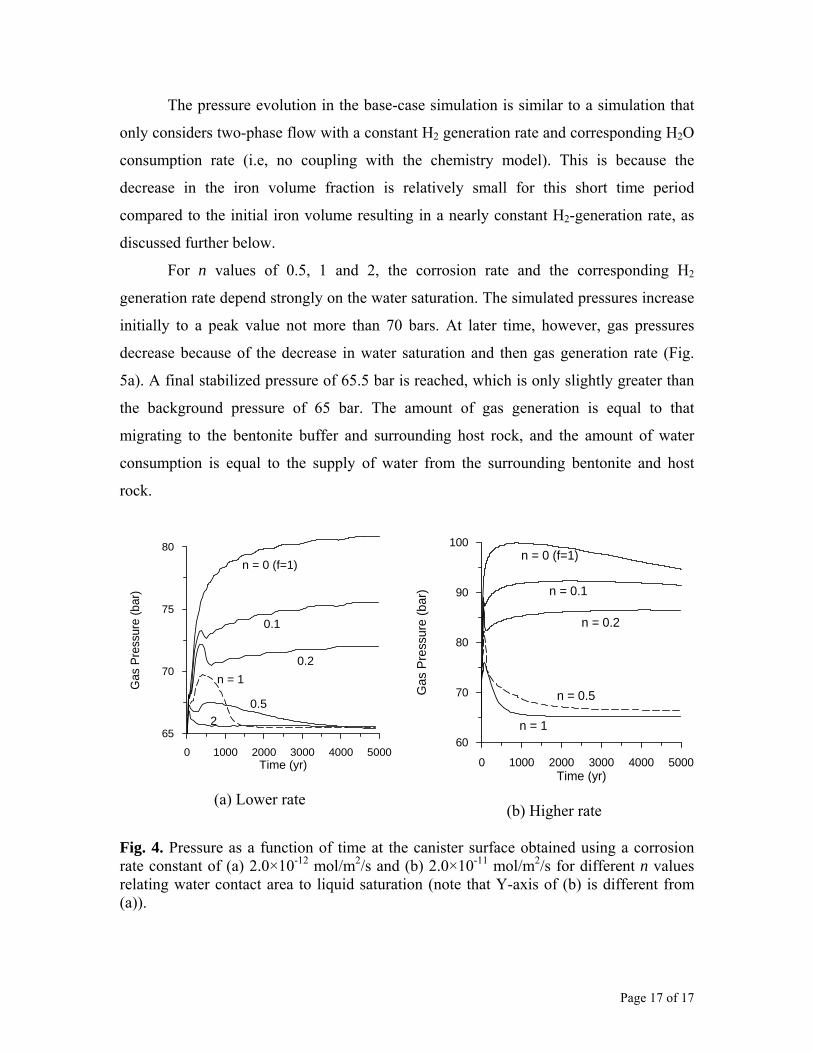
The pressure evolution in the base-case simulation is similar to a simulation that
only considers two-phase flow with a constant H2 generation rate and corresponding H2O
consumption rate (i.e, no coupling with the chemistry model). This is because the
decrease in the iron volume fraction is relatively small for this short time period
compared to the initial iron volume resulting in a nearly constant H2-generation rate, as
discussed further below.
For n values of 0.5, 1 and 2, the corrosion rate and the corresponding H2
generation rate depend strongly on the water saturation. The simulated pressures increase
initially to a peak value not more than 70 bars. At later time, however, gas pressures
decrease because of the decrease in water saturation and then gas generation rate (Fig.
5a). A final stabilized pressure of 65.5 bar is reached, which is only slightly greater than
the background pressure of 65 bar. The amount of gas generation is equal to that
migrating to the bentonite buffer and surrounding host rock, and the amount of water
consumption is equal to the supply of water from the surrounding bentonite and host
rock.
0 1000 2000 3000 4000 5000Time (yr)
65
70
75
80
Gas
Pre
ssur
e (b
ar)
n = 0 (f=1)
n = 1
2
0.1
0.2
0.5
(a) Lower rate
0 1000 2000 3000 4000 5000Time (yr)
60
70
80
90
100
Gas
Pre
ssur
e (b
ar) n = 0.1
n = 1
n = 0.5
n = 0 (f=1)
n = 0.2
(b) Higher rate
Fig. 4. Pressure as a function of time at the canister surface obtained using a corrosion rate constant of (a) 2.0×10⁻¹² mol/m2/s and (b) 2.0×10⁻¹¹ mol/m2/s for different n values relating water contact area to liquid saturation (note that Y-axis of (b) is different from (a)).
Page 18 of 18
For the higher corrosion rate cases (2.0×10⁻¹¹ mol/m2/s), pressure evolution at the
canister grid block for the simulations with different values of the n parameter is shown
in Fig. 4b. In the base-case simulation with n = 0 (i.e., f = 1), the gas pressure rapidly
increases to about 100 bars after 100 years and then decreases gradually. For n values of
0.1 and 0.2, where the corrosion rate depends slightly on the water saturation, pressures
increase steadily but do not reach 100 bars. For n values above 0.5, where the corrosion
rate depends strongly on the water saturation, pressures increase at the very early time,
but later decrease to a final stabilized pressure of 65.5 bar, similar to the lower rate cases.
The computed H2 generation rates and gas saturations at the waste container over
time for all cases are presented in Figs. 5 and 6, respectively. For the base-case (i.e., n =
0 and then f = 1) the corrosion rate does not depend on the water saturation. At the lower
corrosion case (Fig. 5a), the computed H2 generation rate increases initially, but later
decreases slightly due to the reduction of iron volume and then the reduction of reactive
surface area. For n values greater than zero, the H2 generation rate shows the same initial
increase as the base-case, because of the initial pore water available for the full corrosion,
but decreases rapidly (Fig. 5a). For n values of 0.1 and 0.2, this initial decrease is
followed by a near constant rate after 500 years. For n greater than one (i.e., f < Sw), the
overall H2 generation rate decreases continuously, because f < Sw and the corrosion rate
decreases more because of the decrease in the surface area (Eq. 6).
For higher rate cases, an n value of zero yields an overall rate increase at early
time (Fig. 5b), which later decreases significantly due to significant reduction of the iron
volume (Fig. 7b) and then corresponding decrease in the surface area (i.e., Eq. 6 showing
that the reactive surface areas is proportional to the volume). For other n values, the time
evolution patterns are similar to the lower rate cases, but the early declines are much
faster. For n = 0.1 and 0.2, the H2 generation rates show a more gradual decline at late
time (Fig. 5b). For n > 0.5, the H2 generation rates decline more rapidly due to the lower
water saturations compared to the low-rate cases. The H2 gas saturations over time for all
cases are presented in Fig. 6. The higher overall H2 generation rates, the faster near gas-
saturated conditions are reached. Note that the gas saturation could reach close to 100%
but never reaches exactly 100%, and in these cases a very small water saturation (in the
order of 0.001) is obtained and a steady water flow into the grid block maintains the

Page 19 of 19
corrosion going. High gas saturations near 100% are reached only in the canister grid
blocks, while adjacent bentonite grid blocks are still close to 100% liquid saturated. The
mobility of each phase (liquid and gas) is controlled by upstream grid blocks. Gas flows
from the upstream steel canister to the bentonite, but liquid flows from the bentonite to
the steel canister. Phase permeabilities vary with saturation according to the van
Genuchten (1980) curves with parameters given in Table 2.
0 1000 2000 3000 4000 5000Time (yr)
0.0E+0
2.0E-11
4.0E-11
6.0E-11
8.0E-11
1.0E-10
H2
gene
ratio
n ra
te (k
g/s)
n = 0 (f=1)
n = 0.1
n = 0.2
n = 0.512
(a) Lower rate
0 1000 2000 3000 4000 5000Time (yr)
0.0E+0
2.0E-10
4.0E-10
6.0E-10
8.0E-10
1.0E-9
H2
Gen
erat
ion
Rat
e (k
g/s)
n = 0
n = 0.1
n = 0.2
n =0.51
(b) Higher rate Fig. 5. H2 generation rate as a function of time at the canister surface for different n values relating water contact area to water saturation.

Page 20 of 20
0 1000 2000 3000 4000 5000Time (yr)
0.0
0.2
0.4
0.6
0.8
1.0G
as S
atur
atio
n0.5 1
n = 2
0.1
(a) Lower rate constant
0 1000 2000 3000 4000 5000Time (yr)
0.0
0.2
0.4
0.6
0.8
1.0
Gas
Sat
urat
ion
n=0.5n=1
n=2
(b) Higher rate constant Fig. 6. Gas phase saturation as a function of time at the canister for different n values.
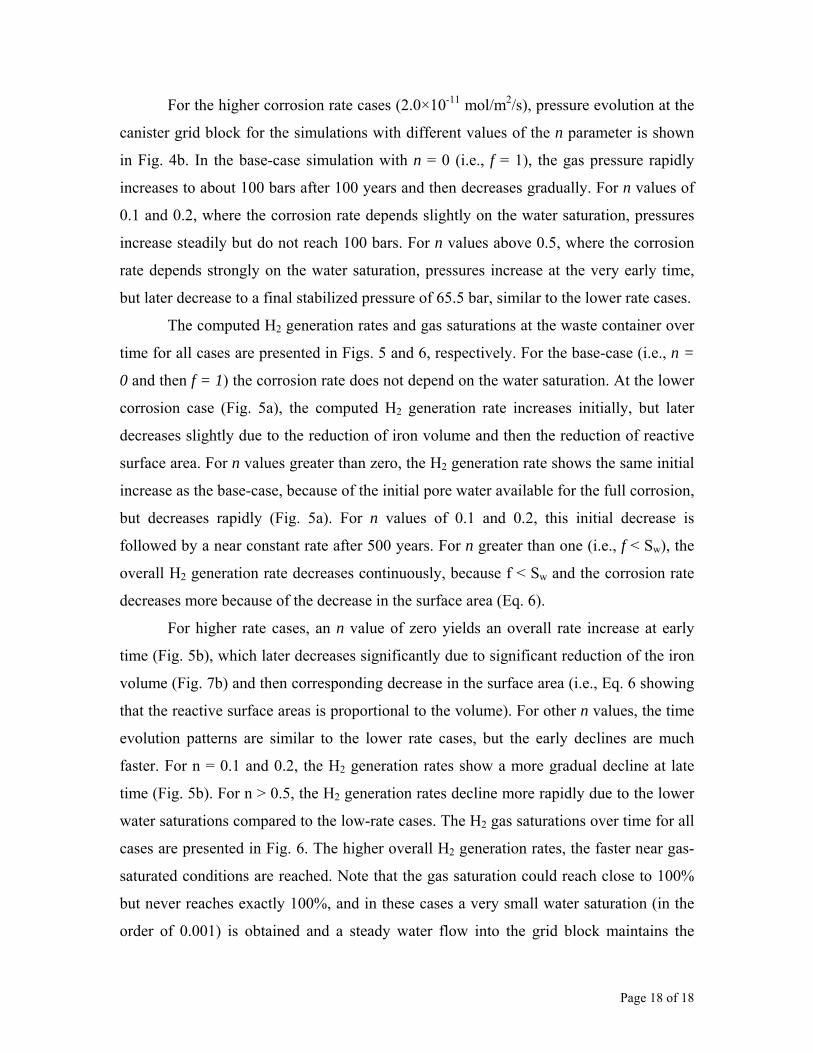
The amount of iron dissolution and magnetite precipitation is presented in Figs. 7
and 8, respectively. The simulated conversion of iron (steel) to magnetite results in an
overall volume increase by a factor of 2.1 which is consistent with values reported by
Johnson and King (2003). Changes in porosity due to the iron corrosion and their effects
on flow were not considered in the current problem, but the option is available in the
simulator. As mentioned above, in the base-case simulation (n = 0) using the higher rate,
the iron volume fraction is reduced by about 60% after 5,000 years (the initial iron
volume fraction is 0.72 in terms of medium). The lower-rate base-case simulation
obtained an iron volume reduction by only about 7%. As a result, the obtained H2
generation for the base-case simulation only shows a relatively small gradual decline
(Fig. 5a). In comparison, the high-rate base-case simulation having a significant iron-
volume reduction shows a steeper decline in the H2 generation rate (Fig. 5b). If the
corrosion rate is dependent on water saturation (i.e., n > 0), the amount of iron dissolved
and concomitant H2 generation is reduced.
Page 21 of 21
0 1000 2000 3000 4000 5000Time (yr)
-8.0E-2
-7.0E-2
-6.0E-2
-5.0E-2
-4.0E-2
-3.0E-2
-2.0E-2
-1.0E-2
0.0E+0
Iron
diss
olut
ion
(vol
ume
fract
ion)
n = 0
0.10.2
0.51
n = 2
(a) Lower rate
0 1000 2000 3000 4000 5000Time (yr)
-5.0E-1
-4.0E-1
-3.0E-1
-2.0E-1
-1.0E-1
0.0E+0
Iron
diss
olut
ion
(vol
ume
fract
ion)
n = 0
n = 0.1
n = 0.2
n = 0.5
(b) Higher rate Fig. 7. Iron dissolution (volume fraction in terms of medium accounting for a porosity of 0.1 over time at the canister for different n values.
0 1000 2000 3000 4000 5000Time (yr)
0.0E+0
5.0E-2
1.0E-1
1.5E-1
Mag
netit
e Pr
ecip
itatio
n (v
olum
e fra
ctio
n)
n = 0.5
n = 0
0.10.2
12
(a) Lower rate
0 1000 2000 3000 4000 5000Time (yr)
0.0E+0
1.0E-1
2.0E-1
3.0E-1
4.0E-1
5.0E-1
6.0E-1
7.0E-1
8.0E-1
Mag
netit
e pr
ecip
itatio
n (v
olum
e fra
ctio
n)
n = 0.5
n = 0.1
n = 0
n = 0.2
(b) Higher rate Fig. 8. Magnetite precipitation (volume fraction in terms of medium) over time at the canister for different n values.
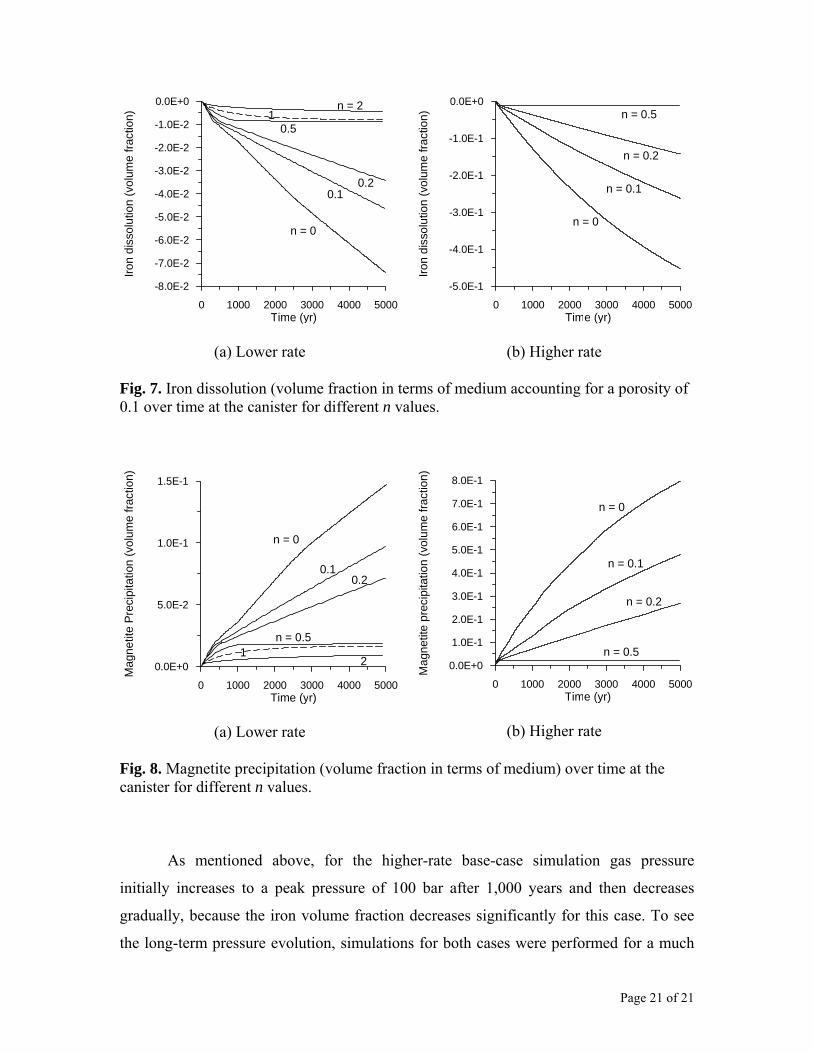
As mentioned above, for the higher-rate base-case simulation gas pressure
initially increases to a peak pressure of 100 bar after 1,000 years and then decreases
gradually, because the iron volume fraction decreases significantly for this case. To see
the long-term pressure evolution, simulations for both cases were performed for a much
Page 22 of 22
longer period. For the lower-rate base case, the iron is completely dissolved after about
150,000 years (Fig. 9a), and then no more H2 is generated, resulting in the pressure to
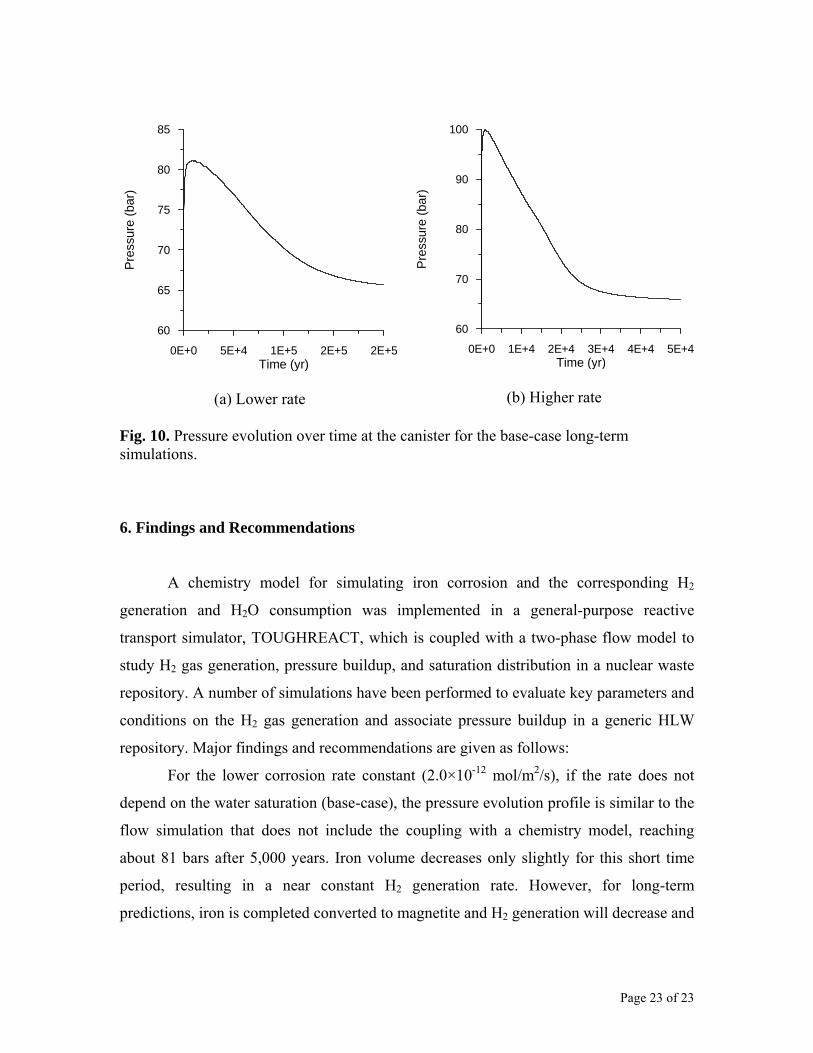
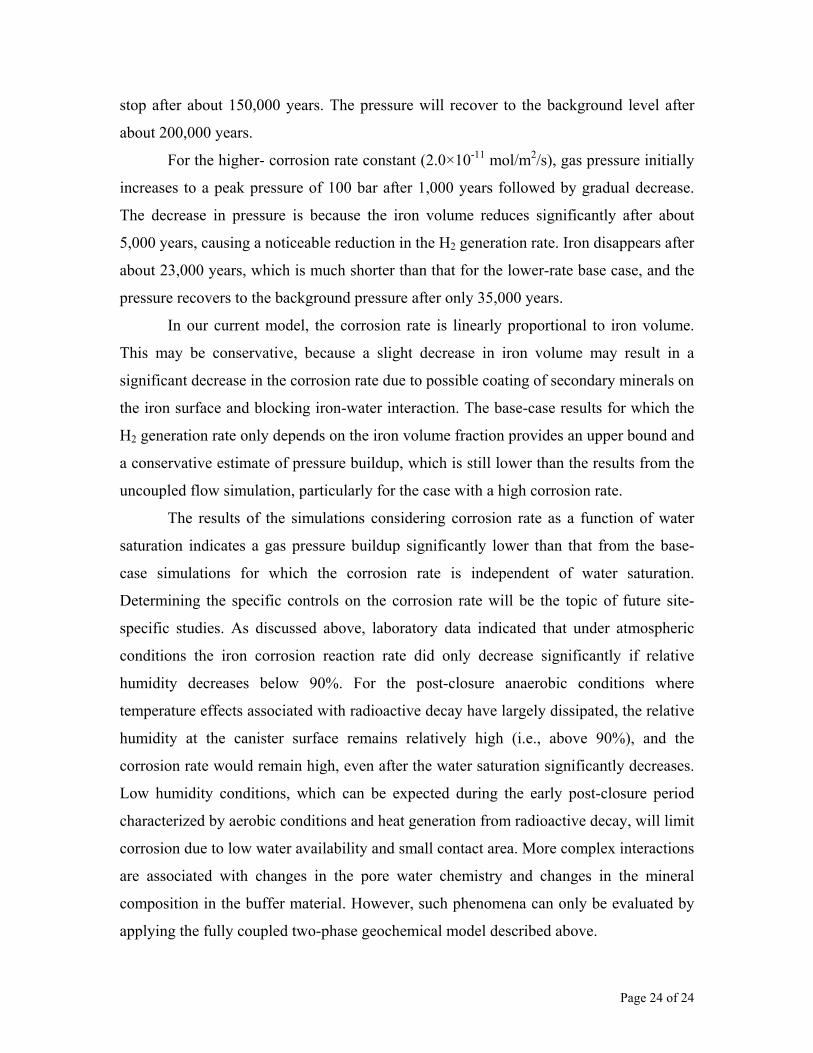
recover close to the background level after about 200,000 years (Fig. 10a). For the
higher-rate base case, iron disappears after about 23,000 years (Fig. 9b), which is much
shorter than the lower-rate base case, and the pressure needs about 35,000 years to
recover to background conditions (Fig. 10b).
0.0E+0 5.0E+4 1.0E+5 1.5E+5 2.0E+5Time (yr)
-0.8
-0.6
-0.4
-0.2
0
Iron
diss
olut
ion
(vol
ume
fract
ion)
(a) Lower rate
0E+0 1E+4 2E+4 3E+4 4E+4 5E+4Time (yr)
-0.8
-0.6
-0.4
-0.2
0.0
Iron
diss
olut
ion
(vol
ume
fract
ion)
(b) Higher rate Fig. 9. Iron dissolution (in volume fraction in terms of medium) over time at the canister surface for the base-case long-term simulations. (A maximum volume fraction of iron dissolution is 0.72, which is in terms of medium accounting for a porosity of 0.1. If in terms of the solid, the maximum iron dissolved is 0.8 as specified in the initial input)
Page 23 of 23
0E+0 5E+4 1E+5 2E+5 2E+5Time (yr)
60
65
70
75
80
85Pr
essu
re (b
ar)
(a) Lower rate
0E+0 1E+4 2E+4 3E+4 4E+4 5E+4Time (yr)
60
70
80
90
100
Pres
sure
(bar
)
(b) Higher rate
Fig. 10. Pressure evolution over time at the canister for the base-case long-term simulations.
6. Findings and Recommendations
A chemistry model for simulating iron corrosion and the corresponding H2
generation and H2O consumption was implemented in a general-purpose reactive
transport simulator, TOUGHREACT, which is coupled with a two-phase flow model to
study H2 gas generation, pressure buildup, and saturation distribution in a nuclear waste
repository. A number of simulations have been performed to evaluate key parameters and
conditions on the H2 gas generation and associate pressure buildup in a generic HLW
repository. Major findings and recommendations are given as follows:
For the lower corrosion rate constant (2.0×10⁻¹² mol/m2/s), if the rate does not
depend on the water saturation (base-case), the pressure evolution profile is similar to the
flow simulation that does not include the coupling with a chemistry model, reaching
about 81 bars after 5,000 years. Iron volume decreases only slightly for this short time
period, resulting in a near constant H2 generation rate. However, for long-term
predictions, iron is completed converted to magnetite and H2 generation will decrease and
Page 24 of 24
stop after about 150,000 years. The pressure will recover to the background level after
about 200,000 years.
For the higher- corrosion rate constant (2.0×10⁻¹¹ mol/m2/s), gas pressure initially
increases to a peak pressure of 100 bar after 1,000 years followed by gradual decrease.
The decrease in pressure is because the iron volume reduces significantly after about
5,000 years, causing a noticeable reduction in the H2 generation rate. Iron disappears after
about 23,000 years, which is much shorter than that for the lower-rate base case, and the
pressure recovers to the background pressure after only 35,000 years.
In our current model, the corrosion rate is linearly proportional to iron volume.
This may be conservative, because a slight decrease in iron volume may result in a
significant decrease in the corrosion rate due to possible coating of secondary minerals on
the iron surface and blocking iron-water interaction. The base-case results for which the
H2 generation rate only depends on the iron volume fraction provides an upper bound and
a conservative estimate of pressure buildup, which is still lower than the results from the
uncoupled flow simulation, particularly for the case with a high corrosion rate.
The results of the simulations considering corrosion rate as a function of water
saturation indicates a gas pressure buildup significantly lower than that from the base-
case simulations for which the corrosion rate is independent of water saturation.
Determining the specific controls on the corrosion rate will be the topic of future site-
specific studies. As discussed above, laboratory data indicated that under atmospheric
conditions the iron corrosion reaction rate did only decrease significantly if relative
humidity decreases below 90%. For the post-closure anaerobic conditions where
temperature effects associated with radioactive decay have largely dissipated, the relative
humidity at the canister surface remains relatively high (i.e., above 90%), and the
corrosion rate would remain high, even after the water saturation significantly decreases.
Low humidity conditions, which can be expected during the early post-closure period
characterized by aerobic conditions and heat generation from radioactive decay, will limit
corrosion due to low water availability and small contact area. More complex interactions
are associated with changes in the pore water chemistry and changes in the mineral
composition in the buffer material. However, such phenomena can only be evaluated by
applying the fully coupled two-phase geochemical model described above.

Page 25 of 25
The present modeling is for a generic clayey formation. However, this simplified
modeling and the sensitivity analyses were useful in order to identify the role of some
physical parameters on the H2 gas generation in a nuclear waste repository. The
developed coupled model can be used in numerical experiments to describe the dynamic
evolution of the system. Moreover, it provides a useful tool for gaining a better
understanding of the coupled chemical and physical processes as well as controlling
conditions and relevant parameters for H2 generation and migration.
Acknowledgment. We are grateful to Nicolas Spycher and Keni Zhang for a review of the manuscript and suggestions for improvement. We appreciate Eric Gaucher and the anonymous reviewer for their comments during the journal review process, which greatly improved the quality of the paper. This work was supported by the National Co-operative for the Disposal of Radioactive Waste (NAGRA) of Switzerland, and, in part, by the U.S. Dept. of Energy under Contract No. DE-AC02-05CH11231 References Bauer, A., Berger, G., 1998. Kaolinite and smectite dissolution rate in high molar KOH
solutions at 350 and 800C. Applied Geochemistry, 13, 905-916. Brown, P.W., Masters, L.W. 1982. Factors affecting the corrosion of metals in the
atmosphere, Atmospheric Corrosion, Ed. W.H. Ailov, New York. Bauer, A., Berger, G., 1998. Kaolinite and smectite dissolution rate in high molar KOH
solutions at 350 and 800C. Applied Geochemistry, 13, 905-916.
de Combarieu, G., Barboux, P., Minet, Y. 2007. Iron corrosion in Callovo–Oxfordian argilite: From experiments to thermodynamic/kinetic modeling. Physics and Chemistry of the Earth, 32, 346-358.
Davydov, A., Rybalka, K.V., Beketaeva, L.A., Engelhardt, G.R., Jayaweera, P., Macdonald, D.D., 2005. The kinetics of hydrogen evolution and oxygen reduction on Alloy 22. Corrosion Science, 47, 195-215.
Fernández, R., Cuevas, J., Sánchez, L., de la Villa, R.V., Leguey, S., 2006. Reactivity of the cement-bentonite interface with alkaline solutions using transport cells. Applied Geochemistry, 21, 977-992.
Finsterle, S., 1999. iTOUGH2 User’s Guide, Report LBNL-40040, Lawrence National Berkeley Laboratory, Berkeley, California, USA.
Finsterle, S., 2004. Multiphase inverse modeling: Review and iTOUGH2 applications, Vadose Zone J., 3, 747–762.

Page 26 of 26
Galle, C., 2000. Gas breakthrough pressure in compacted Fo–Ca clay and interfacial gas overpressure in waste disposal context. Applied Clay Science, 17, 85–97.
Gaucher E.C., Blanc, P., Bardot, F., Braibant, G., Buschaert, S., Crouzet, C., Gautier, A., Girard, J.-P., Jacquot, E., Lassin, A., Negrel, G., Tournassat, C., Vinsot, A., Altmann, 2006. Modelling the porewater chemistry of the Callovian-Oxfordian formation at a regional scale. Comptes Rendus Geosciences 338(12-13), 917-930.
International Formulation Committee, 1967. A Formulation of the thermodynamic properties of ordinary water substance, IFC Secretariat, Düsseldorf, Germany.
Johnson, L.H., King, F. 2003. Canister Options for the Direct Disposal of Spent Fuel. NAGRA Technical Report NTB 02-11, NAGRA, Wettingen, Switzerland.
Lapuerta, S., Millard-Pinard, N., Moncoffre, N., Bérerd, N., Jaffrezic, H., Brunel, G., Crusset, D., Mennecart, T., 2007, Origin of the hydrogen involved in iron corrosion under irradiation, Surface and Coatings Technology, 201, 8197-8201.
Lasaga, A.C., Soler, J.M., Ganor, J., Burch, T.E., Nagy, K.L., 1994. Chemical weathering rate laws and global geochemical cycles. Geochimica et Cosmochimica Acta, 58, 2361–2386.
Mualem, Y., 1976, A new model for predicting the hydraulic conductivity of unsaturated porous media. Water Resour. Res. 12 6, 513 – 522.
NAGRA, 2002. Project Opalinus Clay: Safety Report. Demonstration of Disposal Feasibility (Entsorgungsnachweis) for Spent Fuel, Vitrified High-Level Waste and Long-Lived Intermediate-Level Waste, NAGRA Technical Report NTB 02-05, NAGRA, Wettingen, Switzerland.
NAGRA, 2004, Effects of Post-Disposal Gas Generation in a Repository for Spent Fuel, High-Level Waste and Long-Lived Intermediate Level Waste Sited in Opalinus Clay, NAGRA Technical Report NTB 04-06. NAGRA, Wettingen, Switzerland.
Narasimhan, T.N., Witherspoon, P.A., 1976. An integrated finite difference method for analyzing fluid flow in porous media, Water Resour. Res. 12, 57–64.
Neretnieks, I., 1985. Some Aspects of the Use of Iron Canisters in Deep Lying Repositories for Nuclear Waste, NAGRA Technical Report NTB 85-35, NAGRA, Wettingen, Switzerland.
Ortiz, L., Volckaert, G., Mallants, D., 2002. Gas generation and migration in Boom Clay, a potential host rock formation for nuclear waste storage. Engineering Geology, 64, 287-296.
Pearson, F.J., Arcos, D., Boisson, J.Y., Fernandez, A.M., Gäbler, H.E., Gaucher, E., Gautschi, A., Griffault, L., Hernan, P., Waber, H.N., 2003. Mont Terri project - Geochemistry of water in the Opalinus clay formation at the Mont Terri Rock Laboratory. In Geology Series, Vol. 5 (ed. F.O.W.G.).
Philippini, V., Naveau, A., Catalette, H., Leclercq, S., 2006. Sorption of silicon on magnetite and other corrosion products of iron. Journal of Nuclear Materials, 348, 60-69.

Page 27 of 27
Pruess, K., 1991. TOUGH2: A General-Purpose Numerical Simulator for Multiphase Fluid and Heat Flow, Report LBL-29400, Lawrence Berkeley Laboratory, Berkeley, California, USA.
Reardon, E. J., 1995. Anaerobic corrosion of granular iron: Measurement and interpretation of hydrogen evolution rates. Environ. Sci. Technol., 29, 2936-2945.
Reardon, E., 2005. Zerovalent irons: Styles of corrosion and inorganic control on hydrogen pressure buildup. Environmental Science & Technology, 39, 7311-7317.
Senger, R., Marschall, P.M.., Finsterle, S., 2007. Investigation of Two-Phase Flow Phenomena Associated with Corrosion in an SF/HLW Repository in Opalinus Clay, Switzerland, in Clays in Natural & Engineered Barriers for Radioactive Waste Confinement, 3rd International Meeting, Lille, September 17 – 20, 2007.
Van Genuchten, M. Th., 1980. A Closed-form equation for predicting the hydraulic conductivity of unsaturated soils. Soil Sci. Soc. Am. J. 44, 892 – 898.
Wolery, T.J., 1992. EQ3/6: Software Package for Geochemical Modeling of Aqueous Systems: Package Overview and Installation Guide (Version 7.0), Report UCRL-MA-110662 PT I, Lawrence Livermore National Laboratory, Livermore, California, USA.
Xu, T., Pruess, K., 2001. Modeling multiphase non-isothermal fluid flow and reactive geochemical transport in variably saturated fractured rocks: 1. Methodology, American Journal of Science, 301, 16–33.
Xu, T., Sonnenthal, E.L., Spycher, N., Pruess, K., 2006. TOUGHREACT: A simulation program for non-isothermal multiphase reactive geochemical transport in variably saturated geologic media, Computer & Geoscience, 32, 145–165.