Embed Size (px)
Citation preview
Corrosion Detection on Buried Transmission
Pipelines with Micro-Linear Polarization Resistance
Sensors
Bernard Laskowski, Ph.D.
Analatom, Inc.

Background – Regulatory & Industry
Direct Assessment (DA) is identified in the Gas Pipeline Integrity Management Rule as
an acceptable method for evaluating the integrity of a pipeline segment.
The rule requires a four step process for external corrosion direct assessment (ECDA)
Step One: Pre-assessment - determine the feasibility of using ECDA for a segment, identify
ECDA regions, and identify two indirect examination tools to be used on the ECDA region.
Step Two: Indirect Examination - identify indications of potential external corrosion, classify the
severity of those indications, and determine urgency for their excavation and direct
examination.
Step Three: Direct Examination - examine the condition of the pipe and its environment,
determine actions to be taken should corrosion defects be found, and identify and address root
causes.
Step Four: Post Assessment - determine a segment’s remaining life, its re-assessment
interval, and the effectiveness of using ECDA as an assessment method.
Quoted from U.S. DOT Fact Sheet: Direct Assessment (DA) - Gas Pipelines
Buried natural gas steel pipes are usually cathodically protected and coated
ECDA technologies are significantly challenged at cased sections

Background – Analatom, Inc.
Located in Sunnyvale, CA of Silicon Valley
Founded in 1980
Managed 97 university, government and private industry contracts in microscopic physics, atomic and molecular interactions and device simulations
“A Structural Health Monitoring Company”
Team with Experiment

Objective & Benefits
Determine the feasibility of using micro-linear polarization resistance (μLPR) sensors to monitor corrosion on live pipelines.
- Range of detection of each sensor
- Performance on buried, cathodically protected pipe
Focus on areas of pipe as needed
Measure corrosion rates instantaneously in situ
Qualify as Direct Examination if detection range is acceptable
Achieve integrity assessments on hard to reach locations such as cased crossings
Rely on commercially proven use in structural health monitoring
Minimize R&D risk with only a successful adaptation of an existing technology
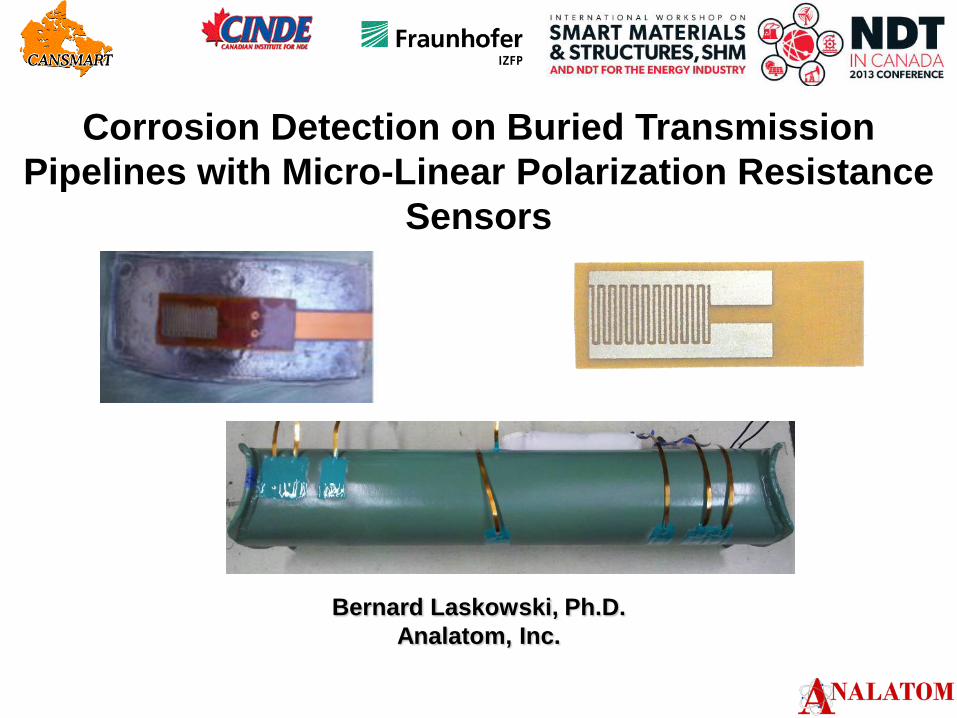
Project Tasks & Schedule
Project Task Percent Complete
May 2012
June 2012
July 2012
Aug. 2012
Sept. 2012
Oct. 2012
Nov. 2012
Dec. 2012
Task 1) Identify Pipeline Materials & Coating
100%
Task 2) Design Experiment, Prepare Mock Pipeline, & Fabricate Sensors
100%
Task 3) Apply Defects to Coating
100%
Task 4) Experiment Assembly
100%
Task 5) Identify Field Conditions
100%
Task 6) Conduct Test
100%
Task 7) Assess Degradation
100%
Task 8) Correlate Degradation to Sensor Data
100%
Final Report & Project Review 90%

Funder Advisory & In-Kind
1. Answers to Questionnaire & KO meeting – Project Advisory Group
Materials selection for pipe and sensors
Moisture/drying cycles, temperature, soil properties, cathodic protection
2. Expertise in cathodic protection and accelerated corrosion - CHG&E
Environmental test chamber and CP design recommendations
3. Specifications & Procurement info for coating services – SoCal
FBE by Commercial Coating Services Int. to industry standards (14 - 16 mils)
Field patch material (3M Scotchcoat Liquid Epoxy Coating 323)
4. Mock-up Pipe, sensor material and welding labor – Questar
3 foot section of 6” API 5L Grade B line pipe
12”x12” API 5L Grade B line pipe section

Sensor Technology – As Applied to Buried Pipe Micro-linear polarization resistance (μLPR) sensors fabricated from same material as
structure.
Monitors electrochemical potential and current between electrode pairs.
Defect causes delamination of coating, allowing micro-fluidic electrolyte flow.
FBE Coating
Steel Surface
Micro-
Fluid
LPR Sensor
Kapton Tape
Epoxy
Cathodic Protection (Voltage)
Capillary Forces (Delamination)
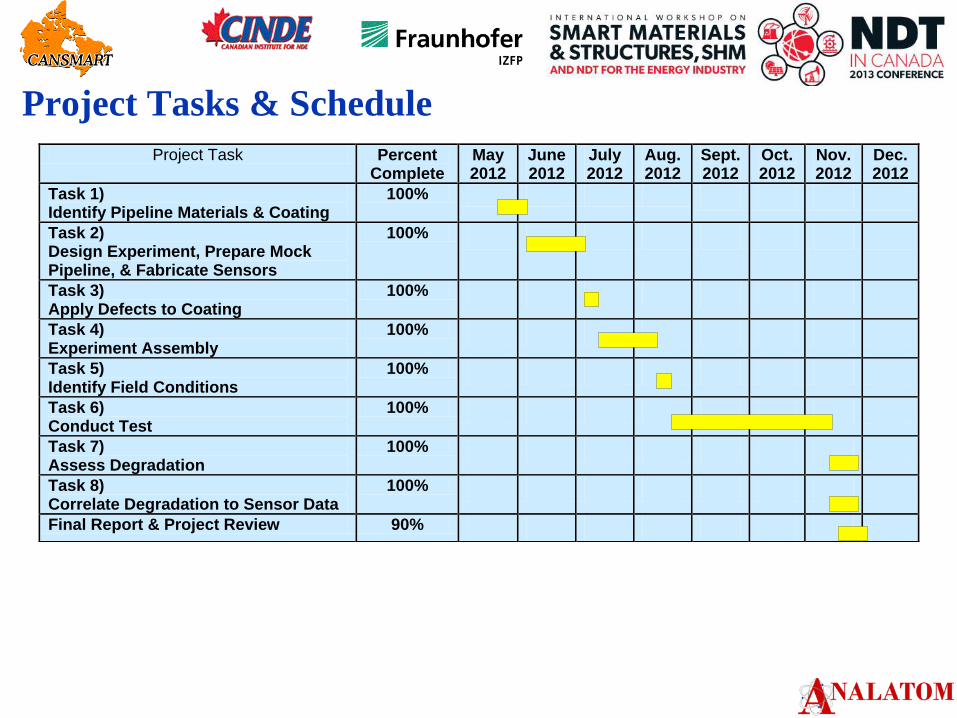
μLPR Sensors Fabrication Shim stock currently unavailable
API 5L Grade-B steel
12” x 12” curved plate
12” x 1.3” wafers
Scaling production will be accomplished by working with a foundry.
Chemical Etching 300 µm electrodes
300 µm spacing
10 mil thickness
Sensors mounted onto 2 mil Kapton (polyimide)
Sensors mounted onto flex cables.
Micro-Sensor Fabrication

Sensor Technology – Mounting on Natural Gas Pipelines
36” section of API 5L Grade B steel pipe acquired for evaluation.
Pipe was coated with 15 mils of fusion bonded epoxy (FBE).
Areas of FBE were removed to expose bare metal for sensor installation.
Sensors were mounted with industrial strength epoxy
Sensors were recoated with Scotchkote Liquid Epoxy 323 (“field patch”).
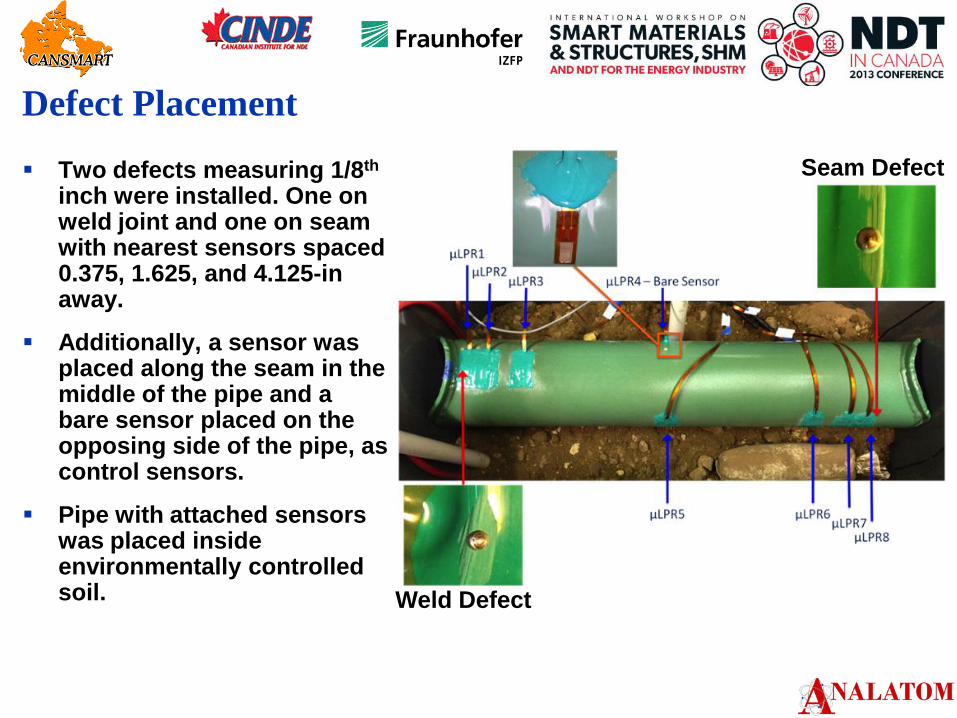
Defect Placement
Two defects measuring 1/8th inch were installed. One on weld joint and one on seam with nearest sensors spaced 0.375, 1.625, and 4.125-in away.
Additionally, a sensor was placed along the seam in the middle of the pipe and a bare sensor placed on the opposing side of the pipe, as control sensors.
Pipe with attached sensors was placed inside environmentally controlled soil. Weld Defect
Seam Defect
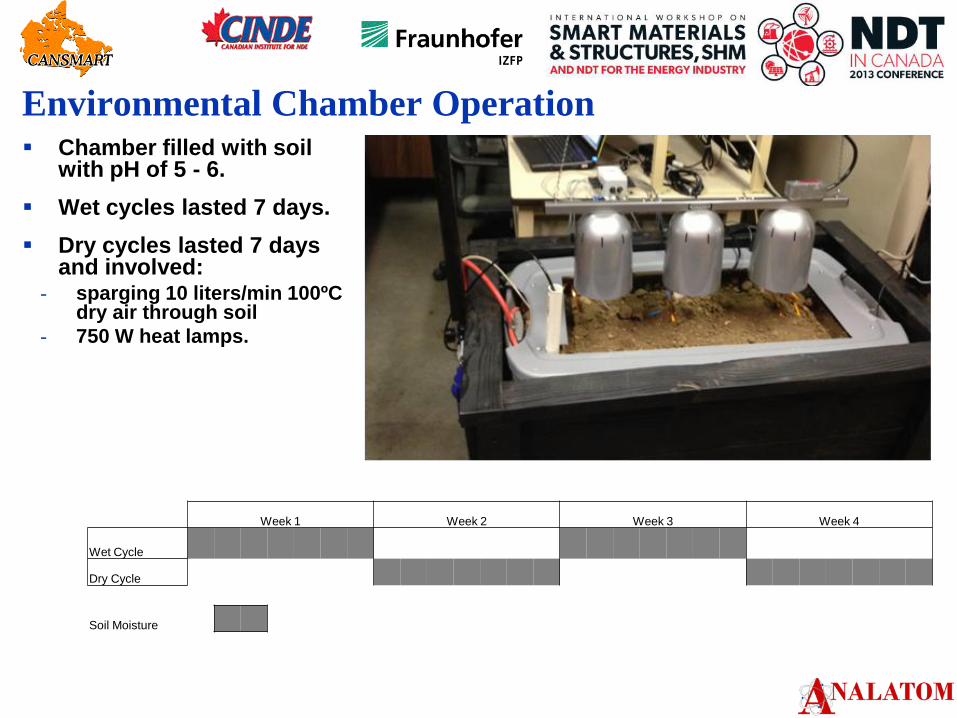
Environmental Chamber Operation Chamber filled with soil
with pH of 5 - 6.
Wet cycles lasted 7 days.
Dry cycles lasted 7 days and involved:
- sparging 10 liters/min 100ºC dry air through soil
- 750 W heat lamps.
Week 1 Week 2 Week 3 Week 4
Wet Cycle
Dry Cycle
Soil Moisture
Se
ns
or
Su
rfa
ce
Lo
ss
[m
m]
Sensor
Surface Loss
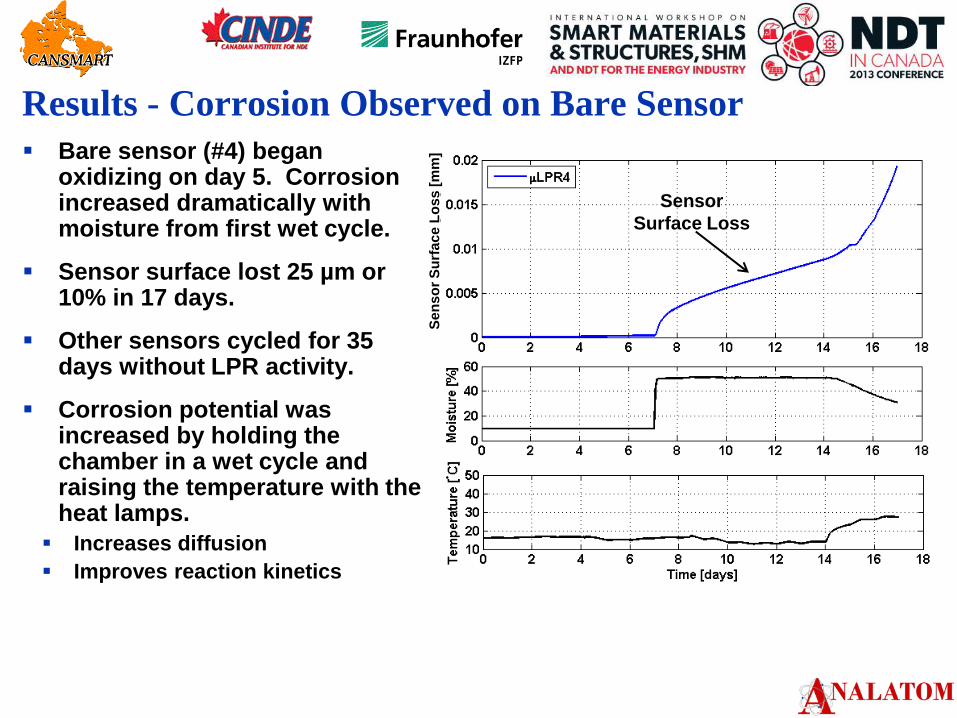
Results - Corrosion Observed on Bare Sensor
Bare sensor (#4) began oxidizing on day 5. Corrosion increased dramatically with moisture from first wet cycle.
Sensor surface lost 25 µm or 10% in 17 days.
Other sensors cycled for 35 days without LPR activity.
Corrosion potential was increased by holding the chamber in a wet cycle and raising the temperature with the heat lamps.
Increases diffusion
Improves reaction kinetics
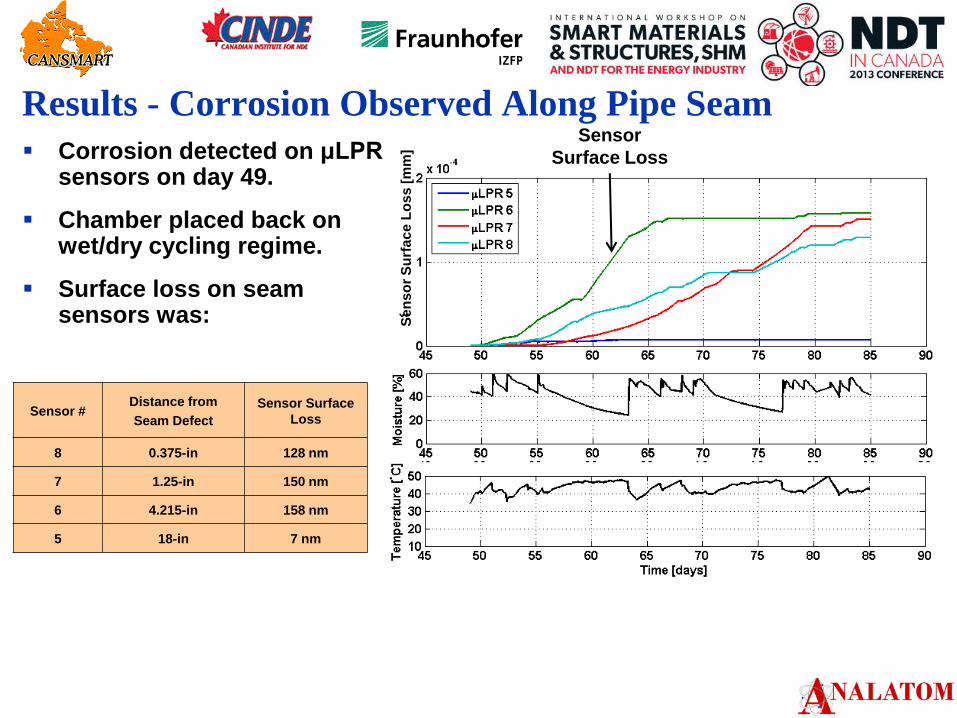
Results - Corrosion Observed Along Pipe Seam
Corrosion detected on μLPR sensors on day 49.
Chamber placed back on wet/dry cycling regime.
Surface loss on seam sensors was:
Sensor # Distance from
Seam Defect
Sensor Surface
Loss
8 0.375-in 128 nm
7 1.25-in 150 nm
6 4.215-in 158 nm
5 18-in 7 nm
Se
ns
or
Su
rfa
ce
Lo
ss
[m
m]
Sensor
Surface Loss

Results - Corrosion Adjacent to Weld Joint Corrosion occurred an order
of magnitude higher along the seam, likely due to positioning in the chamber
Sensitive nature of measurements allows small surface losses to be identified.
Sensors correlate with moisture
Sensor surface lost at weld was:
Sensor # Distance from
Weld Defect
Sensor Surface
Loss
1 0.375-in 11.0 nm
2 1.25-in 1.9 nm
3 4.215-in 3.2 nm
Se
ns
or
Su
rfa
ce
Lo
ss
[m
m]
Sensor
Surface Loss
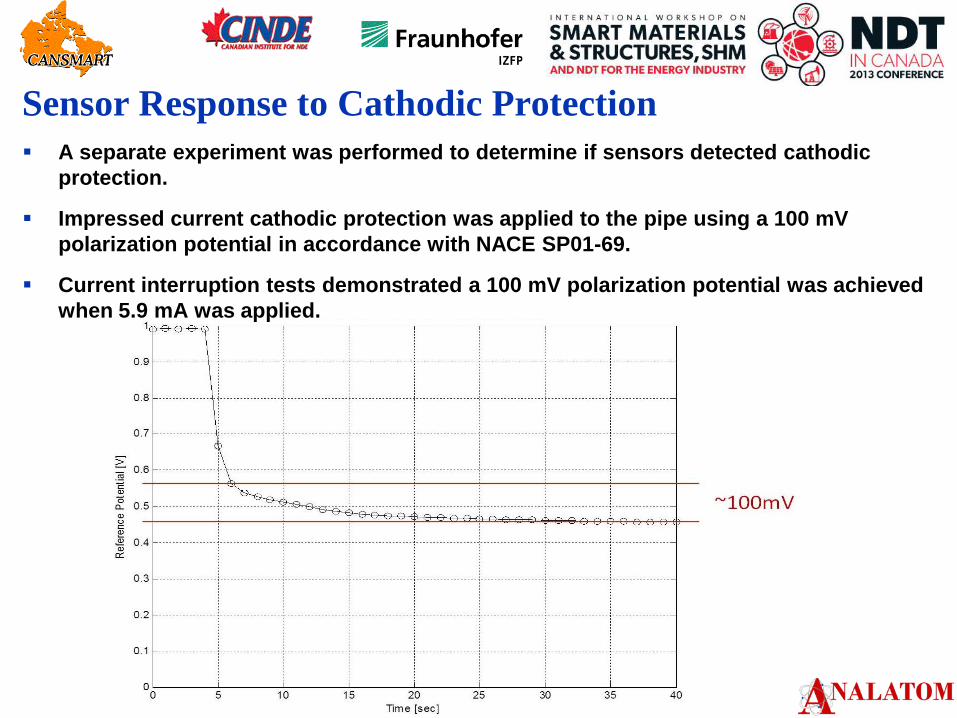
Sensor Response to Cathodic Protection
A separate experiment was performed to determine if sensors detected cathodic
protection.
Impressed current cathodic protection was applied to the pipe using a 100 mV
polarization potential in accordance with NACE SP01-69.
Current interruption tests demonstrated a 100 mV polarization potential was achieved
when 5.9 mA was applied.
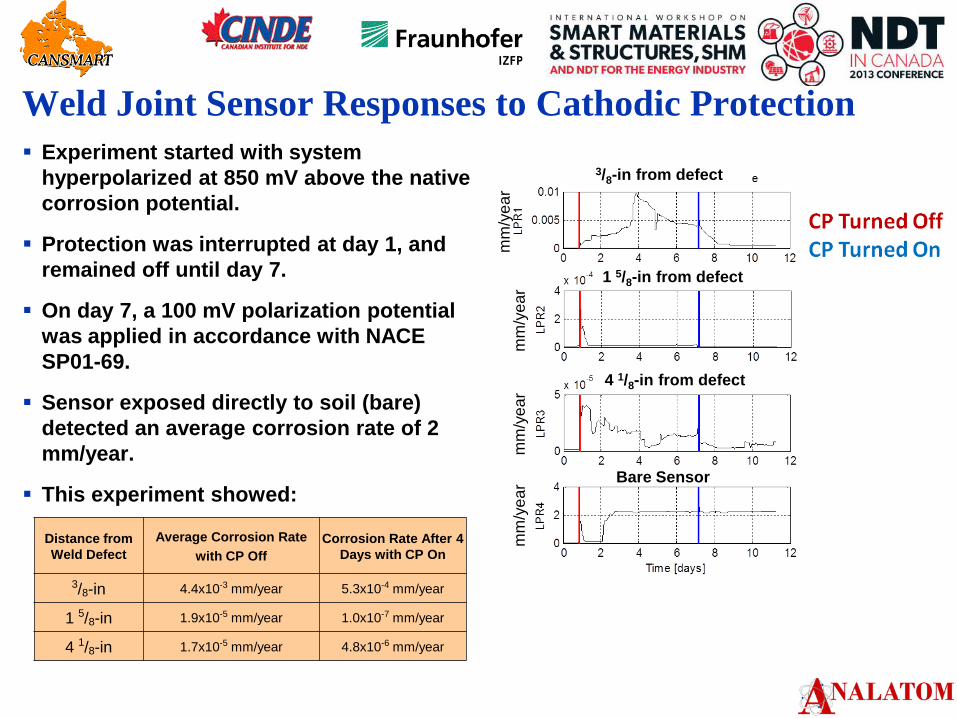
Weld Joint Sensor Responses to Cathodic Protection
Experiment started with system
hyperpolarized at 850 mV above the native
corrosion potential.
Protection was interrupted at day 1, and
remained off until day 7.
On day 7, a 100 mV polarization potential
was applied in accordance with NACE
SP01-69.
Sensor exposed directly to soil (bare)
detected an average corrosion rate of 2
mm/year.
This experiment showed:
3/8-in from defect
1 5/8-in from defect
4 1/8-in from defect
Bare Sensor
mm
/ye
ar
mm
/ye
ar
mm
/ye
ar
mm
/ye
ar
Distance from
Weld Defect
Average Corrosion Rate
with CP Off
Corrosion Rate After 4
Days with CP On
3/8-in 4.4x10⁻³ mm/year 5.3x10⁻⁴ mm/year
1 5/8-in 1.9x10⁻⁵ mm/year 1.0x10⁻⁷ mm/year
4 1/8-in 1.7x10⁻⁵ mm/year 4.8x10⁻⁶ mm/year

Seam Sensor Responses to Cathodic Protection
Experiment started with system
hyperpolarized at 850 mV above the native
corrosion potential.
Protection was interrupted at day 1, and
remained off until day 7.
On day 7, a 100 mV polarization potential
was applied in accordance with NACE
SP01-69.
This experiment showed:
3/8-in from defect
1 5/8-in from defect
4 1/8-in from defect
18-in from defect
mm
/ye
ar
mm
/ye
ar
mm
/ye
ar
mm
/ye
ar
Distance from
Seam Defect
Average Corrosion Rate
with CP Off
Corrosion Rate After 4
Days with CP On
3/8-in 0.03 mm/year 5.5x10⁻³ mm/year
1 5/8-in 1.6x10⁻⁵ mm/year 5.8x10⁻⁶ mm/year
4 1/8-in 1.1x10⁻⁵ mm/year 6.3x10⁻⁶ mm/year
18-in 5.7x10⁻⁵ mm/year 5.4x10⁻⁶ mm/year
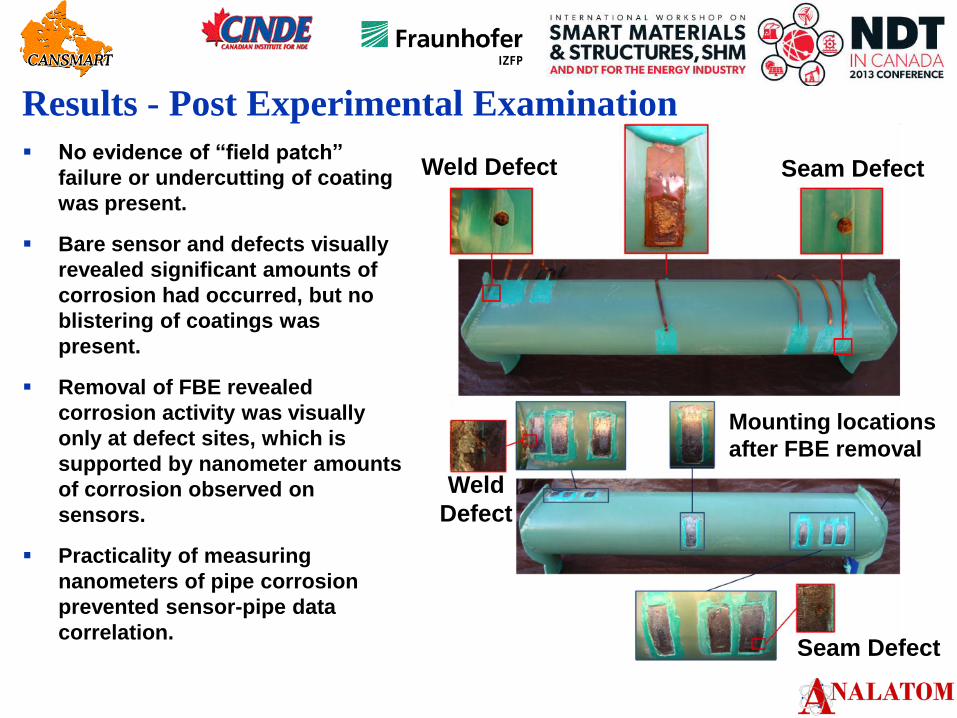
Results - Post Experimental Examination
No evidence of “field patch”
failure or undercutting of coating
was present.
Bare sensor and defects visually
revealed significant amounts of
corrosion had occurred, but no
blistering of coatings was
present.
Removal of FBE revealed
corrosion activity was visually
only at defect sites, which is
supported by nanometer amounts
of corrosion observed on
sensors.
Practicality of measuring
nanometers of pipe corrosion
prevented sensor-pipe data
correlation.
Weld Defect Seam Defect
Weld
Defect
Seam Defect
Mounting locations
after FBE removal

Conclusions
µLPR sensors can be installed on natural gas pipelines without effecting integrity of
fusion-bonded epoxy coating.
Order of magnitude increase in corrosion along the seam defect vs. weld defect.
Little corrosion activity occurred on the pipe. - Surface losses of 130 nm and 11 nm detected near defects over the course of the experiment.
- Small amounts of corrosion seen due to FBE coating quality and timeframe of experiment.
Small amounts of corrosion can be detected over relatively long distances on pipes. - Corrosion measured 18-in from the seam defect.
- Likely can be measured at greater distances.
Cathodic protection did not cause any noise or other adverse effects on sensor.
Corrosion sensors responded to the presence of cathodic protection. - When 850 mV above the corrosion potential was applied all sensors detected no corrosion.
- Cessation of the impressed current caused the sensors to begin showing electrochemical reactions
taking place on the pipe. The magnitude of corrosion varied by location relative to the defect site.
- Application of a 100 mV polarization potential, in accordance with NACE SP01-69, resulted in
corrosion rates falling an order of magnitude or greater in 4 days.