Embed Size (px)
Citation preview
1
Corrosion Control Treatment Answer Key
Copyright © 2001 by the Commonwealth of Pennsylvania. All Rights Reserved.
******
Table of Contents: Module 2 (Basic Corrosion Chemistry) Pages 2 - 3
Module 3 (Lead & Copper Rule Overview) Page 3
Module 4 (Units & Conversions) Pages 3 - 4
Module 5 (Solving Problems Using Units & Conversions) Pages 5 - 8
Additional Unit Cancellation Practice Problems Page 8
Module 6 (pH & Temperature) Pages 8 - 9
Module 8 (Alkalinity & Calcium) Page 10
Module 10 (Phosphate & Silica) Pages 10 - 11
Day 1 Homework Pages 11 - 13
Module 12 (Corrosion principals) Pages 13 - 14
Module 13 (Corrosion Treatment Theory) Pages 14 - 15
Module 14 (pH/Alkalinity Adjustment) Pages 15 - 17
Module 15 (Phosphate / Silicate Inhibitors) Pages 17 - 18
Module 16 (Chemical Feed Systems) Pages 18 - 19
Module 17 (Basic Chemical Feed Calculations 1) Pages 19 - 22
Module 18 (Basic Chemical Feed Calculations 2) Pages 22 - 29
Module 19 (Pump Calibration Workshop) Page 27
Day 2 Homework Pages 27 - 32
Module 20 (Basic Chemical Feed Calculations 3) Pages 33 - 40
Module 21 (Operational Constraints/Startup) Pages 41 - 43
Module 22 (Stock Solution/Jar Test Workshop) Pages 44 - 50
Module 23 (Process Control/Stability Page 51
Module 24 (Process Control Workshop) Pages 52 - 64
Chemical Feed Calculation Practice Problems Pages 64 - 66
2
MODULE 2 - Basic Corrosion Chemistry • The atom is the smallest unit of a chemical element. (Fill in the blank) • Electrons are negatively charged particles which occupy the space around
the nucleus. (Fill in the blank) • An ion is an electrically charged atom formed by the loss or gain of electrons.
(Fill in the blank) • Some of the water molecules naturally separate (or ionize) into two ions: the
hydrogen ion and the hydroxide ion. (Fill in the blanks)
• Substances that produce hydrogen ions in water are called acids. (Fill in the blank)
• A base is a substance that produces hydroxide ions in water. (Fill in the blank) • A salt is the product of combining an acid and a base. (Fill in the blank) • pH is the measurement of the concentration of hydrogen ions in water. (Fill in
the blank)
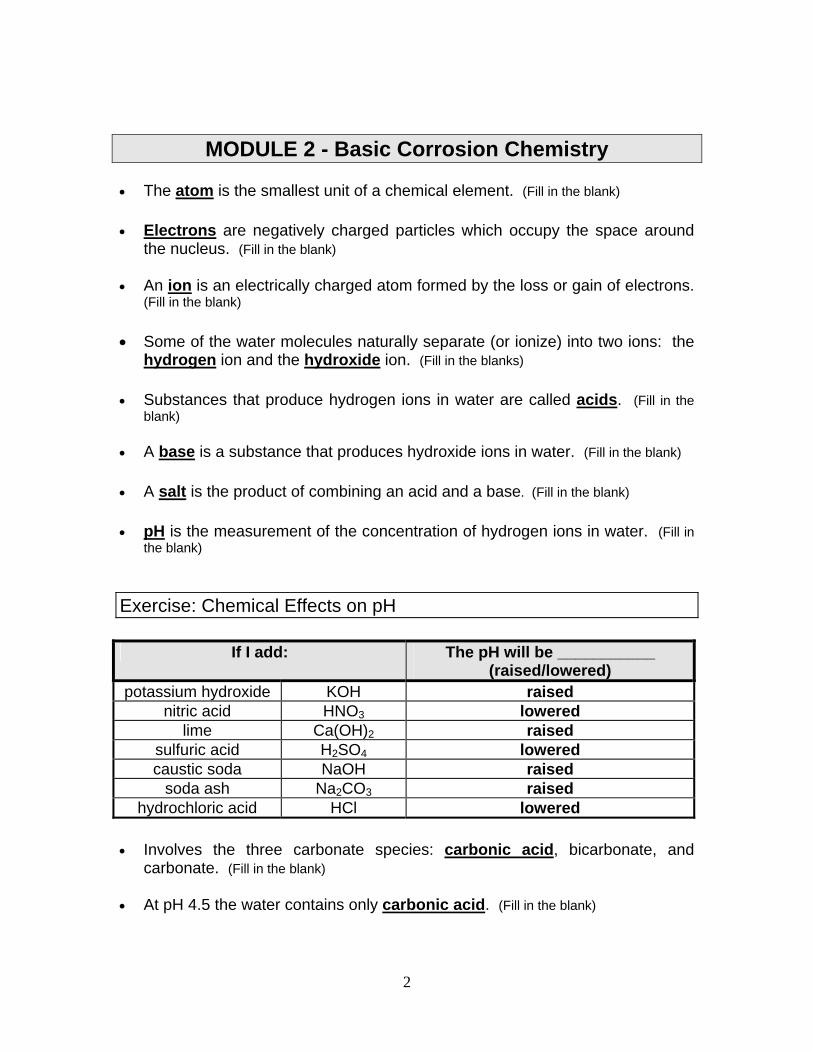
Exercise: Chemical Effects on pH
If I add: The pH will be ___________ (raised/lowered)
potassium hydroxide KOH raised nitric acid HNO3 lowered
lime Ca(OH)2 raised sulfuric acid H2SO4 lowered caustic soda NaOH raised
soda ash Na2CO3 raised hydrochloric acid HCl lowered
• Involves the three carbonate species: carbonic acid, bicarbonate, and
carbonate. (Fill in the blank) • At pH 4.5 the water contains only carbonic acid. (Fill in the blank)
3
• Above 8.3, carbonate begins to form and eventually excess hydroxide ions are formed. (Fill in the blank)
• Electron movement in water causes electricity which makes water corrosive
to metals like lead and copper. (Fill in the blank) • pH is a measure of how acidic or basic a water is. (Fill in the blank) • One goal of corrosion control involves raising pH to neutralize carbonic acid.
(Fill in the blank)
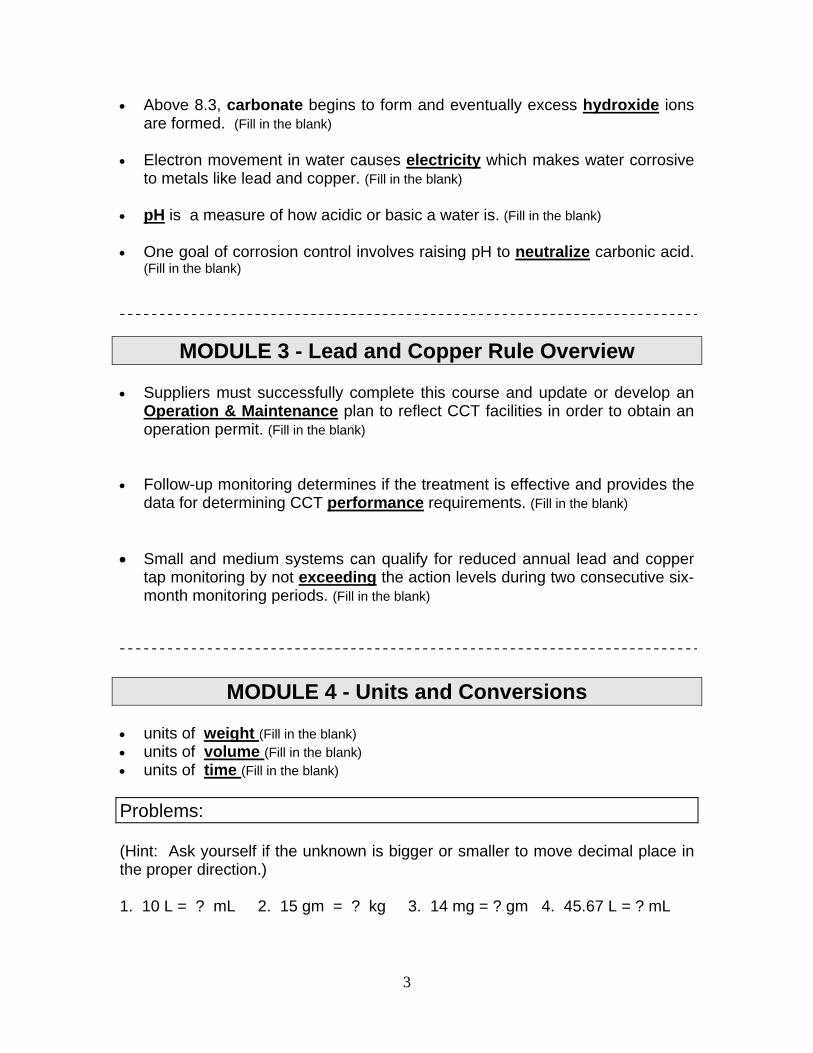
MODULE 3 - Lead and Copper Rule Overview • Suppliers must successfully complete this course and update or develop an
Operation & Maintenance plan to reflect CCT facilities in order to obtain an operation permit. (Fill in the blank)
• Follow-up monitoring determines if the treatment is effective and provides the
data for determining CCT performance requirements. (Fill in the blank) • Small and medium systems can qualify for reduced annual lead and copper
tap monitoring by not exceeding the action levels during two consecutive six-month monitoring periods. (Fill in the blank)
MODULE 4 - Units and Conversions • units of weight (Fill in the blank) • units of volume (Fill in the blank) • units of time (Fill in the blank) Problems: (Hint: Ask yourself if the unknown is bigger or smaller to move decimal place in the proper direction.) 1. 10 L = ? mL 2. 15 gm = ? kg 3. 14 mg = ? gm 4. 45.67 L = ? mL
4
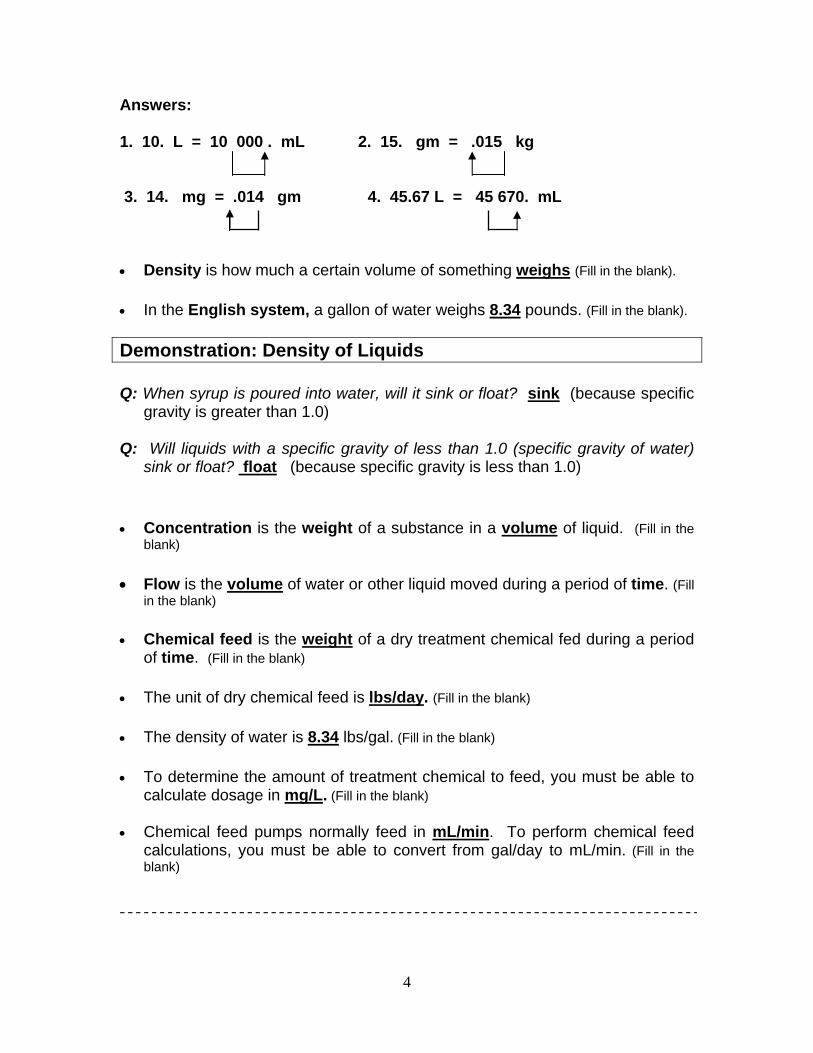
Answers: 1. 10. L = 10 000 . mL 2. 15. gm = .015 kg 3. 14. mg = .014 gm 4. 45.67 L = 45 670. mL • Density is how much a certain volume of something weighs (Fill in the blank). • In the English system, a gallon of water weighs 8.34 pounds. (Fill in the blank). Demonstration: Density of Liquids Q: When syrup is poured into water, will it sink or float? sink (because specific
gravity is greater than 1.0) Q: Will liquids with a specific gravity of less than 1.0 (specific gravity of water)
sink or float? float (because specific gravity is less than 1.0) • Concentration is the weight of a substance in a volume of liquid. (Fill in the
blank) • Flow is the volume of water or other liquid moved during a period of time. (Fill
in the blank) • Chemical feed is the weight of a dry treatment chemical fed during a period
of time. (Fill in the blank) • The unit of dry chemical feed is lbs/day. (Fill in the blank) • The density of water is 8.34 lbs/gal. (Fill in the blank) • To determine the amount of treatment chemical to feed, you must be able to
calculate dosage in mg/L. (Fill in the blank) • Chemical feed pumps normally feed in mL/min. To perform chemical feed
calculations, you must be able to convert from gal/day to mL/min. (Fill in the blank)
5
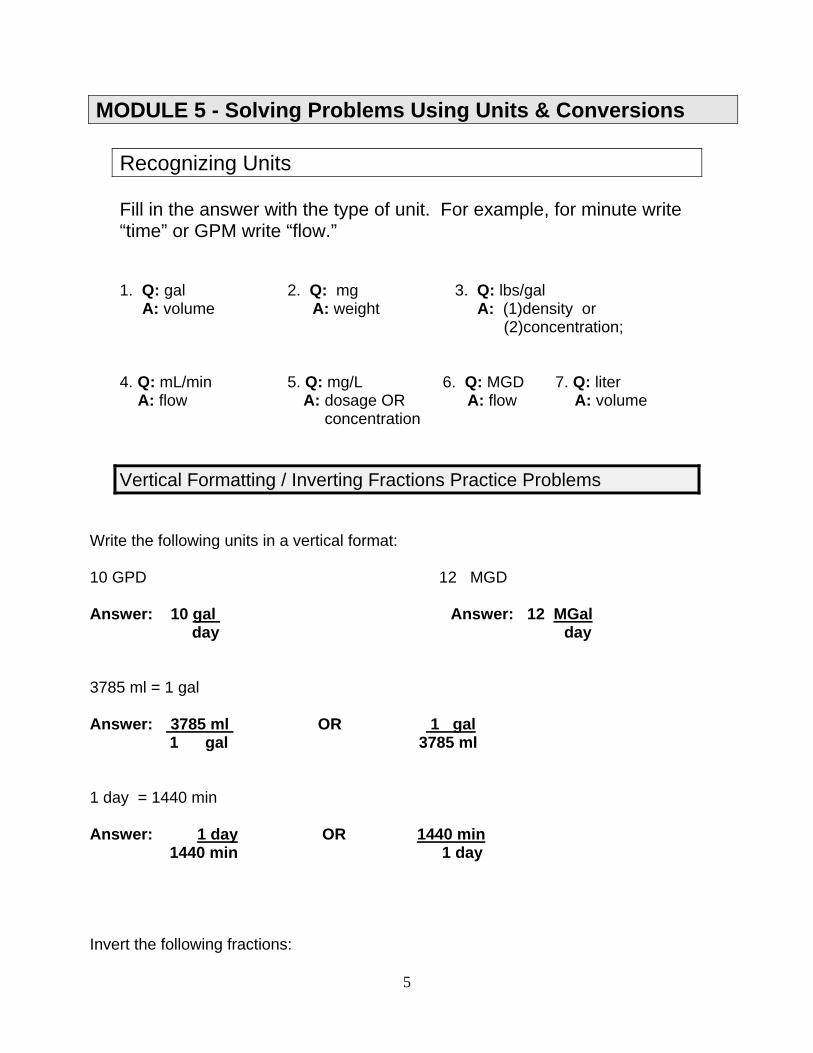
MODULE 5 - Solving Problems Using Units & Conversions Recognizing Units Fill in the answer with the type of unit. For example, for minute write “time” or GPM write “flow.” 1. Q: gal 2. Q: mg 3. Q: lbs/gal
A: volume A: weight A: (1)density or (2)concentration;
4. Q: mL/min 5. Q: mg/L 6. Q: MGD 7. Q: liter
A: flow A: dosage OR A: flow A: volume concentration
Vertical Formatting / Inverting Fractions Practice Problems
Write the following units in a vertical format: 10 GPD 12 MGD Answer: 10 gal Answer: 12 MGal day day 3785 ml = 1 gal Answer: 3785 ml OR 1 gal 1 gal 3785 ml 1 day = 1440 min Answer: 1 day OR 1440 min 1440 min 1 day Invert the following fractions:
6
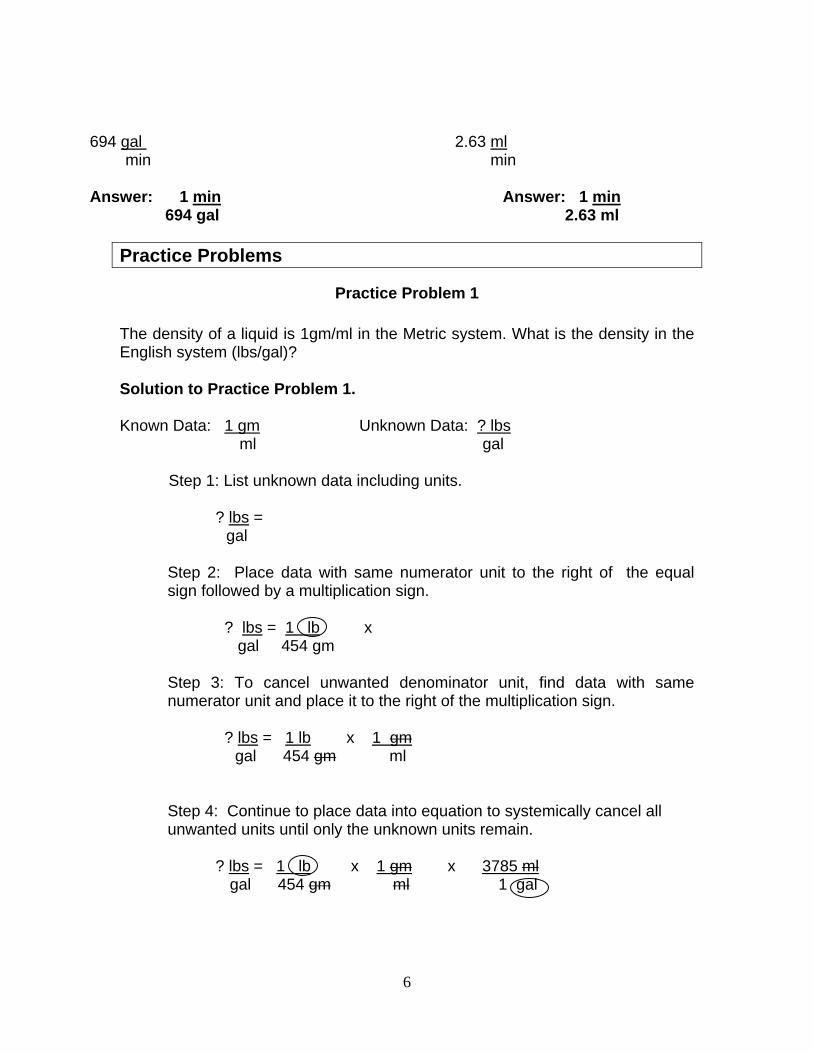
694 gal 2.63 ml min min Answer: 1 min Answer: 1 min 694 gal 2.63 ml
Practice Problems
Practice Problem 1 The density of a liquid is 1gm/ml in the Metric system. What is the density in the English system (lbs/gal)? Solution to Practice Problem 1. Known Data: 1 gm Unknown Data: ? lbs ml gal Step 1: List unknown data including units. ? lbs = gal Step 2: Place data with same numerator unit to the right of the equal sign followed by a multiplication sign. ? lbs = 1 lb x gal 454 gm Step 3: To cancel unwanted denominator unit, find data with same numerator unit and place it to the right of the multiplication sign. ? lbs = 1 lb x 1 gm gal 454 gm ml Step 4: Continue to place data into equation to systemically cancel all unwanted units until only the unknown units remain. ? lbs = 1 lb x 1 gm x 3785 ml gal 454 gm ml 1 gal
7
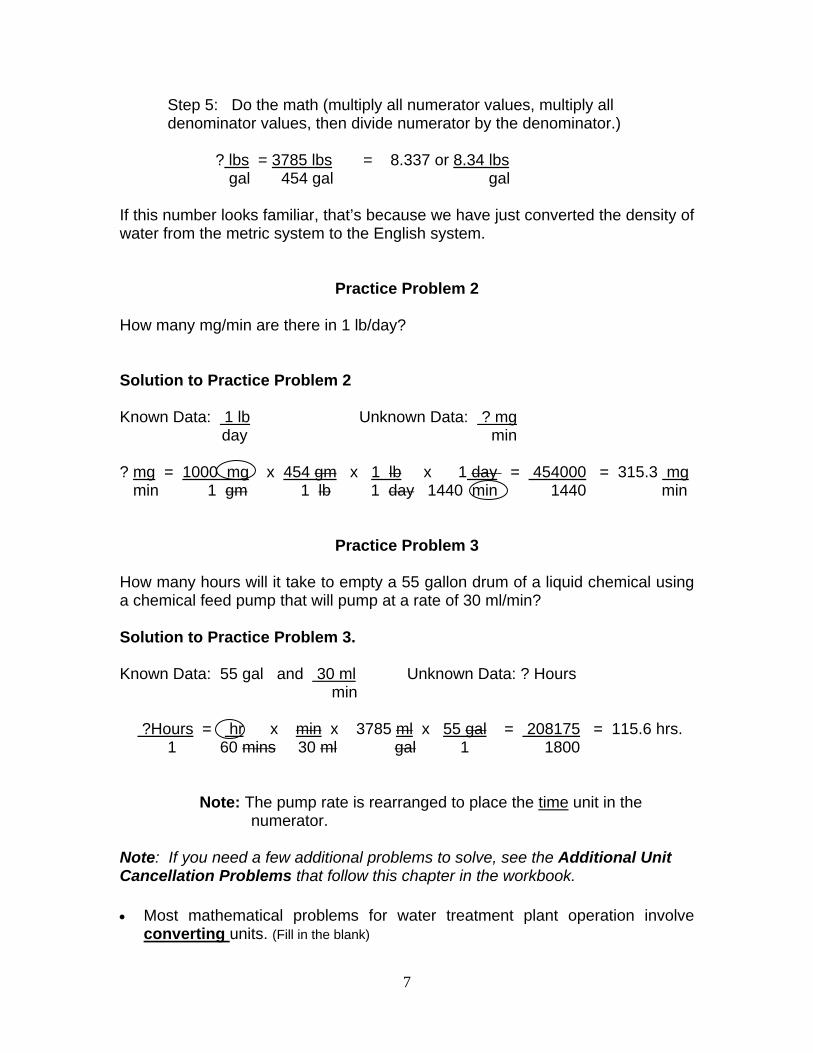
Step 5: Do the math (multiply all numerator values, multiply all denominator values, then divide numerator by the denominator.) ? lbs = 3785 lbs = 8.337 or 8.34 lbs gal 454 gal gal If this number looks familiar, that’s because we have just converted the density of water from the metric system to the English system.
Practice Problem 2
How many mg/min are there in 1 lb/day? Solution to Practice Problem 2 Known Data: 1 lb Unknown Data: ? mg day min ? mg = 1000 mg x 454 gm x 1 lb x 1 day = 454000 = 315.3 mg min 1 gm 1 lb 1 day 1440 min 1440 min
Practice Problem 3
How many hours will it take to empty a 55 gallon drum of a liquid chemical using a chemical feed pump that will pump at a rate of 30 ml/min? Solution to Practice Problem 3. Known Data: 55 gal and 30 ml Unknown Data: ? Hours
min
?Hours = hr x min x 3785 ml x 55 gal = 208175 = 115.6 hrs. 1 60 mins 30 ml gal 1 1800 Note: The pump rate is rearranged to place the time unit in the numerator. Note: If you need a few additional problems to solve, see the Additional Unit Cancellation Problems that follow this chapter in the workbook. • Most mathematical problems for water treatment plant operation involve
converting units. (Fill in the blank)
8
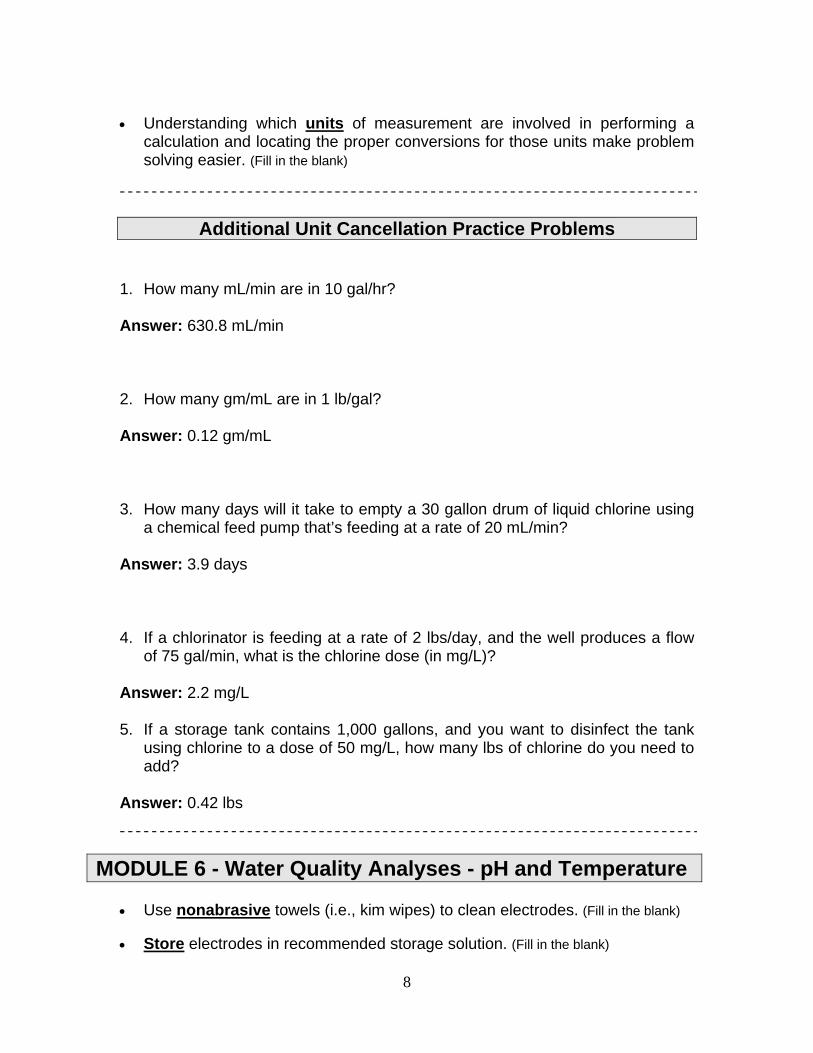
• Understanding which units of measurement are involved in performing a
calculation and locating the proper conversions for those units make problem solving easier. (Fill in the blank)
Additional Unit Cancellation Practice Problems
1. How many mL/min are in 10 gal/hr? Answer: 630.8 mL/min 2. How many gm/mL are in 1 lb/gal? Answer: 0.12 gm/mL 3. How many days will it take to empty a 30 gallon drum of liquid chlorine using
a chemical feed pump that’s feeding at a rate of 20 mL/min? Answer: 3.9 days 4. If a chlorinator is feeding at a rate of 2 lbs/day, and the well produces a flow
of 75 gal/min, what is the chlorine dose (in mg/L)? Answer: 2.2 mg/L 5. If a storage tank contains 1,000 gallons, and you want to disinfect the tank
using chlorine to a dose of 50 mg/L, how many lbs of chlorine do you need to add?
Answer: 0.42 lbs
MODULE 6 - Water Quality Analyses - pH and Temperature
• Use nonabrasive towels (i.e., kim wipes) to clean electrodes. (Fill in the blank)
• Store electrodes in recommended storage solution. (Fill in the blank)
9
• Sealed gel-filled electrodes are disposable. Discard these electrodes when
the gelled reference solution is all used up. (Fill in the blank) • When using a refillable liquid electrode, fill to the proper level: above the level
of the sample or storage solution. (Fill in the blank)
• Ensure injection point does not become clogged. A clogged junction will cause an error or drift in the reading. Some manufacturers recommend soaking the electrode in warm water to unclog the junction. (Fill in the blank)
• Buffer stock solution has a shelf-life of ≈ 1 year. Do not use after the
expiration date. (Fill in the blank) • Buffers prepared for daily use last ≈ 2 or 3 days. Do not pour used buffer
back into the stock solution bottle. (Fill in the blank)
Q: If you know that your raw water pH is ≈ 6.0, which standards would you use for pH analysis? (Answer: 4.00 and 7.00 buffer solutions) Q: If your treated water pH is ≈ 8.0, which standards would you use? (Answer: 7.00 and 10.00 buffers) Q: Why not just use 4.00 and 10.0? (Answer: The calibration procedure requires the use of pH 7.00 buffer to zero the meter (set the isopotential point) and the second buffer should be selected to bracket the expected sample pH. The selected buffer should not be more than two pH units away from the expected value.) • The two buffers used to construct this calibration curve were the pH 7.0 and
10.0 buffers. Now, use your curve to determine the pH of a sample that produced -59 mV. This time, all of us should have a pH of 8.0. (Fill in the blank)
• Perform two-point calibration daily. (Fill in the blanks) • Choose buffers which bracket the expected sample pH. (Fill in the blank) • Analyze samples within 15 minutes of collection. (Fill in the blank) • Analyze samples for pH/temperature measurement within 15 minutes. (Fill in
the blank) • Perform two-point calibration daily for accurate pH measurement. (Fill in the
blanks)
10
MODULE 8 - Water Qlty Analyses: Alkalinity & Calcium • Titration is a method of analyzing the composition of a solution by adding
known amounts of a standardized solution until a given reaction or end point is produced. (Fill in the blank)
• The end point can be a pH change or a color change. (Fill in the blanks) • Total alkalinity as CaCO3 is determined by titration with a sulfuric acid
(H2SO4) standard solution to an end point determined with a calibrated pH meter. That end point is a pH 4.5. (Fill in the blank)
Q: At what pH does the water contain only carbonic acid? (Answer: pH 4.5) Q: At what pH is the alkalinity concentration ≈ 0? (Answer: pH 4.5.) • Collect a sufficient volume (100-200 mL is required for either method). (Fill in
the blank) • Analyze samples as soon as possible after collection. (Fill in the blank) • Analyze samples as soon as possible after sample collection. (Fill in the blank) • A QC program is critical for accurate measurement. (Fill in the blank) MODULE 10 - Wtr Qlty Analyses - Phosphorus & Silica • Use clean, scratch-free sample cells. Wash cells with phosphate-free
detergent and rinse thoroughly with distilled or deionized water. Rinse with 1:1 HCl when needed. (Fill in the blank)
• Extreme background turbidity or color in a sample can interfere with
colorimetric analyses. (Fill in the blank)
• Colorimeters must be zeroed with a blank before unknown solutions can be measured. The method will specify the use of a sample blank or a reagent blank. (Fill in the blank)
• A sample blank is used to compensate for minimal background color inherent
in the sample. To compensate, zero the instrument with the sample prior to addition of any reagents. (Fill in the blank)
11
• A reagent blank is used when the reagent itself adds color to the sample and results in a positive error. To compensate, zero the instrument with distilled or deionized water mixed with the reagents. (Fill in the blank)
• Collect ≈100 mL for phosphorus or silica measurement. (Fill in the blank) • Analyze samples as soon as possible after collection. (Fill in the blank)
• Analyze samples for phosphorus and silica measurement as soon as
possible after collection. (Fill in the blank)
Day 1 Homework
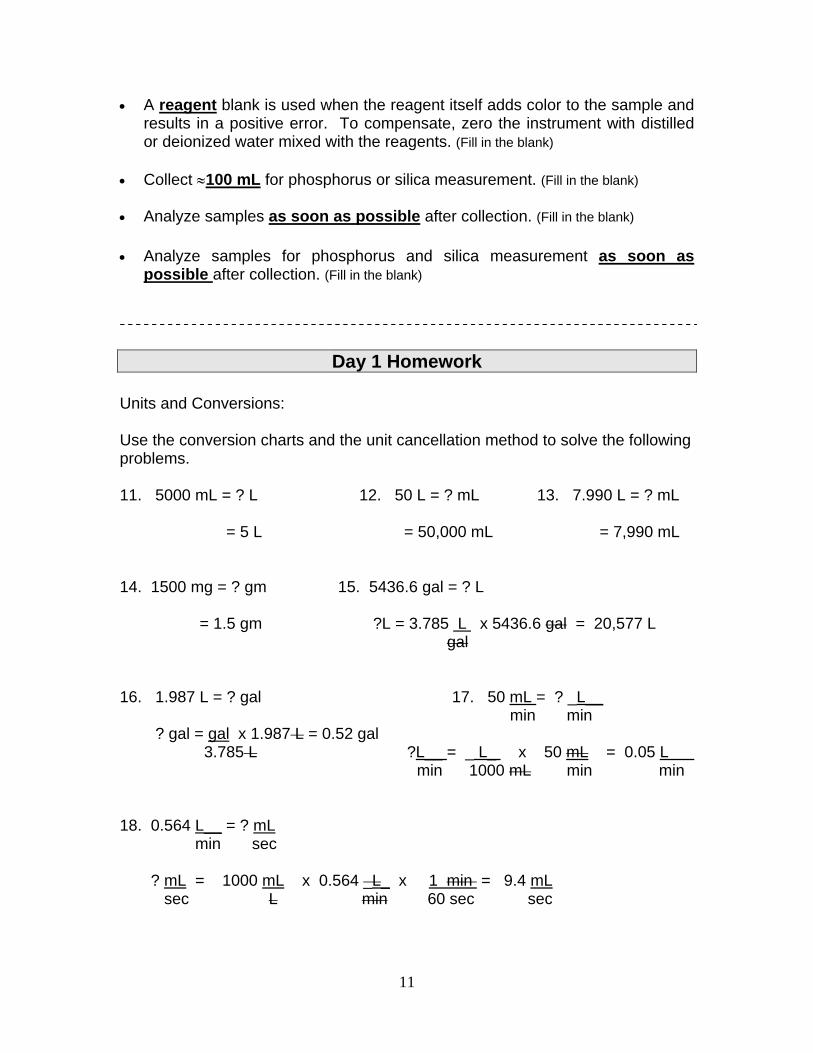
Units and Conversions: Use the conversion charts and the unit cancellation method to solve the following problems. 11. 5000 mL = ? L 12. 50 L = ? mL 13. 7.990 L = ? mL = 5 L = 50,000 mL = 7,990 mL 14. 1500 mg = ? gm 15. 5436.6 gal = ? L = 1.5 gm ?L = 3.785 L x 5436.6 gal = 20,577 L gal 16. 1.987 L = ? gal 17. 50 mL = ? _L__ min min ? gal = gal x 1.987 L = 0.52 gal 3.785 L ?L__ = _ L_ x 50 mL = 0.05 L min 1000 mL min min 18. 0.564 L__ = ? mL min sec ? mL = 1000 mL x 0.564 _L_ x 1 min = 9.4 mL sec L min 60 sec sec
12
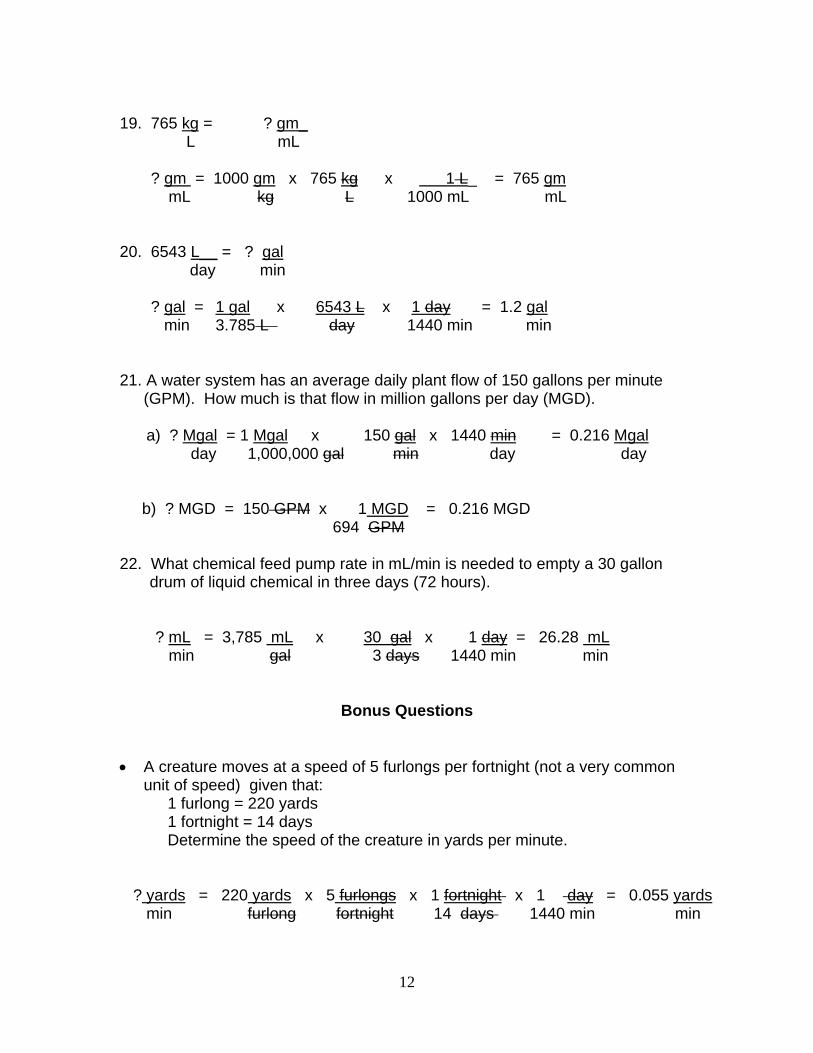
19. 765 kg = ? gm_ L mL ? gm = 1000 gm x 765 kg x 1 L_ = 765 gm mL kg L 1000 mL mL 20. 6543 L__ = ? gal day min ? gal = 1 gal x 6543 L x 1 day = 1.2 gal min 3.785 L day 1440 min min
21. A water system has an average daily plant flow of 150 gallons per minute (GPM). How much is that flow in million gallons per day (MGD).
a) ? Mgal = 1 Mgal x 150 gal x 1440 min = 0.216 Mgal day 1,000,000 gal min day day b) ? MGD = 150 GPM x 1 MGD = 0.216 MGD 694 GPM 22. What chemical feed pump rate in mL/min is needed to empty a 30 gallon
drum of liquid chemical in three days (72 hours). ? mL = 3,785 mL x 30 gal x 1 day = 26.28 mL min gal 3 days 1440 min min
Bonus Questions • A creature moves at a speed of 5 furlongs per fortnight (not a very common
unit of speed) given that: 1 furlong = 220 yards 1 fortnight = 14 days Determine the speed of the creature in yards per minute. ? yards = 220 yards x 5 furlongs x 1 fortnight x 1 day = 0.055 yards min furlong fortnight 14 days 1440 min min
13
• If a person weezes 20 times per cough, how many tissues will he use per bowl of soup if:
5 weezes = 1 sneeze 3 sneezes = 1 tissue 4 coughs = 1 bowl of soup ? tissues = bowl Answer: 5.33 tissues bowl
MODULE 12 - Corrosion Principles Q: Where does the lead in drinking water usually come from? (Answer: lead pipes, solder, brass fittings) Q: How about copper? (Answer: copper pipes in home plumbing)
• Anode - where electrons are lost through the metal. (Fill in the blank)
• Cathode - where electrons are gained and then leave the metal. (Fill in the blank)
Factors Affecting Corrosion
• pH: As pH increases, corrosion decreases. (Fill in the blank)
• Alkalinity: In most cases, as alkalinity increases, corrosion decreases.
(Fill in the blank)
• Total dissolved solids (TDS): So, as TDS increases, corrosion increases. (Fill in the blank)
• Temperature: In general, as temperature increases, corrosion increases
because the rate of chemical reactions increases with increased temperature. (Fill in the blank)
14
• Dissolved oxygen (DO): As DO increases, corrosion increases, because oxygen accepts electrons at the cathode and allows the electrical circuit to continue. (Fill in the blank)
• Chlorides, Sulfates, Nitrates: As these increase, corrosion increases,
because they all add TDS to the water increasing its conductivity. (Fill in the blank)
• Chlorine: As the addition of gas chlorine increases, corrosion increases,
because it reduces pH. (Fill in the blank)
LCR Corrosion Control Treatment Alternatives
• pH/alkalinity adjustment (Fill in the blank)
• Corrosion inhibitors (Fill in the blank)
• The chemistry of the water has the greatest effect on corrosion. (Fill in the blank)
• Controlling lead/copper is achieved by forming a protective layer on the pipe
wall that eliminates the corrosion cell. (Fill in the blank) MODULE 13 - Corrosion Treatment Theory Q: Do you recall from earlier lessons what compounds make up the carbonate system? (Answer: carbonic acid, bicarbonate, carbonate and we can add hydroxide since it is an important part of the chemistry) At pH = 6.0 raw water probably contains mostly carbonic acid, which makes the water corrosive. (Fill in the blank) If we continue to add more chemical, some of the bicarbonate will be converted to carbonate and hydroxide. (Fill in the blank) The approach is to add a base to the water to increase pH to reduce lead solubility. (Fill in the blank) The key to success is to maintain a stable pH after treatment. (Fill in the blank) pH is the most important factor. (Fill in the blank)
15
pH should not be less than 7; above a pH of 8.0 is best for copper reduction. (Fill in the blank) Stable pH is necessary to maintain protection. (Fill in the blank) Alkalinity should be at least 20 mg/L for pH control. (Fill in the blank) For systems with copper problems only (no lead problems), adjust pH above 8.0. (Fill in the blank) Orthophosphates are by far the most widely used inhibitors for lead control. (Fill in the blank)
MODULE 14 - CCT Chemicals: pH/Alkalinity Adjustment pH is the major factor that determines the solubility of most pipe materials. (Fill in the blank) Most easily implemented and least costly. (Fill in the blank)
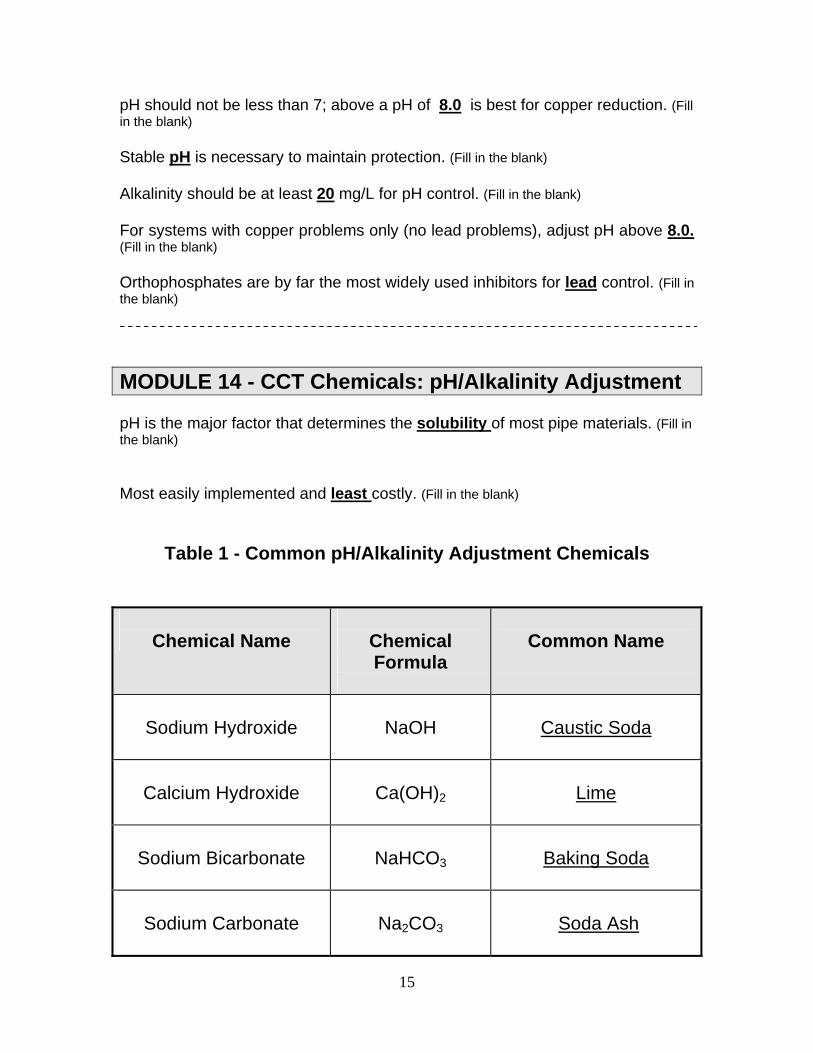
Table 1 - Common pH/Alkalinity Adjustment Chemicals
Chemical Name
Chemical Formula
Common Name
Sodium Hydroxide
NaOH
Caustic Soda
Calcium Hydroxide
Ca(OH)2
Lime
Sodium Bicarbonate
NaHCO3
Baking Soda
Sodium Carbonate
Na2CO3
Soda Ash
16
Do these chemicals act like acids or bases? Answer: bases Are caustic soda and lime stronger or weaker bases than soda ash and sodium bicarbonate? Answer: stronger
Operator Tips: Lime
• Use flexible pipelines to break CaCO3 deposits. (Fill in the blank) • Minimize length of line by placing feeder as close as possible to point of
application. (Fill in the blank)
• Lime, sodium bicarbonate, and soda ash are delivered as dry chemicals but are fed as liquids. (Fill in the blank)
• Caustic soda is dangerous to handle. The Material Data Safety Sheet (MSDS) sheet for 50% caustic soda is 9 pages long and contains detailed information about:
∗ health hazards
∗ special protection
∗ handling and storage precautions
∗ special mixing precautions
∗ warning label information
∗ physical data (density, specific gravity which you will need to calculate dosages)
17
• pH adjustment is least costly and most easily implemented type of
corrosion control treatment. (Fill in the blank)
• Sodium bicarbonate is used primarily to adjust alkalinity. (Fill in the blank)
• Soda ash provides both pH and alkalinity adjustment and is a safe and easy chemical to use. (Fill in the blank)
• In order to prevent freezing of 50% caustic soda, you should keep the
storage area heated. (Fill in the blank) MODULE 15 - CCT Chems: Phosphate/Silicate Inhibitors • Taste, odor, alkalinity and pH are not affected; hardness not increased. (Fill in
the blank)
• Finished water pH is lower; therefore, chlorine doses and TTHM formation potential may be lower than with pH adjustment. (Fill in the blank)
• They may encourage algal growth in reservoirs exposed to sunlight. (Fill in the
blank)
• Zinc is often added to enhance phosphate performance; however, wastewater treatment plants have sludge disposal problems due to the elevated zinc levels. (Fill in the blank)
∗ Cleaning mains by flushing or with hydraulic pigs. ( A process that removes
severe tuberculation and slime build up by brushing or scraping.) (Fill in the blank)
∗ Maintaining continuous feed. (Interrupting feed makes corrosion worse.) (Fill
in the blank) • Phosphate/Silicate inhibitors develop a very thin protective insoluble metallic
fim on the inside of the pipes which won’t clog the pipes. (Fill in the blank) • Polyphosphates are used to sequester iron, manganese, and calcium. (Fill in
the blank) • Zinc orthophosphates are used primarily to control lead levels but are not as
effective for copper. (Fill in the blank)
18
• Silicate inhibitors do not add zinc to the system and are used extensively in point-of-use applications such as buildings and industrial processes. (Fill in the blank)
MODULE 16 - Chemical Feed Systems • An operator can use this information to track inventory and to verify the
dosage of chemical being fed. (Fill in the blank) Q: Where should the suction assembly be installed? (Answer: Suspended just above the bottom of the tank so as not to pull in any solids that may have settled out.) • A calibration chamber consists of a graduated cylinder typically located on the
suction side of the pump. (Fill in the blank) • The valve relieves pressure if the line becomes clogged, a valve is
inadvertently closed, or if the pump produces pressures higher than the piping system can withstand. (Fill in the blank)
• The valve also aids in priming the pump. (Provides a release for entrapped
air.) (Fill in the blank)
1. Observe its operation daily. (Fill in the blank)
2. Maintain a regular schedule of preventive maintenance. (Fill in the blank) • The suction assembly should be examined and cleaned on a regular basis. A
clogged assembly can be cleaned with a weak acid solution (i.e., vinegar or 1:1 HCl). (Fill in the blank)
• Valves used with corrosive chemicals should be disassembled and inspected
at least annually. Parts showing signs of deterioration should be replaced. (Fill in the blank)
• A ball valve caked with chemical may stick and cause siphoning. (Fill in the
blank) • A worn seal may form an air leak that could lower the pump output or cause
the pump to lose prime. (Fill in the blank) • Observe the operation of feed systems daily. (Fill in the blank) • Establish a preventive maintenance schedule. (Fill in the blank)
19
• Establish and maintain proper O&M for stable water quality. (Fill in the blank) MODULE 17 - Chem Feed Calc 1 - Intro & Dry Chem Feed • Product Feed Rate. (Fill in the blank) • Chemical Dosage. (Fill in the blank) • The amount of dry chemical in the treated water is referred to as dosage.
(Fill in the blank) • Chemical dosage is almost always given in units of mg/L. Mg/L is also
referred to as parts per million. (Fill in the blank) • The amount of dry chemical in the chemical product is called product
strength. (Fill in the blank)
• If you are feeding a liquid, the product strength is the weight of dry chemical in a volume of liquid product. (Fill in the blanks)
• For dry product feed, the units are usually lbs/day. Sometimes dry chemical
feed is calculated in gm/min. (Fill in the blank)
• If the product is fed as a liquid, most systems will have metering pumps that feed in mL/min. Some larger systems may feed liquid chemicals at a GPM or GPH rate. (Fill in the blank)
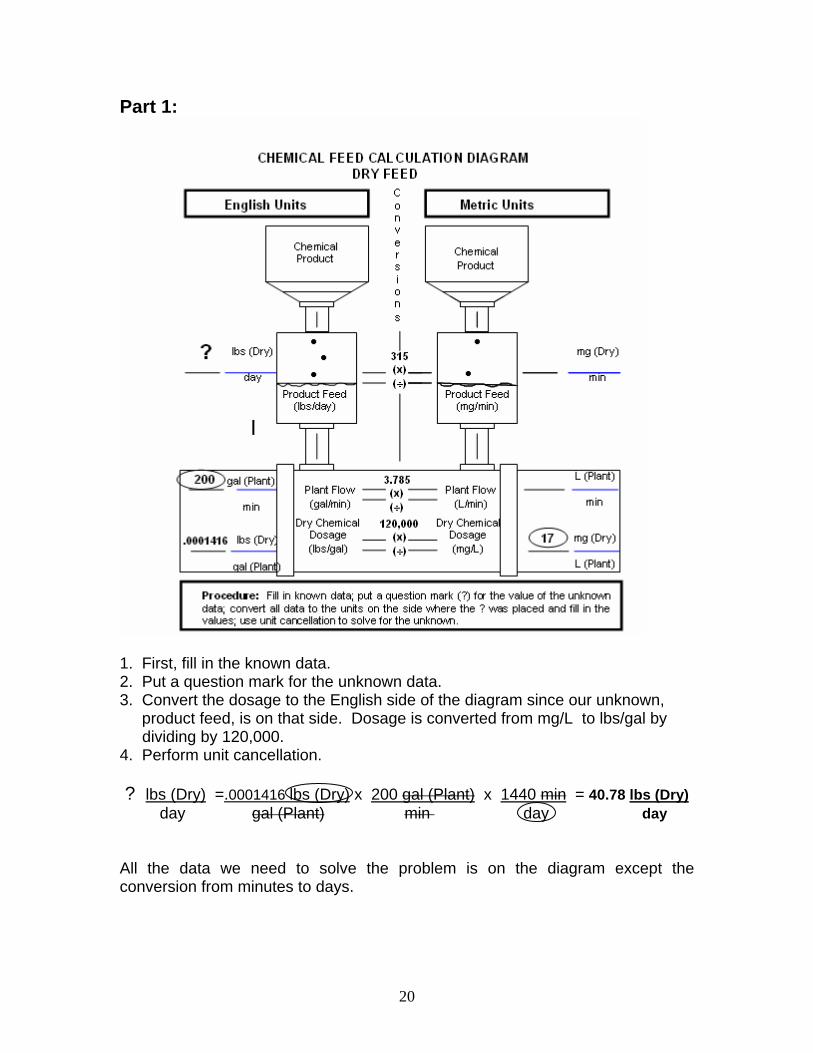
Chemical Feed Problem Your water system uses a dry feed system for lime which feeds in lbs/day. Part 1: How many lbs/day of lime are needed for a desired dosage
of 17 mg/L when the average daily plant flow is 200 GPM?
20
Part 1:
1. First, fill in the known data. 2. Put a question mark for the unknown data. 3. Convert the dosage to the English side of the diagram since our unknown, product feed, is on that side. Dosage is converted from mg/L to lbs/gal by dividing by 120,000. 4. Perform unit cancellation. ? lbs (Dry) =.0001416 lbs (Dry) x 200 gal (Plant) x 1440 min = 40.78 lbs (Dry) day gal (Plant) min day day All the data we need to solve the problem is on the diagram except the conversion from minutes to days.
21
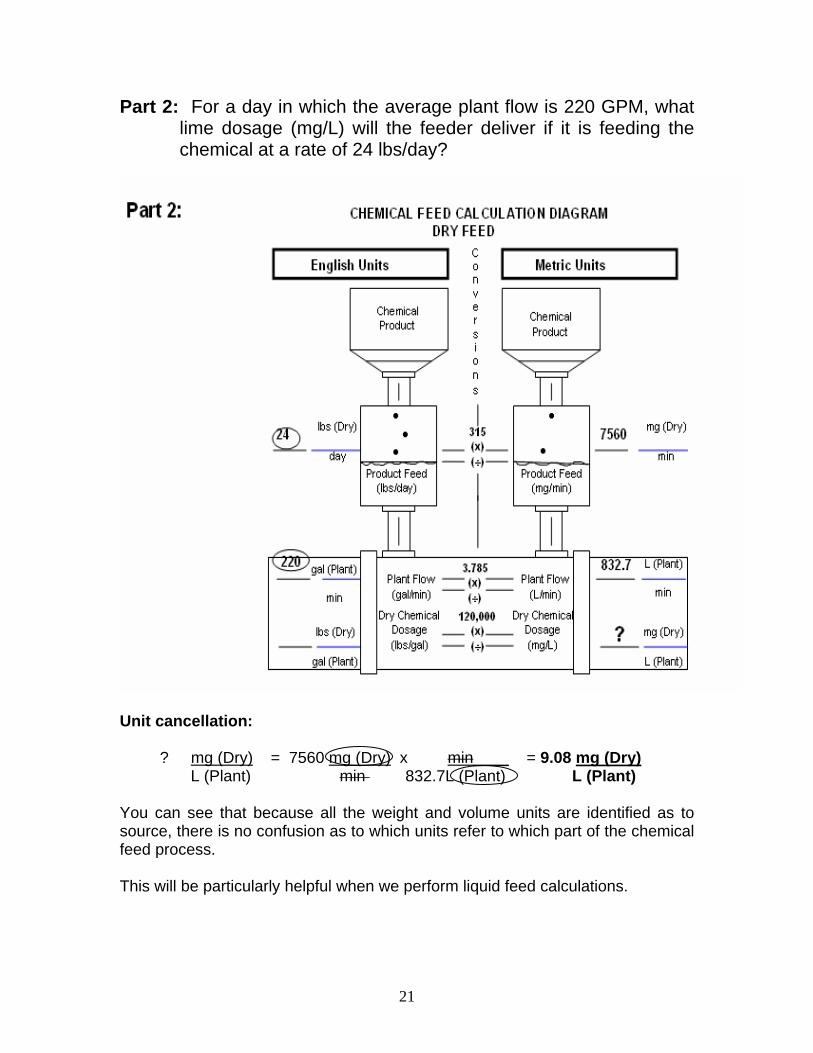
Part 2: For a day in which the average plant flow is 220 GPM, what lime dosage (mg/L) will the feeder deliver if it is feeding the chemical at a rate of 24 lbs/day?
Unit cancellation: ? mg (Dry) = 7560 mg (Dry) x min____ = 9.08 mg (Dry) L (Plant) min 832.7L (Plant) L (Plant) You can see that because all the weight and volume units are identified as to source, there is no confusion as to which units refer to which part of the chemical feed process. This will be particularly helpful when we perform liquid feed calculations.
22
Unit cancellation:
1. Chemical Product Strength. (Fill in the blank) 2. Product Feed Rate. 3. Plant Flow. (Fill in the blank) 4. Chemical Dosage.
• Dosage is based on the amount of dry chemical fed, no matter whether the
chemical is fed dry or as a liquid. (Fill in the blank) MODULE 18 – Chem Feed Calcs 2 - Liquid Chem Feed Q1: What is density? (Density is how much a certain volume of something weighs. Density is weight/volume.) Q2: Now, what is specific gravity? (Specific gravity is the density of something
compared to the density of water.) S.G. = Density “X” Density H2O
From the conversion charts, the density of water in the English system is 8.34 lbs/gal.
Q3: If a substance has a density of 11.3 lbs/gal, what is its specific gravity?
(Density of substance) = 11.3 lbs/gal = 1.35 (Density of water) 8.34 lbs/gal Q4: What are the units of specific gravity? (Specific gravity has no units, the density units cancel out.) Q5: If a liquid chemical has a specific gravity of 1.28, what is its density in metric
units and in English units? (Metric: 1.28 gm/mL; English: 10.7 lbs/gal) The density in metric units (gm/mL) is the same as the specific gravity. The density in English units is 1.28 x 8.34 lbs/gal (density of water) or 10.7 lbs/gal
23
Example Problem: Calculating Product Strength
Example Problem 1: You receive a delivery of 25% caustic soda in a 55 gallon drum. The product information indicates that the density is 11.1 lbs/gal. What is the product strength? In other words, how many lbs of dry caustic soda are in a gallon of liquid product? Product Strength (lbs/gal) = Product Density (lbs/gal) x Percent Strength 100 = 11.1 lbs/gal x _25_
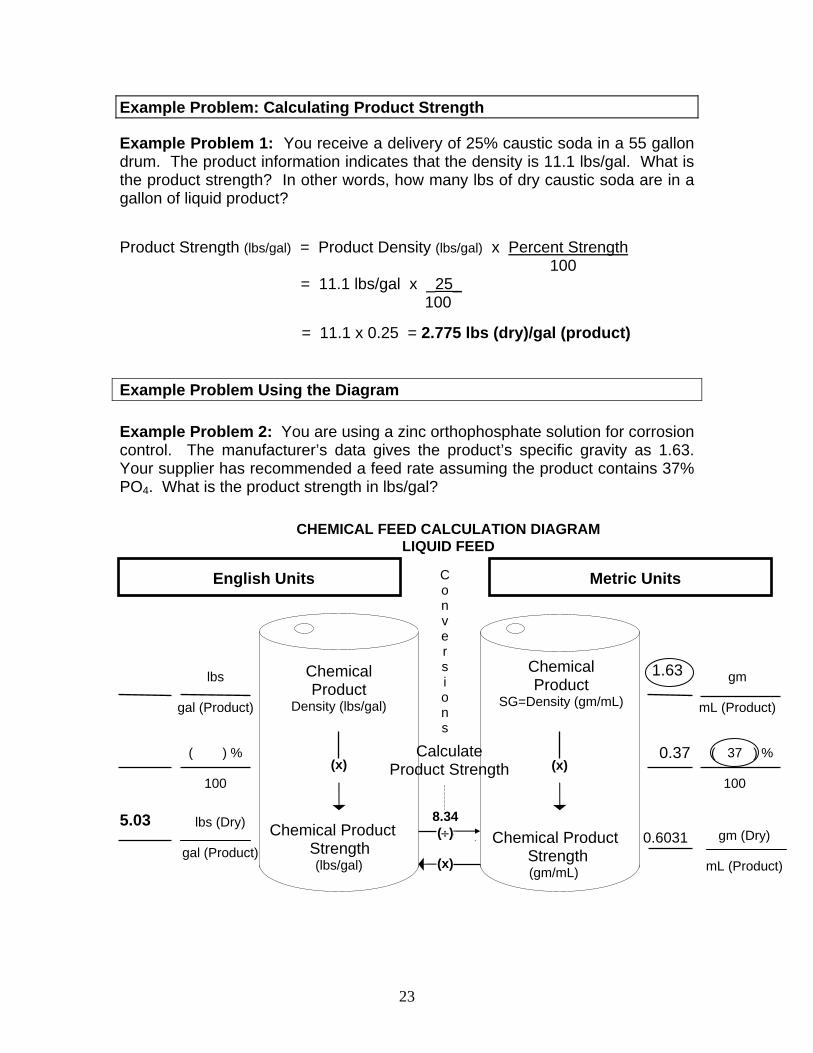
100 = 11.1 x 0.25 = 2.775 lbs (dry)/gal (product) Example Problem Using the Diagram Example Problem 2: You are using a zinc orthophosphate solution for corrosion control. The manufacturer’s data gives the product’s specific gravity as 1.63. Your supplier has recommended a feed rate assuming the product contains 37% PO4. What is the product strength in lbs/gal?
English Units Metric Units 1.63 0.37 5.03 0.6031
Chemical Product
SG=Density (gm/mL)
(x)
Chemical Product
Density (lbs/gal)
(x)
Chemical Product Strength (gm/mL)
C o n v e r s i o n s
Calculate Product Strength
Chemical Product Strength
(lbs/gal)
CHEMICAL FEED CALCULATION DIAGRAM LIQUID FEED
gm
mL (Product)
( 37 ) %
100
gm (Dry)
mL (Product)
8.34 (÷)
(x)
lbs (Dry)
gal (Product)
( ) %
100
lbs
gal (Product)
24
Solution Steps:
1. This problem involves specific gravity; so you fill in the density on the Metric (right ) side of the diagram. In the Metric system, specific gravity equals density.
2. Fill in the percent/100 or 0.37 and multiply. 3. Since the problem asks for product strength in lbs/gal, the diagram directs
you to multiply the Metric value by 8.34, which yields 5.03 lbs (dry)/gal (product).
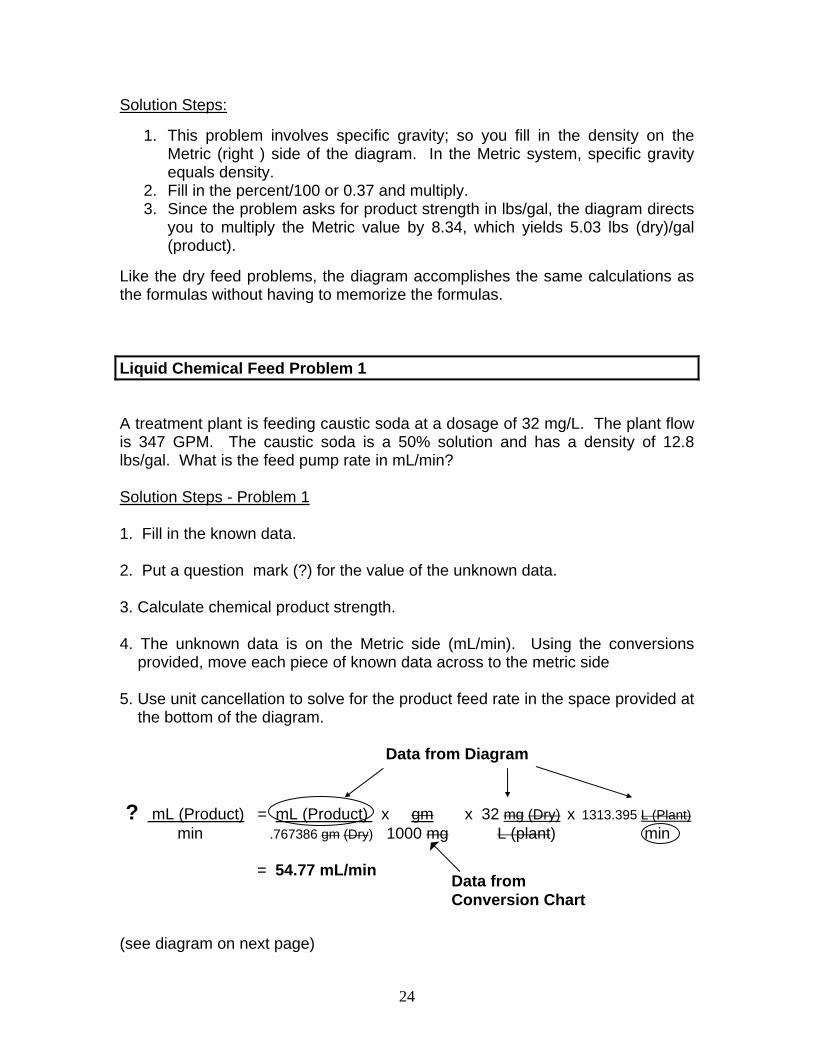
Like the dry feed problems, the diagram accomplishes the same calculations as the formulas without having to memorize the formulas. Liquid Chemical Feed Problem 1 A treatment plant is feeding caustic soda at a dosage of 32 mg/L. The plant flow is 347 GPM. The caustic soda is a 50% solution and has a density of 12.8 lbs/gal. What is the feed pump rate in mL/min? Solution Steps - Problem 1
1. Fill in the known data. 2. Put a question mark (?) for the value of the unknown data. 3. Calculate chemical product strength. 4. The unknown data is on the Metric side (mL/min). Using the conversions
provided, move each piece of known data across to the metric side 5. Use unit cancellation to solve for the product feed rate in the space provided at
the bottom of the diagram. Data from Diagram ? mL (Product) = mL (Product) x gm x 32 mg (Dry) x 1313.395 L (Plant) min .767386 gm (Dry) 1000 mg L (plant) min = 54.77 mL/min (see diagram on next page)
Data from Conversion Chart
25
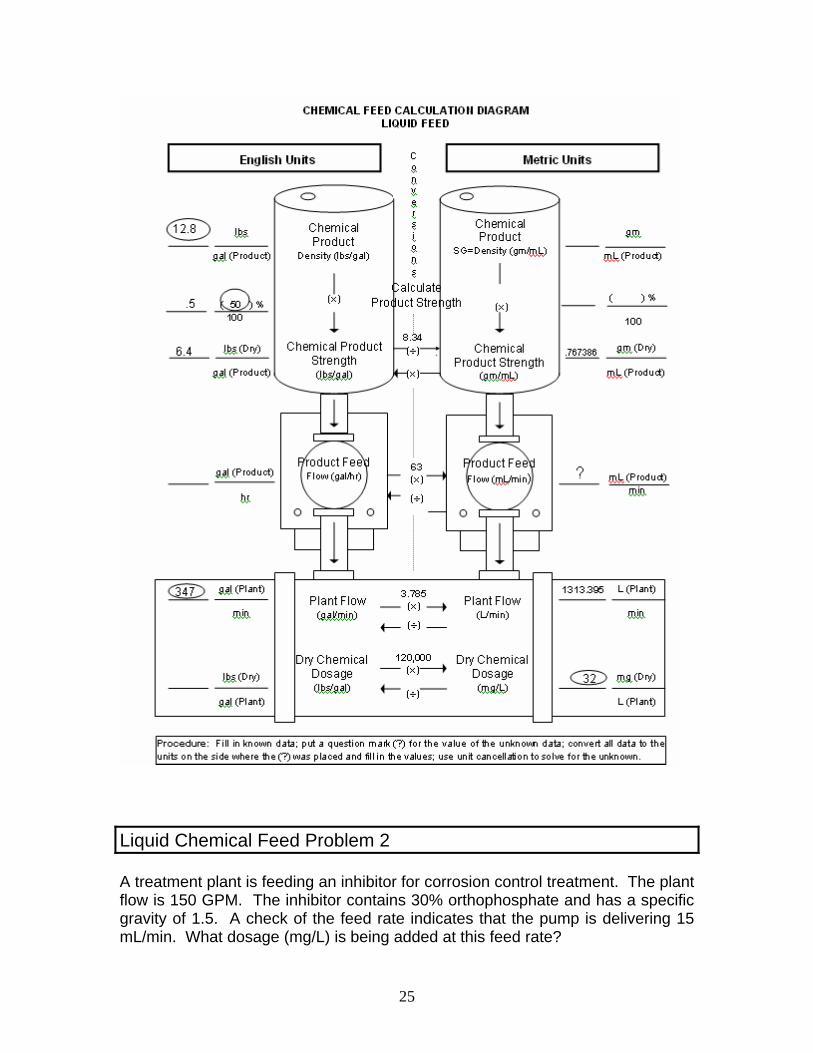
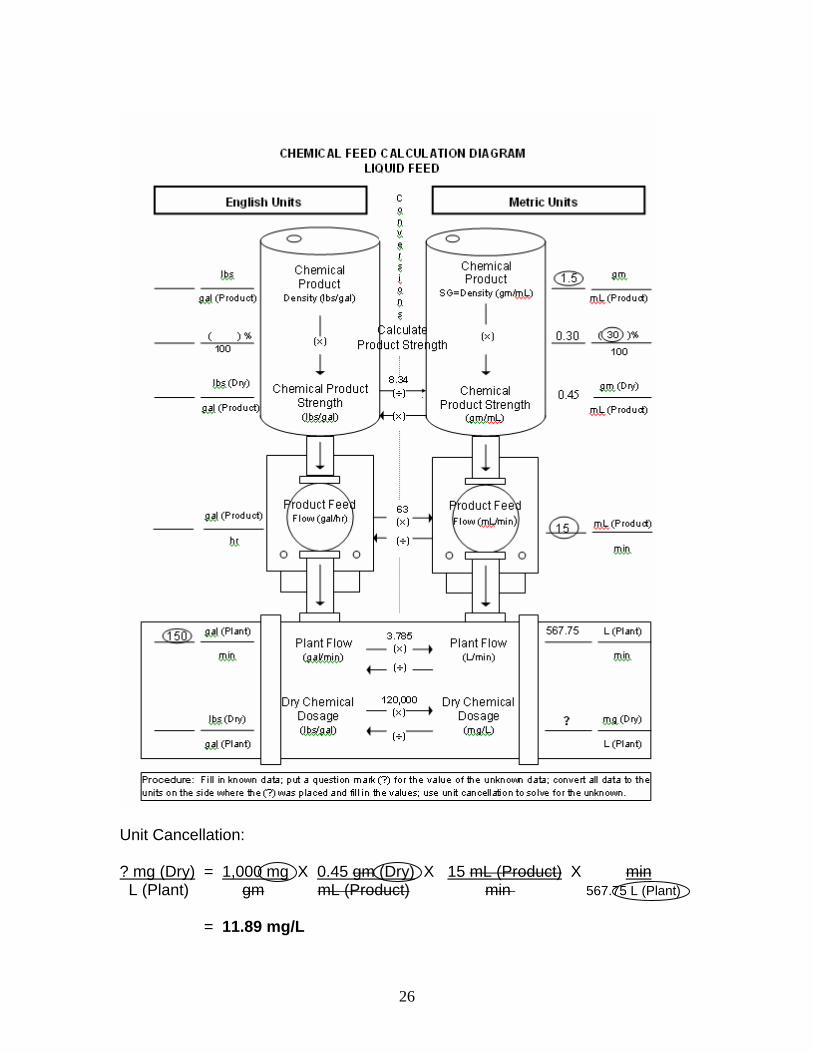
Liquid Chemical Feed Problem 2 A treatment plant is feeding an inhibitor for corrosion control treatment. The plant flow is 150 GPM. The inhibitor contains 30% orthophosphate and has a specific gravity of 1.5. A check of the feed rate indicates that the pump is delivering 15 mL/min. What dosage (mg/L) is being added at this feed rate?
26
Unit Cancellation: ? mg (Dry) = 1,000 mg X 0.45 gm (Dry) X 15 mL (Product) X min L (Plant) gm mL (Product) min 567.75 L (Plant) = 11.89 mg/L
27
• Understanding and using chemical product information is the most difficult and confusing part of liquid feed calculations. (Fill in the Blank)
• Dosage is based on how much dry chemical is fed, even for liquid
chemicals. (Fill in the Blank)
MODULE 19 - Pump Calibration Workshop
Operator Tips: Pump Calibration
• Pump calibration is conducted to determine the pump’s feed rate.
• A pump calibration curve is constructed to serve as a quick reference should the pump setting need to be adjusted in response to varying water quality or chemical demand.
• The pump speed setting equals the number of strokes per minute. A
pump calibration should run for at least 50 strokes at each setting.
• If a calibration curve is constructed in ascending (increasing) order and a decrease in pump output is required, the pump control dial(s) should be turned down below the desired setting and then slowly increased to the appropriate setting. Q: Why? (Answer: Pump output is different going up the scale than it is going down the scale. Output from 30 - 40 is different than 40 - 30.)
• Conduct a pump calibration to determine the pump’s feed rate.
• Perform calibrations at least once per year.
Day Two Homework Plant Data - Practice Borough Water Authority • Average plant flow = 80 GPM • pH adjustment chemical - 25 percent caustic soda; S.G. 1.27 • Target finished water pH is 8.5 Operator Tools
28
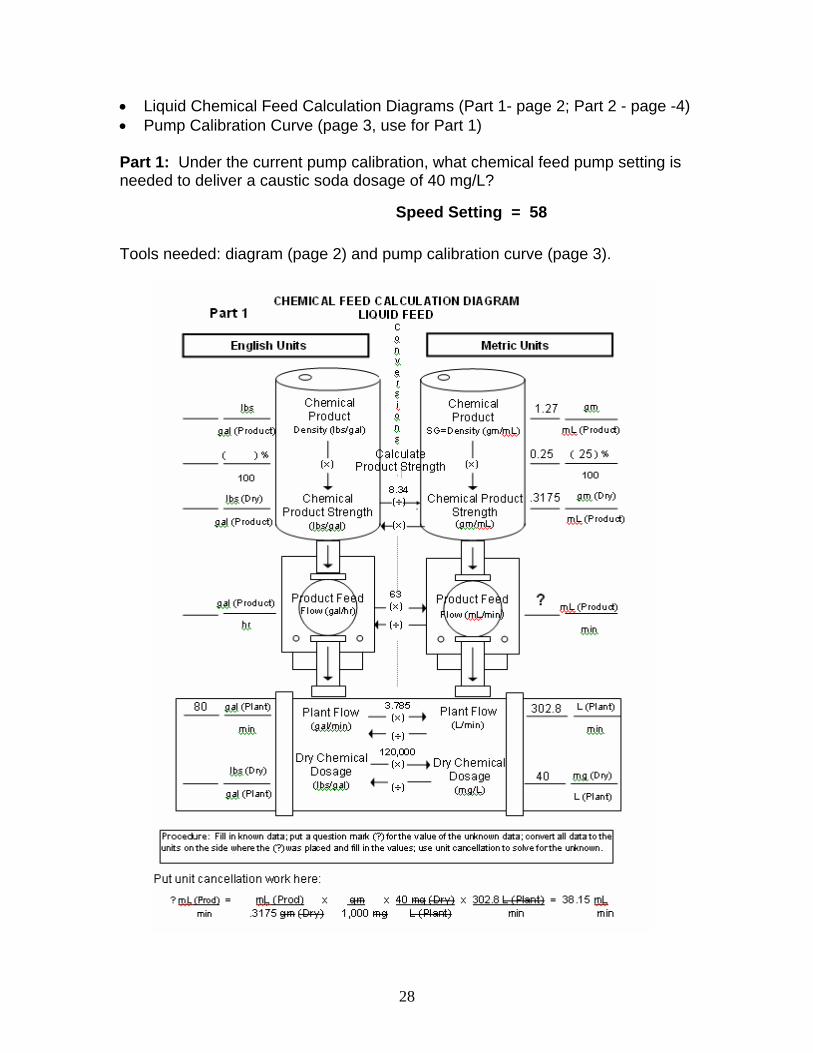
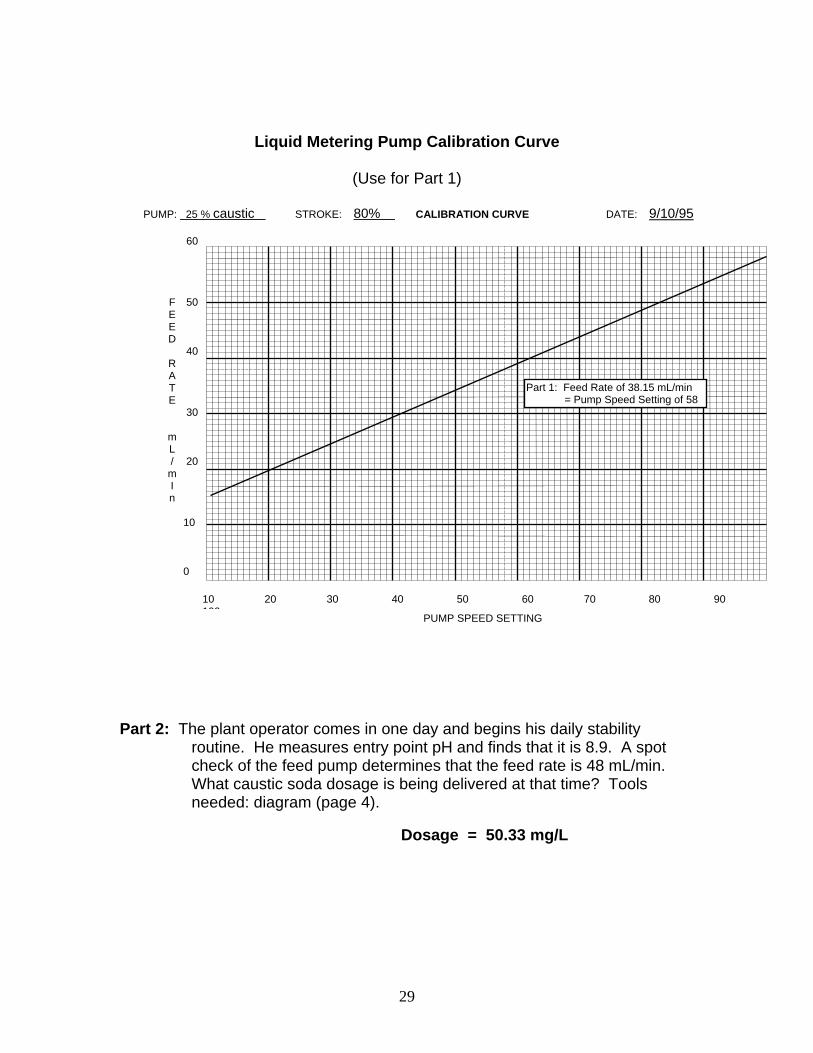
• Liquid Chemical Feed Calculation Diagrams (Part 1- page 2; Part 2 - page -4) • Pump Calibration Curve (page 3, use for Part 1) Part 1: Under the current pump calibration, what chemical feed pump setting is needed to deliver a caustic soda dosage of 40 mg/L? Tools needed: diagram (page 2) and pump calibration curve (page 3).
Speed Setting = 58
29
Liquid Metering Pump Calibration Curve
(Use for Part 1) PUMP: 25 % caustic STROKE: 80% CALIBRATION CURVE DATE: 9/10/95
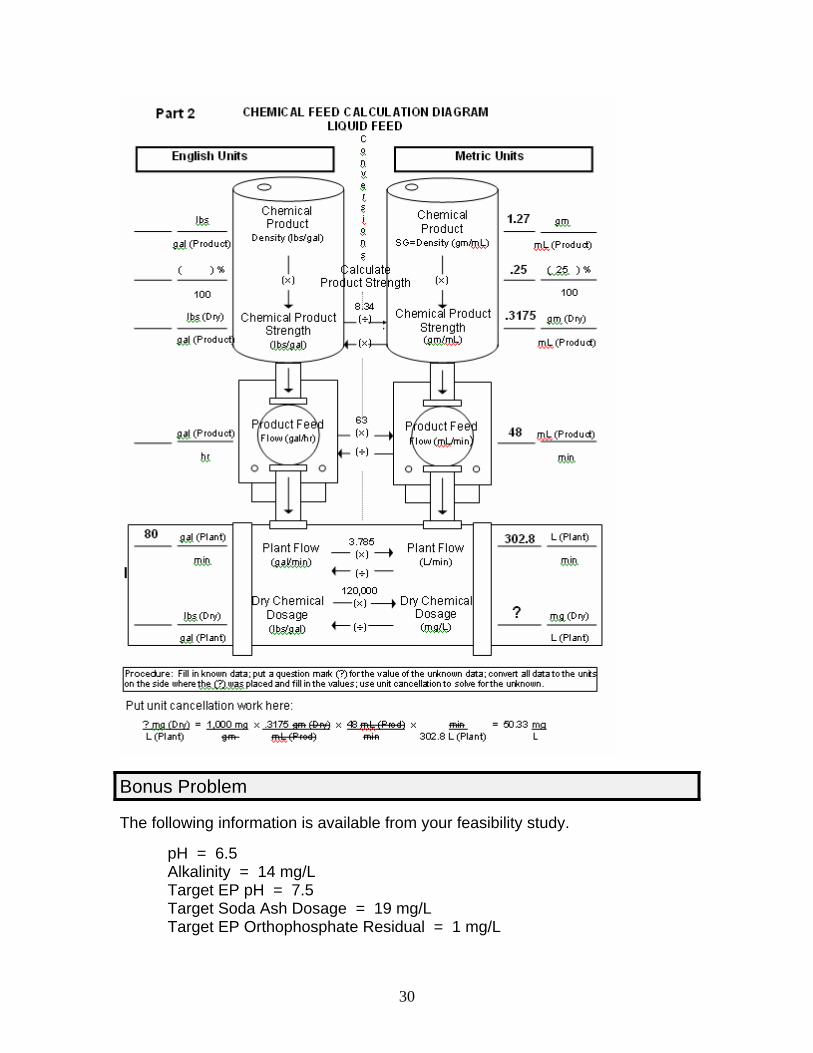
Part 2: The plant operator comes in one day and begins his daily stability
routine. He measures entry point pH and finds that it is 8.9. A spot check of the feed pump determines that the feed rate is 48 mL/min. What caustic soda dosage is being delivered at that time? Tools needed: diagram (page 4).
PUMP SPEED SETTING
F E E D
R A T E
m L /
m I n
10 20 30 40 50 60 70 80 90 100
60 50 40 30 20 10 0
Part 1: Feed Rate of 38.15 mL/min = Pump Speed Setting of 58
Dosage = 50.33 mg/L
30
Bonus Problem The following information is available from your feasibility study.
pH = 6.5 Alkalinity = 14 mg/L Target EP pH = 7.5 Target Soda Ash Dosage = 19 mg/L Target EP Orthophosphate Residual = 1 mg/L
31
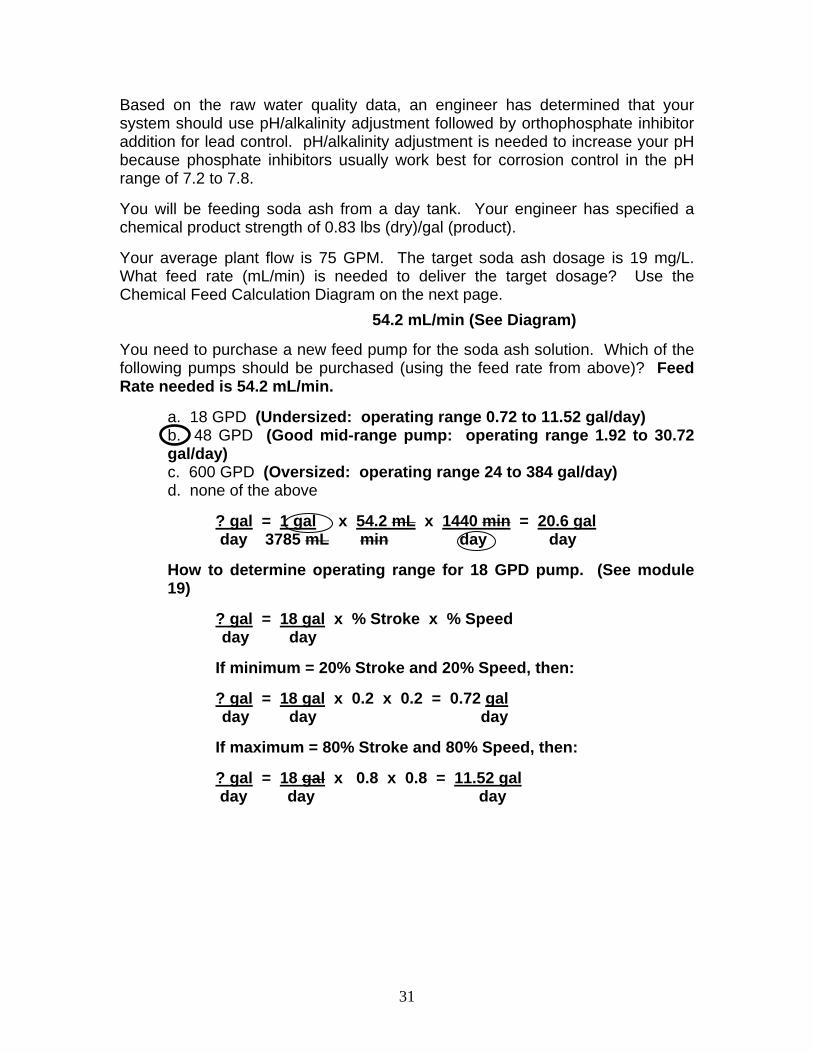
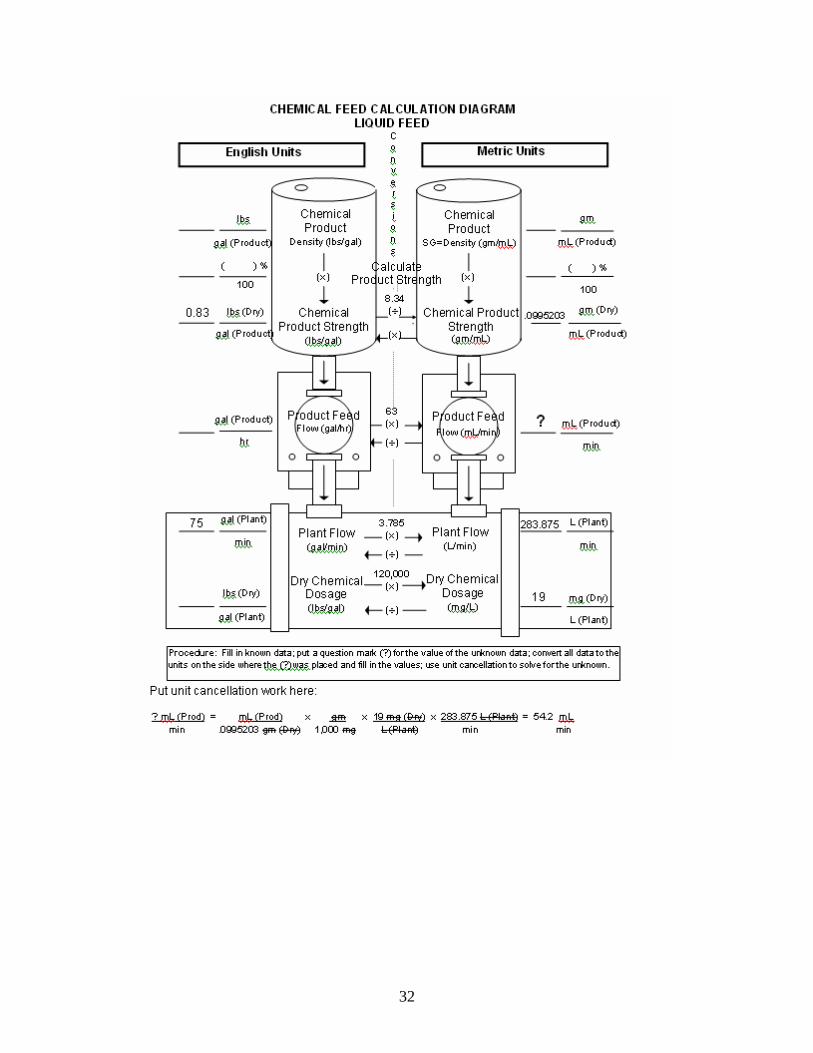
Based on the raw water quality data, an engineer has determined that your system should use pH/alkalinity adjustment followed by orthophosphate inhibitor addition for lead control. pH/alkalinity adjustment is needed to increase your pH because phosphate inhibitors usually work best for corrosion control in the pH range of 7.2 to 7.8. You will be feeding soda ash from a day tank. Your engineer has specified a chemical product strength of 0.83 lbs (dry)/gal (product). Your average plant flow is 75 GPM. The target soda ash dosage is 19 mg/L. What feed rate (mL/min) is needed to deliver the target dosage? Use the Chemical Feed Calculation Diagram on the next page. You need to purchase a new feed pump for the soda ash solution. Which of the following pumps should be purchased (using the feed rate from above)? Feed Rate needed is 54.2 mL/min. a. 18 GPD (Undersized: operating range 0.72 to 11.52 gal/day)
b. 48 GPD (Good mid-range pump: operating range 1.92 to 30.72 gal/day)
c. 600 GPD (Oversized: operating range 24 to 384 gal/day) d. none of the above ? gal = 1 gal x 54.2 mL x 1440 min = 20.6 gal day 3785 mL min day day How to determine operating range for 18 GPD pump. (See module
19) ? gal = 18 gal x % Stroke x % Speed day day If minimum = 20% Stroke and 20% Speed, then: ? gal = 18 gal x 0.2 x 0.2 = 0.72 gal day day day If maximum = 80% Stroke and 80% Speed, then: ? gal = 18 gal x 0.8 x 0.8 = 11.52 gal day day day
54.2 mL/min (See Diagram)
32
33
MODULE 20 - Chemical Feed Calculations 3 - Practice Problems/Mixing Day Tanks
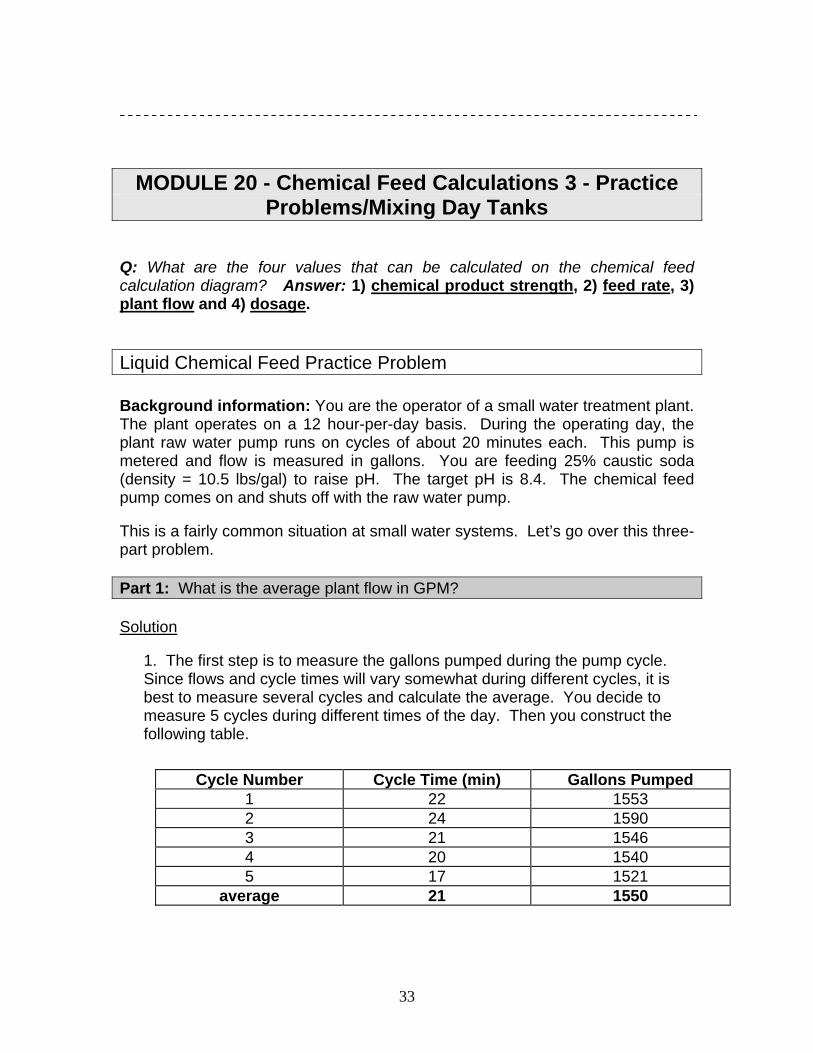
Q: What are the four values that can be calculated on the chemical feed calculation diagram? Answer: 1) chemical product strength, 2) feed rate, 3) plant flow and 4) dosage. Liquid Chemical Feed Practice Problem Background information: You are the operator of a small water treatment plant. The plant operates on a 12 hour-per-day basis. During the operating day, the plant raw water pump runs on cycles of about 20 minutes each. This pump is metered and flow is measured in gallons. You are feeding 25% caustic soda (density = 10.5 lbs/gal) to raise pH. The target pH is 8.4. The chemical feed pump comes on and shuts off with the raw water pump. This is a fairly common situation at small water systems. Let’s go over this three-part problem. Part 1: What is the average plant flow in GPM? Solution
1. The first step is to measure the gallons pumped during the pump cycle. Since flows and cycle times will vary somewhat during different cycles, it is best to measure several cycles and calculate the average. You decide to measure 5 cycles during different times of the day. Then you construct the following table.
Cycle Number Cycle Time (min) Gallons Pumped
1 22 1553 2 24 1590 3 21 1546 4 20 1540 5 17 1521
average 21 1550
34
2. The average plant flow in GPM is calculated by dividing the average gallons pumped (1550 gal) by the cycle time (21 min).
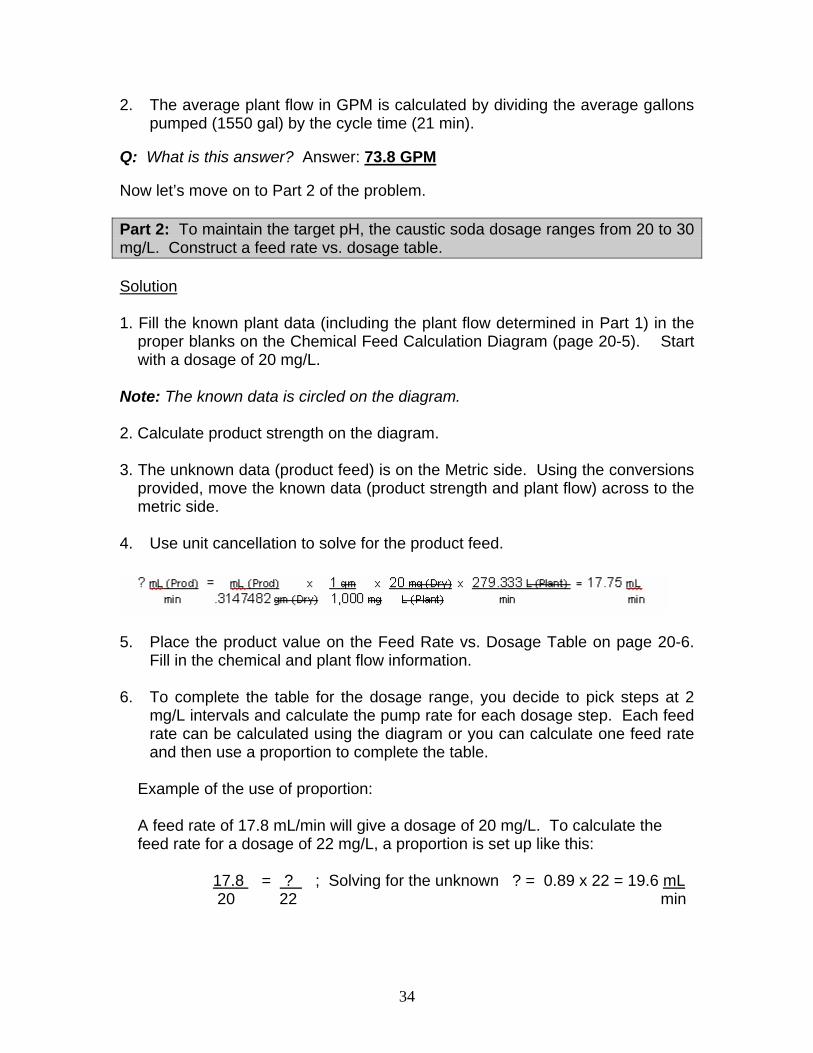
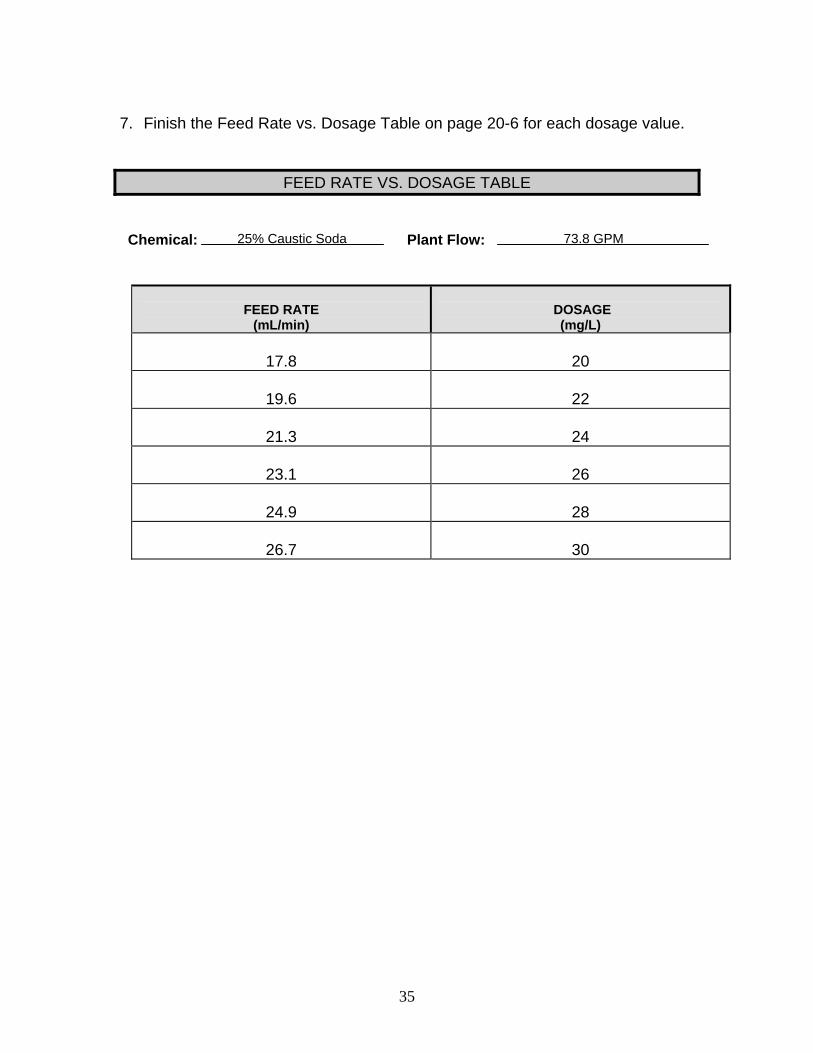
Q: What is this answer? Answer: 73.8 GPM Now let’s move on to Part 2 of the problem. Part 2: To maintain the target pH, the caustic soda dosage ranges from 20 to 30 mg/L. Construct a feed rate vs. dosage table. Solution 1. Fill the known plant data (including the plant flow determined in Part 1) in the
proper blanks on the Chemical Feed Calculation Diagram (page 20-5). Start with a dosage of 20 mg/L.
Note: The known data is circled on the diagram. 2. Calculate product strength on the diagram. 3. The unknown data (product feed) is on the Metric side. Using the conversions
provided, move the known data (product strength and plant flow) across to the metric side.
4. Use unit cancellation to solve for the product feed.
5. Place the product value on the Feed Rate vs. Dosage Table on page 20-6.
Fill in the chemical and plant flow information. 6. To complete the table for the dosage range, you decide to pick steps at 2
mg/L intervals and calculate the pump rate for each dosage step. Each feed rate can be calculated using the diagram or you can calculate one feed rate and then use a proportion to complete the table.
Example of the use of proportion:
A feed rate of 17.8 mL/min will give a dosage of 20 mg/L. To calculate the feed rate for a dosage of 22 mg/L, a proportion is set up like this:
17.8 = ? ; Solving for the unknown ? = 0.89 x 22 = 19.6 mL 20 22 min
35
7. Finish the Feed Rate vs. Dosage Table on page 20-6 for each dosage value.
FEED RATE VS. DOSAGE TABLE Chemical: Plant Flow:
FEED RATE
(mL/min)
DOSAGE
(mg/L)
17.8
20
19.6
22
21.3
24
23.1
26
24.9
28
26.7
30
25% Caustic Soda 73.8 GPM
36
37
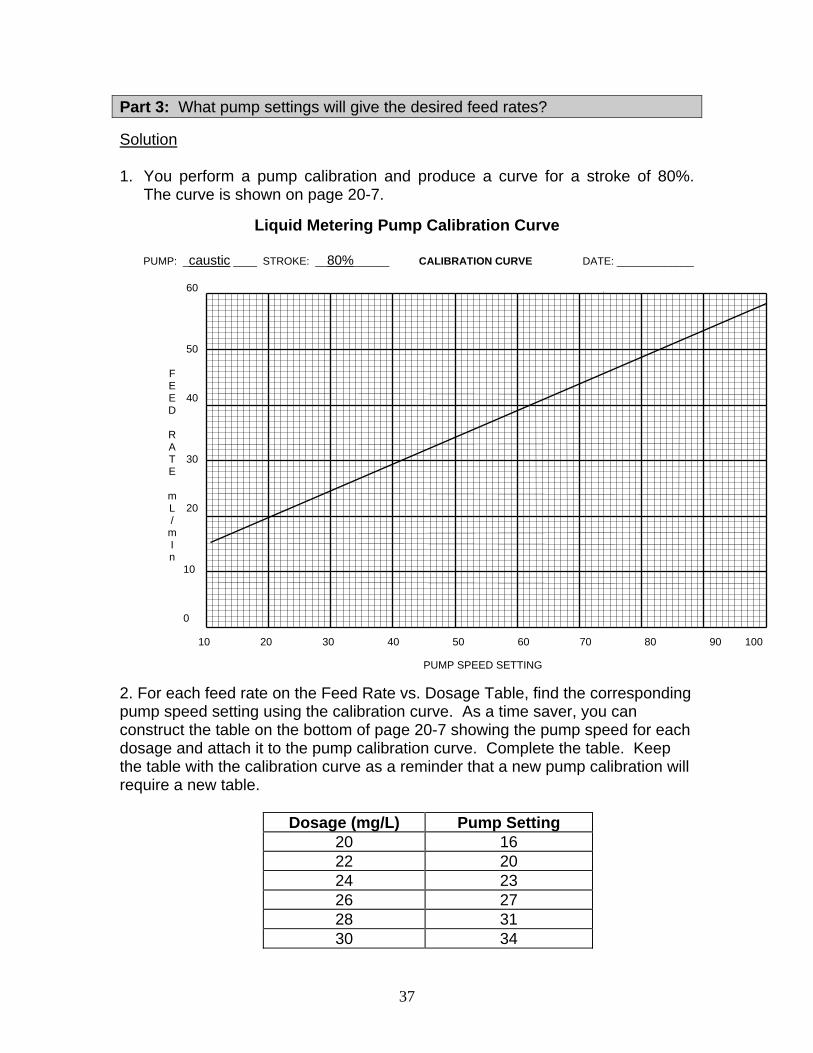
Part 3: What pump settings will give the desired feed rates? Solution 1. You perform a pump calibration and produce a curve for a stroke of 80%.
The curve is shown on page 20-7.
Liquid Metering Pump Calibration Curve PUMP: _caustic ____ STROKE: __80%______ CALIBRATION CURVE DATE: _____________
2. For each feed rate on the Feed Rate vs. Dosage Table, find the corresponding pump speed setting using the calibration curve. As a time saver, you can construct the table on the bottom of page 20-7 showing the pump speed for each dosage and attach it to the pump calibration curve. Complete the table. Keep the table with the calibration curve as a reminder that a new pump calibration will require a new table.
Dosage (mg/L) Pump Setting 20 16 22 20 24 23 26 27 28 31 30 34
60 50 40 30 20 10 0
PUMP SPEED SETTING
F E E D
R A T E
m L /
m I n
10 20 30 40 50 60 70 80 90 100
38
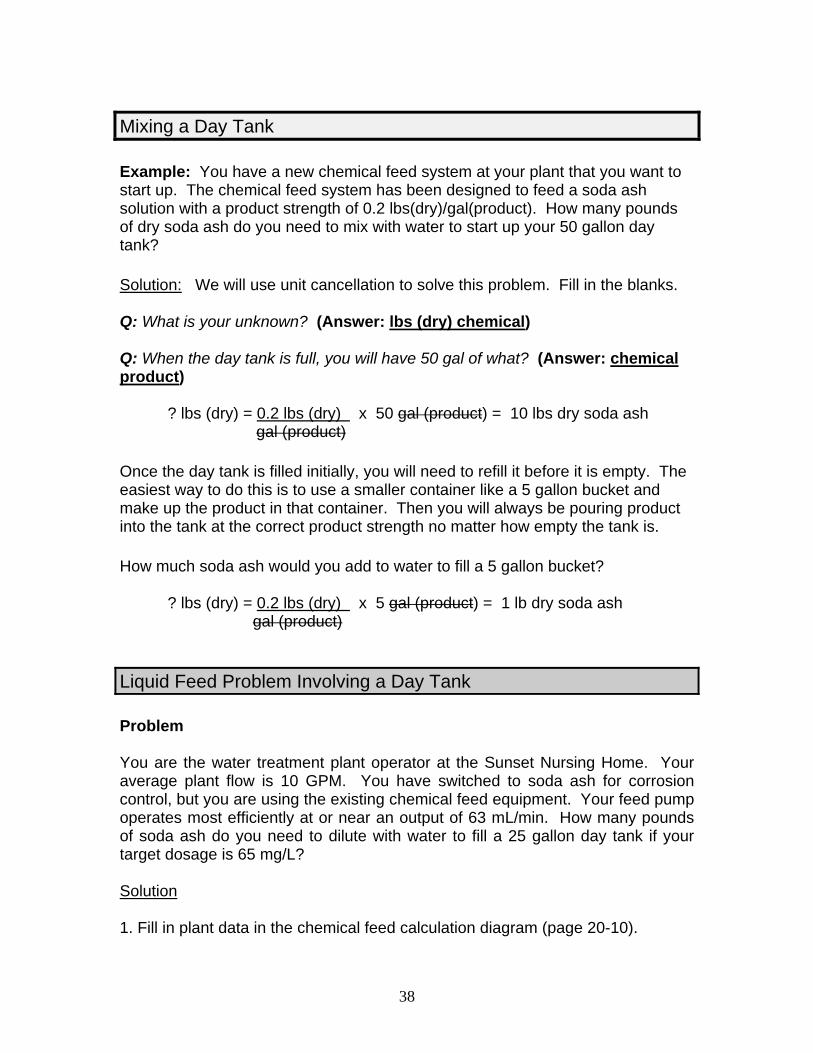
Mixing a Day Tank Example: You have a new chemical feed system at your plant that you want to start up. The chemical feed system has been designed to feed a soda ash solution with a product strength of 0.2 lbs(dry)/gal(product). How many pounds of dry soda ash do you need to mix with water to start up your 50 gallon day tank? Solution: We will use unit cancellation to solve this problem. Fill in the blanks. Q: What is your unknown? (Answer: lbs (dry) chemical) Q: When the day tank is full, you will have 50 gal of what? (Answer: chemical product) ? lbs (dry) = 0.2 lbs (dry) x 50 gal (product) = 10 lbs dry soda ash gal (product) Once the day tank is filled initially, you will need to refill it before it is empty. The easiest way to do this is to use a smaller container like a 5 gallon bucket and make up the product in that container. Then you will always be pouring product into the tank at the correct product strength no matter how empty the tank is. How much soda ash would you add to water to fill a 5 gallon bucket?
? lbs (dry) = 0.2 lbs (dry) x 5 gal (product) = 1 lb dry soda ash gal (product) Liquid Feed Problem Involving a Day Tank
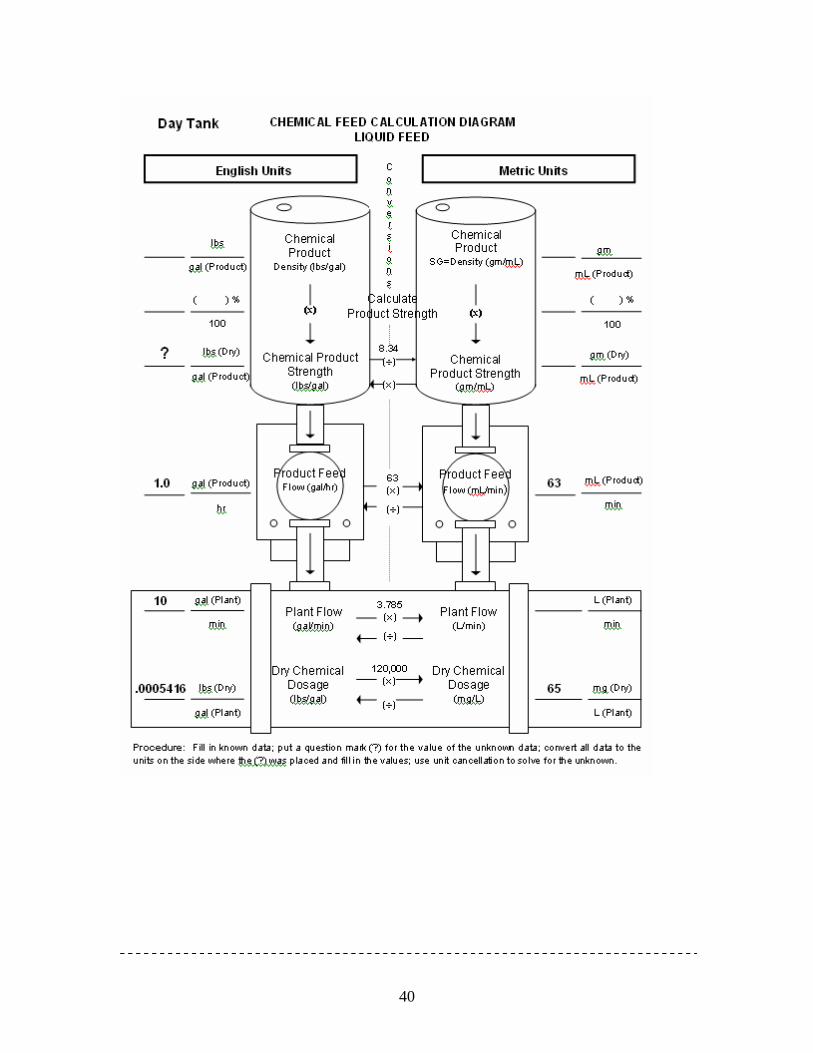
Problem You are the water treatment plant operator at the Sunset Nursing Home. Your average plant flow is 10 GPM. You have switched to soda ash for corrosion control, but you are using the existing chemical feed equipment. Your feed pump operates most efficiently at or near an output of 63 mL/min. How many pounds of soda ash do you need to dilute with water to fill a 25 gallon day tank if your target dosage is 65 mg/L? Solution 1. Fill in plant data in the chemical feed calculation diagram (page 20-10).
39
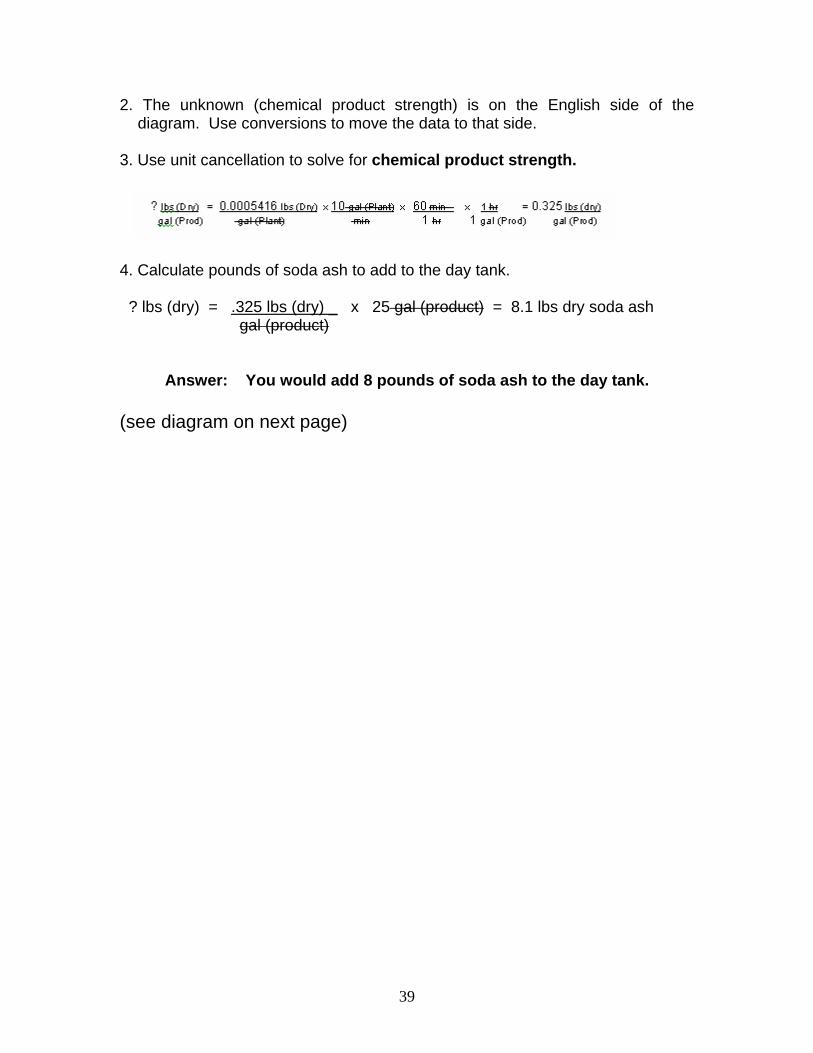
2. The unknown (chemical product strength) is on the English side of the diagram. Use conversions to move the data to that side.
3. Use unit cancellation to solve for chemical product strength.
4. Calculate pounds of soda ash to add to the day tank. ? lbs (dry) = .325 lbs (dry) _ x 25 gal (product) = 8.1 lbs dry soda ash gal (product)
Answer: You would add 8 pounds of soda ash to the day tank.
(see diagram on next page)
40
41
MODULE 21 - Operational Constraints/Startup
Small Group Questions (& Answers) Note: The parenthesis behind the answers (i.e., pH #1, In #2) explains which numbered bullet from pp. 21-2 through 21-4 in the workbook applies to each answer. Questions: 1) Describe 2 ways that pH adjustment impacts the disinfection process. a) Disinfection effectiveness is reduced as pH increases (pH #1) b) Greater potential for higher total plate counts, confluent growth or
presence of total coliforms. (pH #6) 2) Why do silicates affect the useful life of hot water heaters? They precipitate rapidly at higher temperatures (In #6) 3) If you are using a phosphate-based inhibitor, what other treatment process
could be affected? Disinfection (In #1) How is it affected? Residual may be depleted due to biofilms (In #1) 4) Name 2 precipitates that could cause turbidity to increase as a result of
increasing the pH lime, alum, calcium carbonate, iron, manganese (pH #2) 5) What impacts are applicable to both pH/alkalinity adjustment chemicals and
inhibitors? a) Users should be advised of treatment changes (pH #11, In #4)
42
b) Sodium-based chemicals will increase total sodium levels. (pH #8, In #5)
6) Name 3 impacts that result from raising the pH before disinfection or the
coagulation process. a) high THM concentrations (pH #3) b) alum or poly aluminum won’t work as well above pH of 7.0 (pH
#4)
c) increased aluminum concentrations in finished water if using alum (pH #4)
d) reduces effectiveness of some coagulants for THM precurser
removal (pH #5) 7) Why is it difficult to produce an acceptable coating of calcium carbonate in
large distribution systems? a) Too much coating clogs the pipe but if dosage is not high
enough, coating may not extend to the ends of distribution system. (pH #10)
8) Name the optimum location for pH adjustment for : Systems using lime: Added prior to filtration so inert material does not
accumulate in the clearwell or enter the distribution system. (pH #1 asterisk)
Systems not using lime: After disinfection and near the entrance to the
distribution system. (pH #1 asterisk) NOTE: Systems using greensand filtration to remove iron and manganese
might disinfect before filtering to oxidize iron and manganese. 9) What causes “white water”? Excessive calcium carbonate precipitation (pH #9) 10) What adverse effects may occur during the initial phase of adding a
phosphate-based inhibitor? Customer complaints about red water, dirty water, color and
sediment (In #2) What can you do to minimize these effects?
43
a) Flush the lines prior to and during the initial pre-treatment phase
(Phosphate module) b) Notify customers about the temporary negative effects prior to
start up (common sense) 11) Why should commercial users with specific needs be advised of water
treatment changes? a) Users may have consumers who shouldn’t have excessive levels
of some additives (ie. sodium levels for hospital or nursing home residents) (In #4)
b) Industries may have to adjust their own “pretreatment” before
they use the water in boilers, laundries, restaurants, etc... (In #4) 12) Name an element in some phosphate-based inhibitors that is regulated in
wastewater facilities permits. Zinc OR phosphorus (In #3)
Key Points:
• The effectiveness of free chlorine is reduced as pH increases. (Fill in the
blank) • The optimum location for pH adjustment is after disinfection, unless lime
is used. (Fill in the blank) • During the initial phase of treatment with phosphate-based inhibitors, you
may receive customer complaints about red water, dirty water, color, and sediment. You should flush water lines and keep your customers informed about the initial negative impacts to minimize these complaints. (Fill in the blank)
44
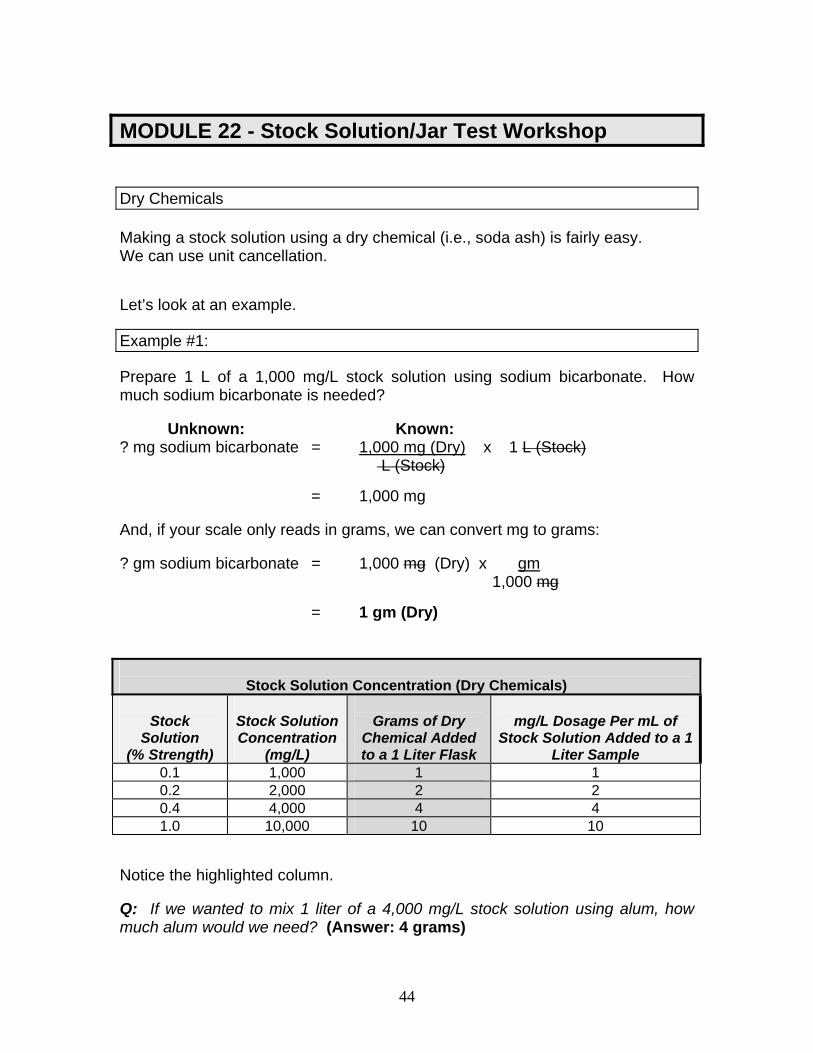
MODULE 22 - Stock Solution/Jar Test Workshop Dry Chemicals Making a stock solution using a dry chemical (i.e., soda ash) is fairly easy. We can use unit cancellation. Let’s look at an example. Example #1: Prepare 1 L of a 1,000 mg/L stock solution using sodium bicarbonate. How much sodium bicarbonate is needed? Unknown: Known: ? mg sodium bicarbonate = 1,000 mg (Dry) x 1 L (Stock) 0 L (Stock) = 1,000 mg And, if your scale only reads in grams, we can convert mg to grams: ? gm sodium bicarbonate = 1,000 mg (Dry) x gm 1,000 mg = 1 gm (Dry)
Stock Solution Concentration (Dry Chemicals)
Stock Solution
(% Strength)
Stock Solution Concentration
(mg/L)
Grams of Dry
Chemical Added to a 1 Liter Flask
mg/L Dosage Per mL of
Stock Solution Added to a 1 Liter Sample
0.1 1,000 1 1 0.2 2,000 2 2 0.4 4,000 4 4 1.0 10,000 10 10
Notice the highlighted column. Q: If we wanted to mix 1 liter of a 4,000 mg/L stock solution using alum, how much alum would we need? (Answer: 4 grams)
45
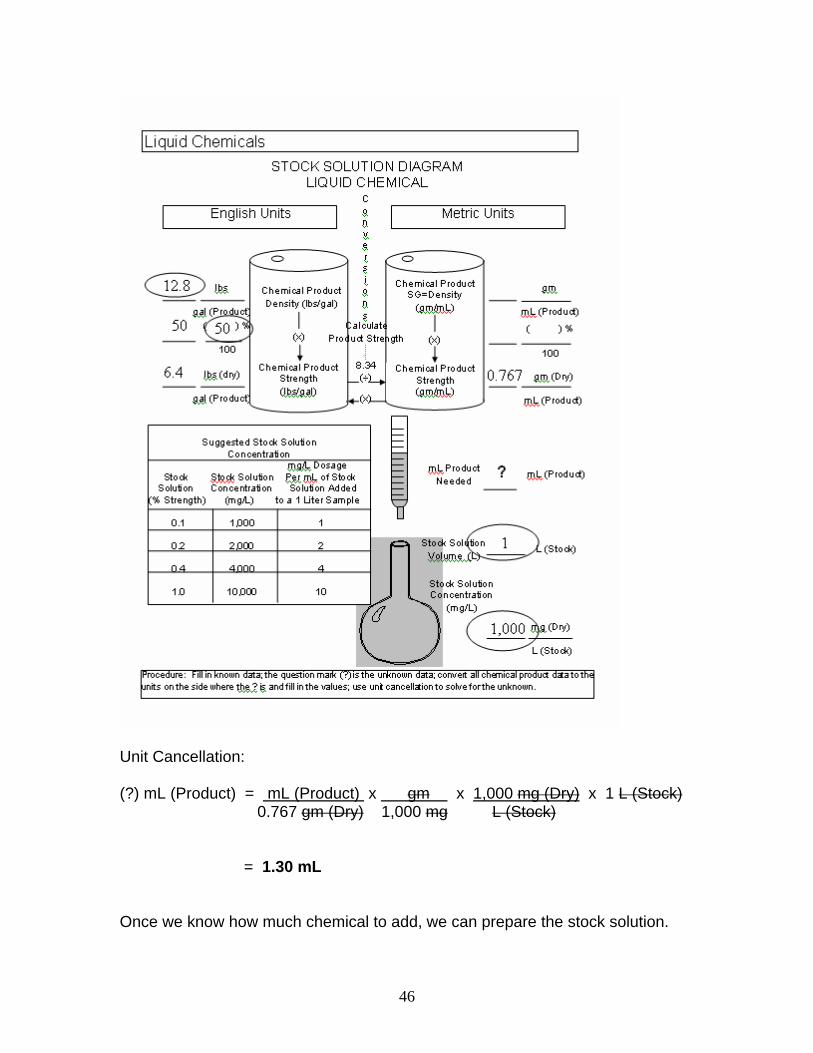
Liquid Chemicals As we’ve already discussed, calculations for liquid chemicals are not as simple. Why? We have to deal with varying chemical product strength. So, we’ve developed a diagram similar to the one used for chemical feed to calculate stock solutions using liquid chemicals. Let’s try an example. Example #2: Prepare 1 L of a 1,000 mg/L stock solution using caustic soda. The caustic soda has a commercial strength of 50% and a density of 12.8 lbs/gal. How much caustic soda is needed?
1. Using the diagram on page 22-4, let’s fill in the known data. (see diagram next page)
2. Next, calculate the chemical product strength. 3. Convert all units to the side where the ? is. 4. Then, use unit cancellation to solve for ?.
46
Unit Cancellation: (?) mL (Product) = mL (Product) x gm x 1,000 mg (Dry) x 1 L (Stock) 0.767 gm (Dry) 1,000 mg L (Stock) = 1.30 mL Once we know how much chemical to add, we can prepare the stock solution.
47
Operator Tips: Preparing a Stock Solution • Use care when handling and mixing chemicals. Read all information supplied
by your chemical manufacturer, including MSDS sheets. (Fill-in the blank) • Use fresh stock solution. Stock solution has a shelf-life of ≈2-4 weeks. The
solution may deteriorate with time due to mold or algae growth, CO2 absorption or contamination. (Fill-in the blank)
Operator Tips: Baseline Water for CCT • At surface water systems - baseline water is collected just past the filters, but
before any post treatment addition. (Fill-in the blank) • At ground water systems without filtration - baseline water is collected from
the raw water tap. (Fill-in the blank)
Operator Tips: Conducting a Jar Test
• Ensure the sample temperature does not change during the jar test. The jar test should be completed immediately following collection of the baseline water sample.
Stock Solution/Jar Test Workshop The workshop has two parts. First, we will prepare a stock solution using soda ash. Then we will perform a jar test using our stock solution. Let’s look at the calculation for soda ash.
48
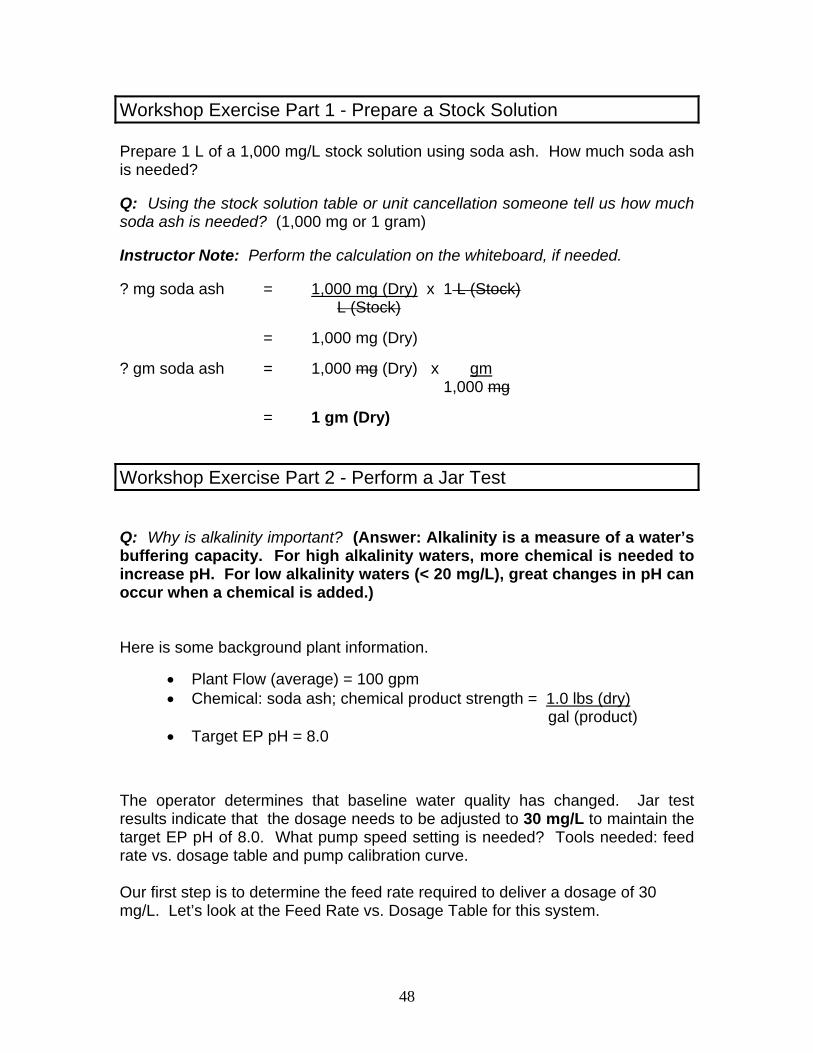
Workshop Exercise Part 1 - Prepare a Stock Solution Prepare 1 L of a 1,000 mg/L stock solution using soda ash. How much soda ash is needed? Q: Using the stock solution table or unit cancellation someone tell us how much soda ash is needed? (1,000 mg or 1 gram) Instructor Note: Perform the calculation on the whiteboard, if needed. ? mg soda ash = 1,000 mg (Dry) x 1 L (Stock) L (Stock) = 1,000 mg (Dry) ? gm soda ash = 1,000 mg (Dry) x gm 1,000 mg = 1 gm (Dry) Workshop Exercise Part 2 - Perform a Jar Test Q: Why is alkalinity important? (Answer: Alkalinity is a measure of a water’s buffering capacity. For high alkalinity waters, more chemical is needed to increase pH. For low alkalinity waters (< 20 mg/L), great changes in pH can occur when a chemical is added.) Here is some background plant information.
• Plant Flow (average) = 100 gpm • Chemical: soda ash; chemical product strength = 1.0 lbs (dry)
gal (product) • Target EP pH = 8.0
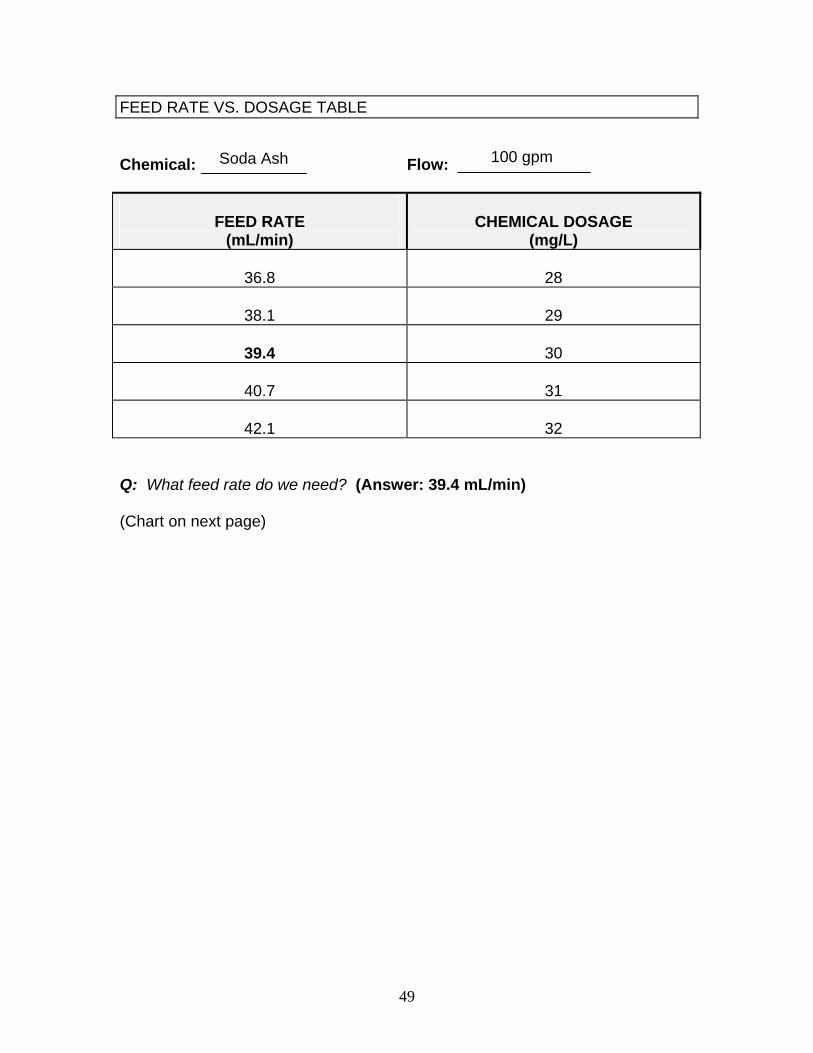
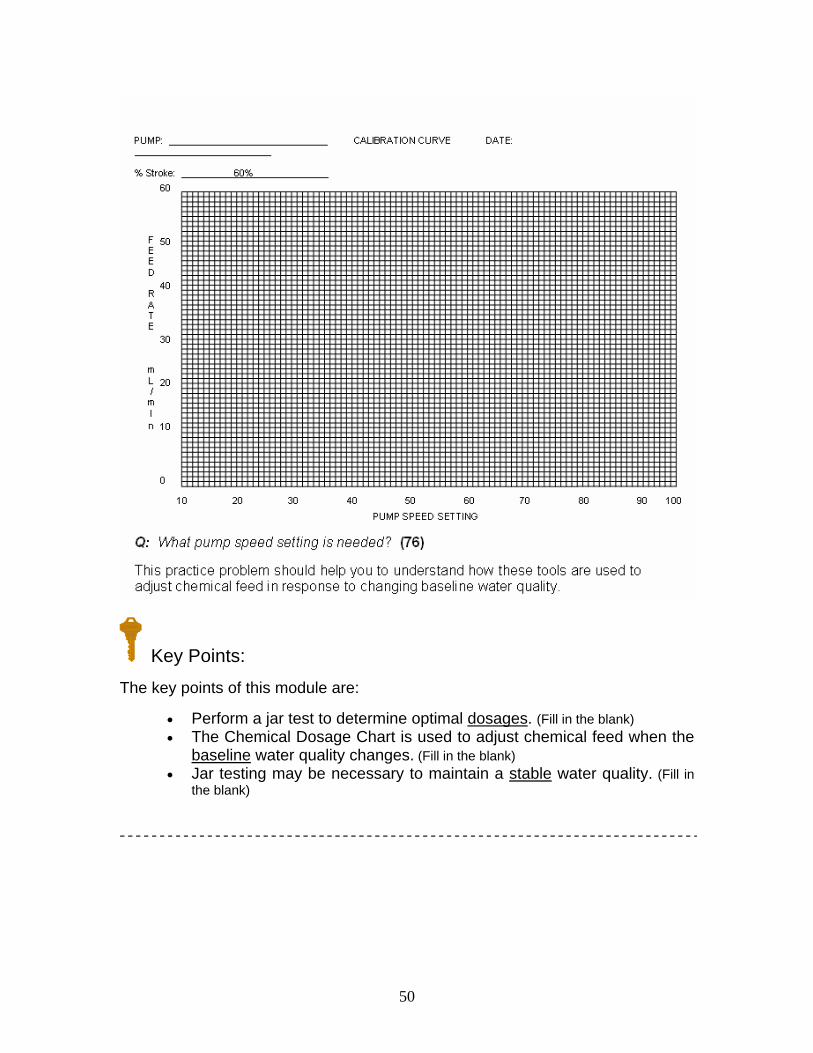
The operator determines that baseline water quality has changed. Jar test results indicate that the dosage needs to be adjusted to 30 mg/L to maintain the target EP pH of 8.0. What pump speed setting is needed? Tools needed: feed rate vs. dosage table and pump calibration curve. Our first step is to determine the feed rate required to deliver a dosage of 30 mg/L. Let’s look at the Feed Rate vs. Dosage Table for this system.
49
FEED RATE VS. DOSAGE TABLE Chemical: Flow: _______________
FEED RATE
(mL/min)
CHEMICAL DOSAGE
(mg/L)
36.8
28
38.1
29
39.4
30
40.7
31
42.1
32 Q: What feed rate do we need? (Answer: 39.4 mL/min) (Chart on next page)
Soda Ash 100 gpm
50
Key Points: The key points of this module are:
• Perform a jar test to determine optimal dosages. (Fill in the blank) • The Chemical Dosage Chart is used to adjust chemical feed when the
baseline water quality changes. (Fill in the blank) • Jar testing may be necessary to maintain a stable water quality. (Fill in
the blank)
51
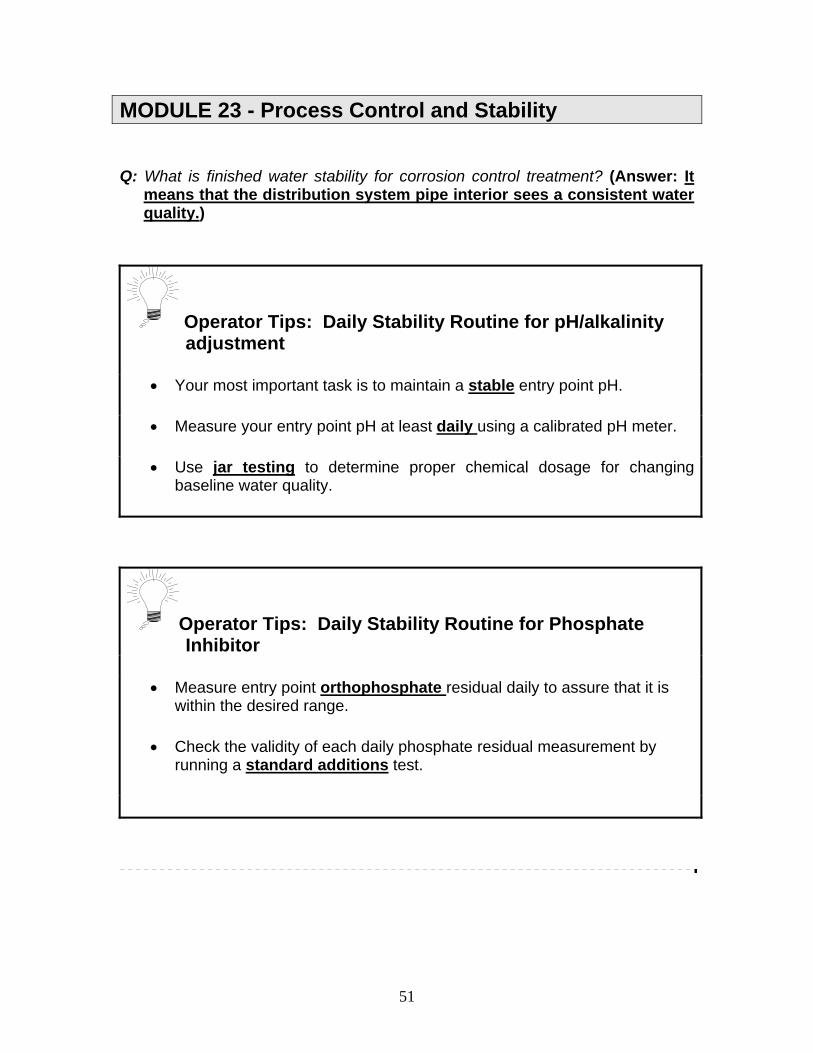
MODULE 23 - Process Control and Stability Q: What is finished water stability for corrosion control treatment? (Answer: It
means that the distribution system pipe interior sees a consistent water quality.)
Operator Tips: Daily Stability Routine for pH/alkalinity adjustment
• Your most important task is to maintain a stable entry point pH. • Measure your entry point pH at least daily using a calibrated pH meter.
• Use jar testing to determine proper chemical dosage for changing
baseline water quality.
Operator Tips: Daily Stability Routine for Phosphate Inhibitor
• Measure entry point orthophosphate residual daily to assure that it is
within the desired range. • Check the validity of each daily phosphate residual measurement by
running a standard additions test.
52
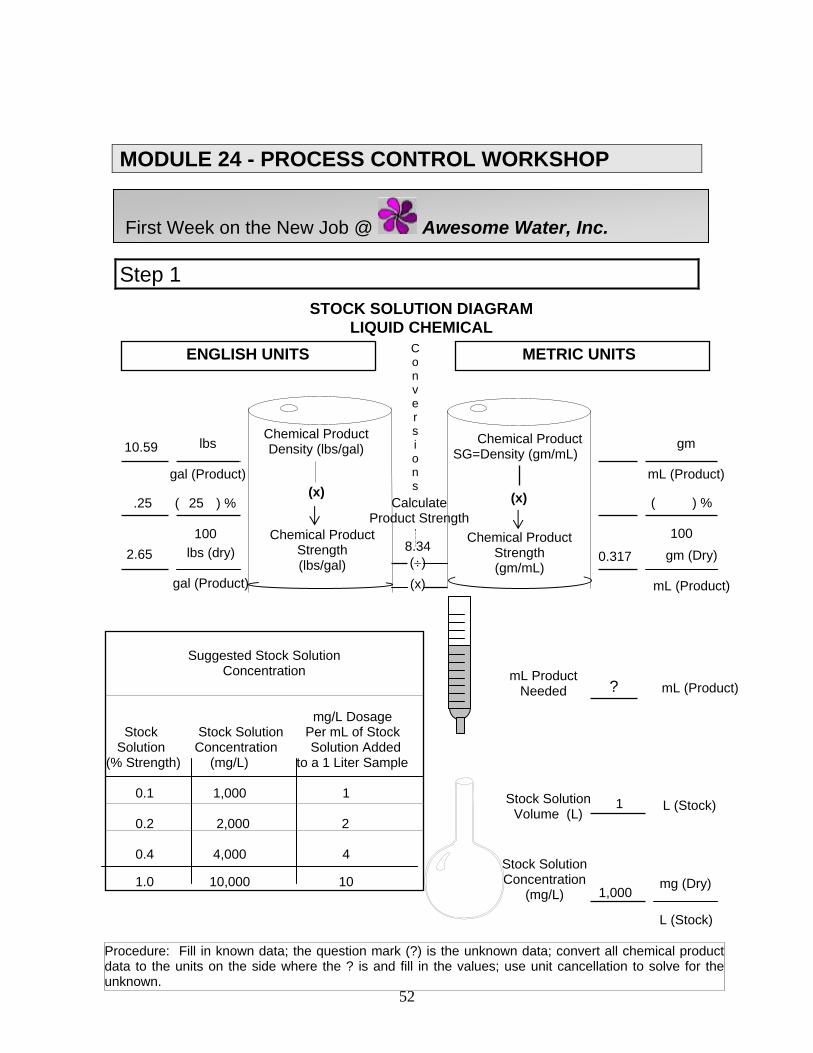
MODULE 24 - PROCESS CONTROL WORKSHOP Step 1
ENGLISH UNITS METRIC UNITS
STOCK SOLUTION DIAGRAM LIQUID CHEMICAL
Chemical Product SG=Density (gm/mL)
(x)
Chemical Product Density (lbs/gal)
(x)
Chemical Product Strength (gm/mL)
C o n v e r s i o n s
Calculate Product Strength
Chemical Product Strength (lbs/gal)
L (Stock)
mg (Dry)
Stock Solution Volume (L)
mL Product Needed
L (Stock)
Suggested Stock Solution
Concentration mg/L Dosage Stock Stock Solution Per mL of Stock Solution Concentration Solution Added (% Strength) (mg/L) to a 1 Liter Sample 0.1 1,000 1 0.2 2,000 2 0.4 4,000 4 1.0 10,000 10
Procedure: Fill in known data; the question mark (?) is the unknown data; convert all chemical product data to the units on the side where the ? is and fill in the values; use unit cancellation to solve for the unknown.
gm
mL (Product)
( ) %
100 gm (Dry)
mL (Product)
8.34 (÷)
(x)
lbs
gal (Product)
( ) %
100 lbs (dry)
gal (Product)
mL (Product) ?
Stock Solution Concentration
(mg/L) 1,000
1
10.59
.25 25
2.65 0.317
First Week on the New Job @ Awesome Water, Inc.
53
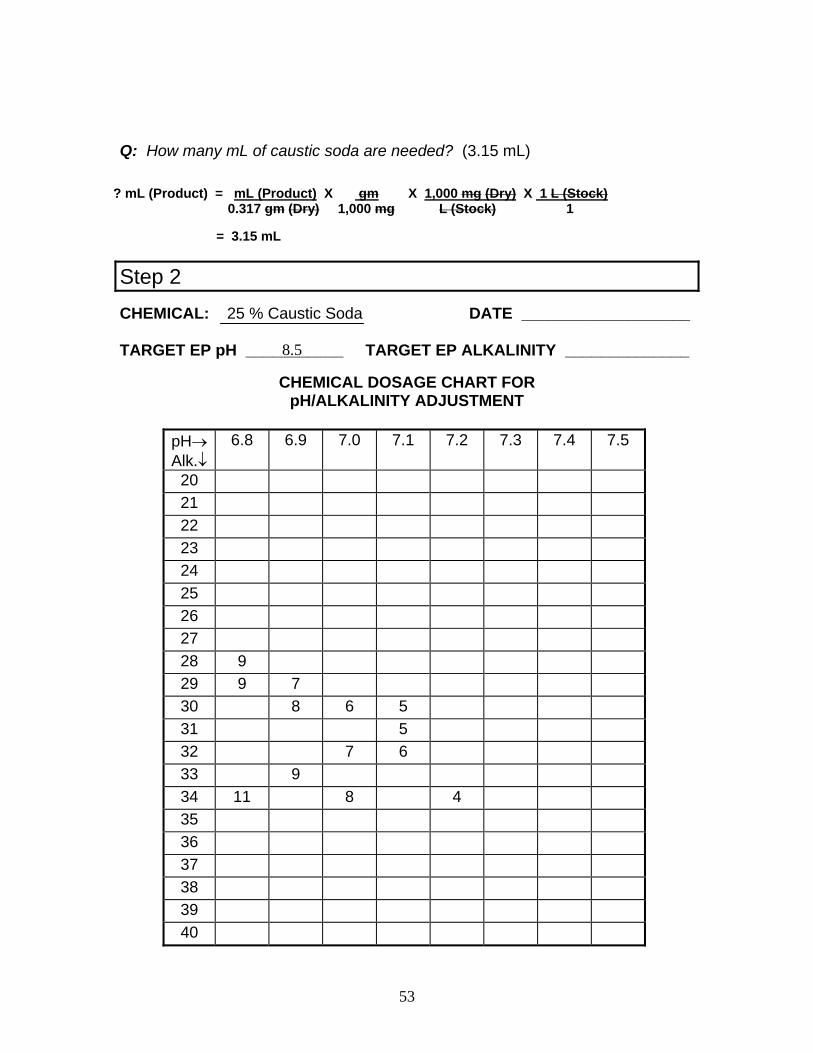
Q: How many mL of caustic soda are needed? (3.15 mL)
Step 2 CHEMICAL: 25 % Caustic Soda DATE ___________________ TARGET EP pH ___________ TARGET EP ALKALINITY ______________
CHEMICAL DOSAGE CHART FOR pH/ALKALINITY ADJUSTMENT
pH→ Alk.↓
6.8 6.9 7.0 7.1 7.2 7.3 7.4 7.5
20 21 22 23 24 25 26 27 28 9 29 9 7 30 8 6 5 31 5 32 7 6 33 9 34 11 8 4 35 36 37 38 39 40
? mL (Product) = mL (Product) X gm X 1,000 mg (Dry) X 1 L (Stock) 0.317 gm (Dry) 1,000 mg L (Stock) 1 = 3.15 mL
8.5
54
Step 3 Construct a Feed Rate vs. Dosage Table. Use the Chemical Feed Calculation Diagram (p. 24-6) to calculate the feed rate for the dosage value of ____________. (see diagram next page)
55
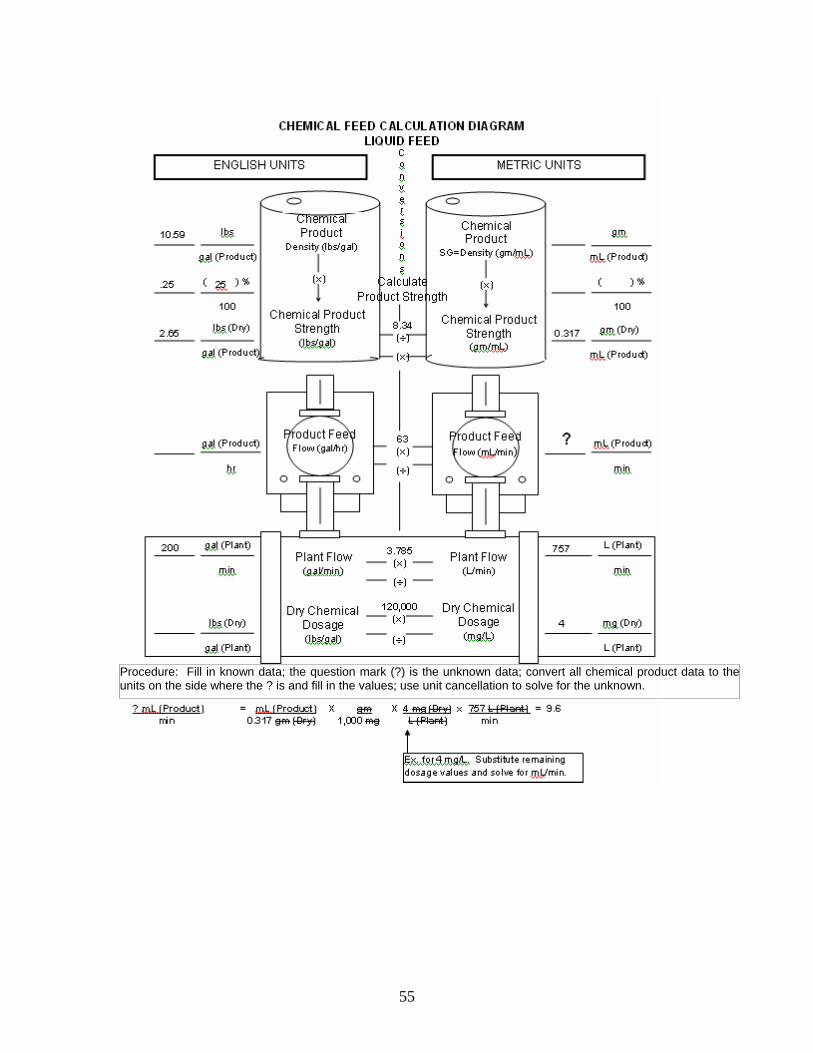
Procedure: Fill in known data; the question mark (?) is the unknown data; convert all chemical product data to the units on the side where the ? is and fill in the values; use unit cancellation to solve for the unknown.
56
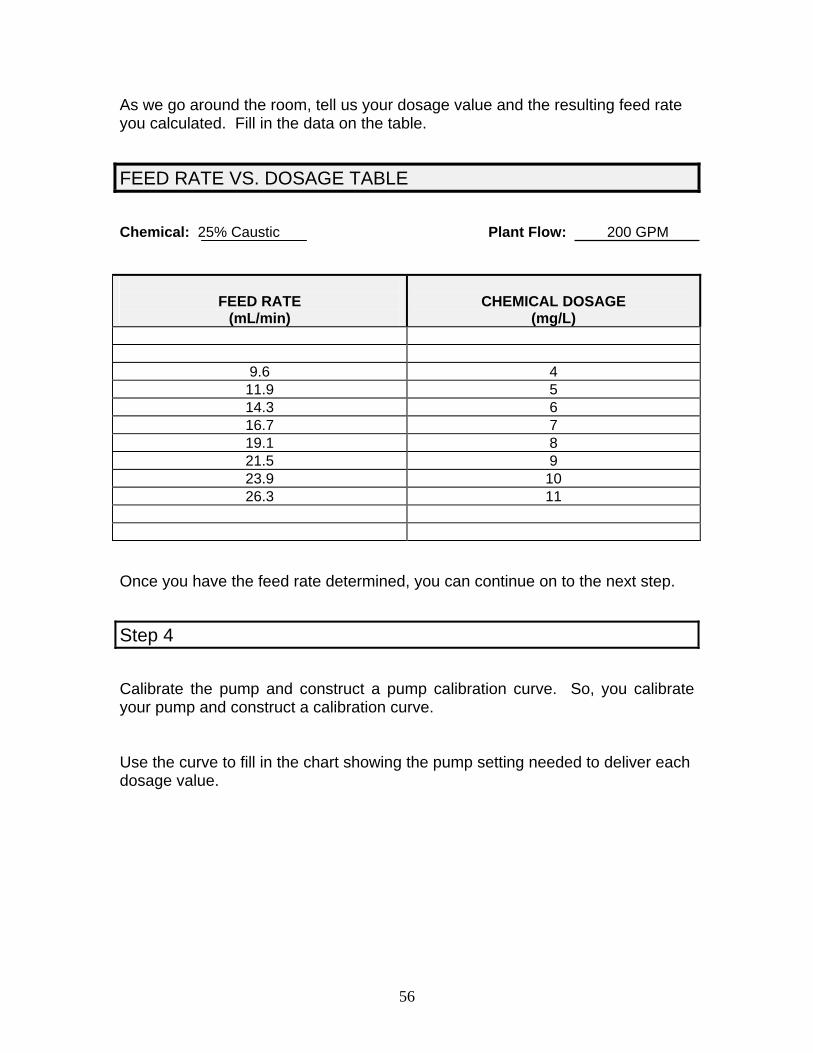
As we go around the room, tell us your dosage value and the resulting feed rate you calculated. Fill in the data on the table.
FEED RATE VS. DOSAGE TABLE Chemical: 25% Caustic Plant Flow: 200 GPM
FEED RATE
(mL/min)
CHEMICAL DOSAGE
(mg/L)
9.6 4 11.9 5 14.3 6 16.7 7 19.1 8 21.5 9 23.9 10 26.3 11
Once you have the feed rate determined, you can continue on to the next step.
Step 4 Calibrate the pump and construct a pump calibration curve. So, you calibrate your pump and construct a calibration curve. Use the curve to fill in the chart showing the pump setting needed to deliver each dosage value.
57
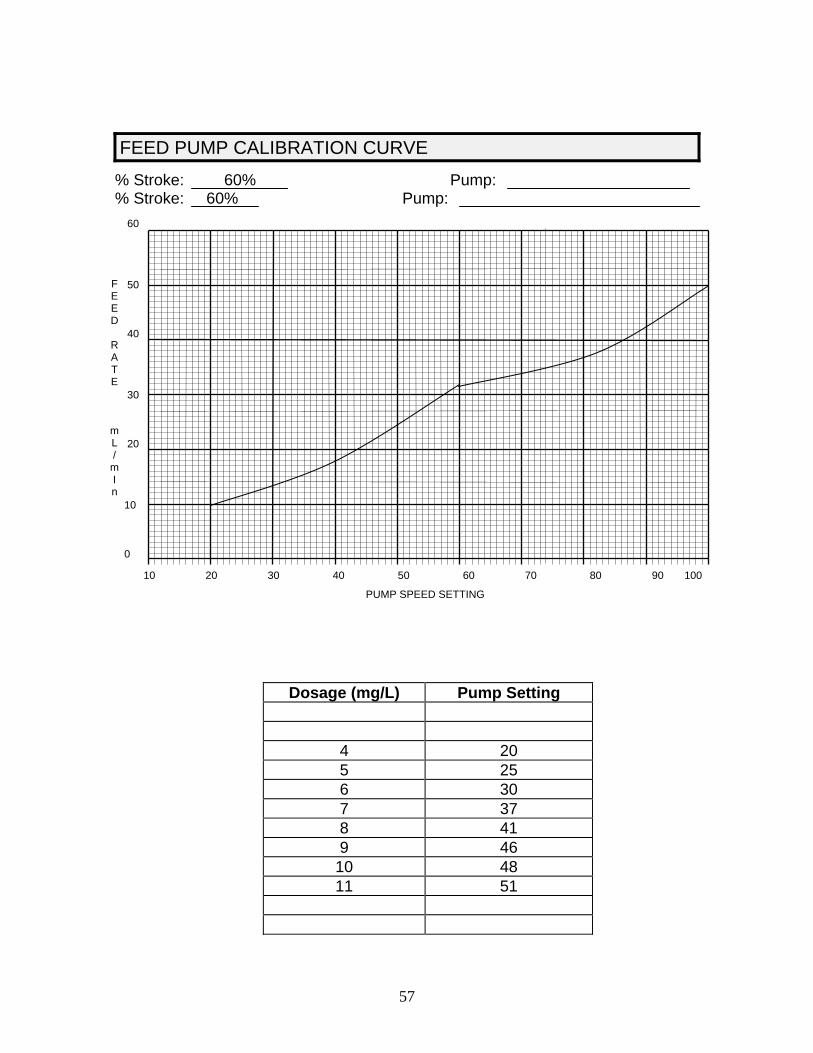
FEED PUMP CALIBRATION CURVE
Dosage (mg/L) Pump Setting 4 20 5 25 6 30 7 37 8 41 9 46
10 48 11 51
% Stroke: 60% Pump: % Stroke: 60% Pump:
60 50 40 30 20 10 0
PUMP SPEED SETTING
F E E D
R A T E
m L /
m I n
10 20 30 40 50 60 70 80 90 100
58
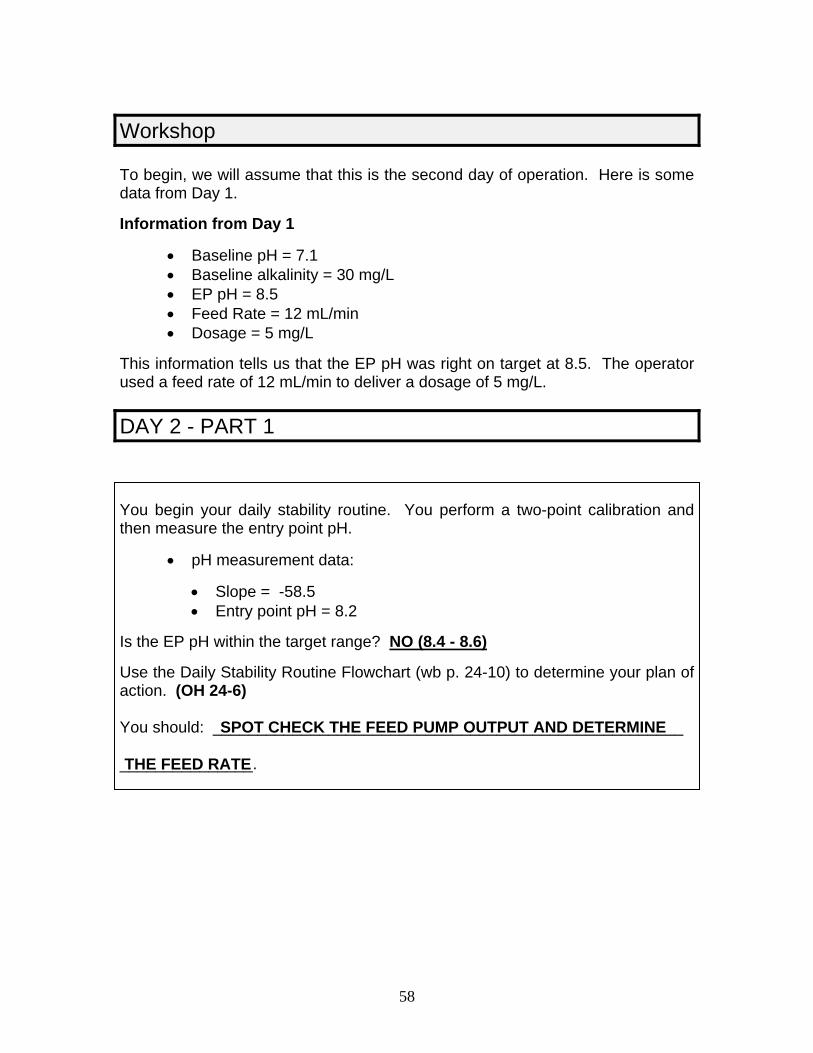
Workshop To begin, we will assume that this is the second day of operation. Here is some data from Day 1. Information from Day 1
• Baseline pH = 7.1 • Baseline alkalinity = 30 mg/L • EP pH = 8.5 • Feed Rate = 12 mL/min • Dosage = 5 mg/L
This information tells us that the EP pH was right on target at 8.5. The operator used a feed rate of 12 mL/min to deliver a dosage of 5 mg/L.
DAY 2 - PART 1 You begin your daily stability routine. You perform a two-point calibration and then measure the entry point pH.
• pH measurement data:
• Slope = -58.5 • Entry point pH = 8.2
Is the EP pH within the target range? NO (8.4 - 8.6) Use the Daily Stability Routine Flowchart (wb p. 24-10) to determine your plan of action. (OH 24-6) You should: _____________________________________________________ _______________.
SPOT CHECK THE FEED PUMP OUTPUT AND DETERMINE
THE FEED RATE
59
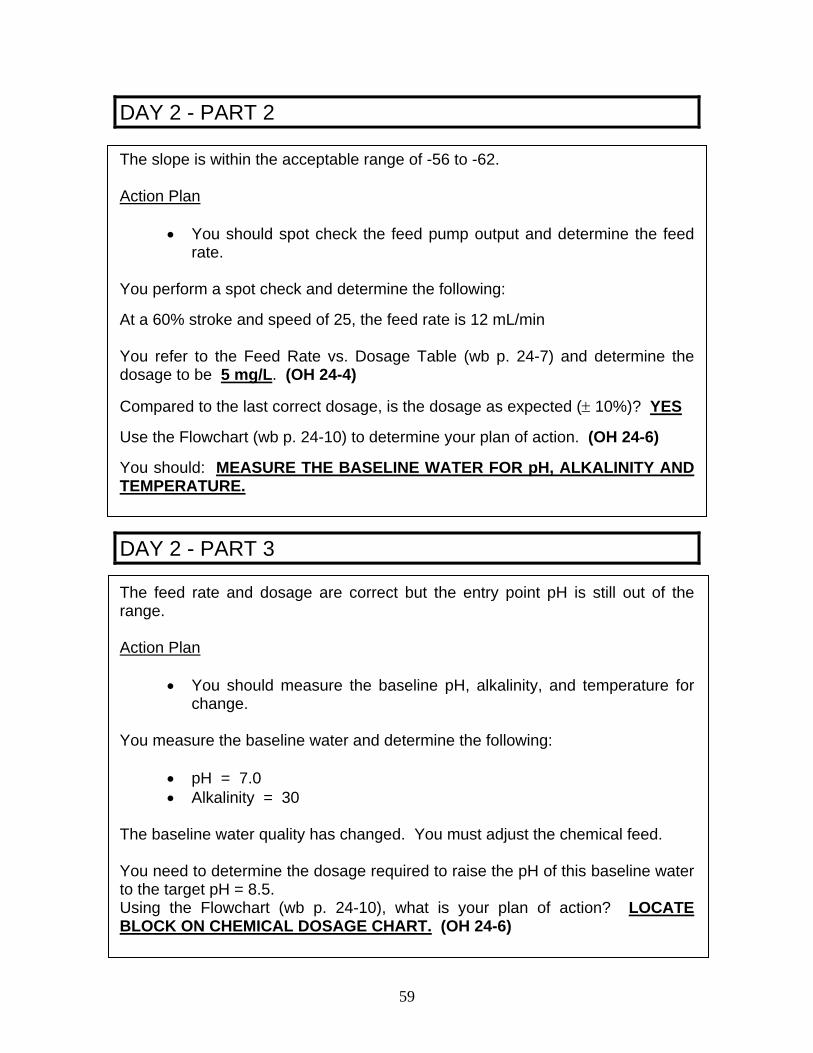
DAY 2 - PART 2 The slope is within the acceptable range of -56 to -62. Action Plan
• You should spot check the feed pump output and determine the feed rate.
You perform a spot check and determine the following: At a 60% stroke and speed of 25, the feed rate is 12 mL/min You refer to the Feed Rate vs. Dosage Table (wb p. 24-7) and determine the dosage to be 5 mg/L. (OH 24-4)
Compared to the last correct dosage, is the dosage as expected (± 10%)? YES Use the Flowchart (wb p. 24-10) to determine your plan of action. (OH 24-6) You should: MEASURE THE BASELINE WATER FOR pH, ALKALINITY AND TEMPERATURE.
DAY 2 - PART 3 The feed rate and dosage are correct but the entry point pH is still out of the range. Action Plan
• You should measure the baseline pH, alkalinity, and temperature for change.
You measure the baseline water and determine the following:
• pH = 7.0 • Alkalinity = 30
The baseline water quality has changed. You must adjust the chemical feed. You need to determine the dosage required to raise the pH of this baseline water to the target pH = 8.5. Using the Flowchart (wb p. 24-10), what is your plan of action? LOCATE BLOCK ON CHEMICAL DOSAGE CHART. (OH 24-6)
60
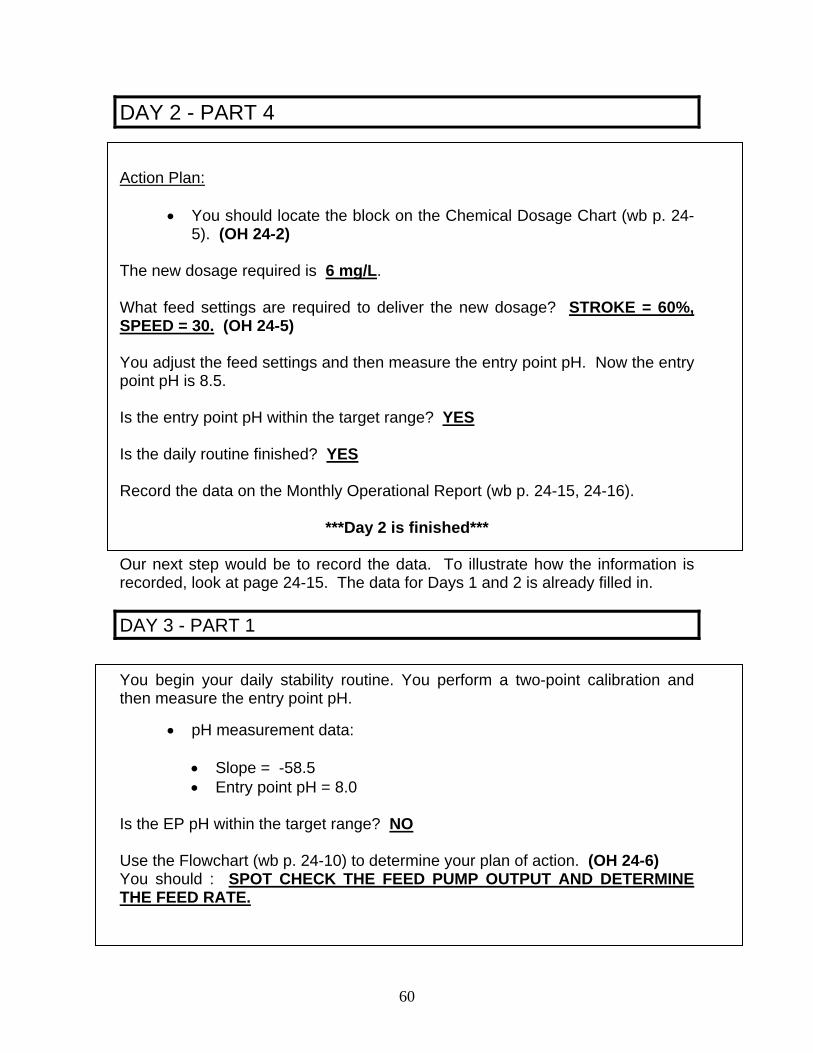
DAY 2 - PART 4 Action Plan:
• You should locate the block on the Chemical Dosage Chart (wb p. 24-5). (OH 24-2)
The new dosage required is 6 mg/L. What feed settings are required to deliver the new dosage? STROKE = 60%, SPEED = 30. (OH 24-5) You adjust the feed settings and then measure the entry point pH. Now the entry point pH is 8.5. Is the entry point pH within the target range? YES Is the daily routine finished? YES Record the data on the Monthly Operational Report (wb p. 24-15, 24-16).
***Day 2 is finished*** Our next step would be to record the data. To illustrate how the information is recorded, look at page 24-15. The data for Days 1 and 2 is already filled in. DAY 3 - PART 1 You begin your daily stability routine. You perform a two-point calibration and then measure the entry point pH.
• pH measurement data:
• Slope = -58.5 • Entry point pH = 8.0
Is the EP pH within the target range? NO Use the Flowchart (wb p. 24-10) to determine your plan of action. (OH 24-6) You should : SPOT CHECK THE FEED PUMP OUTPUT AND DETERMINE THE FEED RATE.
61
DAY 3 - PART 2 The slope is within the acceptable range of -56 to -62. Action Plan
• You should spot check the feed pump output and determine the feed rate.
You perform a spot check and determine the following:
• At a 60% stroke and speed of 30, the feed rate is 10 mL/min. You refer to the Feed Rate vs. Dosage Table (wb p. 24-7) and determine the dosage to be 4 mg/L. (OH 24-4) Compared to the last correct dosage, is the dosage as expected (± 10%)? NO (6 ± 10% = 5.4 - 6.6) Use the Flowchart (wb p. 24-10) to determine your plan of action. (OH 24-6) You should: TROUBLESHOOT, REPAIR AND RECALIBRATE
62
DAY 3 - PART 3 The feed rate was determined to be 10 mL/min and it should have been 14.3 mL/min. Because the feed rate was off, the dosage being delivered was 4 mg/L instead of the required 6 mg/L. Action Plan
• You should troubleshoot the feed pump and other feed system components and make any necessary repairs.
• You should then recalibrate the feed pump at 60% stroke and speed settings of 20, 40, 60, 80 and 100.
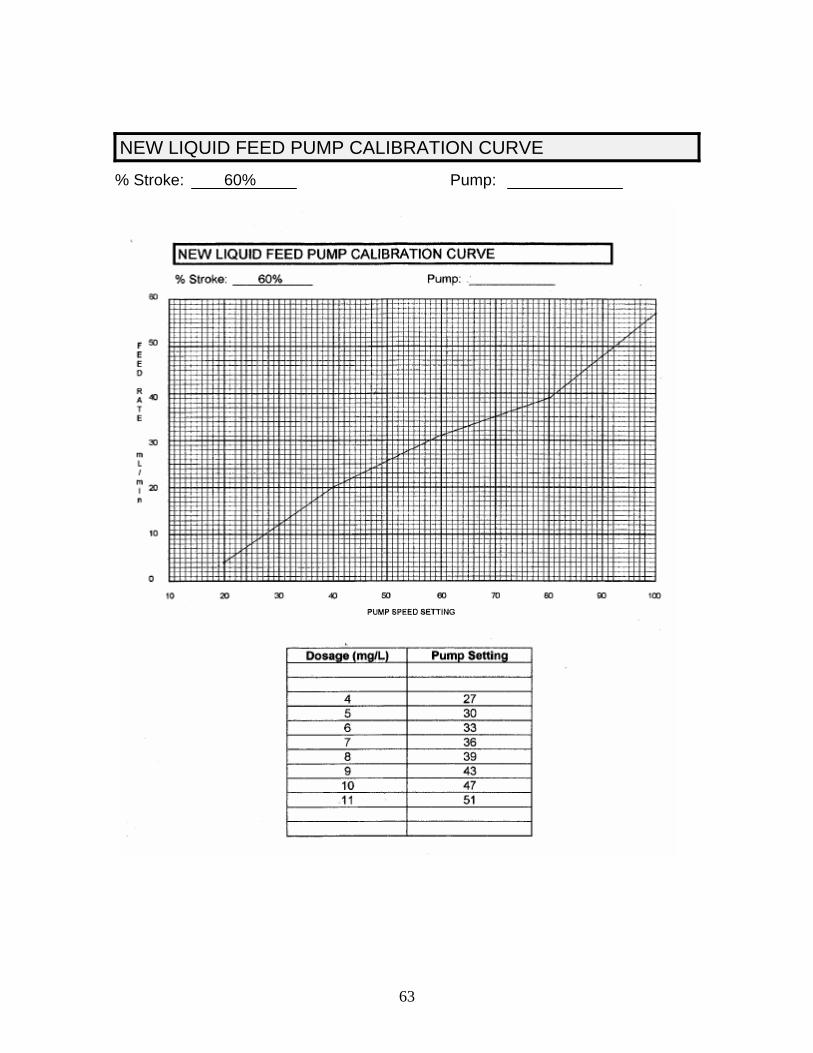
• You should construct a new calibration curve. The mechanical components check out O.K. You perform a calibration of the feed pump and construct a new calibration curve (wb p. 24-20). (OH 24-9) Use the new calibration curve (wb p. 24-20) to determine the appropriate feed settings to deliver 14.3 mL/min. STROKE = 60%, SPEED = 32. You adjust the feed settings and then measure the entry point pH. Now, the entry point pH is 8.5. Is the entry point pH within the target range? YES Is the daily routine finished? YES Record the data on the Monthly Operational Report (wb p. 24-15, 24-16). SPOT CHECKED THE FEED PUMP OUTPUT, CHECKED THE FEED SYSTEM, RECALIBRATED THE PUMP, ADJUSTED THE PUMP SETTING.
63
NEW LIQUID FEED PUMP CALIBRATION CURVE
% Stroke: 60% Pump:
64
Summary
Key Points:
• The Daily Stability Routine Flowchart is a tool used to maintain a stable water quality. (Fill in the blank)
• The Feed Rate vs. Dosage Table provides a quick reference for adjusting
chemical feed to deliver a new dosage. The Table remains constant as long as the plant flow does not vary and the chemical product strength remains the same. (Fill in the blanks)
• The Chemical Dosage Chart is used to adjust chemical feed when the
baseline water quality changes. (Fill in the blank)
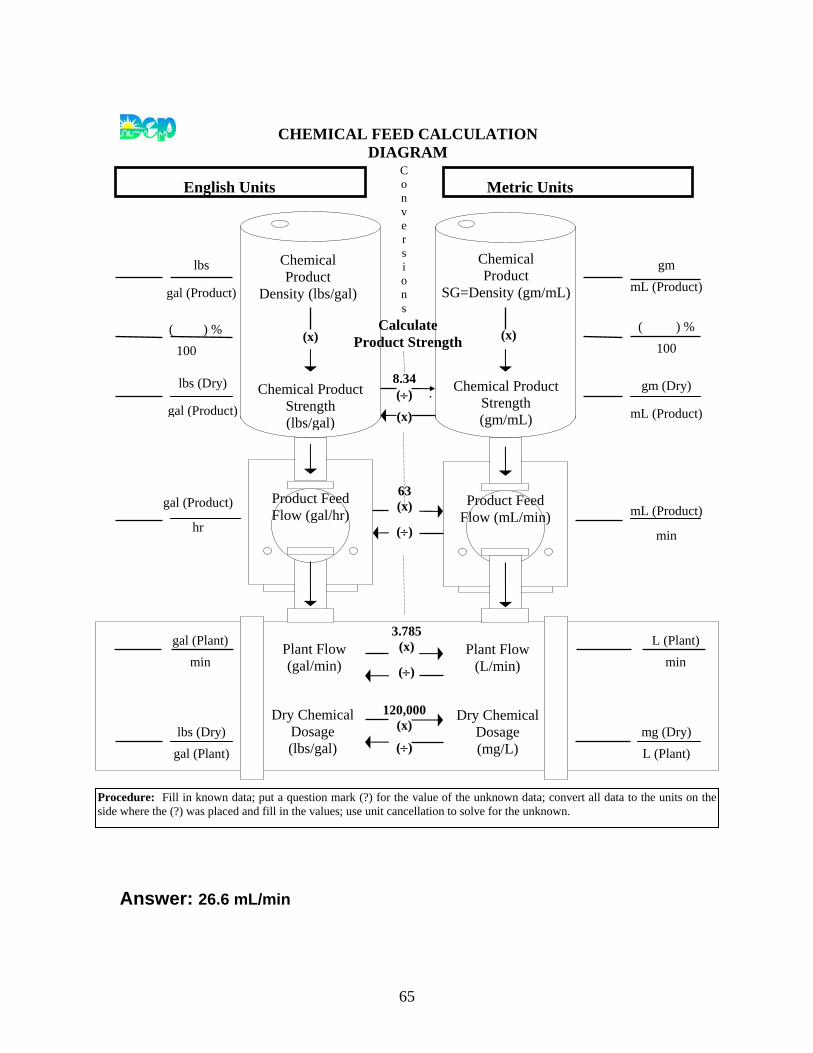
Chemical Feed Calculation Practice Problems
1. A treatment plant wants to feed sodium hypochlorite (12%, density = 10.4 lbs/gal) at a dosage of 1.5 mg/L. The plant flow is 700 GPM. What feed pump rate in mL/min is needed to deliver this dosage?
(Diagram on next page)
65
English Units Metric Units 10.2 .12 12 1.224 .1467625
? 3347 Answer: 26.6 mL/min
Chemical Product
SG=Density (gm/mL)
(x)
Chemical Product
Density (lbs/gal)
(x)
Chemical Product Strength (gm/mL)
Plant Flow (gal/min)
3.785 (x)
(÷) Plant Flow
(L/min)
Dry Chemical Dosage (lbs/gal)
Dry Chemical Dosage (mg/L)
Product Feed Flow (gal/hr)
C o n v e r s i o n s
Product Feed Flow (mL/min)
Calculate Product Strength
Chemical Product Strength (lbs/gal)
CHEMICAL FEED CALCULATION DIAGRAM
Procedure: Fill in known data; put a question mark (?) for the value of the unknown data; convert all data to the units on the side where the (?) was placed and fill in the values; use unit cancellation to solve for the unknown.
gm
mL (Product)
( ) %
100
gm (Dry)
mL (Product)
8.34 (÷)
(x)
mL (Product)
min
63 (x)
(÷)
L (Plant)
min
mg (Dry)
L (Plant)
120,000(x)
(÷) lbs (Dry)
gal (Plant)
gal (Plant)
min
gal (Product)
hr
lbs (Dry)
gal (Product)
( ) %
100
lbs
gal (Product)
66
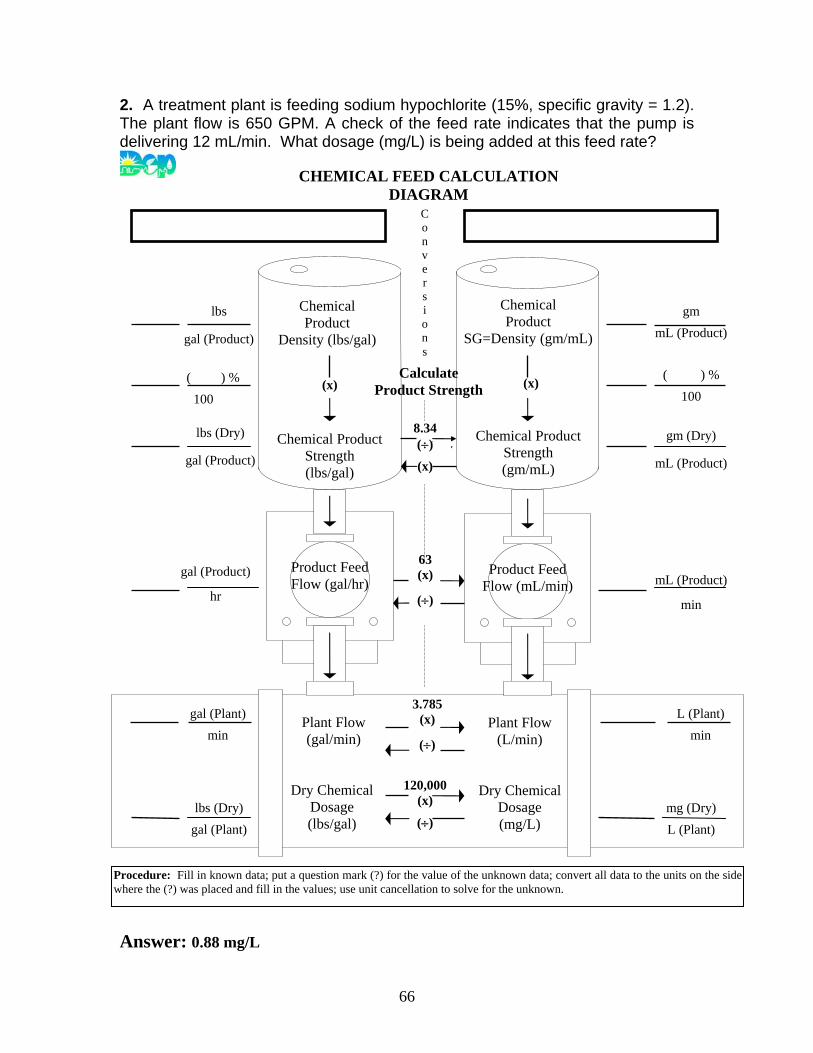
2. A treatment plant is feeding sodium hypochlorite (15%, specific gravity = 1.2). The plant flow is 650 GPM. A check of the feed rate indicates that the pump is delivering 12 mL/min. What dosage (mg/L) is being added at this feed rate?
Answer: 0.88 mg/L
Chemical Product
SG=Density (gm/mL)
(x)
Chemical Product
Density (lbs/gal)
(x)
Chemical Product Strength (gm/mL)
Plant Flow (gal/min)
3.785 (x)
(÷) Plant Flow
(L/min)
Dry Chemical Dosage (lbs/gal)
Dry Chemical Dosage (mg/L)
Product Feed Flow (gal/hr)
C o n v e r s i o n s
Product Feed Flow (mL/min)
Calculate Product Strength
Chemical Product Strength (lbs/gal)
CHEMICAL FEED CALCULATION DIAGRAM
Procedure: Fill in known data; put a question mark (?) for the value of the unknown data; convert all data to the units on the side where the (?) was placed and fill in the values; use unit cancellation to solve for the unknown.
gm
mL (Product)
( ) %
100
gm (Dry)
mL (Product)
8.34 (÷)
(x)
mL (Product)
min
63 (x)
(÷)
L (Plant)
min
mg (Dry)
L (Plant)
120,000(x)
(÷) lbs (Dry)
gal (Plant)
gal (Plant)
min
gal (Product)
hr
lbs (Dry)
gal (Product)
( ) %
100
lbs
gal (Product)