Embed Size (px)
Citation preview

NATURE ECOLOGY & EVOLUTION 1, 0199 (2017) | DOI: 10.1038/s41559-017-0199 | www.nature.com/natecolevol
ARTICLESNATURE ECOLOGY & EVOLUTION
The Supplementary Information files that were originally published with the Article were not the intended final files. Both files have been updated.
Corrigendum: Megafaunal isotopes reveal role of increased moisture on rangeland during late Pleistocene extinctionsM. Timothy Rabanus-Wallace, Matthew J. Wooller, Grant D. Zazula, Elen Shute, A. Hope Jahren, Pavel Kosintsev, James A. Burns, James Breen, Bastien Llamas and Alan Cooper
Nature Ecology & Evolution 1, 0125 (2017); published 18 April 2017; corrected 5 June 2017.
© 2017
Macmillan
Publishers
Limited,
part
of
Springer
Nature.
All
rights
reserved.

In the format provided by the authors and unedited.
1
ARTICLESPUBLISHED: 18 APRIL 2017 | VOLUME: 1 | ARTICLE NUMBER: 0125
© 2017 Macmillan Publishers Limited, part of Springer Nature. All rights reserved.
NATURE ECOLOGY & EVOLUTION 1, 0125 (2017) | DOI: 10.1038/s41559-017-0125 | www.nature.com/natecolevol
Megafaunal isotopes reveal role of increased moisture on rangeland during late Pleistocene extinctionsM. Timothy Rabanus-Wallace1*, Matthew J. Wooller2, 3, Grant D. Zazula4, Elen Shute1, 5, A. Hope Jahren6, Pavel Kosintsev7, James A. Burns8, James Breen1, 9, Bastien Llamas1 and Alan Cooper1*
The role of environmental change in the late Pleistocene megafaunal extinctions remains a key question, owing in part to uncer-tainty about landscape changes at continental scales. We investigated the influence of environmental changes on megaherbi-vores using bone collagen nitrogen isotopes (n = 684, 63 new) as a proxy for moisture levels in the rangelands that sustained late Pleistocene grazers. An increase in landscape moisture in Europe, Siberia and the Americas during the Last Glacial–Interglacial Transition (LGIT; ~25–10 kyr bp) directly affected megaherbivore ecology on four continents, and was associated with a key period of population decline and extinction. In all regions, the period of greatest moisture coincided with regional deglaciation and pre-ceded the widespread formation of wetland environments. Moisture-driven environmental changes appear to have played an important part in the late Quaternary megafaunal extinctions through alteration of environments such as rangelands, which supported a large biomass of specialist grazers. On a continental scale, LGIT moisture changes manifested differently according to regional climate and geography, and the stable presence of grasslands surrounding the central forested belt of Africa during this period helps to explain why proportionally fewer African megafauna became extinct during the late Pleistocene.
The relative roles of human impacts and environmental change in the extinction of the late Pleistocene megafaunal communi-ties of Eurasia and the Americas during the LGIT, approxi-
mately 25–10 kyr bp (thousand years before present), remain poorly understood. Rapid warming events have recently been linked with megafaunal extinctions, both with and without the synergistic effects of human presence1,2. However, the apparently less severe impacts of previous glacial–interglacial cycles remain difficult to explain, and the potential role of human hunting is also compli-cated by the long-term coexistence of megafauna with early mod-ern human and Neanderthal hunters in both Africa and Eurasia. A crucial question in this debate is the nature and extent of the landscape changes during and after the Last Glacial Maximum (LGM, ~25–15 kyr bp) which accompanied extinction events in different parts of the world3,4. These changes can be caused by altered climate, human activities and the presence of megafauna, all of which exert strong top-down pressure on the vegetation, soil and nutrient cycling processes at the base of the food chain. These interactions can be detected through direct evidence (for example butchery marks on bones) or indirect methods such as relating the timing of climate events to extinction events in the palaeontologi-cal record1,3. Direct evidence approaches are particularly important in establishing causality, and studies of fossil abundance, body size and dietary stable isotopes have all identified environmental factors directly impacting megafaunal ecology5–7.
Megaherbivores played a critical role in Pleistocene ecosys-tems, functioning as ‘nutrient pumps’8, adapted to harvesting and distributing the nutrients available across widespread rangelands such as the mammoth steppe, a grass/forb-dominated biome extending from Europe to Siberia and across the Bering Land Bridge into northwestern North America4,9,10. Rangelands and grazers were interdependent, with megafauna impeding the colonization of trees through trampling and sapling consumption, while clearing and breaking down the organic matter from seasonally senescing foli-age9. Seasonal aridity also strongly influences the distribution of rangelands, such that climate change can exert extinction pressure on megafaunal rangeland grazers through habitat loss and range fragmentation9,11–13. Rangelands are particularly amenable to the study of moisture-driven environmental change through nitrogen isotopes preserved in grazer fossils, for which a strong inverse cor-relation exists between soil moisture and the heavier nitrogen stable isotope 15N relative to 14N (expressed using delta notation, δ 15N‰) in soils, plants and herbivore collagen14. The relationship is most pro-nounced where annual rainfall is lower than 500–700 mm (refs 14,15), which is typical for grassland biomes, and the probable range for those in the late glacial leading into the dry LGM16,17 (Supplementary Fig. 17, Supplementary References 5). Palaeoisotopic studies have detected LGIT decreases in δ 15N values across the mammoth steppe, which have been related to moisture from increasing precipitation and degrading permafrost5,12,16,18–20. The changes in δ 15N values
1Australian Centre for Ancient DNA, University of Adelaide, North Terrace, South Australia 5005, Australia. 2Alaska Stable Isotope Facility, Water and Environmental Research Center, Institute of Northern Engineering, University of Alaska Fairbanks, Fairbanks, Alaska 99775, USA. 3College of Fisheries and Ocean Sciences, University of Alaska Fairbanks, Fairbanks, Alaska 99775, USA. 4Yukon Palaeontology Program, Department of Tourism and Culture, Government of Yukon, Whitehorse, Yukon Y1A 2C6, Canada. 5School of Biological Sciences, Flinders University, Bedford Park, South Australia 5042, Australia. 6Centre for Earth Evolution and Dynamics, Department of Geosciences, University of Oslo, Postbox 1028, Blindern, N-0315 Oslo, Norway. 7Institute of Plant and Animal Ecology, Russian Academy of Sciences, 202 8 Marta Street, 620144 Ekaterinburg, Russia. 8Curator Emeritus, Quaternary Paleontology, Royal Alberta Museum, Edmonton, Alberta T5N 0M6, Canada. 9Robinson Institute, University of Adelaide, North Terrace, South Australia 5005, Australia. *e-mail: [email protected]; [email protected]
© 2017 Macmillan Publishers Limited, part of Springer Nature. All rights reserved.
SUPPLEMENTARY INFORMATIONVOLUME: 1 | ARTICLE NUMBER: 0125
NATURE ECOLOGY & EVOLUTION | DOI: 10.1038/s41559-017-0125 | www.nature.com/natecolevol 1

2
Contents
TableofContentsSupplementary:Methods.......................................................................................................................3
SMMethods1:Dataset..........................................................................................................................................3SMMethods2:DatahandlingandtheRMACalgorithm:motivation,description,implementation.........................................................................................................................................................4SMMethods3:Theeffectsofparametersr,a,b,c,m,ontheRMAC..................................................7
Supplementary:Text............................................................................................................................13SMText1:Proxychoiceandsourcesofvariationinthedata...........................................................13SMText2:Carbonstableisotopes.................................................................................................................15SMText3:Megafaunalcommunitycollapse.............................................................................................16SMText4:Non-graminivoreherbivoreδ15Nvalues..............................................................................17SMText5:SouthAmericanrangelandswereanalogoustothoseonthemammothsteppe18
Supplementary:FiguresandInvestigations.................................................................................18Supplementary:References...............................................................................................................27
SMReferences1:Datedδ15Nmeasurements............................................................................................27SMReferences2:Glaciationchronologies.................................................................................................28SMReferences3:PeatlandInitiationDates...............................................................................................28SMReferences4:Climaticfactors/proxies................................................................................................28SMReferences5:Selectedstudiesdemonstratingtheclimate-δ15Nlinkinmodernaridandsemi-aridenvironments.....................................................................................................................................28
Supplementary:Code(inRv3.2.2)..................................................................................................31Subroutines..............................................................................................................................................................31DataHandlingandCalibration........................................................................................................................32Insolation/PeatlandInitiation.........................................................................................................................34t-tests(SMFigures5)..........................................................................................................................................34
Supplementary:Bibliography...........................................................................................................35
© 2017 Macmillan Publishers Limited, part of Springer Nature. All rights reserved.
NATURE ECOLOGY & EVOLUTION | DOI: 10.1038/s41559-017-0125 | www.nature.com/natecolevol 2
SUPPLEMENTARY INFORMATION

3
Supplementary:Methods
SMMethods1:Dataset
SMFigure1.Samplenumbersandlocations.
SMFigure1presentstheδ15Nmeasurementsusedinthisstudyalongwithglobalregion
andsource.Newmeasurements(n=63)arecreditedtoACAD(AustralianCentrefor
AncientDNA).OtherdatasourcesaredetailedinSMReferencesandSMBibliography.
UncalibrateddateswerecalibratedusingthecalibrationcurveIntCal13forallnorthern
hemispheredata,andSHCal13forSouthAmerica.Thecalibrationswereperformed
usingtheRpackageBchronandrepresentedasasinglevaluebytakingthemedianof
theprobabilitydistributionovertime(https://cran.r-project.org/package=Bchron;SM
Code).PreviouslypublishedcalibrateddateswereusedfromthestudiesindicatedinSM
Methods1.Indirectlydatedsamples(n=39BisonandEquussamplesfromDruckeret
al.,2003,andn=5sedimentsamplesfromHaileetal.,2009;seeSMData)wereonly
usedwhenmultiple14Cdatesfromadatedsedimentarylayerallfellwithin750yrsof
oneandanother,andcalibrationwasthenperformedusingthemeanofthe14Cdates
andthehighestofthe95%errormargins.Allsamplesdatingtobetween45and1ka
(thousandyearsbeforepresent)wereincludedinthemainstudyandtheSM
investigations.
© 2017 Macmillan Publishers Limited, part of Springer Nature. All rights reserved.
NATURE ECOLOGY & EVOLUTION | DOI: 10.1038/s41559-017-0125 | www.nature.com/natecolevol 3
SUPPLEMENTARY INFORMATION

4
Samplesweregroupedbygenus.BisonandEquussamplesareabundantinthefossil
recordandtheirdietarypreferenceforgraminoidsreducesthepotentialeffectsofdiet
selectiononδ15Nvalues[1-4].EquusincludesspecimensidentifiedasE.caballusandE.
ferus,whileBisonincludesB.bison,B.bonasus,B.antiquus,B.priscus,alongwithsamples
identifiedonlytogenuslevel.LamacomprisesL.gracilisandL.guanicoe.FortheSM
analyses,MammuthusincludesonlyspecimensofM.primigeniuswhilethecarnivorous
felidsaredescribedinthetextaccompanyingSMFigure11.Similarly,sedimentδ15N
valuesaregiveninSMFiguresandInvestigations(Figure10).
Thesamplesusedinthemainstudy(Equus,Bison,andLama)werethengroupedinto
oneofthefollowingbins:European,Siberian(includingallEurasiansampleseastof
CentralEurope),NorthAmerican,orSouthAmerican(seeSMFigure1).TheNorthSlope
ofAlaskawasseparatedfromtheremainderoftheNorthAmericancontinentsince
ecologicalcontinuitybetweenthetwoisbrokenbytheBrooksRange,andthefossil-rich
NorthSlopeprovidesadequatedatatoindependentlycharacterisetrendsinδ15N
values.
SMMethods2:DatahandlingandtheRMACalgorithm:motivation,description,implementation
Wedevelopedanovelapproachtocombineallavailabledataineachregiontoyielda
proxyfortherelativechangesinMoistureAvailability(𝑀𝑀𝑀𝑀)overtime,basedongrazer
collagenδ15Nvalues.ThismethodproducesaRelativeMoistureAvailabilityCurve
(RMAC)basedonfivesteps:normalisation,exclusionofdata-poorregions,smoothing,
transformation,andscaling.Weaimedtoestimatechangesinrelativemoistureinaway
thataccountedappropriatelyforthereliabilityofthedataatdifferentpointsintime.To
achievethisweestablishedfourguidelines:1)Inperiodswheredataweretoosparseto
adequatelyrepresentδ15Nvariationthennoestimateofmoistureshouldbemade;2)
foranygiventimepoint,relativeMAshouldonlybeestimatedifdataoccurnearbyboth
beforeandafterthattimepoint;3)attimepointswherethedataaredense,itismore
reasonabletoreconstructrelativeMAbasedupontheabundantdataimmediately
surroundingthetimepoint.Wheredatabecomesparse,thefairestestimationof
relativeMAshouldbemoreheavilyinfluencedbymoredistantdata.4).Somemeasure
© 2017 Macmillan Publishers Limited, part of Springer Nature. All rights reserved.
NATURE ECOLOGY & EVOLUTION | DOI: 10.1038/s41559-017-0125 | www.nature.com/natecolevol 4
SUPPLEMENTARY INFORMATION

5
ofthevariabilityoftherelativemoistureestimateatdifferentpointsintimeshouldbe
included.Guidelines1–3areillustratedinSMFigure2;
Tomakedatafromdifferenttaxacomparable,δ15Nvaluesarenormalisedseparatelyfor
eachgenusandtheresultingstandardscores(Z-scores)arethencombinedtogiveadataset𝒙𝒙=(𝑥𝑥!,𝑥𝑥!,...,𝑥𝑥𝑛𝑛),withndatapoints,meanequalto0,andstandard
deviationequalto1.Thisstepisintendedtoeliminatethedifferencesinmeanδ15N
values,aswellasheteroscedasticitybetweenregionsandtaxaduetoidiosyncraciesin
diet,habitat,andphysiology.Eachdatapointin𝒙𝒙isassociatedwithadate,listedin𝒕𝒕 =
𝑡𝑡/, 𝑛𝑛𝑡𝑡0, … , 𝑛𝑛𝑡𝑡2 .TheRMACreconstructionisbaseduponthecentraltendencyof𝒙𝒙over
time,inaccordancewiththepropertieslistedabove.Thesmoothingstep,asillustrated
below,accountsforguidelines1–3(seealsoSMMethods3).
SMFigure2.SchematicillustrationofthesmoothingmethodusedintheRMAC.Bluedots:data.Blackline:the
smoothedaveragethatislatertransformedtogivetheRMAC.Bluecurves:weightingfunctionsatselectedtime
points,illustratingtherelationshipbetweenthevarianceoftheweightingfunctionandthelocaldensityofdata
points.
Inpractice,thesmoothedvalueatatimepointisgivenbythefunction𝑠𝑠 𝑇𝑇 foreach
timepoint𝑇𝑇.Toaccountforguidelines1and2,sis𝑢𝑢𝑢𝑢𝑢𝑢𝑢𝑢𝑢𝑢𝑢𝑢𝑢𝑢𝑢𝑢𝑢𝑢atanypointintime
wherefewerthan𝑚𝑚entriesin𝒕𝒕fallwithintherange 𝑇𝑇 − 𝑟𝑟, 𝑛𝑛𝑇𝑇 + 𝑟𝑟 ,orwhennoentries
in𝒕𝒕fallwithineither 𝑇𝑇 − 𝑟𝑟, 𝑇𝑇 or 𝑇𝑇, 𝑇𝑇 + 𝑟𝑟 ,forsomeconstant𝑟𝑟.Aflagvariable𝑢𝑢is
© 2017 Macmillan Publishers Limited, part of Springer Nature. All rights reserved.
NATURE ECOLOGY & EVOLUTION | DOI: 10.1038/s41559-017-0125 | www.nature.com/natecolevol 5
SUPPLEMENTARY INFORMATION

6
giventhevalue1whentheseconditionsaremet,and0otherwise.Wherethese
conditionsarenotmet,𝑠𝑠(𝑇𝑇)isgivenastheweightedmeanofthesurrounding
datapoints,withthecontributionofeachpointweightedusingtheGaussianprobability
densityfunction𝐺𝐺(𝑥𝑥,µ,s).Inpractice,aGaussiankernelsmoother:
�𝑠𝑠 𝑇𝑇 =
𝑢𝑢𝑢𝑢𝑢𝑢𝑢𝑢𝑢𝑢𝑢𝑢𝑢𝑢𝑢𝑢𝑢𝑢�if𝑢𝑢 = 1, and
𝐺𝐺 𝑇𝑇 − 𝑡𝑡F, 0,µG 𝒙𝒙𝒊𝒊�2�
FI/
𝐺𝐺 𝑇𝑇 − 𝑡𝑡F�, 0,µG2�FI/
otherwise.
ThevariableµG ,thestandarddeviationoftheweightingfunction,isincludedtoaccount
for guideline 3, declining in magnitude as data points become more sparse in the
vicinity of𝑇𝑇(see diagram above). To setµappropriately at each time𝑇𝑇, we require
some measure of the density of data in the vicinity of𝑇𝑇. We use the score𝑢𝑢G =
𝐺𝐺 𝑇𝑇 − 𝑡𝑡F�, 0, 𝑎𝑎 2�FI/ , which is proportional to the Gaussian kernel density at𝑇𝑇with
bandwidth𝑎𝑎. The standard deviation of the weighting function,µG , is then assigned
usingtherelationship𝑢𝑢G = 𝑏𝑏𝑢𝑢STUV ,whichallowsforthestandarddeviationtoapproach
zeroasthedensityincreases(seealsoSMMethods3).Theparameters𝑏𝑏and𝑐𝑐influence
howthedensityaffects theweighting function.Theparametersused in thisstudyare
�𝑎𝑎 = 1500, �𝑏𝑏 = 2000, 𝑐𝑐 = 100, 𝑟𝑟 = 3800,𝑚𝑚 = 3,withtheexceptionofEuropewhere𝑏𝑏
isset to10000, topreventoverfittingcausedbythehighdensityofdatapoints in this
group.
Smoothedvalues𝑠𝑠 𝑇𝑇 arethebasisofthelinesshownoverthedatadisplayedinthe
insetgraphsinMainTextFigure1.
ThedeterministiccomponentoftherelationshipbetweenmeasuresofMoisture
Availability(𝑀𝑀𝑀𝑀)andδ15Nvaluesinaridandsemi-aridenvironments(annual
precipitation<~500–800mm;seeSMReferences5andSMFigure14)hasbeen
describedasδ/]N~ `ab
+ 𝑧𝑧,where𝑦𝑦and𝑧𝑧areconstantsspecifictothesystemunder
study[5].Sincethereislittlesuchinformationaboutthepaleoecosystemsorspeciesin
thisstudy,andwearepoolingnormaliseddatafrommultipledifferentsystems(e.g.
© 2017 Macmillan Publishers Limited, part of Springer Nature. All rights reserved.
NATURE ECOLOGY & EVOLUTION | DOI: 10.1038/s41559-017-0125 | www.nature.com/natecolevol 6
SUPPLEMENTARY INFORMATION

7
taxaandregions),wehaveassignedtherelative𝑀𝑀𝑀𝑀vs.δ15Nrelationshiptoprovidea
reasonablereconstructionoftherelativemoisturechangesovertime.Tomakeour𝑀𝑀𝑀𝑀
vs.δ/]Ncurvecompatiblewiththeresultsofempiricalstudies(seeSMReferences5)
weensuredthat,attheupperrangeofvalues,achangeinδ15Nvaluescorrespondstoa
changein𝑀𝑀𝑀𝑀perhapsfivetotentimessmallerthanasimilarchangeatthelowerendof
therange.Giventhevariationinpublishedstudiesacrossdifferentsystemsthis
approachseemsareasonablecompromiseuntilappropriateempiricaldataare
gathered.Thetransformationiseffectedusingthefunction:
𝑅𝑅 𝑇𝑇 =1
𝑠𝑠 𝑇𝑇 +𝑚𝑚𝑚𝑚𝑚𝑚GIfg],fff 𝑠𝑠 𝑇𝑇 + 1
.
Termsaddedto𝑠𝑠 𝑇𝑇 inthedenominatorupshiftthedatatoavoidundefinedvaluesof𝑅𝑅.
Theoutputof𝑅𝑅isinarbitraryunits,bestinterpretedasapproximatechangesinthe
relativeavailabilityofmoistureovertime,allowingthevaluestobescaledforplotting
andcomparisontootherproxies(e.g.MainTextFigure1).Foreachstudygroup,we
took1000bootstrapsamplesfromthedataandforeachevaluated𝑅𝑅at200points
spacedequallyalongtherange 0,45000 .Ateachpoint,abootstrap95thpercentile
confidenceintervaliscalculatedandplottedtoyieldtheRMACsshowninMainText
Figure1.
TheRMACreconstructionwasimplementedinRandthepackageggplot2(seeSM
Code).Deglaciationproxieswerereproduceddirectlyfromthesourcepublications
(listedinSMReferences2).PeatlandinitiationwasrepresentedbyapplyingR’sdensity
functionwithbandwidth1000onpeatlandinitiationdatesgroupedbyregion(North
Slopen=70,otherNorthAmerican=919,Siberian=363,Europen=518,South
American=54;sourceslistedinSMReferences3).Thepeatlandinitiationdateswere
calibratedusingthecalibrationcurvesandmethodsasdescribedfortheδ15Nvalues
(SMMethods1andSMCode).
SMMethods3:Theeffectsofparametersr,a,b,c,m,ontheRMAC
© 2017 Macmillan Publishers Limited, part of Springer Nature. All rights reserved.
NATURE ECOLOGY & EVOLUTION | DOI: 10.1038/s41559-017-0125 | www.nature.com/natecolevol 7
SUPPLEMENTARY INFORMATION
8
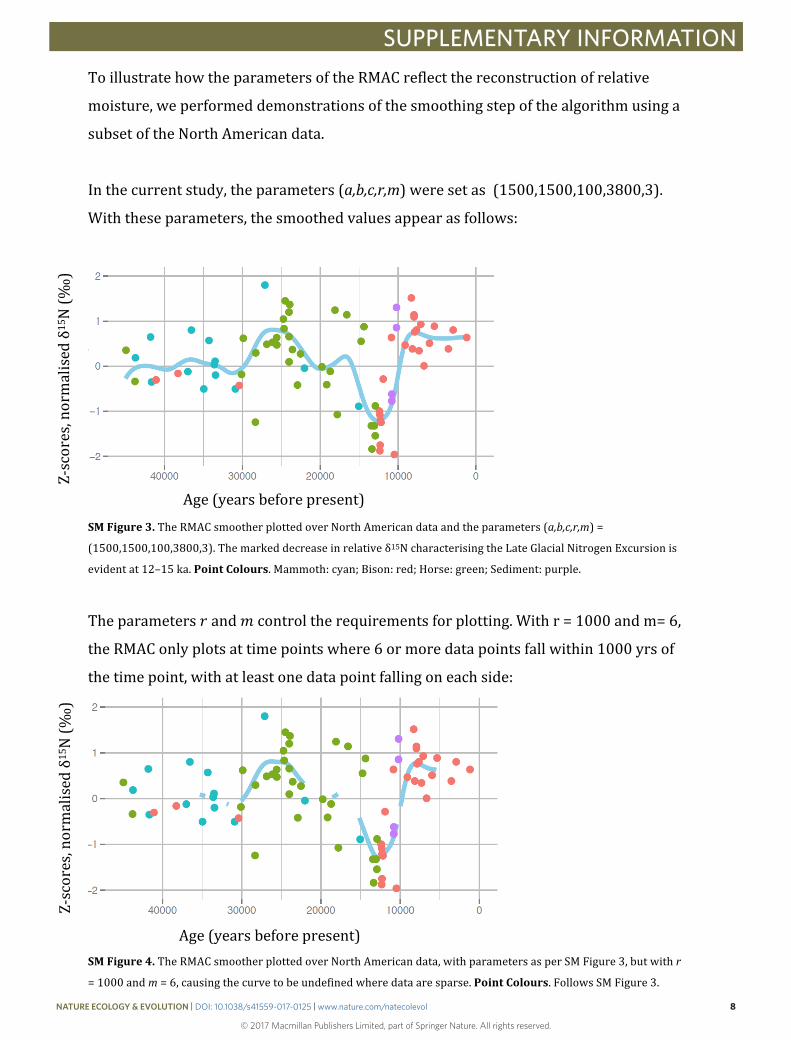
ToillustratehowtheparametersoftheRMACreflectthereconstructionofrelative
moisture,weperformeddemonstrationsofthesmoothingstepofthealgorithmusinga
subsetoftheNorthAmericandata.
Inthecurrentstudy,theparameters(a,b,c,r,m)weresetas(1500,1500,100,3800,3).
Withtheseparameters,thesmoothedvaluesappearasfollows:
SMFigure3.TheRMACsmootherplottedoverNorthAmericandataandtheparameters(a,b,c,r,m)=
(1500,1500,100,3800,3).Themarkeddecreaseinrelativeδ15NcharacterisingtheLateGlacialNitrogenExcursionis
evidentat12–15ka.PointColours.Mammoth:cyan;Bison:red;Horse:green;Sediment:purple.
Theparameters𝑟𝑟and𝑚𝑚controltherequirementsforplotting.Withr=1000andm=6,
theRMAConlyplotsattimepointswhere6ormoredatapointsfallwithin1000yrsof
thetimepoint,withatleastonedatapointfallingoneachside:
SMFigure4.TheRMACsmootherplottedoverNorthAmericandata,withparametersasperSMFigure3,butwithr
=1000andm=6,causingthecurvetobeundefinedwheredataaresparse.PointColours.FollowsSMFigure3.
Z-scores,n
ormalised
δ15N(‰
)
Age(yearsbeforepresent)
Age(yearsbeforepresent)
Z-scores,n
ormalised
δ15N(‰
)
© 2017 Macmillan Publishers Limited, part of Springer Nature. All rights reserved.
NATURE ECOLOGY & EVOLUTION | DOI: 10.1038/s41559-017-0125 | www.nature.com/natecolevol 8
SUPPLEMENTARY INFORMATION

9
Theparameter𝑎𝑎controlshowthedensityofdataismeasuredateachpointintime.A
lowvaluemeansthedensityisestimatedbasedlargelyonthedensityofdataveryclose
totheestimationpoint,whileahighervaluemeanstheestimategivesmoreweightto
datapointsfurtherfromtheestimationpoint.Ideally,thedensityscorewillchange
quicklywhereanobviouschangeindensityoccurs,suchasbeforeandafter~27kain
theexampleshere(SMFigures3–8).Theeffectofaltering𝑎𝑎canbeobservedbyplotting
thenormaliseddensityscores,toassessintuitivelyhowwelltheheightoftheline
reflectschangesinthedensityofdata.
Pale: Normaliseddensitywitha=5000
Medium: Normaliseddensitywitha=1500
Dark: Normaliseddensitywitha=500
SMFigure5.TheeffectofparameterauponRMACdensityscorescorrespondingtoNorthAmericandata,showing
howlowvaluesofaproducedensityscoresthataremoresensitivetochangesinthedensityofdata.Parameters
besidesaasperSMFigure3.LineColours.Dark:a=500;Medium:a=1500;Pale:a=5000.PointColours.Follows
SMFigure3.
Thedensityscore𝑑𝑑isusedtosetthestandarddeviationsoftheweightingdistributions
forthesmoother.AsshowninSMFigure2,thestandarddeviationissmallwherethe
dataaredense,andlargewherethedataaresparse.Therelationshipbetweenthe
kerneldensityandthestandarddeviationiscontrolledbytheparameters𝑏𝑏and𝑐𝑐:
Age(yearsbeforepresent)
Z-scores,n
ormalised
δ15N(‰
)
Densityscore(norm
alised)
© 2017 Macmillan Publishers Limited, part of Springer Nature. All rights reserved.
NATURE ECOLOGY & EVOLUTION | DOI: 10.1038/s41559-017-0125 | www.nature.com/natecolevol 9
SUPPLEMENTARY INFORMATION

10
Red:NormalisedDensity(witha=1500)
Pale: Standarddeviationwithb=1500
Medium: Standarddeviationwithb=1000
Dark: Standarddeviationwithb=200
SMFigure6.TheeffectofparameterbupontherelationshipbetweenRMACdensityscores,andtheSDofthe
weightingfunctionusingtheNorthAmericandataset.ParametersbesidesbfollowSMFigure3.RedLine.RMAC
densityscore.BlueLines.SDofweightingdistribution.BlueLineColours.Dark:b=200;Medium:b=1000;Pale:b
=1500.
Red:NormalisedDensity
Pale: Standarddeviationwithc=50
Medium: Standarddeviationwithc=250
Dark: Standarddeviationwithc=500
Age(yearsbeforepresent)
SDofW
eigh
tingDistribu
tion
Density
© 2017 Macmillan Publishers Limited, part of Springer Nature. All rights reserved.
NATURE ECOLOGY & EVOLUTION | DOI: 10.1038/s41559-017-0125 | www.nature.com/natecolevol 10
SUPPLEMENTARY INFORMATION

11
SMFigure7.TheeffectofparametercupontherelationshipbetweenRMACdensityscores,andtheSDofthe
weightingfunctionusingtheNorthAmericandataset.ParametersbesidescfollowSMFigure3.RedLine.RMAC
densityscore.BlueLines.SDofweightingdistribution.BlueLineColours.Dark:c=500;Medium:c=250;Pale:c=
50.
Todemonstratetheeffectofdensity-dependentweighting,theresultsofthesmoothing
stepcanbecomparedwithandwithoutthisfeature.TheredcurveinSMFigure8
representstheRMACsmootherwithdensity-dependentweighting(b=3000,c=300).
Thebluecurvesaredensity-independent(c=0)withnarrower(darkblue;b=1000)or
broader(lightblue;b=2000)weightingfunctions.Notethatthelightbluecurve
performswellinthelow-densityregions<27ka,butunderfitsinthedenseregions
around14–5ka.Thedarkbluecurveperformswellinthishigh-densityregionbut
overfitsinthelower-densityareas.TheredRMACsmootherappearstocapturethe
centraltrendswellinbothregions:
SMFigure8.AcomparisonoftheperformanceoftheRMACsmootherwithandwithoutdensity-dependent
weighting,usingNorthAmericandata,showinghowdensity-dependentweightingpreventstheunder-and
Age(yearsbeforepresent)
Density
SDofW
eigh
tingDistribu
tion
Age(yearsbeforepresent)
Z-scores,n
ormalised
δ15N(‰
)
© 2017 Macmillan Publishers Limited, part of Springer Nature. All rights reserved.
NATURE ECOLOGY & EVOLUTION | DOI: 10.1038/s41559-017-0125 | www.nature.com/natecolevol 11
SUPPLEMENTARY INFORMATION

12
overfittingofthesmootherwithoutthisfeature.LineColours.Red:Smootherwithdensity-dependentweighting,(b
=3000,c=300);Darkblue:Smootherwithoutdensity-dependentweighting,withparameters(b=1000,c=0);
Lightblue:Smootherwithoutdensity-dependentweighting,withparameters(b=2000,c=0).PointColours.
FollowsSMFigure3.
© 2017 Macmillan Publishers Limited, part of Springer Nature. All rights reserved.
NATURE ECOLOGY & EVOLUTION | DOI: 10.1038/s41559-017-0125 | www.nature.com/natecolevol 12
SUPPLEMENTARY INFORMATION

13
Supplementary:Text
SMText1:Proxychoiceandsourcesofvariationinthedata
SincethecurrentstudycomparesRMACsderivedfromdataspanningbroad
geographicalrangeswithproxiesfromasimilarlybroadrange,theresultsshouldbe
consideredanintegrationovercontinental/regional-scaletrends.Similarly,thetrends
aregeneralisedsincetheyrelyonageographicallyandtemporallyheterogeneous
sampleofrangelandfauna.However,sincethevariabledrivingthesignalisarguedto
bemoisture,andmoistureregimesactoverbroadspatialscales,somegeneralisation
oughttobepossible.Forexample,thevolumeofδ15Ndataappearsadequateto
demonstratethattheLateGlacialNitrogen-15Excursion(LGNE)fallswelloutsidethe
rangeofpre-LGM(LateGlacialMaximum)variation.Themagnitudeoftheδ15Nshift
andthecorrelationbetweendifferentregionsandtaxasuggestabiologicalevent
associatedwiththeclimaticandenvironmentaleventsoftheLastGlacial-Interglacial
Transition(LGIT;MainTextFig.2).
TheRMACreconstructionsarecontrastedwithdeglaciationproxiesforenvironmental
changeinMainTextFigure1.Whilethemassandareaoficesheetsisaproductof
complicateddynamicinputs(precipitation,condensation,surging)andoutputs
(melting,sublimation,calving),glaciationwasfavouredasaproxyforlargescale
climate-drivenchangesatthelandscapelevelbecausefactorscausinganicesheetto
retreatarealsolikelytobesignificanttoothersystems.Furthermore,theretreatofice
sheetsisitselfexpectedtostronglyinfluencethesurroundingenvironmentsvia
mechanismsincludingisostatic/eustaticsea-levelchange,thedischargeofmeltwater,
alteredwindandthermohalinecirculation,andtheretreatofperiglacialenvironments.
PeatlandformationisalsoplottedinMainTextFigure1asageneralisedproxyfor
environmentalchangeatcontinentalscalesovertimeduetotheextensivedatasets
availableforpeatlandinitiationoverabroadspreadoflocationswithinthestudy
regions,eachrepresentedbyasingledate(ratherthanaseriesofabundancemeasures
overtime).ThediscussionintheMainTextassumesthatgrazerspreferentially
aggregatedinflourishinggrasslandswheremoistureaccumulatedanddrovedownthe
© 2017 Macmillan Publishers Limited, part of Springer Nature. All rights reserved.
NATURE ECOLOGY & EVOLUTION | DOI: 10.1038/s41559-017-0125 | www.nature.com/natecolevol 13
SUPPLEMENTARY INFORMATION

14
δ15Nvaluesofgraze.Thiswouldspecificallyrequireprolongedincreasedmoisture:in
aridgrasslands,theimmediateeffectofincreasedmoisture(forinstance,theanomalous
rainyseasonreportedbyArranibar,Otteretal.in2004[6])caninfactincreasefoliar
δ15Nvaluesintheshortterm.Therefore,δ15Nvaluesonlynormallydecreasealongwith
averagedlong-term(annual/decadal)moisturelevels.Peatlandformationhasthesame
requirementforpersistentmoistureinlocalisedareas,justinalargerdegreeandfora
longertime[7-9].
Theδ15Nvaluesofnaturalsamplescanbeinfluencedbyanumberofbiological,
geological,andchemicalprocesses.Forinstance,salinity,slope,pH,temperature,and
depthhaveallbeenlinkedtosoilandplantδ15Nvalues[10-13].Moisturelevelshave
predictableeffectsonseveralaspectsofthenitrogencycle.Ithasbeensuggestedthat
generallydryenvironmentshaveproportionallymoreinorganicnitrogen,whichis
moreamenableto15Nenrichmentviaevaporation,whilewetenvironmentshavemore
organicnitrogen,whichmaysuffergreater15Ndepletionvialeaching[14].Such
interactionsultimatelyleadtothestrongstatisticalδ15N-moisturecorrelationsthat
havebeenreportedfromfieldstudiesinaridandsemi-aridregions(seeSMReferences
5).Theabundanceofinfluencesonδ15Nvaluescancomplicatetheinterpretationof
palaeo-isotopicdata,howeveritislikelythatmoistureexertedtheprimaryinfluenceon
theassembleddatasetashasbeenobservedinmodernglobalstudiesofecosystemδ15N
values(SMReferences5).
TheLGITwarmingtrendisknowntohaveproducedlandscapemoisturethrough
severalmeans.Increasedprecipitationinmanyregionswascausedbychangesinglobal
windcurrentsandthermohalinecirculation,withstormtracksandlowpressure
regionsmovingmoistureinlandinEurope[15],Siberia[16],andNorthAmerica[17-
19],andtheInter-TropicalConvergenceZoneshiftingsouthwardoverSouthAmerica
[20].Highertemperaturesincreasedevaporation,andrisingsealevelsbroughtthe
influenceofmaritimeclimateregimesfurtherinland.Directevidenceforenhanced
LGNEmoistureinputareprovidedbyLGITrecordsofstreamincisiondetectedinthe
studyregionsofEurope[21,22],theNorthSlope[23],Alaska[24],Siberia[25,26],and
SouthAmerica[27,28].Thisisreinforcedbychangesincertainplantcommunities,
whicharemoredirectlylinkedtothesoilmoisturethatexertsstrongcontrolover
© 2017 Macmillan Publishers Limited, part of Springer Nature. All rights reserved.
NATURE ECOLOGY & EVOLUTION | DOI: 10.1038/s41559-017-0125 | www.nature.com/natecolevol 14
SUPPLEMENTARY INFORMATION

15
grazerδ15Nvalues.LGITpollenprofilescollectedfromacrossthestudyregionsshow
transitionsofsteppevegetation(graminoid/forbdominance)toforestwithearly-
establishingtrees(oftendeciduousshrubsorsmalltrees),beingreplacedwithlarger
forestevergreens.Northofthetreelinethetransitionistotundravegetation,andwhere
thewaterbalanceallowsprolongedaccumulation,peatlandsform[20,29-32](seealso
SMReferences3).Withintheserobustgeneralrelationships,thecorrelationbetween
localproxiestothesoilmoisturethatinfluencesgraminivorecollagenδ15Nvaluesare
usuallyindirect,andheterogeneouswithinregionswithrespecttobothtimingand
extent.
SMText2:Carbonstableisotopes
Forthecollagensamplesanalysedforδ15Nvalues,wealsocomparedδ13Cvalueswith
datafrompreviousstudies(seeSMReferences1).Theδ13Cvaluesremainrelatively
stableduringtheLGNE,andthemoststrikingchangesareelevatedpost-LGNEδ13C
valuesinNorthAmericanbisonbetween~10and6ka,andaslightdecreasein
HoloceneEuropeanhorses(<10ka).Theseexcursionsareinoppositedirectionsand
arethereforelikelytobecontrolledbyvariablesactingatlocalscales[33].TheNorth
Americanδ13Cincreaseisfirstobservableinhorses,butbecomesmostapparentin
bisonsouthoftheicesheets(seeSMFigures1),andismostlikelytheresultofchanging
proportionsofC3vs.C4plantsinsouthernareas[34],thoughincreasingatmospheric
CO2mayalsohaveplayedapart[35].Theslightdecreaseinpost10kaEuropeanhorse
δ13Cvalues(~2permil)couldreflectadecreasedneedforWaterUseEfficiency(WUE)
byC3plants,changesinatmosphericCO2,oranincreasingcanopyeffect[36].Foliar
δ13CvaluesalsorespondstochangesinWUEinplants,whichmightwellbeexpectedto
alterwithchangesinmoisture.
Whileδ15Nvaluesaremostsensitiveunderaridconditions,δ13Cvaluesaremore
affectedbymoistenvironmentsandremainfarlesssensitivetochangesinmoisture
undercomparativelydryregimessuchasthoseknowntosustainextensiverangelands
inthePleistoceneandtoday[37].However,thelackofchangeinSiberianandNorth
Americanδ13CvaluesduringtheLGNEindicatesthatforagecompositionremained
© 2017 Macmillan Publishers Limited, part of Springer Nature. All rights reserved.
NATURE ECOLOGY & EVOLUTION | DOI: 10.1038/s41559-017-0125 | www.nature.com/natecolevol 15
SUPPLEMENTARY INFORMATION
16
consistentwithaprimarilyC3,graminoiddietandrulesoutmajorshiftsinforage,e.g.in
favourofherbs[38].CurrentpalaeoecologicalevidencealsoindicatesthatC4plantsdid
notexpandintoBeringiaintheLatePleistocene(e.g.[39,40]).
Palaeo-isotopestudiesthatinvestigatefoodwebsgenerallyassumethatδ15Nina
speciesatagiventimeisstabilisedbythatspecies’tendencytoconsumethesamekinds
offorageacrossbroadgeographicranges[41].Toothwear,isotopicstudiesofplant
type,andthedietsofmodernanalogueshavebeenusedtoargueforthisstabilisation
[3,41].Overallthen,apurelydiet-basedexplanationfortheLGNEpatternseems
unlikely,andwouldneedtopositanear-simultaneoustransitionofmultiplegrazing
taxaondifferentcontinentstoanalternativefoodsourcethataffectedδ15Ninthesame
manner,andinallcaseswasnotreflectedinδ13Cvalues.Thisisunlikely,although
moderatechangesintheratioofplanttypesconsumedispossiblesincemoistureis
likelytoencouragetherangelandfloratoalterinsimilarways,forinstance,by
increasingtheproportionof15N-depletedforbsandpioneerrudderalsinthediet.
SMText3:Megafaunalcommunitycollapse
ItisimportanttoemphasisewhythePleistocenerangelandswerecriticalinthe
structureofthemegafaunalmammalcommunities.Akeyquestionaboutthis
environmentistheso-calledproductivityparadoxwhichaskshowanenvironmentthat
waspresumedtobelargelytundrawasabletosupportsuchalargebiomassof
mammals.Guthrie[3]hassuggestedthatrangelandswereinfactsomeofthemost
productiveenvironments,withawarmgrowingseasonthawprovidingamplemoisture
fordeep-rootedgrasses,whileclearskiesandlongdaysallowedforfastgrowthand
uptakeofmobilenutrients.Duringthecoldseason,deadsuperterraneanfoliagewas
rapidlycomposted,andthenutrientsredistributedbymegafauna.Cold-aridgrasslands
mayalsofavourlargegrazersinparticular:large-bodiedendothermicanimals,havinga
largesurfacearea-to-volumeratiosandthermalinertia,mayincuraselectivebenefitin
coldenvironments.Largebodiesalsoallowlargedigestivesystemsfortheextractionof
energyfromsizeableamountsoflow-qualityforagesuchasthegraminoidsthat
dominatearidregions.Also,largebodiesmayallowlongersurvivalwhenresourcesare
© 2017 Macmillan Publishers Limited, part of Springer Nature. All rights reserved.
NATURE ECOLOGY & EVOLUTION | DOI: 10.1038/s41559-017-0125 | www.nature.com/natecolevol 16
SUPPLEMENTARY INFORMATION

17
scarce.Theselectiveadvantageconferredbythelattertwofactorsmaybeamplifiedby
strongseasonalshiftsinpolarregions[3].
Themaintextincludesonlycursorydiscussionofthemechanismsbywhichaltered
moistureregimesmayleadtoenhancedextinctionpressureonrangelandmegafauna,
focusingonhabitatlossasclimaticvariablesaltertheenvironment.Previousworkhas
exploredtheinterdependenceofmegafaunaandvegetation,alongwithotherfactors
suchasfire,andofferedinsightsintomechanismsthatdirectlylinkmegafaunal
extinctiontomoistureviathenitrogencycle[42-45].Forinstance,increasedmoisture
(alongsidetemperatureandatmosphericCO2)maycausenitrogentobecomealimiting
factorinthenutrientcycle.Herbivorebehaviourandphysiologychangessignificantlyto
compensateforinadequatefoliarnutrition[45],andbyretainingmorenitrogenand
focusingdeliberatelyonlocationscontaininghigh-nitrogenforage,theredistributionof
nutrientsbyherbivoresisimpaired.Thiscanfurtherexacerbatethenitrogenshortage
creatingafeedbackcycle[42].
SMText4:Non-graminivoreherbivoreδ15Nvalues.
Publishedstudies[46-49]havedemonstratedthatbrowsingdeerprobablyresponded
tosomeinfluencesnotaffectingtheobligatebrowsersusedtoinvestigatetherangeland
habitatsinthisstudy.Agradualincreaseinδ15NvaluesforNorthSlopecaribou
(Rangifertarandus)hasbeennotedfrom~40kaintotheLGM[48],whichisnot
obviouslyreflectedingrazervaluesfromtheregion.Whilethefacultativeconsumption
ofgrass,andsomesharedinfluencesofmoistureonbothgrazeandbrowseprobably
explainsthelateglacialdepletion(and,intheEuropeancaseofbothcaribouandred
deer,Cervuselephas,subsequentrecovery),theNorthSlopecaribourecordfromMann
et.al.(2013)[1]possiblyreflectscoolingandadecreaseinmoistureavailabilityleading
totheLGM,which,basedonhorse,bison,andmammothdatafromthesamestudy,
appearstohaveinfluencedtheecologyofrangelandslessthanthebiomesbrowsedby
caribou.Thepre-LGMincreasemaythereforereflectagreaterreliancebydeeron
graminoidmaterialincoldanddrytimes.Mostimportantly,however,thedecouplingof
theNorthSlopecaribouandgraminivorerecordsdemonstratesthatwhileecological
© 2017 Macmillan Publishers Limited, part of Springer Nature. All rights reserved.
NATURE ECOLOGY & EVOLUTION | DOI: 10.1038/s41559-017-0125 | www.nature.com/natecolevol 17
SUPPLEMENTARY INFORMATION

18
changeswereoccurringbeforetheLGIT,theydidnotsignificantlyimpacttheentire
herbivorecommunityuntilthelateglacialmoistureincreases[48].
SMText5:SouthAmericanrangelandswereanalogoustothoseonthemammothsteppe
Landscape-scaleinterpretationsoflate-glacialenvironmentalchangepredictthata
similardecreaseinδ15Nvaluesshouldbefoundwhereveraridrangelandsgrazedby
mega-herbivoresweresubjecttoasustainedincreaseinplant-availablemoisture.
SouthernSouthAmericanrangelands,andtheirgraminivore[50]community,makea
goodanalogueforthemammothsteppe,sharingsimilarhistorieswithrespectto
changesintheenvironmentsandtheextinctions/rangeshiftsofthegrazers[28,51,52].
FollowingLGITpopulationdeclineandrangecontraction,Lamagracilisbecame
confinedtohighlandsteppesinthecentralwest,whileL.guanicoepopulationsalso
underwentrangeshiftsduringtheglacialperiod[53],andoccupiedsimilarsteppe-like
habitatsalongthecentralandsouthernwestcoast[54].Pleistocenerangelandswere
replacedbyvariousbiomesincludingwoodland,wetland,forest,anddesert,andthe
permafrostthatunderlaymuchofthecontinent’ssouthernhalfduringtheLGMisnow
onlyfoundathighaltitudesalongthewesterncordillera[28,55].Previousstudieshave
shownSouthAmericancamelidδ15Nvaluescorrelatewithprecipitationandtovary
overtime[56,57].Overallthen,thellamaisotopicsignalsrecordananalogouspattern
tothatseenforhorse,bison,andmammothacrosstheholarcticrangelands,suggesting
asimilarprocessofmoisturechangeassociatedwithmegafaunalextinctions.
Supplementary:FiguresandInvestigations
SMFigure9displaysallherbivoreδ15Ndatacompiledforthestudypriorto
normalisation.Mammothδ15NvalueswerenotusedinthemaintextRMAC
reconstruction,owingtotheirlowdensityandpoortemporalcoverage.WhiletheRMAC
ischangedverylittlebyinclusionofthesevalues,thenormalisationstephastheeffect
ofover-emphasisingnoiseinthedatawhenfewdatapointsareavailable.Wheredata
pointsoverlapwiththeLGNE,themammothδ15Nvaluesdoindeedsuggestadecline,
whichisexpectedgiventhatdigestivephysiology,dentalmorphology,modern
analogues[4],ancientDNA[58],andstableisotopeanalysis[1]indicatethatmammoth
© 2017 Macmillan Publishers Limited, part of Springer Nature. All rights reserved.
NATURE ECOLOGY & EVOLUTION | DOI: 10.1038/s41559-017-0125 | www.nature.com/natecolevol 18
SUPPLEMENTARY INFORMATION

19
wererangelandgraminivoresthatsubsistedprimarilyonlargequantitiesoflow-quality
graminoidforagecomplementedbyforbs.
SMFigure9.Completeunnormalisedherbivoreδ15Ndatacompiledforthestudy,showingvaryingonsetofLGNE
patternindifferentregions.Totalsamplenumbersforeachregionaregivenineachpanel.NorthAmericansamples
areseparatedintothosefallinginEasternBeringia(Alaska,USA,andYukonTerritory,Canada;n=92),andsouthof
theNorthAmericanicesheetcomplex(AlbertaandBritishColumbiainCanada;Minnesota,Nevada,andWyomingin
theUSA;n=62).SiberiansamplesareseparatedintothosefromtheUralMountains(n=33)andotherregions
(includingtheRussianPlains,Taymyr,andWesternBeringia;n=56).SouthAmericanllamasareseparatedby
δ15 N
(‰)
Age(yearsbeforepresent)
n=231
n=154
n=152
n=89
n=45
© 2017 Macmillan Publishers Limited, part of Springer Nature. All rights reserved.
NATURE ECOLOGY & EVOLUTION | DOI: 10.1038/s41559-017-0125 | www.nature.com/natecolevol 19
SUPPLEMENTARY INFORMATION

20
speciesintoLamagracilis(n=15)andL.guanicoe(n=30).Mammothδ15Nvaluesfromtheliterature(n=93;SeeSM
DataandSMBibliography)arealsoshown.
Modernfieldstudiesshowthatthemoisture-δ15Nrelationshipisdetectableattrophic
levelsfromsoilupwards.Ourmoisture-basedinterpretationofδ15Nchangestherefore
predictsthattheLGNEwillbereflectedinsoilδ15Nvalues.Inadditiontodatapresented
inthemaintext,wecollatedδ15Nmeasurementsfrompermafrostsedimentsamples(n
=5)fromariverembankmentatSteven’sVillage,Alaskatakenfromtwopointswithina
transectreportedbyHaileetal.,2009[59](SMFigure10).Theageofthesamplesis
estimatedtobeca.10.8and10.2karespectively,basedupontheradiocarbondates
madealongthetransect.Whilethesefewsoilmeasurementsrepresentonlya
preliminaryinvestigation,thelowδ15Nvaluesmatchthefaunalsignals,andare
consistentwiththereturnphaseoftheLGNE.Whilefoliarnitrogenmayshowa
depletionin15Ncomparedwithsoil[60,61],herbivoreδ15Nvaluesaretypically~3–
4‰higherthantheforagetheyconsume.Thesoilδ15Nvaluesappeartofallinarange
thatwouldbeunexpectedlylowiftheyhadnotexperiencedLGITdepletion.
SMFigure10.Sedimentδ15Ndata(n=4)fromSteven’sVillage,AlaskaNorthAmericajuxtaposedagainstherbivore
datafromthesameregion,showingthatvaluesconsistentwiththeLGNEcanbedetectedinsoilsdatingfromthe
sameperiod.
δ15 N
(‰)
Age(yearsbeforepresent)
© 2017 Macmillan Publishers Limited, part of Springer Nature. All rights reserved.
NATURE ECOLOGY & EVOLUTION | DOI: 10.1038/s41559-017-0125 | www.nature.com/natecolevol 20
SUPPLEMENTARY INFORMATION

21
SMFigure11showstheraw(unnormalised)SouthAmericancamelidδ15Ndata,anda
similar,butelevated,patternofrapidincreaseinasetofcarnivoresfromthesamearea.
IthasbeenshownbyBumpetal.[33]thatorganismsathightrophiclevelsbetter
integratestableisotopesignaturesoverthesurroundingarea.Hencethecarnivoreδ15N
valuesindicatethatalargeproportionoftheherbivoresconsumedbythesefelids
(includingtaxaotherthanllamas)exhibitedthesamegeneraltrend,reinforcingthe
viewthattheeffectsofthelateglacialmoistureincreasewerelargeenoughtoaffectthe
megafaunalcommunitybeyondjustgrazers.Comparedtothellamas,thecarnivores
showδ15Nvalues3–4‰higher,consistentwiththeδ15Nvalueincreasethattypically
occursbetweenpredatorsandtheirprey.
SMFigure11:SouthAmericanunnormalisedδ15Ndataincludingcarnivores,showingarapidincreaseinvaluesfrom
~16kaconsistentwiththeLGNErecoveryphase,suggestingamajormoisturespikearoundtherapiddeglaciationof
~17–16ka.TheX-axishasbeenlimitedtobetween~15and17.5ka,toemphasisethestrongupwardδ15Ntrendat
thistime.DatafromSouthAmericanfelidcarnivores(n=13;Pumaconcolor,Smilodonpopulator,andPantheraonca)
demonstratethattheδ15Nsignalsweretransmittedtotheuppertrophiclevelsofthefoodchain.
δ15 N
(‰)
Age(yearsbeforepresent)
© 2017 Macmillan Publishers Limited, part of Springer Nature. All rights reserved.
NATURE ECOLOGY & EVOLUTION | DOI: 10.1038/s41559-017-0125 | www.nature.com/natecolevol 21
SUPPLEMENTARY INFORMATION

22
SMFigure12:δ13Cvaluesfororiginaldatausedinthisstudyshowingtheoveralllackofsignificantchangesduring
theLGNEperiod.Thecausesandimplicationsofδ13Cchangesovertime(inparticularthosethatoccurafterthe
LGNE,suchasinNorthAmerica),isdiscussedinSMText2.
δ13 C(‰
)
Age(yearsbefore present)
n=231
n=154
n=152
n=89
n=45
© 2017 Macmillan Publishers Limited, part of Springer Nature. All rights reserved.
NATURE ECOLOGY & EVOLUTION | DOI: 10.1038/s41559-017-0125 | www.nature.com/natecolevol 22
SUPPLEMENTARY INFORMATION

23
ThetestspresentedinSMFigures13–16aimtoinvestigatethestatisticalsignificanceof
changesinZ-normalisedδ15Nvalues.Dataweregroupedintopointsfallingwithina
particularwindow,andthosefallingoutside.Foreachwindow,aStudent’st-test(two-
tailed)wasusedtogenerateap-valueonthenullhypothesisthattheδ15Nvalueswithin
thewindowweredrawnfromthesamedistributionastheδ15Nvaluesoutsidethe
window.Eachfieldintheplotrepresentsawindow,withthecolourcorrespondingto
thep-value.Forinstance,thedarkestfieldintheEuropeanexamplebelow(SMFigure
13)representsawindowbeginningat11ka,andlastingfor3ky.Thisindicatesthatthe
period11–14kyacontainedδ15Nvaluesthatweremostsignificantlydifferentfrom
thosebeforeandafterthiswindow(p≤1E-50inthiscase).
Diagonalstripingisaconsequenceofδ15Nexcursions:longwindowscontainingthe
excursionmaystillhaveelevatedsignificancedespiteincludingsomedatapointsfrom
theregular(non-excursion)rangeofvalues.Thisisespeciallyprevalentwherethe
excursionabutsaperiodofsparseorabsentdata,forinstance,after10kaintheNorth
Slope(seeSMFigure9).Fieldsarecolouredgreywhenfewerthan5datapointsexist
withinthewindow.ThistestisnotinformativeontheSouthAmericadataset,which
showsastrong,singletrendinaveryshortperiod.
SMFigure13.Student’st-testsforsignificantvariationinz-normalisedδ15NvaluesinEurope,showinghighly
significantδ15Nexcursionsaround11–14ka.
window starts (ka)
Europe
© 2017 Macmillan Publishers Limited, part of Springer Nature. All rights reserved.
NATURE ECOLOGY & EVOLUTION | DOI: 10.1038/s41559-017-0125 | www.nature.com/natecolevol 23
SUPPLEMENTARY INFORMATION

24
SMFigure14.Student’st-testsforsignificantδ15NvariationinNorthAmericashowinghighlysignificantδ15N
excursionsaround10–17ka.
SMFigure15.Student’st-testsforsignificantδ15NvariationontheAlaskanNorthSlope,showingahighlysignificant
δ15Nexcursionataround10ka.Notethediagonalstripingcausedbythelackofdataafter10ka.
100020003000400050006000700080009000
1000011000120001300014000150001600017000180001900020000
0 5000 10000 15000 20000 25000 30000 35000 40000 45000window begins (earliest) (kya)
win
dow
size
(ky) log(p−value)
−7.5
−5.0
−2.5
NorthSlope d15N z−scores (two−sample t−test, values in window vs other) log p−values
window starts (ka)
window starts (ka)
NorthSlope
NorthAmerica
© 2017 Macmillan Publishers Limited, part of Springer Nature. All rights reserved.
NATURE ECOLOGY & EVOLUTION | DOI: 10.1038/s41559-017-0125 | www.nature.com/natecolevol 24
SUPPLEMENTARY INFORMATION

25
SMFigure16.Student’st-testsforsignificantδ15NvariationinSiberia,showingasignificantδ15Nexcursionaround
13–20ka.
Atlargegeographicscales,variationinmodernδ15Nvalueshasbeeninvestigatedwith
respecttomanyinter-correlatedvariables,suchasmoisture,temperature,altitude,and
latitude(SeeSMText1).Tojustifytheassumptionthattherelationshipbetweenδ15N
valuesandmoistureholdsbetweenrangelandenvironmentsindifferentcontinentswe
compareamodernδ15NvaluedatasetfromAustraliawithanotherfromAlaska,
demonstratingtheconsistencybetweentheresults.
SMFigures17.Investigationoftheglobalapplicabilityofthemoisture-δ15Nrelationship,usingmoderngrassdata(n
=35)collectedinAlaska[62],whichisoneofourstudyareas,andAustralia[5].ErrorbarsassociatedwiththeAlaska
window starts (ka)
Siberia
© 2017 Macmillan Publishers Limited, part of Springer Nature. All rights reserved.
NATURE ECOLOGY & EVOLUTION | DOI: 10.1038/s41559-017-0125 | www.nature.com/natecolevol 25
SUPPLEMENTARY INFORMATION
26
δ15Nvalues=1standarddeviation.Thesetwogeographicallydisparateregionsshowcompatibleresults,withrespect
toboththedirectionoftherelationshipandtherawδ15Nvaluesatcertainmoisturelevels(approximatedhereusing
meanannualprecipitation).
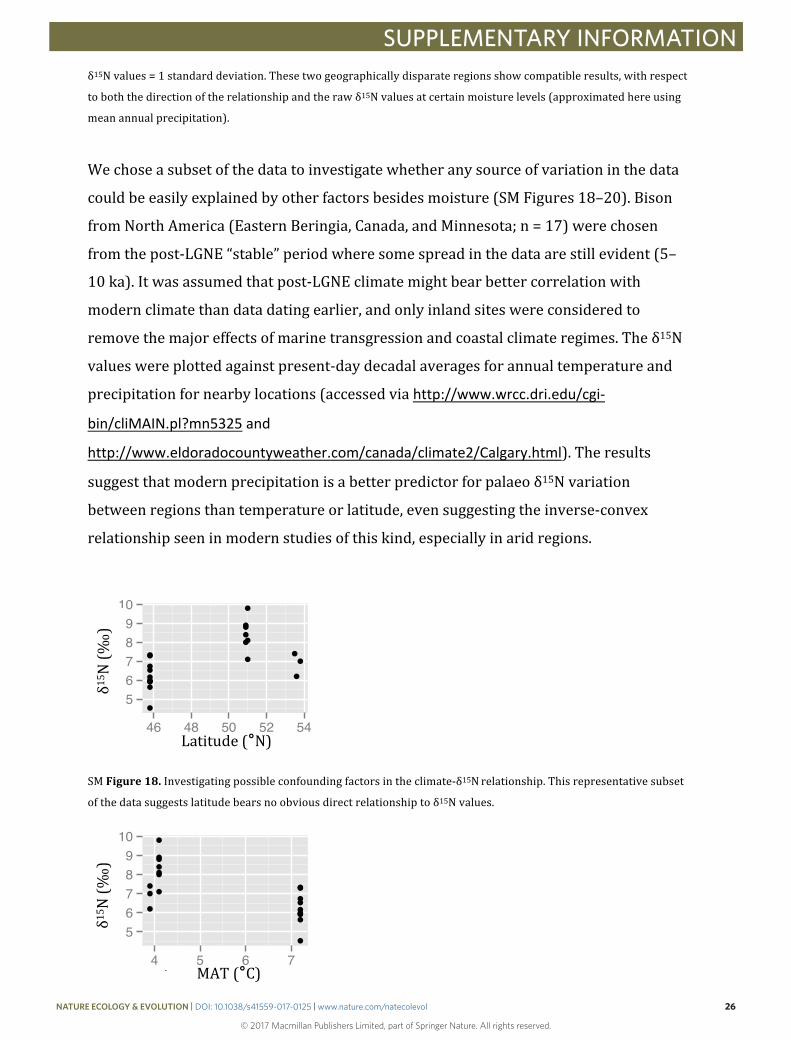
Wechoseasubsetofthedatatoinvestigatewhetheranysourceofvariationinthedata
couldbeeasilyexplainedbyotherfactorsbesidesmoisture(SMFigures18–20).Bison
fromNorthAmerica(EasternBeringia,Canada,andMinnesota;n=17)werechosen
fromthepost-LGNE“stable”periodwheresomespreadinthedataarestillevident(5–
10ka).Itwasassumedthatpost-LGNEclimatemightbearbettercorrelationwith
modernclimatethandatadatingearlier,andonlyinlandsiteswereconsideredto
removethemajoreffectsofmarinetransgressionandcoastalclimateregimes.Theδ15N
valueswereplottedagainstpresent-daydecadalaveragesforannualtemperatureand
precipitationfornearbylocations(accessedviahttp://www.wrcc.dri.edu/cgi-
bin/cliMAIN.pl?mn5325and
http://www.eldoradocountyweather.com/canada/climate2/Calgary.html).Theresults
suggestthatmodernprecipitationisabetterpredictorforpalaeoδ15Nvariation
betweenregionsthantemperatureorlatitude,evensuggestingtheinverse-convex
relationshipseeninmodernstudiesofthiskind,especiallyinaridregions.
SMFigure18.Investigatingpossibleconfoundingfactorsintheclimate-δ15Nrelationship.Thisrepresentativesubset
ofthedatasuggestslatitudebearsnoobviousdirectrelationshiptoδ15Nvalues.
5678910
46 48 50 52 54lat
d15N
5678910
4 5 6 7temp_mu_c_year
d15N
δ15 N
(‰)
δ1
5 N(‰
)
Latitude(°N)
MAT(°C)
© 2017 Macmillan Publishers Limited, part of Springer Nature. All rights reserved.
NATURE ECOLOGY & EVOLUTION | DOI: 10.1038/s41559-017-0125 | www.nature.com/natecolevol 26
SUPPLEMENTARY INFORMATION

27
SMFigure19.Investigatingpossibleconfoundingfactorsintheclimate-δ15Nrelationship.Thisrepresentativesubset
ofthedatasuggestsMeanAnnualTemperature(MAT)bearsnoobviousdirectrelationshiptoδ15Nvalues.
SM20.Investigatingclimate-δ15Nrelationships:MeanAnnualPrecipitation(MAP)appearstoobeytheinverse-convexrelationshiptoδ15Nseeninempiricalstudies.
Supplementary:References
SMReferences1:Datedδ15NmeasurementsPublicationssupplyingdataforthisstudyarelistedbyregionandtaxoninSMMethods.
ThedataareavailableinSupplementaryData.Thefollowinginstitutionsandcollectors
kindlysuppliedsamplesforthispublication,whichwegratefullyacknowledge:
USA:AmericanMuseumofNaturalHistory,NewYork,USA;UniversityofAlaska,
Fairbanks,USA;UniversityofKansasMuseumofNaturalHistory,Lawrence,KS,USA;
UniversityofAlaskaMuseumoftheNorth,USA;AlaskaDepartmentofFishandGame,
Fairbanks,USA;BellMuseumofNaturalHistory,UniversityofMinnesota,USA
Canada:CanadianMuseumofNature,Ottawa,Canada;CanadianMuseumof
Civilisation,Gatineau,Canada;ProvincialMuseumofAlberta/RoyalAlbertaMuseum,
Edmonton,Canada;SimonFraserUniversity,Vancouver,Canada;UniversityofVictoria,
Victoria,Canada;YukonHeritageCentre,Whitehorse,YT,Canada;YukonPalaeontology
Program,Whitehorse,YT,Canada;M.C.Wilson,privatecollection,Canada
Russia:InstituteofPlantandAnimalEcology,Ekaterinburg,Russia;Paleontological
Institute,Moscow,Russia;ZoologicalInstitute,St.Petersburg,Russia;Northern
ResearchStation,Cherskii,Russia;LaboratoryofPrehistory,StPetersburg,Russia;
LocalMuseum,Chersky,Russia
Europe:MalmoMuseumofNaturalHistory,Sweden;ZoologicalMuseumAmsterdam,
Netherlands:NaturalHistoryMuseum,London,UK
5678910
400 500 600precip_mu_mm_year
d15N
δ15 N
(‰)
MAP(mm)
© 2017 Macmillan Publishers Limited, part of Springer Nature. All rights reserved.
NATURE ECOLOGY & EVOLUTION | DOI: 10.1038/s41559-017-0125 | www.nature.com/natecolevol 27
SUPPLEMENTARY INFORMATION

28
SouthAmerica:InstitutodelaPatagonia,UniversidaddeMagallanes,Magallanes,Chile;
LaPlataMuseum,UniversidadNacionaldeCuyo,Mendozo,Argentina;Museode
HistoriaNaturaldeSanRafael,Mendozo,Argentina;MuseodeHistoriaNatural,
UniversidadNacionalMayordeSanMarcos,Peru
SMReferences2:GlaciationchronologiesEurasianIceSheet:VandenBergetal.(2008)[63],Figure10;NorthernUrals:
Svendesenetal.(2014)[64],Figure14;NorthAmericanIceComplex:Tarasovetal.
(2003)[65],Figure18;PatagonianIceSheet:Boexetal.(2013)[66],Figure3.
SMReferences3:PeatlandInitiationDatesNorthernHemisphere(n=1870):[7-9];SouthAmerica(n=54):[9].
SMReferences4:Climaticfactors/proxiesNGRIP:[67];EPICADomeC:[68];Insolation:[69](http://CRAN.R-
project.org/package=palinsol).
SMReferences5:Selectedstudiesdemonstratingtheclimate-δ15Nlinkinmodernaridand
semi-aridenvironments
StudyTitle Reference Type Region Dataset
Convergenceofsoil
nitrogenisotopesacross
globalclimategradients
Craine2015[70] Global MultipleMixed,aridlesswell-
represented
Globalpatternsofthe
isotopiccompositionof
soilandplantnitrogen
Amundson2003[11] Global MultipleMixed,aridlesswell-
represented
Thecarbonandnitrogen
isotopecompositionof
Australiangrassesin
relationtoclimate
Murphy2009[5] Arid Australia Grass
Kangaroometabolism
doesnotcausethe
relationshipbetween
bonecollagenδ15Nand
wateravailability
Murphy2006[71] Arid Australia Grass,Kangaroo
Nitrogencyclinginthe
soil–plantsystemalonga
precipitationgradientin
Aranibar2004[6] Arid Africa Grass,Soil
© 2017 Macmillan Publishers Limited, part of Springer Nature. All rights reserved.
NATURE ECOLOGY & EVOLUTION | DOI: 10.1038/s41559-017-0125 | www.nature.com/natecolevol 28
SUPPLEMENTARY INFORMATION

29
theKalaharisands
Effectsofclimateondeer
boneδ15Nandδ13C:
Lackofprecipitation
effectsonδ15Nfor
animalsconsuminglow
amountsofC3plants
Cormie1996[72]Semi-arid–
MesicNorthAmerica Deer
15NEnrichmentinthe
Sahara:InSearchofa
GlobalRelationship
Schwarcz1999[73]Arid–Semi-arid,
compilationAfrica Human,Animal,Plants
Altitudinalgradientsof
grasslandcarbon
andnitrogenisotope
compositionare
recordedinthehairof
grazers
Mannel2007[74]Semi-arid–
MesicEurope
Sheep,Cattle,Goats,
Alpaca,Horse
Quaternaryrecordof
aridityandmeanannual
precipitation
basedonδ15Ninratite
anddromornithid
eggshellsfromLakeEyre,
Australia
Newsome2011[75] Arid–Semi-arid Australia MoaEggshell,Grass
StableNitrogenIsotope
ValuesinArid-Land
KangaroosCorrelated
withMeanAnnual
Rainfall:Potentialasa
PalaeoclimaticIndicator
Pate2008[76] Arid–Semi-arid Australia Kangaroo
Annualrainfalland
nitrogen-isotope
correlationinmacropod
collagen:applicationasa
paleoprecipitation
indicator
Grocke1997[77] Arid,Coastal Australia Possum,Kangaroo
The15Nnatural
abundance(δ15N)of
ecosystemsamples
reflectsmeasuresof
wateravailability
Handley1999[14] Global Multiple
Soil,Plant.Arid
reasonablywell-
represented.
Climaticinfluenceonthe Heaton1986[78] Arid Africa Human,Elephant,
© 2017 Macmillan Publishers Limited, part of Springer Nature. All rights reserved.
NATURE ECOLOGY & EVOLUTION | DOI: 10.1038/s41559-017-0125 | www.nature.com/natecolevol 29
SUPPLEMENTARY INFORMATION

30
isotopiccompositionof
bonenitrogen
Wildebeest,Giraffe,
Zebra
Nitrogenisotopicecology
insouthernAfricaSealy1987[79] Arid Africa
ManyAfricanAnimals
(groupedbycollection
site)
Plantstableisotope
compositionacross
habitat
gradientsinasemi-arid
savanna:implicationsfor
environmental
reconstruction
Codron2007[80] Arid–Semi-arid Africa Grass,Trees
Conservationofnitrogen
increaseswith
precipitationacrossa
majorgrasslandgradient
intheCentralGreatPlains
ofNorthAmerica
McCulley2008[81]Semi-arid–
MesicNorthAmerica Grass
Naturalabundanceof13C
and15NinC3andC4
vegetationofsouthern
Africa:patternsand
implications
Swap2003[82] Arid–Semi-arid Africa Plants
Patternsandimplications
ofplant-soilδ13Candδ15NvaluesinAfrican
savannaecosystems.
Wang2010[83] Arid–Semi-arid Africa Plants
© 2017 Macmillan Publishers Limited, part of Springer Nature. All rights reserved.
NATURE ECOLOGY & EVOLUTION | DOI: 10.1038/s41559-017-0125 | www.nature.com/natecolevol 30
SUPPLEMENTARY INFORMATION

31
Supplementary:Code(inRv3.2.2)
Subroutines#z-transformavectorztransform<-function(data){mu<-mean(data)sd<-sd(data)(data-mu)/sd}#residualsfromthemean.notusedinfinalpaperbutpossiblyuseful.residuals<-function(data){mu<-mean(data)data-mu}#weightingvaluesbasedontheGaussian.Scaledtobetween0and1.gaussian_weights<-function(calc_point,data_points,stdev){dnorm(data_points,mean=calc_point,sd=stdev)/dnorm(0,0,sd=stdev)}#z-transformsbylevelsofafactor.Forbigdatasets,rewritingthisusingapply-familyfunctionswillbeessential.factorwise_ztransform<-function(x,values_colname,factor_colname){for(levinlevels(x[[factor_colname]])){x[values_colname][x[factor_colname]==lev&!is.na(x[factor_colname])&!is.na(x[values_colname])]<-ztransform(x[values_colname][x[factor_colname]==lev&!is.na(x[factor_colname])&!is.na(x[values_colname])])}out<-x[values_colname]colnames(out)<-paste(sep="",values_colname,"_Z_trans_",factor_colname,"wise")out}#notusedinfinalpaperbutpossiblyusefulfactorwise_residuals<-function(x,values_colname,factor_colname){for(levinlevels(x[[factor_colname]])){#print(lev)#print(x[values_colname][x[factor_colname]==lev&!is.na(x[factor_colname])&!is.na(x[values_colname])])x[values_colname][x[factor_colname]==lev&!is.na(x[factor_colname])&!is.na(x[values_colname])]<-residuals(x[values_colname][x[factor_colname]==lev&!is.na(x[factor_colname])&!is.na(x[values_colname])])}out<-x[values_colname]colnames(out)<-paste(sep="",values_colname,"_residuals_",factor_colname,"wise")out}#giveitavectorofdatapointsbootstrap<-function(x){x[floor(runif(nrow(x))*nrow(x)+1),]}RMAC_unscaled<-function(x,df,dd_sd,sd_a,sd_b,top,bottom,...){df<-df[!is.na(df[,1])&!is.na(df[,2]),]#cleanNAsfromdfif(!missing(...)){df<-df[multimatch(df[,3],list(...)),]}if(sum(x<=0)>0){df[,1]<--df[,1]}#reversingthex-axisjustfeedsstat_functionthex-valuesasnegative...sowedealwithitlikethisdf[,2]-min(df[,2])+1000000->df[,2]#thisisarelativescaleandit'sjusteasiertoworkwithpositivevalueshereratherthanmessingwiththefunction.theresultisexactlythesame.outvector<-numeric()#defineoutputstoragefor(tinx)#tisthetimeatwhichwewanttoknowtheRMAC_unscaled{num<-0#numeratorden<-0#denominatorl_in<-0#numberwithin2sdofmeanonleftr_in<-0#onright#forthisx(akap),scanthroughtime/d15Npairs,applycontributiontonumerator(Ndensity(p-time,0,sd)*d15N)anddenominator(Ndensity(p-time,0,sd))#print("t");print(t)
© 2017 Macmillan Publishers Limited, part of Springer Nature. All rights reserved.
NATURE ECOLOGY & EVOLUTION | DOI: 10.1038/s41559-017-0125 | www.nature.com/natecolevol 31
SUPPLEMENTARY INFORMATION

32
densityscore<-0for(rowin1:nrow(df))#foreachdatapoint(time,measurement)pair{dist<-t-df[row,1]#distanceofdatapointfromtif((dist>=0)&(dist<=2*dd_sd)){l_in<-l_in+1}#l_in:pointstothe(l)eftoftthatare(in)thethresholdelseif((dist<=0)&(dist>=-2*dd_sd)){r_in<-r_in+1}densityscore<-densityscore+dnorm(dist,0,dd_sd)#ascoretocharacterisehowdensethedatapointsarearoundthist.}#print(paste("lin/rin",l_in,"/",r_in))#print(paste("densityscore:",densityscore))sd_wt<-sd_a*exp(-sd_b*densityscore)#defineanappropriatesdfortheweightingdistribution#print(c("sdthiscalcpoint:",sd_wt))#reallyusefulforchoosingmeaningfulparamsfor(rowin1:nrow(df))#foreachdatapoint(time,measurement)pair{dist=t-df[row,1]#distofpointfromtweight<-dnorm(dist,0,sd_wt)#usingthedefinedweightingdistnum<-num+(weight*df[row,2])den<-den+weight;}mu<-numeric()if((!(l_in>0)||!(r_in>0))||(l_in+r_in<6)){mu<-NA}#limitsbasedonlinandrinelse{mu<-1/(num/den)}#mu<-1/(num/den)#nolimitsoutvector<-c(outvector,mu)}#print(outvector)#(((outvector-min(outvector,na.rm=T))/(max(outvector,na.rm=T)-min(outvector,na.rm=T)))*(top-bottom))+bottom->outvector#toscalebetweentopandbottomreturn(outvector)}#returnsthemeanor95%CIsateachtime.“What”canbe“mu”,“upper”or“lower”.RMAC_unscaled_bstrap_intervals<-function(x,df,dd_sd,sd_a,sd_b,top,bottom,what,...){n_bootstraps<-1500 x->timesdo.call(rbind,lapply(1:n_bootstraps,function(x)RMAC_unscaled(times,bootstrap(df),dd_sd,sd_a,sd_b,top,bottom,...)))->bstraps#rescalehere(bstraps-min(bstraps,na.rm=T))/(max(bstraps,na.rm=T)-min(bstraps,na.rm=T))*(top-bottom)+bottom->bstrapsreturn(do.call(rbind,apply(bstraps,2,function(x){strap<-x[!is.na(x)]n_out_each_end<-round(((.05*length(strap))/2),digits=0)if(n_out_each_end>0){return(data.frame('mu'=median(strap),'upper'=strap[order(strap)][(length(strap)-n_out_each_end)],'lower'=strap[order(strap)][n_out_each_end+1]))}else{return(data.frame('mu'=NA,'upper'=NA,'lower'=NA))}}))[,what]#delete[,what]togetthewholedataframe,i.e.whatisplottedinthemsfig1.)}
DataHandlingandCalibrationThecolumn“notes”herewasusedasaconvenientinformalrepositoryofrelevantmetadataconcatenatedintoas-long-as-necessarycharacterstringsandusedtogrouporextractinformationforsamples.Itisnotincludedinthesupplementarydatabutisavailableuponrequest.x<-read.csv(file="data.csv")#columnsnamed"study","genus","region","date","cal_error","d13C","d15N,"dating_record","notes","locality","extra","diet","d15N_Z_trans_genuswise","cal_date"as.character(x$notes)->x$notesx$extra[x$extra==""]<-NAas.character(x$dating_record)->x$dating_recordas.character(x$locality)->x$localityas.numeric(sub("?","-",x$d15N,fixed=T))->x$d15Nas.numeric(sub("?","-",x$d13C,fixed=T))->x$d13Cas.numeric(sub(",","",x$date,fixed=T))->x$date
© 2017 Macmillan Publishers Limited, part of Springer Nature. All rights reserved.
NATURE ECOLOGY & EVOLUTION | DOI: 10.1038/s41559-017-0125 | www.nature.com/natecolevol 32
SUPPLEMENTARY INFORMATION

33
as.numeric(as.character(x$d15N))->x$d15N#addedstuffforexplorationlevels(x$extra)<-c(levels(x$extra),"EB","NonEBCan","USA")x$extra[x$region=="NorthAmerica"&grepl("hicken|ukon|YT|laska|AK|IrishGulch|Quartz",x$notes)]<-"EB"x$extra[x$region=="NorthAmerica"&grepl("lberta|AB|olumbia|dmonton|BC|Charli|Buffalo",x$notes)]<-"NonEBCan"x$extra[x$region=="NorthAmerica"&grepl("hicken|ukon|YT|laska|AK|innesota|Trap|48States",x$notes)]<-"USA"x$extra[x$region=="NorthAmerica"&grepl("azula|obbs|zpak",x$study)]<-"EB"#separatellamasbyspecieslevels(x$extra)<-c(levels(x$extra),"guanaco","gracilis","unidentified")x$extra[x$genus=="Lama"&grepl("ExcinctG",x$extra)]<-"guanaco"x$extra[x$genus=="Lama"&grepl("Gracilis",x$extra)]<-"gracilis"x$extra[x$genus=="Lama"&grepl("Holocene",x$extra)]<-"gracilis"x$extra[x$genus=="Lama"&grepl("UnID",x$extra)]<-"unidentified"x$extra[x$genus=="Lama"&is.na(x$extra)]<-"gracilis"droplevels(x[!grepl("USA",x$extra)&!grepl("unidentified",x$extra),])->x#addsiberiaseparationlevels(x$extra)<-c(levels(x$extra),"Urals","Other")x$extra[grepl("rals",x$notes)&x$region=="Siberia"]<-"Urals"x$extra[!grepl("rals",x$notes)&x$region=="Siberia"]<-"Other"#doz-transformationsdroplevels(x)->xrm(b,t)for(iinlevels(x$region)){x[x$region==i,]->tcbind(t,factorwise_ztransform(t,"d15N","genus"))->tif(!exists("b")){t->b}else{rbind(b,t)->b}}b->xrm(b,t)x<-x[x$date<45000&x$date>1000&x$d15N_Z_trans_genuswise>-3&x$d15N_Z_trans_genuswise<3&1,]x<-x[!is.na(x$date)&!is.na(x$d15N)&1,]x<-x[x$genus!="Mammuthus",]#calibratex$cal_date=x$datelibrary(Bchron)length(x$date[!is.na(x$date)&!is.na(x$cal_error)])->lcalcurves<-ifelse(x$region[!is.na(x$date)&!is.na(x$cal_error)]=="SouthAmerica","shcal13","intcal13")BchronCalibrate(ages=x$date[!is.na(x$date)&!is.na(x$cal_error)],ageSds=x$cal_err[!is.na(x$date)&!is.na(x$cal_error)],calCurves=calcurves)->calsx$cal_date[!is.na(x$date)&!is.na(x$cal_error)]<-as.numeric((lapply(cals,function(i){range(i$ageGrid)[1]+(sum(i$densities)/2)*(range(i$ageGrid)[2]-range(i$ageGrid)[1])})))droplevels(x)->x#tidyupandhavealookstr(x)table(x$genus,x$region)table(x$study,x$region)
© 2017 Macmillan Publishers Limited, part of Springer Nature. All rights reserved.
NATURE ECOLOGY & EVOLUTION | DOI: 10.1038/s41559-017-0125 | www.nature.com/natecolevol 33
SUPPLEMENTARY INFORMATION

34
Insolation/PeatlandInitiation#insolationlibrary(palinsol)insolation<-function(times,astrosol=la04,ltd,...)sapply(times,function(tt)Insol(orbit=astrosol(tt),long=ltd,lat=65*pi/180))tts<-seq(from=-45000,to=0,by=100)isl_S<-insolation(tts,ber78,ltd=pi/2)isl_W<-insolation(tts,ber78,ltd=pi/2)plot(tts,isl,typ='l')ggplot(data=data.frame(insol_S=isl_S,insol_W=isl_W,time=-tts))+geom_line(mapping=aes(x=time,y=insol_S))+geom_line(mapping=aes(x=time,y=insol_W))#peatlands#readinread.csv(file="data.csv")[,1:7]->x#columnsinclude“lat”,“long”,“date”,”region”#alittlecleaningsub(",","",x$date)->x$date#assignregionsbylatitudec(levels(x$region),"Siberia","Europe","NA","NorthSlope")->levels(x$region)cut(x$long[x$ref=="MacDonnell_06"],breaks=c(-180,-169.02,-54.99,-13.9,58.68,180),labels=c("Siberia","NorthAmerica","NA","Europe","Siberia"))->x$region[x$ref=="MacDonnell_06"]x$region[x$lat>68.26&x$long>-166.49&x$long<-140.96]<-"NorthSlope"x<-droplevels(x)x$date<-as.numeric(as.character(x$date))
t-tests(SMFigure13–16)#dop-valuesovertimefunction(x=timepoint,df=dataframe,willgiveyoup-valueusingt-testforalld15Nvalspre-pointvs.afterpoint)pval_split<-function(from,to,df)#requirescolumnsofdataframe“df”labeled“date”and“d15N_Z_trans_genuswise”.{#print(paste("to:",to,",from:",from))if(from>45000){return(NA)}#windowextendsbeyondendif(to>=from){return(NA)}#windowbeyond<-df$d15N_Z_trans_genuswise[(df$date>from|df$date<to)&!is.na(df$d15N_Z_trans_genuswise)]#before+afterwithin<-df$d15N_Z_trans_genuswise[df$date<from&df$date>to&!is.na(df$d15N_Z_trans_genuswise)]#betweenif(length(beyond)<5||length(within)<5){return(NA)}t.test(x=beyond,y=within)[["p.value"]]}#makematrix#eachcellwillbethep-valuewhenexcludingtheregion[from,to]inc<-1000loc<-"NorthSlope"#makem.adataframewhererowsarethestartpointsofeachwindow,andcolsarethewinsizem<-sapply(seq(1000,20000,by=1000),function(winsize)sapply(seq(0,45000,by=inc),function(a)pval=pval_split(a+winsize,a,x[x$region==loc,])))m<-as.data.frame(m)dimnames(m)<-list(seq(0,45000,by=inc),seq(1000,20000,by=1000))df<-data.frame()for(iincolnames(m)){for(jinrownames(m)){df<-rbind(df,data.frame(t=j,w=i,p=m[j,i]))}}#atypicalplotlibrary(ggplot2)ggplot(data=df,aes(x=t,y=w,fill=log(p)))+geom_tile()+scale_fill_gradient(low="steelblue",high="white",guide=guide_legend(title="log(p-value)"))+scale_x_discrete(breaks=c(seq(0,45000,5000)))+xlab("windowbegins(earliest)(kya)")+ylab("windowsize(ky)")+ggtitle(paste(loc,"d15Nz-scores(two-samplet-test,valuesinwindowvsother)logp-values"))
© 2017 Macmillan Publishers Limited, part of Springer Nature. All rights reserved.
NATURE ECOLOGY & EVOLUTION | DOI: 10.1038/s41559-017-0125 | www.nature.com/natecolevol 34
SUPPLEMENTARY INFORMATION

35
Supplementary:Bibliography
1. Schwartz-Narbonne,R.,etal.,Solvingthewoollymammothconundrum:aminoacid15N-enrichmentsuggestsadistinctforageorhabitat.Scientificreports,2015.5.
2. Vallentine,J.,GrazingManagementAcademicPress.Inc.,SanDiego,Calif,1990.3. Guthrie,R.D.,Mammalsofthemammothsteppeaspaleoenvironmentalindicators.
PaleoecologyofBeringia,1982:p.307-326.4. Guthrie,R.D.,Frozenfaunaofthemammothsteppe.TheStoryofBlueBabe
ChicagoUniversity,1990.5. Murphy,B.P.andD.M.Bowman,Thecarbonandnitrogenisotopecompositionof
Australiangrassesinrelationtoclimate.FunctionalEcology,2009.23(6):p.1040-1049.
6. Aranibar,J.N.,etal.,Nitrogencyclinginthesoil–plantsystemalongaprecipitationgradientintheKalaharisands.GlobalChangeBiology,2004.10(3):p.359-373.
7. Jones,M.C.andZ.Yu,RapiddeglacialandearlyHoloceneexpansionofpeatlandsinAlaska.ProceedingsoftheNationalAcademyofSciences,2010.107(16):p.7347-7352.
8. MacDonald,G.M.,etal.,RapidearlydevelopmentofcircumarcticpeatlandsandatmosphericCH4andCO2variations.Science,2006.314(5797):p.285-288.
9. Yu,Z.,etal.,GlobalpeatlanddynamicssincetheLastGlacialMaximum.GeophysicalResearchLetters,2010.37(13).
10. Handley,L.andC.Scrimgeour,Terrestrialplantecologyand15Nnaturalabundance:thepresentlimitstointerpretationforuncultivatedsystemswithoriginaldatafromaScottisholdfield.AdvancesinEcologicalResearch,1997.27:p.133-212.
11. Amundson,R.,etal.,Globalpatternsoftheisotopiccompositionofsoilandplantnitrogen.GlobalBiogeochemicalCycles,2003.17(1).
12. Billings,S.andD.Richter,Changesinstableisotopicsignaturesofsoilnitrogenandcarbonduring40yearsofforestdevelopment.Oecologia,2006.148(2):p.325-333.
13. Craine,J.M.,etal.,Globalpatternsoffoliarnitrogenisotopesandtheirrelationshipswithclimate,mycorrhizalfungi,foliarnutrientconcentrations,andnitrogenavailability.NewPhytologist,2009.183(4):p.980-992.
14. Handley,L.,etal.,The15Nnaturalabundance(δ15N)ofecosystemsamplesreflectsmeasuresofwateravailability.FunctionalPlantBiology,1999.26(2):p.185-199.
15. Ludwig,P.,etal.,RegionalatmosphericcirculationoverEuropeduringtheLastGlacialMaximumanditslinkstoprecipitation.JournalofGeophysicalResearch:Atmospheres,2016.121(5):p.2130-2145.
16. Alexandrov,G.,V.Brovkin,andT.Kleinen,TheinfluenceofclimateonpeatlandextentinWesternSiberiasincetheLastGlacialMaximum.Scientificreports,2016.6.
17. Luetscher,M.,etal.,NorthAtlanticstormtrackchangesduringtheLastGlacialMaximumrecordedbyAlpinespeleothems.Naturecommunications,2015.6.
18. Oster,J.L.,etal.,SteeringofwesterlystormsoverwesternNorthAmericaattheLastGlacialMaximum.NatureGeoscience,2015.8(3):p.201-205.
© 2017 Macmillan Publishers Limited, part of Springer Nature. All rights reserved.
NATURE ECOLOGY & EVOLUTION | DOI: 10.1038/s41559-017-0125 | www.nature.com/natecolevol 35
SUPPLEMENTARY INFORMATION

36
19. Bartlein,P.J.,etal.,PaleoclimatesimulationsforNorthAmericaoverthepast21,000years:featuresofthesimulatedclimateandcomparisonswithpaleoenvironmentaldata.QuaternaryScienceReviews,1998.17(6):p.549-585.
20. Moreno,P.I.,etal.,RadiocarbonchronologyofthelastglacialmaximumanditsterminationinnorthwesternPatagonia.QuaternaryScienceReviews,2015.122:p.233-249.
21. Mol,J.,J.Vandenberghe,andC.Kasse,Riverresponsetovariationsofperiglacialclimateinmid-latitudeEurope.Geomorphology,2000.33(3):p.131-148.
22. Tebbens,L.,etal.,FluvialincisionandchanneldowncuttingasaresponsetoLate-glacialandEarlyHoloceneclimatechange:thelowerreachoftheRiverMeuse(Maas),theNetherlands.JournalofQuaternaryscience,1999.14(1):p.59-75.
23. Mann,D.H.,etal.,ResponsesofanarcticlandscapetoLateglacialandearlyHoloceneclimaticchanges:theimportanceofmoisture.QuaternaryScienceReviews,2002.21(8):p.997-1021.
24. Ashley,G.M.andT.D.Hamilton,FluvialresponsetolateQuaternaryclimaticfluctuations,centralKobukValley,northwesternAlaska.JournalofSedimentaryResearch,1993.63(5).
25. Glushkova,O.Y.,GeomorphologicalcorrelationofLatePleistoceneglacialcomplexesofWesternandEasternBeringia.QuaternaryScienceReviews,2001.20(1):p.405-417.
26. Alekseev,M.andV.Drouchits,QuaternaryfluvialsedimentsintheRussianArcticandSubarctic:LateCenozoicdevelopmentoftheLenaRiversystem,northeasternSiberia.ProceedingsoftheGeologists'Association,2004.115(4):p.339-346.
27. Quattrocchio,M.E.,etal.,LandscapeevolutionandclimatechangesintheLatePleistocene–Holocene,southernPampa(Argentina):evidencefrompalynology,mammalsandsedimentology.QuaternaryInternational,2008.181(1):p.123-138.
28. Trombotto,D.,Surveyofcryogenicprocesses,periglacialformsandpermafrostconditionsinSouthAmerica.RevistadoInstitutoGeológico,2000.21(1-2):p.33-55.
29. Andreev,A.A.,etal.,LatePleistoceneandHolocenevegetationandclimateonthenorthernTaymyrPeninsula,ArcticRussia.Boreas,2003.32(3):p.484-505.
30. Anderson,P.M.andL.B.Brubaker,VegetationhistoryofnorthcentralAlaska:amappedsummaryoflate-Quaternarypollendata.QuaternaryScienceReviews,1994.13(1):p.71-92.
31. Vermaire,J.C.andL.C.Cwynar,Arevisedlate-QuaternaryvegetationhistoryoftheunglaciatedsouthwesternYukonTerritory,Canada,fromAntifreezeandEiklandponds.CanadianJournalofEarthSciences,2010.47(1):p.75-88.
32. MacDonald,G.,etal.,PatternofextinctionofthewoollymammothinBeringia.Naturecommunications,2012.3:p.893.
33. Bump,J.K.,etal.,Stableisotopes,ecologicalintegrationandenvironmentalchange:wolvesrecordatmosphericcarbonisotopetrendbetterthantreerings.ProceedingsoftheRoyalSocietyofLondonB:BiologicalSciences,2007.274(1624):p.2471-2480.
34. Still,C.J.,etal.,GlobaldistributionofC3andC4vegetation:carboncycleimplications.GlobalBiogeochemicalCycles,2003.17(1).
35. Richards,M.andR.Hedges,Variationsinbonecollagenδ13Candδ15NvaluesoffaunafromNorthwestEuropeoverthelast40,000years.Palaeogeography,Palaeoclimatology,Palaeoecology,2003.193(2):p.261-267.
© 2017 Macmillan Publishers Limited, part of Springer Nature. All rights reserved.
NATURE ECOLOGY & EVOLUTION | DOI: 10.1038/s41559-017-0125 | www.nature.com/natecolevol 36
SUPPLEMENTARY INFORMATION

37
36. Stevens,R.E.andR.E.Hedges,CarbonandnitrogenstableisotopeanalysisofnorthwestEuropeanhorseboneandtoothcollagen,40,000BP–present:Palaeoclimaticinterpretations.QuaternaryScienceReviews,2004.23(7):p.977-991.
37. Diefendorf,A.F.,etal.,Globalpatternsinleaf13Cdiscriminationandimplicationsforstudiesofpastandfutureclimate.ProceedingsoftheNationalAcademyofSciences,2010.107(13):p.5738-5743.
38. Fox-Dobbs,K.,J.A.Leonard,andP.L.Koch,PleistocenemegafaunafromeasternBeringia:Paleoecologicalandpaleoenvironmentalinterpretationsofstablecarbonandnitrogenisotopeandradiocarbonrecords.Palaeogeography,Palaeoclimatology,Palaeoecology,2008.261(1):p.30-46.
39. Blinnikov,M.S.,etal.,Pleistocenegraminoid-dominatedecosystemsintheArctic.QuaternaryScienceReviews,2011.30(21–22):p.2906-2929.
40. Zazula,G.D.andM.J.Wooller,Commenton“Environmentalsetting,(micro)morphologiesandstableC–Oisotopecompositionofcoldclimatecarbonateprecipitates—areviewandevaluationoftheirpotentialaspaleoclimaticproxies”byDenisLacelleQuaternaryScienceReviews26,1670–1689.QuaternaryScienceReviews,2008.27(15):p.1659-1660.
41. Yeakel,J.D.,etal.,TheimpactofclimatechangeonthestructureofPleistocenefoodwebsacrossthemammothsteppe.ProceedingsoftheRoyalSocietyofLondonB:BiologicalSciences,2013.280(1762):p.20130239.
42. Faith,J.T.,LatePleistoceneclimatechange,nutrientcycling,andthemegafaunalextinctionsinNorthAmerica.QuaternaryScienceReviews,2011.30(13):p.1675-1680.
43. Gross,M.,Megafaunamovesnutrientsuphill.CurrentBiology,2016.26(1):p.R1-R5.
44. Daufresne,T.,Palaeoecology:Megafaunaasanutrientpump.NatureGeoscience,2013.6(9):p.679-680.
45. Pastor,J.,Y.Cohen,andN.T.Hobbs,Therolesoflargeherbivoresinecosystemnutrientcycles,inLargeHerbivoreEcology,EcosystemDynamicsandConservation:,K.Danell,etal.,Editors.2006,CambridgeUniversityPress.p.289-325.
46. Drucker,D.,C.-J.Kind,andE.Stephan,ChronologicalandecologicalinformationonLate-glacialandearlyHolocenereindeerfromnorthwestEuropeusingradiocarbon(14C)andstableisotope(13C,15N)analysisofbonecollagen:casestudyinsouthwesternGermany.QuaternaryInternational,2011.245(2):p.218-224.
47. Drucker,D.,etal.,Evolutionofhabitatandenvironmentofreddeer(Cervuselaphus)duringtheLate-glacialandearlyHoloceneineasternFrance(FrenchJuraandthewesternAlps)usingmulti-isotopeanalysis(δ13C,δ15N,δ18O,δ34S)ofarchaeologicalremains.QuaternaryInternational,2011.245(2):p.268-278.
48. Mann,D.H.,etal.,Ice-agemegafaunainArcticAlaska:extinction,invasion,survival.QuaternaryScienceReviews,2013.70:p.91-108.
49. Stevens,R.E.,etal.,Nitrogenisotopeanalysesofreindeer(Rangifertarandus),45,000BPto9,000BP:Palaeoenvironmentalreconstructions.Palaeogeography,Palaeoclimatology,Palaeoecology,2008.262(1):p.32-45.
50. Puig,S.,etal.,Seasonalvariationsinguanacodiet(LamaguanicoeMüller1776)andfoodavailabilityinNorthernPatagonia,Argentina.JournalofAridEnvironments,1996.34(2):p.215-224.
© 2017 Macmillan Publishers Limited, part of Springer Nature. All rights reserved.
NATURE ECOLOGY & EVOLUTION | DOI: 10.1038/s41559-017-0125 | www.nature.com/natecolevol 37
SUPPLEMENTARY INFORMATION

38
51. Metcalf,J.L.,etal.,SynergisticrolesofclimatewarmingandhumanoccupationinPatagonianmegafaunalextinctions.ScienceAdvances,2016.
52. Prado,J.L.,C.Martinez-Maza,andM.T.Alberdi,MegafaunaextinctioninSouthAmerica:AnewchronologyfortheArgentinePampas.Palaeogeography,Palaeoclimatology,Palaeoecology,2015.425:p.41-49.
53. Marín,J.C.,etal.,MitochondrialDNAvariationandsystematicsoftheguanaco(Lamaguanicoe,Artiodactyla:Camelidae).JournalofMammalogy,2008.89(2):p.269-281.
54. Wheeler,J.C.,EvolutionandpresentsituationoftheSouthAmericanCamelidae.BiologicalJournaloftheLinneanSociety,1995.54(3):p.271-295.
55. Tonni,E.P.,A.L.Cione,andA.b.J.Figini,PredominanceofaridclimatesindicatedbymammalsinthepampasofArgentinaduringtheLatePleistoceneandHolocene.Palaeogeography,Palaeoclimatology,Palaeoecology,1999.147(3):p.257-281.
56. Gil,A.F.,etal.,Variationincamelidδ13Candδ15Nvaluesinrelationtogeographyandclimate:HolocenepatternsandarchaeologicalimplicationsincentralwesternArgentina.JournalofArchaeologicalScience,2016.66:p.7-20.
57. Samec,C.,M.Morales,andH.Yacobaccio,ExploringhumansubsistencestrategiesandenvironmentalchangethroughstableisotopesinthedryPunaofArgentina.InternationalJournalofOsteoarchaeology,2014.24(2):p.134-148.
58. Willerslev,E.,etal.,FiftythousandyearsofArcticvegetationandmegafaunaldiet.Nature,2014.506(7486):p.47-51.
59. Haile,J.,etal.,AncientDNArevealslatesurvivalofmammothandhorseininteriorAlaska.ProceedingsoftheNationalAcademyofSciences,2009.106(52):p.22352-22357.
60. Craine,J.M.,etal.,Grazingandlandscapecontrolsonnitrogenavailabilityacross330SouthAfricansavannasites.AustralEcology,2009.34(7):p.731-740.
61. Aranibar,J.,etal.,Nitrogenisotopecompositionofsoils,C3andC4plantsalonglandusegradientsinsouthernAfrica.JournalofAridEnvironments,2008.72(4):p.326-337.
62. Wooller,M.J.,etal.,StablecarbonisotopecompositionsofEasternBeringiangrassesandsedges:investigatingtheirpotentialaspaleoenvironmentalindicators.Arctic,Antarctic,andAlpineResearch,2007.39(2):p.318-331.
63. VanDenBerg,J.,R.vandeWal,andH.Oerlemans,AmassbalancemodelfortheEurasianIceSheetforthelast120,000years.GlobalandPlanetaryChange,2008.61(3):p.194-208.
64. Svendsen,J.I.,etal.,GlacialandvegetationhistoryofthePolarUralMountainsinnorthernRussiaduringthelasticeage,marineisotopestages5–2.QuaternaryScienceReviews,2014.92:p.409-428.
65. Tarasov,L.andW.R.Peltier,AgeophysicallyconstrainedlargeensembleanalysisofthedeglacialhistoryoftheNorthAmericanice-sheetcomplex.QuaternaryScienceReviews,2004.23(3):p.359-388.
66. Boex,J.,etal.,RapidthinningofthelatePleistocenePatagonianIceSheetfollowedmigrationoftheSouthernWesterlies.Scientificreports,2013.3.
67. NGRIP,N.G.I.C.P.,NorthGreenlandicecoreprojectoxygenisotopedata.IGBPPAGES/WorldDataCenterforPaleoclimatologyDataContributionSeries,2004.59.
68. Jouzel,J.,EPICADomeCIceCore800KYrDeuteriumDataandTemperatureEstimates,IGBPPAGES/WorldDataCenterforPaleoclimatology.2007,DataContributionSeries.
© 2017 Macmillan Publishers Limited, part of Springer Nature. All rights reserved.
NATURE ECOLOGY & EVOLUTION | DOI: 10.1038/s41559-017-0125 | www.nature.com/natecolevol 38
SUPPLEMENTARY INFORMATION

39
69. Crucifix,M.,palinsol:Insolationforpalaeoclimatestudies.2014.70. Craine,J.M.,etal.,Convergenceofsoilnitrogenisotopesacrossglobalclimate
gradients.2015.71. Murphy,B.P.andD.M.Bowman,Kangaroometabolismdoesnotcausethe
relationshipbetweenbonecollagenδ15Nandwateravailability.FunctionalEcology,2006.20(6):p.1062-1069.
72. Cormie,A.B.andH.P.Schwarcz,Effectsofclimateondeerboneδ15Nandδ13C:lackofprecipitationeffectsonδ15NforanimalsconsuminglowamountsofC4plants.GeochimicaetCosmochimicaActa,1996.60(21):p.4161-4166.
73. Schwarcz,H.P.,T.L.Dupras,andS.I.Fairgrieve,15NenrichmentintheSahara:insearchofaglobalrelationship.JournalofArchaeologicalScience,1999.26(6):p.629-636.
74. Männel,T.T.,K.Auerswald,andH.Schnyder,Altitudinalgradientsofgrasslandcarbonandnitrogenisotopecompositionarerecordedinthehairofgrazers.GlobalEcologyandBiogeography,2007.16(5):p.583-592.
75. Newsome,S.D.,etal.,Quaternaryrecordofaridityandmeanannualprecipitationbasedonδ15NinratiteanddromornithideggshellsfromLakeEyre,Australia.Oecologia,2011.167(4):p.1151-1162.
76. Pate,F.D.andT.Anson,Stablenitrogenisotopevaluesinarid‐landkangarooscorrelatedwithmeanannualrainfall:potentialasapalaeoclimaticindicator.InternationalJournalofOsteoarchaeology,2008.18(3):p.317-326.
77. Gröcke,D.R.,H.Bocherens,andA.Mariotti,Annualrainfallandnitrogen-isotopecorrelationinmacropodcollagen:applicationasapalaeoprecipitationindicator.EarthandPlanetaryScienceLetters,1997.153(3):p.279-285.
78. Heaton,T.H.,etal.,Climaticinfluenceontheisotopiccompositionofbonenitrogen.1986.
79. Sealy,J.C.,etal.,NitrogenisotopicecologyinsouthernAfrica:implicationsforenvironmentalanddietarytracing.GeochimicaetCosmochimicaActa,1987.51(10):p.2707-2717.
80. Codron,J.,etal.,Plantstableisotopecompositionacrosshabitatgradientsinasemi‐aridsavanna:implicationsforenvironmentalreconstruction.JournalofQuaternaryScience,2013.28(3):p.301-310.
81. McCulley,R.L.,I.C.Burke,andW.K.Lauenroth,ConservationofnitrogenincreaseswithprecipitationacrossamajorgrasslandgradientintheCentralGreatPlainsofNorthAmerica.Oecologia,2009.159(3):p.571-581.
82. Swap,R.,etal.,Naturalabundanceof13Cand15NinC3andC4vegetationofsouthernAfrica:patternsandimplications.GlobalChangeBiology,2004.10(3):p.350-358.
83. Wang,L.,etal.,Patternsandimplicationsofplant-soilδ13Candδ15NvaluesinAfricansavannaecosystems.QuaternaryResearch,2010.73(1):p.77-83.
© 2017 Macmillan Publishers Limited, part of Springer Nature. All rights reserved.
NATURE ECOLOGY & EVOLUTION | DOI: 10.1038/s41559-017-0125 | www.nature.com/natecolevol 39
SUPPLEMENTARY INFORMATION