Embed Size (px)
Citation preview
Corridor System Management Plan (CSMP)
L o s A n g e l e s I - 2 1 0 C o r r i d o r
F i n a l R e p o r t
Execut ive Summar y
S e p t e m b e r 2 0 1 0
I approve this Corridor System Management Plan (CSMP) for 1-210 in Caltrans District 7 as the overall
Policy Statement and Strategic Plan that will guide transportation decisions and investment for the 1-210
Corridor from 1-5 to SR-57 in Los Angeles County
Approval
~bate
I-210 Corridor System Management Plan Executive Summary
Page i
Table of Contents
Table of Contentsi List of Exhibits ii
BACKGROUND 1
STAKEHOLDER INVOLVEMENT 3
CORRIDOR PERFORMANCE ASSESSMENT 4 Corridor Description 4 Corridor Performance Assessment 6
Mobility 6 Reliability 14 Safety 16 Productivity 18
BOTTLENECK IDENTIFICATION AND CAUSALITY ANALYSIS21
SCENARIO DEVELOPMENT AND ANALYSIS25 Traffic Model Development25 Scenario Development Framework 27 Scenario Evaluation Results29 Benefit-Cost Analysis 36
CONCLUSIONS AND RECOMMENDATIONS38
I-210 Corridor System Management Plan Executive Summary
Page ii
List of Exhibits
Exhibit ES-1 System Management Pyramid ________________________________________2 Exhibit ES-2 Los Angeles County I-210 CSMP Corridor Map __________________________5 Exhibit ES-3 Average Weekday Delay by Month (2005-2009) __________________________8 Exhibit ES-4 Mainline Lane Delay by Day of Week (2005-2009) ________________________9 Exhibit ES-5 HOV Lane Delay by Day of Week (2005-2009) ___________________________9 Exhibit ES-6 Eastbound Mainline Lanes Hourly Delay (2005-2009)_____________________10 Exhibit ES-7 Westbound Mainline Lanes Hourly Delay (2005-2009) ____________________11 Exhibit ES-8 Eastbound Mainline Lanes Travel Time by Hour (2005-2009)_______________12 Exhibit ES-9 Westbound Mainline Lanes Travel Time by Hour (2005-2009) ______________12 Exhibit ES-10 Eastbound HOV Lanes Travel Time by Hour (2005-2009) ________________13 Exhibit ES-11 Westbound HOV Lanes Travel Time by Hour (2005-2009) ________________13 Exhibit ES-12 Eastbound Mainline Lanes Travel Time Variability (2006)_________________15 Exhibit ES-13 Westbound Mainline Lanes Travel Time Variability (2006) ________________15 Exhibit ES-14 Eastbound I-210 Monthly Collisions (2004-2008) _______________________17 Exhibit ES-15 Westbound I-210 Monthly Collisions (2004-2008) _______________________17 Exhibit ES-16 Lost Productivity Illustrated ________________________________________19 Exhibit ES-17 Mainline Daily Equivalent Lost Lane-Miles by Direction and Period (2005-09) _20 Exhibit ES-18 HOV Daily Equivalent Lost Lane-Miles by Direction and Period (2005-09) ____20 Exhibit ES-19 I-210 Eastbound Bottleneck Locations________________________________22 Exhibit ES-20 I-210 Westbound Bottleneck Locations _______________________________22 Exhibit ES-21 I-210 Map of AM Bottleneck Locations _______________________________23 Exhibit ES-22 I-210 Map of PM Bottleneck Locations _______________________________24 Exhibit ES-23 Micro-Simulation Model Network ____________________________________26 Exhibit ES-24 Micro-Simulation Modeling Approach ________________________________28 Exhibit ES-25 2006 AM Peak Micro-Simulation Delay Results by Scenario_______________29 Exhibit ES-26 2006 PM Peak Micro-Simulation Delay Results by Scenario_______________30 Exhibit ES-27 2020 AM Peak Micro-Simulation Delay Results by Scenario_______________30 Exhibit ES-28 2020 PM Peak Micro-Simulation Delay Results by Scenario_______________31 Exhibit ES-29 I-210 Scenario BenefitCost (BC) Results ____________________________37
I-210 Corridor System Management Plan Executive Summary
Page 1 of 39
This document represents the Executive Summary for the Los Angeles I-210 Corridor
System Management Plan (CSMP) Final Report developed on behalf of the California Department of Transportation (Caltrans) by System Metrics Group Inc (SMG) A more detailed and larger technical CSMP is available upon request
This CSMP is the direct result of the November 2006 voter-approved Proposition 1B (The Highway Safety Traffic Reduction Air Quality and Port Security Bond Act of 2006) This ballot measure included a funding program deposited into a Corridor Mobility Improvement Account (CMIA)
To receive CMIA funds the California Transportation Commission (CTC) guidelines required that project nominations describe in a CSMP how mobility gains from funded corridor improvements would be maintained over time A CSMP therefore aims to define how corridors will be managed over time focusing on operational strategies in addition to the already funded expansion projects The goal is to get the most out of the existing system and maintain or improve corridor performance
The two documents ndash the Executive Summary and Final Report ndash represent the results of a study that included several key steps including
diams Stakeholder Involvement diams Corridor Performance Assessment diams Bottleneck Identification and Causality Analysis diams Scenario Development and Analysis diams Conclusions and Recommendations
Highlights of each of these steps are included in later sections of this summary
BACKGROUND
Los Angeles Countyrsquos transportation system faces numerous challenges mdash the demand for transportation keeps rising congestion is increasing and infrastructure is aging At the same time traditional transportation finance mechanisms are not able to provide adequate funding to keep expanding the infrastructure to keep up with demand Caltrans recognized that infrastructure expansion cannot keep pace with demand and adopted a system management philosophy to address current and future transportation needs in a comprehensive manner Exhibit ES-1 conceptually illustrates system management as a pyramid The exhibit shows that the transportation decision makers and practitioners at all jurisdictions must expand their ldquotool boxrdquo to include many complementary strategies with an increased focus on operational investments (shown in
I-210 Corridor System Management Plan Executive Summary
Page 2 of 39
the middle part of the pyramid) to complement the traditional system expansion investments
Exhibit ES-1 System Management Pyramid
This I-210 CSMP aims to define how Caltrans and its stakeholders will manage the corridor over time focusing on operational strategies in addition to already funded expansion projects The goal is to get the most out of the existing system and maintain andor improve its performance The CSMP fully respects previous decisions and complements them with additional promising investment suggestions where appropriate The CSMP development effort relies on complex analytical tools including micro simulation models to isolate deficiencies and quantify improvements for even relatively small operational investments
Caltrans develops integrated multimodal projects in balance with community goals plans and values Caltrans seeks and tries to address the safety and mobility needs of bicyclists pedestrians and transit users in all projects regardless of funding Bicycle pedestrian and transit travel is facilitated by creating complete streets beginning early in system planning and continuing through project delivery maintenance and operations Developing a network of complete streets requires collaboration among all Caltrans functional units and stakeholders As the first generation CSMP this report is more focused on reducing congestion and increasing mobility through capital and operational strategies The future CSMP work will further address pedestrian bicycle and transit components and seek to manage and improve the whole network as an interactive system
I-210 Corridor System Management Plan Executive Summary
Page 3 of 39
STAKEHOLDER INVOLVEMENT
A technical committee was formed and met on an almost monthly basis to discuss progress technical challenges data needs and preliminary conclusions for the I-210 CSMP The technical committee included representatives from Caltrans the Southern California Association of Governments (SCAG) the Los Angeles County Metropolitan Transportation Authority (Metro) as well as consultant team members
The I-210 CSMP involved other corridor stakeholders such as representatives from cities bordering I-210 Caltrans briefed these stakeholders at critical milestones
Feedback from the stakeholders helped solidify the findings of the performance assessment bottleneck identification and causality analysis given their intimate knowledge of local conditions Moreover stakeholders have provided support and insight and shared valuable field and project data without which this study would not have been possible The stakeholders included representatives from the following organizations
diams San Gabriel Valley Council of Governments diams Los Angeles County Department of Public Works diams City of Arcadia diams City of Azusa diams City of Claremont diams City of Duarte diams City of Glendora diams City of Irwindale diams City of LaVerne diams City of Monrovia diams City of Pasadena diams City of San Dimas
Caltrans would like to thank all of its partners for contributing to this CSMP development process In addition the CSMP development provided a venue for tighter coordination between Caltrans planning and operations professionals which is critical to the success of the system management approach
I-210 Corridor System Management Plan Executive Summary
Page 4 of 39
CORRIDOR PERFORMANCE ASSESSMENT
This section briefly describes the I-210 corridor and summarizes the results of the comprehensive corridor performance assessment conducted
Corridor Description
Exhibit ES-2 shows the location of the Los Angeles County I-210 CSMP corridor The corridor extends approximately 45 miles from the I-5 (Golden State Freeway) interchange in the San Fernando Valley to the SR-57 (Orange Freeway) interchange It traverses the cities of San Fernando La Canada Flintridge Pasadena Arcadia Monrovia Duarte Azusa and San Dimas The focus of the CSMP is the 20-mile congested urban section between SR-134 and SR-57
The corridor is a divided eight- to ten-lane freeway with a concrete median and an additional outside auxiliary lane along most of the corridor A single High Occupancy Vehicle (HOV) lane exists in each direction through the congestion urban area that is the focus of the study corridor (from the SR-134 interchange to the SR-57 interchange)
According to Caltrans traffic volumes reported for 2008 Los Angeles I-210 carries between 76000 and 298000 annual average daily traffic (AADT) The highest average daily traffic volume on the corridor occurs at the SR-134 interchange and the lowest volume occurs near the I-5 interchange
I-210 is also a Surface Transportation Assistance Act (STAA) route that allows large trucks to operate on the mainline lanes According to the latest truck volumes from Caltrans trucks comprise between four and ten percent of total daily traffic along the corridor Higher truck percentages occur west of the SR-134 Many of these trucks travel eastbound to the Inland Empire home to many warehouses and distribution centers The trucks traveling westbound are typically headed north to connect to the I-5 corridor and beyond
Major transit operations along the I-210 Corridor include Metro bus and light rail Metrolink commuter rail Foothill Transit Los Angeles City Department of Transportation Commuter Express and Pasadena Area Rapid Transit System (ARTS)
Metro operates ten parallel local bus or bus rapid transit (BRT) routes near the I-210 corridor It also operates the Metro Rail Gold Line that provides light-rail service in the center median of I-210 from downtown Los Angeles Union Station to the Sierra Madre Villa station
1-210 Corridor Study A1rea
0 I 2 3 4 5 MIEB
llllilllilllilllil l+j
I-210 Corridor System Management Plan Executive Summary
Page 5 of 39
Exhibit ES-2 Los Angeles County I-210 CSMP Corridor Map
I-210 Corridor System Management Plan Executive Summary
Page 6 of 39
Foothill Transit provides four bus lines that serve Pasadena the City of Arcadia and the City of Duarte The City of Los Angeles Department of Transportation also operates two commuter service lines that service the San Gabriel Valley Other transit agencies such as the Pasadena Rapid Transit System and the Glendale Bee operate local bus service between residential neighborhoods and business centers The Metrolink Antelope Valley Line provides commuter rail service from the Antelope Valley along the I-5 and San Fernando Road to downtown Los Angeles
There are various bike routes near I-210 but none that parallel the study corridor Most of the bike routes near the corridor are Class III Bike Paths (preferred bike routes on existing streets identified by signs only) These routes are concentrated between I-110 and SR-19 Due to the terrain and uphill climb there are few bike paths west of SRshy134
Several roadway improvements have been recently completed In preparation for System-Wide Adaptive Ramp Metering (SWARM) implementation various on-ramps between SR-134 and SR-57 were modified to enhance metering with traffic signals on the HOV bypass lanes Freeway connector on-ramps from I-605 and SR-57 have been modified to implement connector metering with traffic signals Closed-circuit television (CCTV) cameras and fiber optic communications were also added throughout the corridor
In addition to major employment trip-generating activity centers in Pasadena area there are 14 collegesuniversities six major medical centers the Rose Bowl stadium Santa Anita Park Horse Track Irwindale Speedway and various large shopping malls The Bob Hope Airport in Burbank is also a major traffic generator for the I-210 corridor
Corridor Performance Assessment
The I-210 CSMP focuses on four categories of performance measures
diams Mobility describes how quickly people and freight move along the corridor diams Reliability captures the relative predictability of travel time along the corridor diams Safety provides an overview of collisions along the corridor diams Productivity quantifies the degree to which traffic inefficiencies at bottlenecks or
hot spots reduce flow rates along the corridor
Mobility
Two primary measures quantify mobility in this report delay and travel time Each is estimated from field automatic detection data from the Performance Measurement System1 (PeMS) provided access to the historical freeway detection data needed to
1 Developed and maintained by Caltrans and accessible at pemsdotcagov
I-210 Corridor System Management Plan Executive Summary
Page 7 of 39
estimate the two mobility measures PeMS collects detector volume and occupancy data on the freeway which were used to estimate speed delay and travel time
Delay
Delay is defined as the observed travel time less the travel time at uncongested conditions and is reported as vehicle-hours of delay The assessment summarized the results for the five-year period between 2005 and 2009 Delays in this report were calculated as the difference in travel time between estimated speeds and free-flow conditions at 60 mph applied to the observed volume Exhibit ES-2 shows the average daily vehicle-hours of delay for each month between 2005 and 2009 for both mainline and high occupancy vehicle (HOV) lanes This exhibit reveals the following trends
diams Prior to 2007 the eastbound and westbound directions experienced similar delay levels on both the mainline and HOV lanes The HOV lanes comprise approximately 15 to 20 percent of the total estimated delay on the corridor
diams Congestion on the westbound mainline lanes experienced extreme peaking ndash likely caused by construction on the corridor between 2007 and 2008 The eastbound lanes did not experience much change in delay in 2007 but declined through 2008 The HOV facility did not experience significant change during this time
diams In 2009 the estimated delay on the eastbound mainline lanes increased dramatically while in contrast the westbound lanes declined sharply The HOV lane showed a similar trend with the eastbound HOV lane exceeding the delay in the westbound direction
I-210 Corridor System Management Plan Executive Summary
Page 8 of 39
Exhibit ES-3 Average Weekday Delay by Month (2005-2009) 16000
Av
era
ge
Da
ily
Ve
hic
le-H
ou
rs o
f D
ela
y (
6
0m
ph
)
15000
14000
13000
12000
11000
10000
9000
8000
7000
6000
5000
4000
3000
2000
1000
-
Ja
nF
eb
Ma
rA
pr
Ma
yJ
un
Ju
lA
ug
Se
pO
ct
No
vD
ec
Ja
nF
eb
Ma
rA
pr
Ma
yJ
un
Ju
lA
ug
Se
pO
ct
No
vD
ec
Ja
nF
eb
Ma
rA
pr
Ma
yJ
un
Ju
lA
ug
Se
pO
ct
No
vD
ec
Ja
nF
eb
Ma
rA
pr
Ma
yJ
un
Ju
lA
ug
Se
pO
ct
No
vD
ec
Ja
nF
eb
Ma
rA
pr
Ma
yJ
un
Ju
lA
ug
Se
pO
ct
No
vD
ec
2005 2006 2007 2008 2009
Eastbound ML
Westbound ML
Eastbound HOV
Westbound HOV
Month
The CSMP separates delay further into two components severe delay and other delay Severe delay is delay that occurs when speeds are below 35 mph and other delay occurs where speeds are between 35 and 60 mph Severe delay represents breakdown conditions ldquoOtherrdquo delay represents conditions approaching or leaving the breakdown congestion or areas that cause temporary slowdowns However it can also be a leading indicator of future severe delay
Exhibits ES-4 (Mainline lanes) and ES-5 (HOV lanes) show average severe and other daily vehicle-hours of delay by day of the week A few notes related to ES-4 and ES-5
diams Severe delay makes up about 70 percent of all weekday delay on the corridor in either the eastbound or the westbound direction Severe delay on Saturdays and SundaysHolidays tend to be under 70 percent while weekday severe delay averages around 75 percent of all delay As in Exhibit ES-3 HOV delays tend to range between 14 and 25 percent of total delay
diams Fridays in the eastbound direction experience the highest delays probably due to weekend travel The second highest delays generally occurred on Thursdays In the westbound direction the day of week trends are typical for urban commute corridors with the midweek days experiencing the highest delays with Monday and Friday showing slightly less congestion and the weekends showing much lower delays than during the week
Av
era
ge D
aily V
eh
icle
-Ho
urs
of
Dela
y (
60
mp
h)
Av
era
ge D
aily V
eh
icle
-Ho
urs
of
Dela
y (
60
mp
h)
I-210 Corridor System Management Plan Executive Summary
Page 9 of 39
Exhibit ES-4 Mainline Lane Delay by Day of Week (2005-2009) 16000
15000
14000
13000
12000
11000
10000
9000
8000
7000
6000
5000
4000
3000
2000
1000
-
Mainline Other Delay
Mainline Severe Delay M
on
T
ue
Wed
T
hu
F
riS
at
Su
n
Ho
lM
on
Tu
eW
ed
Th
uF
riS
at
Su
n
Ho
lM
on
Tu
eW
ed
Th
uF
riS
at
Su
n
Ho
lM
on
Tu
eW
ed
Th
uF
riS
at
Su
n
Ho
lM
on
Tu
eW
ed
Th
uF
riS
at
Su
n
Ho
lM
on
Tu
eW
ed
Th
uF
riS
at
Su
n
Ho
lM
on
Tu
eW
ed
Th
uF
riS
at
Su
n
Ho
lM
on
Tu
eW
ed
Th
uF
riS
at
Su
n
Ho
lM
on
Tu
eW
ed
Th
uF
riS
at
Su
n
Ho
lM
on
Tu
eW
ed
Th
uF
riS
at
Su
n
Ho
l
2005 2006 2007 2008 2009 2005 2006 2007 2008 2009
EASTBOUND WESTBOUND
Exhibit ES-5 HOV Lane Delay by Day of Week (2005-2009) 4000
3500
3000
2500
2000
1500
1000
500
-
Mo
nT
ue
Wed
Th
uF
riS
at
Su
n
Ho
lM
on
Tu
eW
ed
Th
uF
riS
at
Su
n
Ho
lM
on
Tu
eW
ed
Th
uF
riS
at
Su
n
Ho
lM
on
Tu
eW
ed
Th
uF
riS
at
Su
n
Ho
lM
on
Tu
eW
ed
Th
uF
riS
at
Su
n
Ho
lM
on
Tu
eW
ed
Th
uF
riS
at
Su
n
Ho
lM
on
Tu
eW
ed
Th
uF
riS
at
Su
n
Ho
lM
on
Tu
eW
ed
Th
uF
riS
at
Su
n
Ho
lM
on
Tu
eW
ed
Th
uF
riS
at
Su
n
Ho
lM
on
Tu
eW
ed
Th
uF
riS
at
Su
n
Ho
l
2005 2006 2007 2008 2009 2005 2006 2007 2008 2009
EASTBOUND WESTBOUND
Other Delay
Severe Delay
I-210 Corridor System Management Plan Executive Summary
Page 10 of 39
Exhibits ES-6 and ES-7 summarize average annual weekday delay by hour of the day over the five-year period for the mainline northbound and southbound lanes respectively These exhibits allow planners and decision makers to understand the trend in peak period delay spiking and peak period spreading by comparing the intensity and duration of the peak period congestion Note that the HOV lanes are not shown in this summary report since they follow similar peaking trends as the mainline lanes (the main technical report contains the HOV delay by hour results) A few notes on these two exhibits
diams The eastbound direction peaks in the PM peak period while the AM is the westbound peak AM peak hour is 700 AM while the PM peak period is 500 PM
diams In the eastbound PM direction congestion grew dramatically in 2009 while westbound AM congestion declined This is also evident in Exhibit ES-2 Eastbound delay between 2005 and 2008 remained relatively constant at about 1750 vehicle-hours during the 500 PM peak hour before increasing in 2009 to about 2100 vehicle-hours
diams Westbound AM congestion declined in 2009 after two years of dramatic growth between 2007 and 2008 In 2009 the AM peak period also shrank by approximately one-half hour and started at approximately 530 AM whereas from 2005 to 2008 the peak period started around 500 AM
Exhibit ES-6 Eastbound Mainline Lanes Hourly Delay (2005-2009)
0
250
500
750
1000
1250
1500
1750
2000
2250
2500
Ave
rag
e D
ail
y V
eh
icle
Ho
urs
of
Dela
y (
60
mp
h) 2009 Weekday
2008 Weekday
2007 Weekday
2006 Weekday
2005 Weekday
00
0
10
0
20
0
30
0
40
0
50
0
60
0
70
0
80
0
90
0
100
0
110
0
120
0
130
0
140
0
150
0
160
0
170
0
180
0
190
0
200
0
210
0
220
0
230
0
Hour of the Day
I-210 Corridor System Management Plan Executive Summary
Page 11 of 39
Exhibit ES-7 Westbound Mainline Lanes Hourly Delay (2005-2009)
0
250
500
750
1000
1250
1500
1750
2000
2250
2500
Ave
rag
e D
ail
y V
eh
icle
Ho
urs
of
Dela
y (
60m
ph
) 2009 Weekday
2008 Weekday
2007 Weekday
2006 Weekday
2005 Weekday
00
0
10
0
20
0
30
0
40
0
50
0
60
0
70
0
80
0
90
0
100
0
110
0
120
0
130
0
140
0
150
0
160
0
170
0
180
0
190
0
200
0
210
0
220
0
230
0
Hour of the Day
Travel Time
The travel time performance measure represents the average time it takes for a vehicle to travel between SR-134 and SR-57 a distance of approximately 20 miles
Exhibits ES-8 and ES-9 summarize mainline estimated average weekday travel times by hour of day for the 2005-2009 five-year period Exhibits ES-10 and ES-11 show the same results for the HOV facility Similar to delay travel times increased in 2009 in the eastbound PM direction and time but decreased in the westbound AM commute period
In the mainline lanes the eastbound PM peak hour (500 PM) travel time grew from 40 minutes in 2008 to 44 minutes in 2009 In the westbound AM peak hour (700 AM) the opposite trend occurred with travel times dropping from a 41 minute average in 2008 to around 36 minutes in 2009
A similar trend occurred for the HOV lanes except that 2005 was the worst year in terms of travel times
Tra
ve
l T
ime
(m
inu
tes
) T
rav
el
Tim
e (
min
ute
s)
45
40
35
30
25
20
15
10
5
0
45
40
35
30
25
20
15
10
5
0
I-210 Corridor System Management Plan Executive Summary
Page 12 of 39
Exhibit ES-8 Eastbound Mainline Lanes Travel Time by Hour (2005-2009) 50
2009 Average Travel Time
2008 Average Travel Time
2007 Average Travel Time
2006 Average Travel Time
2005 Average Travel Time
Travel Time 60mph
Travel Time 35mph
Hour of the Day
00
0
10
0
20
0
30
0
40
0
50
0
60
0
70
0
80
0
90
0
100
0
110
0
120
0
130
0
140
0
150
0
160
0
170
0
180
0
190
0
200
0
210
0
220
0
Hour of the Day
Exhibit ES-9 Westbound Mainline Lanes Travel Time by Hour (2005-2009) 50
2009 Average Travel Time
2008 Average Travel Time
2007 Average Travel Time
2006 Average Travel Time
2005 Average Travel Time
Travel Time 60mph
Travel Time 35mph
00
0
10
0
20
0
30
0
40
0
50
0
60
0
70
0
80
0
90
0
10
00
11
00
12
00
13
00
14
00
15
00
16
00
17
00
18
00
19
00
20
00
21
00
22
00
230
0
23
00
Tra
ve
l T
ime
(m
inu
tes
) T
rav
el
Tim
e (
min
ute
s)
45
40
35
30
25
20
15
10
5
0
45
40
35
30
25
20
15
10
5
0
I-210 Corridor System Management Plan Executive Summary
Page 13 of 39
Exhibit ES-10 Eastbound HOV Lanes Travel Time by Hour (2005-2009) 50
2009 Average Travel Time
2008 Average Travel Time
2007 Average Travel Time
2006 Average Travel Time
2005 Average Travel Time
Travel Time 60mph
Travel Time 35mph
Hour of the Day
00
0
10
0
20
0
30
0
40
0
50
0
60
0
70
0
80
0
90
0
100
0
110
0
120
0
130
0
140
0
150
0
160
0
170
0
180
0
190
0
200
0
210
0
220
0
Hour of the Day
Exhibit ES-11 Westbound HOV Lanes Travel Time by Hour (2005-2009) 50
2009 Average Travel Time
2008 Average Travel Time
2007 Average Travel Time
2006 Average Travel Time
2005 Average Travel Time
Travel Time 60mph
Travel Time 35mph
00
0
10
0
20
0
30
0
40
0
50
0
60
0
70
0
80
0
90
0
100
0
110
0
120
0
130
0
140
0
150
0
160
0
170
0
180
0
190
0
200
0
210
0
220
0
230
0
230
0
I-210 Corridor System Management Plan Executive Summary
Page 14 of 39
Reliability
Reliability captures the degree of predictability in travel time Reliability focuses on how travel time varies from day to day and reflects the impacts of accidents incidents weather and special events Improving reliability is an important goal for transportation agencies and efforts to accomplish this include incident management traveler information and special event planning
To measure reliability the CSMP used the ldquobuffer indexrdquo which reflects the additional time required (over and beyond the average) to ensure an on-time arrival 95 percent of the time In other words if a person must be on time 95 days out of 100 (or 19 out of 20 workdays per month) then that person must add additional time to their average expected travel time to ensure an on-time arrival That additional time is the buffer time Severe events such as collisions could cause longer travel times but the 95th percentile represents a balance between days with extreme events (eg major accidents) and other more ldquotypicalrdquo travel days
Exhibits ES-12 and ES-13 show the estimated mainline lane travel time variability along I-210 on non-holiday weekdays for 2006 in the eastbound and westbound directions respectively The main report shows the buffer index for the years 2005-2009 for both mainline and HOV lanes but this Executive Summary reports only the data for the year 2006 for mainlines since that year was used as the base year for modeling
The following observations on the reliability results are worth noting
bull In 2006 in the eastbound direction 500 PM had the highest estimated average travel time at approximately 41 minutes and the highest estimated buffer index time of 15 minutes for a buffer index of 33 percent In other words to arrive on time 95 percent of the time a commuter would need to leave for work 56 minutes before the start time to travel the entire length of the I-210 study corridor
bull The westbound direction the 700 AM had the estimated average travel time of 39 minutes in 2006 with a buffer time of 15 minutes for a buffer index of 38 percent
70
65
60
55
50
45
40
35
30
25
20
15
10
5
0
70
65
60
55
50
45
40
35
30
25
20
15
10
5
0
Average Travel Time
Travel Time Variability (95th Percentile)
Travel Time at 60mph
Travel Time at 35mph
TIME OF DAY
Exhibit ES-13 Westbound Mainline Lanes Travel Time Variability (2006)
75
TIME OF DAY
Average Travel Time
Travel Time Variability (95th Percentile)
Travel Time at 60mph
Travel Time at 35mph
Exhibit ES-12 Eastbound Mainline Lanes Travel Time Variability (2006)
75
I-210 Corridor System Management Plan Executive Summary
Page 15 of 39
TR
AV
EL
TIM
E (
MIN
)
00
000
0
10
010
0
TR
AV
EL
TIM
E (
MIN
)
20
020
0
30
030
0
40
040
0
50
050
0
60
060
0
70
070
0
80
080
0
90
090
0
100
01
00
0
110
01
10
0
120
01
20
0
130
01
30
0
140
01
40
0
150
01
50
0
160
01
60
0
170
01
70
0
180
01
80
0
190
01
90
0
200
02
00
0
210
02
10
0
220
02
20
0
230
02
30
0
00
0
00
0
I-210 Corridor System Management Plan Executive Summary
Page 16 of 39
Safety
The adopted performance measures to assess safety involve the number of accidents and the accident rates computed from the Caltrans Traffic Accident Surveillance and Analysis System (TASAS) TASAS is a traffic records system containing an accident database linked to a highway database The highway database contains descriptive elements of highway segments intersections and ramps access control traffic volumes and other data TASAS contains specific data for accidents on State highways Accidents on non-State highways are not included (eg local streets and roads)
The safety assessment in this report intends to characterize the overall accident history and trends in the corridor and to highlight notable accident concentration locations or patterns that are readily apparent This report does not intend to supplant more detailed safety investigations routinely performed by Caltrans staff
Exhibits ES-14 and ES-15 show the I-210 total number of eastbound and westbound accidents by month respectively For the accident analysis the corridor is split in half the ldquoless urbanrdquo western half of the corridor from I-5 (postmile 0) in Sylmar to SR-134 in Pasadena (postmile R2200) and the ldquomore urbanrdquo eastern half from SR-134 to SR-57 (postmile R45) in San Dimas The latest available TASAS data from PeMS is to December 30 2008 Accidents are reported for the study corridor and not separated by mainline and HOV facility The exhibits summarize the latest available three-year data from January 1 2006 through December 31 2008
Both the eastbound and westbound directions have similar accident profiles with the more urbanized eastern half of the corridor (postmile R22 to R45) experiencing nearly 45 times as many accidents as the western half (PM 0 to R22) The eastbound (Exhibit ES-13) direction has around 79 accidents on average per month in the more-urbanized section and just fewer than 18 accidents in the less-urbanized section
The westbound direction has just fewer than 78 accidents on average per month in the more-urbanized section and just fewer than 18 in the less-urbanized section This is very similar to the eastbound direction
Nu
mb
er
of
Ac
cid
en
ts
Nu
mb
er
of
Accid
en
ts
I-210 Corridor System Management Plan Executive Summary
Page 17 of 39
Exhibit ES-14 Eastbound I-210 Monthly Collisions (2004-2008) 120
110
100
90
80
70
60
50
40
30
20
10
0
Jan
Feb
Mar
Ap
rM
ay
Ju
nJu
lA
ug
Sep
Oct
No
vD
ec
Jan
Feb
Mar
Ap
rM
ay
Ju
nJu
lA
ug
Sep
Oct
No
vD
ec
Jan
Feb
Mar
Ap
rM
ay
Ju
nJu
lA
ug
Sep
Oct
No
vD
ec
Jan
Feb
Mar
Ap
rM
ay
Ju
nJu
lA
ug
Sep
Oct
No
vD
ec
Jan
Feb
Mar
Ap
rM
ay
Ju
nJu
lA
ug
Sep
Oct
No
vD
ec
2004 2005 2006 2007 2008
Less Urbanized Western Section (I-5 to SR-134)
More Urbanized Eastern Section (SR-134 to SR-57)
110
100
90
80
70
60
50
40
30
20
10
0
Exhibit ES-15 Westbound I-210 Monthly Collisions (2004-2008) 120
Jan
Feb
Mar
Ap
rM
ay
Ju
nJu
lA
ug
Sep
Oct
No
vD
ec
Jan
Feb
Mar
Ap
rM
ay
Ju
nJu
lA
ug
Sep
Oct
No
vD
ec
Jan
Feb
Mar
Ap
rM
ay
Ju
nJu
lA
ug
Sep
Oct
No
vD
ec
Jan
Feb
Mar
Ap
rM
ay
Ju
nJu
lA
ug
Sep
Oct
No
vD
ec
Jan
Feb
Mar
Ap
rM
ay
Ju
nJu
lA
ug
Sep
Oct
No
vD
ec
2004 2005 2006 2007 2008
Less Urbanized Western Section (I-5 to SR-134)
More Urbanized Eastern Section (SR-134 to SR-57)
I-210 Corridor System Management Plan Executive Summary
Page 18 of 39
Productivity
Productivity is a system efficiency measure used to analyze the throughput of the corridor during congested conditions Restoring lost productivity is one focus area of CSMPs
Exhibit ES-16 illustrates how congestion leads to lost productivity The exhibit uses observed I-210 data from sensors for a typical spring 2010 afternoon peak period (Thursday May 6 2010) It shows speeds (red line) and flow rates (blue line) on eastbound I-210 at Huntington Drive one of the most congested locations on the corridor
Flow rates (measured as vehicle-per-hour-per-lane or ldquovphplrdquo) at Huntington Drive averaged around 1800 vphpl between 200 PM and 300 PM Once volumes approach a maximum flow rate of around 2000 vphl traffic becomes unstable Any additional merging or weaving traffic breaks down and speeds can rapidly plummet to below 35 mph In essence every incremental merge takes up two spots on the freeway for a short time However since the volume is close to the capacity these merges lead to queues Moreover rather than accommodating the same number of vehicles flow rates also drop and vehicles back up creating bottlenecks and associated congestion
At the location shown in Exhibit ES-16 throughput drops by over 30 percent on average during the peak period (from over 1800 to around 1200 vphpl) This five-lane road therefore operates as if lost 30 percent capacity when demand is at its highest Stated differently just when the corridor needed the most capacity it performed in the least productive manner and effectively lost lanes This loss in throughput can be aggregated and presented as ldquoEquivalent Lost-Lane-Milesrdquo
I-210 Corridor System Management Plan Executive Summary
Page 19 of 39
Exhibit ES-16 Lost Productivity Illustrated
70 2000
65
60 1750
50
55 1500
SP
EE
D
45 1250
40
35 1000
30 Speed lt35mph
750 25
20 500 I-210 EB
15 Los Angeles County Huntington
10 PM=3338 250
May 6 2010 5 VDS ID 761141
0 -
FL
OW
RA
TE
(VP
HP
L)
140
0
143
0
150
0
153
0
160
0
163
0
170
0
173
0
180
0
183
0
190
0
193
0
TIME The estimated average non-holiday weekday lost lane-miles by period and year on Ishy210 are shown Exhibits ES-17 (mainline) and ES-18 (HOV) A few notes on these two exhibits
diams The trends in the productivity losses are comparable to the delay trends The largest productivity losses occurred in the eastbound direction during the PM peak hours which is the direction and time period that experienced the most congestion
diams On the mainline facility the westbound direction experienced nearly as high productivity loses during the AM peak period
diams On the HOV lanes a greater productivity loss in the eastbound peak period is more evident
Operational strategies are critical to recovering such productivity losses These strategies include building new or extending auxiliary lanes developing more aggressive ramp metering strategies without negatively influencing the arterial network and improving incident clearance times
I-210 Corridor System Management Plan Executive Summary
Page 20 of 39
Exhibit ES-17 Mainline Daily Equivalent Lost Lane-Miles by Direction and Period (2005-09)
-
10
20
30
40
50
60
70
80
90
100
110
120
130
140
150
160
2005 2006 2007 2008 2009 2005 2006 2007 2008 2009 2005 2006 2007 2008 2009 2005 2006 2007 2008 2009
Eastbound
Westbound
AM PM Midday Night Time Period and Year
Daily
Eq
uiv
ale
nt
Lost
Lan
e-M
iles
Exhibit ES-18 HOV Daily Equivalent Lost Lane-Miles by Direction and Period (2005-09)
-
10
20
30
40
2005 2006 2007 2008 2009 2005 2006 2007 2008 2009 2005 2006 2007 2008 2009 2005 2006 2007 2008 2009
Eastbound
Westbound
AM Midday PM Night
Daily
Eq
uiv
ale
nt
Lost
Lan
e-M
iles
Time Period and Year
I-210 Corridor System Management Plan Executive Summary
Page 21 of 39
BOTTLENECK IDENTIFICATION AND CAUSALITY ANALYSIS
Exhibits ES-19 and ES-20 summarize the eastbound and westbound bottleneck locations the time period that each bottleneck is generally active and the causes of the each bottleneck Exhibits ES-21 and ES-22 are maps of the corridor showing these bottleneck locations for the AM and PM peak periods respectively
Major bottlenecks are the primary cause of congestion and lost productivity By definition a bottleneck is a condition where traffic demand exceeds the effective carrying capacity of the roadway In most cases the cause of a bottleneck is related to a sudden reduction in capacity such as a lane drop merging and weaving driver distractions a surge in demand or a combination of factors
The specific location and causality of each major I-210 bottleneck was verified by multiple field observations on separate weekdays throughout the summer fall and winter of 2009 Some bottleneck locations were videotaped to validate bottlenecks and to assist in micro-simulation model calibration
The detailed final report explains in detail the process and results of the bottleneck identification and causality analysis
I-210 Corridor System Management Plan Executive Summary
Page 22 of 39
Exhibit ES-19 I-210 Eastbound Bottleneck Locations
Abs CA Bottleneck
Location
Active
Period Causality Summary
AM PM
250 R250 Fair Oaks Heavy ramp merge
265 R265 Lake On-ramp Heavy ramp merge
286 R287 San Gabriel On-ramp Heavy ramp merge roadway curves
294 R294 Rosemead On-ramp Heavy consecutive ramp merge
330 R327 Huntington Interchange Heavy ramp merge roadway curves
366 R363 I-605 On-ramp traffic weaving with the off-ramp
400 R397 Azusa On-ramp Heavy ramp merge
408 R406 Citrus On-ramp Heavy ramp merge
450 R450 SR-57 On-ramp Heavy ramp merge and lane drop
Exhibit ES-20 I-210 Westbound Bottleneck Locations
Abs CA
Bottleneck
Location
Active
Period Causality Summary
AM PM
401 R398 Azusa On-ramp Consecutive ramp merge curves
368 R365 I-605 Off-ramp Consecutive ramp merge weaving
322 R319 Santa Anita On-ramp Heavy ramp merge roadway curves
307 R304 Baldwin On-ramp Heavy consecutive ramp merge
297 L297 Rosemead On-ramp Three consecutive ramp merges weaving
280 R281 Altadena On-ramp Heavy ramp merge
261 R261 Lake On-ramp Heavy ramp merge
Bottleneck Locations
reg --Bottleneck
Westbound
Eastbound
0 1 2
I bull I I I bull I I I Miles
HJOUAIIO fl _
I-210 Corridor System Management Plan Executive Summary
Page 23 of 39
Exhibit ES-21 I-210 Map of AM Bottleneck Locations
Bottleneck Locations
reg Bottleneck - Westbound - Eastbound
N 0 1 2
bull I I II II II I ll) Mles s
HJOUAIIO fl _
I-210 Corridor System Management Plan Executive Summary
Page 24 of 39
Exhibit ES-22 I-210 Map of PM Bottleneck Locations
I-210 Corridor System Management Plan Executive Summary
Page 25 of 39
SCENARIO DEVELOPMENT AND ANALYSIS
Fully understanding how a corridor performs and why it performs the way it does sets the foundation for evaluating potential solutions Several steps were required to develop and evaluate improvements including
diams Developing traffic models for 2006 base year and 2020 long-term demand diams Combining projects in a logical manner for modeling and testing diams Evaluating model outputs and summarizing results diams Conducting a benefit-cost assessment of scenarios
Traffic Model Development
The study team developed a traffic model using the VISSIM micro-simulation software It is important to note that micro-simulation models are complex to develop and calibrate for a large urban corridor However it is one of the only tools capable of providing a reasonable approximation of bottleneck formation and queue development Therefore such tools help quantify the impacts of operational strategies which traditional travel demand models cannot
The model was calibrated against 2006 conditions This was a resource intensive effort requiring several iterations of submittals and review cycles until the model reasonably matched bottleneck locations and relative severity Once calibration was approved a 2020 model was also developed based on SCAGrsquos travel demand model demand projections
These two models were used to evaluate different scenarios (combinations of projects) to quantify the associated congestion relief benefits and to compare total project costs against their benefits
Exhibit ES-23 depicts the network included in the model There were no parallel arterials modeled with the exception of arterials at interchanges All freeway interchanges were included as well as on-ramps and off-ramps
I-210 Corridor System Management Plan Executive Summary
Page 26 of 39
Exhibit ES-23 Micro-Simulation Model Network
I-210 Corridor System Management Plan Executive Summary
Page 27 of 39
Scenario Development Framework
The study team developed a framework for combining projects into scenarios It would be desirable to evaluate every possible combination of projects However this would have entailed thousands of model runs Instead the team combined projects based on a number of factors including
diams Projects that were fully constructed and completed from 2006 to 2010 were tested with both the 2006 and 2020 models
diams Short- and mid- term operational projects were grouped into scenarios and tested with the both the 2006 and 2020 models
diams Longer-range projects to be delivered by 2020 and beyond were used to develop scenarios to be tested with the 2020 model only
diams Alternative ramp closures were grouped into isolated scenarios (future scenarios did not build on top of these) and tested with both the 2006 and 2020 models
The study assumes that projects delivered before 2016 could reasonably be evaluated using the 2006 base year model The 2020 forecast year for the I-210 study was consistent with the SCAG 2020 regional travel demand model origin-destination matrices used to develop the 2008 Regional Transportation Plan (RTP) When SCAG updates its travel demand model and Regional Transportation Plan (RTP) it may wish to update the micro-simulation model with revised demand projections
Project lists used to develop scenarios were part from the Regional Transportation Improvement Program (RTIP) the RTP and other sources such as special studies Projects that do not directly affect mobility were eliminated For instance sound wall landscaping or minor arterial improvement projects were not evaluated since microshysimulation models cannot evaluate them
Scenario testing performed for the performed for the I-210 CSMP differed from traditional ldquoalternatives evaluationsrdquo done for Major Investment Studies (MIS) or Environmental Impact Reports (EIRs) An MIS or EIR focuses on identifying alternative solutions to address current or projected corridor problems so each alternative is evaluated separately and results among competing alternatives are compared resulting in a locally preferred alternative In contrast for the I-210 CSMP scenarios build on each other in that a scenario contains the projects from the previous scenario plus one or more projects as long as the incremental scenario results showed an acceptable level of performance improvement This incremental scenario evaluation approach is important since CSMPs are new and are often compared with alternatives studies
Exhibit ES-24 summarizes the approach used and scenarios tested and provides a
I-210 Corridor System Management Plan Executive Summary
Page 28 of 39
general description of the projects included in the 2006 and 2020 micro-simulation runs Most projects were tested for both the short- and long-term timeframes Each scenario tested was built upon prior scenarios except for Scenarios 7 and 8 which were ldquostand alonerdquo scenarios used to test alternative ramp closures Later scenarios build on Scenarios 5 and 6 and do not include the improvements tested in Scenarios 7 and 8 Enhanced incident management was tested in Scenarios 11 and 12 by comparing a simulated incident without and with enhanced incident management system Scenarios 13 and 14 are expected for the longer term and were tested only with the 2020 model
Exhibit ES-24 Micro-Simulation Modeling Approach
Short-Term Scenarios Long-Term Scenarios
Calibrated 2006 Base Case
Scenario 1 Expand Ramp-
Metering
Scenario 3 Scenario 1 +
Adv Ramp-Meter w
Queue Control
Scenario 5 Scenario 3 + aux lane striping and
ramp improvements
2020 Horizon Year
2006 Network 2020 OD Matrices
Scenario 7 Scenario 5 +
Ramp Closures
Scenario 2 Expand Ramp-
Metering
Scenario 4 Scenario 2 +
Adv Ramp-Meter w
Queue Control
Scenario 6 Scenario 4 + aux lane striping and
ramp improvements
Scenario 8 Scenario 6 +
Ramp Closures
Scenario 14 Scenario 13 + Lake
Ave Drop Ramp
Lane Addition
Scenario 9 Scenario 5+
On-Ramp amp Aux
lane improvements
Scenario 10 Scenario 6 +
On-Ramp amp Aux
lane improvements
Scenario 11 Incident with No
Incident
Management
Scenario 12 Incident With
Incident
Management
Scenario 13 Scenario 10 +
134210 IC
modification
Incident Management Scenarios
I-210 Corridor System Management Plan Executive Summary
Page 29 of 39
Scenario Evaluation Results
Exhibits ES-25 and ES-26 show the delay results for all the 2006 scenarios evaluated for the AM and PM peak periods respectively Exhibits ES-27 and ES-28 show the delay results for all the 2020 scenarios evaluated for the AM and PM peak periods respectively For each scenario the modeling team produced results by facility type (ie mainline HOV arterials and ramps) and vehicle type (SOV HOV trucks) as well as speed contour diagrams (discussed in more detail in the full technical CSMP) The study team scrutinized to ensure that they were consistent with general traffic engineering principles The following summarizes the findings related to the four exhibits
Exhibit ES-25 2006 AM Peak Micro-Simulation Delay Results by Scenario
De
lay
(Pe
ak
Pe
rio
d V
eh
icle
-Ho
urs
)
2006 Base Year S1 S3 S5 S7 S9 Scenario
18000
16000
14000
12000
10000
8000
6000
4000
2000
-
S1 Expand Ramp Metering
S3 Adv Ramp Metering
S5 Aux Lane Striping Ramp Improvs
S7 Ramp Closures
S9 On-Ramp amp Aux Lane Improvs
-2 -3 -3
-16 -20
HOV WB I-210 WB
HOV EB I-210 EB
Ramps Arterials
I-210 Corridor System Management Plan Executive Summary
Page 30 of 39
Exhibit ES-26 2006 PM Peak Micro-Simulation Delay Results by Scenario
18000
De
lay
(Pe
ak
Pe
rio
d V
eh
icle
-Ho
urs
)
16000
14000
12000
10000
8000
6000
4000
2000
-
S1 Expand Ramp Metering
S3 Adv Ramp Metering
HOV WB
I-210 WB
S5 Aux Lane Striping Ramp Improvs
S7 Ramp Closures
S9 On-Ramp amp Aux Lane Improvs
HOV EB
I-210 EB
Ramps
Arterials
-17
-11
-18
-18 -28
2006 Base Year S1 S3 S5 S7 S9 Scenario
Exhibit ES-27 2020 AM Peak Micro-Simulation Delay Results by Scenario
30000
De
lay
(Pe
ak
Pe
rio
d V
eh
icle
-Ho
urs
)
25000
20000
15000
10000
5000
S2 Expand Ramp Metering
S4 Adv Ramp Metering
S6 Aux Lane Striping Ramp Improvs
S8 Ramp Closures
HOV WB
I-210 WB
HOV EB
-8
-2 -8
-13 -12
S10 On-Ramp amp Aux Lane Improvs
S13 SR-134I-210 IC Modification
S14 Lake Ave Drop Ramp Lane Addition
I-210 EB
Ramps
Arterials
-11
-23
-
2020 S2 S4 S6 S8 S10 S13 S14 Horizon Scenario
I-210 Corridor System Management Plan Executive Summary
Page 31 of 39
Exhibit ES-28 2020 PM Peak Micro-Simulation Delay Results by Scenario D
ela
y(P
ea
k P
eri
od
Ve
hic
le-H
ou
rs)
30000
25000
20000
15000
10000
5000
-
S2 Expand Ramp Metering
S4 Adv Ramp Metering
S6 Aux Lane Striping Ramp Improvs
S8 Ramp Closures
HOV WB
I-210 WB
HOV EB
-14
S10 On-Ramp amp Aux Lane Improvs
S13 SR-134I-210 IC Modification
S14 Lake Ave Drop Ramp Lane Addition
I-210 EB
Ramps
Arterials
-2 -5 -3 -28
-3 -19
2020 S2 S4 S6 S8 S10 S13 S14 Horizon Scenario
Base Year and Do Minimum Horizon Year
Absent any physical improvements the modeling team estimates that by 2020 total delay (mainline HOV ramps and arterials) would double compared to 2006 (from a total of around 22000 vehicle-hours daily to just fewer than 45000 vehicle-hours) in the combined AM and PM peak
Scenarios 1 and 2 (Expand Ramp Metering)
Scenarios 1 and 2 test the only project on the corridor that was fully constructed and completed The project installed new connector metering at the SR-57 and I-605 to Ishy210 freeway connector ramps The project also widened various ramps removed various HOV meter bypasses and upgraded the ramp metering system
The 2006 model estimates that Scenario 1 would reduce delay on the corridor by around 17 percent (or 1600 daily vehicle-hours) in the PM peak period but only around two percent (or 200 vehicle-hours) in the AM peak period The biggest benefits occur in the PM eastbound direction from Rosemead On-Ramp to Huntington interchange (with a delay reduction of over 1000 vehicle-hours) as well as from I-605 to the Azusa On-Ramp (delay reduction of 500 vehicle-hours) for single occupant vehicles The
I-210 Corridor System Management Plan Executive Summary
Page 32 of 39
westbound reductions in freeway delay are largely offset by increased on-ramp delay mostly from new connector metering at SR-57 and I-605
The 2020 model estimates that Scenario 2 will reduce delay by around 8 percent in the AM peak and 14 percent in the PM peak for a combined total reduction of 5000 daily vehicle-hours The long-term improvements are less than the short-term improvements due to the increase in demand
Scenarios 3 and 4 (Advanced Ramp Metering)
Scenarios 3 and 4 build on Scenarios 1 and 2 by adding advanced ramp metering system such as dynamic or adaptive ramp metering system
The 2006 model shows that Scenario 3 would reduce delay by an additional 850 daily vehicle-hours (or 11 percent) in the PM peak with a marginal reduction in the AM peak period However in conjunction with Scenario 1 Scenario 3 reduces delay in total by over 600 vehicle-hours in the AM peak These results suggest that queue control provides additional benefits beyond SWARM
The 2020 model estimates that Scenario 4 will modestly reduce delay by about 2 percent in both the AM and PM peaks or a combined total of 800 daily vehicle-hours Again the benefits are lower in percentage terms due to the increase in demand
Note that there are various types of advanced ramp metering systems deployed around the world including System-wide Adaptive Ramp Metering System or SWARM tested recently in Los Angeles I-210 freeway corridor For the I-210 model the Asservissement Lineaire drsquoEntreacutee Autoroutiere (ALINEA system) was tested as proxy for any advanced ramp metering system as its algorithm for the model was readily available It is not necessarily recommended that ALINEA be deployed but rather some type of advanced ramp metering system that would produce similar if not better results
Scenarios 5 and 6 (Auxiliary Lane Striping Ramp Improvements)
Scenarios 5 and 6 build on Scenarios 3 and 4 that include several relatively lower-cost operational improvements that could be implemented by 2015
diams Building a westbound auxiliary lane from Santa Anita to Baldwin and an eastbound auxiliary lane from Santa Anita to Huntington
diams Extending a lane to Lincoln on the westbound I-210 connector
diams Connecting and converging the Altadena on-ramps into a single on-ramp
I-210 Corridor System Management Plan Executive Summary
Page 33 of 39
diams Connecting and converging the Santa Anita on-ramps into a single on-ramp
diams Connecting and converging the Irwindale on-ramps into a single on-ramp
diams Restriping to add a lane in the eastbound direction from San Dimas to Fruit
The 2006 model shows that Scenario 5 reduces delay by 3 percent (nearly 400 vehicleshyhours) in the AM peak and 18 percent (1200 vehicle-hours) in the PM peak The segment that experienced the largest improvement in the eastbound during the PM peak was from Rosemead to Huntington This segment experienced a 45 percent improvement in delay (from 2700 vehicle-hours to 1500 vehicle-hours) which is likely attributed to the eastbound auxiliary lane from Santa Anita to Huntington In the westbound direction the auxiliary lane from Santa Anita to Baldwin shifts some traffic downstream to cause increased congestion at Michillinda (ie bottleneck shift) during the westbound AM peak However the auxiliary lane helps reduce both queue length and queue duration for the Santa Anita bottleneck
The 2020 model estimates that Scenario 6 would reduce delay by 8 percent in the AM peak and 5 percent in the PM peak for a total reduction of 2500 daily vehicle-hours A reduction in PM delay is expected to occur mostly in the westbound direction
Scenarios 7 and 8 (Ramp Closures)
Scenarios 7 and 8 build on Scenarios 5 and 6 and test the closure of several ramps
diams Eastbound Marengo on-ramp and westbound Lake on-ramp with signalization of the eastbound I-210 off-ramp at Maple and improvement to alternate routes along Corson and Maple
diams Eastbound Mount Olive ramps
Note that subsequent scenarios are not built on top of these scenarios as these are isolated to test ramp closure alternatives
The 2006 model shows that Scenario 7 would reduce delay significantly by 16 percent in the AM peak and 18 percent in the PM peak for a total delay reduction of nearly 3000 daily vehicle-hours The delay reductions are significant on the mainline during the peak direction of travel ndash 1400 vehicle-hours in the westbound AM and 912 vehicleshyhours in the eastbound PM In the westbound direction and AM peak period the segment from Altadena to Lake experienced over an 85 percent decrease in congestion (from 860 to 120 vehicle-hours of delay) This is likely attributed to the closure of the westbound Lake on-ramp In the eastbound direction and PM peak period the segment from Huntington to I-605 experienced a delay reduction of over 70 percent (from 2200
I-210 Corridor System Management Plan Executive Summary
Page 34 of 39
vehicle-hours to 600 vehicle-hours) which is likely attributed to the closure of the Mount Olive ramp
The 2020 model also shows that Scenario 8 improved delay by 12 percent in the AM and 3 percent in the PM for a total delay reduction of almost 3000 daily vehicle-hours On the mainline facility delay also improved for each peak direction of travel ndash by 1600 daily vehicle-hours in the westbound AM and by 750 vehicle-hours in the eastbound PM Delay reductions in the non-peak direction were not as significant
Scenarios 9 and 10 (On-ramp and Aux Lane Improvements)
Scenarios 9 and 10 build on Scenarios 5 and 6 and test four operational improvements that can be implemented in the short to medium range
diams Modify the RosemeadMichillinda interchange and converge the westbound I-210 on-ramps
diams Modify the northside of the Baldwin interchange and eliminate the collectorshydistributor
diams Construct an eastbound auxiliary lane from Azusa to Citrus
diams Converge the eastbound Citrus on-ramps and add an auxiliary lane to Grand
The 2006 model estimates that Scenario 9 will reduce delay by 20 percent (or 2400 daily vehicle-hours) in the AM peak and 28 percent (or 1600 daily vehicle-hours) in the PM peak compared to Scenario 5 In both AM and PM peak period the eastbound direction experienced the largest reduction in delay
The 2020 model estimates that Scenario 10 will reduce delay by 13 percent (or 2500 vehicle-hours) in the AM peak and 28 percent in the PM peak (or 4800 vehicle-hours) compared to Scenario 6 Similar to the 2006 model the 2020 model shows that these improvements produced a greater reduction in delay in the eastbound direction than the westbound direction
Scenarios 11 and 12 (Enhanced Incident Management)
Two incident scenarios were tested on top of Scenario 10 to evaluate the non-recurrent delay reductions resulting from enhanced incident management strategies An enhanced incident management system would entail upgrading or enhancing the current Caltrans incident management system that includes deployment of intelligent transportation system (ITS) field devices central controlcommunications software communications medium (ie fiber optic lines) advanced traveler information system
I-210 Corridor System Management Plan Executive Summary
Page 35 of 39
andor freeway service patrol (FSP) program to reduce incident detection verification response and clearance times
In the first scenario Scenario 11 one collision incident with one lane closure was simulated in the westbound direction in the AM peak period model and one in the eastbound direction in the PM peak period model The incident simulation location and duration were selected based on review of the 2010 actual incident data at one of the high frequency locations The following are the Scenario details
diams Westbound AM peak period starting at 800 AM close mainline lane 2 for 40 minutes at absolute post mile 2612 (at Lake Avenue)
diams Eastbound PM peak period starting at 500 PM close mainline lane 2 for 50 minutes at absolute post mile 3207 (west of Santa Anita)
In the second scenario Scenario 12 the same collision incidents were simulated with a reduction in duration by 10 minutes in the westbound direction and by 12 minutes in the eastbound direction It is estimated based on actual incident management data analysis results provided by Caltrans that an enhanced incident management system could reduce a 35-minute incident by about 10 minutes This scenario represents a typical moderate level incident at one location during the peak period direction Data suggest that incidents vary significantly in terms of impact and duration Some incidents last hundreds of minutes some close multiple lanes and some occur at multiple locations simultaneously There are also numerous minor incidents lasting only a few minutes without lane closures that can result in congestion Many other incidents also occur during off-peak hours
Without enhanced incident management Scenario 11 produced an 8 percent increase in congestion in both peak periods over Scenario 10 an increase of over 2300 hours of vehicle delay With enhanced incident management Scenario 12 evaluation resulted in delay decrease by 2 percent in the AM peak and 3 percent in the PM peak against Scenario 11 results a reduction of nearly 750 vehicle-hours for improving the incident detection verification response and clearance time of one moderate level incident for both of the peak hours
Scenario 13 (SR-134I-210 Interchange Modification)
Scenario 13 tests an improvement to modify the SR-134I-210 interchange to provide a direct connection for vehicles to continue on I-210 with three lanes in each direction This improvement was tested with the 2020 model since it is not likely to be implemented in the short-term
I-210 Corridor System Management Plan Executive Summary
Page 36 of 39
The 2020 model estimates that delay would be reduced by 11 percent (or 1800 daily vehicle-hours) in the AM and 3 percent in the PM (320 daily vehicle-hours) compared to Scenario 10 The westbound mainline experienced the greatest reduction in delay in the AM peak from 9600 vehicle-hours to 8600 vehicle hours after the interchange modification
Scenario 14 (Westbound Drop Ramp and Eastbound Widening)
Scenario 14 builds on Scenario 13 and tests Lake Avenue drop ramp to westbound Ishy210 center lanes (one HOV lane and one mainline) and eastbound I-210 widening from Myrtle to I-605 This improvement was tested with the 2020 model
The 2020 model estimates that delay would be reduced by about 20 percent in the AM or 3400 vehicle-hours and 20 percent in the PM or 2300 vehicle-hours compared to Scenario 13 The mobility improvements are significant with the westbound drop ramp that reduces weaving between SR-134 and SR-210 destined traffic and with the eastbound capacity addition to I-605 off that moves the off-ramp traffic away from the mainline and provides more room for the mainline through traffic
Post Scenario 14 Conditions
By 2020 with the inclusion of all the projects tested the model reveals some residual congestion that remains to address with future improvements According to the model results the total remaining delay on the corridor is around 21000 daily vehicle-hours
Benefit-Cost Analysis
Following an in-depth review of model results by the study team and the SCAG technical committee the study team performed a benefit-cost analysis (BCA) for each scenario
Using the California Benefit-Cost Model (Cal-BC) developed on behalf of Caltrans by the study team benefits in three key areas were estimated travel time savings vehicle operating cost savings and emission reduction savings The benefits generated from this exercise are based solely on congestion relief related benefits However these results are conservative since there are other benefits not captured by this analysis including benefits from deploying bus rapid transit which will achieve other accessibility benefits
Project costs were developed from SCAG and Caltrans project planning and programming documents These costs include construction and support costs in current dollars The study team estimated costs for projects that did not have cost
I-210 Corridor System Management Plan Executive Summary
Page 37 of 39
estimates by reviewing similar completed projects A BC greater than one means that a scenarios projects return greater benefits than it costs to construct or implement It is important to consider the total benefits that a project brings For example a large capital expansion project can cost a great deal and have a low BC ratio but brings much higher absolute benefits to the I-210 users Exhibit ES-29 shows the benefit to cost ranges classified from low (with a BC of one to two) to very high (with a BC of over 10)
The benefit-cost results for the South Corridor scenarios are shown in Exhibit ES-29
Exhibit ES-29 I-210 Scenario BenefitCost (BC) Results
Scenario Scenario Description
BenefitCost Ranges
Low Medium Medium-High High Very High
lt1 1 to 2 2 to 5 5 to 10 gt10
12 Expand Ramp Metering 34 Advanced Ramp Metering 56 Aux Lane Striping Ramp Improvs 78 Ramp Closures
910 On-Ramp amp Aux Lane Improvs 13 SR-134I-210 IC Modification
The benefit-cost findings for each scenario are as follows
diams Scenarios 1 and 2 (ramp metering expansion) shows a high benefit-cost ratio of over ten The relatively high benefit-cost ratio is due to the low cost of expanding ramp metering ($235 million)
diams Scenarios 3 and 4 (advanced ramp metering) resulted in an incremental benefitshycost ratio of over ten This is relatively high as compared to that of typical transportation management system project
diams Scenarios 5 and 6 (operational improvements) produced a benefit-cost ratio of over five This is relatively consistent with other typical operational improvement projects The benefits are substantial At estimated total cost of about $44 million these projects produced benefits of over $233 million
diams Scenarios 7 and 8 tested the ramp closures at eastbound Marengo westbound Lake and eastbound Mount Olive These ramp closured produced an extremely high incremental benefit-cost ratio of over ten due to the relatively very low cost However this benefit-cost calculation does not account for any potential increase in delay on various local arterials because of detours from the closed ramps
diams Scenarios 9 and 10 also produced a relatively high benefit-cost ratio of over ten The four operational projects in these scenarios are collectively estimated to cost
I-210 Corridor System Management Plan Executive Summary
Page 38 of 39
under $30 million and provide a substantial and optimistic benefit of over $670 million
diams Scenario 13 tested the SR-134I-210 interchange modification This project produced a benefit-cost ratio of between one and two consistent with other typical capital expansion projects This project produced benefits of over $200 million at a rough-estimate cost of about $150 million
diams Scenario 14 tested the westbound center drop ramp from Lake Avenue interchange and eastbound lane addition from Myrtle to I-605 These projects produced a relatively high benefit-cost ratio of about 6 to one as compared to other capital improvement projects These two capital projects are unique in that they have specific operational improvement element that addresses major bottleneck locations For an estimated total combined cost of about $70 million the projected benefits exceed $420 million
CONCLUSIONS AND RECOMMENDATIONS
This section summarizes the conclusions and recommendations based on the analysis discussed in the previous section It is important to note that many of these conclusions are based primarily on the micro-simulation model results The model was developed based on the best data available at the time The study team reviewed the model results and believe that both the calibrated base year forecast year and scenario results are reasonable However Caltrans should always be cautious to make decisions based on modeling alone especially complex micro-simulation models
Based on the results the study team offers the following conclusions and recommendations
diams The combination of all scenarios significantly reduces overall congestion on the corridor Projected 2020 congestion after implementation of all scenarios is below 2006 levels in both the AM and PM peak period In the AM peak period the model projects total delay in 2020 after delivering all projects to be less than 11700 vehicle-hours compared to the 2006 base year delay of 13000 vehicleshyhours This represents a reduction of over 10 percent In the PM peak period the model projects total delay in 2020 after delivering all projects to be around 9500 hours compared to the 2006 base year delay of almost 9300 vehicle-hours This represents a slight reduction of 2 percent Clearly the scenarios deliver significant mobility benefits to the corridor Despite the growth in demand future 2020 congestion will be less than experienced in 2006
diams The completed ramp metering expansion project is expected to produce substantial mobility benefits of over $400 million Delay has been significantly reduced since 2006
I-210 Corridor System Management Plan Executive Summary
Page 39 of 39
diams Advanced ramp metering could provide additional mobility improvements by significantly reducing congestion and returning over $100 million in benefits
diams Ramp closures at Marengo Lake and Mount Olive as alternatives seem promising by reducing delay up to 3000 vehicle-hours per day and providing substantial benefits of $280 million at an extremely low cost
diams Operational improvements such as auxiliary lanes and ramp improvements could leverage on the ramp metering projects by making the corridor more efficient and productive that could result in additional mobility benefits of over $230 million
diams Additional capital improvements with specific operational elements to address weaving at major bottleneck locations could produce significant mobility benefits of over $420 million
diams Enhanced incident management system associated with Scenarios 11 and 12 to address non-recurrent congestion proved effective with a delay reduction of over 300 vehicle-hours for one modest level incident with a typical duration of 35 minutes reduced to 25 minutes With the I-210 corridor experiencing up to 2400 collisions per year this translates to a total annual delay savings of over 700000 vehicle-hours for the study corridor
diams The benefit-cost ratio of all scenarios combined is about 64 to 1 If all projects were delivered at current cost estimates the public would get over six dollars of benefits for each dollar expended In current dollars costs total to over $17 billion whereas the benefits are estimated to be over $20 billion
diams The projects also alleviate greenhouse gas (GHG) emissions by over 15 million tons over 20 years averaging over a 75000-ton reduction per year The emissions are estimated using data from the California Air Resources Board (CARB) EMFAC model
This is the first generation CSMP for the I-210 corridor It is important to stress that CSMPs should be updated on a regular basis This is particularly important since traffic conditions and patterns can differ from current projections After projects are delivered it is also useful to compare actual results with estimated ones in this document so that models can be further improved as appropriate
CSMPs or a variation thereof should become the normal course of business that is based on detailed performance assessments an in-depth understanding of the reasons for performance deterioration and an analytical framework that allows for evaluating complementary operational strategies that maximize the productivity of the current system

I-210 Corridor System Management Plan Executive Summary
Page ii
List of Exhibits
Exhibit ES-1 System Management Pyramid ________________________________________2 Exhibit ES-2 Los Angeles County I-210 CSMP Corridor Map __________________________5 Exhibit ES-3 Average Weekday Delay by Month (2005-2009) __________________________8 Exhibit ES-4 Mainline Lane Delay by Day of Week (2005-2009) ________________________9 Exhibit ES-5 HOV Lane Delay by Day of Week (2005-2009) ___________________________9 Exhibit ES-6 Eastbound Mainline Lanes Hourly Delay (2005-2009)_____________________10 Exhibit ES-7 Westbound Mainline Lanes Hourly Delay (2005-2009) ____________________11 Exhibit ES-8 Eastbound Mainline Lanes Travel Time by Hour (2005-2009)_______________12 Exhibit ES-9 Westbound Mainline Lanes Travel Time by Hour (2005-2009) ______________12 Exhibit ES-10 Eastbound HOV Lanes Travel Time by Hour (2005-2009) ________________13 Exhibit ES-11 Westbound HOV Lanes Travel Time by Hour (2005-2009) ________________13 Exhibit ES-12 Eastbound Mainline Lanes Travel Time Variability (2006)_________________15 Exhibit ES-13 Westbound Mainline Lanes Travel Time Variability (2006) ________________15 Exhibit ES-14 Eastbound I-210 Monthly Collisions (2004-2008) _______________________17 Exhibit ES-15 Westbound I-210 Monthly Collisions (2004-2008) _______________________17 Exhibit ES-16 Lost Productivity Illustrated ________________________________________19 Exhibit ES-17 Mainline Daily Equivalent Lost Lane-Miles by Direction and Period (2005-09) _20 Exhibit ES-18 HOV Daily Equivalent Lost Lane-Miles by Direction and Period (2005-09) ____20 Exhibit ES-19 I-210 Eastbound Bottleneck Locations________________________________22 Exhibit ES-20 I-210 Westbound Bottleneck Locations _______________________________22 Exhibit ES-21 I-210 Map of AM Bottleneck Locations _______________________________23 Exhibit ES-22 I-210 Map of PM Bottleneck Locations _______________________________24 Exhibit ES-23 Micro-Simulation Model Network ____________________________________26 Exhibit ES-24 Micro-Simulation Modeling Approach ________________________________28 Exhibit ES-25 2006 AM Peak Micro-Simulation Delay Results by Scenario_______________29 Exhibit ES-26 2006 PM Peak Micro-Simulation Delay Results by Scenario_______________30 Exhibit ES-27 2020 AM Peak Micro-Simulation Delay Results by Scenario_______________30 Exhibit ES-28 2020 PM Peak Micro-Simulation Delay Results by Scenario_______________31 Exhibit ES-29 I-210 Scenario BenefitCost (BC) Results ____________________________37
I-210 Corridor System Management Plan Executive Summary
Page 1 of 39
This document represents the Executive Summary for the Los Angeles I-210 Corridor
System Management Plan (CSMP) Final Report developed on behalf of the California Department of Transportation (Caltrans) by System Metrics Group Inc (SMG) A more detailed and larger technical CSMP is available upon request
This CSMP is the direct result of the November 2006 voter-approved Proposition 1B (The Highway Safety Traffic Reduction Air Quality and Port Security Bond Act of 2006) This ballot measure included a funding program deposited into a Corridor Mobility Improvement Account (CMIA)
To receive CMIA funds the California Transportation Commission (CTC) guidelines required that project nominations describe in a CSMP how mobility gains from funded corridor improvements would be maintained over time A CSMP therefore aims to define how corridors will be managed over time focusing on operational strategies in addition to the already funded expansion projects The goal is to get the most out of the existing system and maintain or improve corridor performance
The two documents ndash the Executive Summary and Final Report ndash represent the results of a study that included several key steps including
diams Stakeholder Involvement diams Corridor Performance Assessment diams Bottleneck Identification and Causality Analysis diams Scenario Development and Analysis diams Conclusions and Recommendations
Highlights of each of these steps are included in later sections of this summary
BACKGROUND
Los Angeles Countyrsquos transportation system faces numerous challenges mdash the demand for transportation keeps rising congestion is increasing and infrastructure is aging At the same time traditional transportation finance mechanisms are not able to provide adequate funding to keep expanding the infrastructure to keep up with demand Caltrans recognized that infrastructure expansion cannot keep pace with demand and adopted a system management philosophy to address current and future transportation needs in a comprehensive manner Exhibit ES-1 conceptually illustrates system management as a pyramid The exhibit shows that the transportation decision makers and practitioners at all jurisdictions must expand their ldquotool boxrdquo to include many complementary strategies with an increased focus on operational investments (shown in
I-210 Corridor System Management Plan Executive Summary
Page 2 of 39
the middle part of the pyramid) to complement the traditional system expansion investments
Exhibit ES-1 System Management Pyramid
This I-210 CSMP aims to define how Caltrans and its stakeholders will manage the corridor over time focusing on operational strategies in addition to already funded expansion projects The goal is to get the most out of the existing system and maintain andor improve its performance The CSMP fully respects previous decisions and complements them with additional promising investment suggestions where appropriate The CSMP development effort relies on complex analytical tools including micro simulation models to isolate deficiencies and quantify improvements for even relatively small operational investments
Caltrans develops integrated multimodal projects in balance with community goals plans and values Caltrans seeks and tries to address the safety and mobility needs of bicyclists pedestrians and transit users in all projects regardless of funding Bicycle pedestrian and transit travel is facilitated by creating complete streets beginning early in system planning and continuing through project delivery maintenance and operations Developing a network of complete streets requires collaboration among all Caltrans functional units and stakeholders As the first generation CSMP this report is more focused on reducing congestion and increasing mobility through capital and operational strategies The future CSMP work will further address pedestrian bicycle and transit components and seek to manage and improve the whole network as an interactive system
I-210 Corridor System Management Plan Executive Summary
Page 3 of 39
STAKEHOLDER INVOLVEMENT
A technical committee was formed and met on an almost monthly basis to discuss progress technical challenges data needs and preliminary conclusions for the I-210 CSMP The technical committee included representatives from Caltrans the Southern California Association of Governments (SCAG) the Los Angeles County Metropolitan Transportation Authority (Metro) as well as consultant team members
The I-210 CSMP involved other corridor stakeholders such as representatives from cities bordering I-210 Caltrans briefed these stakeholders at critical milestones
Feedback from the stakeholders helped solidify the findings of the performance assessment bottleneck identification and causality analysis given their intimate knowledge of local conditions Moreover stakeholders have provided support and insight and shared valuable field and project data without which this study would not have been possible The stakeholders included representatives from the following organizations
diams San Gabriel Valley Council of Governments diams Los Angeles County Department of Public Works diams City of Arcadia diams City of Azusa diams City of Claremont diams City of Duarte diams City of Glendora diams City of Irwindale diams City of LaVerne diams City of Monrovia diams City of Pasadena diams City of San Dimas
Caltrans would like to thank all of its partners for contributing to this CSMP development process In addition the CSMP development provided a venue for tighter coordination between Caltrans planning and operations professionals which is critical to the success of the system management approach
I-210 Corridor System Management Plan Executive Summary
Page 4 of 39
CORRIDOR PERFORMANCE ASSESSMENT
This section briefly describes the I-210 corridor and summarizes the results of the comprehensive corridor performance assessment conducted
Corridor Description
Exhibit ES-2 shows the location of the Los Angeles County I-210 CSMP corridor The corridor extends approximately 45 miles from the I-5 (Golden State Freeway) interchange in the San Fernando Valley to the SR-57 (Orange Freeway) interchange It traverses the cities of San Fernando La Canada Flintridge Pasadena Arcadia Monrovia Duarte Azusa and San Dimas The focus of the CSMP is the 20-mile congested urban section between SR-134 and SR-57
The corridor is a divided eight- to ten-lane freeway with a concrete median and an additional outside auxiliary lane along most of the corridor A single High Occupancy Vehicle (HOV) lane exists in each direction through the congestion urban area that is the focus of the study corridor (from the SR-134 interchange to the SR-57 interchange)
According to Caltrans traffic volumes reported for 2008 Los Angeles I-210 carries between 76000 and 298000 annual average daily traffic (AADT) The highest average daily traffic volume on the corridor occurs at the SR-134 interchange and the lowest volume occurs near the I-5 interchange
I-210 is also a Surface Transportation Assistance Act (STAA) route that allows large trucks to operate on the mainline lanes According to the latest truck volumes from Caltrans trucks comprise between four and ten percent of total daily traffic along the corridor Higher truck percentages occur west of the SR-134 Many of these trucks travel eastbound to the Inland Empire home to many warehouses and distribution centers The trucks traveling westbound are typically headed north to connect to the I-5 corridor and beyond
Major transit operations along the I-210 Corridor include Metro bus and light rail Metrolink commuter rail Foothill Transit Los Angeles City Department of Transportation Commuter Express and Pasadena Area Rapid Transit System (ARTS)
Metro operates ten parallel local bus or bus rapid transit (BRT) routes near the I-210 corridor It also operates the Metro Rail Gold Line that provides light-rail service in the center median of I-210 from downtown Los Angeles Union Station to the Sierra Madre Villa station
1-210 Corridor Study A1rea
0 I 2 3 4 5 MIEB
llllilllilllilllil l+j
I-210 Corridor System Management Plan Executive Summary
Page 5 of 39
Exhibit ES-2 Los Angeles County I-210 CSMP Corridor Map
I-210 Corridor System Management Plan Executive Summary
Page 6 of 39
Foothill Transit provides four bus lines that serve Pasadena the City of Arcadia and the City of Duarte The City of Los Angeles Department of Transportation also operates two commuter service lines that service the San Gabriel Valley Other transit agencies such as the Pasadena Rapid Transit System and the Glendale Bee operate local bus service between residential neighborhoods and business centers The Metrolink Antelope Valley Line provides commuter rail service from the Antelope Valley along the I-5 and San Fernando Road to downtown Los Angeles
There are various bike routes near I-210 but none that parallel the study corridor Most of the bike routes near the corridor are Class III Bike Paths (preferred bike routes on existing streets identified by signs only) These routes are concentrated between I-110 and SR-19 Due to the terrain and uphill climb there are few bike paths west of SRshy134
Several roadway improvements have been recently completed In preparation for System-Wide Adaptive Ramp Metering (SWARM) implementation various on-ramps between SR-134 and SR-57 were modified to enhance metering with traffic signals on the HOV bypass lanes Freeway connector on-ramps from I-605 and SR-57 have been modified to implement connector metering with traffic signals Closed-circuit television (CCTV) cameras and fiber optic communications were also added throughout the corridor
In addition to major employment trip-generating activity centers in Pasadena area there are 14 collegesuniversities six major medical centers the Rose Bowl stadium Santa Anita Park Horse Track Irwindale Speedway and various large shopping malls The Bob Hope Airport in Burbank is also a major traffic generator for the I-210 corridor
Corridor Performance Assessment
The I-210 CSMP focuses on four categories of performance measures
diams Mobility describes how quickly people and freight move along the corridor diams Reliability captures the relative predictability of travel time along the corridor diams Safety provides an overview of collisions along the corridor diams Productivity quantifies the degree to which traffic inefficiencies at bottlenecks or
hot spots reduce flow rates along the corridor
Mobility
Two primary measures quantify mobility in this report delay and travel time Each is estimated from field automatic detection data from the Performance Measurement System1 (PeMS) provided access to the historical freeway detection data needed to
1 Developed and maintained by Caltrans and accessible at pemsdotcagov
I-210 Corridor System Management Plan Executive Summary
Page 7 of 39
estimate the two mobility measures PeMS collects detector volume and occupancy data on the freeway which were used to estimate speed delay and travel time
Delay
Delay is defined as the observed travel time less the travel time at uncongested conditions and is reported as vehicle-hours of delay The assessment summarized the results for the five-year period between 2005 and 2009 Delays in this report were calculated as the difference in travel time between estimated speeds and free-flow conditions at 60 mph applied to the observed volume Exhibit ES-2 shows the average daily vehicle-hours of delay for each month between 2005 and 2009 for both mainline and high occupancy vehicle (HOV) lanes This exhibit reveals the following trends
diams Prior to 2007 the eastbound and westbound directions experienced similar delay levels on both the mainline and HOV lanes The HOV lanes comprise approximately 15 to 20 percent of the total estimated delay on the corridor
diams Congestion on the westbound mainline lanes experienced extreme peaking ndash likely caused by construction on the corridor between 2007 and 2008 The eastbound lanes did not experience much change in delay in 2007 but declined through 2008 The HOV facility did not experience significant change during this time
diams In 2009 the estimated delay on the eastbound mainline lanes increased dramatically while in contrast the westbound lanes declined sharply The HOV lane showed a similar trend with the eastbound HOV lane exceeding the delay in the westbound direction
I-210 Corridor System Management Plan Executive Summary
Page 8 of 39
Exhibit ES-3 Average Weekday Delay by Month (2005-2009) 16000
Av
era
ge
Da
ily
Ve
hic
le-H
ou
rs o
f D
ela
y (
6
0m
ph
)
15000
14000
13000
12000
11000
10000
9000
8000
7000
6000
5000
4000
3000
2000
1000
-
Ja
nF
eb
Ma
rA
pr
Ma
yJ
un
Ju
lA
ug
Se
pO
ct
No
vD
ec
Ja
nF
eb
Ma
rA
pr
Ma
yJ
un
Ju
lA
ug
Se
pO
ct
No
vD
ec
Ja
nF
eb
Ma
rA
pr
Ma
yJ
un
Ju
lA
ug
Se
pO
ct
No
vD
ec
Ja
nF
eb
Ma
rA
pr
Ma
yJ
un
Ju
lA
ug
Se
pO
ct
No
vD
ec
Ja
nF
eb
Ma
rA
pr
Ma
yJ
un
Ju
lA
ug
Se
pO
ct
No
vD
ec
2005 2006 2007 2008 2009
Eastbound ML
Westbound ML
Eastbound HOV
Westbound HOV
Month
The CSMP separates delay further into two components severe delay and other delay Severe delay is delay that occurs when speeds are below 35 mph and other delay occurs where speeds are between 35 and 60 mph Severe delay represents breakdown conditions ldquoOtherrdquo delay represents conditions approaching or leaving the breakdown congestion or areas that cause temporary slowdowns However it can also be a leading indicator of future severe delay
Exhibits ES-4 (Mainline lanes) and ES-5 (HOV lanes) show average severe and other daily vehicle-hours of delay by day of the week A few notes related to ES-4 and ES-5
diams Severe delay makes up about 70 percent of all weekday delay on the corridor in either the eastbound or the westbound direction Severe delay on Saturdays and SundaysHolidays tend to be under 70 percent while weekday severe delay averages around 75 percent of all delay As in Exhibit ES-3 HOV delays tend to range between 14 and 25 percent of total delay
diams Fridays in the eastbound direction experience the highest delays probably due to weekend travel The second highest delays generally occurred on Thursdays In the westbound direction the day of week trends are typical for urban commute corridors with the midweek days experiencing the highest delays with Monday and Friday showing slightly less congestion and the weekends showing much lower delays than during the week
Av
era
ge D
aily V
eh
icle
-Ho
urs
of
Dela
y (
60
mp
h)
Av
era
ge D
aily V
eh
icle
-Ho
urs
of
Dela
y (
60
mp
h)
I-210 Corridor System Management Plan Executive Summary
Page 9 of 39
Exhibit ES-4 Mainline Lane Delay by Day of Week (2005-2009) 16000
15000
14000
13000
12000
11000
10000
9000
8000
7000
6000
5000
4000
3000
2000
1000
-
Mainline Other Delay
Mainline Severe Delay M
on
T
ue
Wed
T
hu
F
riS
at
Su
n
Ho
lM
on
Tu
eW
ed
Th
uF
riS
at
Su
n
Ho
lM
on
Tu
eW
ed
Th
uF
riS
at
Su
n
Ho
lM
on
Tu
eW
ed
Th
uF
riS
at
Su
n
Ho
lM
on
Tu
eW
ed
Th
uF
riS
at
Su
n
Ho
lM
on
Tu
eW
ed
Th
uF
riS
at
Su
n
Ho
lM
on
Tu
eW
ed
Th
uF
riS
at
Su
n
Ho
lM
on
Tu
eW
ed
Th
uF
riS
at
Su
n
Ho
lM
on
Tu
eW
ed
Th
uF
riS
at
Su
n
Ho
lM
on
Tu
eW
ed
Th
uF
riS
at
Su
n
Ho
l
2005 2006 2007 2008 2009 2005 2006 2007 2008 2009
EASTBOUND WESTBOUND
Exhibit ES-5 HOV Lane Delay by Day of Week (2005-2009) 4000
3500
3000
2500
2000
1500
1000
500
-
Mo
nT
ue
Wed
Th
uF
riS
at
Su
n
Ho
lM
on
Tu
eW
ed
Th
uF
riS
at
Su
n
Ho
lM
on
Tu
eW
ed
Th
uF
riS
at
Su
n
Ho
lM
on
Tu
eW
ed
Th
uF
riS
at
Su
n
Ho
lM
on
Tu
eW
ed
Th
uF
riS
at
Su
n
Ho
lM
on
Tu
eW
ed
Th
uF
riS
at
Su
n
Ho
lM
on
Tu
eW
ed
Th
uF
riS
at
Su
n
Ho
lM
on
Tu
eW
ed
Th
uF
riS
at
Su
n
Ho
lM
on
Tu
eW
ed
Th
uF
riS
at
Su
n
Ho
lM
on
Tu
eW
ed
Th
uF
riS
at
Su
n
Ho
l
2005 2006 2007 2008 2009 2005 2006 2007 2008 2009
EASTBOUND WESTBOUND
Other Delay
Severe Delay
I-210 Corridor System Management Plan Executive Summary
Page 10 of 39
Exhibits ES-6 and ES-7 summarize average annual weekday delay by hour of the day over the five-year period for the mainline northbound and southbound lanes respectively These exhibits allow planners and decision makers to understand the trend in peak period delay spiking and peak period spreading by comparing the intensity and duration of the peak period congestion Note that the HOV lanes are not shown in this summary report since they follow similar peaking trends as the mainline lanes (the main technical report contains the HOV delay by hour results) A few notes on these two exhibits
diams The eastbound direction peaks in the PM peak period while the AM is the westbound peak AM peak hour is 700 AM while the PM peak period is 500 PM
diams In the eastbound PM direction congestion grew dramatically in 2009 while westbound AM congestion declined This is also evident in Exhibit ES-2 Eastbound delay between 2005 and 2008 remained relatively constant at about 1750 vehicle-hours during the 500 PM peak hour before increasing in 2009 to about 2100 vehicle-hours
diams Westbound AM congestion declined in 2009 after two years of dramatic growth between 2007 and 2008 In 2009 the AM peak period also shrank by approximately one-half hour and started at approximately 530 AM whereas from 2005 to 2008 the peak period started around 500 AM
Exhibit ES-6 Eastbound Mainline Lanes Hourly Delay (2005-2009)
0
250
500
750
1000
1250
1500
1750
2000
2250
2500
Ave
rag
e D
ail
y V
eh
icle
Ho
urs
of
Dela
y (
60
mp
h) 2009 Weekday
2008 Weekday
2007 Weekday
2006 Weekday
2005 Weekday
00
0
10
0
20
0
30
0
40
0
50
0
60
0
70
0
80
0
90
0
100
0
110
0
120
0
130
0
140
0
150
0
160
0
170
0
180
0
190
0
200
0
210
0
220
0
230
0
Hour of the Day
I-210 Corridor System Management Plan Executive Summary
Page 11 of 39
Exhibit ES-7 Westbound Mainline Lanes Hourly Delay (2005-2009)
0
250
500
750
1000
1250
1500
1750
2000
2250
2500
Ave
rag
e D
ail
y V
eh
icle
Ho
urs
of
Dela
y (
60m
ph
) 2009 Weekday
2008 Weekday
2007 Weekday
2006 Weekday
2005 Weekday
00
0
10
0
20
0
30
0
40
0
50
0
60
0
70
0
80
0
90
0
100
0
110
0
120
0
130
0
140
0
150
0
160
0
170
0
180
0
190
0
200
0
210
0
220
0
230
0
Hour of the Day
Travel Time
The travel time performance measure represents the average time it takes for a vehicle to travel between SR-134 and SR-57 a distance of approximately 20 miles
Exhibits ES-8 and ES-9 summarize mainline estimated average weekday travel times by hour of day for the 2005-2009 five-year period Exhibits ES-10 and ES-11 show the same results for the HOV facility Similar to delay travel times increased in 2009 in the eastbound PM direction and time but decreased in the westbound AM commute period
In the mainline lanes the eastbound PM peak hour (500 PM) travel time grew from 40 minutes in 2008 to 44 minutes in 2009 In the westbound AM peak hour (700 AM) the opposite trend occurred with travel times dropping from a 41 minute average in 2008 to around 36 minutes in 2009
A similar trend occurred for the HOV lanes except that 2005 was the worst year in terms of travel times
Tra
ve
l T
ime
(m
inu
tes
) T
rav
el
Tim
e (
min
ute
s)
45
40
35
30
25
20
15
10
5
0
45
40
35
30
25
20
15
10
5
0
I-210 Corridor System Management Plan Executive Summary
Page 12 of 39
Exhibit ES-8 Eastbound Mainline Lanes Travel Time by Hour (2005-2009) 50
2009 Average Travel Time
2008 Average Travel Time
2007 Average Travel Time
2006 Average Travel Time
2005 Average Travel Time
Travel Time 60mph
Travel Time 35mph
Hour of the Day
00
0
10
0
20
0
30
0
40
0
50
0
60
0
70
0
80
0
90
0
100
0
110
0
120
0
130
0
140
0
150
0
160
0
170
0
180
0
190
0
200
0
210
0
220
0
Hour of the Day
Exhibit ES-9 Westbound Mainline Lanes Travel Time by Hour (2005-2009) 50
2009 Average Travel Time
2008 Average Travel Time
2007 Average Travel Time
2006 Average Travel Time
2005 Average Travel Time
Travel Time 60mph
Travel Time 35mph
00
0
10
0
20
0
30
0
40
0
50
0
60
0
70
0
80
0
90
0
10
00
11
00
12
00
13
00
14
00
15
00
16
00
17
00
18
00
19
00
20
00
21
00
22
00
230
0
23
00
Tra
ve
l T
ime
(m
inu
tes
) T
rav
el
Tim
e (
min
ute
s)
45
40
35
30
25
20
15
10
5
0
45
40
35
30
25
20
15
10
5
0
I-210 Corridor System Management Plan Executive Summary
Page 13 of 39
Exhibit ES-10 Eastbound HOV Lanes Travel Time by Hour (2005-2009) 50
2009 Average Travel Time
2008 Average Travel Time
2007 Average Travel Time
2006 Average Travel Time
2005 Average Travel Time
Travel Time 60mph
Travel Time 35mph
Hour of the Day
00
0
10
0
20
0
30
0
40
0
50
0
60
0
70
0
80
0
90
0
100
0
110
0
120
0
130
0
140
0
150
0
160
0
170
0
180
0
190
0
200
0
210
0
220
0
Hour of the Day
Exhibit ES-11 Westbound HOV Lanes Travel Time by Hour (2005-2009) 50
2009 Average Travel Time
2008 Average Travel Time
2007 Average Travel Time
2006 Average Travel Time
2005 Average Travel Time
Travel Time 60mph
Travel Time 35mph
00
0
10
0
20
0
30
0
40
0
50
0
60
0
70
0
80
0
90
0
100
0
110
0
120
0
130
0
140
0
150
0
160
0
170
0
180
0
190
0
200
0
210
0
220
0
230
0
230
0
I-210 Corridor System Management Plan Executive Summary
Page 14 of 39
Reliability
Reliability captures the degree of predictability in travel time Reliability focuses on how travel time varies from day to day and reflects the impacts of accidents incidents weather and special events Improving reliability is an important goal for transportation agencies and efforts to accomplish this include incident management traveler information and special event planning
To measure reliability the CSMP used the ldquobuffer indexrdquo which reflects the additional time required (over and beyond the average) to ensure an on-time arrival 95 percent of the time In other words if a person must be on time 95 days out of 100 (or 19 out of 20 workdays per month) then that person must add additional time to their average expected travel time to ensure an on-time arrival That additional time is the buffer time Severe events such as collisions could cause longer travel times but the 95th percentile represents a balance between days with extreme events (eg major accidents) and other more ldquotypicalrdquo travel days
Exhibits ES-12 and ES-13 show the estimated mainline lane travel time variability along I-210 on non-holiday weekdays for 2006 in the eastbound and westbound directions respectively The main report shows the buffer index for the years 2005-2009 for both mainline and HOV lanes but this Executive Summary reports only the data for the year 2006 for mainlines since that year was used as the base year for modeling
The following observations on the reliability results are worth noting
bull In 2006 in the eastbound direction 500 PM had the highest estimated average travel time at approximately 41 minutes and the highest estimated buffer index time of 15 minutes for a buffer index of 33 percent In other words to arrive on time 95 percent of the time a commuter would need to leave for work 56 minutes before the start time to travel the entire length of the I-210 study corridor
bull The westbound direction the 700 AM had the estimated average travel time of 39 minutes in 2006 with a buffer time of 15 minutes for a buffer index of 38 percent
70
65
60
55
50
45
40
35
30
25
20
15
10
5
0
70
65
60
55
50
45
40
35
30
25
20
15
10
5
0
Average Travel Time
Travel Time Variability (95th Percentile)
Travel Time at 60mph
Travel Time at 35mph
TIME OF DAY
Exhibit ES-13 Westbound Mainline Lanes Travel Time Variability (2006)
75
TIME OF DAY
Average Travel Time
Travel Time Variability (95th Percentile)
Travel Time at 60mph
Travel Time at 35mph
Exhibit ES-12 Eastbound Mainline Lanes Travel Time Variability (2006)
75
I-210 Corridor System Management Plan Executive Summary
Page 15 of 39
TR
AV
EL
TIM
E (
MIN
)
00
000
0
10
010
0
TR
AV
EL
TIM
E (
MIN
)
20
020
0
30
030
0
40
040
0
50
050
0
60
060
0
70
070
0
80
080
0
90
090
0
100
01
00
0
110
01
10
0
120
01
20
0
130
01
30
0
140
01
40
0
150
01
50
0
160
01
60
0
170
01
70
0
180
01
80
0
190
01
90
0
200
02
00
0
210
02
10
0
220
02
20
0
230
02
30
0
00
0
00
0
I-210 Corridor System Management Plan Executive Summary
Page 16 of 39
Safety
The adopted performance measures to assess safety involve the number of accidents and the accident rates computed from the Caltrans Traffic Accident Surveillance and Analysis System (TASAS) TASAS is a traffic records system containing an accident database linked to a highway database The highway database contains descriptive elements of highway segments intersections and ramps access control traffic volumes and other data TASAS contains specific data for accidents on State highways Accidents on non-State highways are not included (eg local streets and roads)
The safety assessment in this report intends to characterize the overall accident history and trends in the corridor and to highlight notable accident concentration locations or patterns that are readily apparent This report does not intend to supplant more detailed safety investigations routinely performed by Caltrans staff
Exhibits ES-14 and ES-15 show the I-210 total number of eastbound and westbound accidents by month respectively For the accident analysis the corridor is split in half the ldquoless urbanrdquo western half of the corridor from I-5 (postmile 0) in Sylmar to SR-134 in Pasadena (postmile R2200) and the ldquomore urbanrdquo eastern half from SR-134 to SR-57 (postmile R45) in San Dimas The latest available TASAS data from PeMS is to December 30 2008 Accidents are reported for the study corridor and not separated by mainline and HOV facility The exhibits summarize the latest available three-year data from January 1 2006 through December 31 2008
Both the eastbound and westbound directions have similar accident profiles with the more urbanized eastern half of the corridor (postmile R22 to R45) experiencing nearly 45 times as many accidents as the western half (PM 0 to R22) The eastbound (Exhibit ES-13) direction has around 79 accidents on average per month in the more-urbanized section and just fewer than 18 accidents in the less-urbanized section
The westbound direction has just fewer than 78 accidents on average per month in the more-urbanized section and just fewer than 18 in the less-urbanized section This is very similar to the eastbound direction
Nu
mb
er
of
Ac
cid
en
ts
Nu
mb
er
of
Accid
en
ts
I-210 Corridor System Management Plan Executive Summary
Page 17 of 39
Exhibit ES-14 Eastbound I-210 Monthly Collisions (2004-2008) 120
110
100
90
80
70
60
50
40
30
20
10
0
Jan
Feb
Mar
Ap
rM
ay
Ju
nJu
lA
ug
Sep
Oct
No
vD
ec
Jan
Feb
Mar
Ap
rM
ay
Ju
nJu
lA
ug
Sep
Oct
No
vD
ec
Jan
Feb
Mar
Ap
rM
ay
Ju
nJu
lA
ug
Sep
Oct
No
vD
ec
Jan
Feb
Mar
Ap
rM
ay
Ju
nJu
lA
ug
Sep
Oct
No
vD
ec
Jan
Feb
Mar
Ap
rM
ay
Ju
nJu
lA
ug
Sep
Oct
No
vD
ec
2004 2005 2006 2007 2008
Less Urbanized Western Section (I-5 to SR-134)
More Urbanized Eastern Section (SR-134 to SR-57)
110
100
90
80
70
60
50
40
30
20
10
0
Exhibit ES-15 Westbound I-210 Monthly Collisions (2004-2008) 120
Jan
Feb
Mar
Ap
rM
ay
Ju
nJu
lA
ug
Sep
Oct
No
vD
ec
Jan
Feb
Mar
Ap
rM
ay
Ju
nJu
lA
ug
Sep
Oct
No
vD
ec
Jan
Feb
Mar
Ap
rM
ay
Ju
nJu
lA
ug
Sep
Oct
No
vD
ec
Jan
Feb
Mar
Ap
rM
ay
Ju
nJu
lA
ug
Sep
Oct
No
vD
ec
Jan
Feb
Mar
Ap
rM
ay
Ju
nJu
lA
ug
Sep
Oct
No
vD
ec
2004 2005 2006 2007 2008
Less Urbanized Western Section (I-5 to SR-134)
More Urbanized Eastern Section (SR-134 to SR-57)
I-210 Corridor System Management Plan Executive Summary
Page 18 of 39
Productivity
Productivity is a system efficiency measure used to analyze the throughput of the corridor during congested conditions Restoring lost productivity is one focus area of CSMPs
Exhibit ES-16 illustrates how congestion leads to lost productivity The exhibit uses observed I-210 data from sensors for a typical spring 2010 afternoon peak period (Thursday May 6 2010) It shows speeds (red line) and flow rates (blue line) on eastbound I-210 at Huntington Drive one of the most congested locations on the corridor
Flow rates (measured as vehicle-per-hour-per-lane or ldquovphplrdquo) at Huntington Drive averaged around 1800 vphpl between 200 PM and 300 PM Once volumes approach a maximum flow rate of around 2000 vphl traffic becomes unstable Any additional merging or weaving traffic breaks down and speeds can rapidly plummet to below 35 mph In essence every incremental merge takes up two spots on the freeway for a short time However since the volume is close to the capacity these merges lead to queues Moreover rather than accommodating the same number of vehicles flow rates also drop and vehicles back up creating bottlenecks and associated congestion
At the location shown in Exhibit ES-16 throughput drops by over 30 percent on average during the peak period (from over 1800 to around 1200 vphpl) This five-lane road therefore operates as if lost 30 percent capacity when demand is at its highest Stated differently just when the corridor needed the most capacity it performed in the least productive manner and effectively lost lanes This loss in throughput can be aggregated and presented as ldquoEquivalent Lost-Lane-Milesrdquo
I-210 Corridor System Management Plan Executive Summary
Page 19 of 39
Exhibit ES-16 Lost Productivity Illustrated
70 2000
65
60 1750
50
55 1500
SP
EE
D
45 1250
40
35 1000
30 Speed lt35mph
750 25
20 500 I-210 EB
15 Los Angeles County Huntington
10 PM=3338 250
May 6 2010 5 VDS ID 761141
0 -
FL
OW
RA
TE
(VP
HP
L)
140
0
143
0
150
0
153
0
160
0
163
0
170
0
173
0
180
0
183
0
190
0
193
0
TIME The estimated average non-holiday weekday lost lane-miles by period and year on Ishy210 are shown Exhibits ES-17 (mainline) and ES-18 (HOV) A few notes on these two exhibits
diams The trends in the productivity losses are comparable to the delay trends The largest productivity losses occurred in the eastbound direction during the PM peak hours which is the direction and time period that experienced the most congestion
diams On the mainline facility the westbound direction experienced nearly as high productivity loses during the AM peak period
diams On the HOV lanes a greater productivity loss in the eastbound peak period is more evident
Operational strategies are critical to recovering such productivity losses These strategies include building new or extending auxiliary lanes developing more aggressive ramp metering strategies without negatively influencing the arterial network and improving incident clearance times
I-210 Corridor System Management Plan Executive Summary
Page 20 of 39
Exhibit ES-17 Mainline Daily Equivalent Lost Lane-Miles by Direction and Period (2005-09)
-
10
20
30
40
50
60
70
80
90
100
110
120
130
140
150
160
2005 2006 2007 2008 2009 2005 2006 2007 2008 2009 2005 2006 2007 2008 2009 2005 2006 2007 2008 2009
Eastbound
Westbound
AM PM Midday Night Time Period and Year
Daily
Eq
uiv
ale
nt
Lost
Lan
e-M
iles
Exhibit ES-18 HOV Daily Equivalent Lost Lane-Miles by Direction and Period (2005-09)
-
10
20
30
40
2005 2006 2007 2008 2009 2005 2006 2007 2008 2009 2005 2006 2007 2008 2009 2005 2006 2007 2008 2009
Eastbound
Westbound
AM Midday PM Night
Daily
Eq
uiv
ale
nt
Lost
Lan
e-M
iles
Time Period and Year
I-210 Corridor System Management Plan Executive Summary
Page 21 of 39
BOTTLENECK IDENTIFICATION AND CAUSALITY ANALYSIS
Exhibits ES-19 and ES-20 summarize the eastbound and westbound bottleneck locations the time period that each bottleneck is generally active and the causes of the each bottleneck Exhibits ES-21 and ES-22 are maps of the corridor showing these bottleneck locations for the AM and PM peak periods respectively
Major bottlenecks are the primary cause of congestion and lost productivity By definition a bottleneck is a condition where traffic demand exceeds the effective carrying capacity of the roadway In most cases the cause of a bottleneck is related to a sudden reduction in capacity such as a lane drop merging and weaving driver distractions a surge in demand or a combination of factors
The specific location and causality of each major I-210 bottleneck was verified by multiple field observations on separate weekdays throughout the summer fall and winter of 2009 Some bottleneck locations were videotaped to validate bottlenecks and to assist in micro-simulation model calibration
The detailed final report explains in detail the process and results of the bottleneck identification and causality analysis
I-210 Corridor System Management Plan Executive Summary
Page 22 of 39
Exhibit ES-19 I-210 Eastbound Bottleneck Locations
Abs CA Bottleneck
Location
Active
Period Causality Summary
AM PM
250 R250 Fair Oaks Heavy ramp merge
265 R265 Lake On-ramp Heavy ramp merge
286 R287 San Gabriel On-ramp Heavy ramp merge roadway curves
294 R294 Rosemead On-ramp Heavy consecutive ramp merge
330 R327 Huntington Interchange Heavy ramp merge roadway curves
366 R363 I-605 On-ramp traffic weaving with the off-ramp
400 R397 Azusa On-ramp Heavy ramp merge
408 R406 Citrus On-ramp Heavy ramp merge
450 R450 SR-57 On-ramp Heavy ramp merge and lane drop
Exhibit ES-20 I-210 Westbound Bottleneck Locations
Abs CA
Bottleneck
Location
Active
Period Causality Summary
AM PM
401 R398 Azusa On-ramp Consecutive ramp merge curves
368 R365 I-605 Off-ramp Consecutive ramp merge weaving
322 R319 Santa Anita On-ramp Heavy ramp merge roadway curves
307 R304 Baldwin On-ramp Heavy consecutive ramp merge
297 L297 Rosemead On-ramp Three consecutive ramp merges weaving
280 R281 Altadena On-ramp Heavy ramp merge
261 R261 Lake On-ramp Heavy ramp merge
Bottleneck Locations
reg --Bottleneck
Westbound
Eastbound
0 1 2
I bull I I I bull I I I Miles
HJOUAIIO fl _
I-210 Corridor System Management Plan Executive Summary
Page 23 of 39
Exhibit ES-21 I-210 Map of AM Bottleneck Locations
Bottleneck Locations
reg Bottleneck - Westbound - Eastbound
N 0 1 2
bull I I II II II I ll) Mles s
HJOUAIIO fl _
I-210 Corridor System Management Plan Executive Summary
Page 24 of 39
Exhibit ES-22 I-210 Map of PM Bottleneck Locations
I-210 Corridor System Management Plan Executive Summary
Page 25 of 39
SCENARIO DEVELOPMENT AND ANALYSIS
Fully understanding how a corridor performs and why it performs the way it does sets the foundation for evaluating potential solutions Several steps were required to develop and evaluate improvements including
diams Developing traffic models for 2006 base year and 2020 long-term demand diams Combining projects in a logical manner for modeling and testing diams Evaluating model outputs and summarizing results diams Conducting a benefit-cost assessment of scenarios
Traffic Model Development
The study team developed a traffic model using the VISSIM micro-simulation software It is important to note that micro-simulation models are complex to develop and calibrate for a large urban corridor However it is one of the only tools capable of providing a reasonable approximation of bottleneck formation and queue development Therefore such tools help quantify the impacts of operational strategies which traditional travel demand models cannot
The model was calibrated against 2006 conditions This was a resource intensive effort requiring several iterations of submittals and review cycles until the model reasonably matched bottleneck locations and relative severity Once calibration was approved a 2020 model was also developed based on SCAGrsquos travel demand model demand projections
These two models were used to evaluate different scenarios (combinations of projects) to quantify the associated congestion relief benefits and to compare total project costs against their benefits
Exhibit ES-23 depicts the network included in the model There were no parallel arterials modeled with the exception of arterials at interchanges All freeway interchanges were included as well as on-ramps and off-ramps
I-210 Corridor System Management Plan Executive Summary
Page 26 of 39
Exhibit ES-23 Micro-Simulation Model Network
I-210 Corridor System Management Plan Executive Summary
Page 27 of 39
Scenario Development Framework
The study team developed a framework for combining projects into scenarios It would be desirable to evaluate every possible combination of projects However this would have entailed thousands of model runs Instead the team combined projects based on a number of factors including
diams Projects that were fully constructed and completed from 2006 to 2010 were tested with both the 2006 and 2020 models
diams Short- and mid- term operational projects were grouped into scenarios and tested with the both the 2006 and 2020 models
diams Longer-range projects to be delivered by 2020 and beyond were used to develop scenarios to be tested with the 2020 model only
diams Alternative ramp closures were grouped into isolated scenarios (future scenarios did not build on top of these) and tested with both the 2006 and 2020 models
The study assumes that projects delivered before 2016 could reasonably be evaluated using the 2006 base year model The 2020 forecast year for the I-210 study was consistent with the SCAG 2020 regional travel demand model origin-destination matrices used to develop the 2008 Regional Transportation Plan (RTP) When SCAG updates its travel demand model and Regional Transportation Plan (RTP) it may wish to update the micro-simulation model with revised demand projections
Project lists used to develop scenarios were part from the Regional Transportation Improvement Program (RTIP) the RTP and other sources such as special studies Projects that do not directly affect mobility were eliminated For instance sound wall landscaping or minor arterial improvement projects were not evaluated since microshysimulation models cannot evaluate them
Scenario testing performed for the performed for the I-210 CSMP differed from traditional ldquoalternatives evaluationsrdquo done for Major Investment Studies (MIS) or Environmental Impact Reports (EIRs) An MIS or EIR focuses on identifying alternative solutions to address current or projected corridor problems so each alternative is evaluated separately and results among competing alternatives are compared resulting in a locally preferred alternative In contrast for the I-210 CSMP scenarios build on each other in that a scenario contains the projects from the previous scenario plus one or more projects as long as the incremental scenario results showed an acceptable level of performance improvement This incremental scenario evaluation approach is important since CSMPs are new and are often compared with alternatives studies
Exhibit ES-24 summarizes the approach used and scenarios tested and provides a
I-210 Corridor System Management Plan Executive Summary
Page 28 of 39
general description of the projects included in the 2006 and 2020 micro-simulation runs Most projects were tested for both the short- and long-term timeframes Each scenario tested was built upon prior scenarios except for Scenarios 7 and 8 which were ldquostand alonerdquo scenarios used to test alternative ramp closures Later scenarios build on Scenarios 5 and 6 and do not include the improvements tested in Scenarios 7 and 8 Enhanced incident management was tested in Scenarios 11 and 12 by comparing a simulated incident without and with enhanced incident management system Scenarios 13 and 14 are expected for the longer term and were tested only with the 2020 model
Exhibit ES-24 Micro-Simulation Modeling Approach
Short-Term Scenarios Long-Term Scenarios
Calibrated 2006 Base Case
Scenario 1 Expand Ramp-
Metering
Scenario 3 Scenario 1 +
Adv Ramp-Meter w
Queue Control
Scenario 5 Scenario 3 + aux lane striping and
ramp improvements
2020 Horizon Year
2006 Network 2020 OD Matrices
Scenario 7 Scenario 5 +
Ramp Closures
Scenario 2 Expand Ramp-
Metering
Scenario 4 Scenario 2 +
Adv Ramp-Meter w
Queue Control
Scenario 6 Scenario 4 + aux lane striping and
ramp improvements
Scenario 8 Scenario 6 +
Ramp Closures
Scenario 14 Scenario 13 + Lake
Ave Drop Ramp
Lane Addition
Scenario 9 Scenario 5+
On-Ramp amp Aux
lane improvements
Scenario 10 Scenario 6 +
On-Ramp amp Aux
lane improvements
Scenario 11 Incident with No
Incident
Management
Scenario 12 Incident With
Incident
Management
Scenario 13 Scenario 10 +
134210 IC
modification
Incident Management Scenarios
I-210 Corridor System Management Plan Executive Summary
Page 29 of 39
Scenario Evaluation Results
Exhibits ES-25 and ES-26 show the delay results for all the 2006 scenarios evaluated for the AM and PM peak periods respectively Exhibits ES-27 and ES-28 show the delay results for all the 2020 scenarios evaluated for the AM and PM peak periods respectively For each scenario the modeling team produced results by facility type (ie mainline HOV arterials and ramps) and vehicle type (SOV HOV trucks) as well as speed contour diagrams (discussed in more detail in the full technical CSMP) The study team scrutinized to ensure that they were consistent with general traffic engineering principles The following summarizes the findings related to the four exhibits
Exhibit ES-25 2006 AM Peak Micro-Simulation Delay Results by Scenario
De
lay
(Pe
ak
Pe
rio
d V
eh
icle
-Ho
urs
)
2006 Base Year S1 S3 S5 S7 S9 Scenario
18000
16000
14000
12000
10000
8000
6000
4000
2000
-
S1 Expand Ramp Metering
S3 Adv Ramp Metering
S5 Aux Lane Striping Ramp Improvs
S7 Ramp Closures
S9 On-Ramp amp Aux Lane Improvs
-2 -3 -3
-16 -20
HOV WB I-210 WB
HOV EB I-210 EB
Ramps Arterials
I-210 Corridor System Management Plan Executive Summary
Page 30 of 39
Exhibit ES-26 2006 PM Peak Micro-Simulation Delay Results by Scenario
18000
De
lay
(Pe
ak
Pe
rio
d V
eh
icle
-Ho
urs
)
16000
14000
12000
10000
8000
6000
4000
2000
-
S1 Expand Ramp Metering
S3 Adv Ramp Metering
HOV WB
I-210 WB
S5 Aux Lane Striping Ramp Improvs
S7 Ramp Closures
S9 On-Ramp amp Aux Lane Improvs
HOV EB
I-210 EB
Ramps
Arterials
-17
-11
-18
-18 -28
2006 Base Year S1 S3 S5 S7 S9 Scenario
Exhibit ES-27 2020 AM Peak Micro-Simulation Delay Results by Scenario
30000
De
lay
(Pe
ak
Pe
rio
d V
eh
icle
-Ho
urs
)
25000
20000
15000
10000
5000
S2 Expand Ramp Metering
S4 Adv Ramp Metering
S6 Aux Lane Striping Ramp Improvs
S8 Ramp Closures
HOV WB
I-210 WB
HOV EB
-8
-2 -8
-13 -12
S10 On-Ramp amp Aux Lane Improvs
S13 SR-134I-210 IC Modification
S14 Lake Ave Drop Ramp Lane Addition
I-210 EB
Ramps
Arterials
-11
-23
-
2020 S2 S4 S6 S8 S10 S13 S14 Horizon Scenario
I-210 Corridor System Management Plan Executive Summary
Page 31 of 39
Exhibit ES-28 2020 PM Peak Micro-Simulation Delay Results by Scenario D
ela
y(P
ea
k P
eri
od
Ve
hic
le-H
ou
rs)
30000
25000
20000
15000
10000
5000
-
S2 Expand Ramp Metering
S4 Adv Ramp Metering
S6 Aux Lane Striping Ramp Improvs
S8 Ramp Closures
HOV WB
I-210 WB
HOV EB
-14
S10 On-Ramp amp Aux Lane Improvs
S13 SR-134I-210 IC Modification
S14 Lake Ave Drop Ramp Lane Addition
I-210 EB
Ramps
Arterials
-2 -5 -3 -28
-3 -19
2020 S2 S4 S6 S8 S10 S13 S14 Horizon Scenario
Base Year and Do Minimum Horizon Year
Absent any physical improvements the modeling team estimates that by 2020 total delay (mainline HOV ramps and arterials) would double compared to 2006 (from a total of around 22000 vehicle-hours daily to just fewer than 45000 vehicle-hours) in the combined AM and PM peak
Scenarios 1 and 2 (Expand Ramp Metering)
Scenarios 1 and 2 test the only project on the corridor that was fully constructed and completed The project installed new connector metering at the SR-57 and I-605 to Ishy210 freeway connector ramps The project also widened various ramps removed various HOV meter bypasses and upgraded the ramp metering system
The 2006 model estimates that Scenario 1 would reduce delay on the corridor by around 17 percent (or 1600 daily vehicle-hours) in the PM peak period but only around two percent (or 200 vehicle-hours) in the AM peak period The biggest benefits occur in the PM eastbound direction from Rosemead On-Ramp to Huntington interchange (with a delay reduction of over 1000 vehicle-hours) as well as from I-605 to the Azusa On-Ramp (delay reduction of 500 vehicle-hours) for single occupant vehicles The
I-210 Corridor System Management Plan Executive Summary
Page 32 of 39
westbound reductions in freeway delay are largely offset by increased on-ramp delay mostly from new connector metering at SR-57 and I-605
The 2020 model estimates that Scenario 2 will reduce delay by around 8 percent in the AM peak and 14 percent in the PM peak for a combined total reduction of 5000 daily vehicle-hours The long-term improvements are less than the short-term improvements due to the increase in demand
Scenarios 3 and 4 (Advanced Ramp Metering)
Scenarios 3 and 4 build on Scenarios 1 and 2 by adding advanced ramp metering system such as dynamic or adaptive ramp metering system
The 2006 model shows that Scenario 3 would reduce delay by an additional 850 daily vehicle-hours (or 11 percent) in the PM peak with a marginal reduction in the AM peak period However in conjunction with Scenario 1 Scenario 3 reduces delay in total by over 600 vehicle-hours in the AM peak These results suggest that queue control provides additional benefits beyond SWARM
The 2020 model estimates that Scenario 4 will modestly reduce delay by about 2 percent in both the AM and PM peaks or a combined total of 800 daily vehicle-hours Again the benefits are lower in percentage terms due to the increase in demand
Note that there are various types of advanced ramp metering systems deployed around the world including System-wide Adaptive Ramp Metering System or SWARM tested recently in Los Angeles I-210 freeway corridor For the I-210 model the Asservissement Lineaire drsquoEntreacutee Autoroutiere (ALINEA system) was tested as proxy for any advanced ramp metering system as its algorithm for the model was readily available It is not necessarily recommended that ALINEA be deployed but rather some type of advanced ramp metering system that would produce similar if not better results
Scenarios 5 and 6 (Auxiliary Lane Striping Ramp Improvements)
Scenarios 5 and 6 build on Scenarios 3 and 4 that include several relatively lower-cost operational improvements that could be implemented by 2015
diams Building a westbound auxiliary lane from Santa Anita to Baldwin and an eastbound auxiliary lane from Santa Anita to Huntington
diams Extending a lane to Lincoln on the westbound I-210 connector
diams Connecting and converging the Altadena on-ramps into a single on-ramp
I-210 Corridor System Management Plan Executive Summary
Page 33 of 39
diams Connecting and converging the Santa Anita on-ramps into a single on-ramp
diams Connecting and converging the Irwindale on-ramps into a single on-ramp
diams Restriping to add a lane in the eastbound direction from San Dimas to Fruit
The 2006 model shows that Scenario 5 reduces delay by 3 percent (nearly 400 vehicleshyhours) in the AM peak and 18 percent (1200 vehicle-hours) in the PM peak The segment that experienced the largest improvement in the eastbound during the PM peak was from Rosemead to Huntington This segment experienced a 45 percent improvement in delay (from 2700 vehicle-hours to 1500 vehicle-hours) which is likely attributed to the eastbound auxiliary lane from Santa Anita to Huntington In the westbound direction the auxiliary lane from Santa Anita to Baldwin shifts some traffic downstream to cause increased congestion at Michillinda (ie bottleneck shift) during the westbound AM peak However the auxiliary lane helps reduce both queue length and queue duration for the Santa Anita bottleneck
The 2020 model estimates that Scenario 6 would reduce delay by 8 percent in the AM peak and 5 percent in the PM peak for a total reduction of 2500 daily vehicle-hours A reduction in PM delay is expected to occur mostly in the westbound direction
Scenarios 7 and 8 (Ramp Closures)
Scenarios 7 and 8 build on Scenarios 5 and 6 and test the closure of several ramps
diams Eastbound Marengo on-ramp and westbound Lake on-ramp with signalization of the eastbound I-210 off-ramp at Maple and improvement to alternate routes along Corson and Maple
diams Eastbound Mount Olive ramps
Note that subsequent scenarios are not built on top of these scenarios as these are isolated to test ramp closure alternatives
The 2006 model shows that Scenario 7 would reduce delay significantly by 16 percent in the AM peak and 18 percent in the PM peak for a total delay reduction of nearly 3000 daily vehicle-hours The delay reductions are significant on the mainline during the peak direction of travel ndash 1400 vehicle-hours in the westbound AM and 912 vehicleshyhours in the eastbound PM In the westbound direction and AM peak period the segment from Altadena to Lake experienced over an 85 percent decrease in congestion (from 860 to 120 vehicle-hours of delay) This is likely attributed to the closure of the westbound Lake on-ramp In the eastbound direction and PM peak period the segment from Huntington to I-605 experienced a delay reduction of over 70 percent (from 2200
I-210 Corridor System Management Plan Executive Summary
Page 34 of 39
vehicle-hours to 600 vehicle-hours) which is likely attributed to the closure of the Mount Olive ramp
The 2020 model also shows that Scenario 8 improved delay by 12 percent in the AM and 3 percent in the PM for a total delay reduction of almost 3000 daily vehicle-hours On the mainline facility delay also improved for each peak direction of travel ndash by 1600 daily vehicle-hours in the westbound AM and by 750 vehicle-hours in the eastbound PM Delay reductions in the non-peak direction were not as significant
Scenarios 9 and 10 (On-ramp and Aux Lane Improvements)
Scenarios 9 and 10 build on Scenarios 5 and 6 and test four operational improvements that can be implemented in the short to medium range
diams Modify the RosemeadMichillinda interchange and converge the westbound I-210 on-ramps
diams Modify the northside of the Baldwin interchange and eliminate the collectorshydistributor
diams Construct an eastbound auxiliary lane from Azusa to Citrus
diams Converge the eastbound Citrus on-ramps and add an auxiliary lane to Grand
The 2006 model estimates that Scenario 9 will reduce delay by 20 percent (or 2400 daily vehicle-hours) in the AM peak and 28 percent (or 1600 daily vehicle-hours) in the PM peak compared to Scenario 5 In both AM and PM peak period the eastbound direction experienced the largest reduction in delay
The 2020 model estimates that Scenario 10 will reduce delay by 13 percent (or 2500 vehicle-hours) in the AM peak and 28 percent in the PM peak (or 4800 vehicle-hours) compared to Scenario 6 Similar to the 2006 model the 2020 model shows that these improvements produced a greater reduction in delay in the eastbound direction than the westbound direction
Scenarios 11 and 12 (Enhanced Incident Management)
Two incident scenarios were tested on top of Scenario 10 to evaluate the non-recurrent delay reductions resulting from enhanced incident management strategies An enhanced incident management system would entail upgrading or enhancing the current Caltrans incident management system that includes deployment of intelligent transportation system (ITS) field devices central controlcommunications software communications medium (ie fiber optic lines) advanced traveler information system
I-210 Corridor System Management Plan Executive Summary
Page 35 of 39
andor freeway service patrol (FSP) program to reduce incident detection verification response and clearance times
In the first scenario Scenario 11 one collision incident with one lane closure was simulated in the westbound direction in the AM peak period model and one in the eastbound direction in the PM peak period model The incident simulation location and duration were selected based on review of the 2010 actual incident data at one of the high frequency locations The following are the Scenario details
diams Westbound AM peak period starting at 800 AM close mainline lane 2 for 40 minutes at absolute post mile 2612 (at Lake Avenue)
diams Eastbound PM peak period starting at 500 PM close mainline lane 2 for 50 minutes at absolute post mile 3207 (west of Santa Anita)
In the second scenario Scenario 12 the same collision incidents were simulated with a reduction in duration by 10 minutes in the westbound direction and by 12 minutes in the eastbound direction It is estimated based on actual incident management data analysis results provided by Caltrans that an enhanced incident management system could reduce a 35-minute incident by about 10 minutes This scenario represents a typical moderate level incident at one location during the peak period direction Data suggest that incidents vary significantly in terms of impact and duration Some incidents last hundreds of minutes some close multiple lanes and some occur at multiple locations simultaneously There are also numerous minor incidents lasting only a few minutes without lane closures that can result in congestion Many other incidents also occur during off-peak hours
Without enhanced incident management Scenario 11 produced an 8 percent increase in congestion in both peak periods over Scenario 10 an increase of over 2300 hours of vehicle delay With enhanced incident management Scenario 12 evaluation resulted in delay decrease by 2 percent in the AM peak and 3 percent in the PM peak against Scenario 11 results a reduction of nearly 750 vehicle-hours for improving the incident detection verification response and clearance time of one moderate level incident for both of the peak hours
Scenario 13 (SR-134I-210 Interchange Modification)
Scenario 13 tests an improvement to modify the SR-134I-210 interchange to provide a direct connection for vehicles to continue on I-210 with three lanes in each direction This improvement was tested with the 2020 model since it is not likely to be implemented in the short-term
I-210 Corridor System Management Plan Executive Summary
Page 36 of 39
The 2020 model estimates that delay would be reduced by 11 percent (or 1800 daily vehicle-hours) in the AM and 3 percent in the PM (320 daily vehicle-hours) compared to Scenario 10 The westbound mainline experienced the greatest reduction in delay in the AM peak from 9600 vehicle-hours to 8600 vehicle hours after the interchange modification
Scenario 14 (Westbound Drop Ramp and Eastbound Widening)
Scenario 14 builds on Scenario 13 and tests Lake Avenue drop ramp to westbound Ishy210 center lanes (one HOV lane and one mainline) and eastbound I-210 widening from Myrtle to I-605 This improvement was tested with the 2020 model
The 2020 model estimates that delay would be reduced by about 20 percent in the AM or 3400 vehicle-hours and 20 percent in the PM or 2300 vehicle-hours compared to Scenario 13 The mobility improvements are significant with the westbound drop ramp that reduces weaving between SR-134 and SR-210 destined traffic and with the eastbound capacity addition to I-605 off that moves the off-ramp traffic away from the mainline and provides more room for the mainline through traffic
Post Scenario 14 Conditions
By 2020 with the inclusion of all the projects tested the model reveals some residual congestion that remains to address with future improvements According to the model results the total remaining delay on the corridor is around 21000 daily vehicle-hours
Benefit-Cost Analysis
Following an in-depth review of model results by the study team and the SCAG technical committee the study team performed a benefit-cost analysis (BCA) for each scenario
Using the California Benefit-Cost Model (Cal-BC) developed on behalf of Caltrans by the study team benefits in three key areas were estimated travel time savings vehicle operating cost savings and emission reduction savings The benefits generated from this exercise are based solely on congestion relief related benefits However these results are conservative since there are other benefits not captured by this analysis including benefits from deploying bus rapid transit which will achieve other accessibility benefits
Project costs were developed from SCAG and Caltrans project planning and programming documents These costs include construction and support costs in current dollars The study team estimated costs for projects that did not have cost
I-210 Corridor System Management Plan Executive Summary
Page 37 of 39
estimates by reviewing similar completed projects A BC greater than one means that a scenarios projects return greater benefits than it costs to construct or implement It is important to consider the total benefits that a project brings For example a large capital expansion project can cost a great deal and have a low BC ratio but brings much higher absolute benefits to the I-210 users Exhibit ES-29 shows the benefit to cost ranges classified from low (with a BC of one to two) to very high (with a BC of over 10)
The benefit-cost results for the South Corridor scenarios are shown in Exhibit ES-29
Exhibit ES-29 I-210 Scenario BenefitCost (BC) Results
Scenario Scenario Description
BenefitCost Ranges
Low Medium Medium-High High Very High
lt1 1 to 2 2 to 5 5 to 10 gt10
12 Expand Ramp Metering 34 Advanced Ramp Metering 56 Aux Lane Striping Ramp Improvs 78 Ramp Closures
910 On-Ramp amp Aux Lane Improvs 13 SR-134I-210 IC Modification
The benefit-cost findings for each scenario are as follows
diams Scenarios 1 and 2 (ramp metering expansion) shows a high benefit-cost ratio of over ten The relatively high benefit-cost ratio is due to the low cost of expanding ramp metering ($235 million)
diams Scenarios 3 and 4 (advanced ramp metering) resulted in an incremental benefitshycost ratio of over ten This is relatively high as compared to that of typical transportation management system project
diams Scenarios 5 and 6 (operational improvements) produced a benefit-cost ratio of over five This is relatively consistent with other typical operational improvement projects The benefits are substantial At estimated total cost of about $44 million these projects produced benefits of over $233 million
diams Scenarios 7 and 8 tested the ramp closures at eastbound Marengo westbound Lake and eastbound Mount Olive These ramp closured produced an extremely high incremental benefit-cost ratio of over ten due to the relatively very low cost However this benefit-cost calculation does not account for any potential increase in delay on various local arterials because of detours from the closed ramps
diams Scenarios 9 and 10 also produced a relatively high benefit-cost ratio of over ten The four operational projects in these scenarios are collectively estimated to cost
I-210 Corridor System Management Plan Executive Summary
Page 38 of 39
under $30 million and provide a substantial and optimistic benefit of over $670 million
diams Scenario 13 tested the SR-134I-210 interchange modification This project produced a benefit-cost ratio of between one and two consistent with other typical capital expansion projects This project produced benefits of over $200 million at a rough-estimate cost of about $150 million
diams Scenario 14 tested the westbound center drop ramp from Lake Avenue interchange and eastbound lane addition from Myrtle to I-605 These projects produced a relatively high benefit-cost ratio of about 6 to one as compared to other capital improvement projects These two capital projects are unique in that they have specific operational improvement element that addresses major bottleneck locations For an estimated total combined cost of about $70 million the projected benefits exceed $420 million
CONCLUSIONS AND RECOMMENDATIONS
This section summarizes the conclusions and recommendations based on the analysis discussed in the previous section It is important to note that many of these conclusions are based primarily on the micro-simulation model results The model was developed based on the best data available at the time The study team reviewed the model results and believe that both the calibrated base year forecast year and scenario results are reasonable However Caltrans should always be cautious to make decisions based on modeling alone especially complex micro-simulation models
Based on the results the study team offers the following conclusions and recommendations
diams The combination of all scenarios significantly reduces overall congestion on the corridor Projected 2020 congestion after implementation of all scenarios is below 2006 levels in both the AM and PM peak period In the AM peak period the model projects total delay in 2020 after delivering all projects to be less than 11700 vehicle-hours compared to the 2006 base year delay of 13000 vehicleshyhours This represents a reduction of over 10 percent In the PM peak period the model projects total delay in 2020 after delivering all projects to be around 9500 hours compared to the 2006 base year delay of almost 9300 vehicle-hours This represents a slight reduction of 2 percent Clearly the scenarios deliver significant mobility benefits to the corridor Despite the growth in demand future 2020 congestion will be less than experienced in 2006
diams The completed ramp metering expansion project is expected to produce substantial mobility benefits of over $400 million Delay has been significantly reduced since 2006
I-210 Corridor System Management Plan Executive Summary
Page 39 of 39
diams Advanced ramp metering could provide additional mobility improvements by significantly reducing congestion and returning over $100 million in benefits
diams Ramp closures at Marengo Lake and Mount Olive as alternatives seem promising by reducing delay up to 3000 vehicle-hours per day and providing substantial benefits of $280 million at an extremely low cost
diams Operational improvements such as auxiliary lanes and ramp improvements could leverage on the ramp metering projects by making the corridor more efficient and productive that could result in additional mobility benefits of over $230 million
diams Additional capital improvements with specific operational elements to address weaving at major bottleneck locations could produce significant mobility benefits of over $420 million
diams Enhanced incident management system associated with Scenarios 11 and 12 to address non-recurrent congestion proved effective with a delay reduction of over 300 vehicle-hours for one modest level incident with a typical duration of 35 minutes reduced to 25 minutes With the I-210 corridor experiencing up to 2400 collisions per year this translates to a total annual delay savings of over 700000 vehicle-hours for the study corridor
diams The benefit-cost ratio of all scenarios combined is about 64 to 1 If all projects were delivered at current cost estimates the public would get over six dollars of benefits for each dollar expended In current dollars costs total to over $17 billion whereas the benefits are estimated to be over $20 billion
diams The projects also alleviate greenhouse gas (GHG) emissions by over 15 million tons over 20 years averaging over a 75000-ton reduction per year The emissions are estimated using data from the California Air Resources Board (CARB) EMFAC model
This is the first generation CSMP for the I-210 corridor It is important to stress that CSMPs should be updated on a regular basis This is particularly important since traffic conditions and patterns can differ from current projections After projects are delivered it is also useful to compare actual results with estimated ones in this document so that models can be further improved as appropriate
CSMPs or a variation thereof should become the normal course of business that is based on detailed performance assessments an in-depth understanding of the reasons for performance deterioration and an analytical framework that allows for evaluating complementary operational strategies that maximize the productivity of the current system
I-210 Corridor System Management Plan Executive Summary
Page 1 of 39
This document represents the Executive Summary for the Los Angeles I-210 Corridor
System Management Plan (CSMP) Final Report developed on behalf of the California Department of Transportation (Caltrans) by System Metrics Group Inc (SMG) A more detailed and larger technical CSMP is available upon request
This CSMP is the direct result of the November 2006 voter-approved Proposition 1B (The Highway Safety Traffic Reduction Air Quality and Port Security Bond Act of 2006) This ballot measure included a funding program deposited into a Corridor Mobility Improvement Account (CMIA)
To receive CMIA funds the California Transportation Commission (CTC) guidelines required that project nominations describe in a CSMP how mobility gains from funded corridor improvements would be maintained over time A CSMP therefore aims to define how corridors will be managed over time focusing on operational strategies in addition to the already funded expansion projects The goal is to get the most out of the existing system and maintain or improve corridor performance
The two documents ndash the Executive Summary and Final Report ndash represent the results of a study that included several key steps including
diams Stakeholder Involvement diams Corridor Performance Assessment diams Bottleneck Identification and Causality Analysis diams Scenario Development and Analysis diams Conclusions and Recommendations
Highlights of each of these steps are included in later sections of this summary
BACKGROUND
Los Angeles Countyrsquos transportation system faces numerous challenges mdash the demand for transportation keeps rising congestion is increasing and infrastructure is aging At the same time traditional transportation finance mechanisms are not able to provide adequate funding to keep expanding the infrastructure to keep up with demand Caltrans recognized that infrastructure expansion cannot keep pace with demand and adopted a system management philosophy to address current and future transportation needs in a comprehensive manner Exhibit ES-1 conceptually illustrates system management as a pyramid The exhibit shows that the transportation decision makers and practitioners at all jurisdictions must expand their ldquotool boxrdquo to include many complementary strategies with an increased focus on operational investments (shown in
I-210 Corridor System Management Plan Executive Summary
Page 2 of 39
the middle part of the pyramid) to complement the traditional system expansion investments
Exhibit ES-1 System Management Pyramid
This I-210 CSMP aims to define how Caltrans and its stakeholders will manage the corridor over time focusing on operational strategies in addition to already funded expansion projects The goal is to get the most out of the existing system and maintain andor improve its performance The CSMP fully respects previous decisions and complements them with additional promising investment suggestions where appropriate The CSMP development effort relies on complex analytical tools including micro simulation models to isolate deficiencies and quantify improvements for even relatively small operational investments
Caltrans develops integrated multimodal projects in balance with community goals plans and values Caltrans seeks and tries to address the safety and mobility needs of bicyclists pedestrians and transit users in all projects regardless of funding Bicycle pedestrian and transit travel is facilitated by creating complete streets beginning early in system planning and continuing through project delivery maintenance and operations Developing a network of complete streets requires collaboration among all Caltrans functional units and stakeholders As the first generation CSMP this report is more focused on reducing congestion and increasing mobility through capital and operational strategies The future CSMP work will further address pedestrian bicycle and transit components and seek to manage and improve the whole network as an interactive system
I-210 Corridor System Management Plan Executive Summary
Page 3 of 39
STAKEHOLDER INVOLVEMENT
A technical committee was formed and met on an almost monthly basis to discuss progress technical challenges data needs and preliminary conclusions for the I-210 CSMP The technical committee included representatives from Caltrans the Southern California Association of Governments (SCAG) the Los Angeles County Metropolitan Transportation Authority (Metro) as well as consultant team members
The I-210 CSMP involved other corridor stakeholders such as representatives from cities bordering I-210 Caltrans briefed these stakeholders at critical milestones
Feedback from the stakeholders helped solidify the findings of the performance assessment bottleneck identification and causality analysis given their intimate knowledge of local conditions Moreover stakeholders have provided support and insight and shared valuable field and project data without which this study would not have been possible The stakeholders included representatives from the following organizations
diams San Gabriel Valley Council of Governments diams Los Angeles County Department of Public Works diams City of Arcadia diams City of Azusa diams City of Claremont diams City of Duarte diams City of Glendora diams City of Irwindale diams City of LaVerne diams City of Monrovia diams City of Pasadena diams City of San Dimas
Caltrans would like to thank all of its partners for contributing to this CSMP development process In addition the CSMP development provided a venue for tighter coordination between Caltrans planning and operations professionals which is critical to the success of the system management approach
I-210 Corridor System Management Plan Executive Summary
Page 4 of 39
CORRIDOR PERFORMANCE ASSESSMENT
This section briefly describes the I-210 corridor and summarizes the results of the comprehensive corridor performance assessment conducted
Corridor Description
Exhibit ES-2 shows the location of the Los Angeles County I-210 CSMP corridor The corridor extends approximately 45 miles from the I-5 (Golden State Freeway) interchange in the San Fernando Valley to the SR-57 (Orange Freeway) interchange It traverses the cities of San Fernando La Canada Flintridge Pasadena Arcadia Monrovia Duarte Azusa and San Dimas The focus of the CSMP is the 20-mile congested urban section between SR-134 and SR-57
The corridor is a divided eight- to ten-lane freeway with a concrete median and an additional outside auxiliary lane along most of the corridor A single High Occupancy Vehicle (HOV) lane exists in each direction through the congestion urban area that is the focus of the study corridor (from the SR-134 interchange to the SR-57 interchange)
According to Caltrans traffic volumes reported for 2008 Los Angeles I-210 carries between 76000 and 298000 annual average daily traffic (AADT) The highest average daily traffic volume on the corridor occurs at the SR-134 interchange and the lowest volume occurs near the I-5 interchange
I-210 is also a Surface Transportation Assistance Act (STAA) route that allows large trucks to operate on the mainline lanes According to the latest truck volumes from Caltrans trucks comprise between four and ten percent of total daily traffic along the corridor Higher truck percentages occur west of the SR-134 Many of these trucks travel eastbound to the Inland Empire home to many warehouses and distribution centers The trucks traveling westbound are typically headed north to connect to the I-5 corridor and beyond
Major transit operations along the I-210 Corridor include Metro bus and light rail Metrolink commuter rail Foothill Transit Los Angeles City Department of Transportation Commuter Express and Pasadena Area Rapid Transit System (ARTS)
Metro operates ten parallel local bus or bus rapid transit (BRT) routes near the I-210 corridor It also operates the Metro Rail Gold Line that provides light-rail service in the center median of I-210 from downtown Los Angeles Union Station to the Sierra Madre Villa station
1-210 Corridor Study A1rea
0 I 2 3 4 5 MIEB
llllilllilllilllil l+j
I-210 Corridor System Management Plan Executive Summary
Page 5 of 39
Exhibit ES-2 Los Angeles County I-210 CSMP Corridor Map
I-210 Corridor System Management Plan Executive Summary
Page 6 of 39
Foothill Transit provides four bus lines that serve Pasadena the City of Arcadia and the City of Duarte The City of Los Angeles Department of Transportation also operates two commuter service lines that service the San Gabriel Valley Other transit agencies such as the Pasadena Rapid Transit System and the Glendale Bee operate local bus service between residential neighborhoods and business centers The Metrolink Antelope Valley Line provides commuter rail service from the Antelope Valley along the I-5 and San Fernando Road to downtown Los Angeles
There are various bike routes near I-210 but none that parallel the study corridor Most of the bike routes near the corridor are Class III Bike Paths (preferred bike routes on existing streets identified by signs only) These routes are concentrated between I-110 and SR-19 Due to the terrain and uphill climb there are few bike paths west of SRshy134
Several roadway improvements have been recently completed In preparation for System-Wide Adaptive Ramp Metering (SWARM) implementation various on-ramps between SR-134 and SR-57 were modified to enhance metering with traffic signals on the HOV bypass lanes Freeway connector on-ramps from I-605 and SR-57 have been modified to implement connector metering with traffic signals Closed-circuit television (CCTV) cameras and fiber optic communications were also added throughout the corridor
In addition to major employment trip-generating activity centers in Pasadena area there are 14 collegesuniversities six major medical centers the Rose Bowl stadium Santa Anita Park Horse Track Irwindale Speedway and various large shopping malls The Bob Hope Airport in Burbank is also a major traffic generator for the I-210 corridor
Corridor Performance Assessment
The I-210 CSMP focuses on four categories of performance measures
diams Mobility describes how quickly people and freight move along the corridor diams Reliability captures the relative predictability of travel time along the corridor diams Safety provides an overview of collisions along the corridor diams Productivity quantifies the degree to which traffic inefficiencies at bottlenecks or
hot spots reduce flow rates along the corridor
Mobility
Two primary measures quantify mobility in this report delay and travel time Each is estimated from field automatic detection data from the Performance Measurement System1 (PeMS) provided access to the historical freeway detection data needed to
1 Developed and maintained by Caltrans and accessible at pemsdotcagov
I-210 Corridor System Management Plan Executive Summary
Page 7 of 39
estimate the two mobility measures PeMS collects detector volume and occupancy data on the freeway which were used to estimate speed delay and travel time
Delay
Delay is defined as the observed travel time less the travel time at uncongested conditions and is reported as vehicle-hours of delay The assessment summarized the results for the five-year period between 2005 and 2009 Delays in this report were calculated as the difference in travel time between estimated speeds and free-flow conditions at 60 mph applied to the observed volume Exhibit ES-2 shows the average daily vehicle-hours of delay for each month between 2005 and 2009 for both mainline and high occupancy vehicle (HOV) lanes This exhibit reveals the following trends
diams Prior to 2007 the eastbound and westbound directions experienced similar delay levels on both the mainline and HOV lanes The HOV lanes comprise approximately 15 to 20 percent of the total estimated delay on the corridor
diams Congestion on the westbound mainline lanes experienced extreme peaking ndash likely caused by construction on the corridor between 2007 and 2008 The eastbound lanes did not experience much change in delay in 2007 but declined through 2008 The HOV facility did not experience significant change during this time
diams In 2009 the estimated delay on the eastbound mainline lanes increased dramatically while in contrast the westbound lanes declined sharply The HOV lane showed a similar trend with the eastbound HOV lane exceeding the delay in the westbound direction
I-210 Corridor System Management Plan Executive Summary
Page 8 of 39
Exhibit ES-3 Average Weekday Delay by Month (2005-2009) 16000
Av
era
ge
Da
ily
Ve
hic
le-H
ou
rs o
f D
ela
y (
6
0m
ph
)
15000
14000
13000
12000
11000
10000
9000
8000
7000
6000
5000
4000
3000
2000
1000
-
Ja
nF
eb
Ma
rA
pr
Ma
yJ
un
Ju
lA
ug
Se
pO
ct
No
vD
ec
Ja
nF
eb
Ma
rA
pr
Ma
yJ
un
Ju
lA
ug
Se
pO
ct
No
vD
ec
Ja
nF
eb
Ma
rA
pr
Ma
yJ
un
Ju
lA
ug
Se
pO
ct
No
vD
ec
Ja
nF
eb
Ma
rA
pr
Ma
yJ
un
Ju
lA
ug
Se
pO
ct
No
vD
ec
Ja
nF
eb
Ma
rA
pr
Ma
yJ
un
Ju
lA
ug
Se
pO
ct
No
vD
ec
2005 2006 2007 2008 2009
Eastbound ML
Westbound ML
Eastbound HOV
Westbound HOV
Month
The CSMP separates delay further into two components severe delay and other delay Severe delay is delay that occurs when speeds are below 35 mph and other delay occurs where speeds are between 35 and 60 mph Severe delay represents breakdown conditions ldquoOtherrdquo delay represents conditions approaching or leaving the breakdown congestion or areas that cause temporary slowdowns However it can also be a leading indicator of future severe delay
Exhibits ES-4 (Mainline lanes) and ES-5 (HOV lanes) show average severe and other daily vehicle-hours of delay by day of the week A few notes related to ES-4 and ES-5
diams Severe delay makes up about 70 percent of all weekday delay on the corridor in either the eastbound or the westbound direction Severe delay on Saturdays and SundaysHolidays tend to be under 70 percent while weekday severe delay averages around 75 percent of all delay As in Exhibit ES-3 HOV delays tend to range between 14 and 25 percent of total delay
diams Fridays in the eastbound direction experience the highest delays probably due to weekend travel The second highest delays generally occurred on Thursdays In the westbound direction the day of week trends are typical for urban commute corridors with the midweek days experiencing the highest delays with Monday and Friday showing slightly less congestion and the weekends showing much lower delays than during the week
Av
era
ge D
aily V
eh
icle
-Ho
urs
of
Dela
y (
60
mp
h)
Av
era
ge D
aily V
eh
icle
-Ho
urs
of
Dela
y (
60
mp
h)
I-210 Corridor System Management Plan Executive Summary
Page 9 of 39
Exhibit ES-4 Mainline Lane Delay by Day of Week (2005-2009) 16000
15000
14000
13000
12000
11000
10000
9000
8000
7000
6000
5000
4000
3000
2000
1000
-
Mainline Other Delay
Mainline Severe Delay M
on
T
ue
Wed
T
hu
F
riS
at
Su
n
Ho
lM
on
Tu
eW
ed
Th
uF
riS
at
Su
n
Ho
lM
on
Tu
eW
ed
Th
uF
riS
at
Su
n
Ho
lM
on
Tu
eW
ed
Th
uF
riS
at
Su
n
Ho
lM
on
Tu
eW
ed
Th
uF
riS
at
Su
n
Ho
lM
on
Tu
eW
ed
Th
uF
riS
at
Su
n
Ho
lM
on
Tu
eW
ed
Th
uF
riS
at
Su
n
Ho
lM
on
Tu
eW
ed
Th
uF
riS
at
Su
n
Ho
lM
on
Tu
eW
ed
Th
uF
riS
at
Su
n
Ho
lM
on
Tu
eW
ed
Th
uF
riS
at
Su
n
Ho
l
2005 2006 2007 2008 2009 2005 2006 2007 2008 2009
EASTBOUND WESTBOUND
Exhibit ES-5 HOV Lane Delay by Day of Week (2005-2009) 4000
3500
3000
2500
2000
1500
1000
500
-
Mo
nT
ue
Wed
Th
uF
riS
at
Su
n
Ho
lM
on
Tu
eW
ed
Th
uF
riS
at
Su
n
Ho
lM
on
Tu
eW
ed
Th
uF
riS
at
Su
n
Ho
lM
on
Tu
eW
ed
Th
uF
riS
at
Su
n
Ho
lM
on
Tu
eW
ed
Th
uF
riS
at
Su
n
Ho
lM
on
Tu
eW
ed
Th
uF
riS
at
Su
n
Ho
lM
on
Tu
eW
ed
Th
uF
riS
at
Su
n
Ho
lM
on
Tu
eW
ed
Th
uF
riS
at
Su
n
Ho
lM
on
Tu
eW
ed
Th
uF
riS
at
Su
n
Ho
lM
on
Tu
eW
ed
Th
uF
riS
at
Su
n
Ho
l
2005 2006 2007 2008 2009 2005 2006 2007 2008 2009
EASTBOUND WESTBOUND
Other Delay
Severe Delay
I-210 Corridor System Management Plan Executive Summary
Page 10 of 39
Exhibits ES-6 and ES-7 summarize average annual weekday delay by hour of the day over the five-year period for the mainline northbound and southbound lanes respectively These exhibits allow planners and decision makers to understand the trend in peak period delay spiking and peak period spreading by comparing the intensity and duration of the peak period congestion Note that the HOV lanes are not shown in this summary report since they follow similar peaking trends as the mainline lanes (the main technical report contains the HOV delay by hour results) A few notes on these two exhibits
diams The eastbound direction peaks in the PM peak period while the AM is the westbound peak AM peak hour is 700 AM while the PM peak period is 500 PM
diams In the eastbound PM direction congestion grew dramatically in 2009 while westbound AM congestion declined This is also evident in Exhibit ES-2 Eastbound delay between 2005 and 2008 remained relatively constant at about 1750 vehicle-hours during the 500 PM peak hour before increasing in 2009 to about 2100 vehicle-hours
diams Westbound AM congestion declined in 2009 after two years of dramatic growth between 2007 and 2008 In 2009 the AM peak period also shrank by approximately one-half hour and started at approximately 530 AM whereas from 2005 to 2008 the peak period started around 500 AM
Exhibit ES-6 Eastbound Mainline Lanes Hourly Delay (2005-2009)
0
250
500
750
1000
1250
1500
1750
2000
2250
2500
Ave
rag
e D
ail
y V
eh
icle
Ho
urs
of
Dela
y (
60
mp
h) 2009 Weekday
2008 Weekday
2007 Weekday
2006 Weekday
2005 Weekday
00
0
10
0
20
0
30
0
40
0
50
0
60
0
70
0
80
0
90
0
100
0
110
0
120
0
130
0
140
0
150
0
160
0
170
0
180
0
190
0
200
0
210
0
220
0
230
0
Hour of the Day
I-210 Corridor System Management Plan Executive Summary
Page 11 of 39
Exhibit ES-7 Westbound Mainline Lanes Hourly Delay (2005-2009)
0
250
500
750
1000
1250
1500
1750
2000
2250
2500
Ave
rag
e D
ail
y V
eh
icle
Ho
urs
of
Dela
y (
60m
ph
) 2009 Weekday
2008 Weekday
2007 Weekday
2006 Weekday
2005 Weekday
00
0
10
0
20
0
30
0
40
0
50
0
60
0
70
0
80
0
90
0
100
0
110
0
120
0
130
0
140
0
150
0
160
0
170
0
180
0
190
0
200
0
210
0
220
0
230
0
Hour of the Day
Travel Time
The travel time performance measure represents the average time it takes for a vehicle to travel between SR-134 and SR-57 a distance of approximately 20 miles
Exhibits ES-8 and ES-9 summarize mainline estimated average weekday travel times by hour of day for the 2005-2009 five-year period Exhibits ES-10 and ES-11 show the same results for the HOV facility Similar to delay travel times increased in 2009 in the eastbound PM direction and time but decreased in the westbound AM commute period
In the mainline lanes the eastbound PM peak hour (500 PM) travel time grew from 40 minutes in 2008 to 44 minutes in 2009 In the westbound AM peak hour (700 AM) the opposite trend occurred with travel times dropping from a 41 minute average in 2008 to around 36 minutes in 2009
A similar trend occurred for the HOV lanes except that 2005 was the worst year in terms of travel times
Tra
ve
l T
ime
(m
inu
tes
) T
rav
el
Tim
e (
min
ute
s)
45
40
35
30
25
20
15
10
5
0
45
40
35
30
25
20
15
10
5
0
I-210 Corridor System Management Plan Executive Summary
Page 12 of 39
Exhibit ES-8 Eastbound Mainline Lanes Travel Time by Hour (2005-2009) 50
2009 Average Travel Time
2008 Average Travel Time
2007 Average Travel Time
2006 Average Travel Time
2005 Average Travel Time
Travel Time 60mph
Travel Time 35mph
Hour of the Day
00
0
10
0
20
0
30
0
40
0
50
0
60
0
70
0
80
0
90
0
100
0
110
0
120
0
130
0
140
0
150
0
160
0
170
0
180
0
190
0
200
0
210
0
220
0
Hour of the Day
Exhibit ES-9 Westbound Mainline Lanes Travel Time by Hour (2005-2009) 50
2009 Average Travel Time
2008 Average Travel Time
2007 Average Travel Time
2006 Average Travel Time
2005 Average Travel Time
Travel Time 60mph
Travel Time 35mph
00
0
10
0
20
0
30
0
40
0
50
0
60
0
70
0
80
0
90
0
10
00
11
00
12
00
13
00
14
00
15
00
16
00
17
00
18
00
19
00
20
00
21
00
22
00
230
0
23
00
Tra
ve
l T
ime
(m
inu
tes
) T
rav
el
Tim
e (
min
ute
s)
45
40
35
30
25
20
15
10
5
0
45
40
35
30
25
20
15
10
5
0
I-210 Corridor System Management Plan Executive Summary
Page 13 of 39
Exhibit ES-10 Eastbound HOV Lanes Travel Time by Hour (2005-2009) 50
2009 Average Travel Time
2008 Average Travel Time
2007 Average Travel Time
2006 Average Travel Time
2005 Average Travel Time
Travel Time 60mph
Travel Time 35mph
Hour of the Day
00
0
10
0
20
0
30
0
40
0
50
0
60
0
70
0
80
0
90
0
100
0
110
0
120
0
130
0
140
0
150
0
160
0
170
0
180
0
190
0
200
0
210
0
220
0
Hour of the Day
Exhibit ES-11 Westbound HOV Lanes Travel Time by Hour (2005-2009) 50
2009 Average Travel Time
2008 Average Travel Time
2007 Average Travel Time
2006 Average Travel Time
2005 Average Travel Time
Travel Time 60mph
Travel Time 35mph
00
0
10
0
20
0
30
0
40
0
50
0
60
0
70
0
80
0
90
0
100
0
110
0
120
0
130
0
140
0
150
0
160
0
170
0
180
0
190
0
200
0
210
0
220
0
230
0
230
0
I-210 Corridor System Management Plan Executive Summary
Page 14 of 39
Reliability
Reliability captures the degree of predictability in travel time Reliability focuses on how travel time varies from day to day and reflects the impacts of accidents incidents weather and special events Improving reliability is an important goal for transportation agencies and efforts to accomplish this include incident management traveler information and special event planning
To measure reliability the CSMP used the ldquobuffer indexrdquo which reflects the additional time required (over and beyond the average) to ensure an on-time arrival 95 percent of the time In other words if a person must be on time 95 days out of 100 (or 19 out of 20 workdays per month) then that person must add additional time to their average expected travel time to ensure an on-time arrival That additional time is the buffer time Severe events such as collisions could cause longer travel times but the 95th percentile represents a balance between days with extreme events (eg major accidents) and other more ldquotypicalrdquo travel days
Exhibits ES-12 and ES-13 show the estimated mainline lane travel time variability along I-210 on non-holiday weekdays for 2006 in the eastbound and westbound directions respectively The main report shows the buffer index for the years 2005-2009 for both mainline and HOV lanes but this Executive Summary reports only the data for the year 2006 for mainlines since that year was used as the base year for modeling
The following observations on the reliability results are worth noting
bull In 2006 in the eastbound direction 500 PM had the highest estimated average travel time at approximately 41 minutes and the highest estimated buffer index time of 15 minutes for a buffer index of 33 percent In other words to arrive on time 95 percent of the time a commuter would need to leave for work 56 minutes before the start time to travel the entire length of the I-210 study corridor
bull The westbound direction the 700 AM had the estimated average travel time of 39 minutes in 2006 with a buffer time of 15 minutes for a buffer index of 38 percent
70
65
60
55
50
45
40
35
30
25
20
15
10
5
0
70
65
60
55
50
45
40
35
30
25
20
15
10
5
0
Average Travel Time
Travel Time Variability (95th Percentile)
Travel Time at 60mph
Travel Time at 35mph
TIME OF DAY
Exhibit ES-13 Westbound Mainline Lanes Travel Time Variability (2006)
75
TIME OF DAY
Average Travel Time
Travel Time Variability (95th Percentile)
Travel Time at 60mph
Travel Time at 35mph
Exhibit ES-12 Eastbound Mainline Lanes Travel Time Variability (2006)
75
I-210 Corridor System Management Plan Executive Summary
Page 15 of 39
TR
AV
EL
TIM
E (
MIN
)
00
000
0
10
010
0
TR
AV
EL
TIM
E (
MIN
)
20
020
0
30
030
0
40
040
0
50
050
0
60
060
0
70
070
0
80
080
0
90
090
0
100
01
00
0
110
01
10
0
120
01
20
0
130
01
30
0
140
01
40
0
150
01
50
0
160
01
60
0
170
01
70
0
180
01
80
0
190
01
90
0
200
02
00
0
210
02
10
0
220
02
20
0
230
02
30
0
00
0
00
0
I-210 Corridor System Management Plan Executive Summary
Page 16 of 39
Safety
The adopted performance measures to assess safety involve the number of accidents and the accident rates computed from the Caltrans Traffic Accident Surveillance and Analysis System (TASAS) TASAS is a traffic records system containing an accident database linked to a highway database The highway database contains descriptive elements of highway segments intersections and ramps access control traffic volumes and other data TASAS contains specific data for accidents on State highways Accidents on non-State highways are not included (eg local streets and roads)
The safety assessment in this report intends to characterize the overall accident history and trends in the corridor and to highlight notable accident concentration locations or patterns that are readily apparent This report does not intend to supplant more detailed safety investigations routinely performed by Caltrans staff
Exhibits ES-14 and ES-15 show the I-210 total number of eastbound and westbound accidents by month respectively For the accident analysis the corridor is split in half the ldquoless urbanrdquo western half of the corridor from I-5 (postmile 0) in Sylmar to SR-134 in Pasadena (postmile R2200) and the ldquomore urbanrdquo eastern half from SR-134 to SR-57 (postmile R45) in San Dimas The latest available TASAS data from PeMS is to December 30 2008 Accidents are reported for the study corridor and not separated by mainline and HOV facility The exhibits summarize the latest available three-year data from January 1 2006 through December 31 2008
Both the eastbound and westbound directions have similar accident profiles with the more urbanized eastern half of the corridor (postmile R22 to R45) experiencing nearly 45 times as many accidents as the western half (PM 0 to R22) The eastbound (Exhibit ES-13) direction has around 79 accidents on average per month in the more-urbanized section and just fewer than 18 accidents in the less-urbanized section
The westbound direction has just fewer than 78 accidents on average per month in the more-urbanized section and just fewer than 18 in the less-urbanized section This is very similar to the eastbound direction
Nu
mb
er
of
Ac
cid
en
ts
Nu
mb
er
of
Accid
en
ts
I-210 Corridor System Management Plan Executive Summary
Page 17 of 39
Exhibit ES-14 Eastbound I-210 Monthly Collisions (2004-2008) 120
110
100
90
80
70
60
50
40
30
20
10
0
Jan
Feb
Mar
Ap
rM
ay
Ju
nJu
lA
ug
Sep
Oct
No
vD
ec
Jan
Feb
Mar
Ap
rM
ay
Ju
nJu
lA
ug
Sep
Oct
No
vD
ec
Jan
Feb
Mar
Ap
rM
ay
Ju
nJu
lA
ug
Sep
Oct
No
vD
ec
Jan
Feb
Mar
Ap
rM
ay
Ju
nJu
lA
ug
Sep
Oct
No
vD
ec
Jan
Feb
Mar
Ap
rM
ay
Ju
nJu
lA
ug
Sep
Oct
No
vD
ec
2004 2005 2006 2007 2008
Less Urbanized Western Section (I-5 to SR-134)
More Urbanized Eastern Section (SR-134 to SR-57)
110
100
90
80
70
60
50
40
30
20
10
0
Exhibit ES-15 Westbound I-210 Monthly Collisions (2004-2008) 120
Jan
Feb
Mar
Ap
rM
ay
Ju
nJu
lA
ug
Sep
Oct
No
vD
ec
Jan
Feb
Mar
Ap
rM
ay
Ju
nJu
lA
ug
Sep
Oct
No
vD
ec
Jan
Feb
Mar
Ap
rM
ay
Ju
nJu
lA
ug
Sep
Oct
No
vD
ec
Jan
Feb
Mar
Ap
rM
ay
Ju
nJu
lA
ug
Sep
Oct
No
vD
ec
Jan
Feb
Mar
Ap
rM
ay
Ju
nJu
lA
ug
Sep
Oct
No
vD
ec
2004 2005 2006 2007 2008
Less Urbanized Western Section (I-5 to SR-134)
More Urbanized Eastern Section (SR-134 to SR-57)
I-210 Corridor System Management Plan Executive Summary
Page 18 of 39
Productivity
Productivity is a system efficiency measure used to analyze the throughput of the corridor during congested conditions Restoring lost productivity is one focus area of CSMPs
Exhibit ES-16 illustrates how congestion leads to lost productivity The exhibit uses observed I-210 data from sensors for a typical spring 2010 afternoon peak period (Thursday May 6 2010) It shows speeds (red line) and flow rates (blue line) on eastbound I-210 at Huntington Drive one of the most congested locations on the corridor
Flow rates (measured as vehicle-per-hour-per-lane or ldquovphplrdquo) at Huntington Drive averaged around 1800 vphpl between 200 PM and 300 PM Once volumes approach a maximum flow rate of around 2000 vphl traffic becomes unstable Any additional merging or weaving traffic breaks down and speeds can rapidly plummet to below 35 mph In essence every incremental merge takes up two spots on the freeway for a short time However since the volume is close to the capacity these merges lead to queues Moreover rather than accommodating the same number of vehicles flow rates also drop and vehicles back up creating bottlenecks and associated congestion
At the location shown in Exhibit ES-16 throughput drops by over 30 percent on average during the peak period (from over 1800 to around 1200 vphpl) This five-lane road therefore operates as if lost 30 percent capacity when demand is at its highest Stated differently just when the corridor needed the most capacity it performed in the least productive manner and effectively lost lanes This loss in throughput can be aggregated and presented as ldquoEquivalent Lost-Lane-Milesrdquo
I-210 Corridor System Management Plan Executive Summary
Page 19 of 39
Exhibit ES-16 Lost Productivity Illustrated
70 2000
65
60 1750
50
55 1500
SP
EE
D
45 1250
40
35 1000
30 Speed lt35mph
750 25
20 500 I-210 EB
15 Los Angeles County Huntington
10 PM=3338 250
May 6 2010 5 VDS ID 761141
0 -
FL
OW
RA
TE
(VP
HP
L)
140
0
143
0
150
0
153
0
160
0
163
0
170
0
173
0
180
0
183
0
190
0
193
0
TIME The estimated average non-holiday weekday lost lane-miles by period and year on Ishy210 are shown Exhibits ES-17 (mainline) and ES-18 (HOV) A few notes on these two exhibits
diams The trends in the productivity losses are comparable to the delay trends The largest productivity losses occurred in the eastbound direction during the PM peak hours which is the direction and time period that experienced the most congestion
diams On the mainline facility the westbound direction experienced nearly as high productivity loses during the AM peak period
diams On the HOV lanes a greater productivity loss in the eastbound peak period is more evident
Operational strategies are critical to recovering such productivity losses These strategies include building new or extending auxiliary lanes developing more aggressive ramp metering strategies without negatively influencing the arterial network and improving incident clearance times
I-210 Corridor System Management Plan Executive Summary
Page 20 of 39
Exhibit ES-17 Mainline Daily Equivalent Lost Lane-Miles by Direction and Period (2005-09)
-
10
20
30
40
50
60
70
80
90
100
110
120
130
140
150
160
2005 2006 2007 2008 2009 2005 2006 2007 2008 2009 2005 2006 2007 2008 2009 2005 2006 2007 2008 2009
Eastbound
Westbound
AM PM Midday Night Time Period and Year
Daily
Eq
uiv
ale
nt
Lost
Lan
e-M
iles
Exhibit ES-18 HOV Daily Equivalent Lost Lane-Miles by Direction and Period (2005-09)
-
10
20
30
40
2005 2006 2007 2008 2009 2005 2006 2007 2008 2009 2005 2006 2007 2008 2009 2005 2006 2007 2008 2009
Eastbound
Westbound
AM Midday PM Night
Daily
Eq
uiv
ale
nt
Lost
Lan
e-M
iles
Time Period and Year
I-210 Corridor System Management Plan Executive Summary
Page 21 of 39
BOTTLENECK IDENTIFICATION AND CAUSALITY ANALYSIS
Exhibits ES-19 and ES-20 summarize the eastbound and westbound bottleneck locations the time period that each bottleneck is generally active and the causes of the each bottleneck Exhibits ES-21 and ES-22 are maps of the corridor showing these bottleneck locations for the AM and PM peak periods respectively
Major bottlenecks are the primary cause of congestion and lost productivity By definition a bottleneck is a condition where traffic demand exceeds the effective carrying capacity of the roadway In most cases the cause of a bottleneck is related to a sudden reduction in capacity such as a lane drop merging and weaving driver distractions a surge in demand or a combination of factors
The specific location and causality of each major I-210 bottleneck was verified by multiple field observations on separate weekdays throughout the summer fall and winter of 2009 Some bottleneck locations were videotaped to validate bottlenecks and to assist in micro-simulation model calibration
The detailed final report explains in detail the process and results of the bottleneck identification and causality analysis
I-210 Corridor System Management Plan Executive Summary
Page 22 of 39
Exhibit ES-19 I-210 Eastbound Bottleneck Locations
Abs CA Bottleneck
Location
Active
Period Causality Summary
AM PM
250 R250 Fair Oaks Heavy ramp merge
265 R265 Lake On-ramp Heavy ramp merge
286 R287 San Gabriel On-ramp Heavy ramp merge roadway curves
294 R294 Rosemead On-ramp Heavy consecutive ramp merge
330 R327 Huntington Interchange Heavy ramp merge roadway curves
366 R363 I-605 On-ramp traffic weaving with the off-ramp
400 R397 Azusa On-ramp Heavy ramp merge
408 R406 Citrus On-ramp Heavy ramp merge
450 R450 SR-57 On-ramp Heavy ramp merge and lane drop
Exhibit ES-20 I-210 Westbound Bottleneck Locations
Abs CA
Bottleneck
Location
Active
Period Causality Summary
AM PM
401 R398 Azusa On-ramp Consecutive ramp merge curves
368 R365 I-605 Off-ramp Consecutive ramp merge weaving
322 R319 Santa Anita On-ramp Heavy ramp merge roadway curves
307 R304 Baldwin On-ramp Heavy consecutive ramp merge
297 L297 Rosemead On-ramp Three consecutive ramp merges weaving
280 R281 Altadena On-ramp Heavy ramp merge
261 R261 Lake On-ramp Heavy ramp merge
Bottleneck Locations
reg --Bottleneck
Westbound
Eastbound
0 1 2
I bull I I I bull I I I Miles
HJOUAIIO fl _
I-210 Corridor System Management Plan Executive Summary
Page 23 of 39
Exhibit ES-21 I-210 Map of AM Bottleneck Locations
Bottleneck Locations
reg Bottleneck - Westbound - Eastbound
N 0 1 2
bull I I II II II I ll) Mles s
HJOUAIIO fl _
I-210 Corridor System Management Plan Executive Summary
Page 24 of 39
Exhibit ES-22 I-210 Map of PM Bottleneck Locations
I-210 Corridor System Management Plan Executive Summary
Page 25 of 39
SCENARIO DEVELOPMENT AND ANALYSIS
Fully understanding how a corridor performs and why it performs the way it does sets the foundation for evaluating potential solutions Several steps were required to develop and evaluate improvements including
diams Developing traffic models for 2006 base year and 2020 long-term demand diams Combining projects in a logical manner for modeling and testing diams Evaluating model outputs and summarizing results diams Conducting a benefit-cost assessment of scenarios
Traffic Model Development
The study team developed a traffic model using the VISSIM micro-simulation software It is important to note that micro-simulation models are complex to develop and calibrate for a large urban corridor However it is one of the only tools capable of providing a reasonable approximation of bottleneck formation and queue development Therefore such tools help quantify the impacts of operational strategies which traditional travel demand models cannot
The model was calibrated against 2006 conditions This was a resource intensive effort requiring several iterations of submittals and review cycles until the model reasonably matched bottleneck locations and relative severity Once calibration was approved a 2020 model was also developed based on SCAGrsquos travel demand model demand projections
These two models were used to evaluate different scenarios (combinations of projects) to quantify the associated congestion relief benefits and to compare total project costs against their benefits
Exhibit ES-23 depicts the network included in the model There were no parallel arterials modeled with the exception of arterials at interchanges All freeway interchanges were included as well as on-ramps and off-ramps
I-210 Corridor System Management Plan Executive Summary
Page 26 of 39
Exhibit ES-23 Micro-Simulation Model Network
I-210 Corridor System Management Plan Executive Summary
Page 27 of 39
Scenario Development Framework
The study team developed a framework for combining projects into scenarios It would be desirable to evaluate every possible combination of projects However this would have entailed thousands of model runs Instead the team combined projects based on a number of factors including
diams Projects that were fully constructed and completed from 2006 to 2010 were tested with both the 2006 and 2020 models
diams Short- and mid- term operational projects were grouped into scenarios and tested with the both the 2006 and 2020 models
diams Longer-range projects to be delivered by 2020 and beyond were used to develop scenarios to be tested with the 2020 model only
diams Alternative ramp closures were grouped into isolated scenarios (future scenarios did not build on top of these) and tested with both the 2006 and 2020 models
The study assumes that projects delivered before 2016 could reasonably be evaluated using the 2006 base year model The 2020 forecast year for the I-210 study was consistent with the SCAG 2020 regional travel demand model origin-destination matrices used to develop the 2008 Regional Transportation Plan (RTP) When SCAG updates its travel demand model and Regional Transportation Plan (RTP) it may wish to update the micro-simulation model with revised demand projections
Project lists used to develop scenarios were part from the Regional Transportation Improvement Program (RTIP) the RTP and other sources such as special studies Projects that do not directly affect mobility were eliminated For instance sound wall landscaping or minor arterial improvement projects were not evaluated since microshysimulation models cannot evaluate them
Scenario testing performed for the performed for the I-210 CSMP differed from traditional ldquoalternatives evaluationsrdquo done for Major Investment Studies (MIS) or Environmental Impact Reports (EIRs) An MIS or EIR focuses on identifying alternative solutions to address current or projected corridor problems so each alternative is evaluated separately and results among competing alternatives are compared resulting in a locally preferred alternative In contrast for the I-210 CSMP scenarios build on each other in that a scenario contains the projects from the previous scenario plus one or more projects as long as the incremental scenario results showed an acceptable level of performance improvement This incremental scenario evaluation approach is important since CSMPs are new and are often compared with alternatives studies
Exhibit ES-24 summarizes the approach used and scenarios tested and provides a
I-210 Corridor System Management Plan Executive Summary
Page 28 of 39
general description of the projects included in the 2006 and 2020 micro-simulation runs Most projects were tested for both the short- and long-term timeframes Each scenario tested was built upon prior scenarios except for Scenarios 7 and 8 which were ldquostand alonerdquo scenarios used to test alternative ramp closures Later scenarios build on Scenarios 5 and 6 and do not include the improvements tested in Scenarios 7 and 8 Enhanced incident management was tested in Scenarios 11 and 12 by comparing a simulated incident without and with enhanced incident management system Scenarios 13 and 14 are expected for the longer term and were tested only with the 2020 model
Exhibit ES-24 Micro-Simulation Modeling Approach
Short-Term Scenarios Long-Term Scenarios
Calibrated 2006 Base Case
Scenario 1 Expand Ramp-
Metering
Scenario 3 Scenario 1 +
Adv Ramp-Meter w
Queue Control
Scenario 5 Scenario 3 + aux lane striping and
ramp improvements
2020 Horizon Year
2006 Network 2020 OD Matrices
Scenario 7 Scenario 5 +
Ramp Closures
Scenario 2 Expand Ramp-
Metering
Scenario 4 Scenario 2 +
Adv Ramp-Meter w
Queue Control
Scenario 6 Scenario 4 + aux lane striping and
ramp improvements
Scenario 8 Scenario 6 +
Ramp Closures
Scenario 14 Scenario 13 + Lake
Ave Drop Ramp
Lane Addition
Scenario 9 Scenario 5+
On-Ramp amp Aux
lane improvements
Scenario 10 Scenario 6 +
On-Ramp amp Aux
lane improvements
Scenario 11 Incident with No
Incident
Management
Scenario 12 Incident With
Incident
Management
Scenario 13 Scenario 10 +
134210 IC
modification
Incident Management Scenarios
I-210 Corridor System Management Plan Executive Summary
Page 29 of 39
Scenario Evaluation Results
Exhibits ES-25 and ES-26 show the delay results for all the 2006 scenarios evaluated for the AM and PM peak periods respectively Exhibits ES-27 and ES-28 show the delay results for all the 2020 scenarios evaluated for the AM and PM peak periods respectively For each scenario the modeling team produced results by facility type (ie mainline HOV arterials and ramps) and vehicle type (SOV HOV trucks) as well as speed contour diagrams (discussed in more detail in the full technical CSMP) The study team scrutinized to ensure that they were consistent with general traffic engineering principles The following summarizes the findings related to the four exhibits
Exhibit ES-25 2006 AM Peak Micro-Simulation Delay Results by Scenario
De
lay
(Pe
ak
Pe
rio
d V
eh
icle
-Ho
urs
)
2006 Base Year S1 S3 S5 S7 S9 Scenario
18000
16000
14000
12000
10000
8000
6000
4000
2000
-
S1 Expand Ramp Metering
S3 Adv Ramp Metering
S5 Aux Lane Striping Ramp Improvs
S7 Ramp Closures
S9 On-Ramp amp Aux Lane Improvs
-2 -3 -3
-16 -20
HOV WB I-210 WB
HOV EB I-210 EB
Ramps Arterials
I-210 Corridor System Management Plan Executive Summary
Page 30 of 39
Exhibit ES-26 2006 PM Peak Micro-Simulation Delay Results by Scenario
18000
De
lay
(Pe
ak
Pe
rio
d V
eh
icle
-Ho
urs
)
16000
14000
12000
10000
8000
6000
4000
2000
-
S1 Expand Ramp Metering
S3 Adv Ramp Metering
HOV WB
I-210 WB
S5 Aux Lane Striping Ramp Improvs
S7 Ramp Closures
S9 On-Ramp amp Aux Lane Improvs
HOV EB
I-210 EB
Ramps
Arterials
-17
-11
-18
-18 -28
2006 Base Year S1 S3 S5 S7 S9 Scenario
Exhibit ES-27 2020 AM Peak Micro-Simulation Delay Results by Scenario
30000
De
lay
(Pe
ak
Pe
rio
d V
eh
icle
-Ho
urs
)
25000
20000
15000
10000
5000
S2 Expand Ramp Metering
S4 Adv Ramp Metering
S6 Aux Lane Striping Ramp Improvs
S8 Ramp Closures
HOV WB
I-210 WB
HOV EB
-8
-2 -8
-13 -12
S10 On-Ramp amp Aux Lane Improvs
S13 SR-134I-210 IC Modification
S14 Lake Ave Drop Ramp Lane Addition
I-210 EB
Ramps
Arterials
-11
-23
-
2020 S2 S4 S6 S8 S10 S13 S14 Horizon Scenario
I-210 Corridor System Management Plan Executive Summary
Page 31 of 39
Exhibit ES-28 2020 PM Peak Micro-Simulation Delay Results by Scenario D
ela
y(P
ea
k P
eri
od
Ve
hic
le-H
ou
rs)
30000
25000
20000
15000
10000
5000
-
S2 Expand Ramp Metering
S4 Adv Ramp Metering
S6 Aux Lane Striping Ramp Improvs
S8 Ramp Closures
HOV WB
I-210 WB
HOV EB
-14
S10 On-Ramp amp Aux Lane Improvs
S13 SR-134I-210 IC Modification
S14 Lake Ave Drop Ramp Lane Addition
I-210 EB
Ramps
Arterials
-2 -5 -3 -28
-3 -19
2020 S2 S4 S6 S8 S10 S13 S14 Horizon Scenario
Base Year and Do Minimum Horizon Year
Absent any physical improvements the modeling team estimates that by 2020 total delay (mainline HOV ramps and arterials) would double compared to 2006 (from a total of around 22000 vehicle-hours daily to just fewer than 45000 vehicle-hours) in the combined AM and PM peak
Scenarios 1 and 2 (Expand Ramp Metering)
Scenarios 1 and 2 test the only project on the corridor that was fully constructed and completed The project installed new connector metering at the SR-57 and I-605 to Ishy210 freeway connector ramps The project also widened various ramps removed various HOV meter bypasses and upgraded the ramp metering system
The 2006 model estimates that Scenario 1 would reduce delay on the corridor by around 17 percent (or 1600 daily vehicle-hours) in the PM peak period but only around two percent (or 200 vehicle-hours) in the AM peak period The biggest benefits occur in the PM eastbound direction from Rosemead On-Ramp to Huntington interchange (with a delay reduction of over 1000 vehicle-hours) as well as from I-605 to the Azusa On-Ramp (delay reduction of 500 vehicle-hours) for single occupant vehicles The
I-210 Corridor System Management Plan Executive Summary
Page 32 of 39
westbound reductions in freeway delay are largely offset by increased on-ramp delay mostly from new connector metering at SR-57 and I-605
The 2020 model estimates that Scenario 2 will reduce delay by around 8 percent in the AM peak and 14 percent in the PM peak for a combined total reduction of 5000 daily vehicle-hours The long-term improvements are less than the short-term improvements due to the increase in demand
Scenarios 3 and 4 (Advanced Ramp Metering)
Scenarios 3 and 4 build on Scenarios 1 and 2 by adding advanced ramp metering system such as dynamic or adaptive ramp metering system
The 2006 model shows that Scenario 3 would reduce delay by an additional 850 daily vehicle-hours (or 11 percent) in the PM peak with a marginal reduction in the AM peak period However in conjunction with Scenario 1 Scenario 3 reduces delay in total by over 600 vehicle-hours in the AM peak These results suggest that queue control provides additional benefits beyond SWARM
The 2020 model estimates that Scenario 4 will modestly reduce delay by about 2 percent in both the AM and PM peaks or a combined total of 800 daily vehicle-hours Again the benefits are lower in percentage terms due to the increase in demand
Note that there are various types of advanced ramp metering systems deployed around the world including System-wide Adaptive Ramp Metering System or SWARM tested recently in Los Angeles I-210 freeway corridor For the I-210 model the Asservissement Lineaire drsquoEntreacutee Autoroutiere (ALINEA system) was tested as proxy for any advanced ramp metering system as its algorithm for the model was readily available It is not necessarily recommended that ALINEA be deployed but rather some type of advanced ramp metering system that would produce similar if not better results
Scenarios 5 and 6 (Auxiliary Lane Striping Ramp Improvements)
Scenarios 5 and 6 build on Scenarios 3 and 4 that include several relatively lower-cost operational improvements that could be implemented by 2015
diams Building a westbound auxiliary lane from Santa Anita to Baldwin and an eastbound auxiliary lane from Santa Anita to Huntington
diams Extending a lane to Lincoln on the westbound I-210 connector
diams Connecting and converging the Altadena on-ramps into a single on-ramp
I-210 Corridor System Management Plan Executive Summary
Page 33 of 39
diams Connecting and converging the Santa Anita on-ramps into a single on-ramp
diams Connecting and converging the Irwindale on-ramps into a single on-ramp
diams Restriping to add a lane in the eastbound direction from San Dimas to Fruit
The 2006 model shows that Scenario 5 reduces delay by 3 percent (nearly 400 vehicleshyhours) in the AM peak and 18 percent (1200 vehicle-hours) in the PM peak The segment that experienced the largest improvement in the eastbound during the PM peak was from Rosemead to Huntington This segment experienced a 45 percent improvement in delay (from 2700 vehicle-hours to 1500 vehicle-hours) which is likely attributed to the eastbound auxiliary lane from Santa Anita to Huntington In the westbound direction the auxiliary lane from Santa Anita to Baldwin shifts some traffic downstream to cause increased congestion at Michillinda (ie bottleneck shift) during the westbound AM peak However the auxiliary lane helps reduce both queue length and queue duration for the Santa Anita bottleneck
The 2020 model estimates that Scenario 6 would reduce delay by 8 percent in the AM peak and 5 percent in the PM peak for a total reduction of 2500 daily vehicle-hours A reduction in PM delay is expected to occur mostly in the westbound direction
Scenarios 7 and 8 (Ramp Closures)
Scenarios 7 and 8 build on Scenarios 5 and 6 and test the closure of several ramps
diams Eastbound Marengo on-ramp and westbound Lake on-ramp with signalization of the eastbound I-210 off-ramp at Maple and improvement to alternate routes along Corson and Maple
diams Eastbound Mount Olive ramps
Note that subsequent scenarios are not built on top of these scenarios as these are isolated to test ramp closure alternatives
The 2006 model shows that Scenario 7 would reduce delay significantly by 16 percent in the AM peak and 18 percent in the PM peak for a total delay reduction of nearly 3000 daily vehicle-hours The delay reductions are significant on the mainline during the peak direction of travel ndash 1400 vehicle-hours in the westbound AM and 912 vehicleshyhours in the eastbound PM In the westbound direction and AM peak period the segment from Altadena to Lake experienced over an 85 percent decrease in congestion (from 860 to 120 vehicle-hours of delay) This is likely attributed to the closure of the westbound Lake on-ramp In the eastbound direction and PM peak period the segment from Huntington to I-605 experienced a delay reduction of over 70 percent (from 2200
I-210 Corridor System Management Plan Executive Summary
Page 34 of 39
vehicle-hours to 600 vehicle-hours) which is likely attributed to the closure of the Mount Olive ramp
The 2020 model also shows that Scenario 8 improved delay by 12 percent in the AM and 3 percent in the PM for a total delay reduction of almost 3000 daily vehicle-hours On the mainline facility delay also improved for each peak direction of travel ndash by 1600 daily vehicle-hours in the westbound AM and by 750 vehicle-hours in the eastbound PM Delay reductions in the non-peak direction were not as significant
Scenarios 9 and 10 (On-ramp and Aux Lane Improvements)
Scenarios 9 and 10 build on Scenarios 5 and 6 and test four operational improvements that can be implemented in the short to medium range
diams Modify the RosemeadMichillinda interchange and converge the westbound I-210 on-ramps
diams Modify the northside of the Baldwin interchange and eliminate the collectorshydistributor
diams Construct an eastbound auxiliary lane from Azusa to Citrus
diams Converge the eastbound Citrus on-ramps and add an auxiliary lane to Grand
The 2006 model estimates that Scenario 9 will reduce delay by 20 percent (or 2400 daily vehicle-hours) in the AM peak and 28 percent (or 1600 daily vehicle-hours) in the PM peak compared to Scenario 5 In both AM and PM peak period the eastbound direction experienced the largest reduction in delay
The 2020 model estimates that Scenario 10 will reduce delay by 13 percent (or 2500 vehicle-hours) in the AM peak and 28 percent in the PM peak (or 4800 vehicle-hours) compared to Scenario 6 Similar to the 2006 model the 2020 model shows that these improvements produced a greater reduction in delay in the eastbound direction than the westbound direction
Scenarios 11 and 12 (Enhanced Incident Management)
Two incident scenarios were tested on top of Scenario 10 to evaluate the non-recurrent delay reductions resulting from enhanced incident management strategies An enhanced incident management system would entail upgrading or enhancing the current Caltrans incident management system that includes deployment of intelligent transportation system (ITS) field devices central controlcommunications software communications medium (ie fiber optic lines) advanced traveler information system
I-210 Corridor System Management Plan Executive Summary
Page 35 of 39
andor freeway service patrol (FSP) program to reduce incident detection verification response and clearance times
In the first scenario Scenario 11 one collision incident with one lane closure was simulated in the westbound direction in the AM peak period model and one in the eastbound direction in the PM peak period model The incident simulation location and duration were selected based on review of the 2010 actual incident data at one of the high frequency locations The following are the Scenario details
diams Westbound AM peak period starting at 800 AM close mainline lane 2 for 40 minutes at absolute post mile 2612 (at Lake Avenue)
diams Eastbound PM peak period starting at 500 PM close mainline lane 2 for 50 minutes at absolute post mile 3207 (west of Santa Anita)
In the second scenario Scenario 12 the same collision incidents were simulated with a reduction in duration by 10 minutes in the westbound direction and by 12 minutes in the eastbound direction It is estimated based on actual incident management data analysis results provided by Caltrans that an enhanced incident management system could reduce a 35-minute incident by about 10 minutes This scenario represents a typical moderate level incident at one location during the peak period direction Data suggest that incidents vary significantly in terms of impact and duration Some incidents last hundreds of minutes some close multiple lanes and some occur at multiple locations simultaneously There are also numerous minor incidents lasting only a few minutes without lane closures that can result in congestion Many other incidents also occur during off-peak hours
Without enhanced incident management Scenario 11 produced an 8 percent increase in congestion in both peak periods over Scenario 10 an increase of over 2300 hours of vehicle delay With enhanced incident management Scenario 12 evaluation resulted in delay decrease by 2 percent in the AM peak and 3 percent in the PM peak against Scenario 11 results a reduction of nearly 750 vehicle-hours for improving the incident detection verification response and clearance time of one moderate level incident for both of the peak hours
Scenario 13 (SR-134I-210 Interchange Modification)
Scenario 13 tests an improvement to modify the SR-134I-210 interchange to provide a direct connection for vehicles to continue on I-210 with three lanes in each direction This improvement was tested with the 2020 model since it is not likely to be implemented in the short-term
I-210 Corridor System Management Plan Executive Summary
Page 36 of 39
The 2020 model estimates that delay would be reduced by 11 percent (or 1800 daily vehicle-hours) in the AM and 3 percent in the PM (320 daily vehicle-hours) compared to Scenario 10 The westbound mainline experienced the greatest reduction in delay in the AM peak from 9600 vehicle-hours to 8600 vehicle hours after the interchange modification
Scenario 14 (Westbound Drop Ramp and Eastbound Widening)
Scenario 14 builds on Scenario 13 and tests Lake Avenue drop ramp to westbound Ishy210 center lanes (one HOV lane and one mainline) and eastbound I-210 widening from Myrtle to I-605 This improvement was tested with the 2020 model
The 2020 model estimates that delay would be reduced by about 20 percent in the AM or 3400 vehicle-hours and 20 percent in the PM or 2300 vehicle-hours compared to Scenario 13 The mobility improvements are significant with the westbound drop ramp that reduces weaving between SR-134 and SR-210 destined traffic and with the eastbound capacity addition to I-605 off that moves the off-ramp traffic away from the mainline and provides more room for the mainline through traffic
Post Scenario 14 Conditions
By 2020 with the inclusion of all the projects tested the model reveals some residual congestion that remains to address with future improvements According to the model results the total remaining delay on the corridor is around 21000 daily vehicle-hours
Benefit-Cost Analysis
Following an in-depth review of model results by the study team and the SCAG technical committee the study team performed a benefit-cost analysis (BCA) for each scenario
Using the California Benefit-Cost Model (Cal-BC) developed on behalf of Caltrans by the study team benefits in three key areas were estimated travel time savings vehicle operating cost savings and emission reduction savings The benefits generated from this exercise are based solely on congestion relief related benefits However these results are conservative since there are other benefits not captured by this analysis including benefits from deploying bus rapid transit which will achieve other accessibility benefits
Project costs were developed from SCAG and Caltrans project planning and programming documents These costs include construction and support costs in current dollars The study team estimated costs for projects that did not have cost
I-210 Corridor System Management Plan Executive Summary
Page 37 of 39
estimates by reviewing similar completed projects A BC greater than one means that a scenarios projects return greater benefits than it costs to construct or implement It is important to consider the total benefits that a project brings For example a large capital expansion project can cost a great deal and have a low BC ratio but brings much higher absolute benefits to the I-210 users Exhibit ES-29 shows the benefit to cost ranges classified from low (with a BC of one to two) to very high (with a BC of over 10)
The benefit-cost results for the South Corridor scenarios are shown in Exhibit ES-29
Exhibit ES-29 I-210 Scenario BenefitCost (BC) Results
Scenario Scenario Description
BenefitCost Ranges
Low Medium Medium-High High Very High
lt1 1 to 2 2 to 5 5 to 10 gt10
12 Expand Ramp Metering 34 Advanced Ramp Metering 56 Aux Lane Striping Ramp Improvs 78 Ramp Closures
910 On-Ramp amp Aux Lane Improvs 13 SR-134I-210 IC Modification
The benefit-cost findings for each scenario are as follows
diams Scenarios 1 and 2 (ramp metering expansion) shows a high benefit-cost ratio of over ten The relatively high benefit-cost ratio is due to the low cost of expanding ramp metering ($235 million)
diams Scenarios 3 and 4 (advanced ramp metering) resulted in an incremental benefitshycost ratio of over ten This is relatively high as compared to that of typical transportation management system project
diams Scenarios 5 and 6 (operational improvements) produced a benefit-cost ratio of over five This is relatively consistent with other typical operational improvement projects The benefits are substantial At estimated total cost of about $44 million these projects produced benefits of over $233 million
diams Scenarios 7 and 8 tested the ramp closures at eastbound Marengo westbound Lake and eastbound Mount Olive These ramp closured produced an extremely high incremental benefit-cost ratio of over ten due to the relatively very low cost However this benefit-cost calculation does not account for any potential increase in delay on various local arterials because of detours from the closed ramps
diams Scenarios 9 and 10 also produced a relatively high benefit-cost ratio of over ten The four operational projects in these scenarios are collectively estimated to cost
I-210 Corridor System Management Plan Executive Summary
Page 38 of 39
under $30 million and provide a substantial and optimistic benefit of over $670 million
diams Scenario 13 tested the SR-134I-210 interchange modification This project produced a benefit-cost ratio of between one and two consistent with other typical capital expansion projects This project produced benefits of over $200 million at a rough-estimate cost of about $150 million
diams Scenario 14 tested the westbound center drop ramp from Lake Avenue interchange and eastbound lane addition from Myrtle to I-605 These projects produced a relatively high benefit-cost ratio of about 6 to one as compared to other capital improvement projects These two capital projects are unique in that they have specific operational improvement element that addresses major bottleneck locations For an estimated total combined cost of about $70 million the projected benefits exceed $420 million
CONCLUSIONS AND RECOMMENDATIONS
This section summarizes the conclusions and recommendations based on the analysis discussed in the previous section It is important to note that many of these conclusions are based primarily on the micro-simulation model results The model was developed based on the best data available at the time The study team reviewed the model results and believe that both the calibrated base year forecast year and scenario results are reasonable However Caltrans should always be cautious to make decisions based on modeling alone especially complex micro-simulation models
Based on the results the study team offers the following conclusions and recommendations
diams The combination of all scenarios significantly reduces overall congestion on the corridor Projected 2020 congestion after implementation of all scenarios is below 2006 levels in both the AM and PM peak period In the AM peak period the model projects total delay in 2020 after delivering all projects to be less than 11700 vehicle-hours compared to the 2006 base year delay of 13000 vehicleshyhours This represents a reduction of over 10 percent In the PM peak period the model projects total delay in 2020 after delivering all projects to be around 9500 hours compared to the 2006 base year delay of almost 9300 vehicle-hours This represents a slight reduction of 2 percent Clearly the scenarios deliver significant mobility benefits to the corridor Despite the growth in demand future 2020 congestion will be less than experienced in 2006
diams The completed ramp metering expansion project is expected to produce substantial mobility benefits of over $400 million Delay has been significantly reduced since 2006
I-210 Corridor System Management Plan Executive Summary
Page 39 of 39
diams Advanced ramp metering could provide additional mobility improvements by significantly reducing congestion and returning over $100 million in benefits
diams Ramp closures at Marengo Lake and Mount Olive as alternatives seem promising by reducing delay up to 3000 vehicle-hours per day and providing substantial benefits of $280 million at an extremely low cost
diams Operational improvements such as auxiliary lanes and ramp improvements could leverage on the ramp metering projects by making the corridor more efficient and productive that could result in additional mobility benefits of over $230 million
diams Additional capital improvements with specific operational elements to address weaving at major bottleneck locations could produce significant mobility benefits of over $420 million
diams Enhanced incident management system associated with Scenarios 11 and 12 to address non-recurrent congestion proved effective with a delay reduction of over 300 vehicle-hours for one modest level incident with a typical duration of 35 minutes reduced to 25 minutes With the I-210 corridor experiencing up to 2400 collisions per year this translates to a total annual delay savings of over 700000 vehicle-hours for the study corridor
diams The benefit-cost ratio of all scenarios combined is about 64 to 1 If all projects were delivered at current cost estimates the public would get over six dollars of benefits for each dollar expended In current dollars costs total to over $17 billion whereas the benefits are estimated to be over $20 billion
diams The projects also alleviate greenhouse gas (GHG) emissions by over 15 million tons over 20 years averaging over a 75000-ton reduction per year The emissions are estimated using data from the California Air Resources Board (CARB) EMFAC model
This is the first generation CSMP for the I-210 corridor It is important to stress that CSMPs should be updated on a regular basis This is particularly important since traffic conditions and patterns can differ from current projections After projects are delivered it is also useful to compare actual results with estimated ones in this document so that models can be further improved as appropriate
CSMPs or a variation thereof should become the normal course of business that is based on detailed performance assessments an in-depth understanding of the reasons for performance deterioration and an analytical framework that allows for evaluating complementary operational strategies that maximize the productivity of the current system
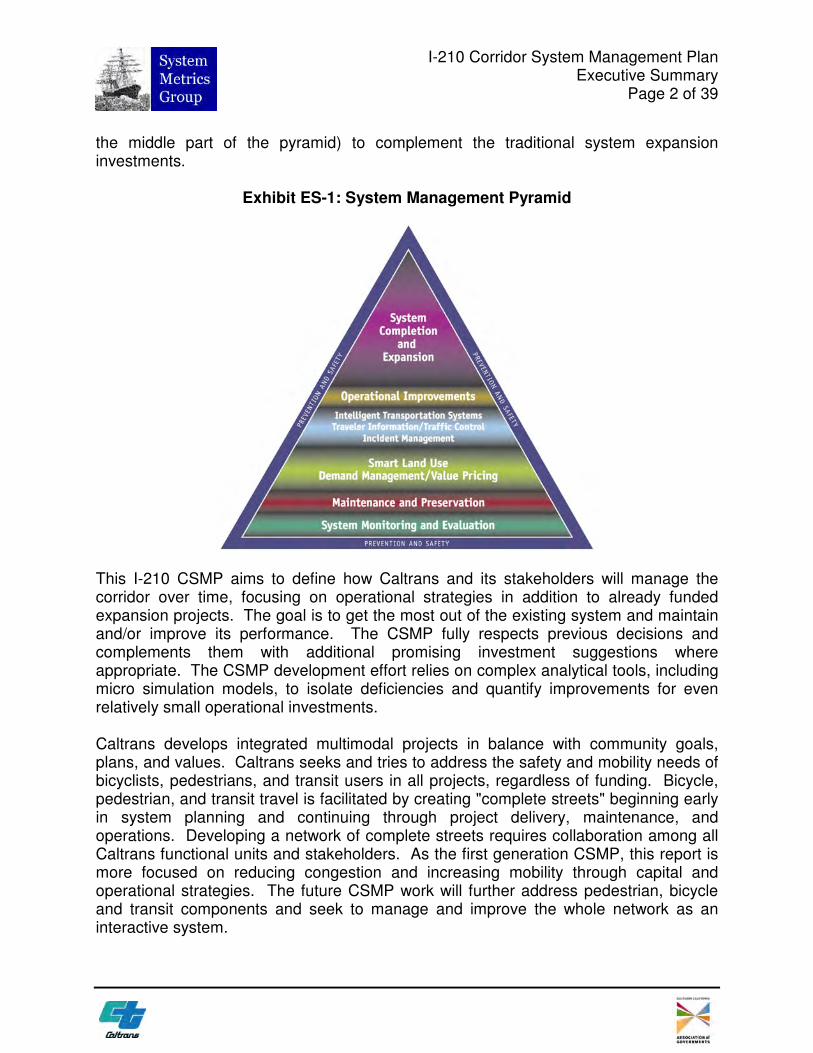
I-210 Corridor System Management Plan Executive Summary
Page 2 of 39
the middle part of the pyramid) to complement the traditional system expansion investments
Exhibit ES-1 System Management Pyramid
This I-210 CSMP aims to define how Caltrans and its stakeholders will manage the corridor over time focusing on operational strategies in addition to already funded expansion projects The goal is to get the most out of the existing system and maintain andor improve its performance The CSMP fully respects previous decisions and complements them with additional promising investment suggestions where appropriate The CSMP development effort relies on complex analytical tools including micro simulation models to isolate deficiencies and quantify improvements for even relatively small operational investments
Caltrans develops integrated multimodal projects in balance with community goals plans and values Caltrans seeks and tries to address the safety and mobility needs of bicyclists pedestrians and transit users in all projects regardless of funding Bicycle pedestrian and transit travel is facilitated by creating complete streets beginning early in system planning and continuing through project delivery maintenance and operations Developing a network of complete streets requires collaboration among all Caltrans functional units and stakeholders As the first generation CSMP this report is more focused on reducing congestion and increasing mobility through capital and operational strategies The future CSMP work will further address pedestrian bicycle and transit components and seek to manage and improve the whole network as an interactive system
I-210 Corridor System Management Plan Executive Summary
Page 3 of 39
STAKEHOLDER INVOLVEMENT
A technical committee was formed and met on an almost monthly basis to discuss progress technical challenges data needs and preliminary conclusions for the I-210 CSMP The technical committee included representatives from Caltrans the Southern California Association of Governments (SCAG) the Los Angeles County Metropolitan Transportation Authority (Metro) as well as consultant team members
The I-210 CSMP involved other corridor stakeholders such as representatives from cities bordering I-210 Caltrans briefed these stakeholders at critical milestones
Feedback from the stakeholders helped solidify the findings of the performance assessment bottleneck identification and causality analysis given their intimate knowledge of local conditions Moreover stakeholders have provided support and insight and shared valuable field and project data without which this study would not have been possible The stakeholders included representatives from the following organizations
diams San Gabriel Valley Council of Governments diams Los Angeles County Department of Public Works diams City of Arcadia diams City of Azusa diams City of Claremont diams City of Duarte diams City of Glendora diams City of Irwindale diams City of LaVerne diams City of Monrovia diams City of Pasadena diams City of San Dimas
Caltrans would like to thank all of its partners for contributing to this CSMP development process In addition the CSMP development provided a venue for tighter coordination between Caltrans planning and operations professionals which is critical to the success of the system management approach
I-210 Corridor System Management Plan Executive Summary
Page 4 of 39
CORRIDOR PERFORMANCE ASSESSMENT
This section briefly describes the I-210 corridor and summarizes the results of the comprehensive corridor performance assessment conducted
Corridor Description
Exhibit ES-2 shows the location of the Los Angeles County I-210 CSMP corridor The corridor extends approximately 45 miles from the I-5 (Golden State Freeway) interchange in the San Fernando Valley to the SR-57 (Orange Freeway) interchange It traverses the cities of San Fernando La Canada Flintridge Pasadena Arcadia Monrovia Duarte Azusa and San Dimas The focus of the CSMP is the 20-mile congested urban section between SR-134 and SR-57
The corridor is a divided eight- to ten-lane freeway with a concrete median and an additional outside auxiliary lane along most of the corridor A single High Occupancy Vehicle (HOV) lane exists in each direction through the congestion urban area that is the focus of the study corridor (from the SR-134 interchange to the SR-57 interchange)
According to Caltrans traffic volumes reported for 2008 Los Angeles I-210 carries between 76000 and 298000 annual average daily traffic (AADT) The highest average daily traffic volume on the corridor occurs at the SR-134 interchange and the lowest volume occurs near the I-5 interchange
I-210 is also a Surface Transportation Assistance Act (STAA) route that allows large trucks to operate on the mainline lanes According to the latest truck volumes from Caltrans trucks comprise between four and ten percent of total daily traffic along the corridor Higher truck percentages occur west of the SR-134 Many of these trucks travel eastbound to the Inland Empire home to many warehouses and distribution centers The trucks traveling westbound are typically headed north to connect to the I-5 corridor and beyond
Major transit operations along the I-210 Corridor include Metro bus and light rail Metrolink commuter rail Foothill Transit Los Angeles City Department of Transportation Commuter Express and Pasadena Area Rapid Transit System (ARTS)
Metro operates ten parallel local bus or bus rapid transit (BRT) routes near the I-210 corridor It also operates the Metro Rail Gold Line that provides light-rail service in the center median of I-210 from downtown Los Angeles Union Station to the Sierra Madre Villa station
1-210 Corridor Study A1rea
0 I 2 3 4 5 MIEB
llllilllilllilllil l+j
I-210 Corridor System Management Plan Executive Summary
Page 5 of 39
Exhibit ES-2 Los Angeles County I-210 CSMP Corridor Map
I-210 Corridor System Management Plan Executive Summary
Page 6 of 39
Foothill Transit provides four bus lines that serve Pasadena the City of Arcadia and the City of Duarte The City of Los Angeles Department of Transportation also operates two commuter service lines that service the San Gabriel Valley Other transit agencies such as the Pasadena Rapid Transit System and the Glendale Bee operate local bus service between residential neighborhoods and business centers The Metrolink Antelope Valley Line provides commuter rail service from the Antelope Valley along the I-5 and San Fernando Road to downtown Los Angeles
There are various bike routes near I-210 but none that parallel the study corridor Most of the bike routes near the corridor are Class III Bike Paths (preferred bike routes on existing streets identified by signs only) These routes are concentrated between I-110 and SR-19 Due to the terrain and uphill climb there are few bike paths west of SRshy134
Several roadway improvements have been recently completed In preparation for System-Wide Adaptive Ramp Metering (SWARM) implementation various on-ramps between SR-134 and SR-57 were modified to enhance metering with traffic signals on the HOV bypass lanes Freeway connector on-ramps from I-605 and SR-57 have been modified to implement connector metering with traffic signals Closed-circuit television (CCTV) cameras and fiber optic communications were also added throughout the corridor
In addition to major employment trip-generating activity centers in Pasadena area there are 14 collegesuniversities six major medical centers the Rose Bowl stadium Santa Anita Park Horse Track Irwindale Speedway and various large shopping malls The Bob Hope Airport in Burbank is also a major traffic generator for the I-210 corridor
Corridor Performance Assessment
The I-210 CSMP focuses on four categories of performance measures
diams Mobility describes how quickly people and freight move along the corridor diams Reliability captures the relative predictability of travel time along the corridor diams Safety provides an overview of collisions along the corridor diams Productivity quantifies the degree to which traffic inefficiencies at bottlenecks or
hot spots reduce flow rates along the corridor
Mobility
Two primary measures quantify mobility in this report delay and travel time Each is estimated from field automatic detection data from the Performance Measurement System1 (PeMS) provided access to the historical freeway detection data needed to
1 Developed and maintained by Caltrans and accessible at pemsdotcagov
I-210 Corridor System Management Plan Executive Summary
Page 7 of 39
estimate the two mobility measures PeMS collects detector volume and occupancy data on the freeway which were used to estimate speed delay and travel time
Delay
Delay is defined as the observed travel time less the travel time at uncongested conditions and is reported as vehicle-hours of delay The assessment summarized the results for the five-year period between 2005 and 2009 Delays in this report were calculated as the difference in travel time between estimated speeds and free-flow conditions at 60 mph applied to the observed volume Exhibit ES-2 shows the average daily vehicle-hours of delay for each month between 2005 and 2009 for both mainline and high occupancy vehicle (HOV) lanes This exhibit reveals the following trends
diams Prior to 2007 the eastbound and westbound directions experienced similar delay levels on both the mainline and HOV lanes The HOV lanes comprise approximately 15 to 20 percent of the total estimated delay on the corridor
diams Congestion on the westbound mainline lanes experienced extreme peaking ndash likely caused by construction on the corridor between 2007 and 2008 The eastbound lanes did not experience much change in delay in 2007 but declined through 2008 The HOV facility did not experience significant change during this time
diams In 2009 the estimated delay on the eastbound mainline lanes increased dramatically while in contrast the westbound lanes declined sharply The HOV lane showed a similar trend with the eastbound HOV lane exceeding the delay in the westbound direction
I-210 Corridor System Management Plan Executive Summary
Page 8 of 39
Exhibit ES-3 Average Weekday Delay by Month (2005-2009) 16000
Av
era
ge
Da
ily
Ve
hic
le-H
ou
rs o
f D
ela
y (
6
0m
ph
)
15000
14000
13000
12000
11000
10000
9000
8000
7000
6000
5000
4000
3000
2000
1000
-
Ja
nF
eb
Ma
rA
pr
Ma
yJ
un
Ju
lA
ug
Se
pO
ct
No
vD
ec
Ja
nF
eb
Ma
rA
pr
Ma
yJ
un
Ju
lA
ug
Se
pO
ct
No
vD
ec
Ja
nF
eb
Ma
rA
pr
Ma
yJ
un
Ju
lA
ug
Se
pO
ct
No
vD
ec
Ja
nF
eb
Ma
rA
pr
Ma
yJ
un
Ju
lA
ug
Se
pO
ct
No
vD
ec
Ja
nF
eb
Ma
rA
pr
Ma
yJ
un
Ju
lA
ug
Se
pO
ct
No
vD
ec
2005 2006 2007 2008 2009
Eastbound ML
Westbound ML
Eastbound HOV
Westbound HOV
Month
The CSMP separates delay further into two components severe delay and other delay Severe delay is delay that occurs when speeds are below 35 mph and other delay occurs where speeds are between 35 and 60 mph Severe delay represents breakdown conditions ldquoOtherrdquo delay represents conditions approaching or leaving the breakdown congestion or areas that cause temporary slowdowns However it can also be a leading indicator of future severe delay
Exhibits ES-4 (Mainline lanes) and ES-5 (HOV lanes) show average severe and other daily vehicle-hours of delay by day of the week A few notes related to ES-4 and ES-5
diams Severe delay makes up about 70 percent of all weekday delay on the corridor in either the eastbound or the westbound direction Severe delay on Saturdays and SundaysHolidays tend to be under 70 percent while weekday severe delay averages around 75 percent of all delay As in Exhibit ES-3 HOV delays tend to range between 14 and 25 percent of total delay
diams Fridays in the eastbound direction experience the highest delays probably due to weekend travel The second highest delays generally occurred on Thursdays In the westbound direction the day of week trends are typical for urban commute corridors with the midweek days experiencing the highest delays with Monday and Friday showing slightly less congestion and the weekends showing much lower delays than during the week
Av
era
ge D
aily V
eh
icle
-Ho
urs
of
Dela
y (
60
mp
h)
Av
era
ge D
aily V
eh
icle
-Ho
urs
of
Dela
y (
60
mp
h)
I-210 Corridor System Management Plan Executive Summary
Page 9 of 39
Exhibit ES-4 Mainline Lane Delay by Day of Week (2005-2009) 16000
15000
14000
13000
12000
11000
10000
9000
8000
7000
6000
5000
4000
3000
2000
1000
-
Mainline Other Delay
Mainline Severe Delay M
on
T
ue
Wed
T
hu
F
riS
at
Su
n
Ho
lM
on
Tu
eW
ed
Th
uF
riS
at
Su
n
Ho
lM
on
Tu
eW
ed
Th
uF
riS
at
Su
n
Ho
lM
on
Tu
eW
ed
Th
uF
riS
at
Su
n
Ho
lM
on
Tu
eW
ed
Th
uF
riS
at
Su
n
Ho
lM
on
Tu
eW
ed
Th
uF
riS
at
Su
n
Ho
lM
on
Tu
eW
ed
Th
uF
riS
at
Su
n
Ho
lM
on
Tu
eW
ed
Th
uF
riS
at
Su
n
Ho
lM
on
Tu
eW
ed
Th
uF
riS
at
Su
n
Ho
lM
on
Tu
eW
ed
Th
uF
riS
at
Su
n
Ho
l
2005 2006 2007 2008 2009 2005 2006 2007 2008 2009
EASTBOUND WESTBOUND
Exhibit ES-5 HOV Lane Delay by Day of Week (2005-2009) 4000
3500
3000
2500
2000
1500
1000
500
-
Mo
nT
ue
Wed
Th
uF
riS
at
Su
n
Ho
lM
on
Tu
eW
ed
Th
uF
riS
at
Su
n
Ho
lM
on
Tu
eW
ed
Th
uF
riS
at
Su
n
Ho
lM
on
Tu
eW
ed
Th
uF
riS
at
Su
n
Ho
lM
on
Tu
eW
ed
Th
uF
riS
at
Su
n
Ho
lM
on
Tu
eW
ed
Th
uF
riS
at
Su
n
Ho
lM
on
Tu
eW
ed
Th
uF
riS
at
Su
n
Ho
lM
on
Tu
eW
ed
Th
uF
riS
at
Su
n
Ho
lM
on
Tu
eW
ed
Th
uF
riS
at
Su
n
Ho
lM
on
Tu
eW
ed
Th
uF
riS
at
Su
n
Ho
l
2005 2006 2007 2008 2009 2005 2006 2007 2008 2009
EASTBOUND WESTBOUND
Other Delay
Severe Delay
I-210 Corridor System Management Plan Executive Summary
Page 10 of 39
Exhibits ES-6 and ES-7 summarize average annual weekday delay by hour of the day over the five-year period for the mainline northbound and southbound lanes respectively These exhibits allow planners and decision makers to understand the trend in peak period delay spiking and peak period spreading by comparing the intensity and duration of the peak period congestion Note that the HOV lanes are not shown in this summary report since they follow similar peaking trends as the mainline lanes (the main technical report contains the HOV delay by hour results) A few notes on these two exhibits
diams The eastbound direction peaks in the PM peak period while the AM is the westbound peak AM peak hour is 700 AM while the PM peak period is 500 PM
diams In the eastbound PM direction congestion grew dramatically in 2009 while westbound AM congestion declined This is also evident in Exhibit ES-2 Eastbound delay between 2005 and 2008 remained relatively constant at about 1750 vehicle-hours during the 500 PM peak hour before increasing in 2009 to about 2100 vehicle-hours
diams Westbound AM congestion declined in 2009 after two years of dramatic growth between 2007 and 2008 In 2009 the AM peak period also shrank by approximately one-half hour and started at approximately 530 AM whereas from 2005 to 2008 the peak period started around 500 AM
Exhibit ES-6 Eastbound Mainline Lanes Hourly Delay (2005-2009)
0
250
500
750
1000
1250
1500
1750
2000
2250
2500
Ave
rag
e D
ail
y V
eh
icle
Ho
urs
of
Dela
y (
60
mp
h) 2009 Weekday
2008 Weekday
2007 Weekday
2006 Weekday
2005 Weekday
00
0
10
0
20
0
30
0
40
0
50
0
60
0
70
0
80
0
90
0
100
0
110
0
120
0
130
0
140
0
150
0
160
0
170
0
180
0
190
0
200
0
210
0
220
0
230
0
Hour of the Day
I-210 Corridor System Management Plan Executive Summary
Page 11 of 39
Exhibit ES-7 Westbound Mainline Lanes Hourly Delay (2005-2009)
0
250
500
750
1000
1250
1500
1750
2000
2250
2500
Ave
rag
e D
ail
y V
eh
icle
Ho
urs
of
Dela
y (
60m
ph
) 2009 Weekday
2008 Weekday
2007 Weekday
2006 Weekday
2005 Weekday
00
0
10
0
20
0
30
0
40
0
50
0
60
0
70
0
80
0
90
0
100
0
110
0
120
0
130
0
140
0
150
0
160
0
170
0
180
0
190
0
200
0
210
0
220
0
230
0
Hour of the Day
Travel Time
The travel time performance measure represents the average time it takes for a vehicle to travel between SR-134 and SR-57 a distance of approximately 20 miles
Exhibits ES-8 and ES-9 summarize mainline estimated average weekday travel times by hour of day for the 2005-2009 five-year period Exhibits ES-10 and ES-11 show the same results for the HOV facility Similar to delay travel times increased in 2009 in the eastbound PM direction and time but decreased in the westbound AM commute period
In the mainline lanes the eastbound PM peak hour (500 PM) travel time grew from 40 minutes in 2008 to 44 minutes in 2009 In the westbound AM peak hour (700 AM) the opposite trend occurred with travel times dropping from a 41 minute average in 2008 to around 36 minutes in 2009
A similar trend occurred for the HOV lanes except that 2005 was the worst year in terms of travel times
Tra
ve
l T
ime
(m
inu
tes
) T
rav
el
Tim
e (
min
ute
s)
45
40
35
30
25
20
15
10
5
0
45
40
35
30
25
20
15
10
5
0
I-210 Corridor System Management Plan Executive Summary
Page 12 of 39
Exhibit ES-8 Eastbound Mainline Lanes Travel Time by Hour (2005-2009) 50
2009 Average Travel Time
2008 Average Travel Time
2007 Average Travel Time
2006 Average Travel Time
2005 Average Travel Time
Travel Time 60mph
Travel Time 35mph
Hour of the Day
00
0
10
0
20
0
30
0
40
0
50
0
60
0
70
0
80
0
90
0
100
0
110
0
120
0
130
0
140
0
150
0
160
0
170
0
180
0
190
0
200
0
210
0
220
0
Hour of the Day
Exhibit ES-9 Westbound Mainline Lanes Travel Time by Hour (2005-2009) 50
2009 Average Travel Time
2008 Average Travel Time
2007 Average Travel Time
2006 Average Travel Time
2005 Average Travel Time
Travel Time 60mph
Travel Time 35mph
00
0
10
0
20
0
30
0
40
0
50
0
60
0
70
0
80
0
90
0
10
00
11
00
12
00
13
00
14
00
15
00
16
00
17
00
18
00
19
00
20
00
21
00
22
00
230
0
23
00
Tra
ve
l T
ime
(m
inu
tes
) T
rav
el
Tim
e (
min
ute
s)
45
40
35
30
25
20
15
10
5
0
45
40
35
30
25
20
15
10
5
0
I-210 Corridor System Management Plan Executive Summary
Page 13 of 39
Exhibit ES-10 Eastbound HOV Lanes Travel Time by Hour (2005-2009) 50
2009 Average Travel Time
2008 Average Travel Time
2007 Average Travel Time
2006 Average Travel Time
2005 Average Travel Time
Travel Time 60mph
Travel Time 35mph
Hour of the Day
00
0
10
0
20
0
30
0
40
0
50
0
60
0
70
0
80
0
90
0
100
0
110
0
120
0
130
0
140
0
150
0
160
0
170
0
180
0
190
0
200
0
210
0
220
0
Hour of the Day
Exhibit ES-11 Westbound HOV Lanes Travel Time by Hour (2005-2009) 50
2009 Average Travel Time
2008 Average Travel Time
2007 Average Travel Time
2006 Average Travel Time
2005 Average Travel Time
Travel Time 60mph
Travel Time 35mph
00
0
10
0
20
0
30
0
40
0
50
0
60
0
70
0
80
0
90
0
100
0
110
0
120
0
130
0
140
0
150
0
160
0
170
0
180
0
190
0
200
0
210
0
220
0
230
0
230
0
I-210 Corridor System Management Plan Executive Summary
Page 14 of 39
Reliability
Reliability captures the degree of predictability in travel time Reliability focuses on how travel time varies from day to day and reflects the impacts of accidents incidents weather and special events Improving reliability is an important goal for transportation agencies and efforts to accomplish this include incident management traveler information and special event planning
To measure reliability the CSMP used the ldquobuffer indexrdquo which reflects the additional time required (over and beyond the average) to ensure an on-time arrival 95 percent of the time In other words if a person must be on time 95 days out of 100 (or 19 out of 20 workdays per month) then that person must add additional time to their average expected travel time to ensure an on-time arrival That additional time is the buffer time Severe events such as collisions could cause longer travel times but the 95th percentile represents a balance between days with extreme events (eg major accidents) and other more ldquotypicalrdquo travel days
Exhibits ES-12 and ES-13 show the estimated mainline lane travel time variability along I-210 on non-holiday weekdays for 2006 in the eastbound and westbound directions respectively The main report shows the buffer index for the years 2005-2009 for both mainline and HOV lanes but this Executive Summary reports only the data for the year 2006 for mainlines since that year was used as the base year for modeling
The following observations on the reliability results are worth noting
bull In 2006 in the eastbound direction 500 PM had the highest estimated average travel time at approximately 41 minutes and the highest estimated buffer index time of 15 minutes for a buffer index of 33 percent In other words to arrive on time 95 percent of the time a commuter would need to leave for work 56 minutes before the start time to travel the entire length of the I-210 study corridor
bull The westbound direction the 700 AM had the estimated average travel time of 39 minutes in 2006 with a buffer time of 15 minutes for a buffer index of 38 percent
70
65
60
55
50
45
40
35
30
25
20
15
10
5
0
70
65
60
55
50
45
40
35
30
25
20
15
10
5
0
Average Travel Time
Travel Time Variability (95th Percentile)
Travel Time at 60mph
Travel Time at 35mph
TIME OF DAY
Exhibit ES-13 Westbound Mainline Lanes Travel Time Variability (2006)
75
TIME OF DAY
Average Travel Time
Travel Time Variability (95th Percentile)
Travel Time at 60mph
Travel Time at 35mph
Exhibit ES-12 Eastbound Mainline Lanes Travel Time Variability (2006)
75
I-210 Corridor System Management Plan Executive Summary
Page 15 of 39
TR
AV
EL
TIM
E (
MIN
)
00
000
0
10
010
0
TR
AV
EL
TIM
E (
MIN
)
20
020
0
30
030
0
40
040
0
50
050
0
60
060
0
70
070
0
80
080
0
90
090
0
100
01
00
0
110
01
10
0
120
01
20
0
130
01
30
0
140
01
40
0
150
01
50
0
160
01
60
0
170
01
70
0
180
01
80
0
190
01
90
0
200
02
00
0
210
02
10
0
220
02
20
0
230
02
30
0
00
0
00
0
I-210 Corridor System Management Plan Executive Summary
Page 16 of 39
Safety
The adopted performance measures to assess safety involve the number of accidents and the accident rates computed from the Caltrans Traffic Accident Surveillance and Analysis System (TASAS) TASAS is a traffic records system containing an accident database linked to a highway database The highway database contains descriptive elements of highway segments intersections and ramps access control traffic volumes and other data TASAS contains specific data for accidents on State highways Accidents on non-State highways are not included (eg local streets and roads)
The safety assessment in this report intends to characterize the overall accident history and trends in the corridor and to highlight notable accident concentration locations or patterns that are readily apparent This report does not intend to supplant more detailed safety investigations routinely performed by Caltrans staff
Exhibits ES-14 and ES-15 show the I-210 total number of eastbound and westbound accidents by month respectively For the accident analysis the corridor is split in half the ldquoless urbanrdquo western half of the corridor from I-5 (postmile 0) in Sylmar to SR-134 in Pasadena (postmile R2200) and the ldquomore urbanrdquo eastern half from SR-134 to SR-57 (postmile R45) in San Dimas The latest available TASAS data from PeMS is to December 30 2008 Accidents are reported for the study corridor and not separated by mainline and HOV facility The exhibits summarize the latest available three-year data from January 1 2006 through December 31 2008
Both the eastbound and westbound directions have similar accident profiles with the more urbanized eastern half of the corridor (postmile R22 to R45) experiencing nearly 45 times as many accidents as the western half (PM 0 to R22) The eastbound (Exhibit ES-13) direction has around 79 accidents on average per month in the more-urbanized section and just fewer than 18 accidents in the less-urbanized section
The westbound direction has just fewer than 78 accidents on average per month in the more-urbanized section and just fewer than 18 in the less-urbanized section This is very similar to the eastbound direction
Nu
mb
er
of
Ac
cid
en
ts
Nu
mb
er
of
Accid
en
ts
I-210 Corridor System Management Plan Executive Summary
Page 17 of 39
Exhibit ES-14 Eastbound I-210 Monthly Collisions (2004-2008) 120
110
100
90
80
70
60
50
40
30
20
10
0
Jan
Feb
Mar
Ap
rM
ay
Ju
nJu
lA
ug
Sep
Oct
No
vD
ec
Jan
Feb
Mar
Ap
rM
ay
Ju
nJu
lA
ug
Sep
Oct
No
vD
ec
Jan
Feb
Mar
Ap
rM
ay
Ju
nJu
lA
ug
Sep
Oct
No
vD
ec
Jan
Feb
Mar
Ap
rM
ay
Ju
nJu
lA
ug
Sep
Oct
No
vD
ec
Jan
Feb
Mar
Ap
rM
ay
Ju
nJu
lA
ug
Sep
Oct
No
vD
ec
2004 2005 2006 2007 2008
Less Urbanized Western Section (I-5 to SR-134)
More Urbanized Eastern Section (SR-134 to SR-57)
110
100
90
80
70
60
50
40
30
20
10
0
Exhibit ES-15 Westbound I-210 Monthly Collisions (2004-2008) 120
Jan
Feb
Mar
Ap
rM
ay
Ju
nJu
lA
ug
Sep
Oct
No
vD
ec
Jan
Feb
Mar
Ap
rM
ay
Ju
nJu
lA
ug
Sep
Oct
No
vD
ec
Jan
Feb
Mar
Ap
rM
ay
Ju
nJu
lA
ug
Sep
Oct
No
vD
ec
Jan
Feb
Mar
Ap
rM
ay
Ju
nJu
lA
ug
Sep
Oct
No
vD
ec
Jan
Feb
Mar
Ap
rM
ay
Ju
nJu
lA
ug
Sep
Oct
No
vD
ec
2004 2005 2006 2007 2008
Less Urbanized Western Section (I-5 to SR-134)
More Urbanized Eastern Section (SR-134 to SR-57)
I-210 Corridor System Management Plan Executive Summary
Page 18 of 39
Productivity
Productivity is a system efficiency measure used to analyze the throughput of the corridor during congested conditions Restoring lost productivity is one focus area of CSMPs
Exhibit ES-16 illustrates how congestion leads to lost productivity The exhibit uses observed I-210 data from sensors for a typical spring 2010 afternoon peak period (Thursday May 6 2010) It shows speeds (red line) and flow rates (blue line) on eastbound I-210 at Huntington Drive one of the most congested locations on the corridor
Flow rates (measured as vehicle-per-hour-per-lane or ldquovphplrdquo) at Huntington Drive averaged around 1800 vphpl between 200 PM and 300 PM Once volumes approach a maximum flow rate of around 2000 vphl traffic becomes unstable Any additional merging or weaving traffic breaks down and speeds can rapidly plummet to below 35 mph In essence every incremental merge takes up two spots on the freeway for a short time However since the volume is close to the capacity these merges lead to queues Moreover rather than accommodating the same number of vehicles flow rates also drop and vehicles back up creating bottlenecks and associated congestion
At the location shown in Exhibit ES-16 throughput drops by over 30 percent on average during the peak period (from over 1800 to around 1200 vphpl) This five-lane road therefore operates as if lost 30 percent capacity when demand is at its highest Stated differently just when the corridor needed the most capacity it performed in the least productive manner and effectively lost lanes This loss in throughput can be aggregated and presented as ldquoEquivalent Lost-Lane-Milesrdquo
I-210 Corridor System Management Plan Executive Summary
Page 19 of 39
Exhibit ES-16 Lost Productivity Illustrated
70 2000
65
60 1750
50
55 1500
SP
EE
D
45 1250
40
35 1000
30 Speed lt35mph
750 25
20 500 I-210 EB
15 Los Angeles County Huntington
10 PM=3338 250
May 6 2010 5 VDS ID 761141
0 -
FL
OW
RA
TE
(VP
HP
L)
140
0
143
0
150
0
153
0
160
0
163
0
170
0
173
0
180
0
183
0
190
0
193
0
TIME The estimated average non-holiday weekday lost lane-miles by period and year on Ishy210 are shown Exhibits ES-17 (mainline) and ES-18 (HOV) A few notes on these two exhibits
diams The trends in the productivity losses are comparable to the delay trends The largest productivity losses occurred in the eastbound direction during the PM peak hours which is the direction and time period that experienced the most congestion
diams On the mainline facility the westbound direction experienced nearly as high productivity loses during the AM peak period
diams On the HOV lanes a greater productivity loss in the eastbound peak period is more evident
Operational strategies are critical to recovering such productivity losses These strategies include building new or extending auxiliary lanes developing more aggressive ramp metering strategies without negatively influencing the arterial network and improving incident clearance times
I-210 Corridor System Management Plan Executive Summary
Page 20 of 39
Exhibit ES-17 Mainline Daily Equivalent Lost Lane-Miles by Direction and Period (2005-09)
-
10
20
30
40
50
60
70
80
90
100
110
120
130
140
150
160
2005 2006 2007 2008 2009 2005 2006 2007 2008 2009 2005 2006 2007 2008 2009 2005 2006 2007 2008 2009
Eastbound
Westbound
AM PM Midday Night Time Period and Year
Daily
Eq
uiv
ale
nt
Lost
Lan
e-M
iles
Exhibit ES-18 HOV Daily Equivalent Lost Lane-Miles by Direction and Period (2005-09)
-
10
20
30
40
2005 2006 2007 2008 2009 2005 2006 2007 2008 2009 2005 2006 2007 2008 2009 2005 2006 2007 2008 2009
Eastbound
Westbound
AM Midday PM Night
Daily
Eq
uiv
ale
nt
Lost
Lan
e-M
iles
Time Period and Year
I-210 Corridor System Management Plan Executive Summary
Page 21 of 39
BOTTLENECK IDENTIFICATION AND CAUSALITY ANALYSIS
Exhibits ES-19 and ES-20 summarize the eastbound and westbound bottleneck locations the time period that each bottleneck is generally active and the causes of the each bottleneck Exhibits ES-21 and ES-22 are maps of the corridor showing these bottleneck locations for the AM and PM peak periods respectively
Major bottlenecks are the primary cause of congestion and lost productivity By definition a bottleneck is a condition where traffic demand exceeds the effective carrying capacity of the roadway In most cases the cause of a bottleneck is related to a sudden reduction in capacity such as a lane drop merging and weaving driver distractions a surge in demand or a combination of factors
The specific location and causality of each major I-210 bottleneck was verified by multiple field observations on separate weekdays throughout the summer fall and winter of 2009 Some bottleneck locations were videotaped to validate bottlenecks and to assist in micro-simulation model calibration
The detailed final report explains in detail the process and results of the bottleneck identification and causality analysis
I-210 Corridor System Management Plan Executive Summary
Page 22 of 39
Exhibit ES-19 I-210 Eastbound Bottleneck Locations
Abs CA Bottleneck
Location
Active
Period Causality Summary
AM PM
250 R250 Fair Oaks Heavy ramp merge
265 R265 Lake On-ramp Heavy ramp merge
286 R287 San Gabriel On-ramp Heavy ramp merge roadway curves
294 R294 Rosemead On-ramp Heavy consecutive ramp merge
330 R327 Huntington Interchange Heavy ramp merge roadway curves
366 R363 I-605 On-ramp traffic weaving with the off-ramp
400 R397 Azusa On-ramp Heavy ramp merge
408 R406 Citrus On-ramp Heavy ramp merge
450 R450 SR-57 On-ramp Heavy ramp merge and lane drop
Exhibit ES-20 I-210 Westbound Bottleneck Locations
Abs CA
Bottleneck
Location
Active
Period Causality Summary
AM PM
401 R398 Azusa On-ramp Consecutive ramp merge curves
368 R365 I-605 Off-ramp Consecutive ramp merge weaving
322 R319 Santa Anita On-ramp Heavy ramp merge roadway curves
307 R304 Baldwin On-ramp Heavy consecutive ramp merge
297 L297 Rosemead On-ramp Three consecutive ramp merges weaving
280 R281 Altadena On-ramp Heavy ramp merge
261 R261 Lake On-ramp Heavy ramp merge
Bottleneck Locations
reg --Bottleneck
Westbound
Eastbound
0 1 2
I bull I I I bull I I I Miles
HJOUAIIO fl _
I-210 Corridor System Management Plan Executive Summary
Page 23 of 39
Exhibit ES-21 I-210 Map of AM Bottleneck Locations
Bottleneck Locations
reg Bottleneck - Westbound - Eastbound
N 0 1 2
bull I I II II II I ll) Mles s
HJOUAIIO fl _
I-210 Corridor System Management Plan Executive Summary
Page 24 of 39
Exhibit ES-22 I-210 Map of PM Bottleneck Locations
I-210 Corridor System Management Plan Executive Summary
Page 25 of 39
SCENARIO DEVELOPMENT AND ANALYSIS
Fully understanding how a corridor performs and why it performs the way it does sets the foundation for evaluating potential solutions Several steps were required to develop and evaluate improvements including
diams Developing traffic models for 2006 base year and 2020 long-term demand diams Combining projects in a logical manner for modeling and testing diams Evaluating model outputs and summarizing results diams Conducting a benefit-cost assessment of scenarios
Traffic Model Development
The study team developed a traffic model using the VISSIM micro-simulation software It is important to note that micro-simulation models are complex to develop and calibrate for a large urban corridor However it is one of the only tools capable of providing a reasonable approximation of bottleneck formation and queue development Therefore such tools help quantify the impacts of operational strategies which traditional travel demand models cannot
The model was calibrated against 2006 conditions This was a resource intensive effort requiring several iterations of submittals and review cycles until the model reasonably matched bottleneck locations and relative severity Once calibration was approved a 2020 model was also developed based on SCAGrsquos travel demand model demand projections
These two models were used to evaluate different scenarios (combinations of projects) to quantify the associated congestion relief benefits and to compare total project costs against their benefits
Exhibit ES-23 depicts the network included in the model There were no parallel arterials modeled with the exception of arterials at interchanges All freeway interchanges were included as well as on-ramps and off-ramps
I-210 Corridor System Management Plan Executive Summary
Page 26 of 39
Exhibit ES-23 Micro-Simulation Model Network
I-210 Corridor System Management Plan Executive Summary
Page 27 of 39
Scenario Development Framework
The study team developed a framework for combining projects into scenarios It would be desirable to evaluate every possible combination of projects However this would have entailed thousands of model runs Instead the team combined projects based on a number of factors including
diams Projects that were fully constructed and completed from 2006 to 2010 were tested with both the 2006 and 2020 models
diams Short- and mid- term operational projects were grouped into scenarios and tested with the both the 2006 and 2020 models
diams Longer-range projects to be delivered by 2020 and beyond were used to develop scenarios to be tested with the 2020 model only
diams Alternative ramp closures were grouped into isolated scenarios (future scenarios did not build on top of these) and tested with both the 2006 and 2020 models
The study assumes that projects delivered before 2016 could reasonably be evaluated using the 2006 base year model The 2020 forecast year for the I-210 study was consistent with the SCAG 2020 regional travel demand model origin-destination matrices used to develop the 2008 Regional Transportation Plan (RTP) When SCAG updates its travel demand model and Regional Transportation Plan (RTP) it may wish to update the micro-simulation model with revised demand projections
Project lists used to develop scenarios were part from the Regional Transportation Improvement Program (RTIP) the RTP and other sources such as special studies Projects that do not directly affect mobility were eliminated For instance sound wall landscaping or minor arterial improvement projects were not evaluated since microshysimulation models cannot evaluate them
Scenario testing performed for the performed for the I-210 CSMP differed from traditional ldquoalternatives evaluationsrdquo done for Major Investment Studies (MIS) or Environmental Impact Reports (EIRs) An MIS or EIR focuses on identifying alternative solutions to address current or projected corridor problems so each alternative is evaluated separately and results among competing alternatives are compared resulting in a locally preferred alternative In contrast for the I-210 CSMP scenarios build on each other in that a scenario contains the projects from the previous scenario plus one or more projects as long as the incremental scenario results showed an acceptable level of performance improvement This incremental scenario evaluation approach is important since CSMPs are new and are often compared with alternatives studies
Exhibit ES-24 summarizes the approach used and scenarios tested and provides a
I-210 Corridor System Management Plan Executive Summary
Page 28 of 39
general description of the projects included in the 2006 and 2020 micro-simulation runs Most projects were tested for both the short- and long-term timeframes Each scenario tested was built upon prior scenarios except for Scenarios 7 and 8 which were ldquostand alonerdquo scenarios used to test alternative ramp closures Later scenarios build on Scenarios 5 and 6 and do not include the improvements tested in Scenarios 7 and 8 Enhanced incident management was tested in Scenarios 11 and 12 by comparing a simulated incident without and with enhanced incident management system Scenarios 13 and 14 are expected for the longer term and were tested only with the 2020 model
Exhibit ES-24 Micro-Simulation Modeling Approach
Short-Term Scenarios Long-Term Scenarios
Calibrated 2006 Base Case
Scenario 1 Expand Ramp-
Metering
Scenario 3 Scenario 1 +
Adv Ramp-Meter w
Queue Control
Scenario 5 Scenario 3 + aux lane striping and
ramp improvements
2020 Horizon Year
2006 Network 2020 OD Matrices
Scenario 7 Scenario 5 +
Ramp Closures
Scenario 2 Expand Ramp-
Metering
Scenario 4 Scenario 2 +
Adv Ramp-Meter w
Queue Control
Scenario 6 Scenario 4 + aux lane striping and
ramp improvements
Scenario 8 Scenario 6 +
Ramp Closures
Scenario 14 Scenario 13 + Lake
Ave Drop Ramp
Lane Addition
Scenario 9 Scenario 5+
On-Ramp amp Aux
lane improvements
Scenario 10 Scenario 6 +
On-Ramp amp Aux
lane improvements
Scenario 11 Incident with No
Incident
Management
Scenario 12 Incident With
Incident
Management
Scenario 13 Scenario 10 +
134210 IC
modification
Incident Management Scenarios
I-210 Corridor System Management Plan Executive Summary
Page 29 of 39
Scenario Evaluation Results
Exhibits ES-25 and ES-26 show the delay results for all the 2006 scenarios evaluated for the AM and PM peak periods respectively Exhibits ES-27 and ES-28 show the delay results for all the 2020 scenarios evaluated for the AM and PM peak periods respectively For each scenario the modeling team produced results by facility type (ie mainline HOV arterials and ramps) and vehicle type (SOV HOV trucks) as well as speed contour diagrams (discussed in more detail in the full technical CSMP) The study team scrutinized to ensure that they were consistent with general traffic engineering principles The following summarizes the findings related to the four exhibits
Exhibit ES-25 2006 AM Peak Micro-Simulation Delay Results by Scenario
De
lay
(Pe
ak
Pe
rio
d V
eh
icle
-Ho
urs
)
2006 Base Year S1 S3 S5 S7 S9 Scenario
18000
16000
14000
12000
10000
8000
6000
4000
2000
-
S1 Expand Ramp Metering
S3 Adv Ramp Metering
S5 Aux Lane Striping Ramp Improvs
S7 Ramp Closures
S9 On-Ramp amp Aux Lane Improvs
-2 -3 -3
-16 -20
HOV WB I-210 WB
HOV EB I-210 EB
Ramps Arterials
I-210 Corridor System Management Plan Executive Summary
Page 30 of 39
Exhibit ES-26 2006 PM Peak Micro-Simulation Delay Results by Scenario
18000
De
lay
(Pe
ak
Pe
rio
d V
eh
icle
-Ho
urs
)
16000
14000
12000
10000
8000
6000
4000
2000
-
S1 Expand Ramp Metering
S3 Adv Ramp Metering
HOV WB
I-210 WB
S5 Aux Lane Striping Ramp Improvs
S7 Ramp Closures
S9 On-Ramp amp Aux Lane Improvs
HOV EB
I-210 EB
Ramps
Arterials
-17
-11
-18
-18 -28
2006 Base Year S1 S3 S5 S7 S9 Scenario
Exhibit ES-27 2020 AM Peak Micro-Simulation Delay Results by Scenario
30000
De
lay
(Pe
ak
Pe
rio
d V
eh
icle
-Ho
urs
)
25000
20000
15000
10000
5000
S2 Expand Ramp Metering
S4 Adv Ramp Metering
S6 Aux Lane Striping Ramp Improvs
S8 Ramp Closures
HOV WB
I-210 WB
HOV EB
-8
-2 -8
-13 -12
S10 On-Ramp amp Aux Lane Improvs
S13 SR-134I-210 IC Modification
S14 Lake Ave Drop Ramp Lane Addition
I-210 EB
Ramps
Arterials
-11
-23
-
2020 S2 S4 S6 S8 S10 S13 S14 Horizon Scenario
I-210 Corridor System Management Plan Executive Summary
Page 31 of 39
Exhibit ES-28 2020 PM Peak Micro-Simulation Delay Results by Scenario D
ela
y(P
ea
k P
eri
od
Ve
hic
le-H
ou
rs)
30000
25000
20000
15000
10000
5000
-
S2 Expand Ramp Metering
S4 Adv Ramp Metering
S6 Aux Lane Striping Ramp Improvs
S8 Ramp Closures
HOV WB
I-210 WB
HOV EB
-14
S10 On-Ramp amp Aux Lane Improvs
S13 SR-134I-210 IC Modification
S14 Lake Ave Drop Ramp Lane Addition
I-210 EB
Ramps
Arterials
-2 -5 -3 -28
-3 -19
2020 S2 S4 S6 S8 S10 S13 S14 Horizon Scenario
Base Year and Do Minimum Horizon Year
Absent any physical improvements the modeling team estimates that by 2020 total delay (mainline HOV ramps and arterials) would double compared to 2006 (from a total of around 22000 vehicle-hours daily to just fewer than 45000 vehicle-hours) in the combined AM and PM peak
Scenarios 1 and 2 (Expand Ramp Metering)
Scenarios 1 and 2 test the only project on the corridor that was fully constructed and completed The project installed new connector metering at the SR-57 and I-605 to Ishy210 freeway connector ramps The project also widened various ramps removed various HOV meter bypasses and upgraded the ramp metering system
The 2006 model estimates that Scenario 1 would reduce delay on the corridor by around 17 percent (or 1600 daily vehicle-hours) in the PM peak period but only around two percent (or 200 vehicle-hours) in the AM peak period The biggest benefits occur in the PM eastbound direction from Rosemead On-Ramp to Huntington interchange (with a delay reduction of over 1000 vehicle-hours) as well as from I-605 to the Azusa On-Ramp (delay reduction of 500 vehicle-hours) for single occupant vehicles The
I-210 Corridor System Management Plan Executive Summary
Page 32 of 39
westbound reductions in freeway delay are largely offset by increased on-ramp delay mostly from new connector metering at SR-57 and I-605
The 2020 model estimates that Scenario 2 will reduce delay by around 8 percent in the AM peak and 14 percent in the PM peak for a combined total reduction of 5000 daily vehicle-hours The long-term improvements are less than the short-term improvements due to the increase in demand
Scenarios 3 and 4 (Advanced Ramp Metering)
Scenarios 3 and 4 build on Scenarios 1 and 2 by adding advanced ramp metering system such as dynamic or adaptive ramp metering system
The 2006 model shows that Scenario 3 would reduce delay by an additional 850 daily vehicle-hours (or 11 percent) in the PM peak with a marginal reduction in the AM peak period However in conjunction with Scenario 1 Scenario 3 reduces delay in total by over 600 vehicle-hours in the AM peak These results suggest that queue control provides additional benefits beyond SWARM
The 2020 model estimates that Scenario 4 will modestly reduce delay by about 2 percent in both the AM and PM peaks or a combined total of 800 daily vehicle-hours Again the benefits are lower in percentage terms due to the increase in demand
Note that there are various types of advanced ramp metering systems deployed around the world including System-wide Adaptive Ramp Metering System or SWARM tested recently in Los Angeles I-210 freeway corridor For the I-210 model the Asservissement Lineaire drsquoEntreacutee Autoroutiere (ALINEA system) was tested as proxy for any advanced ramp metering system as its algorithm for the model was readily available It is not necessarily recommended that ALINEA be deployed but rather some type of advanced ramp metering system that would produce similar if not better results
Scenarios 5 and 6 (Auxiliary Lane Striping Ramp Improvements)
Scenarios 5 and 6 build on Scenarios 3 and 4 that include several relatively lower-cost operational improvements that could be implemented by 2015
diams Building a westbound auxiliary lane from Santa Anita to Baldwin and an eastbound auxiliary lane from Santa Anita to Huntington
diams Extending a lane to Lincoln on the westbound I-210 connector
diams Connecting and converging the Altadena on-ramps into a single on-ramp
I-210 Corridor System Management Plan Executive Summary
Page 33 of 39
diams Connecting and converging the Santa Anita on-ramps into a single on-ramp
diams Connecting and converging the Irwindale on-ramps into a single on-ramp
diams Restriping to add a lane in the eastbound direction from San Dimas to Fruit
The 2006 model shows that Scenario 5 reduces delay by 3 percent (nearly 400 vehicleshyhours) in the AM peak and 18 percent (1200 vehicle-hours) in the PM peak The segment that experienced the largest improvement in the eastbound during the PM peak was from Rosemead to Huntington This segment experienced a 45 percent improvement in delay (from 2700 vehicle-hours to 1500 vehicle-hours) which is likely attributed to the eastbound auxiliary lane from Santa Anita to Huntington In the westbound direction the auxiliary lane from Santa Anita to Baldwin shifts some traffic downstream to cause increased congestion at Michillinda (ie bottleneck shift) during the westbound AM peak However the auxiliary lane helps reduce both queue length and queue duration for the Santa Anita bottleneck
The 2020 model estimates that Scenario 6 would reduce delay by 8 percent in the AM peak and 5 percent in the PM peak for a total reduction of 2500 daily vehicle-hours A reduction in PM delay is expected to occur mostly in the westbound direction
Scenarios 7 and 8 (Ramp Closures)
Scenarios 7 and 8 build on Scenarios 5 and 6 and test the closure of several ramps
diams Eastbound Marengo on-ramp and westbound Lake on-ramp with signalization of the eastbound I-210 off-ramp at Maple and improvement to alternate routes along Corson and Maple
diams Eastbound Mount Olive ramps
Note that subsequent scenarios are not built on top of these scenarios as these are isolated to test ramp closure alternatives
The 2006 model shows that Scenario 7 would reduce delay significantly by 16 percent in the AM peak and 18 percent in the PM peak for a total delay reduction of nearly 3000 daily vehicle-hours The delay reductions are significant on the mainline during the peak direction of travel ndash 1400 vehicle-hours in the westbound AM and 912 vehicleshyhours in the eastbound PM In the westbound direction and AM peak period the segment from Altadena to Lake experienced over an 85 percent decrease in congestion (from 860 to 120 vehicle-hours of delay) This is likely attributed to the closure of the westbound Lake on-ramp In the eastbound direction and PM peak period the segment from Huntington to I-605 experienced a delay reduction of over 70 percent (from 2200
I-210 Corridor System Management Plan Executive Summary
Page 34 of 39
vehicle-hours to 600 vehicle-hours) which is likely attributed to the closure of the Mount Olive ramp
The 2020 model also shows that Scenario 8 improved delay by 12 percent in the AM and 3 percent in the PM for a total delay reduction of almost 3000 daily vehicle-hours On the mainline facility delay also improved for each peak direction of travel ndash by 1600 daily vehicle-hours in the westbound AM and by 750 vehicle-hours in the eastbound PM Delay reductions in the non-peak direction were not as significant
Scenarios 9 and 10 (On-ramp and Aux Lane Improvements)
Scenarios 9 and 10 build on Scenarios 5 and 6 and test four operational improvements that can be implemented in the short to medium range
diams Modify the RosemeadMichillinda interchange and converge the westbound I-210 on-ramps
diams Modify the northside of the Baldwin interchange and eliminate the collectorshydistributor
diams Construct an eastbound auxiliary lane from Azusa to Citrus
diams Converge the eastbound Citrus on-ramps and add an auxiliary lane to Grand
The 2006 model estimates that Scenario 9 will reduce delay by 20 percent (or 2400 daily vehicle-hours) in the AM peak and 28 percent (or 1600 daily vehicle-hours) in the PM peak compared to Scenario 5 In both AM and PM peak period the eastbound direction experienced the largest reduction in delay
The 2020 model estimates that Scenario 10 will reduce delay by 13 percent (or 2500 vehicle-hours) in the AM peak and 28 percent in the PM peak (or 4800 vehicle-hours) compared to Scenario 6 Similar to the 2006 model the 2020 model shows that these improvements produced a greater reduction in delay in the eastbound direction than the westbound direction
Scenarios 11 and 12 (Enhanced Incident Management)
Two incident scenarios were tested on top of Scenario 10 to evaluate the non-recurrent delay reductions resulting from enhanced incident management strategies An enhanced incident management system would entail upgrading or enhancing the current Caltrans incident management system that includes deployment of intelligent transportation system (ITS) field devices central controlcommunications software communications medium (ie fiber optic lines) advanced traveler information system
I-210 Corridor System Management Plan Executive Summary
Page 35 of 39
andor freeway service patrol (FSP) program to reduce incident detection verification response and clearance times
In the first scenario Scenario 11 one collision incident with one lane closure was simulated in the westbound direction in the AM peak period model and one in the eastbound direction in the PM peak period model The incident simulation location and duration were selected based on review of the 2010 actual incident data at one of the high frequency locations The following are the Scenario details
diams Westbound AM peak period starting at 800 AM close mainline lane 2 for 40 minutes at absolute post mile 2612 (at Lake Avenue)
diams Eastbound PM peak period starting at 500 PM close mainline lane 2 for 50 minutes at absolute post mile 3207 (west of Santa Anita)
In the second scenario Scenario 12 the same collision incidents were simulated with a reduction in duration by 10 minutes in the westbound direction and by 12 minutes in the eastbound direction It is estimated based on actual incident management data analysis results provided by Caltrans that an enhanced incident management system could reduce a 35-minute incident by about 10 minutes This scenario represents a typical moderate level incident at one location during the peak period direction Data suggest that incidents vary significantly in terms of impact and duration Some incidents last hundreds of minutes some close multiple lanes and some occur at multiple locations simultaneously There are also numerous minor incidents lasting only a few minutes without lane closures that can result in congestion Many other incidents also occur during off-peak hours
Without enhanced incident management Scenario 11 produced an 8 percent increase in congestion in both peak periods over Scenario 10 an increase of over 2300 hours of vehicle delay With enhanced incident management Scenario 12 evaluation resulted in delay decrease by 2 percent in the AM peak and 3 percent in the PM peak against Scenario 11 results a reduction of nearly 750 vehicle-hours for improving the incident detection verification response and clearance time of one moderate level incident for both of the peak hours
Scenario 13 (SR-134I-210 Interchange Modification)
Scenario 13 tests an improvement to modify the SR-134I-210 interchange to provide a direct connection for vehicles to continue on I-210 with three lanes in each direction This improvement was tested with the 2020 model since it is not likely to be implemented in the short-term
I-210 Corridor System Management Plan Executive Summary
Page 36 of 39
The 2020 model estimates that delay would be reduced by 11 percent (or 1800 daily vehicle-hours) in the AM and 3 percent in the PM (320 daily vehicle-hours) compared to Scenario 10 The westbound mainline experienced the greatest reduction in delay in the AM peak from 9600 vehicle-hours to 8600 vehicle hours after the interchange modification
Scenario 14 (Westbound Drop Ramp and Eastbound Widening)
Scenario 14 builds on Scenario 13 and tests Lake Avenue drop ramp to westbound Ishy210 center lanes (one HOV lane and one mainline) and eastbound I-210 widening from Myrtle to I-605 This improvement was tested with the 2020 model
The 2020 model estimates that delay would be reduced by about 20 percent in the AM or 3400 vehicle-hours and 20 percent in the PM or 2300 vehicle-hours compared to Scenario 13 The mobility improvements are significant with the westbound drop ramp that reduces weaving between SR-134 and SR-210 destined traffic and with the eastbound capacity addition to I-605 off that moves the off-ramp traffic away from the mainline and provides more room for the mainline through traffic
Post Scenario 14 Conditions
By 2020 with the inclusion of all the projects tested the model reveals some residual congestion that remains to address with future improvements According to the model results the total remaining delay on the corridor is around 21000 daily vehicle-hours
Benefit-Cost Analysis
Following an in-depth review of model results by the study team and the SCAG technical committee the study team performed a benefit-cost analysis (BCA) for each scenario
Using the California Benefit-Cost Model (Cal-BC) developed on behalf of Caltrans by the study team benefits in three key areas were estimated travel time savings vehicle operating cost savings and emission reduction savings The benefits generated from this exercise are based solely on congestion relief related benefits However these results are conservative since there are other benefits not captured by this analysis including benefits from deploying bus rapid transit which will achieve other accessibility benefits
Project costs were developed from SCAG and Caltrans project planning and programming documents These costs include construction and support costs in current dollars The study team estimated costs for projects that did not have cost
I-210 Corridor System Management Plan Executive Summary
Page 37 of 39
estimates by reviewing similar completed projects A BC greater than one means that a scenarios projects return greater benefits than it costs to construct or implement It is important to consider the total benefits that a project brings For example a large capital expansion project can cost a great deal and have a low BC ratio but brings much higher absolute benefits to the I-210 users Exhibit ES-29 shows the benefit to cost ranges classified from low (with a BC of one to two) to very high (with a BC of over 10)
The benefit-cost results for the South Corridor scenarios are shown in Exhibit ES-29
Exhibit ES-29 I-210 Scenario BenefitCost (BC) Results
Scenario Scenario Description
BenefitCost Ranges
Low Medium Medium-High High Very High
lt1 1 to 2 2 to 5 5 to 10 gt10
12 Expand Ramp Metering 34 Advanced Ramp Metering 56 Aux Lane Striping Ramp Improvs 78 Ramp Closures
910 On-Ramp amp Aux Lane Improvs 13 SR-134I-210 IC Modification
The benefit-cost findings for each scenario are as follows
diams Scenarios 1 and 2 (ramp metering expansion) shows a high benefit-cost ratio of over ten The relatively high benefit-cost ratio is due to the low cost of expanding ramp metering ($235 million)
diams Scenarios 3 and 4 (advanced ramp metering) resulted in an incremental benefitshycost ratio of over ten This is relatively high as compared to that of typical transportation management system project
diams Scenarios 5 and 6 (operational improvements) produced a benefit-cost ratio of over five This is relatively consistent with other typical operational improvement projects The benefits are substantial At estimated total cost of about $44 million these projects produced benefits of over $233 million
diams Scenarios 7 and 8 tested the ramp closures at eastbound Marengo westbound Lake and eastbound Mount Olive These ramp closured produced an extremely high incremental benefit-cost ratio of over ten due to the relatively very low cost However this benefit-cost calculation does not account for any potential increase in delay on various local arterials because of detours from the closed ramps
diams Scenarios 9 and 10 also produced a relatively high benefit-cost ratio of over ten The four operational projects in these scenarios are collectively estimated to cost
I-210 Corridor System Management Plan Executive Summary
Page 38 of 39
under $30 million and provide a substantial and optimistic benefit of over $670 million
diams Scenario 13 tested the SR-134I-210 interchange modification This project produced a benefit-cost ratio of between one and two consistent with other typical capital expansion projects This project produced benefits of over $200 million at a rough-estimate cost of about $150 million
diams Scenario 14 tested the westbound center drop ramp from Lake Avenue interchange and eastbound lane addition from Myrtle to I-605 These projects produced a relatively high benefit-cost ratio of about 6 to one as compared to other capital improvement projects These two capital projects are unique in that they have specific operational improvement element that addresses major bottleneck locations For an estimated total combined cost of about $70 million the projected benefits exceed $420 million
CONCLUSIONS AND RECOMMENDATIONS
This section summarizes the conclusions and recommendations based on the analysis discussed in the previous section It is important to note that many of these conclusions are based primarily on the micro-simulation model results The model was developed based on the best data available at the time The study team reviewed the model results and believe that both the calibrated base year forecast year and scenario results are reasonable However Caltrans should always be cautious to make decisions based on modeling alone especially complex micro-simulation models
Based on the results the study team offers the following conclusions and recommendations
diams The combination of all scenarios significantly reduces overall congestion on the corridor Projected 2020 congestion after implementation of all scenarios is below 2006 levels in both the AM and PM peak period In the AM peak period the model projects total delay in 2020 after delivering all projects to be less than 11700 vehicle-hours compared to the 2006 base year delay of 13000 vehicleshyhours This represents a reduction of over 10 percent In the PM peak period the model projects total delay in 2020 after delivering all projects to be around 9500 hours compared to the 2006 base year delay of almost 9300 vehicle-hours This represents a slight reduction of 2 percent Clearly the scenarios deliver significant mobility benefits to the corridor Despite the growth in demand future 2020 congestion will be less than experienced in 2006
diams The completed ramp metering expansion project is expected to produce substantial mobility benefits of over $400 million Delay has been significantly reduced since 2006
I-210 Corridor System Management Plan Executive Summary
Page 39 of 39
diams Advanced ramp metering could provide additional mobility improvements by significantly reducing congestion and returning over $100 million in benefits
diams Ramp closures at Marengo Lake and Mount Olive as alternatives seem promising by reducing delay up to 3000 vehicle-hours per day and providing substantial benefits of $280 million at an extremely low cost
diams Operational improvements such as auxiliary lanes and ramp improvements could leverage on the ramp metering projects by making the corridor more efficient and productive that could result in additional mobility benefits of over $230 million
diams Additional capital improvements with specific operational elements to address weaving at major bottleneck locations could produce significant mobility benefits of over $420 million
diams Enhanced incident management system associated with Scenarios 11 and 12 to address non-recurrent congestion proved effective with a delay reduction of over 300 vehicle-hours for one modest level incident with a typical duration of 35 minutes reduced to 25 minutes With the I-210 corridor experiencing up to 2400 collisions per year this translates to a total annual delay savings of over 700000 vehicle-hours for the study corridor
diams The benefit-cost ratio of all scenarios combined is about 64 to 1 If all projects were delivered at current cost estimates the public would get over six dollars of benefits for each dollar expended In current dollars costs total to over $17 billion whereas the benefits are estimated to be over $20 billion
diams The projects also alleviate greenhouse gas (GHG) emissions by over 15 million tons over 20 years averaging over a 75000-ton reduction per year The emissions are estimated using data from the California Air Resources Board (CARB) EMFAC model
This is the first generation CSMP for the I-210 corridor It is important to stress that CSMPs should be updated on a regular basis This is particularly important since traffic conditions and patterns can differ from current projections After projects are delivered it is also useful to compare actual results with estimated ones in this document so that models can be further improved as appropriate
CSMPs or a variation thereof should become the normal course of business that is based on detailed performance assessments an in-depth understanding of the reasons for performance deterioration and an analytical framework that allows for evaluating complementary operational strategies that maximize the productivity of the current system
I-210 Corridor System Management Plan Executive Summary
Page 3 of 39
STAKEHOLDER INVOLVEMENT
A technical committee was formed and met on an almost monthly basis to discuss progress technical challenges data needs and preliminary conclusions for the I-210 CSMP The technical committee included representatives from Caltrans the Southern California Association of Governments (SCAG) the Los Angeles County Metropolitan Transportation Authority (Metro) as well as consultant team members
The I-210 CSMP involved other corridor stakeholders such as representatives from cities bordering I-210 Caltrans briefed these stakeholders at critical milestones
Feedback from the stakeholders helped solidify the findings of the performance assessment bottleneck identification and causality analysis given their intimate knowledge of local conditions Moreover stakeholders have provided support and insight and shared valuable field and project data without which this study would not have been possible The stakeholders included representatives from the following organizations
diams San Gabriel Valley Council of Governments diams Los Angeles County Department of Public Works diams City of Arcadia diams City of Azusa diams City of Claremont diams City of Duarte diams City of Glendora diams City of Irwindale diams City of LaVerne diams City of Monrovia diams City of Pasadena diams City of San Dimas
Caltrans would like to thank all of its partners for contributing to this CSMP development process In addition the CSMP development provided a venue for tighter coordination between Caltrans planning and operations professionals which is critical to the success of the system management approach
I-210 Corridor System Management Plan Executive Summary
Page 4 of 39
CORRIDOR PERFORMANCE ASSESSMENT
This section briefly describes the I-210 corridor and summarizes the results of the comprehensive corridor performance assessment conducted
Corridor Description
Exhibit ES-2 shows the location of the Los Angeles County I-210 CSMP corridor The corridor extends approximately 45 miles from the I-5 (Golden State Freeway) interchange in the San Fernando Valley to the SR-57 (Orange Freeway) interchange It traverses the cities of San Fernando La Canada Flintridge Pasadena Arcadia Monrovia Duarte Azusa and San Dimas The focus of the CSMP is the 20-mile congested urban section between SR-134 and SR-57
The corridor is a divided eight- to ten-lane freeway with a concrete median and an additional outside auxiliary lane along most of the corridor A single High Occupancy Vehicle (HOV) lane exists in each direction through the congestion urban area that is the focus of the study corridor (from the SR-134 interchange to the SR-57 interchange)
According to Caltrans traffic volumes reported for 2008 Los Angeles I-210 carries between 76000 and 298000 annual average daily traffic (AADT) The highest average daily traffic volume on the corridor occurs at the SR-134 interchange and the lowest volume occurs near the I-5 interchange
I-210 is also a Surface Transportation Assistance Act (STAA) route that allows large trucks to operate on the mainline lanes According to the latest truck volumes from Caltrans trucks comprise between four and ten percent of total daily traffic along the corridor Higher truck percentages occur west of the SR-134 Many of these trucks travel eastbound to the Inland Empire home to many warehouses and distribution centers The trucks traveling westbound are typically headed north to connect to the I-5 corridor and beyond
Major transit operations along the I-210 Corridor include Metro bus and light rail Metrolink commuter rail Foothill Transit Los Angeles City Department of Transportation Commuter Express and Pasadena Area Rapid Transit System (ARTS)
Metro operates ten parallel local bus or bus rapid transit (BRT) routes near the I-210 corridor It also operates the Metro Rail Gold Line that provides light-rail service in the center median of I-210 from downtown Los Angeles Union Station to the Sierra Madre Villa station
1-210 Corridor Study A1rea
0 I 2 3 4 5 MIEB
llllilllilllilllil l+j
I-210 Corridor System Management Plan Executive Summary
Page 5 of 39
Exhibit ES-2 Los Angeles County I-210 CSMP Corridor Map
I-210 Corridor System Management Plan Executive Summary
Page 6 of 39
Foothill Transit provides four bus lines that serve Pasadena the City of Arcadia and the City of Duarte The City of Los Angeles Department of Transportation also operates two commuter service lines that service the San Gabriel Valley Other transit agencies such as the Pasadena Rapid Transit System and the Glendale Bee operate local bus service between residential neighborhoods and business centers The Metrolink Antelope Valley Line provides commuter rail service from the Antelope Valley along the I-5 and San Fernando Road to downtown Los Angeles
There are various bike routes near I-210 but none that parallel the study corridor Most of the bike routes near the corridor are Class III Bike Paths (preferred bike routes on existing streets identified by signs only) These routes are concentrated between I-110 and SR-19 Due to the terrain and uphill climb there are few bike paths west of SRshy134
Several roadway improvements have been recently completed In preparation for System-Wide Adaptive Ramp Metering (SWARM) implementation various on-ramps between SR-134 and SR-57 were modified to enhance metering with traffic signals on the HOV bypass lanes Freeway connector on-ramps from I-605 and SR-57 have been modified to implement connector metering with traffic signals Closed-circuit television (CCTV) cameras and fiber optic communications were also added throughout the corridor
In addition to major employment trip-generating activity centers in Pasadena area there are 14 collegesuniversities six major medical centers the Rose Bowl stadium Santa Anita Park Horse Track Irwindale Speedway and various large shopping malls The Bob Hope Airport in Burbank is also a major traffic generator for the I-210 corridor
Corridor Performance Assessment
The I-210 CSMP focuses on four categories of performance measures
diams Mobility describes how quickly people and freight move along the corridor diams Reliability captures the relative predictability of travel time along the corridor diams Safety provides an overview of collisions along the corridor diams Productivity quantifies the degree to which traffic inefficiencies at bottlenecks or
hot spots reduce flow rates along the corridor
Mobility
Two primary measures quantify mobility in this report delay and travel time Each is estimated from field automatic detection data from the Performance Measurement System1 (PeMS) provided access to the historical freeway detection data needed to
1 Developed and maintained by Caltrans and accessible at pemsdotcagov
I-210 Corridor System Management Plan Executive Summary
Page 7 of 39
estimate the two mobility measures PeMS collects detector volume and occupancy data on the freeway which were used to estimate speed delay and travel time
Delay
Delay is defined as the observed travel time less the travel time at uncongested conditions and is reported as vehicle-hours of delay The assessment summarized the results for the five-year period between 2005 and 2009 Delays in this report were calculated as the difference in travel time between estimated speeds and free-flow conditions at 60 mph applied to the observed volume Exhibit ES-2 shows the average daily vehicle-hours of delay for each month between 2005 and 2009 for both mainline and high occupancy vehicle (HOV) lanes This exhibit reveals the following trends
diams Prior to 2007 the eastbound and westbound directions experienced similar delay levels on both the mainline and HOV lanes The HOV lanes comprise approximately 15 to 20 percent of the total estimated delay on the corridor
diams Congestion on the westbound mainline lanes experienced extreme peaking ndash likely caused by construction on the corridor between 2007 and 2008 The eastbound lanes did not experience much change in delay in 2007 but declined through 2008 The HOV facility did not experience significant change during this time
diams In 2009 the estimated delay on the eastbound mainline lanes increased dramatically while in contrast the westbound lanes declined sharply The HOV lane showed a similar trend with the eastbound HOV lane exceeding the delay in the westbound direction
I-210 Corridor System Management Plan Executive Summary
Page 8 of 39
Exhibit ES-3 Average Weekday Delay by Month (2005-2009) 16000
Av
era
ge
Da
ily
Ve
hic
le-H
ou
rs o
f D
ela
y (
6
0m
ph
)
15000
14000
13000
12000
11000
10000
9000
8000
7000
6000
5000
4000
3000
2000
1000
-
Ja
nF
eb
Ma
rA
pr
Ma
yJ
un
Ju
lA
ug
Se
pO
ct
No
vD
ec
Ja
nF
eb
Ma
rA
pr
Ma
yJ
un
Ju
lA
ug
Se
pO
ct
No
vD
ec
Ja
nF
eb
Ma
rA
pr
Ma
yJ
un
Ju
lA
ug
Se
pO
ct
No
vD
ec
Ja
nF
eb
Ma
rA
pr
Ma
yJ
un
Ju
lA
ug
Se
pO
ct
No
vD
ec
Ja
nF
eb
Ma
rA
pr
Ma
yJ
un
Ju
lA
ug
Se
pO
ct
No
vD
ec
2005 2006 2007 2008 2009
Eastbound ML
Westbound ML
Eastbound HOV
Westbound HOV
Month
The CSMP separates delay further into two components severe delay and other delay Severe delay is delay that occurs when speeds are below 35 mph and other delay occurs where speeds are between 35 and 60 mph Severe delay represents breakdown conditions ldquoOtherrdquo delay represents conditions approaching or leaving the breakdown congestion or areas that cause temporary slowdowns However it can also be a leading indicator of future severe delay
Exhibits ES-4 (Mainline lanes) and ES-5 (HOV lanes) show average severe and other daily vehicle-hours of delay by day of the week A few notes related to ES-4 and ES-5
diams Severe delay makes up about 70 percent of all weekday delay on the corridor in either the eastbound or the westbound direction Severe delay on Saturdays and SundaysHolidays tend to be under 70 percent while weekday severe delay averages around 75 percent of all delay As in Exhibit ES-3 HOV delays tend to range between 14 and 25 percent of total delay
diams Fridays in the eastbound direction experience the highest delays probably due to weekend travel The second highest delays generally occurred on Thursdays In the westbound direction the day of week trends are typical for urban commute corridors with the midweek days experiencing the highest delays with Monday and Friday showing slightly less congestion and the weekends showing much lower delays than during the week
Av
era
ge D
aily V
eh
icle
-Ho
urs
of
Dela
y (
60
mp
h)
Av
era
ge D
aily V
eh
icle
-Ho
urs
of
Dela
y (
60
mp
h)
I-210 Corridor System Management Plan Executive Summary
Page 9 of 39
Exhibit ES-4 Mainline Lane Delay by Day of Week (2005-2009) 16000
15000
14000
13000
12000
11000
10000
9000
8000
7000
6000
5000
4000
3000
2000
1000
-
Mainline Other Delay
Mainline Severe Delay M
on
T
ue
Wed
T
hu
F
riS
at
Su
n
Ho
lM
on
Tu
eW
ed
Th
uF
riS
at
Su
n
Ho
lM
on
Tu
eW
ed
Th
uF
riS
at
Su
n
Ho
lM
on
Tu
eW
ed
Th
uF
riS
at
Su
n
Ho
lM
on
Tu
eW
ed
Th
uF
riS
at
Su
n
Ho
lM
on
Tu
eW
ed
Th
uF
riS
at
Su
n
Ho
lM
on
Tu
eW
ed
Th
uF
riS
at
Su
n
Ho
lM
on
Tu
eW
ed
Th
uF
riS
at
Su
n
Ho
lM
on
Tu
eW
ed
Th
uF
riS
at
Su
n
Ho
lM
on
Tu
eW
ed
Th
uF
riS
at
Su
n
Ho
l
2005 2006 2007 2008 2009 2005 2006 2007 2008 2009
EASTBOUND WESTBOUND
Exhibit ES-5 HOV Lane Delay by Day of Week (2005-2009) 4000
3500
3000
2500
2000
1500
1000
500
-
Mo
nT
ue
Wed
Th
uF
riS
at
Su
n
Ho
lM
on
Tu
eW
ed
Th
uF
riS
at
Su
n
Ho
lM
on
Tu
eW
ed
Th
uF
riS
at
Su
n
Ho
lM
on
Tu
eW
ed
Th
uF
riS
at
Su
n
Ho
lM
on
Tu
eW
ed
Th
uF
riS
at
Su
n
Ho
lM
on
Tu
eW
ed
Th
uF
riS
at
Su
n
Ho
lM
on
Tu
eW
ed
Th
uF
riS
at
Su
n
Ho
lM
on
Tu
eW
ed
Th
uF
riS
at
Su
n
Ho
lM
on
Tu
eW
ed
Th
uF
riS
at
Su
n
Ho
lM
on
Tu
eW
ed
Th
uF
riS
at
Su
n
Ho
l
2005 2006 2007 2008 2009 2005 2006 2007 2008 2009
EASTBOUND WESTBOUND
Other Delay
Severe Delay
I-210 Corridor System Management Plan Executive Summary
Page 10 of 39
Exhibits ES-6 and ES-7 summarize average annual weekday delay by hour of the day over the five-year period for the mainline northbound and southbound lanes respectively These exhibits allow planners and decision makers to understand the trend in peak period delay spiking and peak period spreading by comparing the intensity and duration of the peak period congestion Note that the HOV lanes are not shown in this summary report since they follow similar peaking trends as the mainline lanes (the main technical report contains the HOV delay by hour results) A few notes on these two exhibits
diams The eastbound direction peaks in the PM peak period while the AM is the westbound peak AM peak hour is 700 AM while the PM peak period is 500 PM
diams In the eastbound PM direction congestion grew dramatically in 2009 while westbound AM congestion declined This is also evident in Exhibit ES-2 Eastbound delay between 2005 and 2008 remained relatively constant at about 1750 vehicle-hours during the 500 PM peak hour before increasing in 2009 to about 2100 vehicle-hours
diams Westbound AM congestion declined in 2009 after two years of dramatic growth between 2007 and 2008 In 2009 the AM peak period also shrank by approximately one-half hour and started at approximately 530 AM whereas from 2005 to 2008 the peak period started around 500 AM
Exhibit ES-6 Eastbound Mainline Lanes Hourly Delay (2005-2009)
0
250
500
750
1000
1250
1500
1750
2000
2250
2500
Ave
rag
e D
ail
y V
eh
icle
Ho
urs
of
Dela
y (
60
mp
h) 2009 Weekday
2008 Weekday
2007 Weekday
2006 Weekday
2005 Weekday
00
0
10
0
20
0
30
0
40
0
50
0
60
0
70
0
80
0
90
0
100
0
110
0
120
0
130
0
140
0
150
0
160
0
170
0
180
0
190
0
200
0
210
0
220
0
230
0
Hour of the Day
I-210 Corridor System Management Plan Executive Summary
Page 11 of 39
Exhibit ES-7 Westbound Mainline Lanes Hourly Delay (2005-2009)
0
250
500
750
1000
1250
1500
1750
2000
2250
2500
Ave
rag
e D
ail
y V
eh
icle
Ho
urs
of
Dela
y (
60m
ph
) 2009 Weekday
2008 Weekday
2007 Weekday
2006 Weekday
2005 Weekday
00
0
10
0
20
0
30
0
40
0
50
0
60
0
70
0
80
0
90
0
100
0
110
0
120
0
130
0
140
0
150
0
160
0
170
0
180
0
190
0
200
0
210
0
220
0
230
0
Hour of the Day
Travel Time
The travel time performance measure represents the average time it takes for a vehicle to travel between SR-134 and SR-57 a distance of approximately 20 miles
Exhibits ES-8 and ES-9 summarize mainline estimated average weekday travel times by hour of day for the 2005-2009 five-year period Exhibits ES-10 and ES-11 show the same results for the HOV facility Similar to delay travel times increased in 2009 in the eastbound PM direction and time but decreased in the westbound AM commute period
In the mainline lanes the eastbound PM peak hour (500 PM) travel time grew from 40 minutes in 2008 to 44 minutes in 2009 In the westbound AM peak hour (700 AM) the opposite trend occurred with travel times dropping from a 41 minute average in 2008 to around 36 minutes in 2009
A similar trend occurred for the HOV lanes except that 2005 was the worst year in terms of travel times
Tra
ve
l T
ime
(m
inu
tes
) T
rav
el
Tim
e (
min
ute
s)
45
40
35
30
25
20
15
10
5
0
45
40
35
30
25
20
15
10
5
0
I-210 Corridor System Management Plan Executive Summary
Page 12 of 39
Exhibit ES-8 Eastbound Mainline Lanes Travel Time by Hour (2005-2009) 50
2009 Average Travel Time
2008 Average Travel Time
2007 Average Travel Time
2006 Average Travel Time
2005 Average Travel Time
Travel Time 60mph
Travel Time 35mph
Hour of the Day
00
0
10
0
20
0
30
0
40
0
50
0
60
0
70
0
80
0
90
0
100
0
110
0
120
0
130
0
140
0
150
0
160
0
170
0
180
0
190
0
200
0
210
0
220
0
Hour of the Day
Exhibit ES-9 Westbound Mainline Lanes Travel Time by Hour (2005-2009) 50
2009 Average Travel Time
2008 Average Travel Time
2007 Average Travel Time
2006 Average Travel Time
2005 Average Travel Time
Travel Time 60mph
Travel Time 35mph
00
0
10
0
20
0
30
0
40
0
50
0
60
0
70
0
80
0
90
0
10
00
11
00
12
00
13
00
14
00
15
00
16
00
17
00
18
00
19
00
20
00
21
00
22
00
230
0
23
00
Tra
ve
l T
ime
(m
inu
tes
) T
rav
el
Tim
e (
min
ute
s)
45
40
35
30
25
20
15
10
5
0
45
40
35
30
25
20
15
10
5
0
I-210 Corridor System Management Plan Executive Summary
Page 13 of 39
Exhibit ES-10 Eastbound HOV Lanes Travel Time by Hour (2005-2009) 50
2009 Average Travel Time
2008 Average Travel Time
2007 Average Travel Time
2006 Average Travel Time
2005 Average Travel Time
Travel Time 60mph
Travel Time 35mph
Hour of the Day
00
0
10
0
20
0
30
0
40
0
50
0
60
0
70
0
80
0
90
0
100
0
110
0
120
0
130
0
140
0
150
0
160
0
170
0
180
0
190
0
200
0
210
0
220
0
Hour of the Day
Exhibit ES-11 Westbound HOV Lanes Travel Time by Hour (2005-2009) 50
2009 Average Travel Time
2008 Average Travel Time
2007 Average Travel Time
2006 Average Travel Time
2005 Average Travel Time
Travel Time 60mph
Travel Time 35mph
00
0
10
0
20
0
30
0
40
0
50
0
60
0
70
0
80
0
90
0
100
0
110
0
120
0
130
0
140
0
150
0
160
0
170
0
180
0
190
0
200
0
210
0
220
0
230
0
230
0
I-210 Corridor System Management Plan Executive Summary
Page 14 of 39
Reliability
Reliability captures the degree of predictability in travel time Reliability focuses on how travel time varies from day to day and reflects the impacts of accidents incidents weather and special events Improving reliability is an important goal for transportation agencies and efforts to accomplish this include incident management traveler information and special event planning
To measure reliability the CSMP used the ldquobuffer indexrdquo which reflects the additional time required (over and beyond the average) to ensure an on-time arrival 95 percent of the time In other words if a person must be on time 95 days out of 100 (or 19 out of 20 workdays per month) then that person must add additional time to their average expected travel time to ensure an on-time arrival That additional time is the buffer time Severe events such as collisions could cause longer travel times but the 95th percentile represents a balance between days with extreme events (eg major accidents) and other more ldquotypicalrdquo travel days
Exhibits ES-12 and ES-13 show the estimated mainline lane travel time variability along I-210 on non-holiday weekdays for 2006 in the eastbound and westbound directions respectively The main report shows the buffer index for the years 2005-2009 for both mainline and HOV lanes but this Executive Summary reports only the data for the year 2006 for mainlines since that year was used as the base year for modeling
The following observations on the reliability results are worth noting
bull In 2006 in the eastbound direction 500 PM had the highest estimated average travel time at approximately 41 minutes and the highest estimated buffer index time of 15 minutes for a buffer index of 33 percent In other words to arrive on time 95 percent of the time a commuter would need to leave for work 56 minutes before the start time to travel the entire length of the I-210 study corridor
bull The westbound direction the 700 AM had the estimated average travel time of 39 minutes in 2006 with a buffer time of 15 minutes for a buffer index of 38 percent
70
65
60
55
50
45
40
35
30
25
20
15
10
5
0
70
65
60
55
50
45
40
35
30
25
20
15
10
5
0
Average Travel Time
Travel Time Variability (95th Percentile)
Travel Time at 60mph
Travel Time at 35mph
TIME OF DAY
Exhibit ES-13 Westbound Mainline Lanes Travel Time Variability (2006)
75
TIME OF DAY
Average Travel Time
Travel Time Variability (95th Percentile)
Travel Time at 60mph
Travel Time at 35mph
Exhibit ES-12 Eastbound Mainline Lanes Travel Time Variability (2006)
75
I-210 Corridor System Management Plan Executive Summary
Page 15 of 39
TR
AV
EL
TIM
E (
MIN
)
00
000
0
10
010
0
TR
AV
EL
TIM
E (
MIN
)
20
020
0
30
030
0
40
040
0
50
050
0
60
060
0
70
070
0
80
080
0
90
090
0
100
01
00
0
110
01
10
0
120
01
20
0
130
01
30
0
140
01
40
0
150
01
50
0
160
01
60
0
170
01
70
0
180
01
80
0
190
01
90
0
200
02
00
0
210
02
10
0
220
02
20
0
230
02
30
0
00
0
00
0
I-210 Corridor System Management Plan Executive Summary
Page 16 of 39
Safety
The adopted performance measures to assess safety involve the number of accidents and the accident rates computed from the Caltrans Traffic Accident Surveillance and Analysis System (TASAS) TASAS is a traffic records system containing an accident database linked to a highway database The highway database contains descriptive elements of highway segments intersections and ramps access control traffic volumes and other data TASAS contains specific data for accidents on State highways Accidents on non-State highways are not included (eg local streets and roads)
The safety assessment in this report intends to characterize the overall accident history and trends in the corridor and to highlight notable accident concentration locations or patterns that are readily apparent This report does not intend to supplant more detailed safety investigations routinely performed by Caltrans staff
Exhibits ES-14 and ES-15 show the I-210 total number of eastbound and westbound accidents by month respectively For the accident analysis the corridor is split in half the ldquoless urbanrdquo western half of the corridor from I-5 (postmile 0) in Sylmar to SR-134 in Pasadena (postmile R2200) and the ldquomore urbanrdquo eastern half from SR-134 to SR-57 (postmile R45) in San Dimas The latest available TASAS data from PeMS is to December 30 2008 Accidents are reported for the study corridor and not separated by mainline and HOV facility The exhibits summarize the latest available three-year data from January 1 2006 through December 31 2008
Both the eastbound and westbound directions have similar accident profiles with the more urbanized eastern half of the corridor (postmile R22 to R45) experiencing nearly 45 times as many accidents as the western half (PM 0 to R22) The eastbound (Exhibit ES-13) direction has around 79 accidents on average per month in the more-urbanized section and just fewer than 18 accidents in the less-urbanized section
The westbound direction has just fewer than 78 accidents on average per month in the more-urbanized section and just fewer than 18 in the less-urbanized section This is very similar to the eastbound direction
Nu
mb
er
of
Ac
cid
en
ts
Nu
mb
er
of
Accid
en
ts
I-210 Corridor System Management Plan Executive Summary
Page 17 of 39
Exhibit ES-14 Eastbound I-210 Monthly Collisions (2004-2008) 120
110
100
90
80
70
60
50
40
30
20
10
0
Jan
Feb
Mar
Ap
rM
ay
Ju
nJu
lA
ug
Sep
Oct
No
vD
ec
Jan
Feb
Mar
Ap
rM
ay
Ju
nJu
lA
ug
Sep
Oct
No
vD
ec
Jan
Feb
Mar
Ap
rM
ay
Ju
nJu
lA
ug
Sep
Oct
No
vD
ec
Jan
Feb
Mar
Ap
rM
ay
Ju
nJu
lA
ug
Sep
Oct
No
vD
ec
Jan
Feb
Mar
Ap
rM
ay
Ju
nJu
lA
ug
Sep
Oct
No
vD
ec
2004 2005 2006 2007 2008
Less Urbanized Western Section (I-5 to SR-134)
More Urbanized Eastern Section (SR-134 to SR-57)
110
100
90
80
70
60
50
40
30
20
10
0
Exhibit ES-15 Westbound I-210 Monthly Collisions (2004-2008) 120
Jan
Feb
Mar
Ap
rM
ay
Ju
nJu
lA
ug
Sep
Oct
No
vD
ec
Jan
Feb
Mar
Ap
rM
ay
Ju
nJu
lA
ug
Sep
Oct
No
vD
ec
Jan
Feb
Mar
Ap
rM
ay
Ju
nJu
lA
ug
Sep
Oct
No
vD
ec
Jan
Feb
Mar
Ap
rM
ay
Ju
nJu
lA
ug
Sep
Oct
No
vD
ec
Jan
Feb
Mar
Ap
rM
ay
Ju
nJu
lA
ug
Sep
Oct
No
vD
ec
2004 2005 2006 2007 2008
Less Urbanized Western Section (I-5 to SR-134)
More Urbanized Eastern Section (SR-134 to SR-57)
I-210 Corridor System Management Plan Executive Summary
Page 18 of 39
Productivity
Productivity is a system efficiency measure used to analyze the throughput of the corridor during congested conditions Restoring lost productivity is one focus area of CSMPs
Exhibit ES-16 illustrates how congestion leads to lost productivity The exhibit uses observed I-210 data from sensors for a typical spring 2010 afternoon peak period (Thursday May 6 2010) It shows speeds (red line) and flow rates (blue line) on eastbound I-210 at Huntington Drive one of the most congested locations on the corridor
Flow rates (measured as vehicle-per-hour-per-lane or ldquovphplrdquo) at Huntington Drive averaged around 1800 vphpl between 200 PM and 300 PM Once volumes approach a maximum flow rate of around 2000 vphl traffic becomes unstable Any additional merging or weaving traffic breaks down and speeds can rapidly plummet to below 35 mph In essence every incremental merge takes up two spots on the freeway for a short time However since the volume is close to the capacity these merges lead to queues Moreover rather than accommodating the same number of vehicles flow rates also drop and vehicles back up creating bottlenecks and associated congestion
At the location shown in Exhibit ES-16 throughput drops by over 30 percent on average during the peak period (from over 1800 to around 1200 vphpl) This five-lane road therefore operates as if lost 30 percent capacity when demand is at its highest Stated differently just when the corridor needed the most capacity it performed in the least productive manner and effectively lost lanes This loss in throughput can be aggregated and presented as ldquoEquivalent Lost-Lane-Milesrdquo
I-210 Corridor System Management Plan Executive Summary
Page 19 of 39
Exhibit ES-16 Lost Productivity Illustrated
70 2000
65
60 1750
50
55 1500
SP
EE
D
45 1250
40
35 1000
30 Speed lt35mph
750 25
20 500 I-210 EB
15 Los Angeles County Huntington
10 PM=3338 250
May 6 2010 5 VDS ID 761141
0 -
FL
OW
RA
TE
(VP
HP
L)
140
0
143
0
150
0
153
0
160
0
163
0
170
0
173
0
180
0
183
0
190
0
193
0
TIME The estimated average non-holiday weekday lost lane-miles by period and year on Ishy210 are shown Exhibits ES-17 (mainline) and ES-18 (HOV) A few notes on these two exhibits
diams The trends in the productivity losses are comparable to the delay trends The largest productivity losses occurred in the eastbound direction during the PM peak hours which is the direction and time period that experienced the most congestion
diams On the mainline facility the westbound direction experienced nearly as high productivity loses during the AM peak period
diams On the HOV lanes a greater productivity loss in the eastbound peak period is more evident
Operational strategies are critical to recovering such productivity losses These strategies include building new or extending auxiliary lanes developing more aggressive ramp metering strategies without negatively influencing the arterial network and improving incident clearance times
I-210 Corridor System Management Plan Executive Summary
Page 20 of 39
Exhibit ES-17 Mainline Daily Equivalent Lost Lane-Miles by Direction and Period (2005-09)
-
10
20
30
40
50
60
70
80
90
100
110
120
130
140
150
160
2005 2006 2007 2008 2009 2005 2006 2007 2008 2009 2005 2006 2007 2008 2009 2005 2006 2007 2008 2009
Eastbound
Westbound
AM PM Midday Night Time Period and Year
Daily
Eq
uiv
ale
nt
Lost
Lan
e-M
iles
Exhibit ES-18 HOV Daily Equivalent Lost Lane-Miles by Direction and Period (2005-09)
-
10
20
30
40
2005 2006 2007 2008 2009 2005 2006 2007 2008 2009 2005 2006 2007 2008 2009 2005 2006 2007 2008 2009
Eastbound
Westbound
AM Midday PM Night
Daily
Eq
uiv
ale
nt
Lost
Lan
e-M
iles
Time Period and Year
I-210 Corridor System Management Plan Executive Summary
Page 21 of 39
BOTTLENECK IDENTIFICATION AND CAUSALITY ANALYSIS
Exhibits ES-19 and ES-20 summarize the eastbound and westbound bottleneck locations the time period that each bottleneck is generally active and the causes of the each bottleneck Exhibits ES-21 and ES-22 are maps of the corridor showing these bottleneck locations for the AM and PM peak periods respectively
Major bottlenecks are the primary cause of congestion and lost productivity By definition a bottleneck is a condition where traffic demand exceeds the effective carrying capacity of the roadway In most cases the cause of a bottleneck is related to a sudden reduction in capacity such as a lane drop merging and weaving driver distractions a surge in demand or a combination of factors
The specific location and causality of each major I-210 bottleneck was verified by multiple field observations on separate weekdays throughout the summer fall and winter of 2009 Some bottleneck locations were videotaped to validate bottlenecks and to assist in micro-simulation model calibration
The detailed final report explains in detail the process and results of the bottleneck identification and causality analysis
I-210 Corridor System Management Plan Executive Summary
Page 22 of 39
Exhibit ES-19 I-210 Eastbound Bottleneck Locations
Abs CA Bottleneck
Location
Active
Period Causality Summary
AM PM
250 R250 Fair Oaks Heavy ramp merge
265 R265 Lake On-ramp Heavy ramp merge
286 R287 San Gabriel On-ramp Heavy ramp merge roadway curves
294 R294 Rosemead On-ramp Heavy consecutive ramp merge
330 R327 Huntington Interchange Heavy ramp merge roadway curves
366 R363 I-605 On-ramp traffic weaving with the off-ramp
400 R397 Azusa On-ramp Heavy ramp merge
408 R406 Citrus On-ramp Heavy ramp merge
450 R450 SR-57 On-ramp Heavy ramp merge and lane drop
Exhibit ES-20 I-210 Westbound Bottleneck Locations
Abs CA
Bottleneck
Location
Active
Period Causality Summary
AM PM
401 R398 Azusa On-ramp Consecutive ramp merge curves
368 R365 I-605 Off-ramp Consecutive ramp merge weaving
322 R319 Santa Anita On-ramp Heavy ramp merge roadway curves
307 R304 Baldwin On-ramp Heavy consecutive ramp merge
297 L297 Rosemead On-ramp Three consecutive ramp merges weaving
280 R281 Altadena On-ramp Heavy ramp merge
261 R261 Lake On-ramp Heavy ramp merge
Bottleneck Locations
reg --Bottleneck
Westbound
Eastbound
0 1 2
I bull I I I bull I I I Miles
HJOUAIIO fl _
I-210 Corridor System Management Plan Executive Summary
Page 23 of 39
Exhibit ES-21 I-210 Map of AM Bottleneck Locations
Bottleneck Locations
reg Bottleneck - Westbound - Eastbound
N 0 1 2
bull I I II II II I ll) Mles s
HJOUAIIO fl _
I-210 Corridor System Management Plan Executive Summary
Page 24 of 39
Exhibit ES-22 I-210 Map of PM Bottleneck Locations
I-210 Corridor System Management Plan Executive Summary
Page 25 of 39
SCENARIO DEVELOPMENT AND ANALYSIS
Fully understanding how a corridor performs and why it performs the way it does sets the foundation for evaluating potential solutions Several steps were required to develop and evaluate improvements including
diams Developing traffic models for 2006 base year and 2020 long-term demand diams Combining projects in a logical manner for modeling and testing diams Evaluating model outputs and summarizing results diams Conducting a benefit-cost assessment of scenarios
Traffic Model Development
The study team developed a traffic model using the VISSIM micro-simulation software It is important to note that micro-simulation models are complex to develop and calibrate for a large urban corridor However it is one of the only tools capable of providing a reasonable approximation of bottleneck formation and queue development Therefore such tools help quantify the impacts of operational strategies which traditional travel demand models cannot
The model was calibrated against 2006 conditions This was a resource intensive effort requiring several iterations of submittals and review cycles until the model reasonably matched bottleneck locations and relative severity Once calibration was approved a 2020 model was also developed based on SCAGrsquos travel demand model demand projections
These two models were used to evaluate different scenarios (combinations of projects) to quantify the associated congestion relief benefits and to compare total project costs against their benefits
Exhibit ES-23 depicts the network included in the model There were no parallel arterials modeled with the exception of arterials at interchanges All freeway interchanges were included as well as on-ramps and off-ramps
I-210 Corridor System Management Plan Executive Summary
Page 26 of 39
Exhibit ES-23 Micro-Simulation Model Network
I-210 Corridor System Management Plan Executive Summary
Page 27 of 39
Scenario Development Framework
The study team developed a framework for combining projects into scenarios It would be desirable to evaluate every possible combination of projects However this would have entailed thousands of model runs Instead the team combined projects based on a number of factors including
diams Projects that were fully constructed and completed from 2006 to 2010 were tested with both the 2006 and 2020 models
diams Short- and mid- term operational projects were grouped into scenarios and tested with the both the 2006 and 2020 models
diams Longer-range projects to be delivered by 2020 and beyond were used to develop scenarios to be tested with the 2020 model only
diams Alternative ramp closures were grouped into isolated scenarios (future scenarios did not build on top of these) and tested with both the 2006 and 2020 models
The study assumes that projects delivered before 2016 could reasonably be evaluated using the 2006 base year model The 2020 forecast year for the I-210 study was consistent with the SCAG 2020 regional travel demand model origin-destination matrices used to develop the 2008 Regional Transportation Plan (RTP) When SCAG updates its travel demand model and Regional Transportation Plan (RTP) it may wish to update the micro-simulation model with revised demand projections
Project lists used to develop scenarios were part from the Regional Transportation Improvement Program (RTIP) the RTP and other sources such as special studies Projects that do not directly affect mobility were eliminated For instance sound wall landscaping or minor arterial improvement projects were not evaluated since microshysimulation models cannot evaluate them
Scenario testing performed for the performed for the I-210 CSMP differed from traditional ldquoalternatives evaluationsrdquo done for Major Investment Studies (MIS) or Environmental Impact Reports (EIRs) An MIS or EIR focuses on identifying alternative solutions to address current or projected corridor problems so each alternative is evaluated separately and results among competing alternatives are compared resulting in a locally preferred alternative In contrast for the I-210 CSMP scenarios build on each other in that a scenario contains the projects from the previous scenario plus one or more projects as long as the incremental scenario results showed an acceptable level of performance improvement This incremental scenario evaluation approach is important since CSMPs are new and are often compared with alternatives studies
Exhibit ES-24 summarizes the approach used and scenarios tested and provides a
I-210 Corridor System Management Plan Executive Summary
Page 28 of 39
general description of the projects included in the 2006 and 2020 micro-simulation runs Most projects were tested for both the short- and long-term timeframes Each scenario tested was built upon prior scenarios except for Scenarios 7 and 8 which were ldquostand alonerdquo scenarios used to test alternative ramp closures Later scenarios build on Scenarios 5 and 6 and do not include the improvements tested in Scenarios 7 and 8 Enhanced incident management was tested in Scenarios 11 and 12 by comparing a simulated incident without and with enhanced incident management system Scenarios 13 and 14 are expected for the longer term and were tested only with the 2020 model
Exhibit ES-24 Micro-Simulation Modeling Approach
Short-Term Scenarios Long-Term Scenarios
Calibrated 2006 Base Case
Scenario 1 Expand Ramp-
Metering
Scenario 3 Scenario 1 +
Adv Ramp-Meter w
Queue Control
Scenario 5 Scenario 3 + aux lane striping and
ramp improvements
2020 Horizon Year
2006 Network 2020 OD Matrices
Scenario 7 Scenario 5 +
Ramp Closures
Scenario 2 Expand Ramp-
Metering
Scenario 4 Scenario 2 +
Adv Ramp-Meter w
Queue Control
Scenario 6 Scenario 4 + aux lane striping and
ramp improvements
Scenario 8 Scenario 6 +
Ramp Closures
Scenario 14 Scenario 13 + Lake
Ave Drop Ramp
Lane Addition
Scenario 9 Scenario 5+
On-Ramp amp Aux
lane improvements
Scenario 10 Scenario 6 +
On-Ramp amp Aux
lane improvements
Scenario 11 Incident with No
Incident
Management
Scenario 12 Incident With
Incident
Management
Scenario 13 Scenario 10 +
134210 IC
modification
Incident Management Scenarios
I-210 Corridor System Management Plan Executive Summary
Page 29 of 39
Scenario Evaluation Results
Exhibits ES-25 and ES-26 show the delay results for all the 2006 scenarios evaluated for the AM and PM peak periods respectively Exhibits ES-27 and ES-28 show the delay results for all the 2020 scenarios evaluated for the AM and PM peak periods respectively For each scenario the modeling team produced results by facility type (ie mainline HOV arterials and ramps) and vehicle type (SOV HOV trucks) as well as speed contour diagrams (discussed in more detail in the full technical CSMP) The study team scrutinized to ensure that they were consistent with general traffic engineering principles The following summarizes the findings related to the four exhibits
Exhibit ES-25 2006 AM Peak Micro-Simulation Delay Results by Scenario
De
lay
(Pe
ak
Pe
rio
d V
eh
icle
-Ho
urs
)
2006 Base Year S1 S3 S5 S7 S9 Scenario
18000
16000
14000
12000
10000
8000
6000
4000
2000
-
S1 Expand Ramp Metering
S3 Adv Ramp Metering
S5 Aux Lane Striping Ramp Improvs
S7 Ramp Closures
S9 On-Ramp amp Aux Lane Improvs
-2 -3 -3
-16 -20
HOV WB I-210 WB
HOV EB I-210 EB
Ramps Arterials
I-210 Corridor System Management Plan Executive Summary
Page 30 of 39
Exhibit ES-26 2006 PM Peak Micro-Simulation Delay Results by Scenario
18000
De
lay
(Pe
ak
Pe
rio
d V
eh
icle
-Ho
urs
)
16000
14000
12000
10000
8000
6000
4000
2000
-
S1 Expand Ramp Metering
S3 Adv Ramp Metering
HOV WB
I-210 WB
S5 Aux Lane Striping Ramp Improvs
S7 Ramp Closures
S9 On-Ramp amp Aux Lane Improvs
HOV EB
I-210 EB
Ramps
Arterials
-17
-11
-18
-18 -28
2006 Base Year S1 S3 S5 S7 S9 Scenario
Exhibit ES-27 2020 AM Peak Micro-Simulation Delay Results by Scenario
30000
De
lay
(Pe
ak
Pe
rio
d V
eh
icle
-Ho
urs
)
25000
20000
15000
10000
5000
S2 Expand Ramp Metering
S4 Adv Ramp Metering
S6 Aux Lane Striping Ramp Improvs
S8 Ramp Closures
HOV WB
I-210 WB
HOV EB
-8
-2 -8
-13 -12
S10 On-Ramp amp Aux Lane Improvs
S13 SR-134I-210 IC Modification
S14 Lake Ave Drop Ramp Lane Addition
I-210 EB
Ramps
Arterials
-11
-23
-
2020 S2 S4 S6 S8 S10 S13 S14 Horizon Scenario
I-210 Corridor System Management Plan Executive Summary
Page 31 of 39
Exhibit ES-28 2020 PM Peak Micro-Simulation Delay Results by Scenario D
ela
y(P
ea
k P
eri
od
Ve
hic
le-H
ou
rs)
30000
25000
20000
15000
10000
5000
-
S2 Expand Ramp Metering
S4 Adv Ramp Metering
S6 Aux Lane Striping Ramp Improvs
S8 Ramp Closures
HOV WB
I-210 WB
HOV EB
-14
S10 On-Ramp amp Aux Lane Improvs
S13 SR-134I-210 IC Modification
S14 Lake Ave Drop Ramp Lane Addition
I-210 EB
Ramps
Arterials
-2 -5 -3 -28
-3 -19
2020 S2 S4 S6 S8 S10 S13 S14 Horizon Scenario
Base Year and Do Minimum Horizon Year
Absent any physical improvements the modeling team estimates that by 2020 total delay (mainline HOV ramps and arterials) would double compared to 2006 (from a total of around 22000 vehicle-hours daily to just fewer than 45000 vehicle-hours) in the combined AM and PM peak
Scenarios 1 and 2 (Expand Ramp Metering)
Scenarios 1 and 2 test the only project on the corridor that was fully constructed and completed The project installed new connector metering at the SR-57 and I-605 to Ishy210 freeway connector ramps The project also widened various ramps removed various HOV meter bypasses and upgraded the ramp metering system
The 2006 model estimates that Scenario 1 would reduce delay on the corridor by around 17 percent (or 1600 daily vehicle-hours) in the PM peak period but only around two percent (or 200 vehicle-hours) in the AM peak period The biggest benefits occur in the PM eastbound direction from Rosemead On-Ramp to Huntington interchange (with a delay reduction of over 1000 vehicle-hours) as well as from I-605 to the Azusa On-Ramp (delay reduction of 500 vehicle-hours) for single occupant vehicles The
I-210 Corridor System Management Plan Executive Summary
Page 32 of 39
westbound reductions in freeway delay are largely offset by increased on-ramp delay mostly from new connector metering at SR-57 and I-605
The 2020 model estimates that Scenario 2 will reduce delay by around 8 percent in the AM peak and 14 percent in the PM peak for a combined total reduction of 5000 daily vehicle-hours The long-term improvements are less than the short-term improvements due to the increase in demand
Scenarios 3 and 4 (Advanced Ramp Metering)
Scenarios 3 and 4 build on Scenarios 1 and 2 by adding advanced ramp metering system such as dynamic or adaptive ramp metering system
The 2006 model shows that Scenario 3 would reduce delay by an additional 850 daily vehicle-hours (or 11 percent) in the PM peak with a marginal reduction in the AM peak period However in conjunction with Scenario 1 Scenario 3 reduces delay in total by over 600 vehicle-hours in the AM peak These results suggest that queue control provides additional benefits beyond SWARM
The 2020 model estimates that Scenario 4 will modestly reduce delay by about 2 percent in both the AM and PM peaks or a combined total of 800 daily vehicle-hours Again the benefits are lower in percentage terms due to the increase in demand
Note that there are various types of advanced ramp metering systems deployed around the world including System-wide Adaptive Ramp Metering System or SWARM tested recently in Los Angeles I-210 freeway corridor For the I-210 model the Asservissement Lineaire drsquoEntreacutee Autoroutiere (ALINEA system) was tested as proxy for any advanced ramp metering system as its algorithm for the model was readily available It is not necessarily recommended that ALINEA be deployed but rather some type of advanced ramp metering system that would produce similar if not better results
Scenarios 5 and 6 (Auxiliary Lane Striping Ramp Improvements)
Scenarios 5 and 6 build on Scenarios 3 and 4 that include several relatively lower-cost operational improvements that could be implemented by 2015
diams Building a westbound auxiliary lane from Santa Anita to Baldwin and an eastbound auxiliary lane from Santa Anita to Huntington
diams Extending a lane to Lincoln on the westbound I-210 connector
diams Connecting and converging the Altadena on-ramps into a single on-ramp
I-210 Corridor System Management Plan Executive Summary
Page 33 of 39
diams Connecting and converging the Santa Anita on-ramps into a single on-ramp
diams Connecting and converging the Irwindale on-ramps into a single on-ramp
diams Restriping to add a lane in the eastbound direction from San Dimas to Fruit
The 2006 model shows that Scenario 5 reduces delay by 3 percent (nearly 400 vehicleshyhours) in the AM peak and 18 percent (1200 vehicle-hours) in the PM peak The segment that experienced the largest improvement in the eastbound during the PM peak was from Rosemead to Huntington This segment experienced a 45 percent improvement in delay (from 2700 vehicle-hours to 1500 vehicle-hours) which is likely attributed to the eastbound auxiliary lane from Santa Anita to Huntington In the westbound direction the auxiliary lane from Santa Anita to Baldwin shifts some traffic downstream to cause increased congestion at Michillinda (ie bottleneck shift) during the westbound AM peak However the auxiliary lane helps reduce both queue length and queue duration for the Santa Anita bottleneck
The 2020 model estimates that Scenario 6 would reduce delay by 8 percent in the AM peak and 5 percent in the PM peak for a total reduction of 2500 daily vehicle-hours A reduction in PM delay is expected to occur mostly in the westbound direction
Scenarios 7 and 8 (Ramp Closures)
Scenarios 7 and 8 build on Scenarios 5 and 6 and test the closure of several ramps
diams Eastbound Marengo on-ramp and westbound Lake on-ramp with signalization of the eastbound I-210 off-ramp at Maple and improvement to alternate routes along Corson and Maple
diams Eastbound Mount Olive ramps
Note that subsequent scenarios are not built on top of these scenarios as these are isolated to test ramp closure alternatives
The 2006 model shows that Scenario 7 would reduce delay significantly by 16 percent in the AM peak and 18 percent in the PM peak for a total delay reduction of nearly 3000 daily vehicle-hours The delay reductions are significant on the mainline during the peak direction of travel ndash 1400 vehicle-hours in the westbound AM and 912 vehicleshyhours in the eastbound PM In the westbound direction and AM peak period the segment from Altadena to Lake experienced over an 85 percent decrease in congestion (from 860 to 120 vehicle-hours of delay) This is likely attributed to the closure of the westbound Lake on-ramp In the eastbound direction and PM peak period the segment from Huntington to I-605 experienced a delay reduction of over 70 percent (from 2200
I-210 Corridor System Management Plan Executive Summary
Page 34 of 39
vehicle-hours to 600 vehicle-hours) which is likely attributed to the closure of the Mount Olive ramp
The 2020 model also shows that Scenario 8 improved delay by 12 percent in the AM and 3 percent in the PM for a total delay reduction of almost 3000 daily vehicle-hours On the mainline facility delay also improved for each peak direction of travel ndash by 1600 daily vehicle-hours in the westbound AM and by 750 vehicle-hours in the eastbound PM Delay reductions in the non-peak direction were not as significant
Scenarios 9 and 10 (On-ramp and Aux Lane Improvements)
Scenarios 9 and 10 build on Scenarios 5 and 6 and test four operational improvements that can be implemented in the short to medium range
diams Modify the RosemeadMichillinda interchange and converge the westbound I-210 on-ramps
diams Modify the northside of the Baldwin interchange and eliminate the collectorshydistributor
diams Construct an eastbound auxiliary lane from Azusa to Citrus
diams Converge the eastbound Citrus on-ramps and add an auxiliary lane to Grand
The 2006 model estimates that Scenario 9 will reduce delay by 20 percent (or 2400 daily vehicle-hours) in the AM peak and 28 percent (or 1600 daily vehicle-hours) in the PM peak compared to Scenario 5 In both AM and PM peak period the eastbound direction experienced the largest reduction in delay
The 2020 model estimates that Scenario 10 will reduce delay by 13 percent (or 2500 vehicle-hours) in the AM peak and 28 percent in the PM peak (or 4800 vehicle-hours) compared to Scenario 6 Similar to the 2006 model the 2020 model shows that these improvements produced a greater reduction in delay in the eastbound direction than the westbound direction
Scenarios 11 and 12 (Enhanced Incident Management)
Two incident scenarios were tested on top of Scenario 10 to evaluate the non-recurrent delay reductions resulting from enhanced incident management strategies An enhanced incident management system would entail upgrading or enhancing the current Caltrans incident management system that includes deployment of intelligent transportation system (ITS) field devices central controlcommunications software communications medium (ie fiber optic lines) advanced traveler information system
I-210 Corridor System Management Plan Executive Summary
Page 35 of 39
andor freeway service patrol (FSP) program to reduce incident detection verification response and clearance times
In the first scenario Scenario 11 one collision incident with one lane closure was simulated in the westbound direction in the AM peak period model and one in the eastbound direction in the PM peak period model The incident simulation location and duration were selected based on review of the 2010 actual incident data at one of the high frequency locations The following are the Scenario details
diams Westbound AM peak period starting at 800 AM close mainline lane 2 for 40 minutes at absolute post mile 2612 (at Lake Avenue)
diams Eastbound PM peak period starting at 500 PM close mainline lane 2 for 50 minutes at absolute post mile 3207 (west of Santa Anita)
In the second scenario Scenario 12 the same collision incidents were simulated with a reduction in duration by 10 minutes in the westbound direction and by 12 minutes in the eastbound direction It is estimated based on actual incident management data analysis results provided by Caltrans that an enhanced incident management system could reduce a 35-minute incident by about 10 minutes This scenario represents a typical moderate level incident at one location during the peak period direction Data suggest that incidents vary significantly in terms of impact and duration Some incidents last hundreds of minutes some close multiple lanes and some occur at multiple locations simultaneously There are also numerous minor incidents lasting only a few minutes without lane closures that can result in congestion Many other incidents also occur during off-peak hours
Without enhanced incident management Scenario 11 produced an 8 percent increase in congestion in both peak periods over Scenario 10 an increase of over 2300 hours of vehicle delay With enhanced incident management Scenario 12 evaluation resulted in delay decrease by 2 percent in the AM peak and 3 percent in the PM peak against Scenario 11 results a reduction of nearly 750 vehicle-hours for improving the incident detection verification response and clearance time of one moderate level incident for both of the peak hours
Scenario 13 (SR-134I-210 Interchange Modification)
Scenario 13 tests an improvement to modify the SR-134I-210 interchange to provide a direct connection for vehicles to continue on I-210 with three lanes in each direction This improvement was tested with the 2020 model since it is not likely to be implemented in the short-term
I-210 Corridor System Management Plan Executive Summary
Page 36 of 39
The 2020 model estimates that delay would be reduced by 11 percent (or 1800 daily vehicle-hours) in the AM and 3 percent in the PM (320 daily vehicle-hours) compared to Scenario 10 The westbound mainline experienced the greatest reduction in delay in the AM peak from 9600 vehicle-hours to 8600 vehicle hours after the interchange modification
Scenario 14 (Westbound Drop Ramp and Eastbound Widening)
Scenario 14 builds on Scenario 13 and tests Lake Avenue drop ramp to westbound Ishy210 center lanes (one HOV lane and one mainline) and eastbound I-210 widening from Myrtle to I-605 This improvement was tested with the 2020 model
The 2020 model estimates that delay would be reduced by about 20 percent in the AM or 3400 vehicle-hours and 20 percent in the PM or 2300 vehicle-hours compared to Scenario 13 The mobility improvements are significant with the westbound drop ramp that reduces weaving between SR-134 and SR-210 destined traffic and with the eastbound capacity addition to I-605 off that moves the off-ramp traffic away from the mainline and provides more room for the mainline through traffic
Post Scenario 14 Conditions
By 2020 with the inclusion of all the projects tested the model reveals some residual congestion that remains to address with future improvements According to the model results the total remaining delay on the corridor is around 21000 daily vehicle-hours
Benefit-Cost Analysis
Following an in-depth review of model results by the study team and the SCAG technical committee the study team performed a benefit-cost analysis (BCA) for each scenario
Using the California Benefit-Cost Model (Cal-BC) developed on behalf of Caltrans by the study team benefits in three key areas were estimated travel time savings vehicle operating cost savings and emission reduction savings The benefits generated from this exercise are based solely on congestion relief related benefits However these results are conservative since there are other benefits not captured by this analysis including benefits from deploying bus rapid transit which will achieve other accessibility benefits
Project costs were developed from SCAG and Caltrans project planning and programming documents These costs include construction and support costs in current dollars The study team estimated costs for projects that did not have cost
I-210 Corridor System Management Plan Executive Summary
Page 37 of 39
estimates by reviewing similar completed projects A BC greater than one means that a scenarios projects return greater benefits than it costs to construct or implement It is important to consider the total benefits that a project brings For example a large capital expansion project can cost a great deal and have a low BC ratio but brings much higher absolute benefits to the I-210 users Exhibit ES-29 shows the benefit to cost ranges classified from low (with a BC of one to two) to very high (with a BC of over 10)
The benefit-cost results for the South Corridor scenarios are shown in Exhibit ES-29
Exhibit ES-29 I-210 Scenario BenefitCost (BC) Results
Scenario Scenario Description
BenefitCost Ranges
Low Medium Medium-High High Very High
lt1 1 to 2 2 to 5 5 to 10 gt10
12 Expand Ramp Metering 34 Advanced Ramp Metering 56 Aux Lane Striping Ramp Improvs 78 Ramp Closures
910 On-Ramp amp Aux Lane Improvs 13 SR-134I-210 IC Modification
The benefit-cost findings for each scenario are as follows
diams Scenarios 1 and 2 (ramp metering expansion) shows a high benefit-cost ratio of over ten The relatively high benefit-cost ratio is due to the low cost of expanding ramp metering ($235 million)
diams Scenarios 3 and 4 (advanced ramp metering) resulted in an incremental benefitshycost ratio of over ten This is relatively high as compared to that of typical transportation management system project
diams Scenarios 5 and 6 (operational improvements) produced a benefit-cost ratio of over five This is relatively consistent with other typical operational improvement projects The benefits are substantial At estimated total cost of about $44 million these projects produced benefits of over $233 million
diams Scenarios 7 and 8 tested the ramp closures at eastbound Marengo westbound Lake and eastbound Mount Olive These ramp closured produced an extremely high incremental benefit-cost ratio of over ten due to the relatively very low cost However this benefit-cost calculation does not account for any potential increase in delay on various local arterials because of detours from the closed ramps
diams Scenarios 9 and 10 also produced a relatively high benefit-cost ratio of over ten The four operational projects in these scenarios are collectively estimated to cost
I-210 Corridor System Management Plan Executive Summary
Page 38 of 39
under $30 million and provide a substantial and optimistic benefit of over $670 million
diams Scenario 13 tested the SR-134I-210 interchange modification This project produced a benefit-cost ratio of between one and two consistent with other typical capital expansion projects This project produced benefits of over $200 million at a rough-estimate cost of about $150 million
diams Scenario 14 tested the westbound center drop ramp from Lake Avenue interchange and eastbound lane addition from Myrtle to I-605 These projects produced a relatively high benefit-cost ratio of about 6 to one as compared to other capital improvement projects These two capital projects are unique in that they have specific operational improvement element that addresses major bottleneck locations For an estimated total combined cost of about $70 million the projected benefits exceed $420 million
CONCLUSIONS AND RECOMMENDATIONS
This section summarizes the conclusions and recommendations based on the analysis discussed in the previous section It is important to note that many of these conclusions are based primarily on the micro-simulation model results The model was developed based on the best data available at the time The study team reviewed the model results and believe that both the calibrated base year forecast year and scenario results are reasonable However Caltrans should always be cautious to make decisions based on modeling alone especially complex micro-simulation models
Based on the results the study team offers the following conclusions and recommendations
diams The combination of all scenarios significantly reduces overall congestion on the corridor Projected 2020 congestion after implementation of all scenarios is below 2006 levels in both the AM and PM peak period In the AM peak period the model projects total delay in 2020 after delivering all projects to be less than 11700 vehicle-hours compared to the 2006 base year delay of 13000 vehicleshyhours This represents a reduction of over 10 percent In the PM peak period the model projects total delay in 2020 after delivering all projects to be around 9500 hours compared to the 2006 base year delay of almost 9300 vehicle-hours This represents a slight reduction of 2 percent Clearly the scenarios deliver significant mobility benefits to the corridor Despite the growth in demand future 2020 congestion will be less than experienced in 2006
diams The completed ramp metering expansion project is expected to produce substantial mobility benefits of over $400 million Delay has been significantly reduced since 2006
I-210 Corridor System Management Plan Executive Summary
Page 39 of 39
diams Advanced ramp metering could provide additional mobility improvements by significantly reducing congestion and returning over $100 million in benefits
diams Ramp closures at Marengo Lake and Mount Olive as alternatives seem promising by reducing delay up to 3000 vehicle-hours per day and providing substantial benefits of $280 million at an extremely low cost
diams Operational improvements such as auxiliary lanes and ramp improvements could leverage on the ramp metering projects by making the corridor more efficient and productive that could result in additional mobility benefits of over $230 million
diams Additional capital improvements with specific operational elements to address weaving at major bottleneck locations could produce significant mobility benefits of over $420 million
diams Enhanced incident management system associated with Scenarios 11 and 12 to address non-recurrent congestion proved effective with a delay reduction of over 300 vehicle-hours for one modest level incident with a typical duration of 35 minutes reduced to 25 minutes With the I-210 corridor experiencing up to 2400 collisions per year this translates to a total annual delay savings of over 700000 vehicle-hours for the study corridor
diams The benefit-cost ratio of all scenarios combined is about 64 to 1 If all projects were delivered at current cost estimates the public would get over six dollars of benefits for each dollar expended In current dollars costs total to over $17 billion whereas the benefits are estimated to be over $20 billion
diams The projects also alleviate greenhouse gas (GHG) emissions by over 15 million tons over 20 years averaging over a 75000-ton reduction per year The emissions are estimated using data from the California Air Resources Board (CARB) EMFAC model
This is the first generation CSMP for the I-210 corridor It is important to stress that CSMPs should be updated on a regular basis This is particularly important since traffic conditions and patterns can differ from current projections After projects are delivered it is also useful to compare actual results with estimated ones in this document so that models can be further improved as appropriate
CSMPs or a variation thereof should become the normal course of business that is based on detailed performance assessments an in-depth understanding of the reasons for performance deterioration and an analytical framework that allows for evaluating complementary operational strategies that maximize the productivity of the current system

I-210 Corridor System Management Plan Executive Summary
Page 4 of 39
CORRIDOR PERFORMANCE ASSESSMENT
This section briefly describes the I-210 corridor and summarizes the results of the comprehensive corridor performance assessment conducted
Corridor Description
Exhibit ES-2 shows the location of the Los Angeles County I-210 CSMP corridor The corridor extends approximately 45 miles from the I-5 (Golden State Freeway) interchange in the San Fernando Valley to the SR-57 (Orange Freeway) interchange It traverses the cities of San Fernando La Canada Flintridge Pasadena Arcadia Monrovia Duarte Azusa and San Dimas The focus of the CSMP is the 20-mile congested urban section between SR-134 and SR-57
The corridor is a divided eight- to ten-lane freeway with a concrete median and an additional outside auxiliary lane along most of the corridor A single High Occupancy Vehicle (HOV) lane exists in each direction through the congestion urban area that is the focus of the study corridor (from the SR-134 interchange to the SR-57 interchange)
According to Caltrans traffic volumes reported for 2008 Los Angeles I-210 carries between 76000 and 298000 annual average daily traffic (AADT) The highest average daily traffic volume on the corridor occurs at the SR-134 interchange and the lowest volume occurs near the I-5 interchange
I-210 is also a Surface Transportation Assistance Act (STAA) route that allows large trucks to operate on the mainline lanes According to the latest truck volumes from Caltrans trucks comprise between four and ten percent of total daily traffic along the corridor Higher truck percentages occur west of the SR-134 Many of these trucks travel eastbound to the Inland Empire home to many warehouses and distribution centers The trucks traveling westbound are typically headed north to connect to the I-5 corridor and beyond
Major transit operations along the I-210 Corridor include Metro bus and light rail Metrolink commuter rail Foothill Transit Los Angeles City Department of Transportation Commuter Express and Pasadena Area Rapid Transit System (ARTS)
Metro operates ten parallel local bus or bus rapid transit (BRT) routes near the I-210 corridor It also operates the Metro Rail Gold Line that provides light-rail service in the center median of I-210 from downtown Los Angeles Union Station to the Sierra Madre Villa station
1-210 Corridor Study A1rea
0 I 2 3 4 5 MIEB
llllilllilllilllil l+j
I-210 Corridor System Management Plan Executive Summary
Page 5 of 39
Exhibit ES-2 Los Angeles County I-210 CSMP Corridor Map
I-210 Corridor System Management Plan Executive Summary
Page 6 of 39
Foothill Transit provides four bus lines that serve Pasadena the City of Arcadia and the City of Duarte The City of Los Angeles Department of Transportation also operates two commuter service lines that service the San Gabriel Valley Other transit agencies such as the Pasadena Rapid Transit System and the Glendale Bee operate local bus service between residential neighborhoods and business centers The Metrolink Antelope Valley Line provides commuter rail service from the Antelope Valley along the I-5 and San Fernando Road to downtown Los Angeles
There are various bike routes near I-210 but none that parallel the study corridor Most of the bike routes near the corridor are Class III Bike Paths (preferred bike routes on existing streets identified by signs only) These routes are concentrated between I-110 and SR-19 Due to the terrain and uphill climb there are few bike paths west of SRshy134
Several roadway improvements have been recently completed In preparation for System-Wide Adaptive Ramp Metering (SWARM) implementation various on-ramps between SR-134 and SR-57 were modified to enhance metering with traffic signals on the HOV bypass lanes Freeway connector on-ramps from I-605 and SR-57 have been modified to implement connector metering with traffic signals Closed-circuit television (CCTV) cameras and fiber optic communications were also added throughout the corridor
In addition to major employment trip-generating activity centers in Pasadena area there are 14 collegesuniversities six major medical centers the Rose Bowl stadium Santa Anita Park Horse Track Irwindale Speedway and various large shopping malls The Bob Hope Airport in Burbank is also a major traffic generator for the I-210 corridor
Corridor Performance Assessment
The I-210 CSMP focuses on four categories of performance measures
diams Mobility describes how quickly people and freight move along the corridor diams Reliability captures the relative predictability of travel time along the corridor diams Safety provides an overview of collisions along the corridor diams Productivity quantifies the degree to which traffic inefficiencies at bottlenecks or
hot spots reduce flow rates along the corridor
Mobility
Two primary measures quantify mobility in this report delay and travel time Each is estimated from field automatic detection data from the Performance Measurement System1 (PeMS) provided access to the historical freeway detection data needed to
1 Developed and maintained by Caltrans and accessible at pemsdotcagov
I-210 Corridor System Management Plan Executive Summary
Page 7 of 39
estimate the two mobility measures PeMS collects detector volume and occupancy data on the freeway which were used to estimate speed delay and travel time
Delay
Delay is defined as the observed travel time less the travel time at uncongested conditions and is reported as vehicle-hours of delay The assessment summarized the results for the five-year period between 2005 and 2009 Delays in this report were calculated as the difference in travel time between estimated speeds and free-flow conditions at 60 mph applied to the observed volume Exhibit ES-2 shows the average daily vehicle-hours of delay for each month between 2005 and 2009 for both mainline and high occupancy vehicle (HOV) lanes This exhibit reveals the following trends
diams Prior to 2007 the eastbound and westbound directions experienced similar delay levels on both the mainline and HOV lanes The HOV lanes comprise approximately 15 to 20 percent of the total estimated delay on the corridor
diams Congestion on the westbound mainline lanes experienced extreme peaking ndash likely caused by construction on the corridor between 2007 and 2008 The eastbound lanes did not experience much change in delay in 2007 but declined through 2008 The HOV facility did not experience significant change during this time
diams In 2009 the estimated delay on the eastbound mainline lanes increased dramatically while in contrast the westbound lanes declined sharply The HOV lane showed a similar trend with the eastbound HOV lane exceeding the delay in the westbound direction
I-210 Corridor System Management Plan Executive Summary
Page 8 of 39
Exhibit ES-3 Average Weekday Delay by Month (2005-2009) 16000
Av
era
ge
Da
ily
Ve
hic
le-H
ou
rs o
f D
ela
y (
6
0m
ph
)
15000
14000
13000
12000
11000
10000
9000
8000
7000
6000
5000
4000
3000
2000
1000
-
Ja
nF
eb
Ma
rA
pr
Ma
yJ
un
Ju
lA
ug
Se
pO
ct
No
vD
ec
Ja
nF
eb
Ma
rA
pr
Ma
yJ
un
Ju
lA
ug
Se
pO
ct
No
vD
ec
Ja
nF
eb
Ma
rA
pr
Ma
yJ
un
Ju
lA
ug
Se
pO
ct
No
vD
ec
Ja
nF
eb
Ma
rA
pr
Ma
yJ
un
Ju
lA
ug
Se
pO
ct
No
vD
ec
Ja
nF
eb
Ma
rA
pr
Ma
yJ
un
Ju
lA
ug
Se
pO
ct
No
vD
ec
2005 2006 2007 2008 2009
Eastbound ML
Westbound ML
Eastbound HOV
Westbound HOV
Month
The CSMP separates delay further into two components severe delay and other delay Severe delay is delay that occurs when speeds are below 35 mph and other delay occurs where speeds are between 35 and 60 mph Severe delay represents breakdown conditions ldquoOtherrdquo delay represents conditions approaching or leaving the breakdown congestion or areas that cause temporary slowdowns However it can also be a leading indicator of future severe delay
Exhibits ES-4 (Mainline lanes) and ES-5 (HOV lanes) show average severe and other daily vehicle-hours of delay by day of the week A few notes related to ES-4 and ES-5
diams Severe delay makes up about 70 percent of all weekday delay on the corridor in either the eastbound or the westbound direction Severe delay on Saturdays and SundaysHolidays tend to be under 70 percent while weekday severe delay averages around 75 percent of all delay As in Exhibit ES-3 HOV delays tend to range between 14 and 25 percent of total delay
diams Fridays in the eastbound direction experience the highest delays probably due to weekend travel The second highest delays generally occurred on Thursdays In the westbound direction the day of week trends are typical for urban commute corridors with the midweek days experiencing the highest delays with Monday and Friday showing slightly less congestion and the weekends showing much lower delays than during the week
Av
era
ge D
aily V
eh
icle
-Ho
urs
of
Dela
y (
60
mp
h)
Av
era
ge D
aily V
eh
icle
-Ho
urs
of
Dela
y (
60
mp
h)
I-210 Corridor System Management Plan Executive Summary
Page 9 of 39
Exhibit ES-4 Mainline Lane Delay by Day of Week (2005-2009) 16000
15000
14000
13000
12000
11000
10000
9000
8000
7000
6000
5000
4000
3000
2000
1000
-
Mainline Other Delay
Mainline Severe Delay M
on
T
ue
Wed
T
hu
F
riS
at
Su
n
Ho
lM
on
Tu
eW
ed
Th
uF
riS
at
Su
n
Ho
lM
on
Tu
eW
ed
Th
uF
riS
at
Su
n
Ho
lM
on
Tu
eW
ed
Th
uF
riS
at
Su
n
Ho
lM
on
Tu
eW
ed
Th
uF
riS
at
Su
n
Ho
lM
on
Tu
eW
ed
Th
uF
riS
at
Su
n
Ho
lM
on
Tu
eW
ed
Th
uF
riS
at
Su
n
Ho
lM
on
Tu
eW
ed
Th
uF
riS
at
Su
n
Ho
lM
on
Tu
eW
ed
Th
uF
riS
at
Su
n
Ho
lM
on
Tu
eW
ed
Th
uF
riS
at
Su
n
Ho
l
2005 2006 2007 2008 2009 2005 2006 2007 2008 2009
EASTBOUND WESTBOUND
Exhibit ES-5 HOV Lane Delay by Day of Week (2005-2009) 4000
3500
3000
2500
2000
1500
1000
500
-
Mo
nT
ue
Wed
Th
uF
riS
at
Su
n
Ho
lM
on
Tu
eW
ed
Th
uF
riS
at
Su
n
Ho
lM
on
Tu
eW
ed
Th
uF
riS
at
Su
n
Ho
lM
on
Tu
eW
ed
Th
uF
riS
at
Su
n
Ho
lM
on
Tu
eW
ed
Th
uF
riS
at
Su
n
Ho
lM
on
Tu
eW
ed
Th
uF
riS
at
Su
n
Ho
lM
on
Tu
eW
ed
Th
uF
riS
at
Su
n
Ho
lM
on
Tu
eW
ed
Th
uF
riS
at
Su
n
Ho
lM
on
Tu
eW
ed
Th
uF
riS
at
Su
n
Ho
lM
on
Tu
eW
ed
Th
uF
riS
at
Su
n
Ho
l
2005 2006 2007 2008 2009 2005 2006 2007 2008 2009
EASTBOUND WESTBOUND
Other Delay
Severe Delay
I-210 Corridor System Management Plan Executive Summary
Page 10 of 39
Exhibits ES-6 and ES-7 summarize average annual weekday delay by hour of the day over the five-year period for the mainline northbound and southbound lanes respectively These exhibits allow planners and decision makers to understand the trend in peak period delay spiking and peak period spreading by comparing the intensity and duration of the peak period congestion Note that the HOV lanes are not shown in this summary report since they follow similar peaking trends as the mainline lanes (the main technical report contains the HOV delay by hour results) A few notes on these two exhibits
diams The eastbound direction peaks in the PM peak period while the AM is the westbound peak AM peak hour is 700 AM while the PM peak period is 500 PM
diams In the eastbound PM direction congestion grew dramatically in 2009 while westbound AM congestion declined This is also evident in Exhibit ES-2 Eastbound delay between 2005 and 2008 remained relatively constant at about 1750 vehicle-hours during the 500 PM peak hour before increasing in 2009 to about 2100 vehicle-hours
diams Westbound AM congestion declined in 2009 after two years of dramatic growth between 2007 and 2008 In 2009 the AM peak period also shrank by approximately one-half hour and started at approximately 530 AM whereas from 2005 to 2008 the peak period started around 500 AM
Exhibit ES-6 Eastbound Mainline Lanes Hourly Delay (2005-2009)
0
250
500
750
1000
1250
1500
1750
2000
2250
2500
Ave
rag
e D
ail
y V
eh
icle
Ho
urs
of
Dela
y (
60
mp
h) 2009 Weekday
2008 Weekday
2007 Weekday
2006 Weekday
2005 Weekday
00
0
10
0
20
0
30
0
40
0
50
0
60
0
70
0
80
0
90
0
100
0
110
0
120
0
130
0
140
0
150
0
160
0
170
0
180
0
190
0
200
0
210
0
220
0
230
0
Hour of the Day
I-210 Corridor System Management Plan Executive Summary
Page 11 of 39
Exhibit ES-7 Westbound Mainline Lanes Hourly Delay (2005-2009)
0
250
500
750
1000
1250
1500
1750
2000
2250
2500
Ave
rag
e D
ail
y V
eh
icle
Ho
urs
of
Dela
y (
60m
ph
) 2009 Weekday
2008 Weekday
2007 Weekday
2006 Weekday
2005 Weekday
00
0
10
0
20
0
30
0
40
0
50
0
60
0
70
0
80
0
90
0
100
0
110
0
120
0
130
0
140
0
150
0
160
0
170
0
180
0
190
0
200
0
210
0
220
0
230
0
Hour of the Day
Travel Time
The travel time performance measure represents the average time it takes for a vehicle to travel between SR-134 and SR-57 a distance of approximately 20 miles
Exhibits ES-8 and ES-9 summarize mainline estimated average weekday travel times by hour of day for the 2005-2009 five-year period Exhibits ES-10 and ES-11 show the same results for the HOV facility Similar to delay travel times increased in 2009 in the eastbound PM direction and time but decreased in the westbound AM commute period
In the mainline lanes the eastbound PM peak hour (500 PM) travel time grew from 40 minutes in 2008 to 44 minutes in 2009 In the westbound AM peak hour (700 AM) the opposite trend occurred with travel times dropping from a 41 minute average in 2008 to around 36 minutes in 2009
A similar trend occurred for the HOV lanes except that 2005 was the worst year in terms of travel times
Tra
ve
l T
ime
(m
inu
tes
) T
rav
el
Tim
e (
min
ute
s)
45
40
35
30
25
20
15
10
5
0
45
40
35
30
25
20
15
10
5
0
I-210 Corridor System Management Plan Executive Summary
Page 12 of 39
Exhibit ES-8 Eastbound Mainline Lanes Travel Time by Hour (2005-2009) 50
2009 Average Travel Time
2008 Average Travel Time
2007 Average Travel Time
2006 Average Travel Time
2005 Average Travel Time
Travel Time 60mph
Travel Time 35mph
Hour of the Day
00
0
10
0
20
0
30
0
40
0
50
0
60
0
70
0
80
0
90
0
100
0
110
0
120
0
130
0
140
0
150
0
160
0
170
0
180
0
190
0
200
0
210
0
220
0
Hour of the Day
Exhibit ES-9 Westbound Mainline Lanes Travel Time by Hour (2005-2009) 50
2009 Average Travel Time
2008 Average Travel Time
2007 Average Travel Time
2006 Average Travel Time
2005 Average Travel Time
Travel Time 60mph
Travel Time 35mph
00
0
10
0
20
0
30
0
40
0
50
0
60
0
70
0
80
0
90
0
10
00
11
00
12
00
13
00
14
00
15
00
16
00
17
00
18
00
19
00
20
00
21
00
22
00
230
0
23
00
Tra
ve
l T
ime
(m
inu
tes
) T
rav
el
Tim
e (
min
ute
s)
45
40
35
30
25
20
15
10
5
0
45
40
35
30
25
20
15
10
5
0
I-210 Corridor System Management Plan Executive Summary
Page 13 of 39
Exhibit ES-10 Eastbound HOV Lanes Travel Time by Hour (2005-2009) 50
2009 Average Travel Time
2008 Average Travel Time
2007 Average Travel Time
2006 Average Travel Time
2005 Average Travel Time
Travel Time 60mph
Travel Time 35mph
Hour of the Day
00
0
10
0
20
0
30
0
40
0
50
0
60
0
70
0
80
0
90
0
100
0
110
0
120
0
130
0
140
0
150
0
160
0
170
0
180
0
190
0
200
0
210
0
220
0
Hour of the Day
Exhibit ES-11 Westbound HOV Lanes Travel Time by Hour (2005-2009) 50
2009 Average Travel Time
2008 Average Travel Time
2007 Average Travel Time
2006 Average Travel Time
2005 Average Travel Time
Travel Time 60mph
Travel Time 35mph
00
0
10
0
20
0
30
0
40
0
50
0
60
0
70
0
80
0
90
0
100
0
110
0
120
0
130
0
140
0
150
0
160
0
170
0
180
0
190
0
200
0
210
0
220
0
230
0
230
0
I-210 Corridor System Management Plan Executive Summary
Page 14 of 39
Reliability
Reliability captures the degree of predictability in travel time Reliability focuses on how travel time varies from day to day and reflects the impacts of accidents incidents weather and special events Improving reliability is an important goal for transportation agencies and efforts to accomplish this include incident management traveler information and special event planning
To measure reliability the CSMP used the ldquobuffer indexrdquo which reflects the additional time required (over and beyond the average) to ensure an on-time arrival 95 percent of the time In other words if a person must be on time 95 days out of 100 (or 19 out of 20 workdays per month) then that person must add additional time to their average expected travel time to ensure an on-time arrival That additional time is the buffer time Severe events such as collisions could cause longer travel times but the 95th percentile represents a balance between days with extreme events (eg major accidents) and other more ldquotypicalrdquo travel days
Exhibits ES-12 and ES-13 show the estimated mainline lane travel time variability along I-210 on non-holiday weekdays for 2006 in the eastbound and westbound directions respectively The main report shows the buffer index for the years 2005-2009 for both mainline and HOV lanes but this Executive Summary reports only the data for the year 2006 for mainlines since that year was used as the base year for modeling
The following observations on the reliability results are worth noting
bull In 2006 in the eastbound direction 500 PM had the highest estimated average travel time at approximately 41 minutes and the highest estimated buffer index time of 15 minutes for a buffer index of 33 percent In other words to arrive on time 95 percent of the time a commuter would need to leave for work 56 minutes before the start time to travel the entire length of the I-210 study corridor
bull The westbound direction the 700 AM had the estimated average travel time of 39 minutes in 2006 with a buffer time of 15 minutes for a buffer index of 38 percent
70
65
60
55
50
45
40
35
30
25
20
15
10
5
0
70
65
60
55
50
45
40
35
30
25
20
15
10
5
0
Average Travel Time
Travel Time Variability (95th Percentile)
Travel Time at 60mph
Travel Time at 35mph
TIME OF DAY
Exhibit ES-13 Westbound Mainline Lanes Travel Time Variability (2006)
75
TIME OF DAY
Average Travel Time
Travel Time Variability (95th Percentile)
Travel Time at 60mph
Travel Time at 35mph
Exhibit ES-12 Eastbound Mainline Lanes Travel Time Variability (2006)
75
I-210 Corridor System Management Plan Executive Summary
Page 15 of 39
TR
AV
EL
TIM
E (
MIN
)
00
000
0
10
010
0
TR
AV
EL
TIM
E (
MIN
)
20
020
0
30
030
0
40
040
0
50
050
0
60
060
0
70
070
0
80
080
0
90
090
0
100
01
00
0
110
01
10
0
120
01
20
0
130
01
30
0
140
01
40
0
150
01
50
0
160
01
60
0
170
01
70
0
180
01
80
0
190
01
90
0
200
02
00
0
210
02
10
0
220
02
20
0
230
02
30
0
00
0
00
0
I-210 Corridor System Management Plan Executive Summary
Page 16 of 39
Safety
The adopted performance measures to assess safety involve the number of accidents and the accident rates computed from the Caltrans Traffic Accident Surveillance and Analysis System (TASAS) TASAS is a traffic records system containing an accident database linked to a highway database The highway database contains descriptive elements of highway segments intersections and ramps access control traffic volumes and other data TASAS contains specific data for accidents on State highways Accidents on non-State highways are not included (eg local streets and roads)
The safety assessment in this report intends to characterize the overall accident history and trends in the corridor and to highlight notable accident concentration locations or patterns that are readily apparent This report does not intend to supplant more detailed safety investigations routinely performed by Caltrans staff
Exhibits ES-14 and ES-15 show the I-210 total number of eastbound and westbound accidents by month respectively For the accident analysis the corridor is split in half the ldquoless urbanrdquo western half of the corridor from I-5 (postmile 0) in Sylmar to SR-134 in Pasadena (postmile R2200) and the ldquomore urbanrdquo eastern half from SR-134 to SR-57 (postmile R45) in San Dimas The latest available TASAS data from PeMS is to December 30 2008 Accidents are reported for the study corridor and not separated by mainline and HOV facility The exhibits summarize the latest available three-year data from January 1 2006 through December 31 2008
Both the eastbound and westbound directions have similar accident profiles with the more urbanized eastern half of the corridor (postmile R22 to R45) experiencing nearly 45 times as many accidents as the western half (PM 0 to R22) The eastbound (Exhibit ES-13) direction has around 79 accidents on average per month in the more-urbanized section and just fewer than 18 accidents in the less-urbanized section
The westbound direction has just fewer than 78 accidents on average per month in the more-urbanized section and just fewer than 18 in the less-urbanized section This is very similar to the eastbound direction
Nu
mb
er
of
Ac
cid
en
ts
Nu
mb
er
of
Accid
en
ts
I-210 Corridor System Management Plan Executive Summary
Page 17 of 39
Exhibit ES-14 Eastbound I-210 Monthly Collisions (2004-2008) 120
110
100
90
80
70
60
50
40
30
20
10
0
Jan
Feb
Mar
Ap
rM
ay
Ju
nJu
lA
ug
Sep
Oct
No
vD
ec
Jan
Feb
Mar
Ap
rM
ay
Ju
nJu
lA
ug
Sep
Oct
No
vD
ec
Jan
Feb
Mar
Ap
rM
ay
Ju
nJu
lA
ug
Sep
Oct
No
vD
ec
Jan
Feb
Mar
Ap
rM
ay
Ju
nJu
lA
ug
Sep
Oct
No
vD
ec
Jan
Feb
Mar
Ap
rM
ay
Ju
nJu
lA
ug
Sep
Oct
No
vD
ec
2004 2005 2006 2007 2008
Less Urbanized Western Section (I-5 to SR-134)
More Urbanized Eastern Section (SR-134 to SR-57)
110
100
90
80
70
60
50
40
30
20
10
0
Exhibit ES-15 Westbound I-210 Monthly Collisions (2004-2008) 120
Jan
Feb
Mar
Ap
rM
ay
Ju
nJu
lA
ug
Sep
Oct
No
vD
ec
Jan
Feb
Mar
Ap
rM
ay
Ju
nJu
lA
ug
Sep
Oct
No
vD
ec
Jan
Feb
Mar
Ap
rM
ay
Ju
nJu
lA
ug
Sep
Oct
No
vD
ec
Jan
Feb
Mar
Ap
rM
ay
Ju
nJu
lA
ug
Sep
Oct
No
vD
ec
Jan
Feb
Mar
Ap
rM
ay
Ju
nJu
lA
ug
Sep
Oct
No
vD
ec
2004 2005 2006 2007 2008
Less Urbanized Western Section (I-5 to SR-134)
More Urbanized Eastern Section (SR-134 to SR-57)
I-210 Corridor System Management Plan Executive Summary
Page 18 of 39
Productivity
Productivity is a system efficiency measure used to analyze the throughput of the corridor during congested conditions Restoring lost productivity is one focus area of CSMPs
Exhibit ES-16 illustrates how congestion leads to lost productivity The exhibit uses observed I-210 data from sensors for a typical spring 2010 afternoon peak period (Thursday May 6 2010) It shows speeds (red line) and flow rates (blue line) on eastbound I-210 at Huntington Drive one of the most congested locations on the corridor
Flow rates (measured as vehicle-per-hour-per-lane or ldquovphplrdquo) at Huntington Drive averaged around 1800 vphpl between 200 PM and 300 PM Once volumes approach a maximum flow rate of around 2000 vphl traffic becomes unstable Any additional merging or weaving traffic breaks down and speeds can rapidly plummet to below 35 mph In essence every incremental merge takes up two spots on the freeway for a short time However since the volume is close to the capacity these merges lead to queues Moreover rather than accommodating the same number of vehicles flow rates also drop and vehicles back up creating bottlenecks and associated congestion
At the location shown in Exhibit ES-16 throughput drops by over 30 percent on average during the peak period (from over 1800 to around 1200 vphpl) This five-lane road therefore operates as if lost 30 percent capacity when demand is at its highest Stated differently just when the corridor needed the most capacity it performed in the least productive manner and effectively lost lanes This loss in throughput can be aggregated and presented as ldquoEquivalent Lost-Lane-Milesrdquo
I-210 Corridor System Management Plan Executive Summary
Page 19 of 39
Exhibit ES-16 Lost Productivity Illustrated
70 2000
65
60 1750
50
55 1500
SP
EE
D
45 1250
40
35 1000
30 Speed lt35mph
750 25
20 500 I-210 EB
15 Los Angeles County Huntington
10 PM=3338 250
May 6 2010 5 VDS ID 761141
0 -
FL
OW
RA
TE
(VP
HP
L)
140
0
143
0
150
0
153
0
160
0
163
0
170
0
173
0
180
0
183
0
190
0
193
0
TIME The estimated average non-holiday weekday lost lane-miles by period and year on Ishy210 are shown Exhibits ES-17 (mainline) and ES-18 (HOV) A few notes on these two exhibits
diams The trends in the productivity losses are comparable to the delay trends The largest productivity losses occurred in the eastbound direction during the PM peak hours which is the direction and time period that experienced the most congestion
diams On the mainline facility the westbound direction experienced nearly as high productivity loses during the AM peak period
diams On the HOV lanes a greater productivity loss in the eastbound peak period is more evident
Operational strategies are critical to recovering such productivity losses These strategies include building new or extending auxiliary lanes developing more aggressive ramp metering strategies without negatively influencing the arterial network and improving incident clearance times
I-210 Corridor System Management Plan Executive Summary
Page 20 of 39
Exhibit ES-17 Mainline Daily Equivalent Lost Lane-Miles by Direction and Period (2005-09)
-
10
20
30
40
50
60
70
80
90
100
110
120
130
140
150
160
2005 2006 2007 2008 2009 2005 2006 2007 2008 2009 2005 2006 2007 2008 2009 2005 2006 2007 2008 2009
Eastbound
Westbound
AM PM Midday Night Time Period and Year
Daily
Eq
uiv
ale
nt
Lost
Lan
e-M
iles
Exhibit ES-18 HOV Daily Equivalent Lost Lane-Miles by Direction and Period (2005-09)
-
10
20
30
40
2005 2006 2007 2008 2009 2005 2006 2007 2008 2009 2005 2006 2007 2008 2009 2005 2006 2007 2008 2009
Eastbound
Westbound
AM Midday PM Night
Daily
Eq
uiv
ale
nt
Lost
Lan
e-M
iles
Time Period and Year
I-210 Corridor System Management Plan Executive Summary
Page 21 of 39
BOTTLENECK IDENTIFICATION AND CAUSALITY ANALYSIS
Exhibits ES-19 and ES-20 summarize the eastbound and westbound bottleneck locations the time period that each bottleneck is generally active and the causes of the each bottleneck Exhibits ES-21 and ES-22 are maps of the corridor showing these bottleneck locations for the AM and PM peak periods respectively
Major bottlenecks are the primary cause of congestion and lost productivity By definition a bottleneck is a condition where traffic demand exceeds the effective carrying capacity of the roadway In most cases the cause of a bottleneck is related to a sudden reduction in capacity such as a lane drop merging and weaving driver distractions a surge in demand or a combination of factors
The specific location and causality of each major I-210 bottleneck was verified by multiple field observations on separate weekdays throughout the summer fall and winter of 2009 Some bottleneck locations were videotaped to validate bottlenecks and to assist in micro-simulation model calibration
The detailed final report explains in detail the process and results of the bottleneck identification and causality analysis
I-210 Corridor System Management Plan Executive Summary
Page 22 of 39
Exhibit ES-19 I-210 Eastbound Bottleneck Locations
Abs CA Bottleneck
Location
Active
Period Causality Summary
AM PM
250 R250 Fair Oaks Heavy ramp merge
265 R265 Lake On-ramp Heavy ramp merge
286 R287 San Gabriel On-ramp Heavy ramp merge roadway curves
294 R294 Rosemead On-ramp Heavy consecutive ramp merge
330 R327 Huntington Interchange Heavy ramp merge roadway curves
366 R363 I-605 On-ramp traffic weaving with the off-ramp
400 R397 Azusa On-ramp Heavy ramp merge
408 R406 Citrus On-ramp Heavy ramp merge
450 R450 SR-57 On-ramp Heavy ramp merge and lane drop
Exhibit ES-20 I-210 Westbound Bottleneck Locations
Abs CA
Bottleneck
Location
Active
Period Causality Summary
AM PM
401 R398 Azusa On-ramp Consecutive ramp merge curves
368 R365 I-605 Off-ramp Consecutive ramp merge weaving
322 R319 Santa Anita On-ramp Heavy ramp merge roadway curves
307 R304 Baldwin On-ramp Heavy consecutive ramp merge
297 L297 Rosemead On-ramp Three consecutive ramp merges weaving
280 R281 Altadena On-ramp Heavy ramp merge
261 R261 Lake On-ramp Heavy ramp merge
Bottleneck Locations
reg --Bottleneck
Westbound
Eastbound
0 1 2
I bull I I I bull I I I Miles
HJOUAIIO fl _
I-210 Corridor System Management Plan Executive Summary
Page 23 of 39
Exhibit ES-21 I-210 Map of AM Bottleneck Locations
Bottleneck Locations
reg Bottleneck - Westbound - Eastbound
N 0 1 2
bull I I II II II I ll) Mles s
HJOUAIIO fl _
I-210 Corridor System Management Plan Executive Summary
Page 24 of 39
Exhibit ES-22 I-210 Map of PM Bottleneck Locations
I-210 Corridor System Management Plan Executive Summary
Page 25 of 39
SCENARIO DEVELOPMENT AND ANALYSIS
Fully understanding how a corridor performs and why it performs the way it does sets the foundation for evaluating potential solutions Several steps were required to develop and evaluate improvements including
diams Developing traffic models for 2006 base year and 2020 long-term demand diams Combining projects in a logical manner for modeling and testing diams Evaluating model outputs and summarizing results diams Conducting a benefit-cost assessment of scenarios
Traffic Model Development
The study team developed a traffic model using the VISSIM micro-simulation software It is important to note that micro-simulation models are complex to develop and calibrate for a large urban corridor However it is one of the only tools capable of providing a reasonable approximation of bottleneck formation and queue development Therefore such tools help quantify the impacts of operational strategies which traditional travel demand models cannot
The model was calibrated against 2006 conditions This was a resource intensive effort requiring several iterations of submittals and review cycles until the model reasonably matched bottleneck locations and relative severity Once calibration was approved a 2020 model was also developed based on SCAGrsquos travel demand model demand projections
These two models were used to evaluate different scenarios (combinations of projects) to quantify the associated congestion relief benefits and to compare total project costs against their benefits
Exhibit ES-23 depicts the network included in the model There were no parallel arterials modeled with the exception of arterials at interchanges All freeway interchanges were included as well as on-ramps and off-ramps
I-210 Corridor System Management Plan Executive Summary
Page 26 of 39
Exhibit ES-23 Micro-Simulation Model Network
I-210 Corridor System Management Plan Executive Summary
Page 27 of 39
Scenario Development Framework
The study team developed a framework for combining projects into scenarios It would be desirable to evaluate every possible combination of projects However this would have entailed thousands of model runs Instead the team combined projects based on a number of factors including
diams Projects that were fully constructed and completed from 2006 to 2010 were tested with both the 2006 and 2020 models
diams Short- and mid- term operational projects were grouped into scenarios and tested with the both the 2006 and 2020 models
diams Longer-range projects to be delivered by 2020 and beyond were used to develop scenarios to be tested with the 2020 model only
diams Alternative ramp closures were grouped into isolated scenarios (future scenarios did not build on top of these) and tested with both the 2006 and 2020 models
The study assumes that projects delivered before 2016 could reasonably be evaluated using the 2006 base year model The 2020 forecast year for the I-210 study was consistent with the SCAG 2020 regional travel demand model origin-destination matrices used to develop the 2008 Regional Transportation Plan (RTP) When SCAG updates its travel demand model and Regional Transportation Plan (RTP) it may wish to update the micro-simulation model with revised demand projections
Project lists used to develop scenarios were part from the Regional Transportation Improvement Program (RTIP) the RTP and other sources such as special studies Projects that do not directly affect mobility were eliminated For instance sound wall landscaping or minor arterial improvement projects were not evaluated since microshysimulation models cannot evaluate them
Scenario testing performed for the performed for the I-210 CSMP differed from traditional ldquoalternatives evaluationsrdquo done for Major Investment Studies (MIS) or Environmental Impact Reports (EIRs) An MIS or EIR focuses on identifying alternative solutions to address current or projected corridor problems so each alternative is evaluated separately and results among competing alternatives are compared resulting in a locally preferred alternative In contrast for the I-210 CSMP scenarios build on each other in that a scenario contains the projects from the previous scenario plus one or more projects as long as the incremental scenario results showed an acceptable level of performance improvement This incremental scenario evaluation approach is important since CSMPs are new and are often compared with alternatives studies
Exhibit ES-24 summarizes the approach used and scenarios tested and provides a
I-210 Corridor System Management Plan Executive Summary
Page 28 of 39
general description of the projects included in the 2006 and 2020 micro-simulation runs Most projects were tested for both the short- and long-term timeframes Each scenario tested was built upon prior scenarios except for Scenarios 7 and 8 which were ldquostand alonerdquo scenarios used to test alternative ramp closures Later scenarios build on Scenarios 5 and 6 and do not include the improvements tested in Scenarios 7 and 8 Enhanced incident management was tested in Scenarios 11 and 12 by comparing a simulated incident without and with enhanced incident management system Scenarios 13 and 14 are expected for the longer term and were tested only with the 2020 model
Exhibit ES-24 Micro-Simulation Modeling Approach
Short-Term Scenarios Long-Term Scenarios
Calibrated 2006 Base Case
Scenario 1 Expand Ramp-
Metering
Scenario 3 Scenario 1 +
Adv Ramp-Meter w
Queue Control
Scenario 5 Scenario 3 + aux lane striping and
ramp improvements
2020 Horizon Year
2006 Network 2020 OD Matrices
Scenario 7 Scenario 5 +
Ramp Closures
Scenario 2 Expand Ramp-
Metering
Scenario 4 Scenario 2 +
Adv Ramp-Meter w
Queue Control
Scenario 6 Scenario 4 + aux lane striping and
ramp improvements
Scenario 8 Scenario 6 +
Ramp Closures
Scenario 14 Scenario 13 + Lake
Ave Drop Ramp
Lane Addition
Scenario 9 Scenario 5+
On-Ramp amp Aux
lane improvements
Scenario 10 Scenario 6 +
On-Ramp amp Aux
lane improvements
Scenario 11 Incident with No
Incident
Management
Scenario 12 Incident With
Incident
Management
Scenario 13 Scenario 10 +
134210 IC
modification
Incident Management Scenarios
I-210 Corridor System Management Plan Executive Summary
Page 29 of 39
Scenario Evaluation Results
Exhibits ES-25 and ES-26 show the delay results for all the 2006 scenarios evaluated for the AM and PM peak periods respectively Exhibits ES-27 and ES-28 show the delay results for all the 2020 scenarios evaluated for the AM and PM peak periods respectively For each scenario the modeling team produced results by facility type (ie mainline HOV arterials and ramps) and vehicle type (SOV HOV trucks) as well as speed contour diagrams (discussed in more detail in the full technical CSMP) The study team scrutinized to ensure that they were consistent with general traffic engineering principles The following summarizes the findings related to the four exhibits
Exhibit ES-25 2006 AM Peak Micro-Simulation Delay Results by Scenario
De
lay
(Pe
ak
Pe
rio
d V
eh
icle
-Ho
urs
)
2006 Base Year S1 S3 S5 S7 S9 Scenario
18000
16000
14000
12000
10000
8000
6000
4000
2000
-
S1 Expand Ramp Metering
S3 Adv Ramp Metering
S5 Aux Lane Striping Ramp Improvs
S7 Ramp Closures
S9 On-Ramp amp Aux Lane Improvs
-2 -3 -3
-16 -20
HOV WB I-210 WB
HOV EB I-210 EB
Ramps Arterials
I-210 Corridor System Management Plan Executive Summary
Page 30 of 39
Exhibit ES-26 2006 PM Peak Micro-Simulation Delay Results by Scenario
18000
De
lay
(Pe
ak
Pe
rio
d V
eh
icle
-Ho
urs
)
16000
14000
12000
10000
8000
6000
4000
2000
-
S1 Expand Ramp Metering
S3 Adv Ramp Metering
HOV WB
I-210 WB
S5 Aux Lane Striping Ramp Improvs
S7 Ramp Closures
S9 On-Ramp amp Aux Lane Improvs
HOV EB
I-210 EB
Ramps
Arterials
-17
-11
-18
-18 -28
2006 Base Year S1 S3 S5 S7 S9 Scenario
Exhibit ES-27 2020 AM Peak Micro-Simulation Delay Results by Scenario
30000
De
lay
(Pe
ak
Pe
rio
d V
eh
icle
-Ho
urs
)
25000
20000
15000
10000
5000
S2 Expand Ramp Metering
S4 Adv Ramp Metering
S6 Aux Lane Striping Ramp Improvs
S8 Ramp Closures
HOV WB
I-210 WB
HOV EB
-8
-2 -8
-13 -12
S10 On-Ramp amp Aux Lane Improvs
S13 SR-134I-210 IC Modification
S14 Lake Ave Drop Ramp Lane Addition
I-210 EB
Ramps
Arterials
-11
-23
-
2020 S2 S4 S6 S8 S10 S13 S14 Horizon Scenario
I-210 Corridor System Management Plan Executive Summary
Page 31 of 39
Exhibit ES-28 2020 PM Peak Micro-Simulation Delay Results by Scenario D
ela
y(P
ea
k P
eri
od
Ve
hic
le-H
ou
rs)
30000
25000
20000
15000
10000
5000
-
S2 Expand Ramp Metering
S4 Adv Ramp Metering
S6 Aux Lane Striping Ramp Improvs
S8 Ramp Closures
HOV WB
I-210 WB
HOV EB
-14
S10 On-Ramp amp Aux Lane Improvs
S13 SR-134I-210 IC Modification
S14 Lake Ave Drop Ramp Lane Addition
I-210 EB
Ramps
Arterials
-2 -5 -3 -28
-3 -19
2020 S2 S4 S6 S8 S10 S13 S14 Horizon Scenario
Base Year and Do Minimum Horizon Year
Absent any physical improvements the modeling team estimates that by 2020 total delay (mainline HOV ramps and arterials) would double compared to 2006 (from a total of around 22000 vehicle-hours daily to just fewer than 45000 vehicle-hours) in the combined AM and PM peak
Scenarios 1 and 2 (Expand Ramp Metering)
Scenarios 1 and 2 test the only project on the corridor that was fully constructed and completed The project installed new connector metering at the SR-57 and I-605 to Ishy210 freeway connector ramps The project also widened various ramps removed various HOV meter bypasses and upgraded the ramp metering system
The 2006 model estimates that Scenario 1 would reduce delay on the corridor by around 17 percent (or 1600 daily vehicle-hours) in the PM peak period but only around two percent (or 200 vehicle-hours) in the AM peak period The biggest benefits occur in the PM eastbound direction from Rosemead On-Ramp to Huntington interchange (with a delay reduction of over 1000 vehicle-hours) as well as from I-605 to the Azusa On-Ramp (delay reduction of 500 vehicle-hours) for single occupant vehicles The
I-210 Corridor System Management Plan Executive Summary
Page 32 of 39
westbound reductions in freeway delay are largely offset by increased on-ramp delay mostly from new connector metering at SR-57 and I-605
The 2020 model estimates that Scenario 2 will reduce delay by around 8 percent in the AM peak and 14 percent in the PM peak for a combined total reduction of 5000 daily vehicle-hours The long-term improvements are less than the short-term improvements due to the increase in demand
Scenarios 3 and 4 (Advanced Ramp Metering)
Scenarios 3 and 4 build on Scenarios 1 and 2 by adding advanced ramp metering system such as dynamic or adaptive ramp metering system
The 2006 model shows that Scenario 3 would reduce delay by an additional 850 daily vehicle-hours (or 11 percent) in the PM peak with a marginal reduction in the AM peak period However in conjunction with Scenario 1 Scenario 3 reduces delay in total by over 600 vehicle-hours in the AM peak These results suggest that queue control provides additional benefits beyond SWARM
The 2020 model estimates that Scenario 4 will modestly reduce delay by about 2 percent in both the AM and PM peaks or a combined total of 800 daily vehicle-hours Again the benefits are lower in percentage terms due to the increase in demand
Note that there are various types of advanced ramp metering systems deployed around the world including System-wide Adaptive Ramp Metering System or SWARM tested recently in Los Angeles I-210 freeway corridor For the I-210 model the Asservissement Lineaire drsquoEntreacutee Autoroutiere (ALINEA system) was tested as proxy for any advanced ramp metering system as its algorithm for the model was readily available It is not necessarily recommended that ALINEA be deployed but rather some type of advanced ramp metering system that would produce similar if not better results
Scenarios 5 and 6 (Auxiliary Lane Striping Ramp Improvements)
Scenarios 5 and 6 build on Scenarios 3 and 4 that include several relatively lower-cost operational improvements that could be implemented by 2015
diams Building a westbound auxiliary lane from Santa Anita to Baldwin and an eastbound auxiliary lane from Santa Anita to Huntington
diams Extending a lane to Lincoln on the westbound I-210 connector
diams Connecting and converging the Altadena on-ramps into a single on-ramp
I-210 Corridor System Management Plan Executive Summary
Page 33 of 39
diams Connecting and converging the Santa Anita on-ramps into a single on-ramp
diams Connecting and converging the Irwindale on-ramps into a single on-ramp
diams Restriping to add a lane in the eastbound direction from San Dimas to Fruit
The 2006 model shows that Scenario 5 reduces delay by 3 percent (nearly 400 vehicleshyhours) in the AM peak and 18 percent (1200 vehicle-hours) in the PM peak The segment that experienced the largest improvement in the eastbound during the PM peak was from Rosemead to Huntington This segment experienced a 45 percent improvement in delay (from 2700 vehicle-hours to 1500 vehicle-hours) which is likely attributed to the eastbound auxiliary lane from Santa Anita to Huntington In the westbound direction the auxiliary lane from Santa Anita to Baldwin shifts some traffic downstream to cause increased congestion at Michillinda (ie bottleneck shift) during the westbound AM peak However the auxiliary lane helps reduce both queue length and queue duration for the Santa Anita bottleneck
The 2020 model estimates that Scenario 6 would reduce delay by 8 percent in the AM peak and 5 percent in the PM peak for a total reduction of 2500 daily vehicle-hours A reduction in PM delay is expected to occur mostly in the westbound direction
Scenarios 7 and 8 (Ramp Closures)
Scenarios 7 and 8 build on Scenarios 5 and 6 and test the closure of several ramps
diams Eastbound Marengo on-ramp and westbound Lake on-ramp with signalization of the eastbound I-210 off-ramp at Maple and improvement to alternate routes along Corson and Maple
diams Eastbound Mount Olive ramps
Note that subsequent scenarios are not built on top of these scenarios as these are isolated to test ramp closure alternatives
The 2006 model shows that Scenario 7 would reduce delay significantly by 16 percent in the AM peak and 18 percent in the PM peak for a total delay reduction of nearly 3000 daily vehicle-hours The delay reductions are significant on the mainline during the peak direction of travel ndash 1400 vehicle-hours in the westbound AM and 912 vehicleshyhours in the eastbound PM In the westbound direction and AM peak period the segment from Altadena to Lake experienced over an 85 percent decrease in congestion (from 860 to 120 vehicle-hours of delay) This is likely attributed to the closure of the westbound Lake on-ramp In the eastbound direction and PM peak period the segment from Huntington to I-605 experienced a delay reduction of over 70 percent (from 2200
I-210 Corridor System Management Plan Executive Summary
Page 34 of 39
vehicle-hours to 600 vehicle-hours) which is likely attributed to the closure of the Mount Olive ramp
The 2020 model also shows that Scenario 8 improved delay by 12 percent in the AM and 3 percent in the PM for a total delay reduction of almost 3000 daily vehicle-hours On the mainline facility delay also improved for each peak direction of travel ndash by 1600 daily vehicle-hours in the westbound AM and by 750 vehicle-hours in the eastbound PM Delay reductions in the non-peak direction were not as significant
Scenarios 9 and 10 (On-ramp and Aux Lane Improvements)
Scenarios 9 and 10 build on Scenarios 5 and 6 and test four operational improvements that can be implemented in the short to medium range
diams Modify the RosemeadMichillinda interchange and converge the westbound I-210 on-ramps
diams Modify the northside of the Baldwin interchange and eliminate the collectorshydistributor
diams Construct an eastbound auxiliary lane from Azusa to Citrus
diams Converge the eastbound Citrus on-ramps and add an auxiliary lane to Grand
The 2006 model estimates that Scenario 9 will reduce delay by 20 percent (or 2400 daily vehicle-hours) in the AM peak and 28 percent (or 1600 daily vehicle-hours) in the PM peak compared to Scenario 5 In both AM and PM peak period the eastbound direction experienced the largest reduction in delay
The 2020 model estimates that Scenario 10 will reduce delay by 13 percent (or 2500 vehicle-hours) in the AM peak and 28 percent in the PM peak (or 4800 vehicle-hours) compared to Scenario 6 Similar to the 2006 model the 2020 model shows that these improvements produced a greater reduction in delay in the eastbound direction than the westbound direction
Scenarios 11 and 12 (Enhanced Incident Management)
Two incident scenarios were tested on top of Scenario 10 to evaluate the non-recurrent delay reductions resulting from enhanced incident management strategies An enhanced incident management system would entail upgrading or enhancing the current Caltrans incident management system that includes deployment of intelligent transportation system (ITS) field devices central controlcommunications software communications medium (ie fiber optic lines) advanced traveler information system
I-210 Corridor System Management Plan Executive Summary
Page 35 of 39
andor freeway service patrol (FSP) program to reduce incident detection verification response and clearance times
In the first scenario Scenario 11 one collision incident with one lane closure was simulated in the westbound direction in the AM peak period model and one in the eastbound direction in the PM peak period model The incident simulation location and duration were selected based on review of the 2010 actual incident data at one of the high frequency locations The following are the Scenario details
diams Westbound AM peak period starting at 800 AM close mainline lane 2 for 40 minutes at absolute post mile 2612 (at Lake Avenue)
diams Eastbound PM peak period starting at 500 PM close mainline lane 2 for 50 minutes at absolute post mile 3207 (west of Santa Anita)
In the second scenario Scenario 12 the same collision incidents were simulated with a reduction in duration by 10 minutes in the westbound direction and by 12 minutes in the eastbound direction It is estimated based on actual incident management data analysis results provided by Caltrans that an enhanced incident management system could reduce a 35-minute incident by about 10 minutes This scenario represents a typical moderate level incident at one location during the peak period direction Data suggest that incidents vary significantly in terms of impact and duration Some incidents last hundreds of minutes some close multiple lanes and some occur at multiple locations simultaneously There are also numerous minor incidents lasting only a few minutes without lane closures that can result in congestion Many other incidents also occur during off-peak hours
Without enhanced incident management Scenario 11 produced an 8 percent increase in congestion in both peak periods over Scenario 10 an increase of over 2300 hours of vehicle delay With enhanced incident management Scenario 12 evaluation resulted in delay decrease by 2 percent in the AM peak and 3 percent in the PM peak against Scenario 11 results a reduction of nearly 750 vehicle-hours for improving the incident detection verification response and clearance time of one moderate level incident for both of the peak hours
Scenario 13 (SR-134I-210 Interchange Modification)
Scenario 13 tests an improvement to modify the SR-134I-210 interchange to provide a direct connection for vehicles to continue on I-210 with three lanes in each direction This improvement was tested with the 2020 model since it is not likely to be implemented in the short-term
I-210 Corridor System Management Plan Executive Summary
Page 36 of 39
The 2020 model estimates that delay would be reduced by 11 percent (or 1800 daily vehicle-hours) in the AM and 3 percent in the PM (320 daily vehicle-hours) compared to Scenario 10 The westbound mainline experienced the greatest reduction in delay in the AM peak from 9600 vehicle-hours to 8600 vehicle hours after the interchange modification
Scenario 14 (Westbound Drop Ramp and Eastbound Widening)
Scenario 14 builds on Scenario 13 and tests Lake Avenue drop ramp to westbound Ishy210 center lanes (one HOV lane and one mainline) and eastbound I-210 widening from Myrtle to I-605 This improvement was tested with the 2020 model
The 2020 model estimates that delay would be reduced by about 20 percent in the AM or 3400 vehicle-hours and 20 percent in the PM or 2300 vehicle-hours compared to Scenario 13 The mobility improvements are significant with the westbound drop ramp that reduces weaving between SR-134 and SR-210 destined traffic and with the eastbound capacity addition to I-605 off that moves the off-ramp traffic away from the mainline and provides more room for the mainline through traffic
Post Scenario 14 Conditions
By 2020 with the inclusion of all the projects tested the model reveals some residual congestion that remains to address with future improvements According to the model results the total remaining delay on the corridor is around 21000 daily vehicle-hours
Benefit-Cost Analysis
Following an in-depth review of model results by the study team and the SCAG technical committee the study team performed a benefit-cost analysis (BCA) for each scenario
Using the California Benefit-Cost Model (Cal-BC) developed on behalf of Caltrans by the study team benefits in three key areas were estimated travel time savings vehicle operating cost savings and emission reduction savings The benefits generated from this exercise are based solely on congestion relief related benefits However these results are conservative since there are other benefits not captured by this analysis including benefits from deploying bus rapid transit which will achieve other accessibility benefits
Project costs were developed from SCAG and Caltrans project planning and programming documents These costs include construction and support costs in current dollars The study team estimated costs for projects that did not have cost
I-210 Corridor System Management Plan Executive Summary
Page 37 of 39
estimates by reviewing similar completed projects A BC greater than one means that a scenarios projects return greater benefits than it costs to construct or implement It is important to consider the total benefits that a project brings For example a large capital expansion project can cost a great deal and have a low BC ratio but brings much higher absolute benefits to the I-210 users Exhibit ES-29 shows the benefit to cost ranges classified from low (with a BC of one to two) to very high (with a BC of over 10)
The benefit-cost results for the South Corridor scenarios are shown in Exhibit ES-29
Exhibit ES-29 I-210 Scenario BenefitCost (BC) Results
Scenario Scenario Description
BenefitCost Ranges
Low Medium Medium-High High Very High
lt1 1 to 2 2 to 5 5 to 10 gt10
12 Expand Ramp Metering 34 Advanced Ramp Metering 56 Aux Lane Striping Ramp Improvs 78 Ramp Closures
910 On-Ramp amp Aux Lane Improvs 13 SR-134I-210 IC Modification
The benefit-cost findings for each scenario are as follows
diams Scenarios 1 and 2 (ramp metering expansion) shows a high benefit-cost ratio of over ten The relatively high benefit-cost ratio is due to the low cost of expanding ramp metering ($235 million)
diams Scenarios 3 and 4 (advanced ramp metering) resulted in an incremental benefitshycost ratio of over ten This is relatively high as compared to that of typical transportation management system project
diams Scenarios 5 and 6 (operational improvements) produced a benefit-cost ratio of over five This is relatively consistent with other typical operational improvement projects The benefits are substantial At estimated total cost of about $44 million these projects produced benefits of over $233 million
diams Scenarios 7 and 8 tested the ramp closures at eastbound Marengo westbound Lake and eastbound Mount Olive These ramp closured produced an extremely high incremental benefit-cost ratio of over ten due to the relatively very low cost However this benefit-cost calculation does not account for any potential increase in delay on various local arterials because of detours from the closed ramps
diams Scenarios 9 and 10 also produced a relatively high benefit-cost ratio of over ten The four operational projects in these scenarios are collectively estimated to cost
I-210 Corridor System Management Plan Executive Summary
Page 38 of 39
under $30 million and provide a substantial and optimistic benefit of over $670 million
diams Scenario 13 tested the SR-134I-210 interchange modification This project produced a benefit-cost ratio of between one and two consistent with other typical capital expansion projects This project produced benefits of over $200 million at a rough-estimate cost of about $150 million
diams Scenario 14 tested the westbound center drop ramp from Lake Avenue interchange and eastbound lane addition from Myrtle to I-605 These projects produced a relatively high benefit-cost ratio of about 6 to one as compared to other capital improvement projects These two capital projects are unique in that they have specific operational improvement element that addresses major bottleneck locations For an estimated total combined cost of about $70 million the projected benefits exceed $420 million
CONCLUSIONS AND RECOMMENDATIONS
This section summarizes the conclusions and recommendations based on the analysis discussed in the previous section It is important to note that many of these conclusions are based primarily on the micro-simulation model results The model was developed based on the best data available at the time The study team reviewed the model results and believe that both the calibrated base year forecast year and scenario results are reasonable However Caltrans should always be cautious to make decisions based on modeling alone especially complex micro-simulation models
Based on the results the study team offers the following conclusions and recommendations
diams The combination of all scenarios significantly reduces overall congestion on the corridor Projected 2020 congestion after implementation of all scenarios is below 2006 levels in both the AM and PM peak period In the AM peak period the model projects total delay in 2020 after delivering all projects to be less than 11700 vehicle-hours compared to the 2006 base year delay of 13000 vehicleshyhours This represents a reduction of over 10 percent In the PM peak period the model projects total delay in 2020 after delivering all projects to be around 9500 hours compared to the 2006 base year delay of almost 9300 vehicle-hours This represents a slight reduction of 2 percent Clearly the scenarios deliver significant mobility benefits to the corridor Despite the growth in demand future 2020 congestion will be less than experienced in 2006
diams The completed ramp metering expansion project is expected to produce substantial mobility benefits of over $400 million Delay has been significantly reduced since 2006
I-210 Corridor System Management Plan Executive Summary
Page 39 of 39
diams Advanced ramp metering could provide additional mobility improvements by significantly reducing congestion and returning over $100 million in benefits
diams Ramp closures at Marengo Lake and Mount Olive as alternatives seem promising by reducing delay up to 3000 vehicle-hours per day and providing substantial benefits of $280 million at an extremely low cost
diams Operational improvements such as auxiliary lanes and ramp improvements could leverage on the ramp metering projects by making the corridor more efficient and productive that could result in additional mobility benefits of over $230 million
diams Additional capital improvements with specific operational elements to address weaving at major bottleneck locations could produce significant mobility benefits of over $420 million
diams Enhanced incident management system associated with Scenarios 11 and 12 to address non-recurrent congestion proved effective with a delay reduction of over 300 vehicle-hours for one modest level incident with a typical duration of 35 minutes reduced to 25 minutes With the I-210 corridor experiencing up to 2400 collisions per year this translates to a total annual delay savings of over 700000 vehicle-hours for the study corridor
diams The benefit-cost ratio of all scenarios combined is about 64 to 1 If all projects were delivered at current cost estimates the public would get over six dollars of benefits for each dollar expended In current dollars costs total to over $17 billion whereas the benefits are estimated to be over $20 billion
diams The projects also alleviate greenhouse gas (GHG) emissions by over 15 million tons over 20 years averaging over a 75000-ton reduction per year The emissions are estimated using data from the California Air Resources Board (CARB) EMFAC model
This is the first generation CSMP for the I-210 corridor It is important to stress that CSMPs should be updated on a regular basis This is particularly important since traffic conditions and patterns can differ from current projections After projects are delivered it is also useful to compare actual results with estimated ones in this document so that models can be further improved as appropriate
CSMPs or a variation thereof should become the normal course of business that is based on detailed performance assessments an in-depth understanding of the reasons for performance deterioration and an analytical framework that allows for evaluating complementary operational strategies that maximize the productivity of the current system

I-210 Corridor System Management Plan Executive Summary
Page 7 of 39
estimate the two mobility measures PeMS collects detector volume and occupancy data on the freeway which were used to estimate speed delay and travel time
Delay
Delay is defined as the observed travel time less the travel time at uncongested conditions and is reported as vehicle-hours of delay The assessment summarized the results for the five-year period between 2005 and 2009 Delays in this report were calculated as the difference in travel time between estimated speeds and free-flow conditions at 60 mph applied to the observed volume Exhibit ES-2 shows the average daily vehicle-hours of delay for each month between 2005 and 2009 for both mainline and high occupancy vehicle (HOV) lanes This exhibit reveals the following trends
diams Prior to 2007 the eastbound and westbound directions experienced similar delay levels on both the mainline and HOV lanes The HOV lanes comprise approximately 15 to 20 percent of the total estimated delay on the corridor
diams Congestion on the westbound mainline lanes experienced extreme peaking ndash likely caused by construction on the corridor between 2007 and 2008 The eastbound lanes did not experience much change in delay in 2007 but declined through 2008 The HOV facility did not experience significant change during this time
diams In 2009 the estimated delay on the eastbound mainline lanes increased dramatically while in contrast the westbound lanes declined sharply The HOV lane showed a similar trend with the eastbound HOV lane exceeding the delay in the westbound direction
I-210 Corridor System Management Plan Executive Summary
Page 8 of 39
Exhibit ES-3 Average Weekday Delay by Month (2005-2009) 16000
Av
era
ge
Da
ily
Ve
hic
le-H
ou
rs o
f D
ela
y (
6
0m
ph
)
15000
14000
13000
12000
11000
10000
9000
8000
7000
6000
5000
4000
3000
2000
1000
-
Ja
nF
eb
Ma
rA
pr
Ma
yJ
un
Ju
lA
ug
Se
pO
ct
No
vD
ec
Ja
nF
eb
Ma
rA
pr
Ma
yJ
un
Ju
lA
ug
Se
pO
ct
No
vD
ec
Ja
nF
eb
Ma
rA
pr
Ma
yJ
un
Ju
lA
ug
Se
pO
ct
No
vD
ec
Ja
nF
eb
Ma
rA
pr
Ma
yJ
un
Ju
lA
ug
Se
pO
ct
No
vD
ec
Ja
nF
eb
Ma
rA
pr
Ma
yJ
un
Ju
lA
ug
Se
pO
ct
No
vD
ec
2005 2006 2007 2008 2009
Eastbound ML
Westbound ML
Eastbound HOV
Westbound HOV
Month
The CSMP separates delay further into two components severe delay and other delay Severe delay is delay that occurs when speeds are below 35 mph and other delay occurs where speeds are between 35 and 60 mph Severe delay represents breakdown conditions ldquoOtherrdquo delay represents conditions approaching or leaving the breakdown congestion or areas that cause temporary slowdowns However it can also be a leading indicator of future severe delay
Exhibits ES-4 (Mainline lanes) and ES-5 (HOV lanes) show average severe and other daily vehicle-hours of delay by day of the week A few notes related to ES-4 and ES-5
diams Severe delay makes up about 70 percent of all weekday delay on the corridor in either the eastbound or the westbound direction Severe delay on Saturdays and SundaysHolidays tend to be under 70 percent while weekday severe delay averages around 75 percent of all delay As in Exhibit ES-3 HOV delays tend to range between 14 and 25 percent of total delay
diams Fridays in the eastbound direction experience the highest delays probably due to weekend travel The second highest delays generally occurred on Thursdays In the westbound direction the day of week trends are typical for urban commute corridors with the midweek days experiencing the highest delays with Monday and Friday showing slightly less congestion and the weekends showing much lower delays than during the week
Av
era
ge D
aily V
eh
icle
-Ho
urs
of
Dela
y (
60
mp
h)
Av
era
ge D
aily V
eh
icle
-Ho
urs
of
Dela
y (
60
mp
h)
I-210 Corridor System Management Plan Executive Summary
Page 9 of 39
Exhibit ES-4 Mainline Lane Delay by Day of Week (2005-2009) 16000
15000
14000
13000
12000
11000
10000
9000
8000
7000
6000
5000
4000
3000
2000
1000
-
Mainline Other Delay
Mainline Severe Delay M
on
T
ue
Wed
T
hu
F
riS
at
Su
n
Ho
lM
on
Tu
eW
ed
Th
uF
riS
at
Su
n
Ho
lM
on
Tu
eW
ed
Th
uF
riS
at
Su
n
Ho
lM
on
Tu
eW
ed
Th
uF
riS
at
Su
n
Ho
lM
on
Tu
eW
ed
Th
uF
riS
at
Su
n
Ho
lM
on
Tu
eW
ed
Th
uF
riS
at
Su
n
Ho
lM
on
Tu
eW
ed
Th
uF
riS
at
Su
n
Ho
lM
on
Tu
eW
ed
Th
uF
riS
at
Su
n
Ho
lM
on
Tu
eW
ed
Th
uF
riS
at
Su
n
Ho
lM
on
Tu
eW
ed
Th
uF
riS
at
Su
n
Ho
l
2005 2006 2007 2008 2009 2005 2006 2007 2008 2009
EASTBOUND WESTBOUND
Exhibit ES-5 HOV Lane Delay by Day of Week (2005-2009) 4000
3500
3000
2500
2000
1500
1000
500
-
Mo
nT
ue
Wed
Th
uF
riS
at
Su
n
Ho
lM
on
Tu
eW
ed
Th
uF
riS
at
Su
n
Ho
lM
on
Tu
eW
ed
Th
uF
riS
at
Su
n
Ho
lM
on
Tu
eW
ed
Th
uF
riS
at
Su
n
Ho
lM
on
Tu
eW
ed
Th
uF
riS
at
Su
n
Ho
lM
on
Tu
eW
ed
Th
uF
riS
at
Su
n
Ho
lM
on
Tu
eW
ed
Th
uF
riS
at
Su
n
Ho
lM
on
Tu
eW
ed
Th
uF
riS
at
Su
n
Ho
lM
on
Tu
eW
ed
Th
uF
riS
at
Su
n
Ho
lM
on
Tu
eW
ed
Th
uF
riS
at
Su
n
Ho
l
2005 2006 2007 2008 2009 2005 2006 2007 2008 2009
EASTBOUND WESTBOUND
Other Delay
Severe Delay
I-210 Corridor System Management Plan Executive Summary
Page 10 of 39
Exhibits ES-6 and ES-7 summarize average annual weekday delay by hour of the day over the five-year period for the mainline northbound and southbound lanes respectively These exhibits allow planners and decision makers to understand the trend in peak period delay spiking and peak period spreading by comparing the intensity and duration of the peak period congestion Note that the HOV lanes are not shown in this summary report since they follow similar peaking trends as the mainline lanes (the main technical report contains the HOV delay by hour results) A few notes on these two exhibits
diams The eastbound direction peaks in the PM peak period while the AM is the westbound peak AM peak hour is 700 AM while the PM peak period is 500 PM
diams In the eastbound PM direction congestion grew dramatically in 2009 while westbound AM congestion declined This is also evident in Exhibit ES-2 Eastbound delay between 2005 and 2008 remained relatively constant at about 1750 vehicle-hours during the 500 PM peak hour before increasing in 2009 to about 2100 vehicle-hours
diams Westbound AM congestion declined in 2009 after two years of dramatic growth between 2007 and 2008 In 2009 the AM peak period also shrank by approximately one-half hour and started at approximately 530 AM whereas from 2005 to 2008 the peak period started around 500 AM
Exhibit ES-6 Eastbound Mainline Lanes Hourly Delay (2005-2009)
0
250
500
750
1000
1250
1500
1750
2000
2250
2500
Ave
rag
e D
ail
y V
eh
icle
Ho
urs
of
Dela
y (
60
mp
h) 2009 Weekday
2008 Weekday
2007 Weekday
2006 Weekday
2005 Weekday
00
0
10
0
20
0
30
0
40
0
50
0
60
0
70
0
80
0
90
0
100
0
110
0
120
0
130
0
140
0
150
0
160
0
170
0
180
0
190
0
200
0
210
0
220
0
230
0
Hour of the Day
I-210 Corridor System Management Plan Executive Summary
Page 11 of 39
Exhibit ES-7 Westbound Mainline Lanes Hourly Delay (2005-2009)
0
250
500
750
1000
1250
1500
1750
2000
2250
2500
Ave
rag
e D
ail
y V
eh
icle
Ho
urs
of
Dela
y (
60m
ph
) 2009 Weekday
2008 Weekday
2007 Weekday
2006 Weekday
2005 Weekday
00
0
10
0
20
0
30
0
40
0
50
0
60
0
70
0
80
0
90
0
100
0
110
0
120
0
130
0
140
0
150
0
160
0
170
0
180
0
190
0
200
0
210
0
220
0
230
0
Hour of the Day
Travel Time
The travel time performance measure represents the average time it takes for a vehicle to travel between SR-134 and SR-57 a distance of approximately 20 miles
Exhibits ES-8 and ES-9 summarize mainline estimated average weekday travel times by hour of day for the 2005-2009 five-year period Exhibits ES-10 and ES-11 show the same results for the HOV facility Similar to delay travel times increased in 2009 in the eastbound PM direction and time but decreased in the westbound AM commute period
In the mainline lanes the eastbound PM peak hour (500 PM) travel time grew from 40 minutes in 2008 to 44 minutes in 2009 In the westbound AM peak hour (700 AM) the opposite trend occurred with travel times dropping from a 41 minute average in 2008 to around 36 minutes in 2009
A similar trend occurred for the HOV lanes except that 2005 was the worst year in terms of travel times
Tra
ve
l T
ime
(m
inu
tes
) T
rav
el
Tim
e (
min
ute
s)
45
40
35
30
25
20
15
10
5
0
45
40
35
30
25
20
15
10
5
0
I-210 Corridor System Management Plan Executive Summary
Page 12 of 39
Exhibit ES-8 Eastbound Mainline Lanes Travel Time by Hour (2005-2009) 50
2009 Average Travel Time
2008 Average Travel Time
2007 Average Travel Time
2006 Average Travel Time
2005 Average Travel Time
Travel Time 60mph
Travel Time 35mph
Hour of the Day
00
0
10
0
20
0
30
0
40
0
50
0
60
0
70
0
80
0
90
0
100
0
110
0
120
0
130
0
140
0
150
0
160
0
170
0
180
0
190
0
200
0
210
0
220
0
Hour of the Day
Exhibit ES-9 Westbound Mainline Lanes Travel Time by Hour (2005-2009) 50
2009 Average Travel Time
2008 Average Travel Time
2007 Average Travel Time
2006 Average Travel Time
2005 Average Travel Time
Travel Time 60mph
Travel Time 35mph
00
0
10
0
20
0
30
0
40
0
50
0
60
0
70
0
80
0
90
0
10
00
11
00
12
00
13
00
14
00
15
00
16
00
17
00
18
00
19
00
20
00
21
00
22
00
230
0
23
00
Tra
ve
l T
ime
(m
inu
tes
) T
rav
el
Tim
e (
min
ute
s)
45
40
35
30
25
20
15
10
5
0
45
40
35
30
25
20
15
10
5
0
I-210 Corridor System Management Plan Executive Summary
Page 13 of 39
Exhibit ES-10 Eastbound HOV Lanes Travel Time by Hour (2005-2009) 50
2009 Average Travel Time
2008 Average Travel Time
2007 Average Travel Time
2006 Average Travel Time
2005 Average Travel Time
Travel Time 60mph
Travel Time 35mph
Hour of the Day
00
0
10
0
20
0
30
0
40
0
50
0
60
0
70
0
80
0
90
0
100
0
110
0
120
0
130
0
140
0
150
0
160
0
170
0
180
0
190
0
200
0
210
0
220
0
Hour of the Day
Exhibit ES-11 Westbound HOV Lanes Travel Time by Hour (2005-2009) 50
2009 Average Travel Time
2008 Average Travel Time
2007 Average Travel Time
2006 Average Travel Time
2005 Average Travel Time
Travel Time 60mph
Travel Time 35mph
00
0
10
0
20
0
30
0
40
0
50
0
60
0
70
0
80
0
90
0
100
0
110
0
120
0
130
0
140
0
150
0
160
0
170
0
180
0
190
0
200
0
210
0
220
0
230
0
230
0
I-210 Corridor System Management Plan Executive Summary
Page 14 of 39
Reliability
Reliability captures the degree of predictability in travel time Reliability focuses on how travel time varies from day to day and reflects the impacts of accidents incidents weather and special events Improving reliability is an important goal for transportation agencies and efforts to accomplish this include incident management traveler information and special event planning
To measure reliability the CSMP used the ldquobuffer indexrdquo which reflects the additional time required (over and beyond the average) to ensure an on-time arrival 95 percent of the time In other words if a person must be on time 95 days out of 100 (or 19 out of 20 workdays per month) then that person must add additional time to their average expected travel time to ensure an on-time arrival That additional time is the buffer time Severe events such as collisions could cause longer travel times but the 95th percentile represents a balance between days with extreme events (eg major accidents) and other more ldquotypicalrdquo travel days
Exhibits ES-12 and ES-13 show the estimated mainline lane travel time variability along I-210 on non-holiday weekdays for 2006 in the eastbound and westbound directions respectively The main report shows the buffer index for the years 2005-2009 for both mainline and HOV lanes but this Executive Summary reports only the data for the year 2006 for mainlines since that year was used as the base year for modeling
The following observations on the reliability results are worth noting
bull In 2006 in the eastbound direction 500 PM had the highest estimated average travel time at approximately 41 minutes and the highest estimated buffer index time of 15 minutes for a buffer index of 33 percent In other words to arrive on time 95 percent of the time a commuter would need to leave for work 56 minutes before the start time to travel the entire length of the I-210 study corridor
bull The westbound direction the 700 AM had the estimated average travel time of 39 minutes in 2006 with a buffer time of 15 minutes for a buffer index of 38 percent
70
65
60
55
50
45
40
35
30
25
20
15
10
5
0
70
65
60
55
50
45
40
35
30
25
20
15
10
5
0
Average Travel Time
Travel Time Variability (95th Percentile)
Travel Time at 60mph
Travel Time at 35mph
TIME OF DAY
Exhibit ES-13 Westbound Mainline Lanes Travel Time Variability (2006)
75
TIME OF DAY
Average Travel Time
Travel Time Variability (95th Percentile)
Travel Time at 60mph
Travel Time at 35mph
Exhibit ES-12 Eastbound Mainline Lanes Travel Time Variability (2006)
75
I-210 Corridor System Management Plan Executive Summary
Page 15 of 39
TR
AV
EL
TIM
E (
MIN
)
00
000
0
10
010
0
TR
AV
EL
TIM
E (
MIN
)
20
020
0
30
030
0
40
040
0
50
050
0
60
060
0
70
070
0
80
080
0
90
090
0
100
01
00
0
110
01
10
0
120
01
20
0
130
01
30
0
140
01
40
0
150
01
50
0
160
01
60
0
170
01
70
0
180
01
80
0
190
01
90
0
200
02
00
0
210
02
10
0
220
02
20
0
230
02
30
0
00
0
00
0
I-210 Corridor System Management Plan Executive Summary
Page 16 of 39
Safety
The adopted performance measures to assess safety involve the number of accidents and the accident rates computed from the Caltrans Traffic Accident Surveillance and Analysis System (TASAS) TASAS is a traffic records system containing an accident database linked to a highway database The highway database contains descriptive elements of highway segments intersections and ramps access control traffic volumes and other data TASAS contains specific data for accidents on State highways Accidents on non-State highways are not included (eg local streets and roads)
The safety assessment in this report intends to characterize the overall accident history and trends in the corridor and to highlight notable accident concentration locations or patterns that are readily apparent This report does not intend to supplant more detailed safety investigations routinely performed by Caltrans staff
Exhibits ES-14 and ES-15 show the I-210 total number of eastbound and westbound accidents by month respectively For the accident analysis the corridor is split in half the ldquoless urbanrdquo western half of the corridor from I-5 (postmile 0) in Sylmar to SR-134 in Pasadena (postmile R2200) and the ldquomore urbanrdquo eastern half from SR-134 to SR-57 (postmile R45) in San Dimas The latest available TASAS data from PeMS is to December 30 2008 Accidents are reported for the study corridor and not separated by mainline and HOV facility The exhibits summarize the latest available three-year data from January 1 2006 through December 31 2008
Both the eastbound and westbound directions have similar accident profiles with the more urbanized eastern half of the corridor (postmile R22 to R45) experiencing nearly 45 times as many accidents as the western half (PM 0 to R22) The eastbound (Exhibit ES-13) direction has around 79 accidents on average per month in the more-urbanized section and just fewer than 18 accidents in the less-urbanized section
The westbound direction has just fewer than 78 accidents on average per month in the more-urbanized section and just fewer than 18 in the less-urbanized section This is very similar to the eastbound direction
Nu
mb
er
of
Ac
cid
en
ts
Nu
mb
er
of
Accid
en
ts
I-210 Corridor System Management Plan Executive Summary
Page 17 of 39
Exhibit ES-14 Eastbound I-210 Monthly Collisions (2004-2008) 120
110
100
90
80
70
60
50
40
30
20
10
0
Jan
Feb
Mar
Ap
rM
ay
Ju
nJu
lA
ug
Sep
Oct
No
vD
ec
Jan
Feb
Mar
Ap
rM
ay
Ju
nJu
lA
ug
Sep
Oct
No
vD
ec
Jan
Feb
Mar
Ap
rM
ay
Ju
nJu
lA
ug
Sep
Oct
No
vD
ec
Jan
Feb
Mar
Ap
rM
ay
Ju
nJu
lA
ug
Sep
Oct
No
vD
ec
Jan
Feb
Mar
Ap
rM
ay
Ju
nJu
lA
ug
Sep
Oct
No
vD
ec
2004 2005 2006 2007 2008
Less Urbanized Western Section (I-5 to SR-134)
More Urbanized Eastern Section (SR-134 to SR-57)
110
100
90
80
70
60
50
40
30
20
10
0
Exhibit ES-15 Westbound I-210 Monthly Collisions (2004-2008) 120
Jan
Feb
Mar
Ap
rM
ay
Ju
nJu
lA
ug
Sep
Oct
No
vD
ec
Jan
Feb
Mar
Ap
rM
ay
Ju
nJu
lA
ug
Sep
Oct
No
vD
ec
Jan
Feb
Mar
Ap
rM
ay
Ju
nJu
lA
ug
Sep
Oct
No
vD
ec
Jan
Feb
Mar
Ap
rM
ay
Ju
nJu
lA
ug
Sep
Oct
No
vD
ec
Jan
Feb
Mar
Ap
rM
ay
Ju
nJu
lA
ug
Sep
Oct
No
vD
ec
2004 2005 2006 2007 2008
Less Urbanized Western Section (I-5 to SR-134)
More Urbanized Eastern Section (SR-134 to SR-57)
I-210 Corridor System Management Plan Executive Summary
Page 18 of 39
Productivity
Productivity is a system efficiency measure used to analyze the throughput of the corridor during congested conditions Restoring lost productivity is one focus area of CSMPs
Exhibit ES-16 illustrates how congestion leads to lost productivity The exhibit uses observed I-210 data from sensors for a typical spring 2010 afternoon peak period (Thursday May 6 2010) It shows speeds (red line) and flow rates (blue line) on eastbound I-210 at Huntington Drive one of the most congested locations on the corridor
Flow rates (measured as vehicle-per-hour-per-lane or ldquovphplrdquo) at Huntington Drive averaged around 1800 vphpl between 200 PM and 300 PM Once volumes approach a maximum flow rate of around 2000 vphl traffic becomes unstable Any additional merging or weaving traffic breaks down and speeds can rapidly plummet to below 35 mph In essence every incremental merge takes up two spots on the freeway for a short time However since the volume is close to the capacity these merges lead to queues Moreover rather than accommodating the same number of vehicles flow rates also drop and vehicles back up creating bottlenecks and associated congestion
At the location shown in Exhibit ES-16 throughput drops by over 30 percent on average during the peak period (from over 1800 to around 1200 vphpl) This five-lane road therefore operates as if lost 30 percent capacity when demand is at its highest Stated differently just when the corridor needed the most capacity it performed in the least productive manner and effectively lost lanes This loss in throughput can be aggregated and presented as ldquoEquivalent Lost-Lane-Milesrdquo
I-210 Corridor System Management Plan Executive Summary
Page 19 of 39
Exhibit ES-16 Lost Productivity Illustrated
70 2000
65
60 1750
50
55 1500
SP
EE
D
45 1250
40
35 1000
30 Speed lt35mph
750 25
20 500 I-210 EB
15 Los Angeles County Huntington
10 PM=3338 250
May 6 2010 5 VDS ID 761141
0 -
FL
OW
RA
TE
(VP
HP
L)
140
0
143
0
150
0
153
0
160
0
163
0
170
0
173
0
180
0
183
0
190
0
193
0
TIME The estimated average non-holiday weekday lost lane-miles by period and year on Ishy210 are shown Exhibits ES-17 (mainline) and ES-18 (HOV) A few notes on these two exhibits
diams The trends in the productivity losses are comparable to the delay trends The largest productivity losses occurred in the eastbound direction during the PM peak hours which is the direction and time period that experienced the most congestion
diams On the mainline facility the westbound direction experienced nearly as high productivity loses during the AM peak period
diams On the HOV lanes a greater productivity loss in the eastbound peak period is more evident
Operational strategies are critical to recovering such productivity losses These strategies include building new or extending auxiliary lanes developing more aggressive ramp metering strategies without negatively influencing the arterial network and improving incident clearance times
I-210 Corridor System Management Plan Executive Summary
Page 20 of 39
Exhibit ES-17 Mainline Daily Equivalent Lost Lane-Miles by Direction and Period (2005-09)
-
10
20
30
40
50
60
70
80
90
100
110
120
130
140
150
160
2005 2006 2007 2008 2009 2005 2006 2007 2008 2009 2005 2006 2007 2008 2009 2005 2006 2007 2008 2009
Eastbound
Westbound
AM PM Midday Night Time Period and Year
Daily
Eq
uiv
ale
nt
Lost
Lan
e-M
iles
Exhibit ES-18 HOV Daily Equivalent Lost Lane-Miles by Direction and Period (2005-09)
-
10
20
30
40
2005 2006 2007 2008 2009 2005 2006 2007 2008 2009 2005 2006 2007 2008 2009 2005 2006 2007 2008 2009
Eastbound
Westbound
AM Midday PM Night
Daily
Eq
uiv
ale
nt
Lost
Lan
e-M
iles
Time Period and Year
I-210 Corridor System Management Plan Executive Summary
Page 21 of 39
BOTTLENECK IDENTIFICATION AND CAUSALITY ANALYSIS
Exhibits ES-19 and ES-20 summarize the eastbound and westbound bottleneck locations the time period that each bottleneck is generally active and the causes of the each bottleneck Exhibits ES-21 and ES-22 are maps of the corridor showing these bottleneck locations for the AM and PM peak periods respectively
Major bottlenecks are the primary cause of congestion and lost productivity By definition a bottleneck is a condition where traffic demand exceeds the effective carrying capacity of the roadway In most cases the cause of a bottleneck is related to a sudden reduction in capacity such as a lane drop merging and weaving driver distractions a surge in demand or a combination of factors
The specific location and causality of each major I-210 bottleneck was verified by multiple field observations on separate weekdays throughout the summer fall and winter of 2009 Some bottleneck locations were videotaped to validate bottlenecks and to assist in micro-simulation model calibration
The detailed final report explains in detail the process and results of the bottleneck identification and causality analysis
I-210 Corridor System Management Plan Executive Summary
Page 22 of 39
Exhibit ES-19 I-210 Eastbound Bottleneck Locations
Abs CA Bottleneck
Location
Active
Period Causality Summary
AM PM
250 R250 Fair Oaks Heavy ramp merge
265 R265 Lake On-ramp Heavy ramp merge
286 R287 San Gabriel On-ramp Heavy ramp merge roadway curves
294 R294 Rosemead On-ramp Heavy consecutive ramp merge
330 R327 Huntington Interchange Heavy ramp merge roadway curves
366 R363 I-605 On-ramp traffic weaving with the off-ramp
400 R397 Azusa On-ramp Heavy ramp merge
408 R406 Citrus On-ramp Heavy ramp merge
450 R450 SR-57 On-ramp Heavy ramp merge and lane drop
Exhibit ES-20 I-210 Westbound Bottleneck Locations
Abs CA
Bottleneck
Location
Active
Period Causality Summary
AM PM
401 R398 Azusa On-ramp Consecutive ramp merge curves
368 R365 I-605 Off-ramp Consecutive ramp merge weaving
322 R319 Santa Anita On-ramp Heavy ramp merge roadway curves
307 R304 Baldwin On-ramp Heavy consecutive ramp merge
297 L297 Rosemead On-ramp Three consecutive ramp merges weaving
280 R281 Altadena On-ramp Heavy ramp merge
261 R261 Lake On-ramp Heavy ramp merge
Bottleneck Locations
reg --Bottleneck
Westbound
Eastbound
0 1 2
I bull I I I bull I I I Miles
HJOUAIIO fl _
I-210 Corridor System Management Plan Executive Summary
Page 23 of 39
Exhibit ES-21 I-210 Map of AM Bottleneck Locations
Bottleneck Locations
reg Bottleneck - Westbound - Eastbound
N 0 1 2
bull I I II II II I ll) Mles s
HJOUAIIO fl _
I-210 Corridor System Management Plan Executive Summary
Page 24 of 39
Exhibit ES-22 I-210 Map of PM Bottleneck Locations
I-210 Corridor System Management Plan Executive Summary
Page 25 of 39
SCENARIO DEVELOPMENT AND ANALYSIS
Fully understanding how a corridor performs and why it performs the way it does sets the foundation for evaluating potential solutions Several steps were required to develop and evaluate improvements including
diams Developing traffic models for 2006 base year and 2020 long-term demand diams Combining projects in a logical manner for modeling and testing diams Evaluating model outputs and summarizing results diams Conducting a benefit-cost assessment of scenarios
Traffic Model Development
The study team developed a traffic model using the VISSIM micro-simulation software It is important to note that micro-simulation models are complex to develop and calibrate for a large urban corridor However it is one of the only tools capable of providing a reasonable approximation of bottleneck formation and queue development Therefore such tools help quantify the impacts of operational strategies which traditional travel demand models cannot
The model was calibrated against 2006 conditions This was a resource intensive effort requiring several iterations of submittals and review cycles until the model reasonably matched bottleneck locations and relative severity Once calibration was approved a 2020 model was also developed based on SCAGrsquos travel demand model demand projections
These two models were used to evaluate different scenarios (combinations of projects) to quantify the associated congestion relief benefits and to compare total project costs against their benefits
Exhibit ES-23 depicts the network included in the model There were no parallel arterials modeled with the exception of arterials at interchanges All freeway interchanges were included as well as on-ramps and off-ramps
I-210 Corridor System Management Plan Executive Summary
Page 26 of 39
Exhibit ES-23 Micro-Simulation Model Network
I-210 Corridor System Management Plan Executive Summary
Page 27 of 39
Scenario Development Framework
The study team developed a framework for combining projects into scenarios It would be desirable to evaluate every possible combination of projects However this would have entailed thousands of model runs Instead the team combined projects based on a number of factors including
diams Projects that were fully constructed and completed from 2006 to 2010 were tested with both the 2006 and 2020 models
diams Short- and mid- term operational projects were grouped into scenarios and tested with the both the 2006 and 2020 models
diams Longer-range projects to be delivered by 2020 and beyond were used to develop scenarios to be tested with the 2020 model only
diams Alternative ramp closures were grouped into isolated scenarios (future scenarios did not build on top of these) and tested with both the 2006 and 2020 models
The study assumes that projects delivered before 2016 could reasonably be evaluated using the 2006 base year model The 2020 forecast year for the I-210 study was consistent with the SCAG 2020 regional travel demand model origin-destination matrices used to develop the 2008 Regional Transportation Plan (RTP) When SCAG updates its travel demand model and Regional Transportation Plan (RTP) it may wish to update the micro-simulation model with revised demand projections
Project lists used to develop scenarios were part from the Regional Transportation Improvement Program (RTIP) the RTP and other sources such as special studies Projects that do not directly affect mobility were eliminated For instance sound wall landscaping or minor arterial improvement projects were not evaluated since microshysimulation models cannot evaluate them
Scenario testing performed for the performed for the I-210 CSMP differed from traditional ldquoalternatives evaluationsrdquo done for Major Investment Studies (MIS) or Environmental Impact Reports (EIRs) An MIS or EIR focuses on identifying alternative solutions to address current or projected corridor problems so each alternative is evaluated separately and results among competing alternatives are compared resulting in a locally preferred alternative In contrast for the I-210 CSMP scenarios build on each other in that a scenario contains the projects from the previous scenario plus one or more projects as long as the incremental scenario results showed an acceptable level of performance improvement This incremental scenario evaluation approach is important since CSMPs are new and are often compared with alternatives studies
Exhibit ES-24 summarizes the approach used and scenarios tested and provides a
I-210 Corridor System Management Plan Executive Summary
Page 28 of 39
general description of the projects included in the 2006 and 2020 micro-simulation runs Most projects were tested for both the short- and long-term timeframes Each scenario tested was built upon prior scenarios except for Scenarios 7 and 8 which were ldquostand alonerdquo scenarios used to test alternative ramp closures Later scenarios build on Scenarios 5 and 6 and do not include the improvements tested in Scenarios 7 and 8 Enhanced incident management was tested in Scenarios 11 and 12 by comparing a simulated incident without and with enhanced incident management system Scenarios 13 and 14 are expected for the longer term and were tested only with the 2020 model
Exhibit ES-24 Micro-Simulation Modeling Approach
Short-Term Scenarios Long-Term Scenarios
Calibrated 2006 Base Case
Scenario 1 Expand Ramp-
Metering
Scenario 3 Scenario 1 +
Adv Ramp-Meter w
Queue Control
Scenario 5 Scenario 3 + aux lane striping and
ramp improvements
2020 Horizon Year
2006 Network 2020 OD Matrices
Scenario 7 Scenario 5 +
Ramp Closures
Scenario 2 Expand Ramp-
Metering
Scenario 4 Scenario 2 +
Adv Ramp-Meter w
Queue Control
Scenario 6 Scenario 4 + aux lane striping and
ramp improvements
Scenario 8 Scenario 6 +
Ramp Closures
Scenario 14 Scenario 13 + Lake
Ave Drop Ramp
Lane Addition
Scenario 9 Scenario 5+
On-Ramp amp Aux
lane improvements
Scenario 10 Scenario 6 +
On-Ramp amp Aux
lane improvements
Scenario 11 Incident with No
Incident
Management
Scenario 12 Incident With
Incident
Management
Scenario 13 Scenario 10 +
134210 IC
modification
Incident Management Scenarios
I-210 Corridor System Management Plan Executive Summary
Page 29 of 39
Scenario Evaluation Results
Exhibits ES-25 and ES-26 show the delay results for all the 2006 scenarios evaluated for the AM and PM peak periods respectively Exhibits ES-27 and ES-28 show the delay results for all the 2020 scenarios evaluated for the AM and PM peak periods respectively For each scenario the modeling team produced results by facility type (ie mainline HOV arterials and ramps) and vehicle type (SOV HOV trucks) as well as speed contour diagrams (discussed in more detail in the full technical CSMP) The study team scrutinized to ensure that they were consistent with general traffic engineering principles The following summarizes the findings related to the four exhibits
Exhibit ES-25 2006 AM Peak Micro-Simulation Delay Results by Scenario
De
lay
(Pe
ak
Pe
rio
d V
eh
icle
-Ho
urs
)
2006 Base Year S1 S3 S5 S7 S9 Scenario
18000
16000
14000
12000
10000
8000
6000
4000
2000
-
S1 Expand Ramp Metering
S3 Adv Ramp Metering
S5 Aux Lane Striping Ramp Improvs
S7 Ramp Closures
S9 On-Ramp amp Aux Lane Improvs
-2 -3 -3
-16 -20
HOV WB I-210 WB
HOV EB I-210 EB
Ramps Arterials
I-210 Corridor System Management Plan Executive Summary
Page 30 of 39
Exhibit ES-26 2006 PM Peak Micro-Simulation Delay Results by Scenario
18000
De
lay
(Pe
ak
Pe
rio
d V
eh
icle
-Ho
urs
)
16000
14000
12000
10000
8000
6000
4000
2000
-
S1 Expand Ramp Metering
S3 Adv Ramp Metering
HOV WB
I-210 WB
S5 Aux Lane Striping Ramp Improvs
S7 Ramp Closures
S9 On-Ramp amp Aux Lane Improvs
HOV EB
I-210 EB
Ramps
Arterials
-17
-11
-18
-18 -28
2006 Base Year S1 S3 S5 S7 S9 Scenario
Exhibit ES-27 2020 AM Peak Micro-Simulation Delay Results by Scenario
30000
De
lay
(Pe
ak
Pe
rio
d V
eh
icle
-Ho
urs
)
25000
20000
15000
10000
5000
S2 Expand Ramp Metering
S4 Adv Ramp Metering
S6 Aux Lane Striping Ramp Improvs
S8 Ramp Closures
HOV WB
I-210 WB
HOV EB
-8
-2 -8
-13 -12
S10 On-Ramp amp Aux Lane Improvs
S13 SR-134I-210 IC Modification
S14 Lake Ave Drop Ramp Lane Addition
I-210 EB
Ramps
Arterials
-11
-23
-
2020 S2 S4 S6 S8 S10 S13 S14 Horizon Scenario
I-210 Corridor System Management Plan Executive Summary
Page 31 of 39
Exhibit ES-28 2020 PM Peak Micro-Simulation Delay Results by Scenario D
ela
y(P
ea
k P
eri
od
Ve
hic
le-H
ou
rs)
30000
25000
20000
15000
10000
5000
-
S2 Expand Ramp Metering
S4 Adv Ramp Metering
S6 Aux Lane Striping Ramp Improvs
S8 Ramp Closures
HOV WB
I-210 WB
HOV EB
-14
S10 On-Ramp amp Aux Lane Improvs
S13 SR-134I-210 IC Modification
S14 Lake Ave Drop Ramp Lane Addition
I-210 EB
Ramps
Arterials
-2 -5 -3 -28
-3 -19
2020 S2 S4 S6 S8 S10 S13 S14 Horizon Scenario
Base Year and Do Minimum Horizon Year
Absent any physical improvements the modeling team estimates that by 2020 total delay (mainline HOV ramps and arterials) would double compared to 2006 (from a total of around 22000 vehicle-hours daily to just fewer than 45000 vehicle-hours) in the combined AM and PM peak
Scenarios 1 and 2 (Expand Ramp Metering)
Scenarios 1 and 2 test the only project on the corridor that was fully constructed and completed The project installed new connector metering at the SR-57 and I-605 to Ishy210 freeway connector ramps The project also widened various ramps removed various HOV meter bypasses and upgraded the ramp metering system
The 2006 model estimates that Scenario 1 would reduce delay on the corridor by around 17 percent (or 1600 daily vehicle-hours) in the PM peak period but only around two percent (or 200 vehicle-hours) in the AM peak period The biggest benefits occur in the PM eastbound direction from Rosemead On-Ramp to Huntington interchange (with a delay reduction of over 1000 vehicle-hours) as well as from I-605 to the Azusa On-Ramp (delay reduction of 500 vehicle-hours) for single occupant vehicles The
I-210 Corridor System Management Plan Executive Summary
Page 32 of 39
westbound reductions in freeway delay are largely offset by increased on-ramp delay mostly from new connector metering at SR-57 and I-605
The 2020 model estimates that Scenario 2 will reduce delay by around 8 percent in the AM peak and 14 percent in the PM peak for a combined total reduction of 5000 daily vehicle-hours The long-term improvements are less than the short-term improvements due to the increase in demand
Scenarios 3 and 4 (Advanced Ramp Metering)
Scenarios 3 and 4 build on Scenarios 1 and 2 by adding advanced ramp metering system such as dynamic or adaptive ramp metering system
The 2006 model shows that Scenario 3 would reduce delay by an additional 850 daily vehicle-hours (or 11 percent) in the PM peak with a marginal reduction in the AM peak period However in conjunction with Scenario 1 Scenario 3 reduces delay in total by over 600 vehicle-hours in the AM peak These results suggest that queue control provides additional benefits beyond SWARM
The 2020 model estimates that Scenario 4 will modestly reduce delay by about 2 percent in both the AM and PM peaks or a combined total of 800 daily vehicle-hours Again the benefits are lower in percentage terms due to the increase in demand
Note that there are various types of advanced ramp metering systems deployed around the world including System-wide Adaptive Ramp Metering System or SWARM tested recently in Los Angeles I-210 freeway corridor For the I-210 model the Asservissement Lineaire drsquoEntreacutee Autoroutiere (ALINEA system) was tested as proxy for any advanced ramp metering system as its algorithm for the model was readily available It is not necessarily recommended that ALINEA be deployed but rather some type of advanced ramp metering system that would produce similar if not better results
Scenarios 5 and 6 (Auxiliary Lane Striping Ramp Improvements)
Scenarios 5 and 6 build on Scenarios 3 and 4 that include several relatively lower-cost operational improvements that could be implemented by 2015
diams Building a westbound auxiliary lane from Santa Anita to Baldwin and an eastbound auxiliary lane from Santa Anita to Huntington
diams Extending a lane to Lincoln on the westbound I-210 connector
diams Connecting and converging the Altadena on-ramps into a single on-ramp
I-210 Corridor System Management Plan Executive Summary
Page 33 of 39
diams Connecting and converging the Santa Anita on-ramps into a single on-ramp
diams Connecting and converging the Irwindale on-ramps into a single on-ramp
diams Restriping to add a lane in the eastbound direction from San Dimas to Fruit
The 2006 model shows that Scenario 5 reduces delay by 3 percent (nearly 400 vehicleshyhours) in the AM peak and 18 percent (1200 vehicle-hours) in the PM peak The segment that experienced the largest improvement in the eastbound during the PM peak was from Rosemead to Huntington This segment experienced a 45 percent improvement in delay (from 2700 vehicle-hours to 1500 vehicle-hours) which is likely attributed to the eastbound auxiliary lane from Santa Anita to Huntington In the westbound direction the auxiliary lane from Santa Anita to Baldwin shifts some traffic downstream to cause increased congestion at Michillinda (ie bottleneck shift) during the westbound AM peak However the auxiliary lane helps reduce both queue length and queue duration for the Santa Anita bottleneck
The 2020 model estimates that Scenario 6 would reduce delay by 8 percent in the AM peak and 5 percent in the PM peak for a total reduction of 2500 daily vehicle-hours A reduction in PM delay is expected to occur mostly in the westbound direction
Scenarios 7 and 8 (Ramp Closures)
Scenarios 7 and 8 build on Scenarios 5 and 6 and test the closure of several ramps
diams Eastbound Marengo on-ramp and westbound Lake on-ramp with signalization of the eastbound I-210 off-ramp at Maple and improvement to alternate routes along Corson and Maple
diams Eastbound Mount Olive ramps
Note that subsequent scenarios are not built on top of these scenarios as these are isolated to test ramp closure alternatives
The 2006 model shows that Scenario 7 would reduce delay significantly by 16 percent in the AM peak and 18 percent in the PM peak for a total delay reduction of nearly 3000 daily vehicle-hours The delay reductions are significant on the mainline during the peak direction of travel ndash 1400 vehicle-hours in the westbound AM and 912 vehicleshyhours in the eastbound PM In the westbound direction and AM peak period the segment from Altadena to Lake experienced over an 85 percent decrease in congestion (from 860 to 120 vehicle-hours of delay) This is likely attributed to the closure of the westbound Lake on-ramp In the eastbound direction and PM peak period the segment from Huntington to I-605 experienced a delay reduction of over 70 percent (from 2200
I-210 Corridor System Management Plan Executive Summary
Page 34 of 39
vehicle-hours to 600 vehicle-hours) which is likely attributed to the closure of the Mount Olive ramp
The 2020 model also shows that Scenario 8 improved delay by 12 percent in the AM and 3 percent in the PM for a total delay reduction of almost 3000 daily vehicle-hours On the mainline facility delay also improved for each peak direction of travel ndash by 1600 daily vehicle-hours in the westbound AM and by 750 vehicle-hours in the eastbound PM Delay reductions in the non-peak direction were not as significant
Scenarios 9 and 10 (On-ramp and Aux Lane Improvements)
Scenarios 9 and 10 build on Scenarios 5 and 6 and test four operational improvements that can be implemented in the short to medium range
diams Modify the RosemeadMichillinda interchange and converge the westbound I-210 on-ramps
diams Modify the northside of the Baldwin interchange and eliminate the collectorshydistributor
diams Construct an eastbound auxiliary lane from Azusa to Citrus
diams Converge the eastbound Citrus on-ramps and add an auxiliary lane to Grand
The 2006 model estimates that Scenario 9 will reduce delay by 20 percent (or 2400 daily vehicle-hours) in the AM peak and 28 percent (or 1600 daily vehicle-hours) in the PM peak compared to Scenario 5 In both AM and PM peak period the eastbound direction experienced the largest reduction in delay
The 2020 model estimates that Scenario 10 will reduce delay by 13 percent (or 2500 vehicle-hours) in the AM peak and 28 percent in the PM peak (or 4800 vehicle-hours) compared to Scenario 6 Similar to the 2006 model the 2020 model shows that these improvements produced a greater reduction in delay in the eastbound direction than the westbound direction
Scenarios 11 and 12 (Enhanced Incident Management)
Two incident scenarios were tested on top of Scenario 10 to evaluate the non-recurrent delay reductions resulting from enhanced incident management strategies An enhanced incident management system would entail upgrading or enhancing the current Caltrans incident management system that includes deployment of intelligent transportation system (ITS) field devices central controlcommunications software communications medium (ie fiber optic lines) advanced traveler information system
I-210 Corridor System Management Plan Executive Summary
Page 35 of 39
andor freeway service patrol (FSP) program to reduce incident detection verification response and clearance times
In the first scenario Scenario 11 one collision incident with one lane closure was simulated in the westbound direction in the AM peak period model and one in the eastbound direction in the PM peak period model The incident simulation location and duration were selected based on review of the 2010 actual incident data at one of the high frequency locations The following are the Scenario details
diams Westbound AM peak period starting at 800 AM close mainline lane 2 for 40 minutes at absolute post mile 2612 (at Lake Avenue)
diams Eastbound PM peak period starting at 500 PM close mainline lane 2 for 50 minutes at absolute post mile 3207 (west of Santa Anita)
In the second scenario Scenario 12 the same collision incidents were simulated with a reduction in duration by 10 minutes in the westbound direction and by 12 minutes in the eastbound direction It is estimated based on actual incident management data analysis results provided by Caltrans that an enhanced incident management system could reduce a 35-minute incident by about 10 minutes This scenario represents a typical moderate level incident at one location during the peak period direction Data suggest that incidents vary significantly in terms of impact and duration Some incidents last hundreds of minutes some close multiple lanes and some occur at multiple locations simultaneously There are also numerous minor incidents lasting only a few minutes without lane closures that can result in congestion Many other incidents also occur during off-peak hours
Without enhanced incident management Scenario 11 produced an 8 percent increase in congestion in both peak periods over Scenario 10 an increase of over 2300 hours of vehicle delay With enhanced incident management Scenario 12 evaluation resulted in delay decrease by 2 percent in the AM peak and 3 percent in the PM peak against Scenario 11 results a reduction of nearly 750 vehicle-hours for improving the incident detection verification response and clearance time of one moderate level incident for both of the peak hours
Scenario 13 (SR-134I-210 Interchange Modification)
Scenario 13 tests an improvement to modify the SR-134I-210 interchange to provide a direct connection for vehicles to continue on I-210 with three lanes in each direction This improvement was tested with the 2020 model since it is not likely to be implemented in the short-term
I-210 Corridor System Management Plan Executive Summary
Page 36 of 39
The 2020 model estimates that delay would be reduced by 11 percent (or 1800 daily vehicle-hours) in the AM and 3 percent in the PM (320 daily vehicle-hours) compared to Scenario 10 The westbound mainline experienced the greatest reduction in delay in the AM peak from 9600 vehicle-hours to 8600 vehicle hours after the interchange modification
Scenario 14 (Westbound Drop Ramp and Eastbound Widening)
Scenario 14 builds on Scenario 13 and tests Lake Avenue drop ramp to westbound Ishy210 center lanes (one HOV lane and one mainline) and eastbound I-210 widening from Myrtle to I-605 This improvement was tested with the 2020 model
The 2020 model estimates that delay would be reduced by about 20 percent in the AM or 3400 vehicle-hours and 20 percent in the PM or 2300 vehicle-hours compared to Scenario 13 The mobility improvements are significant with the westbound drop ramp that reduces weaving between SR-134 and SR-210 destined traffic and with the eastbound capacity addition to I-605 off that moves the off-ramp traffic away from the mainline and provides more room for the mainline through traffic
Post Scenario 14 Conditions
By 2020 with the inclusion of all the projects tested the model reveals some residual congestion that remains to address with future improvements According to the model results the total remaining delay on the corridor is around 21000 daily vehicle-hours
Benefit-Cost Analysis
Following an in-depth review of model results by the study team and the SCAG technical committee the study team performed a benefit-cost analysis (BCA) for each scenario
Using the California Benefit-Cost Model (Cal-BC) developed on behalf of Caltrans by the study team benefits in three key areas were estimated travel time savings vehicle operating cost savings and emission reduction savings The benefits generated from this exercise are based solely on congestion relief related benefits However these results are conservative since there are other benefits not captured by this analysis including benefits from deploying bus rapid transit which will achieve other accessibility benefits
Project costs were developed from SCAG and Caltrans project planning and programming documents These costs include construction and support costs in current dollars The study team estimated costs for projects that did not have cost
I-210 Corridor System Management Plan Executive Summary
Page 37 of 39
estimates by reviewing similar completed projects A BC greater than one means that a scenarios projects return greater benefits than it costs to construct or implement It is important to consider the total benefits that a project brings For example a large capital expansion project can cost a great deal and have a low BC ratio but brings much higher absolute benefits to the I-210 users Exhibit ES-29 shows the benefit to cost ranges classified from low (with a BC of one to two) to very high (with a BC of over 10)
The benefit-cost results for the South Corridor scenarios are shown in Exhibit ES-29
Exhibit ES-29 I-210 Scenario BenefitCost (BC) Results
Scenario Scenario Description
BenefitCost Ranges
Low Medium Medium-High High Very High
lt1 1 to 2 2 to 5 5 to 10 gt10
12 Expand Ramp Metering 34 Advanced Ramp Metering 56 Aux Lane Striping Ramp Improvs 78 Ramp Closures
910 On-Ramp amp Aux Lane Improvs 13 SR-134I-210 IC Modification
The benefit-cost findings for each scenario are as follows
diams Scenarios 1 and 2 (ramp metering expansion) shows a high benefit-cost ratio of over ten The relatively high benefit-cost ratio is due to the low cost of expanding ramp metering ($235 million)
diams Scenarios 3 and 4 (advanced ramp metering) resulted in an incremental benefitshycost ratio of over ten This is relatively high as compared to that of typical transportation management system project
diams Scenarios 5 and 6 (operational improvements) produced a benefit-cost ratio of over five This is relatively consistent with other typical operational improvement projects The benefits are substantial At estimated total cost of about $44 million these projects produced benefits of over $233 million
diams Scenarios 7 and 8 tested the ramp closures at eastbound Marengo westbound Lake and eastbound Mount Olive These ramp closured produced an extremely high incremental benefit-cost ratio of over ten due to the relatively very low cost However this benefit-cost calculation does not account for any potential increase in delay on various local arterials because of detours from the closed ramps
diams Scenarios 9 and 10 also produced a relatively high benefit-cost ratio of over ten The four operational projects in these scenarios are collectively estimated to cost
I-210 Corridor System Management Plan Executive Summary
Page 38 of 39
under $30 million and provide a substantial and optimistic benefit of over $670 million
diams Scenario 13 tested the SR-134I-210 interchange modification This project produced a benefit-cost ratio of between one and two consistent with other typical capital expansion projects This project produced benefits of over $200 million at a rough-estimate cost of about $150 million
diams Scenario 14 tested the westbound center drop ramp from Lake Avenue interchange and eastbound lane addition from Myrtle to I-605 These projects produced a relatively high benefit-cost ratio of about 6 to one as compared to other capital improvement projects These two capital projects are unique in that they have specific operational improvement element that addresses major bottleneck locations For an estimated total combined cost of about $70 million the projected benefits exceed $420 million
CONCLUSIONS AND RECOMMENDATIONS
This section summarizes the conclusions and recommendations based on the analysis discussed in the previous section It is important to note that many of these conclusions are based primarily on the micro-simulation model results The model was developed based on the best data available at the time The study team reviewed the model results and believe that both the calibrated base year forecast year and scenario results are reasonable However Caltrans should always be cautious to make decisions based on modeling alone especially complex micro-simulation models
Based on the results the study team offers the following conclusions and recommendations
diams The combination of all scenarios significantly reduces overall congestion on the corridor Projected 2020 congestion after implementation of all scenarios is below 2006 levels in both the AM and PM peak period In the AM peak period the model projects total delay in 2020 after delivering all projects to be less than 11700 vehicle-hours compared to the 2006 base year delay of 13000 vehicleshyhours This represents a reduction of over 10 percent In the PM peak period the model projects total delay in 2020 after delivering all projects to be around 9500 hours compared to the 2006 base year delay of almost 9300 vehicle-hours This represents a slight reduction of 2 percent Clearly the scenarios deliver significant mobility benefits to the corridor Despite the growth in demand future 2020 congestion will be less than experienced in 2006
diams The completed ramp metering expansion project is expected to produce substantial mobility benefits of over $400 million Delay has been significantly reduced since 2006
I-210 Corridor System Management Plan Executive Summary
Page 39 of 39
diams Advanced ramp metering could provide additional mobility improvements by significantly reducing congestion and returning over $100 million in benefits
diams Ramp closures at Marengo Lake and Mount Olive as alternatives seem promising by reducing delay up to 3000 vehicle-hours per day and providing substantial benefits of $280 million at an extremely low cost
diams Operational improvements such as auxiliary lanes and ramp improvements could leverage on the ramp metering projects by making the corridor more efficient and productive that could result in additional mobility benefits of over $230 million
diams Additional capital improvements with specific operational elements to address weaving at major bottleneck locations could produce significant mobility benefits of over $420 million
diams Enhanced incident management system associated with Scenarios 11 and 12 to address non-recurrent congestion proved effective with a delay reduction of over 300 vehicle-hours for one modest level incident with a typical duration of 35 minutes reduced to 25 minutes With the I-210 corridor experiencing up to 2400 collisions per year this translates to a total annual delay savings of over 700000 vehicle-hours for the study corridor
diams The benefit-cost ratio of all scenarios combined is about 64 to 1 If all projects were delivered at current cost estimates the public would get over six dollars of benefits for each dollar expended In current dollars costs total to over $17 billion whereas the benefits are estimated to be over $20 billion
diams The projects also alleviate greenhouse gas (GHG) emissions by over 15 million tons over 20 years averaging over a 75000-ton reduction per year The emissions are estimated using data from the California Air Resources Board (CARB) EMFAC model
This is the first generation CSMP for the I-210 corridor It is important to stress that CSMPs should be updated on a regular basis This is particularly important since traffic conditions and patterns can differ from current projections After projects are delivered it is also useful to compare actual results with estimated ones in this document so that models can be further improved as appropriate
CSMPs or a variation thereof should become the normal course of business that is based on detailed performance assessments an in-depth understanding of the reasons for performance deterioration and an analytical framework that allows for evaluating complementary operational strategies that maximize the productivity of the current system
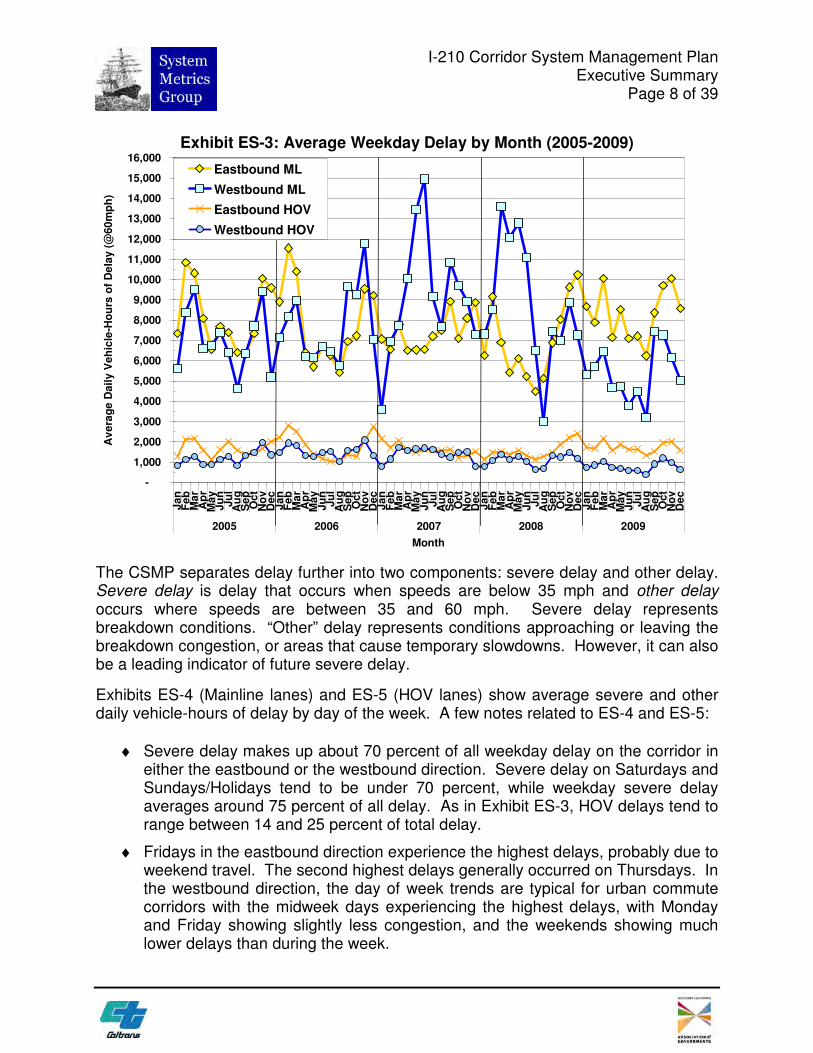
I-210 Corridor System Management Plan Executive Summary
Page 8 of 39
Exhibit ES-3 Average Weekday Delay by Month (2005-2009) 16000
Av
era
ge
Da
ily
Ve
hic
le-H
ou
rs o
f D
ela
y (
6
0m
ph
)
15000
14000
13000
12000
11000
10000
9000
8000
7000
6000
5000
4000
3000
2000
1000
-
Ja
nF
eb
Ma
rA
pr
Ma
yJ
un
Ju
lA
ug
Se
pO
ct
No
vD
ec
Ja
nF
eb
Ma
rA
pr
Ma
yJ
un
Ju
lA
ug
Se
pO
ct
No
vD
ec
Ja
nF
eb
Ma
rA
pr
Ma
yJ
un
Ju
lA
ug
Se
pO
ct
No
vD
ec
Ja
nF
eb
Ma
rA
pr
Ma
yJ
un
Ju
lA
ug
Se
pO
ct
No
vD
ec
Ja
nF
eb
Ma
rA
pr
Ma
yJ
un
Ju
lA
ug
Se
pO
ct
No
vD
ec
2005 2006 2007 2008 2009
Eastbound ML
Westbound ML
Eastbound HOV
Westbound HOV
Month
The CSMP separates delay further into two components severe delay and other delay Severe delay is delay that occurs when speeds are below 35 mph and other delay occurs where speeds are between 35 and 60 mph Severe delay represents breakdown conditions ldquoOtherrdquo delay represents conditions approaching or leaving the breakdown congestion or areas that cause temporary slowdowns However it can also be a leading indicator of future severe delay
Exhibits ES-4 (Mainline lanes) and ES-5 (HOV lanes) show average severe and other daily vehicle-hours of delay by day of the week A few notes related to ES-4 and ES-5
diams Severe delay makes up about 70 percent of all weekday delay on the corridor in either the eastbound or the westbound direction Severe delay on Saturdays and SundaysHolidays tend to be under 70 percent while weekday severe delay averages around 75 percent of all delay As in Exhibit ES-3 HOV delays tend to range between 14 and 25 percent of total delay
diams Fridays in the eastbound direction experience the highest delays probably due to weekend travel The second highest delays generally occurred on Thursdays In the westbound direction the day of week trends are typical for urban commute corridors with the midweek days experiencing the highest delays with Monday and Friday showing slightly less congestion and the weekends showing much lower delays than during the week
Av
era
ge D
aily V
eh
icle
-Ho
urs
of
Dela
y (
60
mp
h)
Av
era
ge D
aily V
eh
icle
-Ho
urs
of
Dela
y (
60
mp
h)
I-210 Corridor System Management Plan Executive Summary
Page 9 of 39
Exhibit ES-4 Mainline Lane Delay by Day of Week (2005-2009) 16000
15000
14000
13000
12000
11000
10000
9000
8000
7000
6000
5000
4000
3000
2000
1000
-
Mainline Other Delay
Mainline Severe Delay M
on
T
ue
Wed
T
hu
F
riS
at
Su
n
Ho
lM
on
Tu
eW
ed
Th
uF
riS
at
Su
n
Ho
lM
on
Tu
eW
ed
Th
uF
riS
at
Su
n
Ho
lM
on
Tu
eW
ed
Th
uF
riS
at
Su
n
Ho
lM
on
Tu
eW
ed
Th
uF
riS
at
Su
n
Ho
lM
on
Tu
eW
ed
Th
uF
riS
at
Su
n
Ho
lM
on
Tu
eW
ed
Th
uF
riS
at
Su
n
Ho
lM
on
Tu
eW
ed
Th
uF
riS
at
Su
n
Ho
lM
on
Tu
eW
ed
Th
uF
riS
at
Su
n
Ho
lM
on
Tu
eW
ed
Th
uF
riS
at
Su
n
Ho
l
2005 2006 2007 2008 2009 2005 2006 2007 2008 2009
EASTBOUND WESTBOUND
Exhibit ES-5 HOV Lane Delay by Day of Week (2005-2009) 4000
3500
3000
2500
2000
1500
1000
500
-
Mo
nT
ue
Wed
Th
uF
riS
at
Su
n
Ho
lM
on
Tu
eW
ed
Th
uF
riS
at
Su
n
Ho
lM
on
Tu
eW
ed
Th
uF
riS
at
Su
n
Ho
lM
on
Tu
eW
ed
Th
uF
riS
at
Su
n
Ho
lM
on
Tu
eW
ed
Th
uF
riS
at
Su
n
Ho
lM
on
Tu
eW
ed
Th
uF
riS
at
Su
n
Ho
lM
on
Tu
eW
ed
Th
uF
riS
at
Su
n
Ho
lM
on
Tu
eW
ed
Th
uF
riS
at
Su
n
Ho
lM
on
Tu
eW
ed
Th
uF
riS
at
Su
n
Ho
lM
on
Tu
eW
ed
Th
uF
riS
at
Su
n
Ho
l
2005 2006 2007 2008 2009 2005 2006 2007 2008 2009
EASTBOUND WESTBOUND
Other Delay
Severe Delay
I-210 Corridor System Management Plan Executive Summary
Page 10 of 39
Exhibits ES-6 and ES-7 summarize average annual weekday delay by hour of the day over the five-year period for the mainline northbound and southbound lanes respectively These exhibits allow planners and decision makers to understand the trend in peak period delay spiking and peak period spreading by comparing the intensity and duration of the peak period congestion Note that the HOV lanes are not shown in this summary report since they follow similar peaking trends as the mainline lanes (the main technical report contains the HOV delay by hour results) A few notes on these two exhibits
diams The eastbound direction peaks in the PM peak period while the AM is the westbound peak AM peak hour is 700 AM while the PM peak period is 500 PM
diams In the eastbound PM direction congestion grew dramatically in 2009 while westbound AM congestion declined This is also evident in Exhibit ES-2 Eastbound delay between 2005 and 2008 remained relatively constant at about 1750 vehicle-hours during the 500 PM peak hour before increasing in 2009 to about 2100 vehicle-hours
diams Westbound AM congestion declined in 2009 after two years of dramatic growth between 2007 and 2008 In 2009 the AM peak period also shrank by approximately one-half hour and started at approximately 530 AM whereas from 2005 to 2008 the peak period started around 500 AM
Exhibit ES-6 Eastbound Mainline Lanes Hourly Delay (2005-2009)
0
250
500
750
1000
1250
1500
1750
2000
2250
2500
Ave
rag
e D
ail
y V
eh
icle
Ho
urs
of
Dela
y (
60
mp
h) 2009 Weekday
2008 Weekday
2007 Weekday
2006 Weekday
2005 Weekday
00
0
10
0
20
0
30
0
40
0
50
0
60
0
70
0
80
0
90
0
100
0
110
0
120
0
130
0
140
0
150
0
160
0
170
0
180
0
190
0
200
0
210
0
220
0
230
0
Hour of the Day
I-210 Corridor System Management Plan Executive Summary
Page 11 of 39
Exhibit ES-7 Westbound Mainline Lanes Hourly Delay (2005-2009)
0
250
500
750
1000
1250
1500
1750
2000
2250
2500
Ave
rag
e D
ail
y V
eh
icle
Ho
urs
of
Dela
y (
60m
ph
) 2009 Weekday
2008 Weekday
2007 Weekday
2006 Weekday
2005 Weekday
00
0
10
0
20
0
30
0
40
0
50
0
60
0
70
0
80
0
90
0
100
0
110
0
120
0
130
0
140
0
150
0
160
0
170
0
180
0
190
0
200
0
210
0
220
0
230
0
Hour of the Day
Travel Time
The travel time performance measure represents the average time it takes for a vehicle to travel between SR-134 and SR-57 a distance of approximately 20 miles
Exhibits ES-8 and ES-9 summarize mainline estimated average weekday travel times by hour of day for the 2005-2009 five-year period Exhibits ES-10 and ES-11 show the same results for the HOV facility Similar to delay travel times increased in 2009 in the eastbound PM direction and time but decreased in the westbound AM commute period
In the mainline lanes the eastbound PM peak hour (500 PM) travel time grew from 40 minutes in 2008 to 44 minutes in 2009 In the westbound AM peak hour (700 AM) the opposite trend occurred with travel times dropping from a 41 minute average in 2008 to around 36 minutes in 2009
A similar trend occurred for the HOV lanes except that 2005 was the worst year in terms of travel times
Tra
ve
l T
ime
(m
inu
tes
) T
rav
el
Tim
e (
min
ute
s)
45
40
35
30
25
20
15
10
5
0
45
40
35
30
25
20
15
10
5
0
I-210 Corridor System Management Plan Executive Summary
Page 12 of 39
Exhibit ES-8 Eastbound Mainline Lanes Travel Time by Hour (2005-2009) 50
2009 Average Travel Time
2008 Average Travel Time
2007 Average Travel Time
2006 Average Travel Time
2005 Average Travel Time
Travel Time 60mph
Travel Time 35mph
Hour of the Day
00
0
10
0
20
0
30
0
40
0
50
0
60
0
70
0
80
0
90
0
100
0
110
0
120
0
130
0
140
0
150
0
160
0
170
0
180
0
190
0
200
0
210
0
220
0
Hour of the Day
Exhibit ES-9 Westbound Mainline Lanes Travel Time by Hour (2005-2009) 50
2009 Average Travel Time
2008 Average Travel Time
2007 Average Travel Time
2006 Average Travel Time
2005 Average Travel Time
Travel Time 60mph
Travel Time 35mph
00
0
10
0
20
0
30
0
40
0
50
0
60
0
70
0
80
0
90
0
10
00
11
00
12
00
13
00
14
00
15
00
16
00
17
00
18
00
19
00
20
00
21
00
22
00
230
0
23
00
Tra
ve
l T
ime
(m
inu
tes
) T
rav
el
Tim
e (
min
ute
s)
45
40
35
30
25
20
15
10
5
0
45
40
35
30
25
20
15
10
5
0
I-210 Corridor System Management Plan Executive Summary
Page 13 of 39
Exhibit ES-10 Eastbound HOV Lanes Travel Time by Hour (2005-2009) 50
2009 Average Travel Time
2008 Average Travel Time
2007 Average Travel Time
2006 Average Travel Time
2005 Average Travel Time
Travel Time 60mph
Travel Time 35mph
Hour of the Day
00
0
10
0
20
0
30
0
40
0
50
0
60
0
70
0
80
0
90
0
100
0
110
0
120
0
130
0
140
0
150
0
160
0
170
0
180
0
190
0
200
0
210
0
220
0
Hour of the Day
Exhibit ES-11 Westbound HOV Lanes Travel Time by Hour (2005-2009) 50
2009 Average Travel Time
2008 Average Travel Time
2007 Average Travel Time
2006 Average Travel Time
2005 Average Travel Time
Travel Time 60mph
Travel Time 35mph
00
0
10
0
20
0
30
0
40
0
50
0
60
0
70
0
80
0
90
0
100
0
110
0
120
0
130
0
140
0
150
0
160
0
170
0
180
0
190
0
200
0
210
0
220
0
230
0
230
0
I-210 Corridor System Management Plan Executive Summary
Page 14 of 39
Reliability
Reliability captures the degree of predictability in travel time Reliability focuses on how travel time varies from day to day and reflects the impacts of accidents incidents weather and special events Improving reliability is an important goal for transportation agencies and efforts to accomplish this include incident management traveler information and special event planning
To measure reliability the CSMP used the ldquobuffer indexrdquo which reflects the additional time required (over and beyond the average) to ensure an on-time arrival 95 percent of the time In other words if a person must be on time 95 days out of 100 (or 19 out of 20 workdays per month) then that person must add additional time to their average expected travel time to ensure an on-time arrival That additional time is the buffer time Severe events such as collisions could cause longer travel times but the 95th percentile represents a balance between days with extreme events (eg major accidents) and other more ldquotypicalrdquo travel days
Exhibits ES-12 and ES-13 show the estimated mainline lane travel time variability along I-210 on non-holiday weekdays for 2006 in the eastbound and westbound directions respectively The main report shows the buffer index for the years 2005-2009 for both mainline and HOV lanes but this Executive Summary reports only the data for the year 2006 for mainlines since that year was used as the base year for modeling
The following observations on the reliability results are worth noting
bull In 2006 in the eastbound direction 500 PM had the highest estimated average travel time at approximately 41 minutes and the highest estimated buffer index time of 15 minutes for a buffer index of 33 percent In other words to arrive on time 95 percent of the time a commuter would need to leave for work 56 minutes before the start time to travel the entire length of the I-210 study corridor
bull The westbound direction the 700 AM had the estimated average travel time of 39 minutes in 2006 with a buffer time of 15 minutes for a buffer index of 38 percent
70
65
60
55
50
45
40
35
30
25
20
15
10
5
0
70
65
60
55
50
45
40
35
30
25
20
15
10
5
0
Average Travel Time
Travel Time Variability (95th Percentile)
Travel Time at 60mph
Travel Time at 35mph
TIME OF DAY
Exhibit ES-13 Westbound Mainline Lanes Travel Time Variability (2006)
75
TIME OF DAY
Average Travel Time
Travel Time Variability (95th Percentile)
Travel Time at 60mph
Travel Time at 35mph
Exhibit ES-12 Eastbound Mainline Lanes Travel Time Variability (2006)
75
I-210 Corridor System Management Plan Executive Summary
Page 15 of 39
TR
AV
EL
TIM
E (
MIN
)
00
000
0
10
010
0
TR
AV
EL
TIM
E (
MIN
)
20
020
0
30
030
0
40
040
0
50
050
0
60
060
0
70
070
0
80
080
0
90
090
0
100
01
00
0
110
01
10
0
120
01
20
0
130
01
30
0
140
01
40
0
150
01
50
0
160
01
60
0
170
01
70
0
180
01
80
0
190
01
90
0
200
02
00
0
210
02
10
0
220
02
20
0
230
02
30
0
00
0
00
0
I-210 Corridor System Management Plan Executive Summary
Page 16 of 39
Safety
The adopted performance measures to assess safety involve the number of accidents and the accident rates computed from the Caltrans Traffic Accident Surveillance and Analysis System (TASAS) TASAS is a traffic records system containing an accident database linked to a highway database The highway database contains descriptive elements of highway segments intersections and ramps access control traffic volumes and other data TASAS contains specific data for accidents on State highways Accidents on non-State highways are not included (eg local streets and roads)
The safety assessment in this report intends to characterize the overall accident history and trends in the corridor and to highlight notable accident concentration locations or patterns that are readily apparent This report does not intend to supplant more detailed safety investigations routinely performed by Caltrans staff
Exhibits ES-14 and ES-15 show the I-210 total number of eastbound and westbound accidents by month respectively For the accident analysis the corridor is split in half the ldquoless urbanrdquo western half of the corridor from I-5 (postmile 0) in Sylmar to SR-134 in Pasadena (postmile R2200) and the ldquomore urbanrdquo eastern half from SR-134 to SR-57 (postmile R45) in San Dimas The latest available TASAS data from PeMS is to December 30 2008 Accidents are reported for the study corridor and not separated by mainline and HOV facility The exhibits summarize the latest available three-year data from January 1 2006 through December 31 2008
Both the eastbound and westbound directions have similar accident profiles with the more urbanized eastern half of the corridor (postmile R22 to R45) experiencing nearly 45 times as many accidents as the western half (PM 0 to R22) The eastbound (Exhibit ES-13) direction has around 79 accidents on average per month in the more-urbanized section and just fewer than 18 accidents in the less-urbanized section
The westbound direction has just fewer than 78 accidents on average per month in the more-urbanized section and just fewer than 18 in the less-urbanized section This is very similar to the eastbound direction
Nu
mb
er
of
Ac
cid
en
ts
Nu
mb
er
of
Accid
en
ts
I-210 Corridor System Management Plan Executive Summary
Page 17 of 39
Exhibit ES-14 Eastbound I-210 Monthly Collisions (2004-2008) 120
110
100
90
80
70
60
50
40
30
20
10
0
Jan
Feb
Mar
Ap
rM
ay
Ju
nJu
lA
ug
Sep
Oct
No
vD
ec
Jan
Feb
Mar
Ap
rM
ay
Ju
nJu
lA
ug
Sep
Oct
No
vD
ec
Jan
Feb
Mar
Ap
rM
ay
Ju
nJu
lA
ug
Sep
Oct
No
vD
ec
Jan
Feb
Mar
Ap
rM
ay
Ju
nJu
lA
ug
Sep
Oct
No
vD
ec
Jan
Feb
Mar
Ap
rM
ay
Ju
nJu
lA
ug
Sep
Oct
No
vD
ec
2004 2005 2006 2007 2008
Less Urbanized Western Section (I-5 to SR-134)
More Urbanized Eastern Section (SR-134 to SR-57)
110
100
90
80
70
60
50
40
30
20
10
0
Exhibit ES-15 Westbound I-210 Monthly Collisions (2004-2008) 120
Jan
Feb
Mar
Ap
rM
ay
Ju
nJu
lA
ug
Sep
Oct
No
vD
ec
Jan
Feb
Mar
Ap
rM
ay
Ju
nJu
lA
ug
Sep
Oct
No
vD
ec
Jan
Feb
Mar
Ap
rM
ay
Ju
nJu
lA
ug
Sep
Oct
No
vD
ec
Jan
Feb
Mar
Ap
rM
ay
Ju
nJu
lA
ug
Sep
Oct
No
vD
ec
Jan
Feb
Mar
Ap
rM
ay
Ju
nJu
lA
ug
Sep
Oct
No
vD
ec
2004 2005 2006 2007 2008
Less Urbanized Western Section (I-5 to SR-134)
More Urbanized Eastern Section (SR-134 to SR-57)
I-210 Corridor System Management Plan Executive Summary
Page 18 of 39
Productivity
Productivity is a system efficiency measure used to analyze the throughput of the corridor during congested conditions Restoring lost productivity is one focus area of CSMPs
Exhibit ES-16 illustrates how congestion leads to lost productivity The exhibit uses observed I-210 data from sensors for a typical spring 2010 afternoon peak period (Thursday May 6 2010) It shows speeds (red line) and flow rates (blue line) on eastbound I-210 at Huntington Drive one of the most congested locations on the corridor
Flow rates (measured as vehicle-per-hour-per-lane or ldquovphplrdquo) at Huntington Drive averaged around 1800 vphpl between 200 PM and 300 PM Once volumes approach a maximum flow rate of around 2000 vphl traffic becomes unstable Any additional merging or weaving traffic breaks down and speeds can rapidly plummet to below 35 mph In essence every incremental merge takes up two spots on the freeway for a short time However since the volume is close to the capacity these merges lead to queues Moreover rather than accommodating the same number of vehicles flow rates also drop and vehicles back up creating bottlenecks and associated congestion
At the location shown in Exhibit ES-16 throughput drops by over 30 percent on average during the peak period (from over 1800 to around 1200 vphpl) This five-lane road therefore operates as if lost 30 percent capacity when demand is at its highest Stated differently just when the corridor needed the most capacity it performed in the least productive manner and effectively lost lanes This loss in throughput can be aggregated and presented as ldquoEquivalent Lost-Lane-Milesrdquo
I-210 Corridor System Management Plan Executive Summary
Page 19 of 39
Exhibit ES-16 Lost Productivity Illustrated
70 2000
65
60 1750
50
55 1500
SP
EE
D
45 1250
40
35 1000
30 Speed lt35mph
750 25
20 500 I-210 EB
15 Los Angeles County Huntington
10 PM=3338 250
May 6 2010 5 VDS ID 761141
0 -
FL
OW
RA
TE
(VP
HP
L)
140
0
143
0
150
0
153
0
160
0
163
0
170
0
173
0
180
0
183
0
190
0
193
0
TIME The estimated average non-holiday weekday lost lane-miles by period and year on Ishy210 are shown Exhibits ES-17 (mainline) and ES-18 (HOV) A few notes on these two exhibits
diams The trends in the productivity losses are comparable to the delay trends The largest productivity losses occurred in the eastbound direction during the PM peak hours which is the direction and time period that experienced the most congestion
diams On the mainline facility the westbound direction experienced nearly as high productivity loses during the AM peak period
diams On the HOV lanes a greater productivity loss in the eastbound peak period is more evident
Operational strategies are critical to recovering such productivity losses These strategies include building new or extending auxiliary lanes developing more aggressive ramp metering strategies without negatively influencing the arterial network and improving incident clearance times
I-210 Corridor System Management Plan Executive Summary
Page 20 of 39
Exhibit ES-17 Mainline Daily Equivalent Lost Lane-Miles by Direction and Period (2005-09)
-
10
20
30
40
50
60
70
80
90
100
110
120
130
140
150
160
2005 2006 2007 2008 2009 2005 2006 2007 2008 2009 2005 2006 2007 2008 2009 2005 2006 2007 2008 2009
Eastbound
Westbound
AM PM Midday Night Time Period and Year
Daily
Eq
uiv
ale
nt
Lost
Lan
e-M
iles
Exhibit ES-18 HOV Daily Equivalent Lost Lane-Miles by Direction and Period (2005-09)
-
10
20
30
40
2005 2006 2007 2008 2009 2005 2006 2007 2008 2009 2005 2006 2007 2008 2009 2005 2006 2007 2008 2009
Eastbound
Westbound
AM Midday PM Night
Daily
Eq
uiv
ale
nt
Lost
Lan
e-M
iles
Time Period and Year
I-210 Corridor System Management Plan Executive Summary
Page 21 of 39
BOTTLENECK IDENTIFICATION AND CAUSALITY ANALYSIS
Exhibits ES-19 and ES-20 summarize the eastbound and westbound bottleneck locations the time period that each bottleneck is generally active and the causes of the each bottleneck Exhibits ES-21 and ES-22 are maps of the corridor showing these bottleneck locations for the AM and PM peak periods respectively
Major bottlenecks are the primary cause of congestion and lost productivity By definition a bottleneck is a condition where traffic demand exceeds the effective carrying capacity of the roadway In most cases the cause of a bottleneck is related to a sudden reduction in capacity such as a lane drop merging and weaving driver distractions a surge in demand or a combination of factors
The specific location and causality of each major I-210 bottleneck was verified by multiple field observations on separate weekdays throughout the summer fall and winter of 2009 Some bottleneck locations were videotaped to validate bottlenecks and to assist in micro-simulation model calibration
The detailed final report explains in detail the process and results of the bottleneck identification and causality analysis
I-210 Corridor System Management Plan Executive Summary
Page 22 of 39
Exhibit ES-19 I-210 Eastbound Bottleneck Locations
Abs CA Bottleneck
Location
Active
Period Causality Summary
AM PM
250 R250 Fair Oaks Heavy ramp merge
265 R265 Lake On-ramp Heavy ramp merge
286 R287 San Gabriel On-ramp Heavy ramp merge roadway curves
294 R294 Rosemead On-ramp Heavy consecutive ramp merge
330 R327 Huntington Interchange Heavy ramp merge roadway curves
366 R363 I-605 On-ramp traffic weaving with the off-ramp
400 R397 Azusa On-ramp Heavy ramp merge
408 R406 Citrus On-ramp Heavy ramp merge
450 R450 SR-57 On-ramp Heavy ramp merge and lane drop
Exhibit ES-20 I-210 Westbound Bottleneck Locations
Abs CA
Bottleneck
Location
Active
Period Causality Summary
AM PM
401 R398 Azusa On-ramp Consecutive ramp merge curves
368 R365 I-605 Off-ramp Consecutive ramp merge weaving
322 R319 Santa Anita On-ramp Heavy ramp merge roadway curves
307 R304 Baldwin On-ramp Heavy consecutive ramp merge
297 L297 Rosemead On-ramp Three consecutive ramp merges weaving
280 R281 Altadena On-ramp Heavy ramp merge
261 R261 Lake On-ramp Heavy ramp merge
Bottleneck Locations
reg --Bottleneck
Westbound
Eastbound
0 1 2
I bull I I I bull I I I Miles
HJOUAIIO fl _
I-210 Corridor System Management Plan Executive Summary
Page 23 of 39
Exhibit ES-21 I-210 Map of AM Bottleneck Locations
Bottleneck Locations
reg Bottleneck - Westbound - Eastbound
N 0 1 2
bull I I II II II I ll) Mles s
HJOUAIIO fl _
I-210 Corridor System Management Plan Executive Summary
Page 24 of 39
Exhibit ES-22 I-210 Map of PM Bottleneck Locations
I-210 Corridor System Management Plan Executive Summary
Page 25 of 39
SCENARIO DEVELOPMENT AND ANALYSIS
Fully understanding how a corridor performs and why it performs the way it does sets the foundation for evaluating potential solutions Several steps were required to develop and evaluate improvements including
diams Developing traffic models for 2006 base year and 2020 long-term demand diams Combining projects in a logical manner for modeling and testing diams Evaluating model outputs and summarizing results diams Conducting a benefit-cost assessment of scenarios
Traffic Model Development
The study team developed a traffic model using the VISSIM micro-simulation software It is important to note that micro-simulation models are complex to develop and calibrate for a large urban corridor However it is one of the only tools capable of providing a reasonable approximation of bottleneck formation and queue development Therefore such tools help quantify the impacts of operational strategies which traditional travel demand models cannot
The model was calibrated against 2006 conditions This was a resource intensive effort requiring several iterations of submittals and review cycles until the model reasonably matched bottleneck locations and relative severity Once calibration was approved a 2020 model was also developed based on SCAGrsquos travel demand model demand projections
These two models were used to evaluate different scenarios (combinations of projects) to quantify the associated congestion relief benefits and to compare total project costs against their benefits
Exhibit ES-23 depicts the network included in the model There were no parallel arterials modeled with the exception of arterials at interchanges All freeway interchanges were included as well as on-ramps and off-ramps
I-210 Corridor System Management Plan Executive Summary
Page 26 of 39
Exhibit ES-23 Micro-Simulation Model Network
I-210 Corridor System Management Plan Executive Summary
Page 27 of 39
Scenario Development Framework
The study team developed a framework for combining projects into scenarios It would be desirable to evaluate every possible combination of projects However this would have entailed thousands of model runs Instead the team combined projects based on a number of factors including
diams Projects that were fully constructed and completed from 2006 to 2010 were tested with both the 2006 and 2020 models
diams Short- and mid- term operational projects were grouped into scenarios and tested with the both the 2006 and 2020 models
diams Longer-range projects to be delivered by 2020 and beyond were used to develop scenarios to be tested with the 2020 model only
diams Alternative ramp closures were grouped into isolated scenarios (future scenarios did not build on top of these) and tested with both the 2006 and 2020 models
The study assumes that projects delivered before 2016 could reasonably be evaluated using the 2006 base year model The 2020 forecast year for the I-210 study was consistent with the SCAG 2020 regional travel demand model origin-destination matrices used to develop the 2008 Regional Transportation Plan (RTP) When SCAG updates its travel demand model and Regional Transportation Plan (RTP) it may wish to update the micro-simulation model with revised demand projections
Project lists used to develop scenarios were part from the Regional Transportation Improvement Program (RTIP) the RTP and other sources such as special studies Projects that do not directly affect mobility were eliminated For instance sound wall landscaping or minor arterial improvement projects were not evaluated since microshysimulation models cannot evaluate them
Scenario testing performed for the performed for the I-210 CSMP differed from traditional ldquoalternatives evaluationsrdquo done for Major Investment Studies (MIS) or Environmental Impact Reports (EIRs) An MIS or EIR focuses on identifying alternative solutions to address current or projected corridor problems so each alternative is evaluated separately and results among competing alternatives are compared resulting in a locally preferred alternative In contrast for the I-210 CSMP scenarios build on each other in that a scenario contains the projects from the previous scenario plus one or more projects as long as the incremental scenario results showed an acceptable level of performance improvement This incremental scenario evaluation approach is important since CSMPs are new and are often compared with alternatives studies
Exhibit ES-24 summarizes the approach used and scenarios tested and provides a
I-210 Corridor System Management Plan Executive Summary
Page 28 of 39
general description of the projects included in the 2006 and 2020 micro-simulation runs Most projects were tested for both the short- and long-term timeframes Each scenario tested was built upon prior scenarios except for Scenarios 7 and 8 which were ldquostand alonerdquo scenarios used to test alternative ramp closures Later scenarios build on Scenarios 5 and 6 and do not include the improvements tested in Scenarios 7 and 8 Enhanced incident management was tested in Scenarios 11 and 12 by comparing a simulated incident without and with enhanced incident management system Scenarios 13 and 14 are expected for the longer term and were tested only with the 2020 model
Exhibit ES-24 Micro-Simulation Modeling Approach
Short-Term Scenarios Long-Term Scenarios
Calibrated 2006 Base Case
Scenario 1 Expand Ramp-
Metering
Scenario 3 Scenario 1 +
Adv Ramp-Meter w
Queue Control
Scenario 5 Scenario 3 + aux lane striping and
ramp improvements
2020 Horizon Year
2006 Network 2020 OD Matrices
Scenario 7 Scenario 5 +
Ramp Closures
Scenario 2 Expand Ramp-
Metering
Scenario 4 Scenario 2 +
Adv Ramp-Meter w
Queue Control
Scenario 6 Scenario 4 + aux lane striping and
ramp improvements
Scenario 8 Scenario 6 +
Ramp Closures
Scenario 14 Scenario 13 + Lake
Ave Drop Ramp
Lane Addition
Scenario 9 Scenario 5+
On-Ramp amp Aux
lane improvements
Scenario 10 Scenario 6 +
On-Ramp amp Aux
lane improvements
Scenario 11 Incident with No
Incident
Management
Scenario 12 Incident With
Incident
Management
Scenario 13 Scenario 10 +
134210 IC
modification
Incident Management Scenarios
I-210 Corridor System Management Plan Executive Summary
Page 29 of 39
Scenario Evaluation Results
Exhibits ES-25 and ES-26 show the delay results for all the 2006 scenarios evaluated for the AM and PM peak periods respectively Exhibits ES-27 and ES-28 show the delay results for all the 2020 scenarios evaluated for the AM and PM peak periods respectively For each scenario the modeling team produced results by facility type (ie mainline HOV arterials and ramps) and vehicle type (SOV HOV trucks) as well as speed contour diagrams (discussed in more detail in the full technical CSMP) The study team scrutinized to ensure that they were consistent with general traffic engineering principles The following summarizes the findings related to the four exhibits
Exhibit ES-25 2006 AM Peak Micro-Simulation Delay Results by Scenario
De
lay
(Pe
ak
Pe
rio
d V
eh
icle
-Ho
urs
)
2006 Base Year S1 S3 S5 S7 S9 Scenario
18000
16000
14000
12000
10000
8000
6000
4000
2000
-
S1 Expand Ramp Metering
S3 Adv Ramp Metering
S5 Aux Lane Striping Ramp Improvs
S7 Ramp Closures
S9 On-Ramp amp Aux Lane Improvs
-2 -3 -3
-16 -20
HOV WB I-210 WB
HOV EB I-210 EB
Ramps Arterials
I-210 Corridor System Management Plan Executive Summary
Page 30 of 39
Exhibit ES-26 2006 PM Peak Micro-Simulation Delay Results by Scenario
18000
De
lay
(Pe
ak
Pe
rio
d V
eh
icle
-Ho
urs
)
16000
14000
12000
10000
8000
6000
4000
2000
-
S1 Expand Ramp Metering
S3 Adv Ramp Metering
HOV WB
I-210 WB
S5 Aux Lane Striping Ramp Improvs
S7 Ramp Closures
S9 On-Ramp amp Aux Lane Improvs
HOV EB
I-210 EB
Ramps
Arterials
-17
-11
-18
-18 -28
2006 Base Year S1 S3 S5 S7 S9 Scenario
Exhibit ES-27 2020 AM Peak Micro-Simulation Delay Results by Scenario
30000
De
lay
(Pe
ak
Pe
rio
d V
eh
icle
-Ho
urs
)
25000
20000
15000
10000
5000
S2 Expand Ramp Metering
S4 Adv Ramp Metering
S6 Aux Lane Striping Ramp Improvs
S8 Ramp Closures
HOV WB
I-210 WB
HOV EB
-8
-2 -8
-13 -12
S10 On-Ramp amp Aux Lane Improvs
S13 SR-134I-210 IC Modification
S14 Lake Ave Drop Ramp Lane Addition
I-210 EB
Ramps
Arterials
-11
-23
-
2020 S2 S4 S6 S8 S10 S13 S14 Horizon Scenario
I-210 Corridor System Management Plan Executive Summary
Page 31 of 39
Exhibit ES-28 2020 PM Peak Micro-Simulation Delay Results by Scenario D
ela
y(P
ea
k P
eri
od
Ve
hic
le-H
ou
rs)
30000
25000
20000
15000
10000
5000
-
S2 Expand Ramp Metering
S4 Adv Ramp Metering
S6 Aux Lane Striping Ramp Improvs
S8 Ramp Closures
HOV WB
I-210 WB
HOV EB
-14
S10 On-Ramp amp Aux Lane Improvs
S13 SR-134I-210 IC Modification
S14 Lake Ave Drop Ramp Lane Addition
I-210 EB
Ramps
Arterials
-2 -5 -3 -28
-3 -19
2020 S2 S4 S6 S8 S10 S13 S14 Horizon Scenario
Base Year and Do Minimum Horizon Year
Absent any physical improvements the modeling team estimates that by 2020 total delay (mainline HOV ramps and arterials) would double compared to 2006 (from a total of around 22000 vehicle-hours daily to just fewer than 45000 vehicle-hours) in the combined AM and PM peak
Scenarios 1 and 2 (Expand Ramp Metering)
Scenarios 1 and 2 test the only project on the corridor that was fully constructed and completed The project installed new connector metering at the SR-57 and I-605 to Ishy210 freeway connector ramps The project also widened various ramps removed various HOV meter bypasses and upgraded the ramp metering system
The 2006 model estimates that Scenario 1 would reduce delay on the corridor by around 17 percent (or 1600 daily vehicle-hours) in the PM peak period but only around two percent (or 200 vehicle-hours) in the AM peak period The biggest benefits occur in the PM eastbound direction from Rosemead On-Ramp to Huntington interchange (with a delay reduction of over 1000 vehicle-hours) as well as from I-605 to the Azusa On-Ramp (delay reduction of 500 vehicle-hours) for single occupant vehicles The
I-210 Corridor System Management Plan Executive Summary
Page 32 of 39
westbound reductions in freeway delay are largely offset by increased on-ramp delay mostly from new connector metering at SR-57 and I-605
The 2020 model estimates that Scenario 2 will reduce delay by around 8 percent in the AM peak and 14 percent in the PM peak for a combined total reduction of 5000 daily vehicle-hours The long-term improvements are less than the short-term improvements due to the increase in demand
Scenarios 3 and 4 (Advanced Ramp Metering)
Scenarios 3 and 4 build on Scenarios 1 and 2 by adding advanced ramp metering system such as dynamic or adaptive ramp metering system
The 2006 model shows that Scenario 3 would reduce delay by an additional 850 daily vehicle-hours (or 11 percent) in the PM peak with a marginal reduction in the AM peak period However in conjunction with Scenario 1 Scenario 3 reduces delay in total by over 600 vehicle-hours in the AM peak These results suggest that queue control provides additional benefits beyond SWARM
The 2020 model estimates that Scenario 4 will modestly reduce delay by about 2 percent in both the AM and PM peaks or a combined total of 800 daily vehicle-hours Again the benefits are lower in percentage terms due to the increase in demand
Note that there are various types of advanced ramp metering systems deployed around the world including System-wide Adaptive Ramp Metering System or SWARM tested recently in Los Angeles I-210 freeway corridor For the I-210 model the Asservissement Lineaire drsquoEntreacutee Autoroutiere (ALINEA system) was tested as proxy for any advanced ramp metering system as its algorithm for the model was readily available It is not necessarily recommended that ALINEA be deployed but rather some type of advanced ramp metering system that would produce similar if not better results
Scenarios 5 and 6 (Auxiliary Lane Striping Ramp Improvements)
Scenarios 5 and 6 build on Scenarios 3 and 4 that include several relatively lower-cost operational improvements that could be implemented by 2015
diams Building a westbound auxiliary lane from Santa Anita to Baldwin and an eastbound auxiliary lane from Santa Anita to Huntington
diams Extending a lane to Lincoln on the westbound I-210 connector
diams Connecting and converging the Altadena on-ramps into a single on-ramp
I-210 Corridor System Management Plan Executive Summary
Page 33 of 39
diams Connecting and converging the Santa Anita on-ramps into a single on-ramp
diams Connecting and converging the Irwindale on-ramps into a single on-ramp
diams Restriping to add a lane in the eastbound direction from San Dimas to Fruit
The 2006 model shows that Scenario 5 reduces delay by 3 percent (nearly 400 vehicleshyhours) in the AM peak and 18 percent (1200 vehicle-hours) in the PM peak The segment that experienced the largest improvement in the eastbound during the PM peak was from Rosemead to Huntington This segment experienced a 45 percent improvement in delay (from 2700 vehicle-hours to 1500 vehicle-hours) which is likely attributed to the eastbound auxiliary lane from Santa Anita to Huntington In the westbound direction the auxiliary lane from Santa Anita to Baldwin shifts some traffic downstream to cause increased congestion at Michillinda (ie bottleneck shift) during the westbound AM peak However the auxiliary lane helps reduce both queue length and queue duration for the Santa Anita bottleneck
The 2020 model estimates that Scenario 6 would reduce delay by 8 percent in the AM peak and 5 percent in the PM peak for a total reduction of 2500 daily vehicle-hours A reduction in PM delay is expected to occur mostly in the westbound direction
Scenarios 7 and 8 (Ramp Closures)
Scenarios 7 and 8 build on Scenarios 5 and 6 and test the closure of several ramps
diams Eastbound Marengo on-ramp and westbound Lake on-ramp with signalization of the eastbound I-210 off-ramp at Maple and improvement to alternate routes along Corson and Maple
diams Eastbound Mount Olive ramps
Note that subsequent scenarios are not built on top of these scenarios as these are isolated to test ramp closure alternatives
The 2006 model shows that Scenario 7 would reduce delay significantly by 16 percent in the AM peak and 18 percent in the PM peak for a total delay reduction of nearly 3000 daily vehicle-hours The delay reductions are significant on the mainline during the peak direction of travel ndash 1400 vehicle-hours in the westbound AM and 912 vehicleshyhours in the eastbound PM In the westbound direction and AM peak period the segment from Altadena to Lake experienced over an 85 percent decrease in congestion (from 860 to 120 vehicle-hours of delay) This is likely attributed to the closure of the westbound Lake on-ramp In the eastbound direction and PM peak period the segment from Huntington to I-605 experienced a delay reduction of over 70 percent (from 2200
I-210 Corridor System Management Plan Executive Summary
Page 34 of 39
vehicle-hours to 600 vehicle-hours) which is likely attributed to the closure of the Mount Olive ramp
The 2020 model also shows that Scenario 8 improved delay by 12 percent in the AM and 3 percent in the PM for a total delay reduction of almost 3000 daily vehicle-hours On the mainline facility delay also improved for each peak direction of travel ndash by 1600 daily vehicle-hours in the westbound AM and by 750 vehicle-hours in the eastbound PM Delay reductions in the non-peak direction were not as significant
Scenarios 9 and 10 (On-ramp and Aux Lane Improvements)
Scenarios 9 and 10 build on Scenarios 5 and 6 and test four operational improvements that can be implemented in the short to medium range
diams Modify the RosemeadMichillinda interchange and converge the westbound I-210 on-ramps
diams Modify the northside of the Baldwin interchange and eliminate the collectorshydistributor
diams Construct an eastbound auxiliary lane from Azusa to Citrus
diams Converge the eastbound Citrus on-ramps and add an auxiliary lane to Grand
The 2006 model estimates that Scenario 9 will reduce delay by 20 percent (or 2400 daily vehicle-hours) in the AM peak and 28 percent (or 1600 daily vehicle-hours) in the PM peak compared to Scenario 5 In both AM and PM peak period the eastbound direction experienced the largest reduction in delay
The 2020 model estimates that Scenario 10 will reduce delay by 13 percent (or 2500 vehicle-hours) in the AM peak and 28 percent in the PM peak (or 4800 vehicle-hours) compared to Scenario 6 Similar to the 2006 model the 2020 model shows that these improvements produced a greater reduction in delay in the eastbound direction than the westbound direction
Scenarios 11 and 12 (Enhanced Incident Management)
Two incident scenarios were tested on top of Scenario 10 to evaluate the non-recurrent delay reductions resulting from enhanced incident management strategies An enhanced incident management system would entail upgrading or enhancing the current Caltrans incident management system that includes deployment of intelligent transportation system (ITS) field devices central controlcommunications software communications medium (ie fiber optic lines) advanced traveler information system
I-210 Corridor System Management Plan Executive Summary
Page 35 of 39
andor freeway service patrol (FSP) program to reduce incident detection verification response and clearance times
In the first scenario Scenario 11 one collision incident with one lane closure was simulated in the westbound direction in the AM peak period model and one in the eastbound direction in the PM peak period model The incident simulation location and duration were selected based on review of the 2010 actual incident data at one of the high frequency locations The following are the Scenario details
diams Westbound AM peak period starting at 800 AM close mainline lane 2 for 40 minutes at absolute post mile 2612 (at Lake Avenue)
diams Eastbound PM peak period starting at 500 PM close mainline lane 2 for 50 minutes at absolute post mile 3207 (west of Santa Anita)
In the second scenario Scenario 12 the same collision incidents were simulated with a reduction in duration by 10 minutes in the westbound direction and by 12 minutes in the eastbound direction It is estimated based on actual incident management data analysis results provided by Caltrans that an enhanced incident management system could reduce a 35-minute incident by about 10 minutes This scenario represents a typical moderate level incident at one location during the peak period direction Data suggest that incidents vary significantly in terms of impact and duration Some incidents last hundreds of minutes some close multiple lanes and some occur at multiple locations simultaneously There are also numerous minor incidents lasting only a few minutes without lane closures that can result in congestion Many other incidents also occur during off-peak hours
Without enhanced incident management Scenario 11 produced an 8 percent increase in congestion in both peak periods over Scenario 10 an increase of over 2300 hours of vehicle delay With enhanced incident management Scenario 12 evaluation resulted in delay decrease by 2 percent in the AM peak and 3 percent in the PM peak against Scenario 11 results a reduction of nearly 750 vehicle-hours for improving the incident detection verification response and clearance time of one moderate level incident for both of the peak hours
Scenario 13 (SR-134I-210 Interchange Modification)
Scenario 13 tests an improvement to modify the SR-134I-210 interchange to provide a direct connection for vehicles to continue on I-210 with three lanes in each direction This improvement was tested with the 2020 model since it is not likely to be implemented in the short-term
I-210 Corridor System Management Plan Executive Summary
Page 36 of 39
The 2020 model estimates that delay would be reduced by 11 percent (or 1800 daily vehicle-hours) in the AM and 3 percent in the PM (320 daily vehicle-hours) compared to Scenario 10 The westbound mainline experienced the greatest reduction in delay in the AM peak from 9600 vehicle-hours to 8600 vehicle hours after the interchange modification
Scenario 14 (Westbound Drop Ramp and Eastbound Widening)
Scenario 14 builds on Scenario 13 and tests Lake Avenue drop ramp to westbound Ishy210 center lanes (one HOV lane and one mainline) and eastbound I-210 widening from Myrtle to I-605 This improvement was tested with the 2020 model
The 2020 model estimates that delay would be reduced by about 20 percent in the AM or 3400 vehicle-hours and 20 percent in the PM or 2300 vehicle-hours compared to Scenario 13 The mobility improvements are significant with the westbound drop ramp that reduces weaving between SR-134 and SR-210 destined traffic and with the eastbound capacity addition to I-605 off that moves the off-ramp traffic away from the mainline and provides more room for the mainline through traffic
Post Scenario 14 Conditions
By 2020 with the inclusion of all the projects tested the model reveals some residual congestion that remains to address with future improvements According to the model results the total remaining delay on the corridor is around 21000 daily vehicle-hours
Benefit-Cost Analysis
Following an in-depth review of model results by the study team and the SCAG technical committee the study team performed a benefit-cost analysis (BCA) for each scenario
Using the California Benefit-Cost Model (Cal-BC) developed on behalf of Caltrans by the study team benefits in three key areas were estimated travel time savings vehicle operating cost savings and emission reduction savings The benefits generated from this exercise are based solely on congestion relief related benefits However these results are conservative since there are other benefits not captured by this analysis including benefits from deploying bus rapid transit which will achieve other accessibility benefits
Project costs were developed from SCAG and Caltrans project planning and programming documents These costs include construction and support costs in current dollars The study team estimated costs for projects that did not have cost
I-210 Corridor System Management Plan Executive Summary
Page 37 of 39
estimates by reviewing similar completed projects A BC greater than one means that a scenarios projects return greater benefits than it costs to construct or implement It is important to consider the total benefits that a project brings For example a large capital expansion project can cost a great deal and have a low BC ratio but brings much higher absolute benefits to the I-210 users Exhibit ES-29 shows the benefit to cost ranges classified from low (with a BC of one to two) to very high (with a BC of over 10)
The benefit-cost results for the South Corridor scenarios are shown in Exhibit ES-29
Exhibit ES-29 I-210 Scenario BenefitCost (BC) Results
Scenario Scenario Description
BenefitCost Ranges
Low Medium Medium-High High Very High
lt1 1 to 2 2 to 5 5 to 10 gt10
12 Expand Ramp Metering 34 Advanced Ramp Metering 56 Aux Lane Striping Ramp Improvs 78 Ramp Closures
910 On-Ramp amp Aux Lane Improvs 13 SR-134I-210 IC Modification
The benefit-cost findings for each scenario are as follows
diams Scenarios 1 and 2 (ramp metering expansion) shows a high benefit-cost ratio of over ten The relatively high benefit-cost ratio is due to the low cost of expanding ramp metering ($235 million)
diams Scenarios 3 and 4 (advanced ramp metering) resulted in an incremental benefitshycost ratio of over ten This is relatively high as compared to that of typical transportation management system project
diams Scenarios 5 and 6 (operational improvements) produced a benefit-cost ratio of over five This is relatively consistent with other typical operational improvement projects The benefits are substantial At estimated total cost of about $44 million these projects produced benefits of over $233 million
diams Scenarios 7 and 8 tested the ramp closures at eastbound Marengo westbound Lake and eastbound Mount Olive These ramp closured produced an extremely high incremental benefit-cost ratio of over ten due to the relatively very low cost However this benefit-cost calculation does not account for any potential increase in delay on various local arterials because of detours from the closed ramps
diams Scenarios 9 and 10 also produced a relatively high benefit-cost ratio of over ten The four operational projects in these scenarios are collectively estimated to cost
I-210 Corridor System Management Plan Executive Summary
Page 38 of 39
under $30 million and provide a substantial and optimistic benefit of over $670 million
diams Scenario 13 tested the SR-134I-210 interchange modification This project produced a benefit-cost ratio of between one and two consistent with other typical capital expansion projects This project produced benefits of over $200 million at a rough-estimate cost of about $150 million
diams Scenario 14 tested the westbound center drop ramp from Lake Avenue interchange and eastbound lane addition from Myrtle to I-605 These projects produced a relatively high benefit-cost ratio of about 6 to one as compared to other capital improvement projects These two capital projects are unique in that they have specific operational improvement element that addresses major bottleneck locations For an estimated total combined cost of about $70 million the projected benefits exceed $420 million
CONCLUSIONS AND RECOMMENDATIONS
This section summarizes the conclusions and recommendations based on the analysis discussed in the previous section It is important to note that many of these conclusions are based primarily on the micro-simulation model results The model was developed based on the best data available at the time The study team reviewed the model results and believe that both the calibrated base year forecast year and scenario results are reasonable However Caltrans should always be cautious to make decisions based on modeling alone especially complex micro-simulation models
Based on the results the study team offers the following conclusions and recommendations
diams The combination of all scenarios significantly reduces overall congestion on the corridor Projected 2020 congestion after implementation of all scenarios is below 2006 levels in both the AM and PM peak period In the AM peak period the model projects total delay in 2020 after delivering all projects to be less than 11700 vehicle-hours compared to the 2006 base year delay of 13000 vehicleshyhours This represents a reduction of over 10 percent In the PM peak period the model projects total delay in 2020 after delivering all projects to be around 9500 hours compared to the 2006 base year delay of almost 9300 vehicle-hours This represents a slight reduction of 2 percent Clearly the scenarios deliver significant mobility benefits to the corridor Despite the growth in demand future 2020 congestion will be less than experienced in 2006
diams The completed ramp metering expansion project is expected to produce substantial mobility benefits of over $400 million Delay has been significantly reduced since 2006
I-210 Corridor System Management Plan Executive Summary
Page 39 of 39
diams Advanced ramp metering could provide additional mobility improvements by significantly reducing congestion and returning over $100 million in benefits
diams Ramp closures at Marengo Lake and Mount Olive as alternatives seem promising by reducing delay up to 3000 vehicle-hours per day and providing substantial benefits of $280 million at an extremely low cost
diams Operational improvements such as auxiliary lanes and ramp improvements could leverage on the ramp metering projects by making the corridor more efficient and productive that could result in additional mobility benefits of over $230 million
diams Additional capital improvements with specific operational elements to address weaving at major bottleneck locations could produce significant mobility benefits of over $420 million
diams Enhanced incident management system associated with Scenarios 11 and 12 to address non-recurrent congestion proved effective with a delay reduction of over 300 vehicle-hours for one modest level incident with a typical duration of 35 minutes reduced to 25 minutes With the I-210 corridor experiencing up to 2400 collisions per year this translates to a total annual delay savings of over 700000 vehicle-hours for the study corridor
diams The benefit-cost ratio of all scenarios combined is about 64 to 1 If all projects were delivered at current cost estimates the public would get over six dollars of benefits for each dollar expended In current dollars costs total to over $17 billion whereas the benefits are estimated to be over $20 billion
diams The projects also alleviate greenhouse gas (GHG) emissions by over 15 million tons over 20 years averaging over a 75000-ton reduction per year The emissions are estimated using data from the California Air Resources Board (CARB) EMFAC model
This is the first generation CSMP for the I-210 corridor It is important to stress that CSMPs should be updated on a regular basis This is particularly important since traffic conditions and patterns can differ from current projections After projects are delivered it is also useful to compare actual results with estimated ones in this document so that models can be further improved as appropriate
CSMPs or a variation thereof should become the normal course of business that is based on detailed performance assessments an in-depth understanding of the reasons for performance deterioration and an analytical framework that allows for evaluating complementary operational strategies that maximize the productivity of the current system
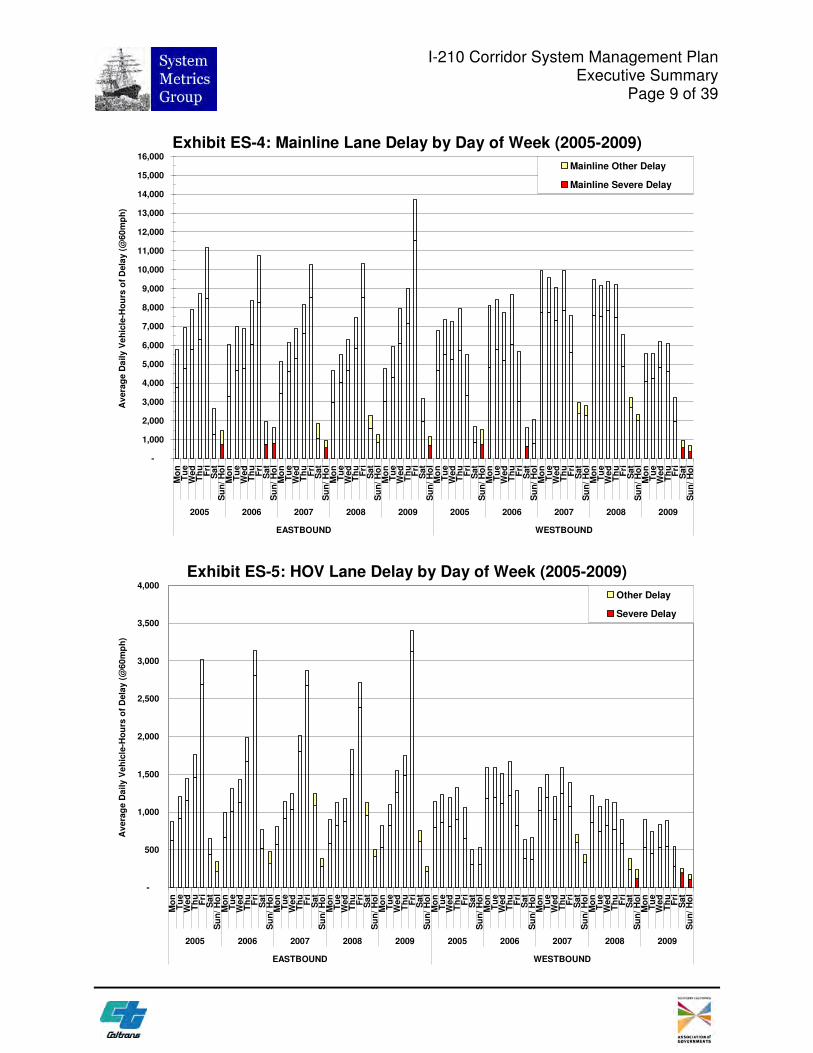
Av
era
ge D
aily V
eh
icle
-Ho
urs
of
Dela
y (
60
mp
h)
Av
era
ge D
aily V
eh
icle
-Ho
urs
of
Dela
y (
60
mp
h)
I-210 Corridor System Management Plan Executive Summary
Page 9 of 39
Exhibit ES-4 Mainline Lane Delay by Day of Week (2005-2009) 16000
15000
14000
13000
12000
11000
10000
9000
8000
7000
6000
5000
4000
3000
2000
1000
-
Mainline Other Delay
Mainline Severe Delay M
on
T
ue
Wed
T
hu
F
riS
at
Su
n
Ho
lM
on
Tu
eW
ed
Th
uF
riS
at
Su
n
Ho
lM
on
Tu
eW
ed
Th
uF
riS
at
Su
n
Ho
lM
on
Tu
eW
ed
Th
uF
riS
at
Su
n
Ho
lM
on
Tu
eW
ed
Th
uF
riS
at
Su
n
Ho
lM
on
Tu
eW
ed
Th
uF
riS
at
Su
n
Ho
lM
on
Tu
eW
ed
Th
uF
riS
at
Su
n
Ho
lM
on
Tu
eW
ed
Th
uF
riS
at
Su
n
Ho
lM
on
Tu
eW
ed
Th
uF
riS
at
Su
n
Ho
lM
on
Tu
eW
ed
Th
uF
riS
at
Su
n
Ho
l
2005 2006 2007 2008 2009 2005 2006 2007 2008 2009
EASTBOUND WESTBOUND
Exhibit ES-5 HOV Lane Delay by Day of Week (2005-2009) 4000
3500
3000
2500
2000
1500
1000
500
-
Mo
nT
ue
Wed
Th
uF
riS
at
Su
n
Ho
lM
on
Tu
eW
ed
Th
uF
riS
at
Su
n
Ho
lM
on
Tu
eW
ed
Th
uF
riS
at
Su
n
Ho
lM
on
Tu
eW
ed
Th
uF
riS
at
Su
n
Ho
lM
on
Tu
eW
ed
Th
uF
riS
at
Su
n
Ho
lM
on
Tu
eW
ed
Th
uF
riS
at
Su
n
Ho
lM
on
Tu
eW
ed
Th
uF
riS
at
Su
n
Ho
lM
on
Tu
eW
ed
Th
uF
riS
at
Su
n
Ho
lM
on
Tu
eW
ed
Th
uF
riS
at
Su
n
Ho
lM
on
Tu
eW
ed
Th
uF
riS
at
Su
n
Ho
l
2005 2006 2007 2008 2009 2005 2006 2007 2008 2009
EASTBOUND WESTBOUND
Other Delay
Severe Delay
I-210 Corridor System Management Plan Executive Summary
Page 10 of 39
Exhibits ES-6 and ES-7 summarize average annual weekday delay by hour of the day over the five-year period for the mainline northbound and southbound lanes respectively These exhibits allow planners and decision makers to understand the trend in peak period delay spiking and peak period spreading by comparing the intensity and duration of the peak period congestion Note that the HOV lanes are not shown in this summary report since they follow similar peaking trends as the mainline lanes (the main technical report contains the HOV delay by hour results) A few notes on these two exhibits
diams The eastbound direction peaks in the PM peak period while the AM is the westbound peak AM peak hour is 700 AM while the PM peak period is 500 PM
diams In the eastbound PM direction congestion grew dramatically in 2009 while westbound AM congestion declined This is also evident in Exhibit ES-2 Eastbound delay between 2005 and 2008 remained relatively constant at about 1750 vehicle-hours during the 500 PM peak hour before increasing in 2009 to about 2100 vehicle-hours
diams Westbound AM congestion declined in 2009 after two years of dramatic growth between 2007 and 2008 In 2009 the AM peak period also shrank by approximately one-half hour and started at approximately 530 AM whereas from 2005 to 2008 the peak period started around 500 AM
Exhibit ES-6 Eastbound Mainline Lanes Hourly Delay (2005-2009)
0
250
500
750
1000
1250
1500
1750
2000
2250
2500
Ave
rag
e D
ail
y V
eh
icle
Ho
urs
of
Dela
y (
60
mp
h) 2009 Weekday
2008 Weekday
2007 Weekday
2006 Weekday
2005 Weekday
00
0
10
0
20
0
30
0
40
0
50
0
60
0
70
0
80
0
90
0
100
0
110
0
120
0
130
0
140
0
150
0
160
0
170
0
180
0
190
0
200
0
210
0
220
0
230
0
Hour of the Day
I-210 Corridor System Management Plan Executive Summary
Page 11 of 39
Exhibit ES-7 Westbound Mainline Lanes Hourly Delay (2005-2009)
0
250
500
750
1000
1250
1500
1750
2000
2250
2500
Ave
rag
e D
ail
y V
eh
icle
Ho
urs
of
Dela
y (
60m
ph
) 2009 Weekday
2008 Weekday
2007 Weekday
2006 Weekday
2005 Weekday
00
0
10
0
20
0
30
0
40
0
50
0
60
0
70
0
80
0
90
0
100
0
110
0
120
0
130
0
140
0
150
0
160
0
170
0
180
0
190
0
200
0
210
0
220
0
230
0
Hour of the Day
Travel Time
The travel time performance measure represents the average time it takes for a vehicle to travel between SR-134 and SR-57 a distance of approximately 20 miles
Exhibits ES-8 and ES-9 summarize mainline estimated average weekday travel times by hour of day for the 2005-2009 five-year period Exhibits ES-10 and ES-11 show the same results for the HOV facility Similar to delay travel times increased in 2009 in the eastbound PM direction and time but decreased in the westbound AM commute period
In the mainline lanes the eastbound PM peak hour (500 PM) travel time grew from 40 minutes in 2008 to 44 minutes in 2009 In the westbound AM peak hour (700 AM) the opposite trend occurred with travel times dropping from a 41 minute average in 2008 to around 36 minutes in 2009
A similar trend occurred for the HOV lanes except that 2005 was the worst year in terms of travel times
Tra
ve
l T
ime
(m
inu
tes
) T
rav
el
Tim
e (
min
ute
s)
45
40
35
30
25
20
15
10
5
0
45
40
35
30
25
20
15
10
5
0
I-210 Corridor System Management Plan Executive Summary
Page 12 of 39
Exhibit ES-8 Eastbound Mainline Lanes Travel Time by Hour (2005-2009) 50
2009 Average Travel Time
2008 Average Travel Time
2007 Average Travel Time
2006 Average Travel Time
2005 Average Travel Time
Travel Time 60mph
Travel Time 35mph
Hour of the Day
00
0
10
0
20
0
30
0
40
0
50
0
60
0
70
0
80
0
90
0
100
0
110
0
120
0
130
0
140
0
150
0
160
0
170
0
180
0
190
0
200
0
210
0
220
0
Hour of the Day
Exhibit ES-9 Westbound Mainline Lanes Travel Time by Hour (2005-2009) 50
2009 Average Travel Time
2008 Average Travel Time
2007 Average Travel Time
2006 Average Travel Time
2005 Average Travel Time
Travel Time 60mph
Travel Time 35mph
00
0
10
0
20
0
30
0
40
0
50
0
60
0
70
0
80
0
90
0
10
00
11
00
12
00
13
00
14
00
15
00
16
00
17
00
18
00
19
00
20
00
21
00
22
00
230
0
23
00
Tra
ve
l T
ime
(m
inu
tes
) T
rav
el
Tim
e (
min
ute
s)
45
40
35
30
25
20
15
10
5
0
45
40
35
30
25
20
15
10
5
0
I-210 Corridor System Management Plan Executive Summary
Page 13 of 39
Exhibit ES-10 Eastbound HOV Lanes Travel Time by Hour (2005-2009) 50
2009 Average Travel Time
2008 Average Travel Time
2007 Average Travel Time
2006 Average Travel Time
2005 Average Travel Time
Travel Time 60mph
Travel Time 35mph
Hour of the Day
00
0
10
0
20
0
30
0
40
0
50
0
60
0
70
0
80
0
90
0
100
0
110
0
120
0
130
0
140
0
150
0
160
0
170
0
180
0
190
0
200
0
210
0
220
0
Hour of the Day
Exhibit ES-11 Westbound HOV Lanes Travel Time by Hour (2005-2009) 50
2009 Average Travel Time
2008 Average Travel Time
2007 Average Travel Time
2006 Average Travel Time
2005 Average Travel Time
Travel Time 60mph
Travel Time 35mph
00
0
10
0
20
0
30
0
40
0
50
0
60
0
70
0
80
0
90
0
100
0
110
0
120
0
130
0
140
0
150
0
160
0
170
0
180
0
190
0
200
0
210
0
220
0
230
0
230
0
I-210 Corridor System Management Plan Executive Summary
Page 14 of 39
Reliability
Reliability captures the degree of predictability in travel time Reliability focuses on how travel time varies from day to day and reflects the impacts of accidents incidents weather and special events Improving reliability is an important goal for transportation agencies and efforts to accomplish this include incident management traveler information and special event planning
To measure reliability the CSMP used the ldquobuffer indexrdquo which reflects the additional time required (over and beyond the average) to ensure an on-time arrival 95 percent of the time In other words if a person must be on time 95 days out of 100 (or 19 out of 20 workdays per month) then that person must add additional time to their average expected travel time to ensure an on-time arrival That additional time is the buffer time Severe events such as collisions could cause longer travel times but the 95th percentile represents a balance between days with extreme events (eg major accidents) and other more ldquotypicalrdquo travel days
Exhibits ES-12 and ES-13 show the estimated mainline lane travel time variability along I-210 on non-holiday weekdays for 2006 in the eastbound and westbound directions respectively The main report shows the buffer index for the years 2005-2009 for both mainline and HOV lanes but this Executive Summary reports only the data for the year 2006 for mainlines since that year was used as the base year for modeling
The following observations on the reliability results are worth noting
bull In 2006 in the eastbound direction 500 PM had the highest estimated average travel time at approximately 41 minutes and the highest estimated buffer index time of 15 minutes for a buffer index of 33 percent In other words to arrive on time 95 percent of the time a commuter would need to leave for work 56 minutes before the start time to travel the entire length of the I-210 study corridor
bull The westbound direction the 700 AM had the estimated average travel time of 39 minutes in 2006 with a buffer time of 15 minutes for a buffer index of 38 percent
70
65
60
55
50
45
40
35
30
25
20
15
10
5
0
70
65
60
55
50
45
40
35
30
25
20
15
10
5
0
Average Travel Time
Travel Time Variability (95th Percentile)
Travel Time at 60mph
Travel Time at 35mph
TIME OF DAY
Exhibit ES-13 Westbound Mainline Lanes Travel Time Variability (2006)
75
TIME OF DAY
Average Travel Time
Travel Time Variability (95th Percentile)
Travel Time at 60mph
Travel Time at 35mph
Exhibit ES-12 Eastbound Mainline Lanes Travel Time Variability (2006)
75
I-210 Corridor System Management Plan Executive Summary
Page 15 of 39
TR
AV
EL
TIM
E (
MIN
)
00
000
0
10
010
0
TR
AV
EL
TIM
E (
MIN
)
20
020
0
30
030
0
40
040
0
50
050
0
60
060
0
70
070
0
80
080
0
90
090
0
100
01
00
0
110
01
10
0
120
01
20
0
130
01
30
0
140
01
40
0
150
01
50
0
160
01
60
0
170
01
70
0
180
01
80
0
190
01
90
0
200
02
00
0
210
02
10
0
220
02
20
0
230
02
30
0
00
0
00
0
I-210 Corridor System Management Plan Executive Summary
Page 16 of 39
Safety
The adopted performance measures to assess safety involve the number of accidents and the accident rates computed from the Caltrans Traffic Accident Surveillance and Analysis System (TASAS) TASAS is a traffic records system containing an accident database linked to a highway database The highway database contains descriptive elements of highway segments intersections and ramps access control traffic volumes and other data TASAS contains specific data for accidents on State highways Accidents on non-State highways are not included (eg local streets and roads)
The safety assessment in this report intends to characterize the overall accident history and trends in the corridor and to highlight notable accident concentration locations or patterns that are readily apparent This report does not intend to supplant more detailed safety investigations routinely performed by Caltrans staff
Exhibits ES-14 and ES-15 show the I-210 total number of eastbound and westbound accidents by month respectively For the accident analysis the corridor is split in half the ldquoless urbanrdquo western half of the corridor from I-5 (postmile 0) in Sylmar to SR-134 in Pasadena (postmile R2200) and the ldquomore urbanrdquo eastern half from SR-134 to SR-57 (postmile R45) in San Dimas The latest available TASAS data from PeMS is to December 30 2008 Accidents are reported for the study corridor and not separated by mainline and HOV facility The exhibits summarize the latest available three-year data from January 1 2006 through December 31 2008
Both the eastbound and westbound directions have similar accident profiles with the more urbanized eastern half of the corridor (postmile R22 to R45) experiencing nearly 45 times as many accidents as the western half (PM 0 to R22) The eastbound (Exhibit ES-13) direction has around 79 accidents on average per month in the more-urbanized section and just fewer than 18 accidents in the less-urbanized section
The westbound direction has just fewer than 78 accidents on average per month in the more-urbanized section and just fewer than 18 in the less-urbanized section This is very similar to the eastbound direction
Nu
mb
er
of
Ac
cid
en
ts
Nu
mb
er
of
Accid
en
ts
I-210 Corridor System Management Plan Executive Summary
Page 17 of 39
Exhibit ES-14 Eastbound I-210 Monthly Collisions (2004-2008) 120
110
100
90
80
70
60
50
40
30
20
10
0
Jan
Feb
Mar
Ap
rM
ay
Ju
nJu
lA
ug
Sep
Oct
No
vD
ec
Jan
Feb
Mar
Ap
rM
ay
Ju
nJu
lA
ug
Sep
Oct
No
vD
ec
Jan
Feb
Mar
Ap
rM
ay
Ju
nJu
lA
ug
Sep
Oct
No
vD
ec
Jan
Feb
Mar
Ap
rM
ay
Ju
nJu
lA
ug
Sep
Oct
No
vD
ec
Jan
Feb
Mar
Ap
rM
ay
Ju
nJu
lA
ug
Sep
Oct
No
vD
ec
2004 2005 2006 2007 2008
Less Urbanized Western Section (I-5 to SR-134)
More Urbanized Eastern Section (SR-134 to SR-57)
110
100
90
80
70
60
50
40
30
20
10
0
Exhibit ES-15 Westbound I-210 Monthly Collisions (2004-2008) 120
Jan
Feb
Mar
Ap
rM
ay
Ju
nJu
lA
ug
Sep
Oct
No
vD
ec
Jan
Feb
Mar
Ap
rM
ay
Ju
nJu
lA
ug
Sep
Oct
No
vD
ec
Jan
Feb
Mar
Ap
rM
ay
Ju
nJu
lA
ug
Sep
Oct
No
vD
ec
Jan
Feb
Mar
Ap
rM
ay
Ju
nJu
lA
ug
Sep
Oct
No
vD
ec
Jan
Feb
Mar
Ap
rM
ay
Ju
nJu
lA
ug
Sep
Oct
No
vD
ec
2004 2005 2006 2007 2008
Less Urbanized Western Section (I-5 to SR-134)
More Urbanized Eastern Section (SR-134 to SR-57)
I-210 Corridor System Management Plan Executive Summary
Page 18 of 39
Productivity
Productivity is a system efficiency measure used to analyze the throughput of the corridor during congested conditions Restoring lost productivity is one focus area of CSMPs
Exhibit ES-16 illustrates how congestion leads to lost productivity The exhibit uses observed I-210 data from sensors for a typical spring 2010 afternoon peak period (Thursday May 6 2010) It shows speeds (red line) and flow rates (blue line) on eastbound I-210 at Huntington Drive one of the most congested locations on the corridor
Flow rates (measured as vehicle-per-hour-per-lane or ldquovphplrdquo) at Huntington Drive averaged around 1800 vphpl between 200 PM and 300 PM Once volumes approach a maximum flow rate of around 2000 vphl traffic becomes unstable Any additional merging or weaving traffic breaks down and speeds can rapidly plummet to below 35 mph In essence every incremental merge takes up two spots on the freeway for a short time However since the volume is close to the capacity these merges lead to queues Moreover rather than accommodating the same number of vehicles flow rates also drop and vehicles back up creating bottlenecks and associated congestion
At the location shown in Exhibit ES-16 throughput drops by over 30 percent on average during the peak period (from over 1800 to around 1200 vphpl) This five-lane road therefore operates as if lost 30 percent capacity when demand is at its highest Stated differently just when the corridor needed the most capacity it performed in the least productive manner and effectively lost lanes This loss in throughput can be aggregated and presented as ldquoEquivalent Lost-Lane-Milesrdquo
I-210 Corridor System Management Plan Executive Summary
Page 19 of 39
Exhibit ES-16 Lost Productivity Illustrated
70 2000
65
60 1750
50
55 1500
SP
EE
D
45 1250
40
35 1000
30 Speed lt35mph
750 25
20 500 I-210 EB
15 Los Angeles County Huntington
10 PM=3338 250
May 6 2010 5 VDS ID 761141
0 -
FL
OW
RA
TE
(VP
HP
L)
140
0
143
0
150
0
153
0
160
0
163
0
170
0
173
0
180
0
183
0
190
0
193
0
TIME The estimated average non-holiday weekday lost lane-miles by period and year on Ishy210 are shown Exhibits ES-17 (mainline) and ES-18 (HOV) A few notes on these two exhibits
diams The trends in the productivity losses are comparable to the delay trends The largest productivity losses occurred in the eastbound direction during the PM peak hours which is the direction and time period that experienced the most congestion
diams On the mainline facility the westbound direction experienced nearly as high productivity loses during the AM peak period
diams On the HOV lanes a greater productivity loss in the eastbound peak period is more evident
Operational strategies are critical to recovering such productivity losses These strategies include building new or extending auxiliary lanes developing more aggressive ramp metering strategies without negatively influencing the arterial network and improving incident clearance times
I-210 Corridor System Management Plan Executive Summary
Page 20 of 39
Exhibit ES-17 Mainline Daily Equivalent Lost Lane-Miles by Direction and Period (2005-09)
-
10
20
30
40
50
60
70
80
90
100
110
120
130
140
150
160
2005 2006 2007 2008 2009 2005 2006 2007 2008 2009 2005 2006 2007 2008 2009 2005 2006 2007 2008 2009
Eastbound
Westbound
AM PM Midday Night Time Period and Year
Daily
Eq
uiv
ale
nt
Lost
Lan
e-M
iles
Exhibit ES-18 HOV Daily Equivalent Lost Lane-Miles by Direction and Period (2005-09)
-
10
20
30
40
2005 2006 2007 2008 2009 2005 2006 2007 2008 2009 2005 2006 2007 2008 2009 2005 2006 2007 2008 2009
Eastbound
Westbound
AM Midday PM Night
Daily
Eq
uiv
ale
nt
Lost
Lan
e-M
iles
Time Period and Year
I-210 Corridor System Management Plan Executive Summary
Page 21 of 39
BOTTLENECK IDENTIFICATION AND CAUSALITY ANALYSIS
Exhibits ES-19 and ES-20 summarize the eastbound and westbound bottleneck locations the time period that each bottleneck is generally active and the causes of the each bottleneck Exhibits ES-21 and ES-22 are maps of the corridor showing these bottleneck locations for the AM and PM peak periods respectively
Major bottlenecks are the primary cause of congestion and lost productivity By definition a bottleneck is a condition where traffic demand exceeds the effective carrying capacity of the roadway In most cases the cause of a bottleneck is related to a sudden reduction in capacity such as a lane drop merging and weaving driver distractions a surge in demand or a combination of factors
The specific location and causality of each major I-210 bottleneck was verified by multiple field observations on separate weekdays throughout the summer fall and winter of 2009 Some bottleneck locations were videotaped to validate bottlenecks and to assist in micro-simulation model calibration
The detailed final report explains in detail the process and results of the bottleneck identification and causality analysis
I-210 Corridor System Management Plan Executive Summary
Page 22 of 39
Exhibit ES-19 I-210 Eastbound Bottleneck Locations
Abs CA Bottleneck
Location
Active
Period Causality Summary
AM PM
250 R250 Fair Oaks Heavy ramp merge
265 R265 Lake On-ramp Heavy ramp merge
286 R287 San Gabriel On-ramp Heavy ramp merge roadway curves
294 R294 Rosemead On-ramp Heavy consecutive ramp merge
330 R327 Huntington Interchange Heavy ramp merge roadway curves
366 R363 I-605 On-ramp traffic weaving with the off-ramp
400 R397 Azusa On-ramp Heavy ramp merge
408 R406 Citrus On-ramp Heavy ramp merge
450 R450 SR-57 On-ramp Heavy ramp merge and lane drop
Exhibit ES-20 I-210 Westbound Bottleneck Locations
Abs CA
Bottleneck
Location
Active
Period Causality Summary
AM PM
401 R398 Azusa On-ramp Consecutive ramp merge curves
368 R365 I-605 Off-ramp Consecutive ramp merge weaving
322 R319 Santa Anita On-ramp Heavy ramp merge roadway curves
307 R304 Baldwin On-ramp Heavy consecutive ramp merge
297 L297 Rosemead On-ramp Three consecutive ramp merges weaving
280 R281 Altadena On-ramp Heavy ramp merge
261 R261 Lake On-ramp Heavy ramp merge
Bottleneck Locations
reg --Bottleneck
Westbound
Eastbound
0 1 2
I bull I I I bull I I I Miles
HJOUAIIO fl _
I-210 Corridor System Management Plan Executive Summary
Page 23 of 39
Exhibit ES-21 I-210 Map of AM Bottleneck Locations
Bottleneck Locations
reg Bottleneck - Westbound - Eastbound
N 0 1 2
bull I I II II II I ll) Mles s
HJOUAIIO fl _
I-210 Corridor System Management Plan Executive Summary
Page 24 of 39
Exhibit ES-22 I-210 Map of PM Bottleneck Locations
I-210 Corridor System Management Plan Executive Summary
Page 25 of 39
SCENARIO DEVELOPMENT AND ANALYSIS
Fully understanding how a corridor performs and why it performs the way it does sets the foundation for evaluating potential solutions Several steps were required to develop and evaluate improvements including
diams Developing traffic models for 2006 base year and 2020 long-term demand diams Combining projects in a logical manner for modeling and testing diams Evaluating model outputs and summarizing results diams Conducting a benefit-cost assessment of scenarios
Traffic Model Development
The study team developed a traffic model using the VISSIM micro-simulation software It is important to note that micro-simulation models are complex to develop and calibrate for a large urban corridor However it is one of the only tools capable of providing a reasonable approximation of bottleneck formation and queue development Therefore such tools help quantify the impacts of operational strategies which traditional travel demand models cannot
The model was calibrated against 2006 conditions This was a resource intensive effort requiring several iterations of submittals and review cycles until the model reasonably matched bottleneck locations and relative severity Once calibration was approved a 2020 model was also developed based on SCAGrsquos travel demand model demand projections
These two models were used to evaluate different scenarios (combinations of projects) to quantify the associated congestion relief benefits and to compare total project costs against their benefits
Exhibit ES-23 depicts the network included in the model There were no parallel arterials modeled with the exception of arterials at interchanges All freeway interchanges were included as well as on-ramps and off-ramps
I-210 Corridor System Management Plan Executive Summary
Page 26 of 39
Exhibit ES-23 Micro-Simulation Model Network
I-210 Corridor System Management Plan Executive Summary
Page 27 of 39
Scenario Development Framework
The study team developed a framework for combining projects into scenarios It would be desirable to evaluate every possible combination of projects However this would have entailed thousands of model runs Instead the team combined projects based on a number of factors including
diams Projects that were fully constructed and completed from 2006 to 2010 were tested with both the 2006 and 2020 models
diams Short- and mid- term operational projects were grouped into scenarios and tested with the both the 2006 and 2020 models
diams Longer-range projects to be delivered by 2020 and beyond were used to develop scenarios to be tested with the 2020 model only
diams Alternative ramp closures were grouped into isolated scenarios (future scenarios did not build on top of these) and tested with both the 2006 and 2020 models
The study assumes that projects delivered before 2016 could reasonably be evaluated using the 2006 base year model The 2020 forecast year for the I-210 study was consistent with the SCAG 2020 regional travel demand model origin-destination matrices used to develop the 2008 Regional Transportation Plan (RTP) When SCAG updates its travel demand model and Regional Transportation Plan (RTP) it may wish to update the micro-simulation model with revised demand projections
Project lists used to develop scenarios were part from the Regional Transportation Improvement Program (RTIP) the RTP and other sources such as special studies Projects that do not directly affect mobility were eliminated For instance sound wall landscaping or minor arterial improvement projects were not evaluated since microshysimulation models cannot evaluate them
Scenario testing performed for the performed for the I-210 CSMP differed from traditional ldquoalternatives evaluationsrdquo done for Major Investment Studies (MIS) or Environmental Impact Reports (EIRs) An MIS or EIR focuses on identifying alternative solutions to address current or projected corridor problems so each alternative is evaluated separately and results among competing alternatives are compared resulting in a locally preferred alternative In contrast for the I-210 CSMP scenarios build on each other in that a scenario contains the projects from the previous scenario plus one or more projects as long as the incremental scenario results showed an acceptable level of performance improvement This incremental scenario evaluation approach is important since CSMPs are new and are often compared with alternatives studies
Exhibit ES-24 summarizes the approach used and scenarios tested and provides a
I-210 Corridor System Management Plan Executive Summary
Page 28 of 39
general description of the projects included in the 2006 and 2020 micro-simulation runs Most projects were tested for both the short- and long-term timeframes Each scenario tested was built upon prior scenarios except for Scenarios 7 and 8 which were ldquostand alonerdquo scenarios used to test alternative ramp closures Later scenarios build on Scenarios 5 and 6 and do not include the improvements tested in Scenarios 7 and 8 Enhanced incident management was tested in Scenarios 11 and 12 by comparing a simulated incident without and with enhanced incident management system Scenarios 13 and 14 are expected for the longer term and were tested only with the 2020 model
Exhibit ES-24 Micro-Simulation Modeling Approach
Short-Term Scenarios Long-Term Scenarios
Calibrated 2006 Base Case
Scenario 1 Expand Ramp-
Metering
Scenario 3 Scenario 1 +
Adv Ramp-Meter w
Queue Control
Scenario 5 Scenario 3 + aux lane striping and
ramp improvements
2020 Horizon Year
2006 Network 2020 OD Matrices
Scenario 7 Scenario 5 +
Ramp Closures
Scenario 2 Expand Ramp-
Metering
Scenario 4 Scenario 2 +
Adv Ramp-Meter w
Queue Control
Scenario 6 Scenario 4 + aux lane striping and
ramp improvements
Scenario 8 Scenario 6 +
Ramp Closures
Scenario 14 Scenario 13 + Lake
Ave Drop Ramp
Lane Addition
Scenario 9 Scenario 5+
On-Ramp amp Aux
lane improvements
Scenario 10 Scenario 6 +
On-Ramp amp Aux
lane improvements
Scenario 11 Incident with No
Incident
Management
Scenario 12 Incident With
Incident
Management
Scenario 13 Scenario 10 +
134210 IC
modification
Incident Management Scenarios
I-210 Corridor System Management Plan Executive Summary
Page 29 of 39
Scenario Evaluation Results
Exhibits ES-25 and ES-26 show the delay results for all the 2006 scenarios evaluated for the AM and PM peak periods respectively Exhibits ES-27 and ES-28 show the delay results for all the 2020 scenarios evaluated for the AM and PM peak periods respectively For each scenario the modeling team produced results by facility type (ie mainline HOV arterials and ramps) and vehicle type (SOV HOV trucks) as well as speed contour diagrams (discussed in more detail in the full technical CSMP) The study team scrutinized to ensure that they were consistent with general traffic engineering principles The following summarizes the findings related to the four exhibits
Exhibit ES-25 2006 AM Peak Micro-Simulation Delay Results by Scenario
De
lay
(Pe
ak
Pe
rio
d V
eh
icle
-Ho
urs
)
2006 Base Year S1 S3 S5 S7 S9 Scenario
18000
16000
14000
12000
10000
8000
6000
4000
2000
-
S1 Expand Ramp Metering
S3 Adv Ramp Metering
S5 Aux Lane Striping Ramp Improvs
S7 Ramp Closures
S9 On-Ramp amp Aux Lane Improvs
-2 -3 -3
-16 -20
HOV WB I-210 WB
HOV EB I-210 EB
Ramps Arterials
I-210 Corridor System Management Plan Executive Summary
Page 30 of 39
Exhibit ES-26 2006 PM Peak Micro-Simulation Delay Results by Scenario
18000
De
lay
(Pe
ak
Pe
rio
d V
eh
icle
-Ho
urs
)
16000
14000
12000
10000
8000
6000
4000
2000
-
S1 Expand Ramp Metering
S3 Adv Ramp Metering
HOV WB
I-210 WB
S5 Aux Lane Striping Ramp Improvs
S7 Ramp Closures
S9 On-Ramp amp Aux Lane Improvs
HOV EB
I-210 EB
Ramps
Arterials
-17
-11
-18
-18 -28
2006 Base Year S1 S3 S5 S7 S9 Scenario
Exhibit ES-27 2020 AM Peak Micro-Simulation Delay Results by Scenario
30000
De
lay
(Pe
ak
Pe
rio
d V
eh
icle
-Ho
urs
)
25000
20000
15000
10000
5000
S2 Expand Ramp Metering
S4 Adv Ramp Metering
S6 Aux Lane Striping Ramp Improvs
S8 Ramp Closures
HOV WB
I-210 WB
HOV EB
-8
-2 -8
-13 -12
S10 On-Ramp amp Aux Lane Improvs
S13 SR-134I-210 IC Modification
S14 Lake Ave Drop Ramp Lane Addition
I-210 EB
Ramps
Arterials
-11
-23
-
2020 S2 S4 S6 S8 S10 S13 S14 Horizon Scenario
I-210 Corridor System Management Plan Executive Summary
Page 31 of 39
Exhibit ES-28 2020 PM Peak Micro-Simulation Delay Results by Scenario D
ela
y(P
ea
k P
eri
od
Ve
hic
le-H
ou
rs)
30000
25000
20000
15000
10000
5000
-
S2 Expand Ramp Metering
S4 Adv Ramp Metering
S6 Aux Lane Striping Ramp Improvs
S8 Ramp Closures
HOV WB
I-210 WB
HOV EB
-14
S10 On-Ramp amp Aux Lane Improvs
S13 SR-134I-210 IC Modification
S14 Lake Ave Drop Ramp Lane Addition
I-210 EB
Ramps
Arterials
-2 -5 -3 -28
-3 -19
2020 S2 S4 S6 S8 S10 S13 S14 Horizon Scenario
Base Year and Do Minimum Horizon Year
Absent any physical improvements the modeling team estimates that by 2020 total delay (mainline HOV ramps and arterials) would double compared to 2006 (from a total of around 22000 vehicle-hours daily to just fewer than 45000 vehicle-hours) in the combined AM and PM peak
Scenarios 1 and 2 (Expand Ramp Metering)
Scenarios 1 and 2 test the only project on the corridor that was fully constructed and completed The project installed new connector metering at the SR-57 and I-605 to Ishy210 freeway connector ramps The project also widened various ramps removed various HOV meter bypasses and upgraded the ramp metering system
The 2006 model estimates that Scenario 1 would reduce delay on the corridor by around 17 percent (or 1600 daily vehicle-hours) in the PM peak period but only around two percent (or 200 vehicle-hours) in the AM peak period The biggest benefits occur in the PM eastbound direction from Rosemead On-Ramp to Huntington interchange (with a delay reduction of over 1000 vehicle-hours) as well as from I-605 to the Azusa On-Ramp (delay reduction of 500 vehicle-hours) for single occupant vehicles The
I-210 Corridor System Management Plan Executive Summary
Page 32 of 39
westbound reductions in freeway delay are largely offset by increased on-ramp delay mostly from new connector metering at SR-57 and I-605
The 2020 model estimates that Scenario 2 will reduce delay by around 8 percent in the AM peak and 14 percent in the PM peak for a combined total reduction of 5000 daily vehicle-hours The long-term improvements are less than the short-term improvements due to the increase in demand
Scenarios 3 and 4 (Advanced Ramp Metering)
Scenarios 3 and 4 build on Scenarios 1 and 2 by adding advanced ramp metering system such as dynamic or adaptive ramp metering system
The 2006 model shows that Scenario 3 would reduce delay by an additional 850 daily vehicle-hours (or 11 percent) in the PM peak with a marginal reduction in the AM peak period However in conjunction with Scenario 1 Scenario 3 reduces delay in total by over 600 vehicle-hours in the AM peak These results suggest that queue control provides additional benefits beyond SWARM
The 2020 model estimates that Scenario 4 will modestly reduce delay by about 2 percent in both the AM and PM peaks or a combined total of 800 daily vehicle-hours Again the benefits are lower in percentage terms due to the increase in demand
Note that there are various types of advanced ramp metering systems deployed around the world including System-wide Adaptive Ramp Metering System or SWARM tested recently in Los Angeles I-210 freeway corridor For the I-210 model the Asservissement Lineaire drsquoEntreacutee Autoroutiere (ALINEA system) was tested as proxy for any advanced ramp metering system as its algorithm for the model was readily available It is not necessarily recommended that ALINEA be deployed but rather some type of advanced ramp metering system that would produce similar if not better results
Scenarios 5 and 6 (Auxiliary Lane Striping Ramp Improvements)
Scenarios 5 and 6 build on Scenarios 3 and 4 that include several relatively lower-cost operational improvements that could be implemented by 2015
diams Building a westbound auxiliary lane from Santa Anita to Baldwin and an eastbound auxiliary lane from Santa Anita to Huntington
diams Extending a lane to Lincoln on the westbound I-210 connector
diams Connecting and converging the Altadena on-ramps into a single on-ramp
I-210 Corridor System Management Plan Executive Summary
Page 33 of 39
diams Connecting and converging the Santa Anita on-ramps into a single on-ramp
diams Connecting and converging the Irwindale on-ramps into a single on-ramp
diams Restriping to add a lane in the eastbound direction from San Dimas to Fruit
The 2006 model shows that Scenario 5 reduces delay by 3 percent (nearly 400 vehicleshyhours) in the AM peak and 18 percent (1200 vehicle-hours) in the PM peak The segment that experienced the largest improvement in the eastbound during the PM peak was from Rosemead to Huntington This segment experienced a 45 percent improvement in delay (from 2700 vehicle-hours to 1500 vehicle-hours) which is likely attributed to the eastbound auxiliary lane from Santa Anita to Huntington In the westbound direction the auxiliary lane from Santa Anita to Baldwin shifts some traffic downstream to cause increased congestion at Michillinda (ie bottleneck shift) during the westbound AM peak However the auxiliary lane helps reduce both queue length and queue duration for the Santa Anita bottleneck
The 2020 model estimates that Scenario 6 would reduce delay by 8 percent in the AM peak and 5 percent in the PM peak for a total reduction of 2500 daily vehicle-hours A reduction in PM delay is expected to occur mostly in the westbound direction
Scenarios 7 and 8 (Ramp Closures)
Scenarios 7 and 8 build on Scenarios 5 and 6 and test the closure of several ramps
diams Eastbound Marengo on-ramp and westbound Lake on-ramp with signalization of the eastbound I-210 off-ramp at Maple and improvement to alternate routes along Corson and Maple
diams Eastbound Mount Olive ramps
Note that subsequent scenarios are not built on top of these scenarios as these are isolated to test ramp closure alternatives
The 2006 model shows that Scenario 7 would reduce delay significantly by 16 percent in the AM peak and 18 percent in the PM peak for a total delay reduction of nearly 3000 daily vehicle-hours The delay reductions are significant on the mainline during the peak direction of travel ndash 1400 vehicle-hours in the westbound AM and 912 vehicleshyhours in the eastbound PM In the westbound direction and AM peak period the segment from Altadena to Lake experienced over an 85 percent decrease in congestion (from 860 to 120 vehicle-hours of delay) This is likely attributed to the closure of the westbound Lake on-ramp In the eastbound direction and PM peak period the segment from Huntington to I-605 experienced a delay reduction of over 70 percent (from 2200
I-210 Corridor System Management Plan Executive Summary
Page 34 of 39
vehicle-hours to 600 vehicle-hours) which is likely attributed to the closure of the Mount Olive ramp
The 2020 model also shows that Scenario 8 improved delay by 12 percent in the AM and 3 percent in the PM for a total delay reduction of almost 3000 daily vehicle-hours On the mainline facility delay also improved for each peak direction of travel ndash by 1600 daily vehicle-hours in the westbound AM and by 750 vehicle-hours in the eastbound PM Delay reductions in the non-peak direction were not as significant
Scenarios 9 and 10 (On-ramp and Aux Lane Improvements)
Scenarios 9 and 10 build on Scenarios 5 and 6 and test four operational improvements that can be implemented in the short to medium range
diams Modify the RosemeadMichillinda interchange and converge the westbound I-210 on-ramps
diams Modify the northside of the Baldwin interchange and eliminate the collectorshydistributor
diams Construct an eastbound auxiliary lane from Azusa to Citrus
diams Converge the eastbound Citrus on-ramps and add an auxiliary lane to Grand
The 2006 model estimates that Scenario 9 will reduce delay by 20 percent (or 2400 daily vehicle-hours) in the AM peak and 28 percent (or 1600 daily vehicle-hours) in the PM peak compared to Scenario 5 In both AM and PM peak period the eastbound direction experienced the largest reduction in delay
The 2020 model estimates that Scenario 10 will reduce delay by 13 percent (or 2500 vehicle-hours) in the AM peak and 28 percent in the PM peak (or 4800 vehicle-hours) compared to Scenario 6 Similar to the 2006 model the 2020 model shows that these improvements produced a greater reduction in delay in the eastbound direction than the westbound direction
Scenarios 11 and 12 (Enhanced Incident Management)
Two incident scenarios were tested on top of Scenario 10 to evaluate the non-recurrent delay reductions resulting from enhanced incident management strategies An enhanced incident management system would entail upgrading or enhancing the current Caltrans incident management system that includes deployment of intelligent transportation system (ITS) field devices central controlcommunications software communications medium (ie fiber optic lines) advanced traveler information system
I-210 Corridor System Management Plan Executive Summary
Page 35 of 39
andor freeway service patrol (FSP) program to reduce incident detection verification response and clearance times
In the first scenario Scenario 11 one collision incident with one lane closure was simulated in the westbound direction in the AM peak period model and one in the eastbound direction in the PM peak period model The incident simulation location and duration were selected based on review of the 2010 actual incident data at one of the high frequency locations The following are the Scenario details
diams Westbound AM peak period starting at 800 AM close mainline lane 2 for 40 minutes at absolute post mile 2612 (at Lake Avenue)
diams Eastbound PM peak period starting at 500 PM close mainline lane 2 for 50 minutes at absolute post mile 3207 (west of Santa Anita)
In the second scenario Scenario 12 the same collision incidents were simulated with a reduction in duration by 10 minutes in the westbound direction and by 12 minutes in the eastbound direction It is estimated based on actual incident management data analysis results provided by Caltrans that an enhanced incident management system could reduce a 35-minute incident by about 10 minutes This scenario represents a typical moderate level incident at one location during the peak period direction Data suggest that incidents vary significantly in terms of impact and duration Some incidents last hundreds of minutes some close multiple lanes and some occur at multiple locations simultaneously There are also numerous minor incidents lasting only a few minutes without lane closures that can result in congestion Many other incidents also occur during off-peak hours
Without enhanced incident management Scenario 11 produced an 8 percent increase in congestion in both peak periods over Scenario 10 an increase of over 2300 hours of vehicle delay With enhanced incident management Scenario 12 evaluation resulted in delay decrease by 2 percent in the AM peak and 3 percent in the PM peak against Scenario 11 results a reduction of nearly 750 vehicle-hours for improving the incident detection verification response and clearance time of one moderate level incident for both of the peak hours
Scenario 13 (SR-134I-210 Interchange Modification)
Scenario 13 tests an improvement to modify the SR-134I-210 interchange to provide a direct connection for vehicles to continue on I-210 with three lanes in each direction This improvement was tested with the 2020 model since it is not likely to be implemented in the short-term
I-210 Corridor System Management Plan Executive Summary
Page 36 of 39
The 2020 model estimates that delay would be reduced by 11 percent (or 1800 daily vehicle-hours) in the AM and 3 percent in the PM (320 daily vehicle-hours) compared to Scenario 10 The westbound mainline experienced the greatest reduction in delay in the AM peak from 9600 vehicle-hours to 8600 vehicle hours after the interchange modification
Scenario 14 (Westbound Drop Ramp and Eastbound Widening)
Scenario 14 builds on Scenario 13 and tests Lake Avenue drop ramp to westbound Ishy210 center lanes (one HOV lane and one mainline) and eastbound I-210 widening from Myrtle to I-605 This improvement was tested with the 2020 model
The 2020 model estimates that delay would be reduced by about 20 percent in the AM or 3400 vehicle-hours and 20 percent in the PM or 2300 vehicle-hours compared to Scenario 13 The mobility improvements are significant with the westbound drop ramp that reduces weaving between SR-134 and SR-210 destined traffic and with the eastbound capacity addition to I-605 off that moves the off-ramp traffic away from the mainline and provides more room for the mainline through traffic
Post Scenario 14 Conditions
By 2020 with the inclusion of all the projects tested the model reveals some residual congestion that remains to address with future improvements According to the model results the total remaining delay on the corridor is around 21000 daily vehicle-hours
Benefit-Cost Analysis
Following an in-depth review of model results by the study team and the SCAG technical committee the study team performed a benefit-cost analysis (BCA) for each scenario
Using the California Benefit-Cost Model (Cal-BC) developed on behalf of Caltrans by the study team benefits in three key areas were estimated travel time savings vehicle operating cost savings and emission reduction savings The benefits generated from this exercise are based solely on congestion relief related benefits However these results are conservative since there are other benefits not captured by this analysis including benefits from deploying bus rapid transit which will achieve other accessibility benefits
Project costs were developed from SCAG and Caltrans project planning and programming documents These costs include construction and support costs in current dollars The study team estimated costs for projects that did not have cost
I-210 Corridor System Management Plan Executive Summary
Page 37 of 39
estimates by reviewing similar completed projects A BC greater than one means that a scenarios projects return greater benefits than it costs to construct or implement It is important to consider the total benefits that a project brings For example a large capital expansion project can cost a great deal and have a low BC ratio but brings much higher absolute benefits to the I-210 users Exhibit ES-29 shows the benefit to cost ranges classified from low (with a BC of one to two) to very high (with a BC of over 10)
The benefit-cost results for the South Corridor scenarios are shown in Exhibit ES-29
Exhibit ES-29 I-210 Scenario BenefitCost (BC) Results
Scenario Scenario Description
BenefitCost Ranges
Low Medium Medium-High High Very High
lt1 1 to 2 2 to 5 5 to 10 gt10
12 Expand Ramp Metering 34 Advanced Ramp Metering 56 Aux Lane Striping Ramp Improvs 78 Ramp Closures
910 On-Ramp amp Aux Lane Improvs 13 SR-134I-210 IC Modification
The benefit-cost findings for each scenario are as follows
diams Scenarios 1 and 2 (ramp metering expansion) shows a high benefit-cost ratio of over ten The relatively high benefit-cost ratio is due to the low cost of expanding ramp metering ($235 million)
diams Scenarios 3 and 4 (advanced ramp metering) resulted in an incremental benefitshycost ratio of over ten This is relatively high as compared to that of typical transportation management system project
diams Scenarios 5 and 6 (operational improvements) produced a benefit-cost ratio of over five This is relatively consistent with other typical operational improvement projects The benefits are substantial At estimated total cost of about $44 million these projects produced benefits of over $233 million
diams Scenarios 7 and 8 tested the ramp closures at eastbound Marengo westbound Lake and eastbound Mount Olive These ramp closured produced an extremely high incremental benefit-cost ratio of over ten due to the relatively very low cost However this benefit-cost calculation does not account for any potential increase in delay on various local arterials because of detours from the closed ramps
diams Scenarios 9 and 10 also produced a relatively high benefit-cost ratio of over ten The four operational projects in these scenarios are collectively estimated to cost
I-210 Corridor System Management Plan Executive Summary
Page 38 of 39
under $30 million and provide a substantial and optimistic benefit of over $670 million
diams Scenario 13 tested the SR-134I-210 interchange modification This project produced a benefit-cost ratio of between one and two consistent with other typical capital expansion projects This project produced benefits of over $200 million at a rough-estimate cost of about $150 million
diams Scenario 14 tested the westbound center drop ramp from Lake Avenue interchange and eastbound lane addition from Myrtle to I-605 These projects produced a relatively high benefit-cost ratio of about 6 to one as compared to other capital improvement projects These two capital projects are unique in that they have specific operational improvement element that addresses major bottleneck locations For an estimated total combined cost of about $70 million the projected benefits exceed $420 million
CONCLUSIONS AND RECOMMENDATIONS
This section summarizes the conclusions and recommendations based on the analysis discussed in the previous section It is important to note that many of these conclusions are based primarily on the micro-simulation model results The model was developed based on the best data available at the time The study team reviewed the model results and believe that both the calibrated base year forecast year and scenario results are reasonable However Caltrans should always be cautious to make decisions based on modeling alone especially complex micro-simulation models
Based on the results the study team offers the following conclusions and recommendations
diams The combination of all scenarios significantly reduces overall congestion on the corridor Projected 2020 congestion after implementation of all scenarios is below 2006 levels in both the AM and PM peak period In the AM peak period the model projects total delay in 2020 after delivering all projects to be less than 11700 vehicle-hours compared to the 2006 base year delay of 13000 vehicleshyhours This represents a reduction of over 10 percent In the PM peak period the model projects total delay in 2020 after delivering all projects to be around 9500 hours compared to the 2006 base year delay of almost 9300 vehicle-hours This represents a slight reduction of 2 percent Clearly the scenarios deliver significant mobility benefits to the corridor Despite the growth in demand future 2020 congestion will be less than experienced in 2006
diams The completed ramp metering expansion project is expected to produce substantial mobility benefits of over $400 million Delay has been significantly reduced since 2006
I-210 Corridor System Management Plan Executive Summary
Page 39 of 39
diams Advanced ramp metering could provide additional mobility improvements by significantly reducing congestion and returning over $100 million in benefits
diams Ramp closures at Marengo Lake and Mount Olive as alternatives seem promising by reducing delay up to 3000 vehicle-hours per day and providing substantial benefits of $280 million at an extremely low cost
diams Operational improvements such as auxiliary lanes and ramp improvements could leverage on the ramp metering projects by making the corridor more efficient and productive that could result in additional mobility benefits of over $230 million
diams Additional capital improvements with specific operational elements to address weaving at major bottleneck locations could produce significant mobility benefits of over $420 million
diams Enhanced incident management system associated with Scenarios 11 and 12 to address non-recurrent congestion proved effective with a delay reduction of over 300 vehicle-hours for one modest level incident with a typical duration of 35 minutes reduced to 25 minutes With the I-210 corridor experiencing up to 2400 collisions per year this translates to a total annual delay savings of over 700000 vehicle-hours for the study corridor
diams The benefit-cost ratio of all scenarios combined is about 64 to 1 If all projects were delivered at current cost estimates the public would get over six dollars of benefits for each dollar expended In current dollars costs total to over $17 billion whereas the benefits are estimated to be over $20 billion
diams The projects also alleviate greenhouse gas (GHG) emissions by over 15 million tons over 20 years averaging over a 75000-ton reduction per year The emissions are estimated using data from the California Air Resources Board (CARB) EMFAC model
This is the first generation CSMP for the I-210 corridor It is important to stress that CSMPs should be updated on a regular basis This is particularly important since traffic conditions and patterns can differ from current projections After projects are delivered it is also useful to compare actual results with estimated ones in this document so that models can be further improved as appropriate
CSMPs or a variation thereof should become the normal course of business that is based on detailed performance assessments an in-depth understanding of the reasons for performance deterioration and an analytical framework that allows for evaluating complementary operational strategies that maximize the productivity of the current system
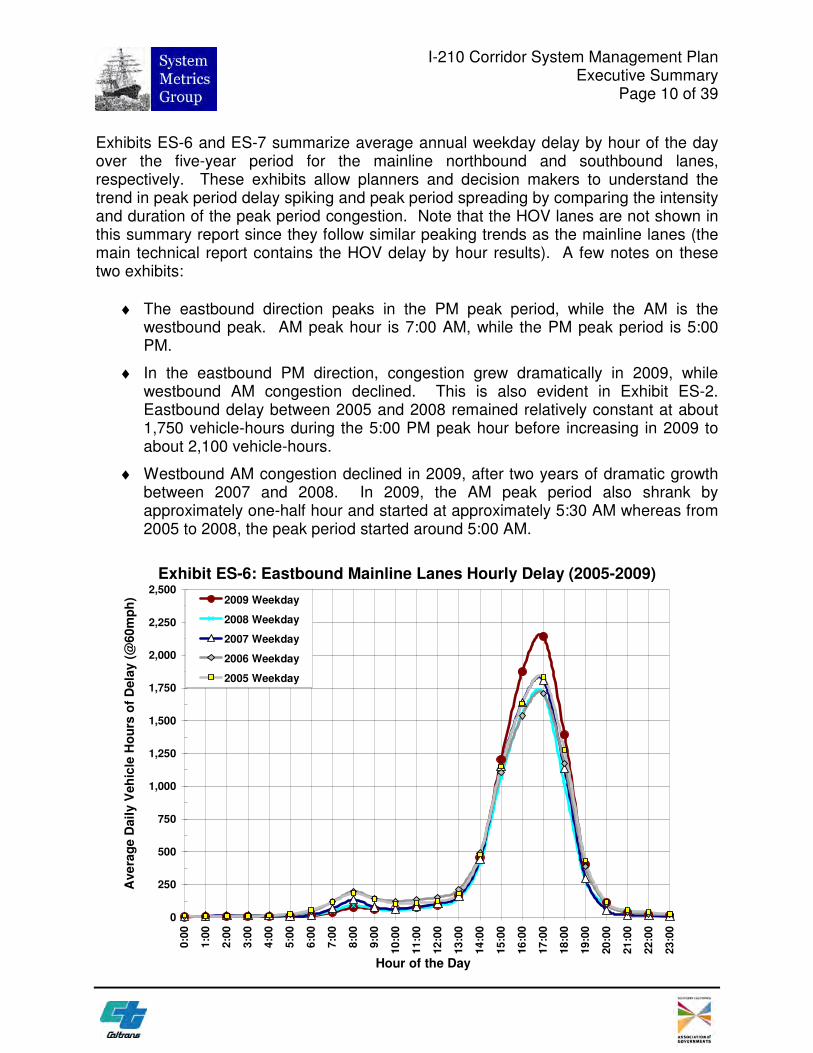
I-210 Corridor System Management Plan Executive Summary
Page 10 of 39
Exhibits ES-6 and ES-7 summarize average annual weekday delay by hour of the day over the five-year period for the mainline northbound and southbound lanes respectively These exhibits allow planners and decision makers to understand the trend in peak period delay spiking and peak period spreading by comparing the intensity and duration of the peak period congestion Note that the HOV lanes are not shown in this summary report since they follow similar peaking trends as the mainline lanes (the main technical report contains the HOV delay by hour results) A few notes on these two exhibits
diams The eastbound direction peaks in the PM peak period while the AM is the westbound peak AM peak hour is 700 AM while the PM peak period is 500 PM
diams In the eastbound PM direction congestion grew dramatically in 2009 while westbound AM congestion declined This is also evident in Exhibit ES-2 Eastbound delay between 2005 and 2008 remained relatively constant at about 1750 vehicle-hours during the 500 PM peak hour before increasing in 2009 to about 2100 vehicle-hours
diams Westbound AM congestion declined in 2009 after two years of dramatic growth between 2007 and 2008 In 2009 the AM peak period also shrank by approximately one-half hour and started at approximately 530 AM whereas from 2005 to 2008 the peak period started around 500 AM
Exhibit ES-6 Eastbound Mainline Lanes Hourly Delay (2005-2009)
0
250
500
750
1000
1250
1500
1750
2000
2250
2500
Ave
rag
e D
ail
y V
eh
icle
Ho
urs
of
Dela
y (
60
mp
h) 2009 Weekday
2008 Weekday
2007 Weekday
2006 Weekday
2005 Weekday
00
0
10
0
20
0
30
0
40
0
50
0
60
0
70
0
80
0
90
0
100
0
110
0
120
0
130
0
140
0
150
0
160
0
170
0
180
0
190
0
200
0
210
0
220
0
230
0
Hour of the Day
I-210 Corridor System Management Plan Executive Summary
Page 11 of 39
Exhibit ES-7 Westbound Mainline Lanes Hourly Delay (2005-2009)
0
250
500
750
1000
1250
1500
1750
2000
2250
2500
Ave
rag
e D
ail
y V
eh
icle
Ho
urs
of
Dela
y (
60m
ph
) 2009 Weekday
2008 Weekday
2007 Weekday
2006 Weekday
2005 Weekday
00
0
10
0
20
0
30
0
40
0
50
0
60
0
70
0
80
0
90
0
100
0
110
0
120
0
130
0
140
0
150
0
160
0
170
0
180
0
190
0
200
0
210
0
220
0
230
0
Hour of the Day
Travel Time
The travel time performance measure represents the average time it takes for a vehicle to travel between SR-134 and SR-57 a distance of approximately 20 miles
Exhibits ES-8 and ES-9 summarize mainline estimated average weekday travel times by hour of day for the 2005-2009 five-year period Exhibits ES-10 and ES-11 show the same results for the HOV facility Similar to delay travel times increased in 2009 in the eastbound PM direction and time but decreased in the westbound AM commute period
In the mainline lanes the eastbound PM peak hour (500 PM) travel time grew from 40 minutes in 2008 to 44 minutes in 2009 In the westbound AM peak hour (700 AM) the opposite trend occurred with travel times dropping from a 41 minute average in 2008 to around 36 minutes in 2009
A similar trend occurred for the HOV lanes except that 2005 was the worst year in terms of travel times
Tra
ve
l T
ime
(m
inu
tes
) T
rav
el
Tim
e (
min
ute
s)
45
40
35
30
25
20
15
10
5
0
45
40
35
30
25
20
15
10
5
0
I-210 Corridor System Management Plan Executive Summary
Page 12 of 39
Exhibit ES-8 Eastbound Mainline Lanes Travel Time by Hour (2005-2009) 50
2009 Average Travel Time
2008 Average Travel Time
2007 Average Travel Time
2006 Average Travel Time
2005 Average Travel Time
Travel Time 60mph
Travel Time 35mph
Hour of the Day
00
0
10
0
20
0
30
0
40
0
50
0
60
0
70
0
80
0
90
0
100
0
110
0
120
0
130
0
140
0
150
0
160
0
170
0
180
0
190
0
200
0
210
0
220
0
Hour of the Day
Exhibit ES-9 Westbound Mainline Lanes Travel Time by Hour (2005-2009) 50
2009 Average Travel Time
2008 Average Travel Time
2007 Average Travel Time
2006 Average Travel Time
2005 Average Travel Time
Travel Time 60mph
Travel Time 35mph
00
0
10
0
20
0
30
0
40
0
50
0
60
0
70
0
80
0
90
0
10
00
11
00
12
00
13
00
14
00
15
00
16
00
17
00
18
00
19
00
20
00
21
00
22
00
230
0
23
00
Tra
ve
l T
ime
(m
inu
tes
) T
rav
el
Tim
e (
min
ute
s)
45
40
35
30
25
20
15
10
5
0
45
40
35
30
25
20
15
10
5
0
I-210 Corridor System Management Plan Executive Summary
Page 13 of 39
Exhibit ES-10 Eastbound HOV Lanes Travel Time by Hour (2005-2009) 50
2009 Average Travel Time
2008 Average Travel Time
2007 Average Travel Time
2006 Average Travel Time
2005 Average Travel Time
Travel Time 60mph
Travel Time 35mph
Hour of the Day
00
0
10
0
20
0
30
0
40
0
50
0
60
0
70
0
80
0
90
0
100
0
110
0
120
0
130
0
140
0
150
0
160
0
170
0
180
0
190
0
200
0
210
0
220
0
Hour of the Day
Exhibit ES-11 Westbound HOV Lanes Travel Time by Hour (2005-2009) 50
2009 Average Travel Time
2008 Average Travel Time
2007 Average Travel Time
2006 Average Travel Time
2005 Average Travel Time
Travel Time 60mph
Travel Time 35mph
00
0
10
0
20
0
30
0
40
0
50
0
60
0
70
0
80
0
90
0
100
0
110
0
120
0
130
0
140
0
150
0
160
0
170
0
180
0
190
0
200
0
210
0
220
0
230
0
230
0
I-210 Corridor System Management Plan Executive Summary
Page 14 of 39
Reliability
Reliability captures the degree of predictability in travel time Reliability focuses on how travel time varies from day to day and reflects the impacts of accidents incidents weather and special events Improving reliability is an important goal for transportation agencies and efforts to accomplish this include incident management traveler information and special event planning
To measure reliability the CSMP used the ldquobuffer indexrdquo which reflects the additional time required (over and beyond the average) to ensure an on-time arrival 95 percent of the time In other words if a person must be on time 95 days out of 100 (or 19 out of 20 workdays per month) then that person must add additional time to their average expected travel time to ensure an on-time arrival That additional time is the buffer time Severe events such as collisions could cause longer travel times but the 95th percentile represents a balance between days with extreme events (eg major accidents) and other more ldquotypicalrdquo travel days
Exhibits ES-12 and ES-13 show the estimated mainline lane travel time variability along I-210 on non-holiday weekdays for 2006 in the eastbound and westbound directions respectively The main report shows the buffer index for the years 2005-2009 for both mainline and HOV lanes but this Executive Summary reports only the data for the year 2006 for mainlines since that year was used as the base year for modeling
The following observations on the reliability results are worth noting
bull In 2006 in the eastbound direction 500 PM had the highest estimated average travel time at approximately 41 minutes and the highest estimated buffer index time of 15 minutes for a buffer index of 33 percent In other words to arrive on time 95 percent of the time a commuter would need to leave for work 56 minutes before the start time to travel the entire length of the I-210 study corridor
bull The westbound direction the 700 AM had the estimated average travel time of 39 minutes in 2006 with a buffer time of 15 minutes for a buffer index of 38 percent
70
65
60
55
50
45
40
35
30
25
20
15
10
5
0
70
65
60
55
50
45
40
35
30
25
20
15
10
5
0
Average Travel Time
Travel Time Variability (95th Percentile)
Travel Time at 60mph
Travel Time at 35mph
TIME OF DAY
Exhibit ES-13 Westbound Mainline Lanes Travel Time Variability (2006)
75
TIME OF DAY
Average Travel Time
Travel Time Variability (95th Percentile)
Travel Time at 60mph
Travel Time at 35mph
Exhibit ES-12 Eastbound Mainline Lanes Travel Time Variability (2006)
75
I-210 Corridor System Management Plan Executive Summary
Page 15 of 39
TR
AV
EL
TIM
E (
MIN
)
00
000
0
10
010
0
TR
AV
EL
TIM
E (
MIN
)
20
020
0
30
030
0
40
040
0
50
050
0
60
060
0
70
070
0
80
080
0
90
090
0
100
01
00
0
110
01
10
0
120
01
20
0
130
01
30
0
140
01
40
0
150
01
50
0
160
01
60
0
170
01
70
0
180
01
80
0
190
01
90
0
200
02
00
0
210
02
10
0
220
02
20
0
230
02
30
0
00
0
00
0
I-210 Corridor System Management Plan Executive Summary
Page 16 of 39
Safety
The adopted performance measures to assess safety involve the number of accidents and the accident rates computed from the Caltrans Traffic Accident Surveillance and Analysis System (TASAS) TASAS is a traffic records system containing an accident database linked to a highway database The highway database contains descriptive elements of highway segments intersections and ramps access control traffic volumes and other data TASAS contains specific data for accidents on State highways Accidents on non-State highways are not included (eg local streets and roads)
The safety assessment in this report intends to characterize the overall accident history and trends in the corridor and to highlight notable accident concentration locations or patterns that are readily apparent This report does not intend to supplant more detailed safety investigations routinely performed by Caltrans staff
Exhibits ES-14 and ES-15 show the I-210 total number of eastbound and westbound accidents by month respectively For the accident analysis the corridor is split in half the ldquoless urbanrdquo western half of the corridor from I-5 (postmile 0) in Sylmar to SR-134 in Pasadena (postmile R2200) and the ldquomore urbanrdquo eastern half from SR-134 to SR-57 (postmile R45) in San Dimas The latest available TASAS data from PeMS is to December 30 2008 Accidents are reported for the study corridor and not separated by mainline and HOV facility The exhibits summarize the latest available three-year data from January 1 2006 through December 31 2008
Both the eastbound and westbound directions have similar accident profiles with the more urbanized eastern half of the corridor (postmile R22 to R45) experiencing nearly 45 times as many accidents as the western half (PM 0 to R22) The eastbound (Exhibit ES-13) direction has around 79 accidents on average per month in the more-urbanized section and just fewer than 18 accidents in the less-urbanized section
The westbound direction has just fewer than 78 accidents on average per month in the more-urbanized section and just fewer than 18 in the less-urbanized section This is very similar to the eastbound direction
Nu
mb
er
of
Ac
cid
en
ts
Nu
mb
er
of
Accid
en
ts
I-210 Corridor System Management Plan Executive Summary
Page 17 of 39
Exhibit ES-14 Eastbound I-210 Monthly Collisions (2004-2008) 120
110
100
90
80
70
60
50
40
30
20
10
0
Jan
Feb
Mar
Ap
rM
ay
Ju
nJu
lA
ug
Sep
Oct
No
vD
ec
Jan
Feb
Mar
Ap
rM
ay
Ju
nJu
lA
ug
Sep
Oct
No
vD
ec
Jan
Feb
Mar
Ap
rM
ay
Ju
nJu
lA
ug
Sep
Oct
No
vD
ec
Jan
Feb
Mar
Ap
rM
ay
Ju
nJu
lA
ug
Sep
Oct
No
vD
ec
Jan
Feb
Mar
Ap
rM
ay
Ju
nJu
lA
ug
Sep
Oct
No
vD
ec
2004 2005 2006 2007 2008
Less Urbanized Western Section (I-5 to SR-134)
More Urbanized Eastern Section (SR-134 to SR-57)
110
100
90
80
70
60
50
40
30
20
10
0
Exhibit ES-15 Westbound I-210 Monthly Collisions (2004-2008) 120
Jan
Feb
Mar
Ap
rM
ay
Ju
nJu
lA
ug
Sep
Oct
No
vD
ec
Jan
Feb
Mar
Ap
rM
ay
Ju
nJu
lA
ug
Sep
Oct
No
vD
ec
Jan
Feb
Mar
Ap
rM
ay
Ju
nJu
lA
ug
Sep
Oct
No
vD
ec
Jan
Feb
Mar
Ap
rM
ay
Ju
nJu
lA
ug
Sep
Oct
No
vD
ec
Jan
Feb
Mar
Ap
rM
ay
Ju
nJu
lA
ug
Sep
Oct
No
vD
ec
2004 2005 2006 2007 2008
Less Urbanized Western Section (I-5 to SR-134)
More Urbanized Eastern Section (SR-134 to SR-57)
I-210 Corridor System Management Plan Executive Summary
Page 18 of 39
Productivity
Productivity is a system efficiency measure used to analyze the throughput of the corridor during congested conditions Restoring lost productivity is one focus area of CSMPs
Exhibit ES-16 illustrates how congestion leads to lost productivity The exhibit uses observed I-210 data from sensors for a typical spring 2010 afternoon peak period (Thursday May 6 2010) It shows speeds (red line) and flow rates (blue line) on eastbound I-210 at Huntington Drive one of the most congested locations on the corridor
Flow rates (measured as vehicle-per-hour-per-lane or ldquovphplrdquo) at Huntington Drive averaged around 1800 vphpl between 200 PM and 300 PM Once volumes approach a maximum flow rate of around 2000 vphl traffic becomes unstable Any additional merging or weaving traffic breaks down and speeds can rapidly plummet to below 35 mph In essence every incremental merge takes up two spots on the freeway for a short time However since the volume is close to the capacity these merges lead to queues Moreover rather than accommodating the same number of vehicles flow rates also drop and vehicles back up creating bottlenecks and associated congestion
At the location shown in Exhibit ES-16 throughput drops by over 30 percent on average during the peak period (from over 1800 to around 1200 vphpl) This five-lane road therefore operates as if lost 30 percent capacity when demand is at its highest Stated differently just when the corridor needed the most capacity it performed in the least productive manner and effectively lost lanes This loss in throughput can be aggregated and presented as ldquoEquivalent Lost-Lane-Milesrdquo
I-210 Corridor System Management Plan Executive Summary
Page 19 of 39
Exhibit ES-16 Lost Productivity Illustrated
70 2000
65
60 1750
50
55 1500
SP
EE
D
45 1250
40
35 1000
30 Speed lt35mph
750 25
20 500 I-210 EB
15 Los Angeles County Huntington
10 PM=3338 250
May 6 2010 5 VDS ID 761141
0 -
FL
OW
RA
TE
(VP
HP
L)
140
0
143
0
150
0
153
0
160
0
163
0
170
0
173
0
180
0
183
0
190
0
193
0
TIME The estimated average non-holiday weekday lost lane-miles by period and year on Ishy210 are shown Exhibits ES-17 (mainline) and ES-18 (HOV) A few notes on these two exhibits
diams The trends in the productivity losses are comparable to the delay trends The largest productivity losses occurred in the eastbound direction during the PM peak hours which is the direction and time period that experienced the most congestion
diams On the mainline facility the westbound direction experienced nearly as high productivity loses during the AM peak period
diams On the HOV lanes a greater productivity loss in the eastbound peak period is more evident
Operational strategies are critical to recovering such productivity losses These strategies include building new or extending auxiliary lanes developing more aggressive ramp metering strategies without negatively influencing the arterial network and improving incident clearance times
I-210 Corridor System Management Plan Executive Summary
Page 20 of 39
Exhibit ES-17 Mainline Daily Equivalent Lost Lane-Miles by Direction and Period (2005-09)
-
10
20
30
40
50
60
70
80
90
100
110
120
130
140
150
160
2005 2006 2007 2008 2009 2005 2006 2007 2008 2009 2005 2006 2007 2008 2009 2005 2006 2007 2008 2009
Eastbound
Westbound
AM PM Midday Night Time Period and Year
Daily
Eq
uiv
ale
nt
Lost
Lan
e-M
iles
Exhibit ES-18 HOV Daily Equivalent Lost Lane-Miles by Direction and Period (2005-09)
-
10
20
30
40
2005 2006 2007 2008 2009 2005 2006 2007 2008 2009 2005 2006 2007 2008 2009 2005 2006 2007 2008 2009
Eastbound
Westbound
AM Midday PM Night
Daily
Eq
uiv
ale
nt
Lost
Lan
e-M
iles
Time Period and Year
I-210 Corridor System Management Plan Executive Summary
Page 21 of 39
BOTTLENECK IDENTIFICATION AND CAUSALITY ANALYSIS
Exhibits ES-19 and ES-20 summarize the eastbound and westbound bottleneck locations the time period that each bottleneck is generally active and the causes of the each bottleneck Exhibits ES-21 and ES-22 are maps of the corridor showing these bottleneck locations for the AM and PM peak periods respectively
Major bottlenecks are the primary cause of congestion and lost productivity By definition a bottleneck is a condition where traffic demand exceeds the effective carrying capacity of the roadway In most cases the cause of a bottleneck is related to a sudden reduction in capacity such as a lane drop merging and weaving driver distractions a surge in demand or a combination of factors
The specific location and causality of each major I-210 bottleneck was verified by multiple field observations on separate weekdays throughout the summer fall and winter of 2009 Some bottleneck locations were videotaped to validate bottlenecks and to assist in micro-simulation model calibration
The detailed final report explains in detail the process and results of the bottleneck identification and causality analysis
I-210 Corridor System Management Plan Executive Summary
Page 22 of 39
Exhibit ES-19 I-210 Eastbound Bottleneck Locations
Abs CA Bottleneck
Location
Active
Period Causality Summary
AM PM
250 R250 Fair Oaks Heavy ramp merge
265 R265 Lake On-ramp Heavy ramp merge
286 R287 San Gabriel On-ramp Heavy ramp merge roadway curves
294 R294 Rosemead On-ramp Heavy consecutive ramp merge
330 R327 Huntington Interchange Heavy ramp merge roadway curves
366 R363 I-605 On-ramp traffic weaving with the off-ramp
400 R397 Azusa On-ramp Heavy ramp merge
408 R406 Citrus On-ramp Heavy ramp merge
450 R450 SR-57 On-ramp Heavy ramp merge and lane drop
Exhibit ES-20 I-210 Westbound Bottleneck Locations
Abs CA
Bottleneck
Location
Active
Period Causality Summary
AM PM
401 R398 Azusa On-ramp Consecutive ramp merge curves
368 R365 I-605 Off-ramp Consecutive ramp merge weaving
322 R319 Santa Anita On-ramp Heavy ramp merge roadway curves
307 R304 Baldwin On-ramp Heavy consecutive ramp merge
297 L297 Rosemead On-ramp Three consecutive ramp merges weaving
280 R281 Altadena On-ramp Heavy ramp merge
261 R261 Lake On-ramp Heavy ramp merge
Bottleneck Locations
reg --Bottleneck
Westbound
Eastbound
0 1 2
I bull I I I bull I I I Miles
HJOUAIIO fl _
I-210 Corridor System Management Plan Executive Summary
Page 23 of 39
Exhibit ES-21 I-210 Map of AM Bottleneck Locations
Bottleneck Locations
reg Bottleneck - Westbound - Eastbound
N 0 1 2
bull I I II II II I ll) Mles s
HJOUAIIO fl _
I-210 Corridor System Management Plan Executive Summary
Page 24 of 39
Exhibit ES-22 I-210 Map of PM Bottleneck Locations
I-210 Corridor System Management Plan Executive Summary
Page 25 of 39
SCENARIO DEVELOPMENT AND ANALYSIS
Fully understanding how a corridor performs and why it performs the way it does sets the foundation for evaluating potential solutions Several steps were required to develop and evaluate improvements including
diams Developing traffic models for 2006 base year and 2020 long-term demand diams Combining projects in a logical manner for modeling and testing diams Evaluating model outputs and summarizing results diams Conducting a benefit-cost assessment of scenarios
Traffic Model Development
The study team developed a traffic model using the VISSIM micro-simulation software It is important to note that micro-simulation models are complex to develop and calibrate for a large urban corridor However it is one of the only tools capable of providing a reasonable approximation of bottleneck formation and queue development Therefore such tools help quantify the impacts of operational strategies which traditional travel demand models cannot
The model was calibrated against 2006 conditions This was a resource intensive effort requiring several iterations of submittals and review cycles until the model reasonably matched bottleneck locations and relative severity Once calibration was approved a 2020 model was also developed based on SCAGrsquos travel demand model demand projections
These two models were used to evaluate different scenarios (combinations of projects) to quantify the associated congestion relief benefits and to compare total project costs against their benefits
Exhibit ES-23 depicts the network included in the model There were no parallel arterials modeled with the exception of arterials at interchanges All freeway interchanges were included as well as on-ramps and off-ramps
I-210 Corridor System Management Plan Executive Summary
Page 26 of 39
Exhibit ES-23 Micro-Simulation Model Network
I-210 Corridor System Management Plan Executive Summary
Page 27 of 39
Scenario Development Framework
The study team developed a framework for combining projects into scenarios It would be desirable to evaluate every possible combination of projects However this would have entailed thousands of model runs Instead the team combined projects based on a number of factors including
diams Projects that were fully constructed and completed from 2006 to 2010 were tested with both the 2006 and 2020 models
diams Short- and mid- term operational projects were grouped into scenarios and tested with the both the 2006 and 2020 models
diams Longer-range projects to be delivered by 2020 and beyond were used to develop scenarios to be tested with the 2020 model only
diams Alternative ramp closures were grouped into isolated scenarios (future scenarios did not build on top of these) and tested with both the 2006 and 2020 models
The study assumes that projects delivered before 2016 could reasonably be evaluated using the 2006 base year model The 2020 forecast year for the I-210 study was consistent with the SCAG 2020 regional travel demand model origin-destination matrices used to develop the 2008 Regional Transportation Plan (RTP) When SCAG updates its travel demand model and Regional Transportation Plan (RTP) it may wish to update the micro-simulation model with revised demand projections
Project lists used to develop scenarios were part from the Regional Transportation Improvement Program (RTIP) the RTP and other sources such as special studies Projects that do not directly affect mobility were eliminated For instance sound wall landscaping or minor arterial improvement projects were not evaluated since microshysimulation models cannot evaluate them
Scenario testing performed for the performed for the I-210 CSMP differed from traditional ldquoalternatives evaluationsrdquo done for Major Investment Studies (MIS) or Environmental Impact Reports (EIRs) An MIS or EIR focuses on identifying alternative solutions to address current or projected corridor problems so each alternative is evaluated separately and results among competing alternatives are compared resulting in a locally preferred alternative In contrast for the I-210 CSMP scenarios build on each other in that a scenario contains the projects from the previous scenario plus one or more projects as long as the incremental scenario results showed an acceptable level of performance improvement This incremental scenario evaluation approach is important since CSMPs are new and are often compared with alternatives studies
Exhibit ES-24 summarizes the approach used and scenarios tested and provides a
I-210 Corridor System Management Plan Executive Summary
Page 28 of 39
general description of the projects included in the 2006 and 2020 micro-simulation runs Most projects were tested for both the short- and long-term timeframes Each scenario tested was built upon prior scenarios except for Scenarios 7 and 8 which were ldquostand alonerdquo scenarios used to test alternative ramp closures Later scenarios build on Scenarios 5 and 6 and do not include the improvements tested in Scenarios 7 and 8 Enhanced incident management was tested in Scenarios 11 and 12 by comparing a simulated incident without and with enhanced incident management system Scenarios 13 and 14 are expected for the longer term and were tested only with the 2020 model
Exhibit ES-24 Micro-Simulation Modeling Approach
Short-Term Scenarios Long-Term Scenarios
Calibrated 2006 Base Case
Scenario 1 Expand Ramp-
Metering
Scenario 3 Scenario 1 +
Adv Ramp-Meter w
Queue Control
Scenario 5 Scenario 3 + aux lane striping and
ramp improvements
2020 Horizon Year
2006 Network 2020 OD Matrices
Scenario 7 Scenario 5 +
Ramp Closures
Scenario 2 Expand Ramp-
Metering
Scenario 4 Scenario 2 +
Adv Ramp-Meter w
Queue Control
Scenario 6 Scenario 4 + aux lane striping and
ramp improvements
Scenario 8 Scenario 6 +
Ramp Closures
Scenario 14 Scenario 13 + Lake
Ave Drop Ramp
Lane Addition
Scenario 9 Scenario 5+
On-Ramp amp Aux
lane improvements
Scenario 10 Scenario 6 +
On-Ramp amp Aux
lane improvements
Scenario 11 Incident with No
Incident
Management
Scenario 12 Incident With
Incident
Management
Scenario 13 Scenario 10 +
134210 IC
modification
Incident Management Scenarios
I-210 Corridor System Management Plan Executive Summary
Page 29 of 39
Scenario Evaluation Results
Exhibits ES-25 and ES-26 show the delay results for all the 2006 scenarios evaluated for the AM and PM peak periods respectively Exhibits ES-27 and ES-28 show the delay results for all the 2020 scenarios evaluated for the AM and PM peak periods respectively For each scenario the modeling team produced results by facility type (ie mainline HOV arterials and ramps) and vehicle type (SOV HOV trucks) as well as speed contour diagrams (discussed in more detail in the full technical CSMP) The study team scrutinized to ensure that they were consistent with general traffic engineering principles The following summarizes the findings related to the four exhibits
Exhibit ES-25 2006 AM Peak Micro-Simulation Delay Results by Scenario
De
lay
(Pe
ak
Pe
rio
d V
eh
icle
-Ho
urs
)
2006 Base Year S1 S3 S5 S7 S9 Scenario
18000
16000
14000
12000
10000
8000
6000
4000
2000
-
S1 Expand Ramp Metering
S3 Adv Ramp Metering
S5 Aux Lane Striping Ramp Improvs
S7 Ramp Closures
S9 On-Ramp amp Aux Lane Improvs
-2 -3 -3
-16 -20
HOV WB I-210 WB
HOV EB I-210 EB
Ramps Arterials
I-210 Corridor System Management Plan Executive Summary
Page 30 of 39
Exhibit ES-26 2006 PM Peak Micro-Simulation Delay Results by Scenario
18000
De
lay
(Pe
ak
Pe
rio
d V
eh
icle
-Ho
urs
)
16000
14000
12000
10000
8000
6000
4000
2000
-
S1 Expand Ramp Metering
S3 Adv Ramp Metering
HOV WB
I-210 WB
S5 Aux Lane Striping Ramp Improvs
S7 Ramp Closures
S9 On-Ramp amp Aux Lane Improvs
HOV EB
I-210 EB
Ramps
Arterials
-17
-11
-18
-18 -28
2006 Base Year S1 S3 S5 S7 S9 Scenario
Exhibit ES-27 2020 AM Peak Micro-Simulation Delay Results by Scenario
30000
De
lay
(Pe
ak
Pe
rio
d V
eh
icle
-Ho
urs
)
25000
20000
15000
10000
5000
S2 Expand Ramp Metering
S4 Adv Ramp Metering
S6 Aux Lane Striping Ramp Improvs
S8 Ramp Closures
HOV WB
I-210 WB
HOV EB
-8
-2 -8
-13 -12
S10 On-Ramp amp Aux Lane Improvs
S13 SR-134I-210 IC Modification
S14 Lake Ave Drop Ramp Lane Addition
I-210 EB
Ramps
Arterials
-11
-23
-
2020 S2 S4 S6 S8 S10 S13 S14 Horizon Scenario
I-210 Corridor System Management Plan Executive Summary
Page 31 of 39
Exhibit ES-28 2020 PM Peak Micro-Simulation Delay Results by Scenario D
ela
y(P
ea
k P
eri
od
Ve
hic
le-H
ou
rs)
30000
25000
20000
15000
10000
5000
-
S2 Expand Ramp Metering
S4 Adv Ramp Metering
S6 Aux Lane Striping Ramp Improvs
S8 Ramp Closures
HOV WB
I-210 WB
HOV EB
-14
S10 On-Ramp amp Aux Lane Improvs
S13 SR-134I-210 IC Modification
S14 Lake Ave Drop Ramp Lane Addition
I-210 EB
Ramps
Arterials
-2 -5 -3 -28
-3 -19
2020 S2 S4 S6 S8 S10 S13 S14 Horizon Scenario
Base Year and Do Minimum Horizon Year
Absent any physical improvements the modeling team estimates that by 2020 total delay (mainline HOV ramps and arterials) would double compared to 2006 (from a total of around 22000 vehicle-hours daily to just fewer than 45000 vehicle-hours) in the combined AM and PM peak
Scenarios 1 and 2 (Expand Ramp Metering)
Scenarios 1 and 2 test the only project on the corridor that was fully constructed and completed The project installed new connector metering at the SR-57 and I-605 to Ishy210 freeway connector ramps The project also widened various ramps removed various HOV meter bypasses and upgraded the ramp metering system
The 2006 model estimates that Scenario 1 would reduce delay on the corridor by around 17 percent (or 1600 daily vehicle-hours) in the PM peak period but only around two percent (or 200 vehicle-hours) in the AM peak period The biggest benefits occur in the PM eastbound direction from Rosemead On-Ramp to Huntington interchange (with a delay reduction of over 1000 vehicle-hours) as well as from I-605 to the Azusa On-Ramp (delay reduction of 500 vehicle-hours) for single occupant vehicles The
I-210 Corridor System Management Plan Executive Summary
Page 32 of 39
westbound reductions in freeway delay are largely offset by increased on-ramp delay mostly from new connector metering at SR-57 and I-605
The 2020 model estimates that Scenario 2 will reduce delay by around 8 percent in the AM peak and 14 percent in the PM peak for a combined total reduction of 5000 daily vehicle-hours The long-term improvements are less than the short-term improvements due to the increase in demand
Scenarios 3 and 4 (Advanced Ramp Metering)
Scenarios 3 and 4 build on Scenarios 1 and 2 by adding advanced ramp metering system such as dynamic or adaptive ramp metering system
The 2006 model shows that Scenario 3 would reduce delay by an additional 850 daily vehicle-hours (or 11 percent) in the PM peak with a marginal reduction in the AM peak period However in conjunction with Scenario 1 Scenario 3 reduces delay in total by over 600 vehicle-hours in the AM peak These results suggest that queue control provides additional benefits beyond SWARM
The 2020 model estimates that Scenario 4 will modestly reduce delay by about 2 percent in both the AM and PM peaks or a combined total of 800 daily vehicle-hours Again the benefits are lower in percentage terms due to the increase in demand
Note that there are various types of advanced ramp metering systems deployed around the world including System-wide Adaptive Ramp Metering System or SWARM tested recently in Los Angeles I-210 freeway corridor For the I-210 model the Asservissement Lineaire drsquoEntreacutee Autoroutiere (ALINEA system) was tested as proxy for any advanced ramp metering system as its algorithm for the model was readily available It is not necessarily recommended that ALINEA be deployed but rather some type of advanced ramp metering system that would produce similar if not better results
Scenarios 5 and 6 (Auxiliary Lane Striping Ramp Improvements)
Scenarios 5 and 6 build on Scenarios 3 and 4 that include several relatively lower-cost operational improvements that could be implemented by 2015
diams Building a westbound auxiliary lane from Santa Anita to Baldwin and an eastbound auxiliary lane from Santa Anita to Huntington
diams Extending a lane to Lincoln on the westbound I-210 connector
diams Connecting and converging the Altadena on-ramps into a single on-ramp
I-210 Corridor System Management Plan Executive Summary
Page 33 of 39
diams Connecting and converging the Santa Anita on-ramps into a single on-ramp
diams Connecting and converging the Irwindale on-ramps into a single on-ramp
diams Restriping to add a lane in the eastbound direction from San Dimas to Fruit
The 2006 model shows that Scenario 5 reduces delay by 3 percent (nearly 400 vehicleshyhours) in the AM peak and 18 percent (1200 vehicle-hours) in the PM peak The segment that experienced the largest improvement in the eastbound during the PM peak was from Rosemead to Huntington This segment experienced a 45 percent improvement in delay (from 2700 vehicle-hours to 1500 vehicle-hours) which is likely attributed to the eastbound auxiliary lane from Santa Anita to Huntington In the westbound direction the auxiliary lane from Santa Anita to Baldwin shifts some traffic downstream to cause increased congestion at Michillinda (ie bottleneck shift) during the westbound AM peak However the auxiliary lane helps reduce both queue length and queue duration for the Santa Anita bottleneck
The 2020 model estimates that Scenario 6 would reduce delay by 8 percent in the AM peak and 5 percent in the PM peak for a total reduction of 2500 daily vehicle-hours A reduction in PM delay is expected to occur mostly in the westbound direction
Scenarios 7 and 8 (Ramp Closures)
Scenarios 7 and 8 build on Scenarios 5 and 6 and test the closure of several ramps
diams Eastbound Marengo on-ramp and westbound Lake on-ramp with signalization of the eastbound I-210 off-ramp at Maple and improvement to alternate routes along Corson and Maple
diams Eastbound Mount Olive ramps
Note that subsequent scenarios are not built on top of these scenarios as these are isolated to test ramp closure alternatives
The 2006 model shows that Scenario 7 would reduce delay significantly by 16 percent in the AM peak and 18 percent in the PM peak for a total delay reduction of nearly 3000 daily vehicle-hours The delay reductions are significant on the mainline during the peak direction of travel ndash 1400 vehicle-hours in the westbound AM and 912 vehicleshyhours in the eastbound PM In the westbound direction and AM peak period the segment from Altadena to Lake experienced over an 85 percent decrease in congestion (from 860 to 120 vehicle-hours of delay) This is likely attributed to the closure of the westbound Lake on-ramp In the eastbound direction and PM peak period the segment from Huntington to I-605 experienced a delay reduction of over 70 percent (from 2200
I-210 Corridor System Management Plan Executive Summary
Page 34 of 39
vehicle-hours to 600 vehicle-hours) which is likely attributed to the closure of the Mount Olive ramp
The 2020 model also shows that Scenario 8 improved delay by 12 percent in the AM and 3 percent in the PM for a total delay reduction of almost 3000 daily vehicle-hours On the mainline facility delay also improved for each peak direction of travel ndash by 1600 daily vehicle-hours in the westbound AM and by 750 vehicle-hours in the eastbound PM Delay reductions in the non-peak direction were not as significant
Scenarios 9 and 10 (On-ramp and Aux Lane Improvements)
Scenarios 9 and 10 build on Scenarios 5 and 6 and test four operational improvements that can be implemented in the short to medium range
diams Modify the RosemeadMichillinda interchange and converge the westbound I-210 on-ramps
diams Modify the northside of the Baldwin interchange and eliminate the collectorshydistributor
diams Construct an eastbound auxiliary lane from Azusa to Citrus
diams Converge the eastbound Citrus on-ramps and add an auxiliary lane to Grand
The 2006 model estimates that Scenario 9 will reduce delay by 20 percent (or 2400 daily vehicle-hours) in the AM peak and 28 percent (or 1600 daily vehicle-hours) in the PM peak compared to Scenario 5 In both AM and PM peak period the eastbound direction experienced the largest reduction in delay
The 2020 model estimates that Scenario 10 will reduce delay by 13 percent (or 2500 vehicle-hours) in the AM peak and 28 percent in the PM peak (or 4800 vehicle-hours) compared to Scenario 6 Similar to the 2006 model the 2020 model shows that these improvements produced a greater reduction in delay in the eastbound direction than the westbound direction
Scenarios 11 and 12 (Enhanced Incident Management)
Two incident scenarios were tested on top of Scenario 10 to evaluate the non-recurrent delay reductions resulting from enhanced incident management strategies An enhanced incident management system would entail upgrading or enhancing the current Caltrans incident management system that includes deployment of intelligent transportation system (ITS) field devices central controlcommunications software communications medium (ie fiber optic lines) advanced traveler information system
I-210 Corridor System Management Plan Executive Summary
Page 35 of 39
andor freeway service patrol (FSP) program to reduce incident detection verification response and clearance times
In the first scenario Scenario 11 one collision incident with one lane closure was simulated in the westbound direction in the AM peak period model and one in the eastbound direction in the PM peak period model The incident simulation location and duration were selected based on review of the 2010 actual incident data at one of the high frequency locations The following are the Scenario details
diams Westbound AM peak period starting at 800 AM close mainline lane 2 for 40 minutes at absolute post mile 2612 (at Lake Avenue)
diams Eastbound PM peak period starting at 500 PM close mainline lane 2 for 50 minutes at absolute post mile 3207 (west of Santa Anita)
In the second scenario Scenario 12 the same collision incidents were simulated with a reduction in duration by 10 minutes in the westbound direction and by 12 minutes in the eastbound direction It is estimated based on actual incident management data analysis results provided by Caltrans that an enhanced incident management system could reduce a 35-minute incident by about 10 minutes This scenario represents a typical moderate level incident at one location during the peak period direction Data suggest that incidents vary significantly in terms of impact and duration Some incidents last hundreds of minutes some close multiple lanes and some occur at multiple locations simultaneously There are also numerous minor incidents lasting only a few minutes without lane closures that can result in congestion Many other incidents also occur during off-peak hours
Without enhanced incident management Scenario 11 produced an 8 percent increase in congestion in both peak periods over Scenario 10 an increase of over 2300 hours of vehicle delay With enhanced incident management Scenario 12 evaluation resulted in delay decrease by 2 percent in the AM peak and 3 percent in the PM peak against Scenario 11 results a reduction of nearly 750 vehicle-hours for improving the incident detection verification response and clearance time of one moderate level incident for both of the peak hours
Scenario 13 (SR-134I-210 Interchange Modification)
Scenario 13 tests an improvement to modify the SR-134I-210 interchange to provide a direct connection for vehicles to continue on I-210 with three lanes in each direction This improvement was tested with the 2020 model since it is not likely to be implemented in the short-term
I-210 Corridor System Management Plan Executive Summary
Page 36 of 39
The 2020 model estimates that delay would be reduced by 11 percent (or 1800 daily vehicle-hours) in the AM and 3 percent in the PM (320 daily vehicle-hours) compared to Scenario 10 The westbound mainline experienced the greatest reduction in delay in the AM peak from 9600 vehicle-hours to 8600 vehicle hours after the interchange modification
Scenario 14 (Westbound Drop Ramp and Eastbound Widening)
Scenario 14 builds on Scenario 13 and tests Lake Avenue drop ramp to westbound Ishy210 center lanes (one HOV lane and one mainline) and eastbound I-210 widening from Myrtle to I-605 This improvement was tested with the 2020 model
The 2020 model estimates that delay would be reduced by about 20 percent in the AM or 3400 vehicle-hours and 20 percent in the PM or 2300 vehicle-hours compared to Scenario 13 The mobility improvements are significant with the westbound drop ramp that reduces weaving between SR-134 and SR-210 destined traffic and with the eastbound capacity addition to I-605 off that moves the off-ramp traffic away from the mainline and provides more room for the mainline through traffic
Post Scenario 14 Conditions
By 2020 with the inclusion of all the projects tested the model reveals some residual congestion that remains to address with future improvements According to the model results the total remaining delay on the corridor is around 21000 daily vehicle-hours
Benefit-Cost Analysis
Following an in-depth review of model results by the study team and the SCAG technical committee the study team performed a benefit-cost analysis (BCA) for each scenario
Using the California Benefit-Cost Model (Cal-BC) developed on behalf of Caltrans by the study team benefits in three key areas were estimated travel time savings vehicle operating cost savings and emission reduction savings The benefits generated from this exercise are based solely on congestion relief related benefits However these results are conservative since there are other benefits not captured by this analysis including benefits from deploying bus rapid transit which will achieve other accessibility benefits
Project costs were developed from SCAG and Caltrans project planning and programming documents These costs include construction and support costs in current dollars The study team estimated costs for projects that did not have cost
I-210 Corridor System Management Plan Executive Summary
Page 37 of 39
estimates by reviewing similar completed projects A BC greater than one means that a scenarios projects return greater benefits than it costs to construct or implement It is important to consider the total benefits that a project brings For example a large capital expansion project can cost a great deal and have a low BC ratio but brings much higher absolute benefits to the I-210 users Exhibit ES-29 shows the benefit to cost ranges classified from low (with a BC of one to two) to very high (with a BC of over 10)
The benefit-cost results for the South Corridor scenarios are shown in Exhibit ES-29
Exhibit ES-29 I-210 Scenario BenefitCost (BC) Results
Scenario Scenario Description
BenefitCost Ranges
Low Medium Medium-High High Very High
lt1 1 to 2 2 to 5 5 to 10 gt10
12 Expand Ramp Metering 34 Advanced Ramp Metering 56 Aux Lane Striping Ramp Improvs 78 Ramp Closures
910 On-Ramp amp Aux Lane Improvs 13 SR-134I-210 IC Modification
The benefit-cost findings for each scenario are as follows
diams Scenarios 1 and 2 (ramp metering expansion) shows a high benefit-cost ratio of over ten The relatively high benefit-cost ratio is due to the low cost of expanding ramp metering ($235 million)
diams Scenarios 3 and 4 (advanced ramp metering) resulted in an incremental benefitshycost ratio of over ten This is relatively high as compared to that of typical transportation management system project
diams Scenarios 5 and 6 (operational improvements) produced a benefit-cost ratio of over five This is relatively consistent with other typical operational improvement projects The benefits are substantial At estimated total cost of about $44 million these projects produced benefits of over $233 million
diams Scenarios 7 and 8 tested the ramp closures at eastbound Marengo westbound Lake and eastbound Mount Olive These ramp closured produced an extremely high incremental benefit-cost ratio of over ten due to the relatively very low cost However this benefit-cost calculation does not account for any potential increase in delay on various local arterials because of detours from the closed ramps
diams Scenarios 9 and 10 also produced a relatively high benefit-cost ratio of over ten The four operational projects in these scenarios are collectively estimated to cost
I-210 Corridor System Management Plan Executive Summary
Page 38 of 39
under $30 million and provide a substantial and optimistic benefit of over $670 million
diams Scenario 13 tested the SR-134I-210 interchange modification This project produced a benefit-cost ratio of between one and two consistent with other typical capital expansion projects This project produced benefits of over $200 million at a rough-estimate cost of about $150 million
diams Scenario 14 tested the westbound center drop ramp from Lake Avenue interchange and eastbound lane addition from Myrtle to I-605 These projects produced a relatively high benefit-cost ratio of about 6 to one as compared to other capital improvement projects These two capital projects are unique in that they have specific operational improvement element that addresses major bottleneck locations For an estimated total combined cost of about $70 million the projected benefits exceed $420 million
CONCLUSIONS AND RECOMMENDATIONS
This section summarizes the conclusions and recommendations based on the analysis discussed in the previous section It is important to note that many of these conclusions are based primarily on the micro-simulation model results The model was developed based on the best data available at the time The study team reviewed the model results and believe that both the calibrated base year forecast year and scenario results are reasonable However Caltrans should always be cautious to make decisions based on modeling alone especially complex micro-simulation models
Based on the results the study team offers the following conclusions and recommendations
diams The combination of all scenarios significantly reduces overall congestion on the corridor Projected 2020 congestion after implementation of all scenarios is below 2006 levels in both the AM and PM peak period In the AM peak period the model projects total delay in 2020 after delivering all projects to be less than 11700 vehicle-hours compared to the 2006 base year delay of 13000 vehicleshyhours This represents a reduction of over 10 percent In the PM peak period the model projects total delay in 2020 after delivering all projects to be around 9500 hours compared to the 2006 base year delay of almost 9300 vehicle-hours This represents a slight reduction of 2 percent Clearly the scenarios deliver significant mobility benefits to the corridor Despite the growth in demand future 2020 congestion will be less than experienced in 2006
diams The completed ramp metering expansion project is expected to produce substantial mobility benefits of over $400 million Delay has been significantly reduced since 2006
I-210 Corridor System Management Plan Executive Summary
Page 39 of 39
diams Advanced ramp metering could provide additional mobility improvements by significantly reducing congestion and returning over $100 million in benefits
diams Ramp closures at Marengo Lake and Mount Olive as alternatives seem promising by reducing delay up to 3000 vehicle-hours per day and providing substantial benefits of $280 million at an extremely low cost
diams Operational improvements such as auxiliary lanes and ramp improvements could leverage on the ramp metering projects by making the corridor more efficient and productive that could result in additional mobility benefits of over $230 million
diams Additional capital improvements with specific operational elements to address weaving at major bottleneck locations could produce significant mobility benefits of over $420 million
diams Enhanced incident management system associated with Scenarios 11 and 12 to address non-recurrent congestion proved effective with a delay reduction of over 300 vehicle-hours for one modest level incident with a typical duration of 35 minutes reduced to 25 minutes With the I-210 corridor experiencing up to 2400 collisions per year this translates to a total annual delay savings of over 700000 vehicle-hours for the study corridor
diams The benefit-cost ratio of all scenarios combined is about 64 to 1 If all projects were delivered at current cost estimates the public would get over six dollars of benefits for each dollar expended In current dollars costs total to over $17 billion whereas the benefits are estimated to be over $20 billion
diams The projects also alleviate greenhouse gas (GHG) emissions by over 15 million tons over 20 years averaging over a 75000-ton reduction per year The emissions are estimated using data from the California Air Resources Board (CARB) EMFAC model
This is the first generation CSMP for the I-210 corridor It is important to stress that CSMPs should be updated on a regular basis This is particularly important since traffic conditions and patterns can differ from current projections After projects are delivered it is also useful to compare actual results with estimated ones in this document so that models can be further improved as appropriate
CSMPs or a variation thereof should become the normal course of business that is based on detailed performance assessments an in-depth understanding of the reasons for performance deterioration and an analytical framework that allows for evaluating complementary operational strategies that maximize the productivity of the current system
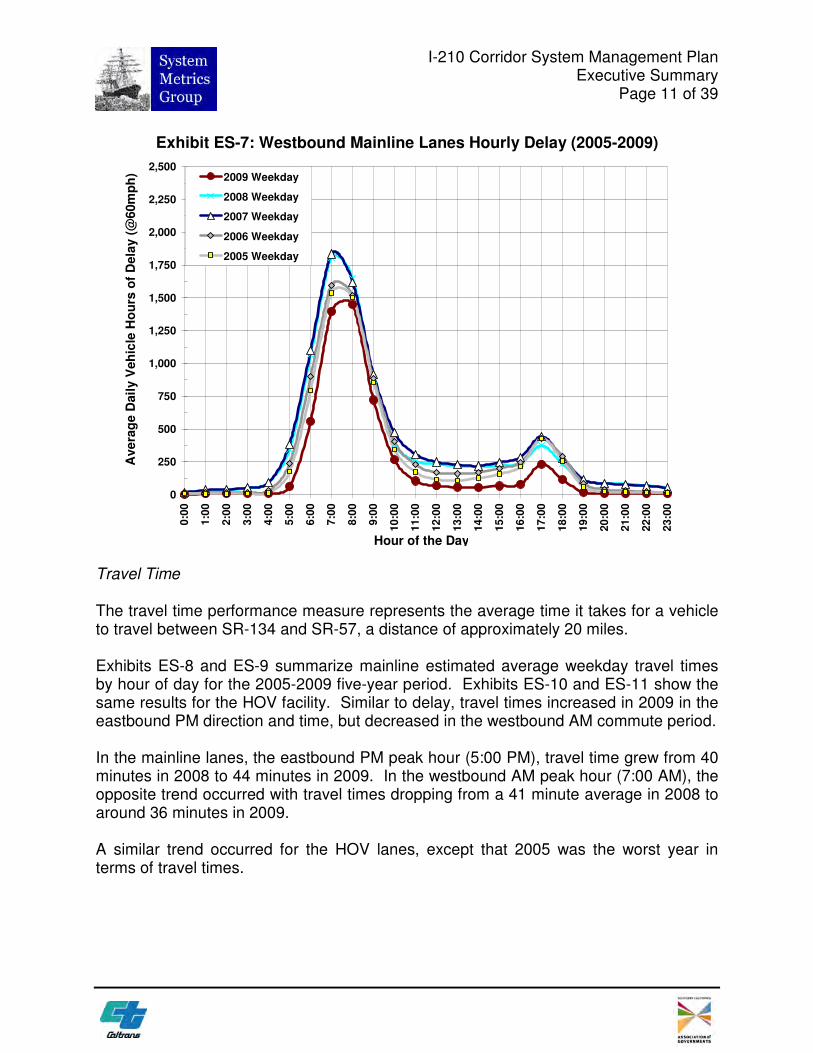
I-210 Corridor System Management Plan Executive Summary
Page 11 of 39
Exhibit ES-7 Westbound Mainline Lanes Hourly Delay (2005-2009)
0
250
500
750
1000
1250
1500
1750
2000
2250
2500
Ave
rag
e D
ail
y V
eh
icle
Ho
urs
of
Dela
y (
60m
ph
) 2009 Weekday
2008 Weekday
2007 Weekday
2006 Weekday
2005 Weekday
00
0
10
0
20
0
30
0
40
0
50
0
60
0
70
0
80
0
90
0
100
0
110
0
120
0
130
0
140
0
150
0
160
0
170
0
180
0
190
0
200
0
210
0
220
0
230
0
Hour of the Day
Travel Time
The travel time performance measure represents the average time it takes for a vehicle to travel between SR-134 and SR-57 a distance of approximately 20 miles
Exhibits ES-8 and ES-9 summarize mainline estimated average weekday travel times by hour of day for the 2005-2009 five-year period Exhibits ES-10 and ES-11 show the same results for the HOV facility Similar to delay travel times increased in 2009 in the eastbound PM direction and time but decreased in the westbound AM commute period
In the mainline lanes the eastbound PM peak hour (500 PM) travel time grew from 40 minutes in 2008 to 44 minutes in 2009 In the westbound AM peak hour (700 AM) the opposite trend occurred with travel times dropping from a 41 minute average in 2008 to around 36 minutes in 2009
A similar trend occurred for the HOV lanes except that 2005 was the worst year in terms of travel times
Tra
ve
l T
ime
(m
inu
tes
) T
rav
el
Tim
e (
min
ute
s)
45
40
35
30
25
20
15
10
5
0
45
40
35
30
25
20
15
10
5
0
I-210 Corridor System Management Plan Executive Summary
Page 12 of 39
Exhibit ES-8 Eastbound Mainline Lanes Travel Time by Hour (2005-2009) 50
2009 Average Travel Time
2008 Average Travel Time
2007 Average Travel Time
2006 Average Travel Time
2005 Average Travel Time
Travel Time 60mph
Travel Time 35mph
Hour of the Day
00
0
10
0
20
0
30
0
40
0
50
0
60
0
70
0
80
0
90
0
100
0
110
0
120
0
130
0
140
0
150
0
160
0
170
0
180
0
190
0
200
0
210
0
220
0
Hour of the Day
Exhibit ES-9 Westbound Mainline Lanes Travel Time by Hour (2005-2009) 50
2009 Average Travel Time
2008 Average Travel Time
2007 Average Travel Time
2006 Average Travel Time
2005 Average Travel Time
Travel Time 60mph
Travel Time 35mph
00
0
10
0
20
0
30
0
40
0
50
0
60
0
70
0
80
0
90
0
10
00
11
00
12
00
13
00
14
00
15
00
16
00
17
00
18
00
19
00
20
00
21
00
22
00
230
0
23
00
Tra
ve
l T
ime
(m
inu
tes
) T
rav
el
Tim
e (
min
ute
s)
45
40
35
30
25
20
15
10
5
0
45
40
35
30
25
20
15
10
5
0
I-210 Corridor System Management Plan Executive Summary
Page 13 of 39
Exhibit ES-10 Eastbound HOV Lanes Travel Time by Hour (2005-2009) 50
2009 Average Travel Time
2008 Average Travel Time
2007 Average Travel Time
2006 Average Travel Time
2005 Average Travel Time
Travel Time 60mph
Travel Time 35mph
Hour of the Day
00
0
10
0
20
0
30
0
40
0
50
0
60
0
70
0
80
0
90
0
100
0
110
0
120
0
130
0
140
0
150
0
160
0
170
0
180
0
190
0
200
0
210
0
220
0
Hour of the Day
Exhibit ES-11 Westbound HOV Lanes Travel Time by Hour (2005-2009) 50
2009 Average Travel Time
2008 Average Travel Time
2007 Average Travel Time
2006 Average Travel Time
2005 Average Travel Time
Travel Time 60mph
Travel Time 35mph
00
0
10
0
20
0
30
0
40
0
50
0
60
0
70
0
80
0
90
0
100
0
110
0
120
0
130
0
140
0
150
0
160
0
170
0
180
0
190
0
200
0
210
0
220
0
230
0
230
0
I-210 Corridor System Management Plan Executive Summary
Page 14 of 39
Reliability
Reliability captures the degree of predictability in travel time Reliability focuses on how travel time varies from day to day and reflects the impacts of accidents incidents weather and special events Improving reliability is an important goal for transportation agencies and efforts to accomplish this include incident management traveler information and special event planning
To measure reliability the CSMP used the ldquobuffer indexrdquo which reflects the additional time required (over and beyond the average) to ensure an on-time arrival 95 percent of the time In other words if a person must be on time 95 days out of 100 (or 19 out of 20 workdays per month) then that person must add additional time to their average expected travel time to ensure an on-time arrival That additional time is the buffer time Severe events such as collisions could cause longer travel times but the 95th percentile represents a balance between days with extreme events (eg major accidents) and other more ldquotypicalrdquo travel days
Exhibits ES-12 and ES-13 show the estimated mainline lane travel time variability along I-210 on non-holiday weekdays for 2006 in the eastbound and westbound directions respectively The main report shows the buffer index for the years 2005-2009 for both mainline and HOV lanes but this Executive Summary reports only the data for the year 2006 for mainlines since that year was used as the base year for modeling
The following observations on the reliability results are worth noting
bull In 2006 in the eastbound direction 500 PM had the highest estimated average travel time at approximately 41 minutes and the highest estimated buffer index time of 15 minutes for a buffer index of 33 percent In other words to arrive on time 95 percent of the time a commuter would need to leave for work 56 minutes before the start time to travel the entire length of the I-210 study corridor
bull The westbound direction the 700 AM had the estimated average travel time of 39 minutes in 2006 with a buffer time of 15 minutes for a buffer index of 38 percent
70
65
60
55
50
45
40
35
30
25
20
15
10
5
0
70
65
60
55
50
45
40
35
30
25
20
15
10
5
0
Average Travel Time
Travel Time Variability (95th Percentile)
Travel Time at 60mph
Travel Time at 35mph
TIME OF DAY
Exhibit ES-13 Westbound Mainline Lanes Travel Time Variability (2006)
75
TIME OF DAY
Average Travel Time
Travel Time Variability (95th Percentile)
Travel Time at 60mph
Travel Time at 35mph
Exhibit ES-12 Eastbound Mainline Lanes Travel Time Variability (2006)
75
I-210 Corridor System Management Plan Executive Summary
Page 15 of 39
TR
AV
EL
TIM
E (
MIN
)
00
000
0
10
010
0
TR
AV
EL
TIM
E (
MIN
)
20
020
0
30
030
0
40
040
0
50
050
0
60
060
0
70
070
0
80
080
0
90
090
0
100
01
00
0
110
01
10
0
120
01
20
0
130
01
30
0
140
01
40
0
150
01
50
0
160
01
60
0
170
01
70
0
180
01
80
0
190
01
90
0
200
02
00
0
210
02
10
0
220
02
20
0
230
02
30
0
00
0
00
0
I-210 Corridor System Management Plan Executive Summary
Page 16 of 39
Safety
The adopted performance measures to assess safety involve the number of accidents and the accident rates computed from the Caltrans Traffic Accident Surveillance and Analysis System (TASAS) TASAS is a traffic records system containing an accident database linked to a highway database The highway database contains descriptive elements of highway segments intersections and ramps access control traffic volumes and other data TASAS contains specific data for accidents on State highways Accidents on non-State highways are not included (eg local streets and roads)
The safety assessment in this report intends to characterize the overall accident history and trends in the corridor and to highlight notable accident concentration locations or patterns that are readily apparent This report does not intend to supplant more detailed safety investigations routinely performed by Caltrans staff
Exhibits ES-14 and ES-15 show the I-210 total number of eastbound and westbound accidents by month respectively For the accident analysis the corridor is split in half the ldquoless urbanrdquo western half of the corridor from I-5 (postmile 0) in Sylmar to SR-134 in Pasadena (postmile R2200) and the ldquomore urbanrdquo eastern half from SR-134 to SR-57 (postmile R45) in San Dimas The latest available TASAS data from PeMS is to December 30 2008 Accidents are reported for the study corridor and not separated by mainline and HOV facility The exhibits summarize the latest available three-year data from January 1 2006 through December 31 2008
Both the eastbound and westbound directions have similar accident profiles with the more urbanized eastern half of the corridor (postmile R22 to R45) experiencing nearly 45 times as many accidents as the western half (PM 0 to R22) The eastbound (Exhibit ES-13) direction has around 79 accidents on average per month in the more-urbanized section and just fewer than 18 accidents in the less-urbanized section
The westbound direction has just fewer than 78 accidents on average per month in the more-urbanized section and just fewer than 18 in the less-urbanized section This is very similar to the eastbound direction
Nu
mb
er
of
Ac
cid
en
ts
Nu
mb
er
of
Accid
en
ts
I-210 Corridor System Management Plan Executive Summary
Page 17 of 39
Exhibit ES-14 Eastbound I-210 Monthly Collisions (2004-2008) 120
110
100
90
80
70
60
50
40
30
20
10
0
Jan
Feb
Mar
Ap
rM
ay
Ju
nJu
lA
ug
Sep
Oct
No
vD
ec
Jan
Feb
Mar
Ap
rM
ay
Ju
nJu
lA
ug
Sep
Oct
No
vD
ec
Jan
Feb
Mar
Ap
rM
ay
Ju
nJu
lA
ug
Sep
Oct
No
vD
ec
Jan
Feb
Mar
Ap
rM
ay
Ju
nJu
lA
ug
Sep
Oct
No
vD
ec
Jan
Feb
Mar
Ap
rM
ay
Ju
nJu
lA
ug
Sep
Oct
No
vD
ec
2004 2005 2006 2007 2008
Less Urbanized Western Section (I-5 to SR-134)
More Urbanized Eastern Section (SR-134 to SR-57)
110
100
90
80
70
60
50
40
30
20
10
0
Exhibit ES-15 Westbound I-210 Monthly Collisions (2004-2008) 120
Jan
Feb
Mar
Ap
rM
ay
Ju
nJu
lA
ug
Sep
Oct
No
vD
ec
Jan
Feb
Mar
Ap
rM
ay
Ju
nJu
lA
ug
Sep
Oct
No
vD
ec
Jan
Feb
Mar
Ap
rM
ay
Ju
nJu
lA
ug
Sep
Oct
No
vD
ec
Jan
Feb
Mar
Ap
rM
ay
Ju
nJu
lA
ug
Sep
Oct
No
vD
ec
Jan
Feb
Mar
Ap
rM
ay
Ju
nJu
lA
ug
Sep
Oct
No
vD
ec
2004 2005 2006 2007 2008
Less Urbanized Western Section (I-5 to SR-134)
More Urbanized Eastern Section (SR-134 to SR-57)
I-210 Corridor System Management Plan Executive Summary
Page 18 of 39
Productivity
Productivity is a system efficiency measure used to analyze the throughput of the corridor during congested conditions Restoring lost productivity is one focus area of CSMPs
Exhibit ES-16 illustrates how congestion leads to lost productivity The exhibit uses observed I-210 data from sensors for a typical spring 2010 afternoon peak period (Thursday May 6 2010) It shows speeds (red line) and flow rates (blue line) on eastbound I-210 at Huntington Drive one of the most congested locations on the corridor
Flow rates (measured as vehicle-per-hour-per-lane or ldquovphplrdquo) at Huntington Drive averaged around 1800 vphpl between 200 PM and 300 PM Once volumes approach a maximum flow rate of around 2000 vphl traffic becomes unstable Any additional merging or weaving traffic breaks down and speeds can rapidly plummet to below 35 mph In essence every incremental merge takes up two spots on the freeway for a short time However since the volume is close to the capacity these merges lead to queues Moreover rather than accommodating the same number of vehicles flow rates also drop and vehicles back up creating bottlenecks and associated congestion
At the location shown in Exhibit ES-16 throughput drops by over 30 percent on average during the peak period (from over 1800 to around 1200 vphpl) This five-lane road therefore operates as if lost 30 percent capacity when demand is at its highest Stated differently just when the corridor needed the most capacity it performed in the least productive manner and effectively lost lanes This loss in throughput can be aggregated and presented as ldquoEquivalent Lost-Lane-Milesrdquo
I-210 Corridor System Management Plan Executive Summary
Page 19 of 39
Exhibit ES-16 Lost Productivity Illustrated
70 2000
65
60 1750
50
55 1500
SP
EE
D
45 1250
40
35 1000
30 Speed lt35mph
750 25
20 500 I-210 EB
15 Los Angeles County Huntington
10 PM=3338 250
May 6 2010 5 VDS ID 761141
0 -
FL
OW
RA
TE
(VP
HP
L)
140
0
143
0
150
0
153
0
160
0
163
0
170
0
173
0
180
0
183
0
190
0
193
0
TIME The estimated average non-holiday weekday lost lane-miles by period and year on Ishy210 are shown Exhibits ES-17 (mainline) and ES-18 (HOV) A few notes on these two exhibits
diams The trends in the productivity losses are comparable to the delay trends The largest productivity losses occurred in the eastbound direction during the PM peak hours which is the direction and time period that experienced the most congestion
diams On the mainline facility the westbound direction experienced nearly as high productivity loses during the AM peak period
diams On the HOV lanes a greater productivity loss in the eastbound peak period is more evident
Operational strategies are critical to recovering such productivity losses These strategies include building new or extending auxiliary lanes developing more aggressive ramp metering strategies without negatively influencing the arterial network and improving incident clearance times
I-210 Corridor System Management Plan Executive Summary
Page 20 of 39
Exhibit ES-17 Mainline Daily Equivalent Lost Lane-Miles by Direction and Period (2005-09)
-
10
20
30
40
50
60
70
80
90
100
110
120
130
140
150
160
2005 2006 2007 2008 2009 2005 2006 2007 2008 2009 2005 2006 2007 2008 2009 2005 2006 2007 2008 2009
Eastbound
Westbound
AM PM Midday Night Time Period and Year
Daily
Eq
uiv
ale
nt
Lost
Lan
e-M
iles
Exhibit ES-18 HOV Daily Equivalent Lost Lane-Miles by Direction and Period (2005-09)
-
10
20
30
40
2005 2006 2007 2008 2009 2005 2006 2007 2008 2009 2005 2006 2007 2008 2009 2005 2006 2007 2008 2009
Eastbound
Westbound
AM Midday PM Night
Daily
Eq
uiv
ale
nt
Lost
Lan
e-M
iles
Time Period and Year
I-210 Corridor System Management Plan Executive Summary
Page 21 of 39
BOTTLENECK IDENTIFICATION AND CAUSALITY ANALYSIS
Exhibits ES-19 and ES-20 summarize the eastbound and westbound bottleneck locations the time period that each bottleneck is generally active and the causes of the each bottleneck Exhibits ES-21 and ES-22 are maps of the corridor showing these bottleneck locations for the AM and PM peak periods respectively
Major bottlenecks are the primary cause of congestion and lost productivity By definition a bottleneck is a condition where traffic demand exceeds the effective carrying capacity of the roadway In most cases the cause of a bottleneck is related to a sudden reduction in capacity such as a lane drop merging and weaving driver distractions a surge in demand or a combination of factors
The specific location and causality of each major I-210 bottleneck was verified by multiple field observations on separate weekdays throughout the summer fall and winter of 2009 Some bottleneck locations were videotaped to validate bottlenecks and to assist in micro-simulation model calibration
The detailed final report explains in detail the process and results of the bottleneck identification and causality analysis
I-210 Corridor System Management Plan Executive Summary
Page 22 of 39
Exhibit ES-19 I-210 Eastbound Bottleneck Locations
Abs CA Bottleneck
Location
Active
Period Causality Summary
AM PM
250 R250 Fair Oaks Heavy ramp merge
265 R265 Lake On-ramp Heavy ramp merge
286 R287 San Gabriel On-ramp Heavy ramp merge roadway curves
294 R294 Rosemead On-ramp Heavy consecutive ramp merge
330 R327 Huntington Interchange Heavy ramp merge roadway curves
366 R363 I-605 On-ramp traffic weaving with the off-ramp
400 R397 Azusa On-ramp Heavy ramp merge
408 R406 Citrus On-ramp Heavy ramp merge
450 R450 SR-57 On-ramp Heavy ramp merge and lane drop
Exhibit ES-20 I-210 Westbound Bottleneck Locations
Abs CA
Bottleneck
Location
Active
Period Causality Summary
AM PM
401 R398 Azusa On-ramp Consecutive ramp merge curves
368 R365 I-605 Off-ramp Consecutive ramp merge weaving
322 R319 Santa Anita On-ramp Heavy ramp merge roadway curves
307 R304 Baldwin On-ramp Heavy consecutive ramp merge
297 L297 Rosemead On-ramp Three consecutive ramp merges weaving
280 R281 Altadena On-ramp Heavy ramp merge
261 R261 Lake On-ramp Heavy ramp merge
Bottleneck Locations
reg --Bottleneck
Westbound
Eastbound
0 1 2
I bull I I I bull I I I Miles
HJOUAIIO fl _
I-210 Corridor System Management Plan Executive Summary
Page 23 of 39
Exhibit ES-21 I-210 Map of AM Bottleneck Locations
Bottleneck Locations
reg Bottleneck - Westbound - Eastbound
N 0 1 2
bull I I II II II I ll) Mles s
HJOUAIIO fl _
I-210 Corridor System Management Plan Executive Summary
Page 24 of 39
Exhibit ES-22 I-210 Map of PM Bottleneck Locations
I-210 Corridor System Management Plan Executive Summary
Page 25 of 39
SCENARIO DEVELOPMENT AND ANALYSIS
Fully understanding how a corridor performs and why it performs the way it does sets the foundation for evaluating potential solutions Several steps were required to develop and evaluate improvements including
diams Developing traffic models for 2006 base year and 2020 long-term demand diams Combining projects in a logical manner for modeling and testing diams Evaluating model outputs and summarizing results diams Conducting a benefit-cost assessment of scenarios
Traffic Model Development
The study team developed a traffic model using the VISSIM micro-simulation software It is important to note that micro-simulation models are complex to develop and calibrate for a large urban corridor However it is one of the only tools capable of providing a reasonable approximation of bottleneck formation and queue development Therefore such tools help quantify the impacts of operational strategies which traditional travel demand models cannot
The model was calibrated against 2006 conditions This was a resource intensive effort requiring several iterations of submittals and review cycles until the model reasonably matched bottleneck locations and relative severity Once calibration was approved a 2020 model was also developed based on SCAGrsquos travel demand model demand projections
These two models were used to evaluate different scenarios (combinations of projects) to quantify the associated congestion relief benefits and to compare total project costs against their benefits
Exhibit ES-23 depicts the network included in the model There were no parallel arterials modeled with the exception of arterials at interchanges All freeway interchanges were included as well as on-ramps and off-ramps
I-210 Corridor System Management Plan Executive Summary
Page 26 of 39
Exhibit ES-23 Micro-Simulation Model Network
I-210 Corridor System Management Plan Executive Summary
Page 27 of 39
Scenario Development Framework
The study team developed a framework for combining projects into scenarios It would be desirable to evaluate every possible combination of projects However this would have entailed thousands of model runs Instead the team combined projects based on a number of factors including
diams Projects that were fully constructed and completed from 2006 to 2010 were tested with both the 2006 and 2020 models
diams Short- and mid- term operational projects were grouped into scenarios and tested with the both the 2006 and 2020 models
diams Longer-range projects to be delivered by 2020 and beyond were used to develop scenarios to be tested with the 2020 model only
diams Alternative ramp closures were grouped into isolated scenarios (future scenarios did not build on top of these) and tested with both the 2006 and 2020 models
The study assumes that projects delivered before 2016 could reasonably be evaluated using the 2006 base year model The 2020 forecast year for the I-210 study was consistent with the SCAG 2020 regional travel demand model origin-destination matrices used to develop the 2008 Regional Transportation Plan (RTP) When SCAG updates its travel demand model and Regional Transportation Plan (RTP) it may wish to update the micro-simulation model with revised demand projections
Project lists used to develop scenarios were part from the Regional Transportation Improvement Program (RTIP) the RTP and other sources such as special studies Projects that do not directly affect mobility were eliminated For instance sound wall landscaping or minor arterial improvement projects were not evaluated since microshysimulation models cannot evaluate them
Scenario testing performed for the performed for the I-210 CSMP differed from traditional ldquoalternatives evaluationsrdquo done for Major Investment Studies (MIS) or Environmental Impact Reports (EIRs) An MIS or EIR focuses on identifying alternative solutions to address current or projected corridor problems so each alternative is evaluated separately and results among competing alternatives are compared resulting in a locally preferred alternative In contrast for the I-210 CSMP scenarios build on each other in that a scenario contains the projects from the previous scenario plus one or more projects as long as the incremental scenario results showed an acceptable level of performance improvement This incremental scenario evaluation approach is important since CSMPs are new and are often compared with alternatives studies
Exhibit ES-24 summarizes the approach used and scenarios tested and provides a
I-210 Corridor System Management Plan Executive Summary
Page 28 of 39
general description of the projects included in the 2006 and 2020 micro-simulation runs Most projects were tested for both the short- and long-term timeframes Each scenario tested was built upon prior scenarios except for Scenarios 7 and 8 which were ldquostand alonerdquo scenarios used to test alternative ramp closures Later scenarios build on Scenarios 5 and 6 and do not include the improvements tested in Scenarios 7 and 8 Enhanced incident management was tested in Scenarios 11 and 12 by comparing a simulated incident without and with enhanced incident management system Scenarios 13 and 14 are expected for the longer term and were tested only with the 2020 model
Exhibit ES-24 Micro-Simulation Modeling Approach
Short-Term Scenarios Long-Term Scenarios
Calibrated 2006 Base Case
Scenario 1 Expand Ramp-
Metering
Scenario 3 Scenario 1 +
Adv Ramp-Meter w
Queue Control
Scenario 5 Scenario 3 + aux lane striping and
ramp improvements
2020 Horizon Year
2006 Network 2020 OD Matrices
Scenario 7 Scenario 5 +
Ramp Closures
Scenario 2 Expand Ramp-
Metering
Scenario 4 Scenario 2 +
Adv Ramp-Meter w
Queue Control
Scenario 6 Scenario 4 + aux lane striping and
ramp improvements
Scenario 8 Scenario 6 +
Ramp Closures
Scenario 14 Scenario 13 + Lake
Ave Drop Ramp
Lane Addition
Scenario 9 Scenario 5+
On-Ramp amp Aux
lane improvements
Scenario 10 Scenario 6 +
On-Ramp amp Aux
lane improvements
Scenario 11 Incident with No
Incident
Management
Scenario 12 Incident With
Incident
Management
Scenario 13 Scenario 10 +
134210 IC
modification
Incident Management Scenarios
I-210 Corridor System Management Plan Executive Summary
Page 29 of 39
Scenario Evaluation Results
Exhibits ES-25 and ES-26 show the delay results for all the 2006 scenarios evaluated for the AM and PM peak periods respectively Exhibits ES-27 and ES-28 show the delay results for all the 2020 scenarios evaluated for the AM and PM peak periods respectively For each scenario the modeling team produced results by facility type (ie mainline HOV arterials and ramps) and vehicle type (SOV HOV trucks) as well as speed contour diagrams (discussed in more detail in the full technical CSMP) The study team scrutinized to ensure that they were consistent with general traffic engineering principles The following summarizes the findings related to the four exhibits
Exhibit ES-25 2006 AM Peak Micro-Simulation Delay Results by Scenario
De
lay
(Pe
ak
Pe
rio
d V
eh
icle
-Ho
urs
)
2006 Base Year S1 S3 S5 S7 S9 Scenario
18000
16000
14000
12000
10000
8000
6000
4000
2000
-
S1 Expand Ramp Metering
S3 Adv Ramp Metering
S5 Aux Lane Striping Ramp Improvs
S7 Ramp Closures
S9 On-Ramp amp Aux Lane Improvs
-2 -3 -3
-16 -20
HOV WB I-210 WB
HOV EB I-210 EB
Ramps Arterials
I-210 Corridor System Management Plan Executive Summary
Page 30 of 39
Exhibit ES-26 2006 PM Peak Micro-Simulation Delay Results by Scenario
18000
De
lay
(Pe
ak
Pe
rio
d V
eh
icle
-Ho
urs
)
16000
14000
12000
10000
8000
6000
4000
2000
-
S1 Expand Ramp Metering
S3 Adv Ramp Metering
HOV WB
I-210 WB
S5 Aux Lane Striping Ramp Improvs
S7 Ramp Closures
S9 On-Ramp amp Aux Lane Improvs
HOV EB
I-210 EB
Ramps
Arterials
-17
-11
-18
-18 -28
2006 Base Year S1 S3 S5 S7 S9 Scenario
Exhibit ES-27 2020 AM Peak Micro-Simulation Delay Results by Scenario
30000
De
lay
(Pe
ak
Pe
rio
d V
eh
icle
-Ho
urs
)
25000
20000
15000
10000
5000
S2 Expand Ramp Metering
S4 Adv Ramp Metering
S6 Aux Lane Striping Ramp Improvs
S8 Ramp Closures
HOV WB
I-210 WB
HOV EB
-8
-2 -8
-13 -12
S10 On-Ramp amp Aux Lane Improvs
S13 SR-134I-210 IC Modification
S14 Lake Ave Drop Ramp Lane Addition
I-210 EB
Ramps
Arterials
-11
-23
-
2020 S2 S4 S6 S8 S10 S13 S14 Horizon Scenario
I-210 Corridor System Management Plan Executive Summary
Page 31 of 39
Exhibit ES-28 2020 PM Peak Micro-Simulation Delay Results by Scenario D
ela
y(P
ea
k P
eri
od
Ve
hic
le-H
ou
rs)
30000
25000
20000
15000
10000
5000
-
S2 Expand Ramp Metering
S4 Adv Ramp Metering
S6 Aux Lane Striping Ramp Improvs
S8 Ramp Closures
HOV WB
I-210 WB
HOV EB
-14
S10 On-Ramp amp Aux Lane Improvs
S13 SR-134I-210 IC Modification
S14 Lake Ave Drop Ramp Lane Addition
I-210 EB
Ramps
Arterials
-2 -5 -3 -28
-3 -19
2020 S2 S4 S6 S8 S10 S13 S14 Horizon Scenario
Base Year and Do Minimum Horizon Year
Absent any physical improvements the modeling team estimates that by 2020 total delay (mainline HOV ramps and arterials) would double compared to 2006 (from a total of around 22000 vehicle-hours daily to just fewer than 45000 vehicle-hours) in the combined AM and PM peak
Scenarios 1 and 2 (Expand Ramp Metering)
Scenarios 1 and 2 test the only project on the corridor that was fully constructed and completed The project installed new connector metering at the SR-57 and I-605 to Ishy210 freeway connector ramps The project also widened various ramps removed various HOV meter bypasses and upgraded the ramp metering system
The 2006 model estimates that Scenario 1 would reduce delay on the corridor by around 17 percent (or 1600 daily vehicle-hours) in the PM peak period but only around two percent (or 200 vehicle-hours) in the AM peak period The biggest benefits occur in the PM eastbound direction from Rosemead On-Ramp to Huntington interchange (with a delay reduction of over 1000 vehicle-hours) as well as from I-605 to the Azusa On-Ramp (delay reduction of 500 vehicle-hours) for single occupant vehicles The
I-210 Corridor System Management Plan Executive Summary
Page 32 of 39
westbound reductions in freeway delay are largely offset by increased on-ramp delay mostly from new connector metering at SR-57 and I-605
The 2020 model estimates that Scenario 2 will reduce delay by around 8 percent in the AM peak and 14 percent in the PM peak for a combined total reduction of 5000 daily vehicle-hours The long-term improvements are less than the short-term improvements due to the increase in demand
Scenarios 3 and 4 (Advanced Ramp Metering)
Scenarios 3 and 4 build on Scenarios 1 and 2 by adding advanced ramp metering system such as dynamic or adaptive ramp metering system
The 2006 model shows that Scenario 3 would reduce delay by an additional 850 daily vehicle-hours (or 11 percent) in the PM peak with a marginal reduction in the AM peak period However in conjunction with Scenario 1 Scenario 3 reduces delay in total by over 600 vehicle-hours in the AM peak These results suggest that queue control provides additional benefits beyond SWARM
The 2020 model estimates that Scenario 4 will modestly reduce delay by about 2 percent in both the AM and PM peaks or a combined total of 800 daily vehicle-hours Again the benefits are lower in percentage terms due to the increase in demand
Note that there are various types of advanced ramp metering systems deployed around the world including System-wide Adaptive Ramp Metering System or SWARM tested recently in Los Angeles I-210 freeway corridor For the I-210 model the Asservissement Lineaire drsquoEntreacutee Autoroutiere (ALINEA system) was tested as proxy for any advanced ramp metering system as its algorithm for the model was readily available It is not necessarily recommended that ALINEA be deployed but rather some type of advanced ramp metering system that would produce similar if not better results
Scenarios 5 and 6 (Auxiliary Lane Striping Ramp Improvements)
Scenarios 5 and 6 build on Scenarios 3 and 4 that include several relatively lower-cost operational improvements that could be implemented by 2015
diams Building a westbound auxiliary lane from Santa Anita to Baldwin and an eastbound auxiliary lane from Santa Anita to Huntington
diams Extending a lane to Lincoln on the westbound I-210 connector
diams Connecting and converging the Altadena on-ramps into a single on-ramp
I-210 Corridor System Management Plan Executive Summary
Page 33 of 39
diams Connecting and converging the Santa Anita on-ramps into a single on-ramp
diams Connecting and converging the Irwindale on-ramps into a single on-ramp
diams Restriping to add a lane in the eastbound direction from San Dimas to Fruit
The 2006 model shows that Scenario 5 reduces delay by 3 percent (nearly 400 vehicleshyhours) in the AM peak and 18 percent (1200 vehicle-hours) in the PM peak The segment that experienced the largest improvement in the eastbound during the PM peak was from Rosemead to Huntington This segment experienced a 45 percent improvement in delay (from 2700 vehicle-hours to 1500 vehicle-hours) which is likely attributed to the eastbound auxiliary lane from Santa Anita to Huntington In the westbound direction the auxiliary lane from Santa Anita to Baldwin shifts some traffic downstream to cause increased congestion at Michillinda (ie bottleneck shift) during the westbound AM peak However the auxiliary lane helps reduce both queue length and queue duration for the Santa Anita bottleneck
The 2020 model estimates that Scenario 6 would reduce delay by 8 percent in the AM peak and 5 percent in the PM peak for a total reduction of 2500 daily vehicle-hours A reduction in PM delay is expected to occur mostly in the westbound direction
Scenarios 7 and 8 (Ramp Closures)
Scenarios 7 and 8 build on Scenarios 5 and 6 and test the closure of several ramps
diams Eastbound Marengo on-ramp and westbound Lake on-ramp with signalization of the eastbound I-210 off-ramp at Maple and improvement to alternate routes along Corson and Maple
diams Eastbound Mount Olive ramps
Note that subsequent scenarios are not built on top of these scenarios as these are isolated to test ramp closure alternatives
The 2006 model shows that Scenario 7 would reduce delay significantly by 16 percent in the AM peak and 18 percent in the PM peak for a total delay reduction of nearly 3000 daily vehicle-hours The delay reductions are significant on the mainline during the peak direction of travel ndash 1400 vehicle-hours in the westbound AM and 912 vehicleshyhours in the eastbound PM In the westbound direction and AM peak period the segment from Altadena to Lake experienced over an 85 percent decrease in congestion (from 860 to 120 vehicle-hours of delay) This is likely attributed to the closure of the westbound Lake on-ramp In the eastbound direction and PM peak period the segment from Huntington to I-605 experienced a delay reduction of over 70 percent (from 2200
I-210 Corridor System Management Plan Executive Summary
Page 34 of 39
vehicle-hours to 600 vehicle-hours) which is likely attributed to the closure of the Mount Olive ramp
The 2020 model also shows that Scenario 8 improved delay by 12 percent in the AM and 3 percent in the PM for a total delay reduction of almost 3000 daily vehicle-hours On the mainline facility delay also improved for each peak direction of travel ndash by 1600 daily vehicle-hours in the westbound AM and by 750 vehicle-hours in the eastbound PM Delay reductions in the non-peak direction were not as significant
Scenarios 9 and 10 (On-ramp and Aux Lane Improvements)
Scenarios 9 and 10 build on Scenarios 5 and 6 and test four operational improvements that can be implemented in the short to medium range
diams Modify the RosemeadMichillinda interchange and converge the westbound I-210 on-ramps
diams Modify the northside of the Baldwin interchange and eliminate the collectorshydistributor
diams Construct an eastbound auxiliary lane from Azusa to Citrus
diams Converge the eastbound Citrus on-ramps and add an auxiliary lane to Grand
The 2006 model estimates that Scenario 9 will reduce delay by 20 percent (or 2400 daily vehicle-hours) in the AM peak and 28 percent (or 1600 daily vehicle-hours) in the PM peak compared to Scenario 5 In both AM and PM peak period the eastbound direction experienced the largest reduction in delay
The 2020 model estimates that Scenario 10 will reduce delay by 13 percent (or 2500 vehicle-hours) in the AM peak and 28 percent in the PM peak (or 4800 vehicle-hours) compared to Scenario 6 Similar to the 2006 model the 2020 model shows that these improvements produced a greater reduction in delay in the eastbound direction than the westbound direction
Scenarios 11 and 12 (Enhanced Incident Management)
Two incident scenarios were tested on top of Scenario 10 to evaluate the non-recurrent delay reductions resulting from enhanced incident management strategies An enhanced incident management system would entail upgrading or enhancing the current Caltrans incident management system that includes deployment of intelligent transportation system (ITS) field devices central controlcommunications software communications medium (ie fiber optic lines) advanced traveler information system
I-210 Corridor System Management Plan Executive Summary
Page 35 of 39
andor freeway service patrol (FSP) program to reduce incident detection verification response and clearance times
In the first scenario Scenario 11 one collision incident with one lane closure was simulated in the westbound direction in the AM peak period model and one in the eastbound direction in the PM peak period model The incident simulation location and duration were selected based on review of the 2010 actual incident data at one of the high frequency locations The following are the Scenario details
diams Westbound AM peak period starting at 800 AM close mainline lane 2 for 40 minutes at absolute post mile 2612 (at Lake Avenue)
diams Eastbound PM peak period starting at 500 PM close mainline lane 2 for 50 minutes at absolute post mile 3207 (west of Santa Anita)
In the second scenario Scenario 12 the same collision incidents were simulated with a reduction in duration by 10 minutes in the westbound direction and by 12 minutes in the eastbound direction It is estimated based on actual incident management data analysis results provided by Caltrans that an enhanced incident management system could reduce a 35-minute incident by about 10 minutes This scenario represents a typical moderate level incident at one location during the peak period direction Data suggest that incidents vary significantly in terms of impact and duration Some incidents last hundreds of minutes some close multiple lanes and some occur at multiple locations simultaneously There are also numerous minor incidents lasting only a few minutes without lane closures that can result in congestion Many other incidents also occur during off-peak hours
Without enhanced incident management Scenario 11 produced an 8 percent increase in congestion in both peak periods over Scenario 10 an increase of over 2300 hours of vehicle delay With enhanced incident management Scenario 12 evaluation resulted in delay decrease by 2 percent in the AM peak and 3 percent in the PM peak against Scenario 11 results a reduction of nearly 750 vehicle-hours for improving the incident detection verification response and clearance time of one moderate level incident for both of the peak hours
Scenario 13 (SR-134I-210 Interchange Modification)
Scenario 13 tests an improvement to modify the SR-134I-210 interchange to provide a direct connection for vehicles to continue on I-210 with three lanes in each direction This improvement was tested with the 2020 model since it is not likely to be implemented in the short-term
I-210 Corridor System Management Plan Executive Summary
Page 36 of 39
The 2020 model estimates that delay would be reduced by 11 percent (or 1800 daily vehicle-hours) in the AM and 3 percent in the PM (320 daily vehicle-hours) compared to Scenario 10 The westbound mainline experienced the greatest reduction in delay in the AM peak from 9600 vehicle-hours to 8600 vehicle hours after the interchange modification
Scenario 14 (Westbound Drop Ramp and Eastbound Widening)
Scenario 14 builds on Scenario 13 and tests Lake Avenue drop ramp to westbound Ishy210 center lanes (one HOV lane and one mainline) and eastbound I-210 widening from Myrtle to I-605 This improvement was tested with the 2020 model
The 2020 model estimates that delay would be reduced by about 20 percent in the AM or 3400 vehicle-hours and 20 percent in the PM or 2300 vehicle-hours compared to Scenario 13 The mobility improvements are significant with the westbound drop ramp that reduces weaving between SR-134 and SR-210 destined traffic and with the eastbound capacity addition to I-605 off that moves the off-ramp traffic away from the mainline and provides more room for the mainline through traffic
Post Scenario 14 Conditions
By 2020 with the inclusion of all the projects tested the model reveals some residual congestion that remains to address with future improvements According to the model results the total remaining delay on the corridor is around 21000 daily vehicle-hours
Benefit-Cost Analysis
Following an in-depth review of model results by the study team and the SCAG technical committee the study team performed a benefit-cost analysis (BCA) for each scenario
Using the California Benefit-Cost Model (Cal-BC) developed on behalf of Caltrans by the study team benefits in three key areas were estimated travel time savings vehicle operating cost savings and emission reduction savings The benefits generated from this exercise are based solely on congestion relief related benefits However these results are conservative since there are other benefits not captured by this analysis including benefits from deploying bus rapid transit which will achieve other accessibility benefits
Project costs were developed from SCAG and Caltrans project planning and programming documents These costs include construction and support costs in current dollars The study team estimated costs for projects that did not have cost
I-210 Corridor System Management Plan Executive Summary
Page 37 of 39
estimates by reviewing similar completed projects A BC greater than one means that a scenarios projects return greater benefits than it costs to construct or implement It is important to consider the total benefits that a project brings For example a large capital expansion project can cost a great deal and have a low BC ratio but brings much higher absolute benefits to the I-210 users Exhibit ES-29 shows the benefit to cost ranges classified from low (with a BC of one to two) to very high (with a BC of over 10)
The benefit-cost results for the South Corridor scenarios are shown in Exhibit ES-29
Exhibit ES-29 I-210 Scenario BenefitCost (BC) Results
Scenario Scenario Description
BenefitCost Ranges
Low Medium Medium-High High Very High
lt1 1 to 2 2 to 5 5 to 10 gt10
12 Expand Ramp Metering 34 Advanced Ramp Metering 56 Aux Lane Striping Ramp Improvs 78 Ramp Closures
910 On-Ramp amp Aux Lane Improvs 13 SR-134I-210 IC Modification
The benefit-cost findings for each scenario are as follows
diams Scenarios 1 and 2 (ramp metering expansion) shows a high benefit-cost ratio of over ten The relatively high benefit-cost ratio is due to the low cost of expanding ramp metering ($235 million)
diams Scenarios 3 and 4 (advanced ramp metering) resulted in an incremental benefitshycost ratio of over ten This is relatively high as compared to that of typical transportation management system project
diams Scenarios 5 and 6 (operational improvements) produced a benefit-cost ratio of over five This is relatively consistent with other typical operational improvement projects The benefits are substantial At estimated total cost of about $44 million these projects produced benefits of over $233 million
diams Scenarios 7 and 8 tested the ramp closures at eastbound Marengo westbound Lake and eastbound Mount Olive These ramp closured produced an extremely high incremental benefit-cost ratio of over ten due to the relatively very low cost However this benefit-cost calculation does not account for any potential increase in delay on various local arterials because of detours from the closed ramps
diams Scenarios 9 and 10 also produced a relatively high benefit-cost ratio of over ten The four operational projects in these scenarios are collectively estimated to cost
I-210 Corridor System Management Plan Executive Summary
Page 38 of 39
under $30 million and provide a substantial and optimistic benefit of over $670 million
diams Scenario 13 tested the SR-134I-210 interchange modification This project produced a benefit-cost ratio of between one and two consistent with other typical capital expansion projects This project produced benefits of over $200 million at a rough-estimate cost of about $150 million
diams Scenario 14 tested the westbound center drop ramp from Lake Avenue interchange and eastbound lane addition from Myrtle to I-605 These projects produced a relatively high benefit-cost ratio of about 6 to one as compared to other capital improvement projects These two capital projects are unique in that they have specific operational improvement element that addresses major bottleneck locations For an estimated total combined cost of about $70 million the projected benefits exceed $420 million
CONCLUSIONS AND RECOMMENDATIONS
This section summarizes the conclusions and recommendations based on the analysis discussed in the previous section It is important to note that many of these conclusions are based primarily on the micro-simulation model results The model was developed based on the best data available at the time The study team reviewed the model results and believe that both the calibrated base year forecast year and scenario results are reasonable However Caltrans should always be cautious to make decisions based on modeling alone especially complex micro-simulation models
Based on the results the study team offers the following conclusions and recommendations
diams The combination of all scenarios significantly reduces overall congestion on the corridor Projected 2020 congestion after implementation of all scenarios is below 2006 levels in both the AM and PM peak period In the AM peak period the model projects total delay in 2020 after delivering all projects to be less than 11700 vehicle-hours compared to the 2006 base year delay of 13000 vehicleshyhours This represents a reduction of over 10 percent In the PM peak period the model projects total delay in 2020 after delivering all projects to be around 9500 hours compared to the 2006 base year delay of almost 9300 vehicle-hours This represents a slight reduction of 2 percent Clearly the scenarios deliver significant mobility benefits to the corridor Despite the growth in demand future 2020 congestion will be less than experienced in 2006
diams The completed ramp metering expansion project is expected to produce substantial mobility benefits of over $400 million Delay has been significantly reduced since 2006
I-210 Corridor System Management Plan Executive Summary
Page 39 of 39
diams Advanced ramp metering could provide additional mobility improvements by significantly reducing congestion and returning over $100 million in benefits
diams Ramp closures at Marengo Lake and Mount Olive as alternatives seem promising by reducing delay up to 3000 vehicle-hours per day and providing substantial benefits of $280 million at an extremely low cost
diams Operational improvements such as auxiliary lanes and ramp improvements could leverage on the ramp metering projects by making the corridor more efficient and productive that could result in additional mobility benefits of over $230 million
diams Additional capital improvements with specific operational elements to address weaving at major bottleneck locations could produce significant mobility benefits of over $420 million
diams Enhanced incident management system associated with Scenarios 11 and 12 to address non-recurrent congestion proved effective with a delay reduction of over 300 vehicle-hours for one modest level incident with a typical duration of 35 minutes reduced to 25 minutes With the I-210 corridor experiencing up to 2400 collisions per year this translates to a total annual delay savings of over 700000 vehicle-hours for the study corridor
diams The benefit-cost ratio of all scenarios combined is about 64 to 1 If all projects were delivered at current cost estimates the public would get over six dollars of benefits for each dollar expended In current dollars costs total to over $17 billion whereas the benefits are estimated to be over $20 billion
diams The projects also alleviate greenhouse gas (GHG) emissions by over 15 million tons over 20 years averaging over a 75000-ton reduction per year The emissions are estimated using data from the California Air Resources Board (CARB) EMFAC model
This is the first generation CSMP for the I-210 corridor It is important to stress that CSMPs should be updated on a regular basis This is particularly important since traffic conditions and patterns can differ from current projections After projects are delivered it is also useful to compare actual results with estimated ones in this document so that models can be further improved as appropriate
CSMPs or a variation thereof should become the normal course of business that is based on detailed performance assessments an in-depth understanding of the reasons for performance deterioration and an analytical framework that allows for evaluating complementary operational strategies that maximize the productivity of the current system

Tra
ve
l T
ime
(m
inu
tes
) T
rav
el
Tim
e (
min
ute
s)
45
40
35
30
25
20
15
10
5
0
45
40
35
30
25
20
15
10
5
0
I-210 Corridor System Management Plan Executive Summary
Page 13 of 39
Exhibit ES-10 Eastbound HOV Lanes Travel Time by Hour (2005-2009) 50
2009 Average Travel Time
2008 Average Travel Time
2007 Average Travel Time
2006 Average Travel Time
2005 Average Travel Time
Travel Time 60mph
Travel Time 35mph
Hour of the Day
00
0
10
0
20
0
30
0
40
0
50
0
60
0
70
0
80
0
90
0
100
0
110
0
120
0
130
0
140
0
150
0
160
0
170
0
180
0
190
0
200
0
210
0
220
0
Hour of the Day
Exhibit ES-11 Westbound HOV Lanes Travel Time by Hour (2005-2009) 50
2009 Average Travel Time
2008 Average Travel Time
2007 Average Travel Time
2006 Average Travel Time
2005 Average Travel Time
Travel Time 60mph
Travel Time 35mph
00
0
10
0
20
0
30
0
40
0
50
0
60
0
70
0
80
0
90
0
100
0
110
0
120
0
130
0
140
0
150
0
160
0
170
0
180
0
190
0
200
0
210
0
220
0
230
0
230
0
I-210 Corridor System Management Plan Executive Summary
Page 14 of 39
Reliability
Reliability captures the degree of predictability in travel time Reliability focuses on how travel time varies from day to day and reflects the impacts of accidents incidents weather and special events Improving reliability is an important goal for transportation agencies and efforts to accomplish this include incident management traveler information and special event planning
To measure reliability the CSMP used the ldquobuffer indexrdquo which reflects the additional time required (over and beyond the average) to ensure an on-time arrival 95 percent of the time In other words if a person must be on time 95 days out of 100 (or 19 out of 20 workdays per month) then that person must add additional time to their average expected travel time to ensure an on-time arrival That additional time is the buffer time Severe events such as collisions could cause longer travel times but the 95th percentile represents a balance between days with extreme events (eg major accidents) and other more ldquotypicalrdquo travel days
Exhibits ES-12 and ES-13 show the estimated mainline lane travel time variability along I-210 on non-holiday weekdays for 2006 in the eastbound and westbound directions respectively The main report shows the buffer index for the years 2005-2009 for both mainline and HOV lanes but this Executive Summary reports only the data for the year 2006 for mainlines since that year was used as the base year for modeling
The following observations on the reliability results are worth noting
bull In 2006 in the eastbound direction 500 PM had the highest estimated average travel time at approximately 41 minutes and the highest estimated buffer index time of 15 minutes for a buffer index of 33 percent In other words to arrive on time 95 percent of the time a commuter would need to leave for work 56 minutes before the start time to travel the entire length of the I-210 study corridor
bull The westbound direction the 700 AM had the estimated average travel time of 39 minutes in 2006 with a buffer time of 15 minutes for a buffer index of 38 percent
70
65
60
55
50
45
40
35
30
25
20
15
10
5
0
70
65
60
55
50
45
40
35
30
25
20
15
10
5
0
Average Travel Time
Travel Time Variability (95th Percentile)
Travel Time at 60mph
Travel Time at 35mph
TIME OF DAY
Exhibit ES-13 Westbound Mainline Lanes Travel Time Variability (2006)
75
TIME OF DAY
Average Travel Time
Travel Time Variability (95th Percentile)
Travel Time at 60mph
Travel Time at 35mph
Exhibit ES-12 Eastbound Mainline Lanes Travel Time Variability (2006)
75
I-210 Corridor System Management Plan Executive Summary
Page 15 of 39
TR
AV
EL
TIM
E (
MIN
)
00
000
0
10
010
0
TR
AV
EL
TIM
E (
MIN
)
20
020
0
30
030
0
40
040
0
50
050
0
60
060
0
70
070
0
80
080
0
90
090
0
100
01
00
0
110
01
10
0
120
01
20
0
130
01
30
0
140
01
40
0
150
01
50
0
160
01
60
0
170
01
70
0
180
01
80
0
190
01
90
0
200
02
00
0
210
02
10
0
220
02
20
0
230
02
30
0
00
0
00
0
I-210 Corridor System Management Plan Executive Summary
Page 16 of 39
Safety
The adopted performance measures to assess safety involve the number of accidents and the accident rates computed from the Caltrans Traffic Accident Surveillance and Analysis System (TASAS) TASAS is a traffic records system containing an accident database linked to a highway database The highway database contains descriptive elements of highway segments intersections and ramps access control traffic volumes and other data TASAS contains specific data for accidents on State highways Accidents on non-State highways are not included (eg local streets and roads)
The safety assessment in this report intends to characterize the overall accident history and trends in the corridor and to highlight notable accident concentration locations or patterns that are readily apparent This report does not intend to supplant more detailed safety investigations routinely performed by Caltrans staff
Exhibits ES-14 and ES-15 show the I-210 total number of eastbound and westbound accidents by month respectively For the accident analysis the corridor is split in half the ldquoless urbanrdquo western half of the corridor from I-5 (postmile 0) in Sylmar to SR-134 in Pasadena (postmile R2200) and the ldquomore urbanrdquo eastern half from SR-134 to SR-57 (postmile R45) in San Dimas The latest available TASAS data from PeMS is to December 30 2008 Accidents are reported for the study corridor and not separated by mainline and HOV facility The exhibits summarize the latest available three-year data from January 1 2006 through December 31 2008
Both the eastbound and westbound directions have similar accident profiles with the more urbanized eastern half of the corridor (postmile R22 to R45) experiencing nearly 45 times as many accidents as the western half (PM 0 to R22) The eastbound (Exhibit ES-13) direction has around 79 accidents on average per month in the more-urbanized section and just fewer than 18 accidents in the less-urbanized section
The westbound direction has just fewer than 78 accidents on average per month in the more-urbanized section and just fewer than 18 in the less-urbanized section This is very similar to the eastbound direction
Nu
mb
er
of
Ac
cid
en
ts
Nu
mb
er
of
Accid
en
ts
I-210 Corridor System Management Plan Executive Summary
Page 17 of 39
Exhibit ES-14 Eastbound I-210 Monthly Collisions (2004-2008) 120
110
100
90
80
70
60
50
40
30
20
10
0
Jan
Feb
Mar
Ap
rM
ay
Ju
nJu
lA
ug
Sep
Oct
No
vD
ec
Jan
Feb
Mar
Ap
rM
ay
Ju
nJu
lA
ug
Sep
Oct
No
vD
ec
Jan
Feb
Mar
Ap
rM
ay
Ju
nJu
lA
ug
Sep
Oct
No
vD
ec
Jan
Feb
Mar
Ap
rM
ay
Ju
nJu
lA
ug
Sep
Oct
No
vD
ec
Jan
Feb
Mar
Ap
rM
ay
Ju
nJu
lA
ug
Sep
Oct
No
vD
ec
2004 2005 2006 2007 2008
Less Urbanized Western Section (I-5 to SR-134)
More Urbanized Eastern Section (SR-134 to SR-57)
110
100
90
80
70
60
50
40
30
20
10
0
Exhibit ES-15 Westbound I-210 Monthly Collisions (2004-2008) 120
Jan
Feb
Mar
Ap
rM
ay
Ju
nJu
lA
ug
Sep
Oct
No
vD
ec
Jan
Feb
Mar
Ap
rM
ay
Ju
nJu
lA
ug
Sep
Oct
No
vD
ec
Jan
Feb
Mar
Ap
rM
ay
Ju
nJu
lA
ug
Sep
Oct
No
vD
ec
Jan
Feb
Mar
Ap
rM
ay
Ju
nJu
lA
ug
Sep
Oct
No
vD
ec
Jan
Feb
Mar
Ap
rM
ay
Ju
nJu
lA
ug
Sep
Oct
No
vD
ec
2004 2005 2006 2007 2008
Less Urbanized Western Section (I-5 to SR-134)
More Urbanized Eastern Section (SR-134 to SR-57)
I-210 Corridor System Management Plan Executive Summary
Page 18 of 39
Productivity
Productivity is a system efficiency measure used to analyze the throughput of the corridor during congested conditions Restoring lost productivity is one focus area of CSMPs
Exhibit ES-16 illustrates how congestion leads to lost productivity The exhibit uses observed I-210 data from sensors for a typical spring 2010 afternoon peak period (Thursday May 6 2010) It shows speeds (red line) and flow rates (blue line) on eastbound I-210 at Huntington Drive one of the most congested locations on the corridor
Flow rates (measured as vehicle-per-hour-per-lane or ldquovphplrdquo) at Huntington Drive averaged around 1800 vphpl between 200 PM and 300 PM Once volumes approach a maximum flow rate of around 2000 vphl traffic becomes unstable Any additional merging or weaving traffic breaks down and speeds can rapidly plummet to below 35 mph In essence every incremental merge takes up two spots on the freeway for a short time However since the volume is close to the capacity these merges lead to queues Moreover rather than accommodating the same number of vehicles flow rates also drop and vehicles back up creating bottlenecks and associated congestion
At the location shown in Exhibit ES-16 throughput drops by over 30 percent on average during the peak period (from over 1800 to around 1200 vphpl) This five-lane road therefore operates as if lost 30 percent capacity when demand is at its highest Stated differently just when the corridor needed the most capacity it performed in the least productive manner and effectively lost lanes This loss in throughput can be aggregated and presented as ldquoEquivalent Lost-Lane-Milesrdquo
I-210 Corridor System Management Plan Executive Summary
Page 19 of 39
Exhibit ES-16 Lost Productivity Illustrated
70 2000
65
60 1750
50
55 1500
SP
EE
D
45 1250
40
35 1000
30 Speed lt35mph
750 25
20 500 I-210 EB
15 Los Angeles County Huntington
10 PM=3338 250
May 6 2010 5 VDS ID 761141
0 -
FL
OW
RA
TE
(VP
HP
L)
140
0
143
0
150
0
153
0
160
0
163
0
170
0
173
0
180
0
183
0
190
0
193
0
TIME The estimated average non-holiday weekday lost lane-miles by period and year on Ishy210 are shown Exhibits ES-17 (mainline) and ES-18 (HOV) A few notes on these two exhibits
diams The trends in the productivity losses are comparable to the delay trends The largest productivity losses occurred in the eastbound direction during the PM peak hours which is the direction and time period that experienced the most congestion
diams On the mainline facility the westbound direction experienced nearly as high productivity loses during the AM peak period
diams On the HOV lanes a greater productivity loss in the eastbound peak period is more evident
Operational strategies are critical to recovering such productivity losses These strategies include building new or extending auxiliary lanes developing more aggressive ramp metering strategies without negatively influencing the arterial network and improving incident clearance times
I-210 Corridor System Management Plan Executive Summary
Page 20 of 39
Exhibit ES-17 Mainline Daily Equivalent Lost Lane-Miles by Direction and Period (2005-09)
-
10
20
30
40
50
60
70
80
90
100
110
120
130
140
150
160
2005 2006 2007 2008 2009 2005 2006 2007 2008 2009 2005 2006 2007 2008 2009 2005 2006 2007 2008 2009
Eastbound
Westbound
AM PM Midday Night Time Period and Year
Daily
Eq
uiv
ale
nt
Lost
Lan
e-M
iles
Exhibit ES-18 HOV Daily Equivalent Lost Lane-Miles by Direction and Period (2005-09)
-
10
20
30
40
2005 2006 2007 2008 2009 2005 2006 2007 2008 2009 2005 2006 2007 2008 2009 2005 2006 2007 2008 2009
Eastbound
Westbound
AM Midday PM Night
Daily
Eq
uiv
ale
nt
Lost
Lan
e-M
iles
Time Period and Year
I-210 Corridor System Management Plan Executive Summary
Page 21 of 39
BOTTLENECK IDENTIFICATION AND CAUSALITY ANALYSIS
Exhibits ES-19 and ES-20 summarize the eastbound and westbound bottleneck locations the time period that each bottleneck is generally active and the causes of the each bottleneck Exhibits ES-21 and ES-22 are maps of the corridor showing these bottleneck locations for the AM and PM peak periods respectively
Major bottlenecks are the primary cause of congestion and lost productivity By definition a bottleneck is a condition where traffic demand exceeds the effective carrying capacity of the roadway In most cases the cause of a bottleneck is related to a sudden reduction in capacity such as a lane drop merging and weaving driver distractions a surge in demand or a combination of factors
The specific location and causality of each major I-210 bottleneck was verified by multiple field observations on separate weekdays throughout the summer fall and winter of 2009 Some bottleneck locations were videotaped to validate bottlenecks and to assist in micro-simulation model calibration
The detailed final report explains in detail the process and results of the bottleneck identification and causality analysis
I-210 Corridor System Management Plan Executive Summary
Page 22 of 39
Exhibit ES-19 I-210 Eastbound Bottleneck Locations
Abs CA Bottleneck
Location
Active
Period Causality Summary
AM PM
250 R250 Fair Oaks Heavy ramp merge
265 R265 Lake On-ramp Heavy ramp merge
286 R287 San Gabriel On-ramp Heavy ramp merge roadway curves
294 R294 Rosemead On-ramp Heavy consecutive ramp merge
330 R327 Huntington Interchange Heavy ramp merge roadway curves
366 R363 I-605 On-ramp traffic weaving with the off-ramp
400 R397 Azusa On-ramp Heavy ramp merge
408 R406 Citrus On-ramp Heavy ramp merge
450 R450 SR-57 On-ramp Heavy ramp merge and lane drop
Exhibit ES-20 I-210 Westbound Bottleneck Locations
Abs CA
Bottleneck
Location
Active
Period Causality Summary
AM PM
401 R398 Azusa On-ramp Consecutive ramp merge curves
368 R365 I-605 Off-ramp Consecutive ramp merge weaving
322 R319 Santa Anita On-ramp Heavy ramp merge roadway curves
307 R304 Baldwin On-ramp Heavy consecutive ramp merge
297 L297 Rosemead On-ramp Three consecutive ramp merges weaving
280 R281 Altadena On-ramp Heavy ramp merge
261 R261 Lake On-ramp Heavy ramp merge
Bottleneck Locations
reg --Bottleneck
Westbound
Eastbound
0 1 2
I bull I I I bull I I I Miles
HJOUAIIO fl _
I-210 Corridor System Management Plan Executive Summary
Page 23 of 39
Exhibit ES-21 I-210 Map of AM Bottleneck Locations
Bottleneck Locations
reg Bottleneck - Westbound - Eastbound
N 0 1 2
bull I I II II II I ll) Mles s
HJOUAIIO fl _
I-210 Corridor System Management Plan Executive Summary
Page 24 of 39
Exhibit ES-22 I-210 Map of PM Bottleneck Locations
I-210 Corridor System Management Plan Executive Summary
Page 25 of 39
SCENARIO DEVELOPMENT AND ANALYSIS
Fully understanding how a corridor performs and why it performs the way it does sets the foundation for evaluating potential solutions Several steps were required to develop and evaluate improvements including
diams Developing traffic models for 2006 base year and 2020 long-term demand diams Combining projects in a logical manner for modeling and testing diams Evaluating model outputs and summarizing results diams Conducting a benefit-cost assessment of scenarios
Traffic Model Development
The study team developed a traffic model using the VISSIM micro-simulation software It is important to note that micro-simulation models are complex to develop and calibrate for a large urban corridor However it is one of the only tools capable of providing a reasonable approximation of bottleneck formation and queue development Therefore such tools help quantify the impacts of operational strategies which traditional travel demand models cannot
The model was calibrated against 2006 conditions This was a resource intensive effort requiring several iterations of submittals and review cycles until the model reasonably matched bottleneck locations and relative severity Once calibration was approved a 2020 model was also developed based on SCAGrsquos travel demand model demand projections
These two models were used to evaluate different scenarios (combinations of projects) to quantify the associated congestion relief benefits and to compare total project costs against their benefits
Exhibit ES-23 depicts the network included in the model There were no parallel arterials modeled with the exception of arterials at interchanges All freeway interchanges were included as well as on-ramps and off-ramps
I-210 Corridor System Management Plan Executive Summary
Page 26 of 39
Exhibit ES-23 Micro-Simulation Model Network
I-210 Corridor System Management Plan Executive Summary
Page 27 of 39
Scenario Development Framework
The study team developed a framework for combining projects into scenarios It would be desirable to evaluate every possible combination of projects However this would have entailed thousands of model runs Instead the team combined projects based on a number of factors including
diams Projects that were fully constructed and completed from 2006 to 2010 were tested with both the 2006 and 2020 models
diams Short- and mid- term operational projects were grouped into scenarios and tested with the both the 2006 and 2020 models
diams Longer-range projects to be delivered by 2020 and beyond were used to develop scenarios to be tested with the 2020 model only
diams Alternative ramp closures were grouped into isolated scenarios (future scenarios did not build on top of these) and tested with both the 2006 and 2020 models
The study assumes that projects delivered before 2016 could reasonably be evaluated using the 2006 base year model The 2020 forecast year for the I-210 study was consistent with the SCAG 2020 regional travel demand model origin-destination matrices used to develop the 2008 Regional Transportation Plan (RTP) When SCAG updates its travel demand model and Regional Transportation Plan (RTP) it may wish to update the micro-simulation model with revised demand projections
Project lists used to develop scenarios were part from the Regional Transportation Improvement Program (RTIP) the RTP and other sources such as special studies Projects that do not directly affect mobility were eliminated For instance sound wall landscaping or minor arterial improvement projects were not evaluated since microshysimulation models cannot evaluate them
Scenario testing performed for the performed for the I-210 CSMP differed from traditional ldquoalternatives evaluationsrdquo done for Major Investment Studies (MIS) or Environmental Impact Reports (EIRs) An MIS or EIR focuses on identifying alternative solutions to address current or projected corridor problems so each alternative is evaluated separately and results among competing alternatives are compared resulting in a locally preferred alternative In contrast for the I-210 CSMP scenarios build on each other in that a scenario contains the projects from the previous scenario plus one or more projects as long as the incremental scenario results showed an acceptable level of performance improvement This incremental scenario evaluation approach is important since CSMPs are new and are often compared with alternatives studies
Exhibit ES-24 summarizes the approach used and scenarios tested and provides a
I-210 Corridor System Management Plan Executive Summary
Page 28 of 39
general description of the projects included in the 2006 and 2020 micro-simulation runs Most projects were tested for both the short- and long-term timeframes Each scenario tested was built upon prior scenarios except for Scenarios 7 and 8 which were ldquostand alonerdquo scenarios used to test alternative ramp closures Later scenarios build on Scenarios 5 and 6 and do not include the improvements tested in Scenarios 7 and 8 Enhanced incident management was tested in Scenarios 11 and 12 by comparing a simulated incident without and with enhanced incident management system Scenarios 13 and 14 are expected for the longer term and were tested only with the 2020 model
Exhibit ES-24 Micro-Simulation Modeling Approach
Short-Term Scenarios Long-Term Scenarios
Calibrated 2006 Base Case
Scenario 1 Expand Ramp-
Metering
Scenario 3 Scenario 1 +
Adv Ramp-Meter w
Queue Control
Scenario 5 Scenario 3 + aux lane striping and
ramp improvements
2020 Horizon Year
2006 Network 2020 OD Matrices
Scenario 7 Scenario 5 +
Ramp Closures
Scenario 2 Expand Ramp-
Metering
Scenario 4 Scenario 2 +
Adv Ramp-Meter w
Queue Control
Scenario 6 Scenario 4 + aux lane striping and
ramp improvements
Scenario 8 Scenario 6 +
Ramp Closures
Scenario 14 Scenario 13 + Lake
Ave Drop Ramp
Lane Addition
Scenario 9 Scenario 5+
On-Ramp amp Aux
lane improvements
Scenario 10 Scenario 6 +
On-Ramp amp Aux
lane improvements
Scenario 11 Incident with No
Incident
Management
Scenario 12 Incident With
Incident
Management
Scenario 13 Scenario 10 +
134210 IC
modification
Incident Management Scenarios
I-210 Corridor System Management Plan Executive Summary
Page 29 of 39
Scenario Evaluation Results
Exhibits ES-25 and ES-26 show the delay results for all the 2006 scenarios evaluated for the AM and PM peak periods respectively Exhibits ES-27 and ES-28 show the delay results for all the 2020 scenarios evaluated for the AM and PM peak periods respectively For each scenario the modeling team produced results by facility type (ie mainline HOV arterials and ramps) and vehicle type (SOV HOV trucks) as well as speed contour diagrams (discussed in more detail in the full technical CSMP) The study team scrutinized to ensure that they were consistent with general traffic engineering principles The following summarizes the findings related to the four exhibits
Exhibit ES-25 2006 AM Peak Micro-Simulation Delay Results by Scenario
De
lay
(Pe
ak
Pe
rio
d V
eh
icle
-Ho
urs
)
2006 Base Year S1 S3 S5 S7 S9 Scenario
18000
16000
14000
12000
10000
8000
6000
4000
2000
-
S1 Expand Ramp Metering
S3 Adv Ramp Metering
S5 Aux Lane Striping Ramp Improvs
S7 Ramp Closures
S9 On-Ramp amp Aux Lane Improvs
-2 -3 -3
-16 -20
HOV WB I-210 WB
HOV EB I-210 EB
Ramps Arterials
I-210 Corridor System Management Plan Executive Summary
Page 30 of 39
Exhibit ES-26 2006 PM Peak Micro-Simulation Delay Results by Scenario
18000
De
lay
(Pe
ak
Pe
rio
d V
eh
icle
-Ho
urs
)
16000
14000
12000
10000
8000
6000
4000
2000
-
S1 Expand Ramp Metering
S3 Adv Ramp Metering
HOV WB
I-210 WB
S5 Aux Lane Striping Ramp Improvs
S7 Ramp Closures
S9 On-Ramp amp Aux Lane Improvs
HOV EB
I-210 EB
Ramps
Arterials
-17
-11
-18
-18 -28
2006 Base Year S1 S3 S5 S7 S9 Scenario
Exhibit ES-27 2020 AM Peak Micro-Simulation Delay Results by Scenario
30000
De
lay
(Pe
ak
Pe
rio
d V
eh
icle
-Ho
urs
)
25000
20000
15000
10000
5000
S2 Expand Ramp Metering
S4 Adv Ramp Metering
S6 Aux Lane Striping Ramp Improvs
S8 Ramp Closures
HOV WB
I-210 WB
HOV EB
-8
-2 -8
-13 -12
S10 On-Ramp amp Aux Lane Improvs
S13 SR-134I-210 IC Modification
S14 Lake Ave Drop Ramp Lane Addition
I-210 EB
Ramps
Arterials
-11
-23
-
2020 S2 S4 S6 S8 S10 S13 S14 Horizon Scenario
I-210 Corridor System Management Plan Executive Summary
Page 31 of 39
Exhibit ES-28 2020 PM Peak Micro-Simulation Delay Results by Scenario D
ela
y(P
ea
k P
eri
od
Ve
hic
le-H
ou
rs)
30000
25000
20000
15000
10000
5000
-
S2 Expand Ramp Metering
S4 Adv Ramp Metering
S6 Aux Lane Striping Ramp Improvs
S8 Ramp Closures
HOV WB
I-210 WB
HOV EB
-14
S10 On-Ramp amp Aux Lane Improvs
S13 SR-134I-210 IC Modification
S14 Lake Ave Drop Ramp Lane Addition
I-210 EB
Ramps
Arterials
-2 -5 -3 -28
-3 -19
2020 S2 S4 S6 S8 S10 S13 S14 Horizon Scenario
Base Year and Do Minimum Horizon Year
Absent any physical improvements the modeling team estimates that by 2020 total delay (mainline HOV ramps and arterials) would double compared to 2006 (from a total of around 22000 vehicle-hours daily to just fewer than 45000 vehicle-hours) in the combined AM and PM peak
Scenarios 1 and 2 (Expand Ramp Metering)
Scenarios 1 and 2 test the only project on the corridor that was fully constructed and completed The project installed new connector metering at the SR-57 and I-605 to Ishy210 freeway connector ramps The project also widened various ramps removed various HOV meter bypasses and upgraded the ramp metering system
The 2006 model estimates that Scenario 1 would reduce delay on the corridor by around 17 percent (or 1600 daily vehicle-hours) in the PM peak period but only around two percent (or 200 vehicle-hours) in the AM peak period The biggest benefits occur in the PM eastbound direction from Rosemead On-Ramp to Huntington interchange (with a delay reduction of over 1000 vehicle-hours) as well as from I-605 to the Azusa On-Ramp (delay reduction of 500 vehicle-hours) for single occupant vehicles The
I-210 Corridor System Management Plan Executive Summary
Page 32 of 39
westbound reductions in freeway delay are largely offset by increased on-ramp delay mostly from new connector metering at SR-57 and I-605
The 2020 model estimates that Scenario 2 will reduce delay by around 8 percent in the AM peak and 14 percent in the PM peak for a combined total reduction of 5000 daily vehicle-hours The long-term improvements are less than the short-term improvements due to the increase in demand
Scenarios 3 and 4 (Advanced Ramp Metering)
Scenarios 3 and 4 build on Scenarios 1 and 2 by adding advanced ramp metering system such as dynamic or adaptive ramp metering system
The 2006 model shows that Scenario 3 would reduce delay by an additional 850 daily vehicle-hours (or 11 percent) in the PM peak with a marginal reduction in the AM peak period However in conjunction with Scenario 1 Scenario 3 reduces delay in total by over 600 vehicle-hours in the AM peak These results suggest that queue control provides additional benefits beyond SWARM
The 2020 model estimates that Scenario 4 will modestly reduce delay by about 2 percent in both the AM and PM peaks or a combined total of 800 daily vehicle-hours Again the benefits are lower in percentage terms due to the increase in demand
Note that there are various types of advanced ramp metering systems deployed around the world including System-wide Adaptive Ramp Metering System or SWARM tested recently in Los Angeles I-210 freeway corridor For the I-210 model the Asservissement Lineaire drsquoEntreacutee Autoroutiere (ALINEA system) was tested as proxy for any advanced ramp metering system as its algorithm for the model was readily available It is not necessarily recommended that ALINEA be deployed but rather some type of advanced ramp metering system that would produce similar if not better results
Scenarios 5 and 6 (Auxiliary Lane Striping Ramp Improvements)
Scenarios 5 and 6 build on Scenarios 3 and 4 that include several relatively lower-cost operational improvements that could be implemented by 2015
diams Building a westbound auxiliary lane from Santa Anita to Baldwin and an eastbound auxiliary lane from Santa Anita to Huntington
diams Extending a lane to Lincoln on the westbound I-210 connector
diams Connecting and converging the Altadena on-ramps into a single on-ramp
I-210 Corridor System Management Plan Executive Summary
Page 33 of 39
diams Connecting and converging the Santa Anita on-ramps into a single on-ramp
diams Connecting and converging the Irwindale on-ramps into a single on-ramp
diams Restriping to add a lane in the eastbound direction from San Dimas to Fruit
The 2006 model shows that Scenario 5 reduces delay by 3 percent (nearly 400 vehicleshyhours) in the AM peak and 18 percent (1200 vehicle-hours) in the PM peak The segment that experienced the largest improvement in the eastbound during the PM peak was from Rosemead to Huntington This segment experienced a 45 percent improvement in delay (from 2700 vehicle-hours to 1500 vehicle-hours) which is likely attributed to the eastbound auxiliary lane from Santa Anita to Huntington In the westbound direction the auxiliary lane from Santa Anita to Baldwin shifts some traffic downstream to cause increased congestion at Michillinda (ie bottleneck shift) during the westbound AM peak However the auxiliary lane helps reduce both queue length and queue duration for the Santa Anita bottleneck
The 2020 model estimates that Scenario 6 would reduce delay by 8 percent in the AM peak and 5 percent in the PM peak for a total reduction of 2500 daily vehicle-hours A reduction in PM delay is expected to occur mostly in the westbound direction
Scenarios 7 and 8 (Ramp Closures)
Scenarios 7 and 8 build on Scenarios 5 and 6 and test the closure of several ramps
diams Eastbound Marengo on-ramp and westbound Lake on-ramp with signalization of the eastbound I-210 off-ramp at Maple and improvement to alternate routes along Corson and Maple
diams Eastbound Mount Olive ramps
Note that subsequent scenarios are not built on top of these scenarios as these are isolated to test ramp closure alternatives
The 2006 model shows that Scenario 7 would reduce delay significantly by 16 percent in the AM peak and 18 percent in the PM peak for a total delay reduction of nearly 3000 daily vehicle-hours The delay reductions are significant on the mainline during the peak direction of travel ndash 1400 vehicle-hours in the westbound AM and 912 vehicleshyhours in the eastbound PM In the westbound direction and AM peak period the segment from Altadena to Lake experienced over an 85 percent decrease in congestion (from 860 to 120 vehicle-hours of delay) This is likely attributed to the closure of the westbound Lake on-ramp In the eastbound direction and PM peak period the segment from Huntington to I-605 experienced a delay reduction of over 70 percent (from 2200
I-210 Corridor System Management Plan Executive Summary
Page 34 of 39
vehicle-hours to 600 vehicle-hours) which is likely attributed to the closure of the Mount Olive ramp
The 2020 model also shows that Scenario 8 improved delay by 12 percent in the AM and 3 percent in the PM for a total delay reduction of almost 3000 daily vehicle-hours On the mainline facility delay also improved for each peak direction of travel ndash by 1600 daily vehicle-hours in the westbound AM and by 750 vehicle-hours in the eastbound PM Delay reductions in the non-peak direction were not as significant
Scenarios 9 and 10 (On-ramp and Aux Lane Improvements)
Scenarios 9 and 10 build on Scenarios 5 and 6 and test four operational improvements that can be implemented in the short to medium range
diams Modify the RosemeadMichillinda interchange and converge the westbound I-210 on-ramps
diams Modify the northside of the Baldwin interchange and eliminate the collectorshydistributor
diams Construct an eastbound auxiliary lane from Azusa to Citrus
diams Converge the eastbound Citrus on-ramps and add an auxiliary lane to Grand
The 2006 model estimates that Scenario 9 will reduce delay by 20 percent (or 2400 daily vehicle-hours) in the AM peak and 28 percent (or 1600 daily vehicle-hours) in the PM peak compared to Scenario 5 In both AM and PM peak period the eastbound direction experienced the largest reduction in delay
The 2020 model estimates that Scenario 10 will reduce delay by 13 percent (or 2500 vehicle-hours) in the AM peak and 28 percent in the PM peak (or 4800 vehicle-hours) compared to Scenario 6 Similar to the 2006 model the 2020 model shows that these improvements produced a greater reduction in delay in the eastbound direction than the westbound direction
Scenarios 11 and 12 (Enhanced Incident Management)
Two incident scenarios were tested on top of Scenario 10 to evaluate the non-recurrent delay reductions resulting from enhanced incident management strategies An enhanced incident management system would entail upgrading or enhancing the current Caltrans incident management system that includes deployment of intelligent transportation system (ITS) field devices central controlcommunications software communications medium (ie fiber optic lines) advanced traveler information system
I-210 Corridor System Management Plan Executive Summary
Page 35 of 39
andor freeway service patrol (FSP) program to reduce incident detection verification response and clearance times
In the first scenario Scenario 11 one collision incident with one lane closure was simulated in the westbound direction in the AM peak period model and one in the eastbound direction in the PM peak period model The incident simulation location and duration were selected based on review of the 2010 actual incident data at one of the high frequency locations The following are the Scenario details
diams Westbound AM peak period starting at 800 AM close mainline lane 2 for 40 minutes at absolute post mile 2612 (at Lake Avenue)
diams Eastbound PM peak period starting at 500 PM close mainline lane 2 for 50 minutes at absolute post mile 3207 (west of Santa Anita)
In the second scenario Scenario 12 the same collision incidents were simulated with a reduction in duration by 10 minutes in the westbound direction and by 12 minutes in the eastbound direction It is estimated based on actual incident management data analysis results provided by Caltrans that an enhanced incident management system could reduce a 35-minute incident by about 10 minutes This scenario represents a typical moderate level incident at one location during the peak period direction Data suggest that incidents vary significantly in terms of impact and duration Some incidents last hundreds of minutes some close multiple lanes and some occur at multiple locations simultaneously There are also numerous minor incidents lasting only a few minutes without lane closures that can result in congestion Many other incidents also occur during off-peak hours
Without enhanced incident management Scenario 11 produced an 8 percent increase in congestion in both peak periods over Scenario 10 an increase of over 2300 hours of vehicle delay With enhanced incident management Scenario 12 evaluation resulted in delay decrease by 2 percent in the AM peak and 3 percent in the PM peak against Scenario 11 results a reduction of nearly 750 vehicle-hours for improving the incident detection verification response and clearance time of one moderate level incident for both of the peak hours
Scenario 13 (SR-134I-210 Interchange Modification)
Scenario 13 tests an improvement to modify the SR-134I-210 interchange to provide a direct connection for vehicles to continue on I-210 with three lanes in each direction This improvement was tested with the 2020 model since it is not likely to be implemented in the short-term
I-210 Corridor System Management Plan Executive Summary
Page 36 of 39
The 2020 model estimates that delay would be reduced by 11 percent (or 1800 daily vehicle-hours) in the AM and 3 percent in the PM (320 daily vehicle-hours) compared to Scenario 10 The westbound mainline experienced the greatest reduction in delay in the AM peak from 9600 vehicle-hours to 8600 vehicle hours after the interchange modification
Scenario 14 (Westbound Drop Ramp and Eastbound Widening)
Scenario 14 builds on Scenario 13 and tests Lake Avenue drop ramp to westbound Ishy210 center lanes (one HOV lane and one mainline) and eastbound I-210 widening from Myrtle to I-605 This improvement was tested with the 2020 model
The 2020 model estimates that delay would be reduced by about 20 percent in the AM or 3400 vehicle-hours and 20 percent in the PM or 2300 vehicle-hours compared to Scenario 13 The mobility improvements are significant with the westbound drop ramp that reduces weaving between SR-134 and SR-210 destined traffic and with the eastbound capacity addition to I-605 off that moves the off-ramp traffic away from the mainline and provides more room for the mainline through traffic
Post Scenario 14 Conditions
By 2020 with the inclusion of all the projects tested the model reveals some residual congestion that remains to address with future improvements According to the model results the total remaining delay on the corridor is around 21000 daily vehicle-hours
Benefit-Cost Analysis
Following an in-depth review of model results by the study team and the SCAG technical committee the study team performed a benefit-cost analysis (BCA) for each scenario
Using the California Benefit-Cost Model (Cal-BC) developed on behalf of Caltrans by the study team benefits in three key areas were estimated travel time savings vehicle operating cost savings and emission reduction savings The benefits generated from this exercise are based solely on congestion relief related benefits However these results are conservative since there are other benefits not captured by this analysis including benefits from deploying bus rapid transit which will achieve other accessibility benefits
Project costs were developed from SCAG and Caltrans project planning and programming documents These costs include construction and support costs in current dollars The study team estimated costs for projects that did not have cost
I-210 Corridor System Management Plan Executive Summary
Page 37 of 39
estimates by reviewing similar completed projects A BC greater than one means that a scenarios projects return greater benefits than it costs to construct or implement It is important to consider the total benefits that a project brings For example a large capital expansion project can cost a great deal and have a low BC ratio but brings much higher absolute benefits to the I-210 users Exhibit ES-29 shows the benefit to cost ranges classified from low (with a BC of one to two) to very high (with a BC of over 10)
The benefit-cost results for the South Corridor scenarios are shown in Exhibit ES-29
Exhibit ES-29 I-210 Scenario BenefitCost (BC) Results
Scenario Scenario Description
BenefitCost Ranges
Low Medium Medium-High High Very High
lt1 1 to 2 2 to 5 5 to 10 gt10
12 Expand Ramp Metering 34 Advanced Ramp Metering 56 Aux Lane Striping Ramp Improvs 78 Ramp Closures
910 On-Ramp amp Aux Lane Improvs 13 SR-134I-210 IC Modification
The benefit-cost findings for each scenario are as follows
diams Scenarios 1 and 2 (ramp metering expansion) shows a high benefit-cost ratio of over ten The relatively high benefit-cost ratio is due to the low cost of expanding ramp metering ($235 million)
diams Scenarios 3 and 4 (advanced ramp metering) resulted in an incremental benefitshycost ratio of over ten This is relatively high as compared to that of typical transportation management system project
diams Scenarios 5 and 6 (operational improvements) produced a benefit-cost ratio of over five This is relatively consistent with other typical operational improvement projects The benefits are substantial At estimated total cost of about $44 million these projects produced benefits of over $233 million
diams Scenarios 7 and 8 tested the ramp closures at eastbound Marengo westbound Lake and eastbound Mount Olive These ramp closured produced an extremely high incremental benefit-cost ratio of over ten due to the relatively very low cost However this benefit-cost calculation does not account for any potential increase in delay on various local arterials because of detours from the closed ramps
diams Scenarios 9 and 10 also produced a relatively high benefit-cost ratio of over ten The four operational projects in these scenarios are collectively estimated to cost
I-210 Corridor System Management Plan Executive Summary
Page 38 of 39
under $30 million and provide a substantial and optimistic benefit of over $670 million
diams Scenario 13 tested the SR-134I-210 interchange modification This project produced a benefit-cost ratio of between one and two consistent with other typical capital expansion projects This project produced benefits of over $200 million at a rough-estimate cost of about $150 million
diams Scenario 14 tested the westbound center drop ramp from Lake Avenue interchange and eastbound lane addition from Myrtle to I-605 These projects produced a relatively high benefit-cost ratio of about 6 to one as compared to other capital improvement projects These two capital projects are unique in that they have specific operational improvement element that addresses major bottleneck locations For an estimated total combined cost of about $70 million the projected benefits exceed $420 million
CONCLUSIONS AND RECOMMENDATIONS
This section summarizes the conclusions and recommendations based on the analysis discussed in the previous section It is important to note that many of these conclusions are based primarily on the micro-simulation model results The model was developed based on the best data available at the time The study team reviewed the model results and believe that both the calibrated base year forecast year and scenario results are reasonable However Caltrans should always be cautious to make decisions based on modeling alone especially complex micro-simulation models
Based on the results the study team offers the following conclusions and recommendations
diams The combination of all scenarios significantly reduces overall congestion on the corridor Projected 2020 congestion after implementation of all scenarios is below 2006 levels in both the AM and PM peak period In the AM peak period the model projects total delay in 2020 after delivering all projects to be less than 11700 vehicle-hours compared to the 2006 base year delay of 13000 vehicleshyhours This represents a reduction of over 10 percent In the PM peak period the model projects total delay in 2020 after delivering all projects to be around 9500 hours compared to the 2006 base year delay of almost 9300 vehicle-hours This represents a slight reduction of 2 percent Clearly the scenarios deliver significant mobility benefits to the corridor Despite the growth in demand future 2020 congestion will be less than experienced in 2006
diams The completed ramp metering expansion project is expected to produce substantial mobility benefits of over $400 million Delay has been significantly reduced since 2006
I-210 Corridor System Management Plan Executive Summary
Page 39 of 39
diams Advanced ramp metering could provide additional mobility improvements by significantly reducing congestion and returning over $100 million in benefits
diams Ramp closures at Marengo Lake and Mount Olive as alternatives seem promising by reducing delay up to 3000 vehicle-hours per day and providing substantial benefits of $280 million at an extremely low cost
diams Operational improvements such as auxiliary lanes and ramp improvements could leverage on the ramp metering projects by making the corridor more efficient and productive that could result in additional mobility benefits of over $230 million
diams Additional capital improvements with specific operational elements to address weaving at major bottleneck locations could produce significant mobility benefits of over $420 million
diams Enhanced incident management system associated with Scenarios 11 and 12 to address non-recurrent congestion proved effective with a delay reduction of over 300 vehicle-hours for one modest level incident with a typical duration of 35 minutes reduced to 25 minutes With the I-210 corridor experiencing up to 2400 collisions per year this translates to a total annual delay savings of over 700000 vehicle-hours for the study corridor
diams The benefit-cost ratio of all scenarios combined is about 64 to 1 If all projects were delivered at current cost estimates the public would get over six dollars of benefits for each dollar expended In current dollars costs total to over $17 billion whereas the benefits are estimated to be over $20 billion
diams The projects also alleviate greenhouse gas (GHG) emissions by over 15 million tons over 20 years averaging over a 75000-ton reduction per year The emissions are estimated using data from the California Air Resources Board (CARB) EMFAC model
This is the first generation CSMP for the I-210 corridor It is important to stress that CSMPs should be updated on a regular basis This is particularly important since traffic conditions and patterns can differ from current projections After projects are delivered it is also useful to compare actual results with estimated ones in this document so that models can be further improved as appropriate
CSMPs or a variation thereof should become the normal course of business that is based on detailed performance assessments an in-depth understanding of the reasons for performance deterioration and an analytical framework that allows for evaluating complementary operational strategies that maximize the productivity of the current system
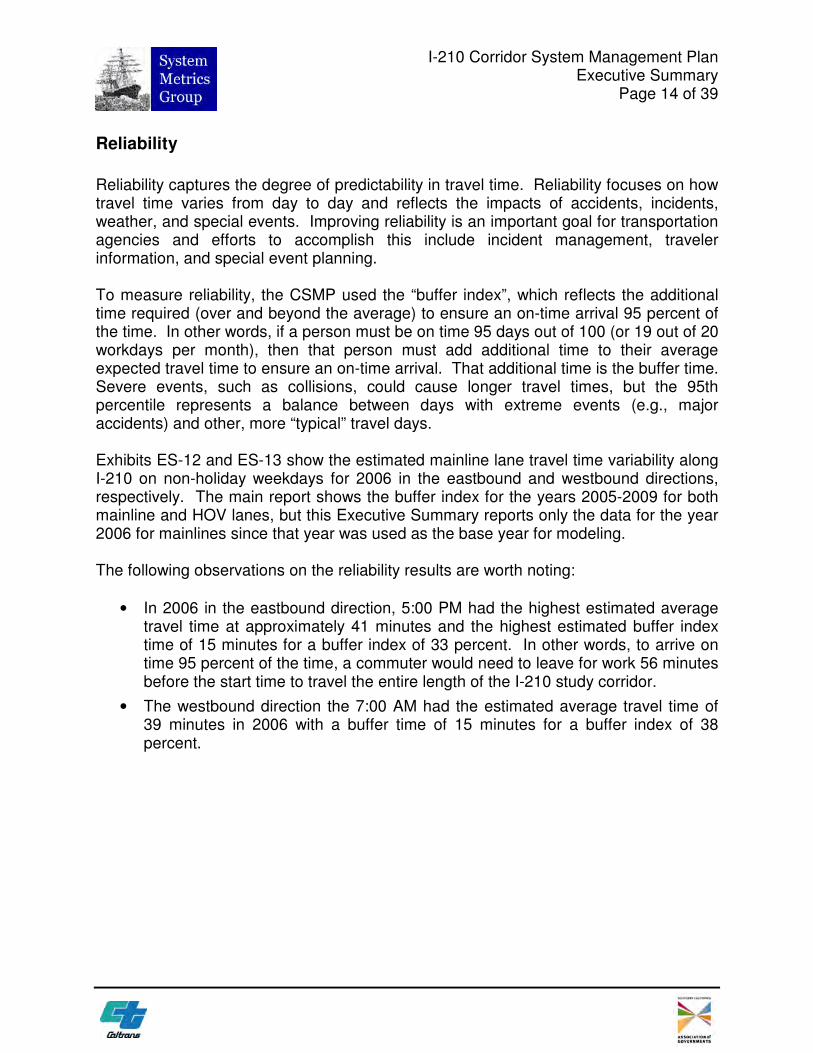
I-210 Corridor System Management Plan Executive Summary
Page 14 of 39
Reliability
Reliability captures the degree of predictability in travel time Reliability focuses on how travel time varies from day to day and reflects the impacts of accidents incidents weather and special events Improving reliability is an important goal for transportation agencies and efforts to accomplish this include incident management traveler information and special event planning
To measure reliability the CSMP used the ldquobuffer indexrdquo which reflects the additional time required (over and beyond the average) to ensure an on-time arrival 95 percent of the time In other words if a person must be on time 95 days out of 100 (or 19 out of 20 workdays per month) then that person must add additional time to their average expected travel time to ensure an on-time arrival That additional time is the buffer time Severe events such as collisions could cause longer travel times but the 95th percentile represents a balance between days with extreme events (eg major accidents) and other more ldquotypicalrdquo travel days
Exhibits ES-12 and ES-13 show the estimated mainline lane travel time variability along I-210 on non-holiday weekdays for 2006 in the eastbound and westbound directions respectively The main report shows the buffer index for the years 2005-2009 for both mainline and HOV lanes but this Executive Summary reports only the data for the year 2006 for mainlines since that year was used as the base year for modeling
The following observations on the reliability results are worth noting
bull In 2006 in the eastbound direction 500 PM had the highest estimated average travel time at approximately 41 minutes and the highest estimated buffer index time of 15 minutes for a buffer index of 33 percent In other words to arrive on time 95 percent of the time a commuter would need to leave for work 56 minutes before the start time to travel the entire length of the I-210 study corridor
bull The westbound direction the 700 AM had the estimated average travel time of 39 minutes in 2006 with a buffer time of 15 minutes for a buffer index of 38 percent
70
65
60
55
50
45
40
35
30
25
20
15
10
5
0
70
65
60
55
50
45
40
35
30
25
20
15
10
5
0
Average Travel Time
Travel Time Variability (95th Percentile)
Travel Time at 60mph
Travel Time at 35mph
TIME OF DAY
Exhibit ES-13 Westbound Mainline Lanes Travel Time Variability (2006)
75
TIME OF DAY
Average Travel Time
Travel Time Variability (95th Percentile)
Travel Time at 60mph
Travel Time at 35mph
Exhibit ES-12 Eastbound Mainline Lanes Travel Time Variability (2006)
75
I-210 Corridor System Management Plan Executive Summary
Page 15 of 39
TR
AV
EL
TIM
E (
MIN
)
00
000
0
10
010
0
TR
AV
EL
TIM
E (
MIN
)
20
020
0
30
030
0
40
040
0
50
050
0
60
060
0
70
070
0
80
080
0
90
090
0
100
01
00
0
110
01
10
0
120
01
20
0
130
01
30
0
140
01
40
0
150
01
50
0
160
01
60
0
170
01
70
0
180
01
80
0
190
01
90
0
200
02
00
0
210
02
10
0
220
02
20
0
230
02
30
0
00
0
00
0
I-210 Corridor System Management Plan Executive Summary
Page 16 of 39
Safety
The adopted performance measures to assess safety involve the number of accidents and the accident rates computed from the Caltrans Traffic Accident Surveillance and Analysis System (TASAS) TASAS is a traffic records system containing an accident database linked to a highway database The highway database contains descriptive elements of highway segments intersections and ramps access control traffic volumes and other data TASAS contains specific data for accidents on State highways Accidents on non-State highways are not included (eg local streets and roads)
The safety assessment in this report intends to characterize the overall accident history and trends in the corridor and to highlight notable accident concentration locations or patterns that are readily apparent This report does not intend to supplant more detailed safety investigations routinely performed by Caltrans staff
Exhibits ES-14 and ES-15 show the I-210 total number of eastbound and westbound accidents by month respectively For the accident analysis the corridor is split in half the ldquoless urbanrdquo western half of the corridor from I-5 (postmile 0) in Sylmar to SR-134 in Pasadena (postmile R2200) and the ldquomore urbanrdquo eastern half from SR-134 to SR-57 (postmile R45) in San Dimas The latest available TASAS data from PeMS is to December 30 2008 Accidents are reported for the study corridor and not separated by mainline and HOV facility The exhibits summarize the latest available three-year data from January 1 2006 through December 31 2008
Both the eastbound and westbound directions have similar accident profiles with the more urbanized eastern half of the corridor (postmile R22 to R45) experiencing nearly 45 times as many accidents as the western half (PM 0 to R22) The eastbound (Exhibit ES-13) direction has around 79 accidents on average per month in the more-urbanized section and just fewer than 18 accidents in the less-urbanized section
The westbound direction has just fewer than 78 accidents on average per month in the more-urbanized section and just fewer than 18 in the less-urbanized section This is very similar to the eastbound direction
Nu
mb
er
of
Ac
cid
en
ts
Nu
mb
er
of
Accid
en
ts
I-210 Corridor System Management Plan Executive Summary
Page 17 of 39
Exhibit ES-14 Eastbound I-210 Monthly Collisions (2004-2008) 120
110
100
90
80
70
60
50
40
30
20
10
0
Jan
Feb
Mar
Ap
rM
ay
Ju
nJu
lA
ug
Sep
Oct
No
vD
ec
Jan
Feb
Mar
Ap
rM
ay
Ju
nJu
lA
ug
Sep
Oct
No
vD
ec
Jan
Feb
Mar
Ap
rM
ay
Ju
nJu
lA
ug
Sep
Oct
No
vD
ec
Jan
Feb
Mar
Ap
rM
ay
Ju
nJu
lA
ug
Sep
Oct
No
vD
ec
Jan
Feb
Mar
Ap
rM
ay
Ju
nJu
lA
ug
Sep
Oct
No
vD
ec
2004 2005 2006 2007 2008
Less Urbanized Western Section (I-5 to SR-134)
More Urbanized Eastern Section (SR-134 to SR-57)
110
100
90
80
70
60
50
40
30
20
10
0
Exhibit ES-15 Westbound I-210 Monthly Collisions (2004-2008) 120
Jan
Feb
Mar
Ap
rM
ay
Ju
nJu
lA
ug
Sep
Oct
No
vD
ec
Jan
Feb
Mar
Ap
rM
ay
Ju
nJu
lA
ug
Sep
Oct
No
vD
ec
Jan
Feb
Mar
Ap
rM
ay
Ju
nJu
lA
ug
Sep
Oct
No
vD
ec
Jan
Feb
Mar
Ap
rM
ay
Ju
nJu
lA
ug
Sep
Oct
No
vD
ec
Jan
Feb
Mar
Ap
rM
ay
Ju
nJu
lA
ug
Sep
Oct
No
vD
ec
2004 2005 2006 2007 2008
Less Urbanized Western Section (I-5 to SR-134)
More Urbanized Eastern Section (SR-134 to SR-57)
I-210 Corridor System Management Plan Executive Summary
Page 18 of 39
Productivity
Productivity is a system efficiency measure used to analyze the throughput of the corridor during congested conditions Restoring lost productivity is one focus area of CSMPs
Exhibit ES-16 illustrates how congestion leads to lost productivity The exhibit uses observed I-210 data from sensors for a typical spring 2010 afternoon peak period (Thursday May 6 2010) It shows speeds (red line) and flow rates (blue line) on eastbound I-210 at Huntington Drive one of the most congested locations on the corridor
Flow rates (measured as vehicle-per-hour-per-lane or ldquovphplrdquo) at Huntington Drive averaged around 1800 vphpl between 200 PM and 300 PM Once volumes approach a maximum flow rate of around 2000 vphl traffic becomes unstable Any additional merging or weaving traffic breaks down and speeds can rapidly plummet to below 35 mph In essence every incremental merge takes up two spots on the freeway for a short time However since the volume is close to the capacity these merges lead to queues Moreover rather than accommodating the same number of vehicles flow rates also drop and vehicles back up creating bottlenecks and associated congestion
At the location shown in Exhibit ES-16 throughput drops by over 30 percent on average during the peak period (from over 1800 to around 1200 vphpl) This five-lane road therefore operates as if lost 30 percent capacity when demand is at its highest Stated differently just when the corridor needed the most capacity it performed in the least productive manner and effectively lost lanes This loss in throughput can be aggregated and presented as ldquoEquivalent Lost-Lane-Milesrdquo
I-210 Corridor System Management Plan Executive Summary
Page 19 of 39
Exhibit ES-16 Lost Productivity Illustrated
70 2000
65
60 1750
50
55 1500
SP
EE
D
45 1250
40
35 1000
30 Speed lt35mph
750 25
20 500 I-210 EB
15 Los Angeles County Huntington
10 PM=3338 250
May 6 2010 5 VDS ID 761141
0 -
FL
OW
RA
TE
(VP
HP
L)
140
0
143
0
150
0
153
0
160
0
163
0
170
0
173
0
180
0
183
0
190
0
193
0
TIME The estimated average non-holiday weekday lost lane-miles by period and year on Ishy210 are shown Exhibits ES-17 (mainline) and ES-18 (HOV) A few notes on these two exhibits
diams The trends in the productivity losses are comparable to the delay trends The largest productivity losses occurred in the eastbound direction during the PM peak hours which is the direction and time period that experienced the most congestion
diams On the mainline facility the westbound direction experienced nearly as high productivity loses during the AM peak period
diams On the HOV lanes a greater productivity loss in the eastbound peak period is more evident
Operational strategies are critical to recovering such productivity losses These strategies include building new or extending auxiliary lanes developing more aggressive ramp metering strategies without negatively influencing the arterial network and improving incident clearance times
I-210 Corridor System Management Plan Executive Summary
Page 20 of 39
Exhibit ES-17 Mainline Daily Equivalent Lost Lane-Miles by Direction and Period (2005-09)
-
10
20
30
40
50
60
70
80
90
100
110
120
130
140
150
160
2005 2006 2007 2008 2009 2005 2006 2007 2008 2009 2005 2006 2007 2008 2009 2005 2006 2007 2008 2009
Eastbound
Westbound
AM PM Midday Night Time Period and Year
Daily
Eq
uiv
ale
nt
Lost
Lan
e-M
iles
Exhibit ES-18 HOV Daily Equivalent Lost Lane-Miles by Direction and Period (2005-09)
-
10
20
30
40
2005 2006 2007 2008 2009 2005 2006 2007 2008 2009 2005 2006 2007 2008 2009 2005 2006 2007 2008 2009
Eastbound
Westbound
AM Midday PM Night
Daily
Eq
uiv
ale
nt
Lost
Lan
e-M
iles
Time Period and Year
I-210 Corridor System Management Plan Executive Summary
Page 21 of 39
BOTTLENECK IDENTIFICATION AND CAUSALITY ANALYSIS
Exhibits ES-19 and ES-20 summarize the eastbound and westbound bottleneck locations the time period that each bottleneck is generally active and the causes of the each bottleneck Exhibits ES-21 and ES-22 are maps of the corridor showing these bottleneck locations for the AM and PM peak periods respectively
Major bottlenecks are the primary cause of congestion and lost productivity By definition a bottleneck is a condition where traffic demand exceeds the effective carrying capacity of the roadway In most cases the cause of a bottleneck is related to a sudden reduction in capacity such as a lane drop merging and weaving driver distractions a surge in demand or a combination of factors
The specific location and causality of each major I-210 bottleneck was verified by multiple field observations on separate weekdays throughout the summer fall and winter of 2009 Some bottleneck locations were videotaped to validate bottlenecks and to assist in micro-simulation model calibration
The detailed final report explains in detail the process and results of the bottleneck identification and causality analysis
I-210 Corridor System Management Plan Executive Summary
Page 22 of 39
Exhibit ES-19 I-210 Eastbound Bottleneck Locations
Abs CA Bottleneck
Location
Active
Period Causality Summary
AM PM
250 R250 Fair Oaks Heavy ramp merge
265 R265 Lake On-ramp Heavy ramp merge
286 R287 San Gabriel On-ramp Heavy ramp merge roadway curves
294 R294 Rosemead On-ramp Heavy consecutive ramp merge
330 R327 Huntington Interchange Heavy ramp merge roadway curves
366 R363 I-605 On-ramp traffic weaving with the off-ramp
400 R397 Azusa On-ramp Heavy ramp merge
408 R406 Citrus On-ramp Heavy ramp merge
450 R450 SR-57 On-ramp Heavy ramp merge and lane drop
Exhibit ES-20 I-210 Westbound Bottleneck Locations
Abs CA
Bottleneck
Location
Active
Period Causality Summary
AM PM
401 R398 Azusa On-ramp Consecutive ramp merge curves
368 R365 I-605 Off-ramp Consecutive ramp merge weaving
322 R319 Santa Anita On-ramp Heavy ramp merge roadway curves
307 R304 Baldwin On-ramp Heavy consecutive ramp merge
297 L297 Rosemead On-ramp Three consecutive ramp merges weaving
280 R281 Altadena On-ramp Heavy ramp merge
261 R261 Lake On-ramp Heavy ramp merge
Bottleneck Locations
reg --Bottleneck
Westbound
Eastbound
0 1 2
I bull I I I bull I I I Miles
HJOUAIIO fl _
I-210 Corridor System Management Plan Executive Summary
Page 23 of 39
Exhibit ES-21 I-210 Map of AM Bottleneck Locations
Bottleneck Locations
reg Bottleneck - Westbound - Eastbound
N 0 1 2
bull I I II II II I ll) Mles s
HJOUAIIO fl _
I-210 Corridor System Management Plan Executive Summary
Page 24 of 39
Exhibit ES-22 I-210 Map of PM Bottleneck Locations
I-210 Corridor System Management Plan Executive Summary
Page 25 of 39
SCENARIO DEVELOPMENT AND ANALYSIS
Fully understanding how a corridor performs and why it performs the way it does sets the foundation for evaluating potential solutions Several steps were required to develop and evaluate improvements including
diams Developing traffic models for 2006 base year and 2020 long-term demand diams Combining projects in a logical manner for modeling and testing diams Evaluating model outputs and summarizing results diams Conducting a benefit-cost assessment of scenarios
Traffic Model Development
The study team developed a traffic model using the VISSIM micro-simulation software It is important to note that micro-simulation models are complex to develop and calibrate for a large urban corridor However it is one of the only tools capable of providing a reasonable approximation of bottleneck formation and queue development Therefore such tools help quantify the impacts of operational strategies which traditional travel demand models cannot
The model was calibrated against 2006 conditions This was a resource intensive effort requiring several iterations of submittals and review cycles until the model reasonably matched bottleneck locations and relative severity Once calibration was approved a 2020 model was also developed based on SCAGrsquos travel demand model demand projections
These two models were used to evaluate different scenarios (combinations of projects) to quantify the associated congestion relief benefits and to compare total project costs against their benefits
Exhibit ES-23 depicts the network included in the model There were no parallel arterials modeled with the exception of arterials at interchanges All freeway interchanges were included as well as on-ramps and off-ramps
I-210 Corridor System Management Plan Executive Summary
Page 26 of 39
Exhibit ES-23 Micro-Simulation Model Network
I-210 Corridor System Management Plan Executive Summary
Page 27 of 39
Scenario Development Framework
The study team developed a framework for combining projects into scenarios It would be desirable to evaluate every possible combination of projects However this would have entailed thousands of model runs Instead the team combined projects based on a number of factors including
diams Projects that were fully constructed and completed from 2006 to 2010 were tested with both the 2006 and 2020 models
diams Short- and mid- term operational projects were grouped into scenarios and tested with the both the 2006 and 2020 models
diams Longer-range projects to be delivered by 2020 and beyond were used to develop scenarios to be tested with the 2020 model only
diams Alternative ramp closures were grouped into isolated scenarios (future scenarios did not build on top of these) and tested with both the 2006 and 2020 models
The study assumes that projects delivered before 2016 could reasonably be evaluated using the 2006 base year model The 2020 forecast year for the I-210 study was consistent with the SCAG 2020 regional travel demand model origin-destination matrices used to develop the 2008 Regional Transportation Plan (RTP) When SCAG updates its travel demand model and Regional Transportation Plan (RTP) it may wish to update the micro-simulation model with revised demand projections
Project lists used to develop scenarios were part from the Regional Transportation Improvement Program (RTIP) the RTP and other sources such as special studies Projects that do not directly affect mobility were eliminated For instance sound wall landscaping or minor arterial improvement projects were not evaluated since microshysimulation models cannot evaluate them
Scenario testing performed for the performed for the I-210 CSMP differed from traditional ldquoalternatives evaluationsrdquo done for Major Investment Studies (MIS) or Environmental Impact Reports (EIRs) An MIS or EIR focuses on identifying alternative solutions to address current or projected corridor problems so each alternative is evaluated separately and results among competing alternatives are compared resulting in a locally preferred alternative In contrast for the I-210 CSMP scenarios build on each other in that a scenario contains the projects from the previous scenario plus one or more projects as long as the incremental scenario results showed an acceptable level of performance improvement This incremental scenario evaluation approach is important since CSMPs are new and are often compared with alternatives studies
Exhibit ES-24 summarizes the approach used and scenarios tested and provides a
I-210 Corridor System Management Plan Executive Summary
Page 28 of 39
general description of the projects included in the 2006 and 2020 micro-simulation runs Most projects were tested for both the short- and long-term timeframes Each scenario tested was built upon prior scenarios except for Scenarios 7 and 8 which were ldquostand alonerdquo scenarios used to test alternative ramp closures Later scenarios build on Scenarios 5 and 6 and do not include the improvements tested in Scenarios 7 and 8 Enhanced incident management was tested in Scenarios 11 and 12 by comparing a simulated incident without and with enhanced incident management system Scenarios 13 and 14 are expected for the longer term and were tested only with the 2020 model
Exhibit ES-24 Micro-Simulation Modeling Approach
Short-Term Scenarios Long-Term Scenarios
Calibrated 2006 Base Case
Scenario 1 Expand Ramp-
Metering
Scenario 3 Scenario 1 +
Adv Ramp-Meter w
Queue Control
Scenario 5 Scenario 3 + aux lane striping and
ramp improvements
2020 Horizon Year
2006 Network 2020 OD Matrices
Scenario 7 Scenario 5 +
Ramp Closures
Scenario 2 Expand Ramp-
Metering
Scenario 4 Scenario 2 +
Adv Ramp-Meter w
Queue Control
Scenario 6 Scenario 4 + aux lane striping and
ramp improvements
Scenario 8 Scenario 6 +
Ramp Closures
Scenario 14 Scenario 13 + Lake
Ave Drop Ramp
Lane Addition
Scenario 9 Scenario 5+
On-Ramp amp Aux
lane improvements
Scenario 10 Scenario 6 +
On-Ramp amp Aux
lane improvements
Scenario 11 Incident with No
Incident
Management
Scenario 12 Incident With
Incident
Management
Scenario 13 Scenario 10 +
134210 IC
modification
Incident Management Scenarios
I-210 Corridor System Management Plan Executive Summary
Page 29 of 39
Scenario Evaluation Results
Exhibits ES-25 and ES-26 show the delay results for all the 2006 scenarios evaluated for the AM and PM peak periods respectively Exhibits ES-27 and ES-28 show the delay results for all the 2020 scenarios evaluated for the AM and PM peak periods respectively For each scenario the modeling team produced results by facility type (ie mainline HOV arterials and ramps) and vehicle type (SOV HOV trucks) as well as speed contour diagrams (discussed in more detail in the full technical CSMP) The study team scrutinized to ensure that they were consistent with general traffic engineering principles The following summarizes the findings related to the four exhibits
Exhibit ES-25 2006 AM Peak Micro-Simulation Delay Results by Scenario
De
lay
(Pe
ak
Pe
rio
d V
eh
icle
-Ho
urs
)
2006 Base Year S1 S3 S5 S7 S9 Scenario
18000
16000
14000
12000
10000
8000
6000
4000
2000
-
S1 Expand Ramp Metering
S3 Adv Ramp Metering
S5 Aux Lane Striping Ramp Improvs
S7 Ramp Closures
S9 On-Ramp amp Aux Lane Improvs
-2 -3 -3
-16 -20
HOV WB I-210 WB
HOV EB I-210 EB
Ramps Arterials
I-210 Corridor System Management Plan Executive Summary
Page 30 of 39
Exhibit ES-26 2006 PM Peak Micro-Simulation Delay Results by Scenario
18000
De
lay
(Pe
ak
Pe
rio
d V
eh
icle
-Ho
urs
)
16000
14000
12000
10000
8000
6000
4000
2000
-
S1 Expand Ramp Metering
S3 Adv Ramp Metering
HOV WB
I-210 WB
S5 Aux Lane Striping Ramp Improvs
S7 Ramp Closures
S9 On-Ramp amp Aux Lane Improvs
HOV EB
I-210 EB
Ramps
Arterials
-17
-11
-18
-18 -28
2006 Base Year S1 S3 S5 S7 S9 Scenario
Exhibit ES-27 2020 AM Peak Micro-Simulation Delay Results by Scenario
30000
De
lay
(Pe
ak
Pe
rio
d V
eh
icle
-Ho
urs
)
25000
20000
15000
10000
5000
S2 Expand Ramp Metering
S4 Adv Ramp Metering
S6 Aux Lane Striping Ramp Improvs
S8 Ramp Closures
HOV WB
I-210 WB
HOV EB
-8
-2 -8
-13 -12
S10 On-Ramp amp Aux Lane Improvs
S13 SR-134I-210 IC Modification
S14 Lake Ave Drop Ramp Lane Addition
I-210 EB
Ramps
Arterials
-11
-23
-
2020 S2 S4 S6 S8 S10 S13 S14 Horizon Scenario
I-210 Corridor System Management Plan Executive Summary
Page 31 of 39
Exhibit ES-28 2020 PM Peak Micro-Simulation Delay Results by Scenario D
ela
y(P
ea
k P
eri
od
Ve
hic
le-H
ou
rs)
30000
25000
20000
15000
10000
5000
-
S2 Expand Ramp Metering
S4 Adv Ramp Metering
S6 Aux Lane Striping Ramp Improvs
S8 Ramp Closures
HOV WB
I-210 WB
HOV EB
-14
S10 On-Ramp amp Aux Lane Improvs
S13 SR-134I-210 IC Modification
S14 Lake Ave Drop Ramp Lane Addition
I-210 EB
Ramps
Arterials
-2 -5 -3 -28
-3 -19
2020 S2 S4 S6 S8 S10 S13 S14 Horizon Scenario
Base Year and Do Minimum Horizon Year
Absent any physical improvements the modeling team estimates that by 2020 total delay (mainline HOV ramps and arterials) would double compared to 2006 (from a total of around 22000 vehicle-hours daily to just fewer than 45000 vehicle-hours) in the combined AM and PM peak
Scenarios 1 and 2 (Expand Ramp Metering)
Scenarios 1 and 2 test the only project on the corridor that was fully constructed and completed The project installed new connector metering at the SR-57 and I-605 to Ishy210 freeway connector ramps The project also widened various ramps removed various HOV meter bypasses and upgraded the ramp metering system
The 2006 model estimates that Scenario 1 would reduce delay on the corridor by around 17 percent (or 1600 daily vehicle-hours) in the PM peak period but only around two percent (or 200 vehicle-hours) in the AM peak period The biggest benefits occur in the PM eastbound direction from Rosemead On-Ramp to Huntington interchange (with a delay reduction of over 1000 vehicle-hours) as well as from I-605 to the Azusa On-Ramp (delay reduction of 500 vehicle-hours) for single occupant vehicles The
I-210 Corridor System Management Plan Executive Summary
Page 32 of 39
westbound reductions in freeway delay are largely offset by increased on-ramp delay mostly from new connector metering at SR-57 and I-605
The 2020 model estimates that Scenario 2 will reduce delay by around 8 percent in the AM peak and 14 percent in the PM peak for a combined total reduction of 5000 daily vehicle-hours The long-term improvements are less than the short-term improvements due to the increase in demand
Scenarios 3 and 4 (Advanced Ramp Metering)
Scenarios 3 and 4 build on Scenarios 1 and 2 by adding advanced ramp metering system such as dynamic or adaptive ramp metering system
The 2006 model shows that Scenario 3 would reduce delay by an additional 850 daily vehicle-hours (or 11 percent) in the PM peak with a marginal reduction in the AM peak period However in conjunction with Scenario 1 Scenario 3 reduces delay in total by over 600 vehicle-hours in the AM peak These results suggest that queue control provides additional benefits beyond SWARM
The 2020 model estimates that Scenario 4 will modestly reduce delay by about 2 percent in both the AM and PM peaks or a combined total of 800 daily vehicle-hours Again the benefits are lower in percentage terms due to the increase in demand
Note that there are various types of advanced ramp metering systems deployed around the world including System-wide Adaptive Ramp Metering System or SWARM tested recently in Los Angeles I-210 freeway corridor For the I-210 model the Asservissement Lineaire drsquoEntreacutee Autoroutiere (ALINEA system) was tested as proxy for any advanced ramp metering system as its algorithm for the model was readily available It is not necessarily recommended that ALINEA be deployed but rather some type of advanced ramp metering system that would produce similar if not better results
Scenarios 5 and 6 (Auxiliary Lane Striping Ramp Improvements)
Scenarios 5 and 6 build on Scenarios 3 and 4 that include several relatively lower-cost operational improvements that could be implemented by 2015
diams Building a westbound auxiliary lane from Santa Anita to Baldwin and an eastbound auxiliary lane from Santa Anita to Huntington
diams Extending a lane to Lincoln on the westbound I-210 connector
diams Connecting and converging the Altadena on-ramps into a single on-ramp
I-210 Corridor System Management Plan Executive Summary
Page 33 of 39
diams Connecting and converging the Santa Anita on-ramps into a single on-ramp
diams Connecting and converging the Irwindale on-ramps into a single on-ramp
diams Restriping to add a lane in the eastbound direction from San Dimas to Fruit
The 2006 model shows that Scenario 5 reduces delay by 3 percent (nearly 400 vehicleshyhours) in the AM peak and 18 percent (1200 vehicle-hours) in the PM peak The segment that experienced the largest improvement in the eastbound during the PM peak was from Rosemead to Huntington This segment experienced a 45 percent improvement in delay (from 2700 vehicle-hours to 1500 vehicle-hours) which is likely attributed to the eastbound auxiliary lane from Santa Anita to Huntington In the westbound direction the auxiliary lane from Santa Anita to Baldwin shifts some traffic downstream to cause increased congestion at Michillinda (ie bottleneck shift) during the westbound AM peak However the auxiliary lane helps reduce both queue length and queue duration for the Santa Anita bottleneck
The 2020 model estimates that Scenario 6 would reduce delay by 8 percent in the AM peak and 5 percent in the PM peak for a total reduction of 2500 daily vehicle-hours A reduction in PM delay is expected to occur mostly in the westbound direction
Scenarios 7 and 8 (Ramp Closures)
Scenarios 7 and 8 build on Scenarios 5 and 6 and test the closure of several ramps
diams Eastbound Marengo on-ramp and westbound Lake on-ramp with signalization of the eastbound I-210 off-ramp at Maple and improvement to alternate routes along Corson and Maple
diams Eastbound Mount Olive ramps
Note that subsequent scenarios are not built on top of these scenarios as these are isolated to test ramp closure alternatives
The 2006 model shows that Scenario 7 would reduce delay significantly by 16 percent in the AM peak and 18 percent in the PM peak for a total delay reduction of nearly 3000 daily vehicle-hours The delay reductions are significant on the mainline during the peak direction of travel ndash 1400 vehicle-hours in the westbound AM and 912 vehicleshyhours in the eastbound PM In the westbound direction and AM peak period the segment from Altadena to Lake experienced over an 85 percent decrease in congestion (from 860 to 120 vehicle-hours of delay) This is likely attributed to the closure of the westbound Lake on-ramp In the eastbound direction and PM peak period the segment from Huntington to I-605 experienced a delay reduction of over 70 percent (from 2200
I-210 Corridor System Management Plan Executive Summary
Page 34 of 39
vehicle-hours to 600 vehicle-hours) which is likely attributed to the closure of the Mount Olive ramp
The 2020 model also shows that Scenario 8 improved delay by 12 percent in the AM and 3 percent in the PM for a total delay reduction of almost 3000 daily vehicle-hours On the mainline facility delay also improved for each peak direction of travel ndash by 1600 daily vehicle-hours in the westbound AM and by 750 vehicle-hours in the eastbound PM Delay reductions in the non-peak direction were not as significant
Scenarios 9 and 10 (On-ramp and Aux Lane Improvements)
Scenarios 9 and 10 build on Scenarios 5 and 6 and test four operational improvements that can be implemented in the short to medium range
diams Modify the RosemeadMichillinda interchange and converge the westbound I-210 on-ramps
diams Modify the northside of the Baldwin interchange and eliminate the collectorshydistributor
diams Construct an eastbound auxiliary lane from Azusa to Citrus
diams Converge the eastbound Citrus on-ramps and add an auxiliary lane to Grand
The 2006 model estimates that Scenario 9 will reduce delay by 20 percent (or 2400 daily vehicle-hours) in the AM peak and 28 percent (or 1600 daily vehicle-hours) in the PM peak compared to Scenario 5 In both AM and PM peak period the eastbound direction experienced the largest reduction in delay
The 2020 model estimates that Scenario 10 will reduce delay by 13 percent (or 2500 vehicle-hours) in the AM peak and 28 percent in the PM peak (or 4800 vehicle-hours) compared to Scenario 6 Similar to the 2006 model the 2020 model shows that these improvements produced a greater reduction in delay in the eastbound direction than the westbound direction
Scenarios 11 and 12 (Enhanced Incident Management)
Two incident scenarios were tested on top of Scenario 10 to evaluate the non-recurrent delay reductions resulting from enhanced incident management strategies An enhanced incident management system would entail upgrading or enhancing the current Caltrans incident management system that includes deployment of intelligent transportation system (ITS) field devices central controlcommunications software communications medium (ie fiber optic lines) advanced traveler information system
I-210 Corridor System Management Plan Executive Summary
Page 35 of 39
andor freeway service patrol (FSP) program to reduce incident detection verification response and clearance times
In the first scenario Scenario 11 one collision incident with one lane closure was simulated in the westbound direction in the AM peak period model and one in the eastbound direction in the PM peak period model The incident simulation location and duration were selected based on review of the 2010 actual incident data at one of the high frequency locations The following are the Scenario details
diams Westbound AM peak period starting at 800 AM close mainline lane 2 for 40 minutes at absolute post mile 2612 (at Lake Avenue)
diams Eastbound PM peak period starting at 500 PM close mainline lane 2 for 50 minutes at absolute post mile 3207 (west of Santa Anita)
In the second scenario Scenario 12 the same collision incidents were simulated with a reduction in duration by 10 minutes in the westbound direction and by 12 minutes in the eastbound direction It is estimated based on actual incident management data analysis results provided by Caltrans that an enhanced incident management system could reduce a 35-minute incident by about 10 minutes This scenario represents a typical moderate level incident at one location during the peak period direction Data suggest that incidents vary significantly in terms of impact and duration Some incidents last hundreds of minutes some close multiple lanes and some occur at multiple locations simultaneously There are also numerous minor incidents lasting only a few minutes without lane closures that can result in congestion Many other incidents also occur during off-peak hours
Without enhanced incident management Scenario 11 produced an 8 percent increase in congestion in both peak periods over Scenario 10 an increase of over 2300 hours of vehicle delay With enhanced incident management Scenario 12 evaluation resulted in delay decrease by 2 percent in the AM peak and 3 percent in the PM peak against Scenario 11 results a reduction of nearly 750 vehicle-hours for improving the incident detection verification response and clearance time of one moderate level incident for both of the peak hours
Scenario 13 (SR-134I-210 Interchange Modification)
Scenario 13 tests an improvement to modify the SR-134I-210 interchange to provide a direct connection for vehicles to continue on I-210 with three lanes in each direction This improvement was tested with the 2020 model since it is not likely to be implemented in the short-term
I-210 Corridor System Management Plan Executive Summary
Page 36 of 39
The 2020 model estimates that delay would be reduced by 11 percent (or 1800 daily vehicle-hours) in the AM and 3 percent in the PM (320 daily vehicle-hours) compared to Scenario 10 The westbound mainline experienced the greatest reduction in delay in the AM peak from 9600 vehicle-hours to 8600 vehicle hours after the interchange modification
Scenario 14 (Westbound Drop Ramp and Eastbound Widening)
Scenario 14 builds on Scenario 13 and tests Lake Avenue drop ramp to westbound Ishy210 center lanes (one HOV lane and one mainline) and eastbound I-210 widening from Myrtle to I-605 This improvement was tested with the 2020 model
The 2020 model estimates that delay would be reduced by about 20 percent in the AM or 3400 vehicle-hours and 20 percent in the PM or 2300 vehicle-hours compared to Scenario 13 The mobility improvements are significant with the westbound drop ramp that reduces weaving between SR-134 and SR-210 destined traffic and with the eastbound capacity addition to I-605 off that moves the off-ramp traffic away from the mainline and provides more room for the mainline through traffic
Post Scenario 14 Conditions
By 2020 with the inclusion of all the projects tested the model reveals some residual congestion that remains to address with future improvements According to the model results the total remaining delay on the corridor is around 21000 daily vehicle-hours
Benefit-Cost Analysis
Following an in-depth review of model results by the study team and the SCAG technical committee the study team performed a benefit-cost analysis (BCA) for each scenario
Using the California Benefit-Cost Model (Cal-BC) developed on behalf of Caltrans by the study team benefits in three key areas were estimated travel time savings vehicle operating cost savings and emission reduction savings The benefits generated from this exercise are based solely on congestion relief related benefits However these results are conservative since there are other benefits not captured by this analysis including benefits from deploying bus rapid transit which will achieve other accessibility benefits
Project costs were developed from SCAG and Caltrans project planning and programming documents These costs include construction and support costs in current dollars The study team estimated costs for projects that did not have cost
I-210 Corridor System Management Plan Executive Summary
Page 37 of 39
estimates by reviewing similar completed projects A BC greater than one means that a scenarios projects return greater benefits than it costs to construct or implement It is important to consider the total benefits that a project brings For example a large capital expansion project can cost a great deal and have a low BC ratio but brings much higher absolute benefits to the I-210 users Exhibit ES-29 shows the benefit to cost ranges classified from low (with a BC of one to two) to very high (with a BC of over 10)
The benefit-cost results for the South Corridor scenarios are shown in Exhibit ES-29
Exhibit ES-29 I-210 Scenario BenefitCost (BC) Results
Scenario Scenario Description
BenefitCost Ranges
Low Medium Medium-High High Very High
lt1 1 to 2 2 to 5 5 to 10 gt10
12 Expand Ramp Metering 34 Advanced Ramp Metering 56 Aux Lane Striping Ramp Improvs 78 Ramp Closures
910 On-Ramp amp Aux Lane Improvs 13 SR-134I-210 IC Modification
The benefit-cost findings for each scenario are as follows
diams Scenarios 1 and 2 (ramp metering expansion) shows a high benefit-cost ratio of over ten The relatively high benefit-cost ratio is due to the low cost of expanding ramp metering ($235 million)
diams Scenarios 3 and 4 (advanced ramp metering) resulted in an incremental benefitshycost ratio of over ten This is relatively high as compared to that of typical transportation management system project
diams Scenarios 5 and 6 (operational improvements) produced a benefit-cost ratio of over five This is relatively consistent with other typical operational improvement projects The benefits are substantial At estimated total cost of about $44 million these projects produced benefits of over $233 million
diams Scenarios 7 and 8 tested the ramp closures at eastbound Marengo westbound Lake and eastbound Mount Olive These ramp closured produced an extremely high incremental benefit-cost ratio of over ten due to the relatively very low cost However this benefit-cost calculation does not account for any potential increase in delay on various local arterials because of detours from the closed ramps
diams Scenarios 9 and 10 also produced a relatively high benefit-cost ratio of over ten The four operational projects in these scenarios are collectively estimated to cost
I-210 Corridor System Management Plan Executive Summary
Page 38 of 39
under $30 million and provide a substantial and optimistic benefit of over $670 million
diams Scenario 13 tested the SR-134I-210 interchange modification This project produced a benefit-cost ratio of between one and two consistent with other typical capital expansion projects This project produced benefits of over $200 million at a rough-estimate cost of about $150 million
diams Scenario 14 tested the westbound center drop ramp from Lake Avenue interchange and eastbound lane addition from Myrtle to I-605 These projects produced a relatively high benefit-cost ratio of about 6 to one as compared to other capital improvement projects These two capital projects are unique in that they have specific operational improvement element that addresses major bottleneck locations For an estimated total combined cost of about $70 million the projected benefits exceed $420 million
CONCLUSIONS AND RECOMMENDATIONS
This section summarizes the conclusions and recommendations based on the analysis discussed in the previous section It is important to note that many of these conclusions are based primarily on the micro-simulation model results The model was developed based on the best data available at the time The study team reviewed the model results and believe that both the calibrated base year forecast year and scenario results are reasonable However Caltrans should always be cautious to make decisions based on modeling alone especially complex micro-simulation models
Based on the results the study team offers the following conclusions and recommendations
diams The combination of all scenarios significantly reduces overall congestion on the corridor Projected 2020 congestion after implementation of all scenarios is below 2006 levels in both the AM and PM peak period In the AM peak period the model projects total delay in 2020 after delivering all projects to be less than 11700 vehicle-hours compared to the 2006 base year delay of 13000 vehicleshyhours This represents a reduction of over 10 percent In the PM peak period the model projects total delay in 2020 after delivering all projects to be around 9500 hours compared to the 2006 base year delay of almost 9300 vehicle-hours This represents a slight reduction of 2 percent Clearly the scenarios deliver significant mobility benefits to the corridor Despite the growth in demand future 2020 congestion will be less than experienced in 2006
diams The completed ramp metering expansion project is expected to produce substantial mobility benefits of over $400 million Delay has been significantly reduced since 2006
I-210 Corridor System Management Plan Executive Summary
Page 39 of 39
diams Advanced ramp metering could provide additional mobility improvements by significantly reducing congestion and returning over $100 million in benefits
diams Ramp closures at Marengo Lake and Mount Olive as alternatives seem promising by reducing delay up to 3000 vehicle-hours per day and providing substantial benefits of $280 million at an extremely low cost
diams Operational improvements such as auxiliary lanes and ramp improvements could leverage on the ramp metering projects by making the corridor more efficient and productive that could result in additional mobility benefits of over $230 million
diams Additional capital improvements with specific operational elements to address weaving at major bottleneck locations could produce significant mobility benefits of over $420 million
diams Enhanced incident management system associated with Scenarios 11 and 12 to address non-recurrent congestion proved effective with a delay reduction of over 300 vehicle-hours for one modest level incident with a typical duration of 35 minutes reduced to 25 minutes With the I-210 corridor experiencing up to 2400 collisions per year this translates to a total annual delay savings of over 700000 vehicle-hours for the study corridor
diams The benefit-cost ratio of all scenarios combined is about 64 to 1 If all projects were delivered at current cost estimates the public would get over six dollars of benefits for each dollar expended In current dollars costs total to over $17 billion whereas the benefits are estimated to be over $20 billion
diams The projects also alleviate greenhouse gas (GHG) emissions by over 15 million tons over 20 years averaging over a 75000-ton reduction per year The emissions are estimated using data from the California Air Resources Board (CARB) EMFAC model
This is the first generation CSMP for the I-210 corridor It is important to stress that CSMPs should be updated on a regular basis This is particularly important since traffic conditions and patterns can differ from current projections After projects are delivered it is also useful to compare actual results with estimated ones in this document so that models can be further improved as appropriate
CSMPs or a variation thereof should become the normal course of business that is based on detailed performance assessments an in-depth understanding of the reasons for performance deterioration and an analytical framework that allows for evaluating complementary operational strategies that maximize the productivity of the current system
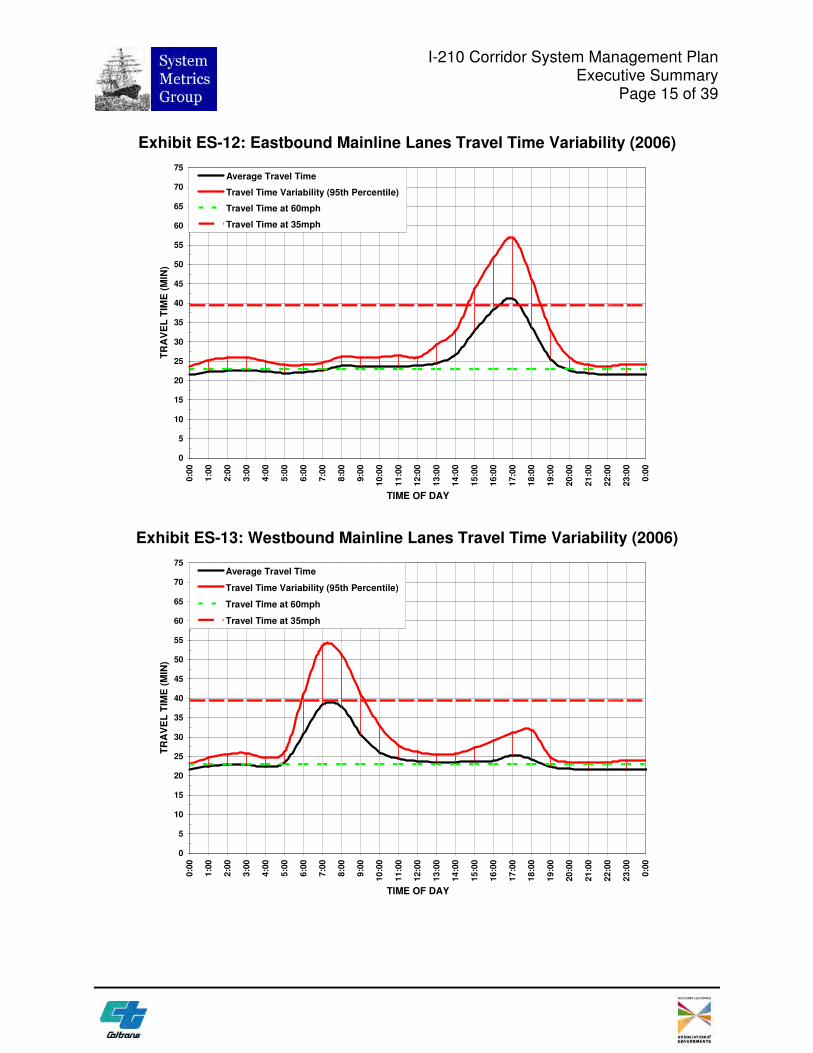
70
65
60
55
50
45
40
35
30
25
20
15
10
5
0
70
65
60
55
50
45
40
35
30
25
20
15
10
5
0
Average Travel Time
Travel Time Variability (95th Percentile)
Travel Time at 60mph
Travel Time at 35mph
TIME OF DAY
Exhibit ES-13 Westbound Mainline Lanes Travel Time Variability (2006)
75
TIME OF DAY
Average Travel Time
Travel Time Variability (95th Percentile)
Travel Time at 60mph
Travel Time at 35mph
Exhibit ES-12 Eastbound Mainline Lanes Travel Time Variability (2006)
75
I-210 Corridor System Management Plan Executive Summary
Page 15 of 39
TR
AV
EL
TIM
E (
MIN
)
00
000
0
10
010
0
TR
AV
EL
TIM
E (
MIN
)
20
020
0
30
030
0
40
040
0
50
050
0
60
060
0
70
070
0
80
080
0
90
090
0
100
01
00
0
110
01
10
0
120
01
20
0
130
01
30
0
140
01
40
0
150
01
50
0
160
01
60
0
170
01
70
0
180
01
80
0
190
01
90
0
200
02
00
0
210
02
10
0
220
02
20
0
230
02
30
0
00
0
00
0
I-210 Corridor System Management Plan Executive Summary
Page 16 of 39
Safety
The adopted performance measures to assess safety involve the number of accidents and the accident rates computed from the Caltrans Traffic Accident Surveillance and Analysis System (TASAS) TASAS is a traffic records system containing an accident database linked to a highway database The highway database contains descriptive elements of highway segments intersections and ramps access control traffic volumes and other data TASAS contains specific data for accidents on State highways Accidents on non-State highways are not included (eg local streets and roads)
The safety assessment in this report intends to characterize the overall accident history and trends in the corridor and to highlight notable accident concentration locations or patterns that are readily apparent This report does not intend to supplant more detailed safety investigations routinely performed by Caltrans staff
Exhibits ES-14 and ES-15 show the I-210 total number of eastbound and westbound accidents by month respectively For the accident analysis the corridor is split in half the ldquoless urbanrdquo western half of the corridor from I-5 (postmile 0) in Sylmar to SR-134 in Pasadena (postmile R2200) and the ldquomore urbanrdquo eastern half from SR-134 to SR-57 (postmile R45) in San Dimas The latest available TASAS data from PeMS is to December 30 2008 Accidents are reported for the study corridor and not separated by mainline and HOV facility The exhibits summarize the latest available three-year data from January 1 2006 through December 31 2008
Both the eastbound and westbound directions have similar accident profiles with the more urbanized eastern half of the corridor (postmile R22 to R45) experiencing nearly 45 times as many accidents as the western half (PM 0 to R22) The eastbound (Exhibit ES-13) direction has around 79 accidents on average per month in the more-urbanized section and just fewer than 18 accidents in the less-urbanized section
The westbound direction has just fewer than 78 accidents on average per month in the more-urbanized section and just fewer than 18 in the less-urbanized section This is very similar to the eastbound direction
Nu
mb
er
of
Ac
cid
en
ts
Nu
mb
er
of
Accid
en
ts
I-210 Corridor System Management Plan Executive Summary
Page 17 of 39
Exhibit ES-14 Eastbound I-210 Monthly Collisions (2004-2008) 120
110
100
90
80
70
60
50
40
30
20
10
0
Jan
Feb
Mar
Ap
rM
ay
Ju
nJu
lA
ug
Sep
Oct
No
vD
ec
Jan
Feb
Mar
Ap
rM
ay
Ju
nJu
lA
ug
Sep
Oct
No
vD
ec
Jan
Feb
Mar
Ap
rM
ay
Ju
nJu
lA
ug
Sep
Oct
No
vD
ec
Jan
Feb
Mar
Ap
rM
ay
Ju
nJu
lA
ug
Sep
Oct
No
vD
ec
Jan
Feb
Mar
Ap
rM
ay
Ju
nJu
lA
ug
Sep
Oct
No
vD
ec
2004 2005 2006 2007 2008
Less Urbanized Western Section (I-5 to SR-134)
More Urbanized Eastern Section (SR-134 to SR-57)
110
100
90
80
70
60
50
40
30
20
10
0
Exhibit ES-15 Westbound I-210 Monthly Collisions (2004-2008) 120
Jan
Feb
Mar
Ap
rM
ay
Ju
nJu
lA
ug
Sep
Oct
No
vD
ec
Jan
Feb
Mar
Ap
rM
ay
Ju
nJu
lA
ug
Sep
Oct
No
vD
ec
Jan
Feb
Mar
Ap
rM
ay
Ju
nJu
lA
ug
Sep
Oct
No
vD
ec
Jan
Feb
Mar
Ap
rM
ay
Ju
nJu
lA
ug
Sep
Oct
No
vD
ec
Jan
Feb
Mar
Ap
rM
ay
Ju
nJu
lA
ug
Sep
Oct
No
vD
ec
2004 2005 2006 2007 2008
Less Urbanized Western Section (I-5 to SR-134)
More Urbanized Eastern Section (SR-134 to SR-57)
I-210 Corridor System Management Plan Executive Summary
Page 18 of 39
Productivity
Productivity is a system efficiency measure used to analyze the throughput of the corridor during congested conditions Restoring lost productivity is one focus area of CSMPs
Exhibit ES-16 illustrates how congestion leads to lost productivity The exhibit uses observed I-210 data from sensors for a typical spring 2010 afternoon peak period (Thursday May 6 2010) It shows speeds (red line) and flow rates (blue line) on eastbound I-210 at Huntington Drive one of the most congested locations on the corridor
Flow rates (measured as vehicle-per-hour-per-lane or ldquovphplrdquo) at Huntington Drive averaged around 1800 vphpl between 200 PM and 300 PM Once volumes approach a maximum flow rate of around 2000 vphl traffic becomes unstable Any additional merging or weaving traffic breaks down and speeds can rapidly plummet to below 35 mph In essence every incremental merge takes up two spots on the freeway for a short time However since the volume is close to the capacity these merges lead to queues Moreover rather than accommodating the same number of vehicles flow rates also drop and vehicles back up creating bottlenecks and associated congestion
At the location shown in Exhibit ES-16 throughput drops by over 30 percent on average during the peak period (from over 1800 to around 1200 vphpl) This five-lane road therefore operates as if lost 30 percent capacity when demand is at its highest Stated differently just when the corridor needed the most capacity it performed in the least productive manner and effectively lost lanes This loss in throughput can be aggregated and presented as ldquoEquivalent Lost-Lane-Milesrdquo
I-210 Corridor System Management Plan Executive Summary
Page 19 of 39
Exhibit ES-16 Lost Productivity Illustrated
70 2000
65
60 1750
50
55 1500
SP
EE
D
45 1250
40
35 1000
30 Speed lt35mph
750 25
20 500 I-210 EB
15 Los Angeles County Huntington
10 PM=3338 250
May 6 2010 5 VDS ID 761141
0 -
FL
OW
RA
TE
(VP
HP
L)
140
0
143
0
150
0
153
0
160
0
163
0
170
0
173
0
180
0
183
0
190
0
193
0
TIME The estimated average non-holiday weekday lost lane-miles by period and year on Ishy210 are shown Exhibits ES-17 (mainline) and ES-18 (HOV) A few notes on these two exhibits
diams The trends in the productivity losses are comparable to the delay trends The largest productivity losses occurred in the eastbound direction during the PM peak hours which is the direction and time period that experienced the most congestion
diams On the mainline facility the westbound direction experienced nearly as high productivity loses during the AM peak period
diams On the HOV lanes a greater productivity loss in the eastbound peak period is more evident
Operational strategies are critical to recovering such productivity losses These strategies include building new or extending auxiliary lanes developing more aggressive ramp metering strategies without negatively influencing the arterial network and improving incident clearance times
I-210 Corridor System Management Plan Executive Summary
Page 20 of 39
Exhibit ES-17 Mainline Daily Equivalent Lost Lane-Miles by Direction and Period (2005-09)
-
10
20
30
40
50
60
70
80
90
100
110
120
130
140
150
160
2005 2006 2007 2008 2009 2005 2006 2007 2008 2009 2005 2006 2007 2008 2009 2005 2006 2007 2008 2009
Eastbound
Westbound
AM PM Midday Night Time Period and Year
Daily
Eq
uiv
ale
nt
Lost
Lan
e-M
iles
Exhibit ES-18 HOV Daily Equivalent Lost Lane-Miles by Direction and Period (2005-09)
-
10
20
30
40
2005 2006 2007 2008 2009 2005 2006 2007 2008 2009 2005 2006 2007 2008 2009 2005 2006 2007 2008 2009
Eastbound
Westbound
AM Midday PM Night
Daily
Eq
uiv
ale
nt
Lost
Lan
e-M
iles
Time Period and Year
I-210 Corridor System Management Plan Executive Summary
Page 21 of 39
BOTTLENECK IDENTIFICATION AND CAUSALITY ANALYSIS
Exhibits ES-19 and ES-20 summarize the eastbound and westbound bottleneck locations the time period that each bottleneck is generally active and the causes of the each bottleneck Exhibits ES-21 and ES-22 are maps of the corridor showing these bottleneck locations for the AM and PM peak periods respectively
Major bottlenecks are the primary cause of congestion and lost productivity By definition a bottleneck is a condition where traffic demand exceeds the effective carrying capacity of the roadway In most cases the cause of a bottleneck is related to a sudden reduction in capacity such as a lane drop merging and weaving driver distractions a surge in demand or a combination of factors
The specific location and causality of each major I-210 bottleneck was verified by multiple field observations on separate weekdays throughout the summer fall and winter of 2009 Some bottleneck locations were videotaped to validate bottlenecks and to assist in micro-simulation model calibration
The detailed final report explains in detail the process and results of the bottleneck identification and causality analysis
I-210 Corridor System Management Plan Executive Summary
Page 22 of 39
Exhibit ES-19 I-210 Eastbound Bottleneck Locations
Abs CA Bottleneck
Location
Active
Period Causality Summary
AM PM
250 R250 Fair Oaks Heavy ramp merge
265 R265 Lake On-ramp Heavy ramp merge
286 R287 San Gabriel On-ramp Heavy ramp merge roadway curves
294 R294 Rosemead On-ramp Heavy consecutive ramp merge
330 R327 Huntington Interchange Heavy ramp merge roadway curves
366 R363 I-605 On-ramp traffic weaving with the off-ramp
400 R397 Azusa On-ramp Heavy ramp merge
408 R406 Citrus On-ramp Heavy ramp merge
450 R450 SR-57 On-ramp Heavy ramp merge and lane drop
Exhibit ES-20 I-210 Westbound Bottleneck Locations
Abs CA
Bottleneck
Location
Active
Period Causality Summary
AM PM
401 R398 Azusa On-ramp Consecutive ramp merge curves
368 R365 I-605 Off-ramp Consecutive ramp merge weaving
322 R319 Santa Anita On-ramp Heavy ramp merge roadway curves
307 R304 Baldwin On-ramp Heavy consecutive ramp merge
297 L297 Rosemead On-ramp Three consecutive ramp merges weaving
280 R281 Altadena On-ramp Heavy ramp merge
261 R261 Lake On-ramp Heavy ramp merge
Bottleneck Locations
reg --Bottleneck
Westbound
Eastbound
0 1 2
I bull I I I bull I I I Miles
HJOUAIIO fl _
I-210 Corridor System Management Plan Executive Summary
Page 23 of 39
Exhibit ES-21 I-210 Map of AM Bottleneck Locations
Bottleneck Locations
reg Bottleneck - Westbound - Eastbound
N 0 1 2
bull I I II II II I ll) Mles s
HJOUAIIO fl _
I-210 Corridor System Management Plan Executive Summary
Page 24 of 39
Exhibit ES-22 I-210 Map of PM Bottleneck Locations
I-210 Corridor System Management Plan Executive Summary
Page 25 of 39
SCENARIO DEVELOPMENT AND ANALYSIS
Fully understanding how a corridor performs and why it performs the way it does sets the foundation for evaluating potential solutions Several steps were required to develop and evaluate improvements including
diams Developing traffic models for 2006 base year and 2020 long-term demand diams Combining projects in a logical manner for modeling and testing diams Evaluating model outputs and summarizing results diams Conducting a benefit-cost assessment of scenarios
Traffic Model Development
The study team developed a traffic model using the VISSIM micro-simulation software It is important to note that micro-simulation models are complex to develop and calibrate for a large urban corridor However it is one of the only tools capable of providing a reasonable approximation of bottleneck formation and queue development Therefore such tools help quantify the impacts of operational strategies which traditional travel demand models cannot
The model was calibrated against 2006 conditions This was a resource intensive effort requiring several iterations of submittals and review cycles until the model reasonably matched bottleneck locations and relative severity Once calibration was approved a 2020 model was also developed based on SCAGrsquos travel demand model demand projections
These two models were used to evaluate different scenarios (combinations of projects) to quantify the associated congestion relief benefits and to compare total project costs against their benefits
Exhibit ES-23 depicts the network included in the model There were no parallel arterials modeled with the exception of arterials at interchanges All freeway interchanges were included as well as on-ramps and off-ramps
I-210 Corridor System Management Plan Executive Summary
Page 26 of 39
Exhibit ES-23 Micro-Simulation Model Network
I-210 Corridor System Management Plan Executive Summary
Page 27 of 39
Scenario Development Framework
The study team developed a framework for combining projects into scenarios It would be desirable to evaluate every possible combination of projects However this would have entailed thousands of model runs Instead the team combined projects based on a number of factors including
diams Projects that were fully constructed and completed from 2006 to 2010 were tested with both the 2006 and 2020 models
diams Short- and mid- term operational projects were grouped into scenarios and tested with the both the 2006 and 2020 models
diams Longer-range projects to be delivered by 2020 and beyond were used to develop scenarios to be tested with the 2020 model only
diams Alternative ramp closures were grouped into isolated scenarios (future scenarios did not build on top of these) and tested with both the 2006 and 2020 models
The study assumes that projects delivered before 2016 could reasonably be evaluated using the 2006 base year model The 2020 forecast year for the I-210 study was consistent with the SCAG 2020 regional travel demand model origin-destination matrices used to develop the 2008 Regional Transportation Plan (RTP) When SCAG updates its travel demand model and Regional Transportation Plan (RTP) it may wish to update the micro-simulation model with revised demand projections
Project lists used to develop scenarios were part from the Regional Transportation Improvement Program (RTIP) the RTP and other sources such as special studies Projects that do not directly affect mobility were eliminated For instance sound wall landscaping or minor arterial improvement projects were not evaluated since microshysimulation models cannot evaluate them
Scenario testing performed for the performed for the I-210 CSMP differed from traditional ldquoalternatives evaluationsrdquo done for Major Investment Studies (MIS) or Environmental Impact Reports (EIRs) An MIS or EIR focuses on identifying alternative solutions to address current or projected corridor problems so each alternative is evaluated separately and results among competing alternatives are compared resulting in a locally preferred alternative In contrast for the I-210 CSMP scenarios build on each other in that a scenario contains the projects from the previous scenario plus one or more projects as long as the incremental scenario results showed an acceptable level of performance improvement This incremental scenario evaluation approach is important since CSMPs are new and are often compared with alternatives studies
Exhibit ES-24 summarizes the approach used and scenarios tested and provides a
I-210 Corridor System Management Plan Executive Summary
Page 28 of 39
general description of the projects included in the 2006 and 2020 micro-simulation runs Most projects were tested for both the short- and long-term timeframes Each scenario tested was built upon prior scenarios except for Scenarios 7 and 8 which were ldquostand alonerdquo scenarios used to test alternative ramp closures Later scenarios build on Scenarios 5 and 6 and do not include the improvements tested in Scenarios 7 and 8 Enhanced incident management was tested in Scenarios 11 and 12 by comparing a simulated incident without and with enhanced incident management system Scenarios 13 and 14 are expected for the longer term and were tested only with the 2020 model
Exhibit ES-24 Micro-Simulation Modeling Approach
Short-Term Scenarios Long-Term Scenarios
Calibrated 2006 Base Case
Scenario 1 Expand Ramp-
Metering
Scenario 3 Scenario 1 +
Adv Ramp-Meter w
Queue Control
Scenario 5 Scenario 3 + aux lane striping and
ramp improvements
2020 Horizon Year
2006 Network 2020 OD Matrices
Scenario 7 Scenario 5 +
Ramp Closures
Scenario 2 Expand Ramp-
Metering
Scenario 4 Scenario 2 +
Adv Ramp-Meter w
Queue Control
Scenario 6 Scenario 4 + aux lane striping and
ramp improvements
Scenario 8 Scenario 6 +
Ramp Closures
Scenario 14 Scenario 13 + Lake
Ave Drop Ramp
Lane Addition
Scenario 9 Scenario 5+
On-Ramp amp Aux
lane improvements
Scenario 10 Scenario 6 +
On-Ramp amp Aux
lane improvements
Scenario 11 Incident with No
Incident
Management
Scenario 12 Incident With
Incident
Management
Scenario 13 Scenario 10 +
134210 IC
modification
Incident Management Scenarios
I-210 Corridor System Management Plan Executive Summary
Page 29 of 39
Scenario Evaluation Results
Exhibits ES-25 and ES-26 show the delay results for all the 2006 scenarios evaluated for the AM and PM peak periods respectively Exhibits ES-27 and ES-28 show the delay results for all the 2020 scenarios evaluated for the AM and PM peak periods respectively For each scenario the modeling team produced results by facility type (ie mainline HOV arterials and ramps) and vehicle type (SOV HOV trucks) as well as speed contour diagrams (discussed in more detail in the full technical CSMP) The study team scrutinized to ensure that they were consistent with general traffic engineering principles The following summarizes the findings related to the four exhibits
Exhibit ES-25 2006 AM Peak Micro-Simulation Delay Results by Scenario
De
lay
(Pe
ak
Pe
rio
d V
eh
icle
-Ho
urs
)
2006 Base Year S1 S3 S5 S7 S9 Scenario
18000
16000
14000
12000
10000
8000
6000
4000
2000
-
S1 Expand Ramp Metering
S3 Adv Ramp Metering
S5 Aux Lane Striping Ramp Improvs
S7 Ramp Closures
S9 On-Ramp amp Aux Lane Improvs
-2 -3 -3
-16 -20
HOV WB I-210 WB
HOV EB I-210 EB
Ramps Arterials
I-210 Corridor System Management Plan Executive Summary
Page 30 of 39
Exhibit ES-26 2006 PM Peak Micro-Simulation Delay Results by Scenario
18000
De
lay
(Pe
ak
Pe
rio
d V
eh
icle
-Ho
urs
)
16000
14000
12000
10000
8000
6000
4000
2000
-
S1 Expand Ramp Metering
S3 Adv Ramp Metering
HOV WB
I-210 WB
S5 Aux Lane Striping Ramp Improvs
S7 Ramp Closures
S9 On-Ramp amp Aux Lane Improvs
HOV EB
I-210 EB
Ramps
Arterials
-17
-11
-18
-18 -28
2006 Base Year S1 S3 S5 S7 S9 Scenario
Exhibit ES-27 2020 AM Peak Micro-Simulation Delay Results by Scenario
30000
De
lay
(Pe
ak
Pe
rio
d V
eh
icle
-Ho
urs
)
25000
20000
15000
10000
5000
S2 Expand Ramp Metering
S4 Adv Ramp Metering
S6 Aux Lane Striping Ramp Improvs
S8 Ramp Closures
HOV WB
I-210 WB
HOV EB
-8
-2 -8
-13 -12
S10 On-Ramp amp Aux Lane Improvs
S13 SR-134I-210 IC Modification
S14 Lake Ave Drop Ramp Lane Addition
I-210 EB
Ramps
Arterials
-11
-23
-
2020 S2 S4 S6 S8 S10 S13 S14 Horizon Scenario
I-210 Corridor System Management Plan Executive Summary
Page 31 of 39
Exhibit ES-28 2020 PM Peak Micro-Simulation Delay Results by Scenario D
ela
y(P
ea
k P
eri
od
Ve
hic
le-H
ou
rs)
30000
25000
20000
15000
10000
5000
-
S2 Expand Ramp Metering
S4 Adv Ramp Metering
S6 Aux Lane Striping Ramp Improvs
S8 Ramp Closures
HOV WB
I-210 WB
HOV EB
-14
S10 On-Ramp amp Aux Lane Improvs
S13 SR-134I-210 IC Modification
S14 Lake Ave Drop Ramp Lane Addition
I-210 EB
Ramps
Arterials
-2 -5 -3 -28
-3 -19
2020 S2 S4 S6 S8 S10 S13 S14 Horizon Scenario
Base Year and Do Minimum Horizon Year
Absent any physical improvements the modeling team estimates that by 2020 total delay (mainline HOV ramps and arterials) would double compared to 2006 (from a total of around 22000 vehicle-hours daily to just fewer than 45000 vehicle-hours) in the combined AM and PM peak
Scenarios 1 and 2 (Expand Ramp Metering)
Scenarios 1 and 2 test the only project on the corridor that was fully constructed and completed The project installed new connector metering at the SR-57 and I-605 to Ishy210 freeway connector ramps The project also widened various ramps removed various HOV meter bypasses and upgraded the ramp metering system
The 2006 model estimates that Scenario 1 would reduce delay on the corridor by around 17 percent (or 1600 daily vehicle-hours) in the PM peak period but only around two percent (or 200 vehicle-hours) in the AM peak period The biggest benefits occur in the PM eastbound direction from Rosemead On-Ramp to Huntington interchange (with a delay reduction of over 1000 vehicle-hours) as well as from I-605 to the Azusa On-Ramp (delay reduction of 500 vehicle-hours) for single occupant vehicles The
I-210 Corridor System Management Plan Executive Summary
Page 32 of 39
westbound reductions in freeway delay are largely offset by increased on-ramp delay mostly from new connector metering at SR-57 and I-605
The 2020 model estimates that Scenario 2 will reduce delay by around 8 percent in the AM peak and 14 percent in the PM peak for a combined total reduction of 5000 daily vehicle-hours The long-term improvements are less than the short-term improvements due to the increase in demand
Scenarios 3 and 4 (Advanced Ramp Metering)
Scenarios 3 and 4 build on Scenarios 1 and 2 by adding advanced ramp metering system such as dynamic or adaptive ramp metering system
The 2006 model shows that Scenario 3 would reduce delay by an additional 850 daily vehicle-hours (or 11 percent) in the PM peak with a marginal reduction in the AM peak period However in conjunction with Scenario 1 Scenario 3 reduces delay in total by over 600 vehicle-hours in the AM peak These results suggest that queue control provides additional benefits beyond SWARM
The 2020 model estimates that Scenario 4 will modestly reduce delay by about 2 percent in both the AM and PM peaks or a combined total of 800 daily vehicle-hours Again the benefits are lower in percentage terms due to the increase in demand
Note that there are various types of advanced ramp metering systems deployed around the world including System-wide Adaptive Ramp Metering System or SWARM tested recently in Los Angeles I-210 freeway corridor For the I-210 model the Asservissement Lineaire drsquoEntreacutee Autoroutiere (ALINEA system) was tested as proxy for any advanced ramp metering system as its algorithm for the model was readily available It is not necessarily recommended that ALINEA be deployed but rather some type of advanced ramp metering system that would produce similar if not better results
Scenarios 5 and 6 (Auxiliary Lane Striping Ramp Improvements)
Scenarios 5 and 6 build on Scenarios 3 and 4 that include several relatively lower-cost operational improvements that could be implemented by 2015
diams Building a westbound auxiliary lane from Santa Anita to Baldwin and an eastbound auxiliary lane from Santa Anita to Huntington
diams Extending a lane to Lincoln on the westbound I-210 connector
diams Connecting and converging the Altadena on-ramps into a single on-ramp
I-210 Corridor System Management Plan Executive Summary
Page 33 of 39
diams Connecting and converging the Santa Anita on-ramps into a single on-ramp
diams Connecting and converging the Irwindale on-ramps into a single on-ramp
diams Restriping to add a lane in the eastbound direction from San Dimas to Fruit
The 2006 model shows that Scenario 5 reduces delay by 3 percent (nearly 400 vehicleshyhours) in the AM peak and 18 percent (1200 vehicle-hours) in the PM peak The segment that experienced the largest improvement in the eastbound during the PM peak was from Rosemead to Huntington This segment experienced a 45 percent improvement in delay (from 2700 vehicle-hours to 1500 vehicle-hours) which is likely attributed to the eastbound auxiliary lane from Santa Anita to Huntington In the westbound direction the auxiliary lane from Santa Anita to Baldwin shifts some traffic downstream to cause increased congestion at Michillinda (ie bottleneck shift) during the westbound AM peak However the auxiliary lane helps reduce both queue length and queue duration for the Santa Anita bottleneck
The 2020 model estimates that Scenario 6 would reduce delay by 8 percent in the AM peak and 5 percent in the PM peak for a total reduction of 2500 daily vehicle-hours A reduction in PM delay is expected to occur mostly in the westbound direction
Scenarios 7 and 8 (Ramp Closures)
Scenarios 7 and 8 build on Scenarios 5 and 6 and test the closure of several ramps
diams Eastbound Marengo on-ramp and westbound Lake on-ramp with signalization of the eastbound I-210 off-ramp at Maple and improvement to alternate routes along Corson and Maple
diams Eastbound Mount Olive ramps
Note that subsequent scenarios are not built on top of these scenarios as these are isolated to test ramp closure alternatives
The 2006 model shows that Scenario 7 would reduce delay significantly by 16 percent in the AM peak and 18 percent in the PM peak for a total delay reduction of nearly 3000 daily vehicle-hours The delay reductions are significant on the mainline during the peak direction of travel ndash 1400 vehicle-hours in the westbound AM and 912 vehicleshyhours in the eastbound PM In the westbound direction and AM peak period the segment from Altadena to Lake experienced over an 85 percent decrease in congestion (from 860 to 120 vehicle-hours of delay) This is likely attributed to the closure of the westbound Lake on-ramp In the eastbound direction and PM peak period the segment from Huntington to I-605 experienced a delay reduction of over 70 percent (from 2200
I-210 Corridor System Management Plan Executive Summary
Page 34 of 39
vehicle-hours to 600 vehicle-hours) which is likely attributed to the closure of the Mount Olive ramp
The 2020 model also shows that Scenario 8 improved delay by 12 percent in the AM and 3 percent in the PM for a total delay reduction of almost 3000 daily vehicle-hours On the mainline facility delay also improved for each peak direction of travel ndash by 1600 daily vehicle-hours in the westbound AM and by 750 vehicle-hours in the eastbound PM Delay reductions in the non-peak direction were not as significant
Scenarios 9 and 10 (On-ramp and Aux Lane Improvements)
Scenarios 9 and 10 build on Scenarios 5 and 6 and test four operational improvements that can be implemented in the short to medium range
diams Modify the RosemeadMichillinda interchange and converge the westbound I-210 on-ramps
diams Modify the northside of the Baldwin interchange and eliminate the collectorshydistributor
diams Construct an eastbound auxiliary lane from Azusa to Citrus
diams Converge the eastbound Citrus on-ramps and add an auxiliary lane to Grand
The 2006 model estimates that Scenario 9 will reduce delay by 20 percent (or 2400 daily vehicle-hours) in the AM peak and 28 percent (or 1600 daily vehicle-hours) in the PM peak compared to Scenario 5 In both AM and PM peak period the eastbound direction experienced the largest reduction in delay
The 2020 model estimates that Scenario 10 will reduce delay by 13 percent (or 2500 vehicle-hours) in the AM peak and 28 percent in the PM peak (or 4800 vehicle-hours) compared to Scenario 6 Similar to the 2006 model the 2020 model shows that these improvements produced a greater reduction in delay in the eastbound direction than the westbound direction
Scenarios 11 and 12 (Enhanced Incident Management)
Two incident scenarios were tested on top of Scenario 10 to evaluate the non-recurrent delay reductions resulting from enhanced incident management strategies An enhanced incident management system would entail upgrading or enhancing the current Caltrans incident management system that includes deployment of intelligent transportation system (ITS) field devices central controlcommunications software communications medium (ie fiber optic lines) advanced traveler information system
I-210 Corridor System Management Plan Executive Summary
Page 35 of 39
andor freeway service patrol (FSP) program to reduce incident detection verification response and clearance times
In the first scenario Scenario 11 one collision incident with one lane closure was simulated in the westbound direction in the AM peak period model and one in the eastbound direction in the PM peak period model The incident simulation location and duration were selected based on review of the 2010 actual incident data at one of the high frequency locations The following are the Scenario details
diams Westbound AM peak period starting at 800 AM close mainline lane 2 for 40 minutes at absolute post mile 2612 (at Lake Avenue)
diams Eastbound PM peak period starting at 500 PM close mainline lane 2 for 50 minutes at absolute post mile 3207 (west of Santa Anita)
In the second scenario Scenario 12 the same collision incidents were simulated with a reduction in duration by 10 minutes in the westbound direction and by 12 minutes in the eastbound direction It is estimated based on actual incident management data analysis results provided by Caltrans that an enhanced incident management system could reduce a 35-minute incident by about 10 minutes This scenario represents a typical moderate level incident at one location during the peak period direction Data suggest that incidents vary significantly in terms of impact and duration Some incidents last hundreds of minutes some close multiple lanes and some occur at multiple locations simultaneously There are also numerous minor incidents lasting only a few minutes without lane closures that can result in congestion Many other incidents also occur during off-peak hours
Without enhanced incident management Scenario 11 produced an 8 percent increase in congestion in both peak periods over Scenario 10 an increase of over 2300 hours of vehicle delay With enhanced incident management Scenario 12 evaluation resulted in delay decrease by 2 percent in the AM peak and 3 percent in the PM peak against Scenario 11 results a reduction of nearly 750 vehicle-hours for improving the incident detection verification response and clearance time of one moderate level incident for both of the peak hours
Scenario 13 (SR-134I-210 Interchange Modification)
Scenario 13 tests an improvement to modify the SR-134I-210 interchange to provide a direct connection for vehicles to continue on I-210 with three lanes in each direction This improvement was tested with the 2020 model since it is not likely to be implemented in the short-term
I-210 Corridor System Management Plan Executive Summary
Page 36 of 39
The 2020 model estimates that delay would be reduced by 11 percent (or 1800 daily vehicle-hours) in the AM and 3 percent in the PM (320 daily vehicle-hours) compared to Scenario 10 The westbound mainline experienced the greatest reduction in delay in the AM peak from 9600 vehicle-hours to 8600 vehicle hours after the interchange modification
Scenario 14 (Westbound Drop Ramp and Eastbound Widening)
Scenario 14 builds on Scenario 13 and tests Lake Avenue drop ramp to westbound Ishy210 center lanes (one HOV lane and one mainline) and eastbound I-210 widening from Myrtle to I-605 This improvement was tested with the 2020 model
The 2020 model estimates that delay would be reduced by about 20 percent in the AM or 3400 vehicle-hours and 20 percent in the PM or 2300 vehicle-hours compared to Scenario 13 The mobility improvements are significant with the westbound drop ramp that reduces weaving between SR-134 and SR-210 destined traffic and with the eastbound capacity addition to I-605 off that moves the off-ramp traffic away from the mainline and provides more room for the mainline through traffic
Post Scenario 14 Conditions
By 2020 with the inclusion of all the projects tested the model reveals some residual congestion that remains to address with future improvements According to the model results the total remaining delay on the corridor is around 21000 daily vehicle-hours
Benefit-Cost Analysis
Following an in-depth review of model results by the study team and the SCAG technical committee the study team performed a benefit-cost analysis (BCA) for each scenario
Using the California Benefit-Cost Model (Cal-BC) developed on behalf of Caltrans by the study team benefits in three key areas were estimated travel time savings vehicle operating cost savings and emission reduction savings The benefits generated from this exercise are based solely on congestion relief related benefits However these results are conservative since there are other benefits not captured by this analysis including benefits from deploying bus rapid transit which will achieve other accessibility benefits
Project costs were developed from SCAG and Caltrans project planning and programming documents These costs include construction and support costs in current dollars The study team estimated costs for projects that did not have cost
I-210 Corridor System Management Plan Executive Summary
Page 37 of 39
estimates by reviewing similar completed projects A BC greater than one means that a scenarios projects return greater benefits than it costs to construct or implement It is important to consider the total benefits that a project brings For example a large capital expansion project can cost a great deal and have a low BC ratio but brings much higher absolute benefits to the I-210 users Exhibit ES-29 shows the benefit to cost ranges classified from low (with a BC of one to two) to very high (with a BC of over 10)
The benefit-cost results for the South Corridor scenarios are shown in Exhibit ES-29
Exhibit ES-29 I-210 Scenario BenefitCost (BC) Results
Scenario Scenario Description
BenefitCost Ranges
Low Medium Medium-High High Very High
lt1 1 to 2 2 to 5 5 to 10 gt10
12 Expand Ramp Metering 34 Advanced Ramp Metering 56 Aux Lane Striping Ramp Improvs 78 Ramp Closures
910 On-Ramp amp Aux Lane Improvs 13 SR-134I-210 IC Modification
The benefit-cost findings for each scenario are as follows
diams Scenarios 1 and 2 (ramp metering expansion) shows a high benefit-cost ratio of over ten The relatively high benefit-cost ratio is due to the low cost of expanding ramp metering ($235 million)
diams Scenarios 3 and 4 (advanced ramp metering) resulted in an incremental benefitshycost ratio of over ten This is relatively high as compared to that of typical transportation management system project
diams Scenarios 5 and 6 (operational improvements) produced a benefit-cost ratio of over five This is relatively consistent with other typical operational improvement projects The benefits are substantial At estimated total cost of about $44 million these projects produced benefits of over $233 million
diams Scenarios 7 and 8 tested the ramp closures at eastbound Marengo westbound Lake and eastbound Mount Olive These ramp closured produced an extremely high incremental benefit-cost ratio of over ten due to the relatively very low cost However this benefit-cost calculation does not account for any potential increase in delay on various local arterials because of detours from the closed ramps
diams Scenarios 9 and 10 also produced a relatively high benefit-cost ratio of over ten The four operational projects in these scenarios are collectively estimated to cost
I-210 Corridor System Management Plan Executive Summary
Page 38 of 39
under $30 million and provide a substantial and optimistic benefit of over $670 million
diams Scenario 13 tested the SR-134I-210 interchange modification This project produced a benefit-cost ratio of between one and two consistent with other typical capital expansion projects This project produced benefits of over $200 million at a rough-estimate cost of about $150 million
diams Scenario 14 tested the westbound center drop ramp from Lake Avenue interchange and eastbound lane addition from Myrtle to I-605 These projects produced a relatively high benefit-cost ratio of about 6 to one as compared to other capital improvement projects These two capital projects are unique in that they have specific operational improvement element that addresses major bottleneck locations For an estimated total combined cost of about $70 million the projected benefits exceed $420 million
CONCLUSIONS AND RECOMMENDATIONS
This section summarizes the conclusions and recommendations based on the analysis discussed in the previous section It is important to note that many of these conclusions are based primarily on the micro-simulation model results The model was developed based on the best data available at the time The study team reviewed the model results and believe that both the calibrated base year forecast year and scenario results are reasonable However Caltrans should always be cautious to make decisions based on modeling alone especially complex micro-simulation models
Based on the results the study team offers the following conclusions and recommendations
diams The combination of all scenarios significantly reduces overall congestion on the corridor Projected 2020 congestion after implementation of all scenarios is below 2006 levels in both the AM and PM peak period In the AM peak period the model projects total delay in 2020 after delivering all projects to be less than 11700 vehicle-hours compared to the 2006 base year delay of 13000 vehicleshyhours This represents a reduction of over 10 percent In the PM peak period the model projects total delay in 2020 after delivering all projects to be around 9500 hours compared to the 2006 base year delay of almost 9300 vehicle-hours This represents a slight reduction of 2 percent Clearly the scenarios deliver significant mobility benefits to the corridor Despite the growth in demand future 2020 congestion will be less than experienced in 2006
diams The completed ramp metering expansion project is expected to produce substantial mobility benefits of over $400 million Delay has been significantly reduced since 2006
I-210 Corridor System Management Plan Executive Summary
Page 39 of 39
diams Advanced ramp metering could provide additional mobility improvements by significantly reducing congestion and returning over $100 million in benefits
diams Ramp closures at Marengo Lake and Mount Olive as alternatives seem promising by reducing delay up to 3000 vehicle-hours per day and providing substantial benefits of $280 million at an extremely low cost
diams Operational improvements such as auxiliary lanes and ramp improvements could leverage on the ramp metering projects by making the corridor more efficient and productive that could result in additional mobility benefits of over $230 million
diams Additional capital improvements with specific operational elements to address weaving at major bottleneck locations could produce significant mobility benefits of over $420 million
diams Enhanced incident management system associated with Scenarios 11 and 12 to address non-recurrent congestion proved effective with a delay reduction of over 300 vehicle-hours for one modest level incident with a typical duration of 35 minutes reduced to 25 minutes With the I-210 corridor experiencing up to 2400 collisions per year this translates to a total annual delay savings of over 700000 vehicle-hours for the study corridor
diams The benefit-cost ratio of all scenarios combined is about 64 to 1 If all projects were delivered at current cost estimates the public would get over six dollars of benefits for each dollar expended In current dollars costs total to over $17 billion whereas the benefits are estimated to be over $20 billion
diams The projects also alleviate greenhouse gas (GHG) emissions by over 15 million tons over 20 years averaging over a 75000-ton reduction per year The emissions are estimated using data from the California Air Resources Board (CARB) EMFAC model
This is the first generation CSMP for the I-210 corridor It is important to stress that CSMPs should be updated on a regular basis This is particularly important since traffic conditions and patterns can differ from current projections After projects are delivered it is also useful to compare actual results with estimated ones in this document so that models can be further improved as appropriate
CSMPs or a variation thereof should become the normal course of business that is based on detailed performance assessments an in-depth understanding of the reasons for performance deterioration and an analytical framework that allows for evaluating complementary operational strategies that maximize the productivity of the current system

I-210 Corridor System Management Plan Executive Summary
Page 16 of 39
Safety
The adopted performance measures to assess safety involve the number of accidents and the accident rates computed from the Caltrans Traffic Accident Surveillance and Analysis System (TASAS) TASAS is a traffic records system containing an accident database linked to a highway database The highway database contains descriptive elements of highway segments intersections and ramps access control traffic volumes and other data TASAS contains specific data for accidents on State highways Accidents on non-State highways are not included (eg local streets and roads)
The safety assessment in this report intends to characterize the overall accident history and trends in the corridor and to highlight notable accident concentration locations or patterns that are readily apparent This report does not intend to supplant more detailed safety investigations routinely performed by Caltrans staff
Exhibits ES-14 and ES-15 show the I-210 total number of eastbound and westbound accidents by month respectively For the accident analysis the corridor is split in half the ldquoless urbanrdquo western half of the corridor from I-5 (postmile 0) in Sylmar to SR-134 in Pasadena (postmile R2200) and the ldquomore urbanrdquo eastern half from SR-134 to SR-57 (postmile R45) in San Dimas The latest available TASAS data from PeMS is to December 30 2008 Accidents are reported for the study corridor and not separated by mainline and HOV facility The exhibits summarize the latest available three-year data from January 1 2006 through December 31 2008
Both the eastbound and westbound directions have similar accident profiles with the more urbanized eastern half of the corridor (postmile R22 to R45) experiencing nearly 45 times as many accidents as the western half (PM 0 to R22) The eastbound (Exhibit ES-13) direction has around 79 accidents on average per month in the more-urbanized section and just fewer than 18 accidents in the less-urbanized section
The westbound direction has just fewer than 78 accidents on average per month in the more-urbanized section and just fewer than 18 in the less-urbanized section This is very similar to the eastbound direction
Nu
mb
er
of
Ac
cid
en
ts
Nu
mb
er
of
Accid
en
ts
I-210 Corridor System Management Plan Executive Summary
Page 17 of 39
Exhibit ES-14 Eastbound I-210 Monthly Collisions (2004-2008) 120
110
100
90
80
70
60
50
40
30
20
10
0
Jan
Feb
Mar
Ap
rM
ay
Ju
nJu
lA
ug
Sep
Oct
No
vD
ec
Jan
Feb
Mar
Ap
rM
ay
Ju
nJu
lA
ug
Sep
Oct
No
vD
ec
Jan
Feb
Mar
Ap
rM
ay
Ju
nJu
lA
ug
Sep
Oct
No
vD
ec
Jan
Feb
Mar
Ap
rM
ay
Ju
nJu
lA
ug
Sep
Oct
No
vD
ec
Jan
Feb
Mar
Ap
rM
ay
Ju
nJu
lA
ug
Sep
Oct
No
vD
ec
2004 2005 2006 2007 2008
Less Urbanized Western Section (I-5 to SR-134)
More Urbanized Eastern Section (SR-134 to SR-57)
110
100
90
80
70
60
50
40
30
20
10
0
Exhibit ES-15 Westbound I-210 Monthly Collisions (2004-2008) 120
Jan
Feb
Mar
Ap
rM
ay
Ju
nJu
lA
ug
Sep
Oct
No
vD
ec
Jan
Feb
Mar
Ap
rM
ay
Ju
nJu
lA
ug
Sep
Oct
No
vD
ec
Jan
Feb
Mar
Ap
rM
ay
Ju
nJu
lA
ug
Sep
Oct
No
vD
ec
Jan
Feb
Mar
Ap
rM
ay
Ju
nJu
lA
ug
Sep
Oct
No
vD
ec
Jan
Feb
Mar
Ap
rM
ay
Ju
nJu
lA
ug
Sep
Oct
No
vD
ec
2004 2005 2006 2007 2008
Less Urbanized Western Section (I-5 to SR-134)
More Urbanized Eastern Section (SR-134 to SR-57)
I-210 Corridor System Management Plan Executive Summary
Page 18 of 39
Productivity
Productivity is a system efficiency measure used to analyze the throughput of the corridor during congested conditions Restoring lost productivity is one focus area of CSMPs
Exhibit ES-16 illustrates how congestion leads to lost productivity The exhibit uses observed I-210 data from sensors for a typical spring 2010 afternoon peak period (Thursday May 6 2010) It shows speeds (red line) and flow rates (blue line) on eastbound I-210 at Huntington Drive one of the most congested locations on the corridor
Flow rates (measured as vehicle-per-hour-per-lane or ldquovphplrdquo) at Huntington Drive averaged around 1800 vphpl between 200 PM and 300 PM Once volumes approach a maximum flow rate of around 2000 vphl traffic becomes unstable Any additional merging or weaving traffic breaks down and speeds can rapidly plummet to below 35 mph In essence every incremental merge takes up two spots on the freeway for a short time However since the volume is close to the capacity these merges lead to queues Moreover rather than accommodating the same number of vehicles flow rates also drop and vehicles back up creating bottlenecks and associated congestion
At the location shown in Exhibit ES-16 throughput drops by over 30 percent on average during the peak period (from over 1800 to around 1200 vphpl) This five-lane road therefore operates as if lost 30 percent capacity when demand is at its highest Stated differently just when the corridor needed the most capacity it performed in the least productive manner and effectively lost lanes This loss in throughput can be aggregated and presented as ldquoEquivalent Lost-Lane-Milesrdquo
I-210 Corridor System Management Plan Executive Summary
Page 19 of 39
Exhibit ES-16 Lost Productivity Illustrated
70 2000
65
60 1750
50
55 1500
SP
EE
D
45 1250
40
35 1000
30 Speed lt35mph
750 25
20 500 I-210 EB
15 Los Angeles County Huntington
10 PM=3338 250
May 6 2010 5 VDS ID 761141
0 -
FL
OW
RA
TE
(VP
HP
L)
140
0
143
0
150
0
153
0
160
0
163
0
170
0
173
0
180
0
183
0
190
0
193
0
TIME The estimated average non-holiday weekday lost lane-miles by period and year on Ishy210 are shown Exhibits ES-17 (mainline) and ES-18 (HOV) A few notes on these two exhibits
diams The trends in the productivity losses are comparable to the delay trends The largest productivity losses occurred in the eastbound direction during the PM peak hours which is the direction and time period that experienced the most congestion
diams On the mainline facility the westbound direction experienced nearly as high productivity loses during the AM peak period
diams On the HOV lanes a greater productivity loss in the eastbound peak period is more evident
Operational strategies are critical to recovering such productivity losses These strategies include building new or extending auxiliary lanes developing more aggressive ramp metering strategies without negatively influencing the arterial network and improving incident clearance times
I-210 Corridor System Management Plan Executive Summary
Page 20 of 39
Exhibit ES-17 Mainline Daily Equivalent Lost Lane-Miles by Direction and Period (2005-09)
-
10
20
30
40
50
60
70
80
90
100
110
120
130
140
150
160
2005 2006 2007 2008 2009 2005 2006 2007 2008 2009 2005 2006 2007 2008 2009 2005 2006 2007 2008 2009
Eastbound
Westbound
AM PM Midday Night Time Period and Year
Daily
Eq
uiv
ale
nt
Lost
Lan
e-M
iles
Exhibit ES-18 HOV Daily Equivalent Lost Lane-Miles by Direction and Period (2005-09)
-
10
20
30
40
2005 2006 2007 2008 2009 2005 2006 2007 2008 2009 2005 2006 2007 2008 2009 2005 2006 2007 2008 2009
Eastbound
Westbound
AM Midday PM Night
Daily
Eq
uiv
ale
nt
Lost
Lan
e-M
iles
Time Period and Year
I-210 Corridor System Management Plan Executive Summary
Page 21 of 39
BOTTLENECK IDENTIFICATION AND CAUSALITY ANALYSIS
Exhibits ES-19 and ES-20 summarize the eastbound and westbound bottleneck locations the time period that each bottleneck is generally active and the causes of the each bottleneck Exhibits ES-21 and ES-22 are maps of the corridor showing these bottleneck locations for the AM and PM peak periods respectively
Major bottlenecks are the primary cause of congestion and lost productivity By definition a bottleneck is a condition where traffic demand exceeds the effective carrying capacity of the roadway In most cases the cause of a bottleneck is related to a sudden reduction in capacity such as a lane drop merging and weaving driver distractions a surge in demand or a combination of factors
The specific location and causality of each major I-210 bottleneck was verified by multiple field observations on separate weekdays throughout the summer fall and winter of 2009 Some bottleneck locations were videotaped to validate bottlenecks and to assist in micro-simulation model calibration
The detailed final report explains in detail the process and results of the bottleneck identification and causality analysis
I-210 Corridor System Management Plan Executive Summary
Page 22 of 39
Exhibit ES-19 I-210 Eastbound Bottleneck Locations
Abs CA Bottleneck
Location
Active
Period Causality Summary
AM PM
250 R250 Fair Oaks Heavy ramp merge
265 R265 Lake On-ramp Heavy ramp merge
286 R287 San Gabriel On-ramp Heavy ramp merge roadway curves
294 R294 Rosemead On-ramp Heavy consecutive ramp merge
330 R327 Huntington Interchange Heavy ramp merge roadway curves
366 R363 I-605 On-ramp traffic weaving with the off-ramp
400 R397 Azusa On-ramp Heavy ramp merge
408 R406 Citrus On-ramp Heavy ramp merge
450 R450 SR-57 On-ramp Heavy ramp merge and lane drop
Exhibit ES-20 I-210 Westbound Bottleneck Locations
Abs CA
Bottleneck
Location
Active
Period Causality Summary
AM PM
401 R398 Azusa On-ramp Consecutive ramp merge curves
368 R365 I-605 Off-ramp Consecutive ramp merge weaving
322 R319 Santa Anita On-ramp Heavy ramp merge roadway curves
307 R304 Baldwin On-ramp Heavy consecutive ramp merge
297 L297 Rosemead On-ramp Three consecutive ramp merges weaving
280 R281 Altadena On-ramp Heavy ramp merge
261 R261 Lake On-ramp Heavy ramp merge
Bottleneck Locations
reg --Bottleneck
Westbound
Eastbound
0 1 2
I bull I I I bull I I I Miles
HJOUAIIO fl _
I-210 Corridor System Management Plan Executive Summary
Page 23 of 39
Exhibit ES-21 I-210 Map of AM Bottleneck Locations
Bottleneck Locations
reg Bottleneck - Westbound - Eastbound
N 0 1 2
bull I I II II II I ll) Mles s
HJOUAIIO fl _
I-210 Corridor System Management Plan Executive Summary
Page 24 of 39
Exhibit ES-22 I-210 Map of PM Bottleneck Locations
I-210 Corridor System Management Plan Executive Summary
Page 25 of 39
SCENARIO DEVELOPMENT AND ANALYSIS
Fully understanding how a corridor performs and why it performs the way it does sets the foundation for evaluating potential solutions Several steps were required to develop and evaluate improvements including
diams Developing traffic models for 2006 base year and 2020 long-term demand diams Combining projects in a logical manner for modeling and testing diams Evaluating model outputs and summarizing results diams Conducting a benefit-cost assessment of scenarios
Traffic Model Development
The study team developed a traffic model using the VISSIM micro-simulation software It is important to note that micro-simulation models are complex to develop and calibrate for a large urban corridor However it is one of the only tools capable of providing a reasonable approximation of bottleneck formation and queue development Therefore such tools help quantify the impacts of operational strategies which traditional travel demand models cannot
The model was calibrated against 2006 conditions This was a resource intensive effort requiring several iterations of submittals and review cycles until the model reasonably matched bottleneck locations and relative severity Once calibration was approved a 2020 model was also developed based on SCAGrsquos travel demand model demand projections
These two models were used to evaluate different scenarios (combinations of projects) to quantify the associated congestion relief benefits and to compare total project costs against their benefits
Exhibit ES-23 depicts the network included in the model There were no parallel arterials modeled with the exception of arterials at interchanges All freeway interchanges were included as well as on-ramps and off-ramps
I-210 Corridor System Management Plan Executive Summary
Page 26 of 39
Exhibit ES-23 Micro-Simulation Model Network
I-210 Corridor System Management Plan Executive Summary
Page 27 of 39
Scenario Development Framework
The study team developed a framework for combining projects into scenarios It would be desirable to evaluate every possible combination of projects However this would have entailed thousands of model runs Instead the team combined projects based on a number of factors including
diams Projects that were fully constructed and completed from 2006 to 2010 were tested with both the 2006 and 2020 models
diams Short- and mid- term operational projects were grouped into scenarios and tested with the both the 2006 and 2020 models
diams Longer-range projects to be delivered by 2020 and beyond were used to develop scenarios to be tested with the 2020 model only
diams Alternative ramp closures were grouped into isolated scenarios (future scenarios did not build on top of these) and tested with both the 2006 and 2020 models
The study assumes that projects delivered before 2016 could reasonably be evaluated using the 2006 base year model The 2020 forecast year for the I-210 study was consistent with the SCAG 2020 regional travel demand model origin-destination matrices used to develop the 2008 Regional Transportation Plan (RTP) When SCAG updates its travel demand model and Regional Transportation Plan (RTP) it may wish to update the micro-simulation model with revised demand projections
Project lists used to develop scenarios were part from the Regional Transportation Improvement Program (RTIP) the RTP and other sources such as special studies Projects that do not directly affect mobility were eliminated For instance sound wall landscaping or minor arterial improvement projects were not evaluated since microshysimulation models cannot evaluate them
Scenario testing performed for the performed for the I-210 CSMP differed from traditional ldquoalternatives evaluationsrdquo done for Major Investment Studies (MIS) or Environmental Impact Reports (EIRs) An MIS or EIR focuses on identifying alternative solutions to address current or projected corridor problems so each alternative is evaluated separately and results among competing alternatives are compared resulting in a locally preferred alternative In contrast for the I-210 CSMP scenarios build on each other in that a scenario contains the projects from the previous scenario plus one or more projects as long as the incremental scenario results showed an acceptable level of performance improvement This incremental scenario evaluation approach is important since CSMPs are new and are often compared with alternatives studies
Exhibit ES-24 summarizes the approach used and scenarios tested and provides a
I-210 Corridor System Management Plan Executive Summary
Page 28 of 39
general description of the projects included in the 2006 and 2020 micro-simulation runs Most projects were tested for both the short- and long-term timeframes Each scenario tested was built upon prior scenarios except for Scenarios 7 and 8 which were ldquostand alonerdquo scenarios used to test alternative ramp closures Later scenarios build on Scenarios 5 and 6 and do not include the improvements tested in Scenarios 7 and 8 Enhanced incident management was tested in Scenarios 11 and 12 by comparing a simulated incident without and with enhanced incident management system Scenarios 13 and 14 are expected for the longer term and were tested only with the 2020 model
Exhibit ES-24 Micro-Simulation Modeling Approach
Short-Term Scenarios Long-Term Scenarios
Calibrated 2006 Base Case
Scenario 1 Expand Ramp-
Metering
Scenario 3 Scenario 1 +
Adv Ramp-Meter w
Queue Control
Scenario 5 Scenario 3 + aux lane striping and
ramp improvements
2020 Horizon Year
2006 Network 2020 OD Matrices
Scenario 7 Scenario 5 +
Ramp Closures
Scenario 2 Expand Ramp-
Metering
Scenario 4 Scenario 2 +
Adv Ramp-Meter w
Queue Control
Scenario 6 Scenario 4 + aux lane striping and
ramp improvements
Scenario 8 Scenario 6 +
Ramp Closures
Scenario 14 Scenario 13 + Lake
Ave Drop Ramp
Lane Addition
Scenario 9 Scenario 5+
On-Ramp amp Aux
lane improvements
Scenario 10 Scenario 6 +
On-Ramp amp Aux
lane improvements
Scenario 11 Incident with No
Incident
Management
Scenario 12 Incident With
Incident
Management
Scenario 13 Scenario 10 +
134210 IC
modification
Incident Management Scenarios
I-210 Corridor System Management Plan Executive Summary
Page 29 of 39
Scenario Evaluation Results
Exhibits ES-25 and ES-26 show the delay results for all the 2006 scenarios evaluated for the AM and PM peak periods respectively Exhibits ES-27 and ES-28 show the delay results for all the 2020 scenarios evaluated for the AM and PM peak periods respectively For each scenario the modeling team produced results by facility type (ie mainline HOV arterials and ramps) and vehicle type (SOV HOV trucks) as well as speed contour diagrams (discussed in more detail in the full technical CSMP) The study team scrutinized to ensure that they were consistent with general traffic engineering principles The following summarizes the findings related to the four exhibits
Exhibit ES-25 2006 AM Peak Micro-Simulation Delay Results by Scenario
De
lay
(Pe
ak
Pe
rio
d V
eh
icle
-Ho
urs
)
2006 Base Year S1 S3 S5 S7 S9 Scenario
18000
16000
14000
12000
10000
8000
6000
4000
2000
-
S1 Expand Ramp Metering
S3 Adv Ramp Metering
S5 Aux Lane Striping Ramp Improvs
S7 Ramp Closures
S9 On-Ramp amp Aux Lane Improvs
-2 -3 -3
-16 -20
HOV WB I-210 WB
HOV EB I-210 EB
Ramps Arterials
I-210 Corridor System Management Plan Executive Summary
Page 30 of 39
Exhibit ES-26 2006 PM Peak Micro-Simulation Delay Results by Scenario
18000
De
lay
(Pe
ak
Pe
rio
d V
eh
icle
-Ho
urs
)
16000
14000
12000
10000
8000
6000
4000
2000
-
S1 Expand Ramp Metering
S3 Adv Ramp Metering
HOV WB
I-210 WB
S5 Aux Lane Striping Ramp Improvs
S7 Ramp Closures
S9 On-Ramp amp Aux Lane Improvs
HOV EB
I-210 EB
Ramps
Arterials
-17
-11
-18
-18 -28
2006 Base Year S1 S3 S5 S7 S9 Scenario
Exhibit ES-27 2020 AM Peak Micro-Simulation Delay Results by Scenario
30000
De
lay
(Pe
ak
Pe
rio
d V
eh
icle
-Ho
urs
)
25000
20000
15000
10000
5000
S2 Expand Ramp Metering
S4 Adv Ramp Metering
S6 Aux Lane Striping Ramp Improvs
S8 Ramp Closures
HOV WB
I-210 WB
HOV EB
-8
-2 -8
-13 -12
S10 On-Ramp amp Aux Lane Improvs
S13 SR-134I-210 IC Modification
S14 Lake Ave Drop Ramp Lane Addition
I-210 EB
Ramps
Arterials
-11
-23
-
2020 S2 S4 S6 S8 S10 S13 S14 Horizon Scenario
I-210 Corridor System Management Plan Executive Summary
Page 31 of 39
Exhibit ES-28 2020 PM Peak Micro-Simulation Delay Results by Scenario D
ela
y(P
ea
k P
eri
od
Ve
hic
le-H
ou
rs)
30000
25000
20000
15000
10000
5000
-
S2 Expand Ramp Metering
S4 Adv Ramp Metering
S6 Aux Lane Striping Ramp Improvs
S8 Ramp Closures
HOV WB
I-210 WB
HOV EB
-14
S10 On-Ramp amp Aux Lane Improvs
S13 SR-134I-210 IC Modification
S14 Lake Ave Drop Ramp Lane Addition
I-210 EB
Ramps
Arterials
-2 -5 -3 -28
-3 -19
2020 S2 S4 S6 S8 S10 S13 S14 Horizon Scenario
Base Year and Do Minimum Horizon Year
Absent any physical improvements the modeling team estimates that by 2020 total delay (mainline HOV ramps and arterials) would double compared to 2006 (from a total of around 22000 vehicle-hours daily to just fewer than 45000 vehicle-hours) in the combined AM and PM peak
Scenarios 1 and 2 (Expand Ramp Metering)
Scenarios 1 and 2 test the only project on the corridor that was fully constructed and completed The project installed new connector metering at the SR-57 and I-605 to Ishy210 freeway connector ramps The project also widened various ramps removed various HOV meter bypasses and upgraded the ramp metering system
The 2006 model estimates that Scenario 1 would reduce delay on the corridor by around 17 percent (or 1600 daily vehicle-hours) in the PM peak period but only around two percent (or 200 vehicle-hours) in the AM peak period The biggest benefits occur in the PM eastbound direction from Rosemead On-Ramp to Huntington interchange (with a delay reduction of over 1000 vehicle-hours) as well as from I-605 to the Azusa On-Ramp (delay reduction of 500 vehicle-hours) for single occupant vehicles The
I-210 Corridor System Management Plan Executive Summary
Page 32 of 39
westbound reductions in freeway delay are largely offset by increased on-ramp delay mostly from new connector metering at SR-57 and I-605
The 2020 model estimates that Scenario 2 will reduce delay by around 8 percent in the AM peak and 14 percent in the PM peak for a combined total reduction of 5000 daily vehicle-hours The long-term improvements are less than the short-term improvements due to the increase in demand
Scenarios 3 and 4 (Advanced Ramp Metering)
Scenarios 3 and 4 build on Scenarios 1 and 2 by adding advanced ramp metering system such as dynamic or adaptive ramp metering system
The 2006 model shows that Scenario 3 would reduce delay by an additional 850 daily vehicle-hours (or 11 percent) in the PM peak with a marginal reduction in the AM peak period However in conjunction with Scenario 1 Scenario 3 reduces delay in total by over 600 vehicle-hours in the AM peak These results suggest that queue control provides additional benefits beyond SWARM
The 2020 model estimates that Scenario 4 will modestly reduce delay by about 2 percent in both the AM and PM peaks or a combined total of 800 daily vehicle-hours Again the benefits are lower in percentage terms due to the increase in demand
Note that there are various types of advanced ramp metering systems deployed around the world including System-wide Adaptive Ramp Metering System or SWARM tested recently in Los Angeles I-210 freeway corridor For the I-210 model the Asservissement Lineaire drsquoEntreacutee Autoroutiere (ALINEA system) was tested as proxy for any advanced ramp metering system as its algorithm for the model was readily available It is not necessarily recommended that ALINEA be deployed but rather some type of advanced ramp metering system that would produce similar if not better results
Scenarios 5 and 6 (Auxiliary Lane Striping Ramp Improvements)
Scenarios 5 and 6 build on Scenarios 3 and 4 that include several relatively lower-cost operational improvements that could be implemented by 2015
diams Building a westbound auxiliary lane from Santa Anita to Baldwin and an eastbound auxiliary lane from Santa Anita to Huntington
diams Extending a lane to Lincoln on the westbound I-210 connector
diams Connecting and converging the Altadena on-ramps into a single on-ramp
I-210 Corridor System Management Plan Executive Summary
Page 33 of 39
diams Connecting and converging the Santa Anita on-ramps into a single on-ramp
diams Connecting and converging the Irwindale on-ramps into a single on-ramp
diams Restriping to add a lane in the eastbound direction from San Dimas to Fruit
The 2006 model shows that Scenario 5 reduces delay by 3 percent (nearly 400 vehicleshyhours) in the AM peak and 18 percent (1200 vehicle-hours) in the PM peak The segment that experienced the largest improvement in the eastbound during the PM peak was from Rosemead to Huntington This segment experienced a 45 percent improvement in delay (from 2700 vehicle-hours to 1500 vehicle-hours) which is likely attributed to the eastbound auxiliary lane from Santa Anita to Huntington In the westbound direction the auxiliary lane from Santa Anita to Baldwin shifts some traffic downstream to cause increased congestion at Michillinda (ie bottleneck shift) during the westbound AM peak However the auxiliary lane helps reduce both queue length and queue duration for the Santa Anita bottleneck
The 2020 model estimates that Scenario 6 would reduce delay by 8 percent in the AM peak and 5 percent in the PM peak for a total reduction of 2500 daily vehicle-hours A reduction in PM delay is expected to occur mostly in the westbound direction
Scenarios 7 and 8 (Ramp Closures)
Scenarios 7 and 8 build on Scenarios 5 and 6 and test the closure of several ramps
diams Eastbound Marengo on-ramp and westbound Lake on-ramp with signalization of the eastbound I-210 off-ramp at Maple and improvement to alternate routes along Corson and Maple
diams Eastbound Mount Olive ramps
Note that subsequent scenarios are not built on top of these scenarios as these are isolated to test ramp closure alternatives
The 2006 model shows that Scenario 7 would reduce delay significantly by 16 percent in the AM peak and 18 percent in the PM peak for a total delay reduction of nearly 3000 daily vehicle-hours The delay reductions are significant on the mainline during the peak direction of travel ndash 1400 vehicle-hours in the westbound AM and 912 vehicleshyhours in the eastbound PM In the westbound direction and AM peak period the segment from Altadena to Lake experienced over an 85 percent decrease in congestion (from 860 to 120 vehicle-hours of delay) This is likely attributed to the closure of the westbound Lake on-ramp In the eastbound direction and PM peak period the segment from Huntington to I-605 experienced a delay reduction of over 70 percent (from 2200
I-210 Corridor System Management Plan Executive Summary
Page 34 of 39
vehicle-hours to 600 vehicle-hours) which is likely attributed to the closure of the Mount Olive ramp
The 2020 model also shows that Scenario 8 improved delay by 12 percent in the AM and 3 percent in the PM for a total delay reduction of almost 3000 daily vehicle-hours On the mainline facility delay also improved for each peak direction of travel ndash by 1600 daily vehicle-hours in the westbound AM and by 750 vehicle-hours in the eastbound PM Delay reductions in the non-peak direction were not as significant
Scenarios 9 and 10 (On-ramp and Aux Lane Improvements)
Scenarios 9 and 10 build on Scenarios 5 and 6 and test four operational improvements that can be implemented in the short to medium range
diams Modify the RosemeadMichillinda interchange and converge the westbound I-210 on-ramps
diams Modify the northside of the Baldwin interchange and eliminate the collectorshydistributor
diams Construct an eastbound auxiliary lane from Azusa to Citrus
diams Converge the eastbound Citrus on-ramps and add an auxiliary lane to Grand
The 2006 model estimates that Scenario 9 will reduce delay by 20 percent (or 2400 daily vehicle-hours) in the AM peak and 28 percent (or 1600 daily vehicle-hours) in the PM peak compared to Scenario 5 In both AM and PM peak period the eastbound direction experienced the largest reduction in delay
The 2020 model estimates that Scenario 10 will reduce delay by 13 percent (or 2500 vehicle-hours) in the AM peak and 28 percent in the PM peak (or 4800 vehicle-hours) compared to Scenario 6 Similar to the 2006 model the 2020 model shows that these improvements produced a greater reduction in delay in the eastbound direction than the westbound direction
Scenarios 11 and 12 (Enhanced Incident Management)
Two incident scenarios were tested on top of Scenario 10 to evaluate the non-recurrent delay reductions resulting from enhanced incident management strategies An enhanced incident management system would entail upgrading or enhancing the current Caltrans incident management system that includes deployment of intelligent transportation system (ITS) field devices central controlcommunications software communications medium (ie fiber optic lines) advanced traveler information system
I-210 Corridor System Management Plan Executive Summary
Page 35 of 39
andor freeway service patrol (FSP) program to reduce incident detection verification response and clearance times
In the first scenario Scenario 11 one collision incident with one lane closure was simulated in the westbound direction in the AM peak period model and one in the eastbound direction in the PM peak period model The incident simulation location and duration were selected based on review of the 2010 actual incident data at one of the high frequency locations The following are the Scenario details
diams Westbound AM peak period starting at 800 AM close mainline lane 2 for 40 minutes at absolute post mile 2612 (at Lake Avenue)
diams Eastbound PM peak period starting at 500 PM close mainline lane 2 for 50 minutes at absolute post mile 3207 (west of Santa Anita)
In the second scenario Scenario 12 the same collision incidents were simulated with a reduction in duration by 10 minutes in the westbound direction and by 12 minutes in the eastbound direction It is estimated based on actual incident management data analysis results provided by Caltrans that an enhanced incident management system could reduce a 35-minute incident by about 10 minutes This scenario represents a typical moderate level incident at one location during the peak period direction Data suggest that incidents vary significantly in terms of impact and duration Some incidents last hundreds of minutes some close multiple lanes and some occur at multiple locations simultaneously There are also numerous minor incidents lasting only a few minutes without lane closures that can result in congestion Many other incidents also occur during off-peak hours
Without enhanced incident management Scenario 11 produced an 8 percent increase in congestion in both peak periods over Scenario 10 an increase of over 2300 hours of vehicle delay With enhanced incident management Scenario 12 evaluation resulted in delay decrease by 2 percent in the AM peak and 3 percent in the PM peak against Scenario 11 results a reduction of nearly 750 vehicle-hours for improving the incident detection verification response and clearance time of one moderate level incident for both of the peak hours
Scenario 13 (SR-134I-210 Interchange Modification)
Scenario 13 tests an improvement to modify the SR-134I-210 interchange to provide a direct connection for vehicles to continue on I-210 with three lanes in each direction This improvement was tested with the 2020 model since it is not likely to be implemented in the short-term
I-210 Corridor System Management Plan Executive Summary
Page 36 of 39
The 2020 model estimates that delay would be reduced by 11 percent (or 1800 daily vehicle-hours) in the AM and 3 percent in the PM (320 daily vehicle-hours) compared to Scenario 10 The westbound mainline experienced the greatest reduction in delay in the AM peak from 9600 vehicle-hours to 8600 vehicle hours after the interchange modification
Scenario 14 (Westbound Drop Ramp and Eastbound Widening)
Scenario 14 builds on Scenario 13 and tests Lake Avenue drop ramp to westbound Ishy210 center lanes (one HOV lane and one mainline) and eastbound I-210 widening from Myrtle to I-605 This improvement was tested with the 2020 model
The 2020 model estimates that delay would be reduced by about 20 percent in the AM or 3400 vehicle-hours and 20 percent in the PM or 2300 vehicle-hours compared to Scenario 13 The mobility improvements are significant with the westbound drop ramp that reduces weaving between SR-134 and SR-210 destined traffic and with the eastbound capacity addition to I-605 off that moves the off-ramp traffic away from the mainline and provides more room for the mainline through traffic
Post Scenario 14 Conditions
By 2020 with the inclusion of all the projects tested the model reveals some residual congestion that remains to address with future improvements According to the model results the total remaining delay on the corridor is around 21000 daily vehicle-hours
Benefit-Cost Analysis
Following an in-depth review of model results by the study team and the SCAG technical committee the study team performed a benefit-cost analysis (BCA) for each scenario
Using the California Benefit-Cost Model (Cal-BC) developed on behalf of Caltrans by the study team benefits in three key areas were estimated travel time savings vehicle operating cost savings and emission reduction savings The benefits generated from this exercise are based solely on congestion relief related benefits However these results are conservative since there are other benefits not captured by this analysis including benefits from deploying bus rapid transit which will achieve other accessibility benefits
Project costs were developed from SCAG and Caltrans project planning and programming documents These costs include construction and support costs in current dollars The study team estimated costs for projects that did not have cost
I-210 Corridor System Management Plan Executive Summary
Page 37 of 39
estimates by reviewing similar completed projects A BC greater than one means that a scenarios projects return greater benefits than it costs to construct or implement It is important to consider the total benefits that a project brings For example a large capital expansion project can cost a great deal and have a low BC ratio but brings much higher absolute benefits to the I-210 users Exhibit ES-29 shows the benefit to cost ranges classified from low (with a BC of one to two) to very high (with a BC of over 10)
The benefit-cost results for the South Corridor scenarios are shown in Exhibit ES-29
Exhibit ES-29 I-210 Scenario BenefitCost (BC) Results
Scenario Scenario Description
BenefitCost Ranges
Low Medium Medium-High High Very High
lt1 1 to 2 2 to 5 5 to 10 gt10
12 Expand Ramp Metering 34 Advanced Ramp Metering 56 Aux Lane Striping Ramp Improvs 78 Ramp Closures
910 On-Ramp amp Aux Lane Improvs 13 SR-134I-210 IC Modification
The benefit-cost findings for each scenario are as follows
diams Scenarios 1 and 2 (ramp metering expansion) shows a high benefit-cost ratio of over ten The relatively high benefit-cost ratio is due to the low cost of expanding ramp metering ($235 million)
diams Scenarios 3 and 4 (advanced ramp metering) resulted in an incremental benefitshycost ratio of over ten This is relatively high as compared to that of typical transportation management system project
diams Scenarios 5 and 6 (operational improvements) produced a benefit-cost ratio of over five This is relatively consistent with other typical operational improvement projects The benefits are substantial At estimated total cost of about $44 million these projects produced benefits of over $233 million
diams Scenarios 7 and 8 tested the ramp closures at eastbound Marengo westbound Lake and eastbound Mount Olive These ramp closured produced an extremely high incremental benefit-cost ratio of over ten due to the relatively very low cost However this benefit-cost calculation does not account for any potential increase in delay on various local arterials because of detours from the closed ramps
diams Scenarios 9 and 10 also produced a relatively high benefit-cost ratio of over ten The four operational projects in these scenarios are collectively estimated to cost
I-210 Corridor System Management Plan Executive Summary
Page 38 of 39
under $30 million and provide a substantial and optimistic benefit of over $670 million
diams Scenario 13 tested the SR-134I-210 interchange modification This project produced a benefit-cost ratio of between one and two consistent with other typical capital expansion projects This project produced benefits of over $200 million at a rough-estimate cost of about $150 million
diams Scenario 14 tested the westbound center drop ramp from Lake Avenue interchange and eastbound lane addition from Myrtle to I-605 These projects produced a relatively high benefit-cost ratio of about 6 to one as compared to other capital improvement projects These two capital projects are unique in that they have specific operational improvement element that addresses major bottleneck locations For an estimated total combined cost of about $70 million the projected benefits exceed $420 million
CONCLUSIONS AND RECOMMENDATIONS
This section summarizes the conclusions and recommendations based on the analysis discussed in the previous section It is important to note that many of these conclusions are based primarily on the micro-simulation model results The model was developed based on the best data available at the time The study team reviewed the model results and believe that both the calibrated base year forecast year and scenario results are reasonable However Caltrans should always be cautious to make decisions based on modeling alone especially complex micro-simulation models
Based on the results the study team offers the following conclusions and recommendations
diams The combination of all scenarios significantly reduces overall congestion on the corridor Projected 2020 congestion after implementation of all scenarios is below 2006 levels in both the AM and PM peak period In the AM peak period the model projects total delay in 2020 after delivering all projects to be less than 11700 vehicle-hours compared to the 2006 base year delay of 13000 vehicleshyhours This represents a reduction of over 10 percent In the PM peak period the model projects total delay in 2020 after delivering all projects to be around 9500 hours compared to the 2006 base year delay of almost 9300 vehicle-hours This represents a slight reduction of 2 percent Clearly the scenarios deliver significant mobility benefits to the corridor Despite the growth in demand future 2020 congestion will be less than experienced in 2006
diams The completed ramp metering expansion project is expected to produce substantial mobility benefits of over $400 million Delay has been significantly reduced since 2006
I-210 Corridor System Management Plan Executive Summary
Page 39 of 39
diams Advanced ramp metering could provide additional mobility improvements by significantly reducing congestion and returning over $100 million in benefits
diams Ramp closures at Marengo Lake and Mount Olive as alternatives seem promising by reducing delay up to 3000 vehicle-hours per day and providing substantial benefits of $280 million at an extremely low cost
diams Operational improvements such as auxiliary lanes and ramp improvements could leverage on the ramp metering projects by making the corridor more efficient and productive that could result in additional mobility benefits of over $230 million
diams Additional capital improvements with specific operational elements to address weaving at major bottleneck locations could produce significant mobility benefits of over $420 million
diams Enhanced incident management system associated with Scenarios 11 and 12 to address non-recurrent congestion proved effective with a delay reduction of over 300 vehicle-hours for one modest level incident with a typical duration of 35 minutes reduced to 25 minutes With the I-210 corridor experiencing up to 2400 collisions per year this translates to a total annual delay savings of over 700000 vehicle-hours for the study corridor
diams The benefit-cost ratio of all scenarios combined is about 64 to 1 If all projects were delivered at current cost estimates the public would get over six dollars of benefits for each dollar expended In current dollars costs total to over $17 billion whereas the benefits are estimated to be over $20 billion
diams The projects also alleviate greenhouse gas (GHG) emissions by over 15 million tons over 20 years averaging over a 75000-ton reduction per year The emissions are estimated using data from the California Air Resources Board (CARB) EMFAC model
This is the first generation CSMP for the I-210 corridor It is important to stress that CSMPs should be updated on a regular basis This is particularly important since traffic conditions and patterns can differ from current projections After projects are delivered it is also useful to compare actual results with estimated ones in this document so that models can be further improved as appropriate
CSMPs or a variation thereof should become the normal course of business that is based on detailed performance assessments an in-depth understanding of the reasons for performance deterioration and an analytical framework that allows for evaluating complementary operational strategies that maximize the productivity of the current system
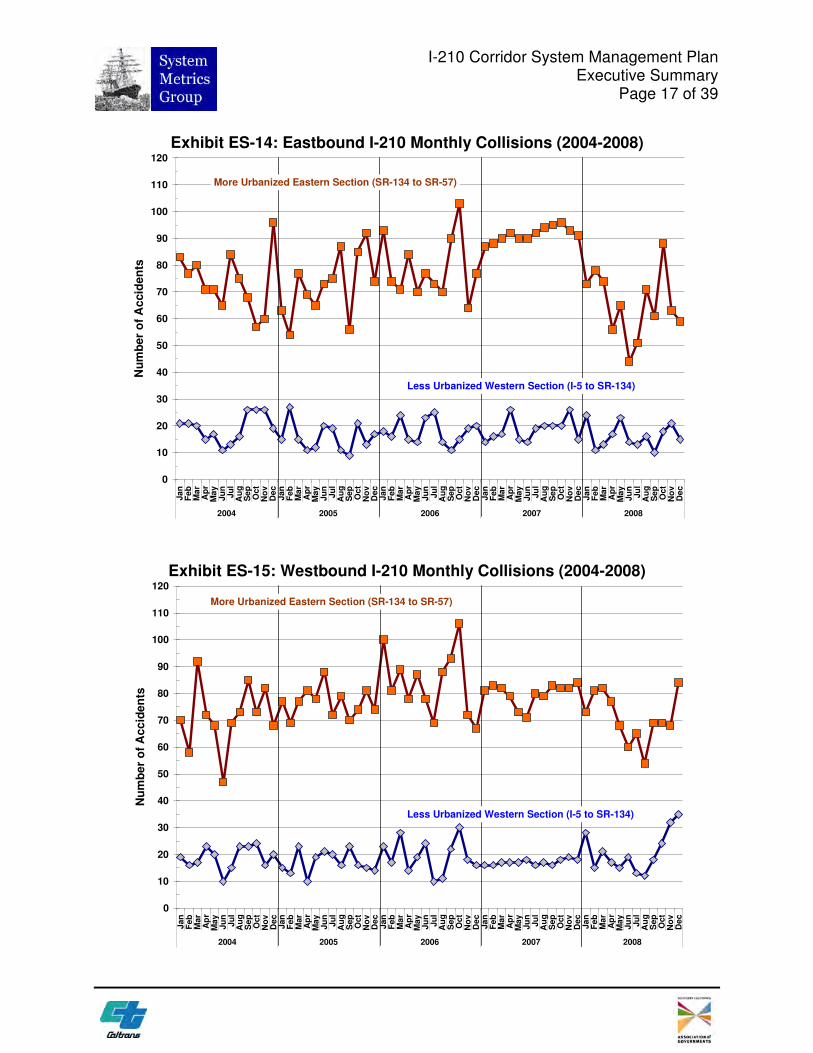
Nu
mb
er
of
Ac
cid
en
ts
Nu
mb
er
of
Accid
en
ts
I-210 Corridor System Management Plan Executive Summary
Page 17 of 39
Exhibit ES-14 Eastbound I-210 Monthly Collisions (2004-2008) 120
110
100
90
80
70
60
50
40
30
20
10
0
Jan
Feb
Mar
Ap
rM
ay
Ju
nJu
lA
ug
Sep
Oct
No
vD
ec
Jan
Feb
Mar
Ap
rM
ay
Ju
nJu
lA
ug
Sep
Oct
No
vD
ec
Jan
Feb
Mar
Ap
rM
ay
Ju
nJu
lA
ug
Sep
Oct
No
vD
ec
Jan
Feb
Mar
Ap
rM
ay
Ju
nJu
lA
ug
Sep
Oct
No
vD
ec
Jan
Feb
Mar
Ap
rM
ay
Ju
nJu
lA
ug
Sep
Oct
No
vD
ec
2004 2005 2006 2007 2008
Less Urbanized Western Section (I-5 to SR-134)
More Urbanized Eastern Section (SR-134 to SR-57)
110
100
90
80
70
60
50
40
30
20
10
0
Exhibit ES-15 Westbound I-210 Monthly Collisions (2004-2008) 120
Jan
Feb
Mar
Ap
rM
ay
Ju
nJu
lA
ug
Sep
Oct
No
vD
ec
Jan
Feb
Mar
Ap
rM
ay
Ju
nJu
lA
ug
Sep
Oct
No
vD
ec
Jan
Feb
Mar
Ap
rM
ay
Ju
nJu
lA
ug
Sep
Oct
No
vD
ec
Jan
Feb
Mar
Ap
rM
ay
Ju
nJu
lA
ug
Sep
Oct
No
vD
ec
Jan
Feb
Mar
Ap
rM
ay
Ju
nJu
lA
ug
Sep
Oct
No
vD
ec
2004 2005 2006 2007 2008
Less Urbanized Western Section (I-5 to SR-134)
More Urbanized Eastern Section (SR-134 to SR-57)
I-210 Corridor System Management Plan Executive Summary
Page 18 of 39
Productivity
Productivity is a system efficiency measure used to analyze the throughput of the corridor during congested conditions Restoring lost productivity is one focus area of CSMPs
Exhibit ES-16 illustrates how congestion leads to lost productivity The exhibit uses observed I-210 data from sensors for a typical spring 2010 afternoon peak period (Thursday May 6 2010) It shows speeds (red line) and flow rates (blue line) on eastbound I-210 at Huntington Drive one of the most congested locations on the corridor
Flow rates (measured as vehicle-per-hour-per-lane or ldquovphplrdquo) at Huntington Drive averaged around 1800 vphpl between 200 PM and 300 PM Once volumes approach a maximum flow rate of around 2000 vphl traffic becomes unstable Any additional merging or weaving traffic breaks down and speeds can rapidly plummet to below 35 mph In essence every incremental merge takes up two spots on the freeway for a short time However since the volume is close to the capacity these merges lead to queues Moreover rather than accommodating the same number of vehicles flow rates also drop and vehicles back up creating bottlenecks and associated congestion
At the location shown in Exhibit ES-16 throughput drops by over 30 percent on average during the peak period (from over 1800 to around 1200 vphpl) This five-lane road therefore operates as if lost 30 percent capacity when demand is at its highest Stated differently just when the corridor needed the most capacity it performed in the least productive manner and effectively lost lanes This loss in throughput can be aggregated and presented as ldquoEquivalent Lost-Lane-Milesrdquo
I-210 Corridor System Management Plan Executive Summary
Page 19 of 39
Exhibit ES-16 Lost Productivity Illustrated
70 2000
65
60 1750
50
55 1500
SP
EE
D
45 1250
40
35 1000
30 Speed lt35mph
750 25
20 500 I-210 EB
15 Los Angeles County Huntington
10 PM=3338 250
May 6 2010 5 VDS ID 761141
0 -
FL
OW
RA
TE
(VP
HP
L)
140
0
143
0
150
0
153
0
160
0
163
0
170
0
173
0
180
0
183
0
190
0
193
0
TIME The estimated average non-holiday weekday lost lane-miles by period and year on Ishy210 are shown Exhibits ES-17 (mainline) and ES-18 (HOV) A few notes on these two exhibits
diams The trends in the productivity losses are comparable to the delay trends The largest productivity losses occurred in the eastbound direction during the PM peak hours which is the direction and time period that experienced the most congestion
diams On the mainline facility the westbound direction experienced nearly as high productivity loses during the AM peak period
diams On the HOV lanes a greater productivity loss in the eastbound peak period is more evident
Operational strategies are critical to recovering such productivity losses These strategies include building new or extending auxiliary lanes developing more aggressive ramp metering strategies without negatively influencing the arterial network and improving incident clearance times
I-210 Corridor System Management Plan Executive Summary
Page 20 of 39
Exhibit ES-17 Mainline Daily Equivalent Lost Lane-Miles by Direction and Period (2005-09)
-
10
20
30
40
50
60
70
80
90
100
110
120
130
140
150
160
2005 2006 2007 2008 2009 2005 2006 2007 2008 2009 2005 2006 2007 2008 2009 2005 2006 2007 2008 2009
Eastbound
Westbound
AM PM Midday Night Time Period and Year
Daily
Eq
uiv
ale
nt
Lost
Lan
e-M
iles
Exhibit ES-18 HOV Daily Equivalent Lost Lane-Miles by Direction and Period (2005-09)
-
10
20
30
40
2005 2006 2007 2008 2009 2005 2006 2007 2008 2009 2005 2006 2007 2008 2009 2005 2006 2007 2008 2009
Eastbound
Westbound
AM Midday PM Night
Daily
Eq
uiv
ale
nt
Lost
Lan
e-M
iles
Time Period and Year
I-210 Corridor System Management Plan Executive Summary
Page 21 of 39
BOTTLENECK IDENTIFICATION AND CAUSALITY ANALYSIS
Exhibits ES-19 and ES-20 summarize the eastbound and westbound bottleneck locations the time period that each bottleneck is generally active and the causes of the each bottleneck Exhibits ES-21 and ES-22 are maps of the corridor showing these bottleneck locations for the AM and PM peak periods respectively
Major bottlenecks are the primary cause of congestion and lost productivity By definition a bottleneck is a condition where traffic demand exceeds the effective carrying capacity of the roadway In most cases the cause of a bottleneck is related to a sudden reduction in capacity such as a lane drop merging and weaving driver distractions a surge in demand or a combination of factors
The specific location and causality of each major I-210 bottleneck was verified by multiple field observations on separate weekdays throughout the summer fall and winter of 2009 Some bottleneck locations were videotaped to validate bottlenecks and to assist in micro-simulation model calibration
The detailed final report explains in detail the process and results of the bottleneck identification and causality analysis
I-210 Corridor System Management Plan Executive Summary
Page 22 of 39
Exhibit ES-19 I-210 Eastbound Bottleneck Locations
Abs CA Bottleneck
Location
Active
Period Causality Summary
AM PM
250 R250 Fair Oaks Heavy ramp merge
265 R265 Lake On-ramp Heavy ramp merge
286 R287 San Gabriel On-ramp Heavy ramp merge roadway curves
294 R294 Rosemead On-ramp Heavy consecutive ramp merge
330 R327 Huntington Interchange Heavy ramp merge roadway curves
366 R363 I-605 On-ramp traffic weaving with the off-ramp
400 R397 Azusa On-ramp Heavy ramp merge
408 R406 Citrus On-ramp Heavy ramp merge
450 R450 SR-57 On-ramp Heavy ramp merge and lane drop
Exhibit ES-20 I-210 Westbound Bottleneck Locations
Abs CA
Bottleneck
Location
Active
Period Causality Summary
AM PM
401 R398 Azusa On-ramp Consecutive ramp merge curves
368 R365 I-605 Off-ramp Consecutive ramp merge weaving
322 R319 Santa Anita On-ramp Heavy ramp merge roadway curves
307 R304 Baldwin On-ramp Heavy consecutive ramp merge
297 L297 Rosemead On-ramp Three consecutive ramp merges weaving
280 R281 Altadena On-ramp Heavy ramp merge
261 R261 Lake On-ramp Heavy ramp merge
Bottleneck Locations
reg --Bottleneck
Westbound
Eastbound
0 1 2
I bull I I I bull I I I Miles
HJOUAIIO fl _
I-210 Corridor System Management Plan Executive Summary
Page 23 of 39
Exhibit ES-21 I-210 Map of AM Bottleneck Locations
Bottleneck Locations
reg Bottleneck - Westbound - Eastbound
N 0 1 2
bull I I II II II I ll) Mles s
HJOUAIIO fl _
I-210 Corridor System Management Plan Executive Summary
Page 24 of 39
Exhibit ES-22 I-210 Map of PM Bottleneck Locations
I-210 Corridor System Management Plan Executive Summary
Page 25 of 39
SCENARIO DEVELOPMENT AND ANALYSIS
Fully understanding how a corridor performs and why it performs the way it does sets the foundation for evaluating potential solutions Several steps were required to develop and evaluate improvements including
diams Developing traffic models for 2006 base year and 2020 long-term demand diams Combining projects in a logical manner for modeling and testing diams Evaluating model outputs and summarizing results diams Conducting a benefit-cost assessment of scenarios
Traffic Model Development
The study team developed a traffic model using the VISSIM micro-simulation software It is important to note that micro-simulation models are complex to develop and calibrate for a large urban corridor However it is one of the only tools capable of providing a reasonable approximation of bottleneck formation and queue development Therefore such tools help quantify the impacts of operational strategies which traditional travel demand models cannot
The model was calibrated against 2006 conditions This was a resource intensive effort requiring several iterations of submittals and review cycles until the model reasonably matched bottleneck locations and relative severity Once calibration was approved a 2020 model was also developed based on SCAGrsquos travel demand model demand projections
These two models were used to evaluate different scenarios (combinations of projects) to quantify the associated congestion relief benefits and to compare total project costs against their benefits
Exhibit ES-23 depicts the network included in the model There were no parallel arterials modeled with the exception of arterials at interchanges All freeway interchanges were included as well as on-ramps and off-ramps
I-210 Corridor System Management Plan Executive Summary
Page 26 of 39
Exhibit ES-23 Micro-Simulation Model Network
I-210 Corridor System Management Plan Executive Summary
Page 27 of 39
Scenario Development Framework
The study team developed a framework for combining projects into scenarios It would be desirable to evaluate every possible combination of projects However this would have entailed thousands of model runs Instead the team combined projects based on a number of factors including
diams Projects that were fully constructed and completed from 2006 to 2010 were tested with both the 2006 and 2020 models
diams Short- and mid- term operational projects were grouped into scenarios and tested with the both the 2006 and 2020 models
diams Longer-range projects to be delivered by 2020 and beyond were used to develop scenarios to be tested with the 2020 model only
diams Alternative ramp closures were grouped into isolated scenarios (future scenarios did not build on top of these) and tested with both the 2006 and 2020 models
The study assumes that projects delivered before 2016 could reasonably be evaluated using the 2006 base year model The 2020 forecast year for the I-210 study was consistent with the SCAG 2020 regional travel demand model origin-destination matrices used to develop the 2008 Regional Transportation Plan (RTP) When SCAG updates its travel demand model and Regional Transportation Plan (RTP) it may wish to update the micro-simulation model with revised demand projections
Project lists used to develop scenarios were part from the Regional Transportation Improvement Program (RTIP) the RTP and other sources such as special studies Projects that do not directly affect mobility were eliminated For instance sound wall landscaping or minor arterial improvement projects were not evaluated since microshysimulation models cannot evaluate them
Scenario testing performed for the performed for the I-210 CSMP differed from traditional ldquoalternatives evaluationsrdquo done for Major Investment Studies (MIS) or Environmental Impact Reports (EIRs) An MIS or EIR focuses on identifying alternative solutions to address current or projected corridor problems so each alternative is evaluated separately and results among competing alternatives are compared resulting in a locally preferred alternative In contrast for the I-210 CSMP scenarios build on each other in that a scenario contains the projects from the previous scenario plus one or more projects as long as the incremental scenario results showed an acceptable level of performance improvement This incremental scenario evaluation approach is important since CSMPs are new and are often compared with alternatives studies
Exhibit ES-24 summarizes the approach used and scenarios tested and provides a
I-210 Corridor System Management Plan Executive Summary
Page 28 of 39
general description of the projects included in the 2006 and 2020 micro-simulation runs Most projects were tested for both the short- and long-term timeframes Each scenario tested was built upon prior scenarios except for Scenarios 7 and 8 which were ldquostand alonerdquo scenarios used to test alternative ramp closures Later scenarios build on Scenarios 5 and 6 and do not include the improvements tested in Scenarios 7 and 8 Enhanced incident management was tested in Scenarios 11 and 12 by comparing a simulated incident without and with enhanced incident management system Scenarios 13 and 14 are expected for the longer term and were tested only with the 2020 model
Exhibit ES-24 Micro-Simulation Modeling Approach
Short-Term Scenarios Long-Term Scenarios
Calibrated 2006 Base Case
Scenario 1 Expand Ramp-
Metering
Scenario 3 Scenario 1 +
Adv Ramp-Meter w
Queue Control
Scenario 5 Scenario 3 + aux lane striping and
ramp improvements
2020 Horizon Year
2006 Network 2020 OD Matrices
Scenario 7 Scenario 5 +
Ramp Closures
Scenario 2 Expand Ramp-
Metering
Scenario 4 Scenario 2 +
Adv Ramp-Meter w
Queue Control
Scenario 6 Scenario 4 + aux lane striping and
ramp improvements
Scenario 8 Scenario 6 +
Ramp Closures
Scenario 14 Scenario 13 + Lake
Ave Drop Ramp
Lane Addition
Scenario 9 Scenario 5+
On-Ramp amp Aux
lane improvements
Scenario 10 Scenario 6 +
On-Ramp amp Aux
lane improvements
Scenario 11 Incident with No
Incident
Management
Scenario 12 Incident With
Incident
Management
Scenario 13 Scenario 10 +
134210 IC
modification
Incident Management Scenarios
I-210 Corridor System Management Plan Executive Summary
Page 29 of 39
Scenario Evaluation Results
Exhibits ES-25 and ES-26 show the delay results for all the 2006 scenarios evaluated for the AM and PM peak periods respectively Exhibits ES-27 and ES-28 show the delay results for all the 2020 scenarios evaluated for the AM and PM peak periods respectively For each scenario the modeling team produced results by facility type (ie mainline HOV arterials and ramps) and vehicle type (SOV HOV trucks) as well as speed contour diagrams (discussed in more detail in the full technical CSMP) The study team scrutinized to ensure that they were consistent with general traffic engineering principles The following summarizes the findings related to the four exhibits
Exhibit ES-25 2006 AM Peak Micro-Simulation Delay Results by Scenario
De
lay
(Pe
ak
Pe
rio
d V
eh
icle
-Ho
urs
)
2006 Base Year S1 S3 S5 S7 S9 Scenario
18000
16000
14000
12000
10000
8000
6000
4000
2000
-
S1 Expand Ramp Metering
S3 Adv Ramp Metering
S5 Aux Lane Striping Ramp Improvs
S7 Ramp Closures
S9 On-Ramp amp Aux Lane Improvs
-2 -3 -3
-16 -20
HOV WB I-210 WB
HOV EB I-210 EB
Ramps Arterials
I-210 Corridor System Management Plan Executive Summary
Page 30 of 39
Exhibit ES-26 2006 PM Peak Micro-Simulation Delay Results by Scenario
18000
De
lay
(Pe
ak
Pe
rio
d V
eh
icle
-Ho
urs
)
16000
14000
12000
10000
8000
6000
4000
2000
-
S1 Expand Ramp Metering
S3 Adv Ramp Metering
HOV WB
I-210 WB
S5 Aux Lane Striping Ramp Improvs
S7 Ramp Closures
S9 On-Ramp amp Aux Lane Improvs
HOV EB
I-210 EB
Ramps
Arterials
-17
-11
-18
-18 -28
2006 Base Year S1 S3 S5 S7 S9 Scenario
Exhibit ES-27 2020 AM Peak Micro-Simulation Delay Results by Scenario
30000
De
lay
(Pe
ak
Pe
rio
d V
eh
icle
-Ho
urs
)
25000
20000
15000
10000
5000
S2 Expand Ramp Metering
S4 Adv Ramp Metering
S6 Aux Lane Striping Ramp Improvs
S8 Ramp Closures
HOV WB
I-210 WB
HOV EB
-8
-2 -8
-13 -12
S10 On-Ramp amp Aux Lane Improvs
S13 SR-134I-210 IC Modification
S14 Lake Ave Drop Ramp Lane Addition
I-210 EB
Ramps
Arterials
-11
-23
-
2020 S2 S4 S6 S8 S10 S13 S14 Horizon Scenario
I-210 Corridor System Management Plan Executive Summary
Page 31 of 39
Exhibit ES-28 2020 PM Peak Micro-Simulation Delay Results by Scenario D
ela
y(P
ea
k P
eri
od
Ve
hic
le-H
ou
rs)
30000
25000
20000
15000
10000
5000
-
S2 Expand Ramp Metering
S4 Adv Ramp Metering
S6 Aux Lane Striping Ramp Improvs
S8 Ramp Closures
HOV WB
I-210 WB
HOV EB
-14
S10 On-Ramp amp Aux Lane Improvs
S13 SR-134I-210 IC Modification
S14 Lake Ave Drop Ramp Lane Addition
I-210 EB
Ramps
Arterials
-2 -5 -3 -28
-3 -19
2020 S2 S4 S6 S8 S10 S13 S14 Horizon Scenario
Base Year and Do Minimum Horizon Year
Absent any physical improvements the modeling team estimates that by 2020 total delay (mainline HOV ramps and arterials) would double compared to 2006 (from a total of around 22000 vehicle-hours daily to just fewer than 45000 vehicle-hours) in the combined AM and PM peak
Scenarios 1 and 2 (Expand Ramp Metering)
Scenarios 1 and 2 test the only project on the corridor that was fully constructed and completed The project installed new connector metering at the SR-57 and I-605 to Ishy210 freeway connector ramps The project also widened various ramps removed various HOV meter bypasses and upgraded the ramp metering system
The 2006 model estimates that Scenario 1 would reduce delay on the corridor by around 17 percent (or 1600 daily vehicle-hours) in the PM peak period but only around two percent (or 200 vehicle-hours) in the AM peak period The biggest benefits occur in the PM eastbound direction from Rosemead On-Ramp to Huntington interchange (with a delay reduction of over 1000 vehicle-hours) as well as from I-605 to the Azusa On-Ramp (delay reduction of 500 vehicle-hours) for single occupant vehicles The
I-210 Corridor System Management Plan Executive Summary
Page 32 of 39
westbound reductions in freeway delay are largely offset by increased on-ramp delay mostly from new connector metering at SR-57 and I-605
The 2020 model estimates that Scenario 2 will reduce delay by around 8 percent in the AM peak and 14 percent in the PM peak for a combined total reduction of 5000 daily vehicle-hours The long-term improvements are less than the short-term improvements due to the increase in demand
Scenarios 3 and 4 (Advanced Ramp Metering)
Scenarios 3 and 4 build on Scenarios 1 and 2 by adding advanced ramp metering system such as dynamic or adaptive ramp metering system
The 2006 model shows that Scenario 3 would reduce delay by an additional 850 daily vehicle-hours (or 11 percent) in the PM peak with a marginal reduction in the AM peak period However in conjunction with Scenario 1 Scenario 3 reduces delay in total by over 600 vehicle-hours in the AM peak These results suggest that queue control provides additional benefits beyond SWARM
The 2020 model estimates that Scenario 4 will modestly reduce delay by about 2 percent in both the AM and PM peaks or a combined total of 800 daily vehicle-hours Again the benefits are lower in percentage terms due to the increase in demand
Note that there are various types of advanced ramp metering systems deployed around the world including System-wide Adaptive Ramp Metering System or SWARM tested recently in Los Angeles I-210 freeway corridor For the I-210 model the Asservissement Lineaire drsquoEntreacutee Autoroutiere (ALINEA system) was tested as proxy for any advanced ramp metering system as its algorithm for the model was readily available It is not necessarily recommended that ALINEA be deployed but rather some type of advanced ramp metering system that would produce similar if not better results
Scenarios 5 and 6 (Auxiliary Lane Striping Ramp Improvements)
Scenarios 5 and 6 build on Scenarios 3 and 4 that include several relatively lower-cost operational improvements that could be implemented by 2015
diams Building a westbound auxiliary lane from Santa Anita to Baldwin and an eastbound auxiliary lane from Santa Anita to Huntington
diams Extending a lane to Lincoln on the westbound I-210 connector
diams Connecting and converging the Altadena on-ramps into a single on-ramp
I-210 Corridor System Management Plan Executive Summary
Page 33 of 39
diams Connecting and converging the Santa Anita on-ramps into a single on-ramp
diams Connecting and converging the Irwindale on-ramps into a single on-ramp
diams Restriping to add a lane in the eastbound direction from San Dimas to Fruit
The 2006 model shows that Scenario 5 reduces delay by 3 percent (nearly 400 vehicleshyhours) in the AM peak and 18 percent (1200 vehicle-hours) in the PM peak The segment that experienced the largest improvement in the eastbound during the PM peak was from Rosemead to Huntington This segment experienced a 45 percent improvement in delay (from 2700 vehicle-hours to 1500 vehicle-hours) which is likely attributed to the eastbound auxiliary lane from Santa Anita to Huntington In the westbound direction the auxiliary lane from Santa Anita to Baldwin shifts some traffic downstream to cause increased congestion at Michillinda (ie bottleneck shift) during the westbound AM peak However the auxiliary lane helps reduce both queue length and queue duration for the Santa Anita bottleneck
The 2020 model estimates that Scenario 6 would reduce delay by 8 percent in the AM peak and 5 percent in the PM peak for a total reduction of 2500 daily vehicle-hours A reduction in PM delay is expected to occur mostly in the westbound direction
Scenarios 7 and 8 (Ramp Closures)
Scenarios 7 and 8 build on Scenarios 5 and 6 and test the closure of several ramps
diams Eastbound Marengo on-ramp and westbound Lake on-ramp with signalization of the eastbound I-210 off-ramp at Maple and improvement to alternate routes along Corson and Maple
diams Eastbound Mount Olive ramps
Note that subsequent scenarios are not built on top of these scenarios as these are isolated to test ramp closure alternatives
The 2006 model shows that Scenario 7 would reduce delay significantly by 16 percent in the AM peak and 18 percent in the PM peak for a total delay reduction of nearly 3000 daily vehicle-hours The delay reductions are significant on the mainline during the peak direction of travel ndash 1400 vehicle-hours in the westbound AM and 912 vehicleshyhours in the eastbound PM In the westbound direction and AM peak period the segment from Altadena to Lake experienced over an 85 percent decrease in congestion (from 860 to 120 vehicle-hours of delay) This is likely attributed to the closure of the westbound Lake on-ramp In the eastbound direction and PM peak period the segment from Huntington to I-605 experienced a delay reduction of over 70 percent (from 2200
I-210 Corridor System Management Plan Executive Summary
Page 34 of 39
vehicle-hours to 600 vehicle-hours) which is likely attributed to the closure of the Mount Olive ramp
The 2020 model also shows that Scenario 8 improved delay by 12 percent in the AM and 3 percent in the PM for a total delay reduction of almost 3000 daily vehicle-hours On the mainline facility delay also improved for each peak direction of travel ndash by 1600 daily vehicle-hours in the westbound AM and by 750 vehicle-hours in the eastbound PM Delay reductions in the non-peak direction were not as significant
Scenarios 9 and 10 (On-ramp and Aux Lane Improvements)
Scenarios 9 and 10 build on Scenarios 5 and 6 and test four operational improvements that can be implemented in the short to medium range
diams Modify the RosemeadMichillinda interchange and converge the westbound I-210 on-ramps
diams Modify the northside of the Baldwin interchange and eliminate the collectorshydistributor
diams Construct an eastbound auxiliary lane from Azusa to Citrus
diams Converge the eastbound Citrus on-ramps and add an auxiliary lane to Grand
The 2006 model estimates that Scenario 9 will reduce delay by 20 percent (or 2400 daily vehicle-hours) in the AM peak and 28 percent (or 1600 daily vehicle-hours) in the PM peak compared to Scenario 5 In both AM and PM peak period the eastbound direction experienced the largest reduction in delay
The 2020 model estimates that Scenario 10 will reduce delay by 13 percent (or 2500 vehicle-hours) in the AM peak and 28 percent in the PM peak (or 4800 vehicle-hours) compared to Scenario 6 Similar to the 2006 model the 2020 model shows that these improvements produced a greater reduction in delay in the eastbound direction than the westbound direction
Scenarios 11 and 12 (Enhanced Incident Management)
Two incident scenarios were tested on top of Scenario 10 to evaluate the non-recurrent delay reductions resulting from enhanced incident management strategies An enhanced incident management system would entail upgrading or enhancing the current Caltrans incident management system that includes deployment of intelligent transportation system (ITS) field devices central controlcommunications software communications medium (ie fiber optic lines) advanced traveler information system
I-210 Corridor System Management Plan Executive Summary
Page 35 of 39
andor freeway service patrol (FSP) program to reduce incident detection verification response and clearance times
In the first scenario Scenario 11 one collision incident with one lane closure was simulated in the westbound direction in the AM peak period model and one in the eastbound direction in the PM peak period model The incident simulation location and duration were selected based on review of the 2010 actual incident data at one of the high frequency locations The following are the Scenario details
diams Westbound AM peak period starting at 800 AM close mainline lane 2 for 40 minutes at absolute post mile 2612 (at Lake Avenue)
diams Eastbound PM peak period starting at 500 PM close mainline lane 2 for 50 minutes at absolute post mile 3207 (west of Santa Anita)
In the second scenario Scenario 12 the same collision incidents were simulated with a reduction in duration by 10 minutes in the westbound direction and by 12 minutes in the eastbound direction It is estimated based on actual incident management data analysis results provided by Caltrans that an enhanced incident management system could reduce a 35-minute incident by about 10 minutes This scenario represents a typical moderate level incident at one location during the peak period direction Data suggest that incidents vary significantly in terms of impact and duration Some incidents last hundreds of minutes some close multiple lanes and some occur at multiple locations simultaneously There are also numerous minor incidents lasting only a few minutes without lane closures that can result in congestion Many other incidents also occur during off-peak hours
Without enhanced incident management Scenario 11 produced an 8 percent increase in congestion in both peak periods over Scenario 10 an increase of over 2300 hours of vehicle delay With enhanced incident management Scenario 12 evaluation resulted in delay decrease by 2 percent in the AM peak and 3 percent in the PM peak against Scenario 11 results a reduction of nearly 750 vehicle-hours for improving the incident detection verification response and clearance time of one moderate level incident for both of the peak hours
Scenario 13 (SR-134I-210 Interchange Modification)
Scenario 13 tests an improvement to modify the SR-134I-210 interchange to provide a direct connection for vehicles to continue on I-210 with three lanes in each direction This improvement was tested with the 2020 model since it is not likely to be implemented in the short-term
I-210 Corridor System Management Plan Executive Summary
Page 36 of 39
The 2020 model estimates that delay would be reduced by 11 percent (or 1800 daily vehicle-hours) in the AM and 3 percent in the PM (320 daily vehicle-hours) compared to Scenario 10 The westbound mainline experienced the greatest reduction in delay in the AM peak from 9600 vehicle-hours to 8600 vehicle hours after the interchange modification
Scenario 14 (Westbound Drop Ramp and Eastbound Widening)
Scenario 14 builds on Scenario 13 and tests Lake Avenue drop ramp to westbound Ishy210 center lanes (one HOV lane and one mainline) and eastbound I-210 widening from Myrtle to I-605 This improvement was tested with the 2020 model
The 2020 model estimates that delay would be reduced by about 20 percent in the AM or 3400 vehicle-hours and 20 percent in the PM or 2300 vehicle-hours compared to Scenario 13 The mobility improvements are significant with the westbound drop ramp that reduces weaving between SR-134 and SR-210 destined traffic and with the eastbound capacity addition to I-605 off that moves the off-ramp traffic away from the mainline and provides more room for the mainline through traffic
Post Scenario 14 Conditions
By 2020 with the inclusion of all the projects tested the model reveals some residual congestion that remains to address with future improvements According to the model results the total remaining delay on the corridor is around 21000 daily vehicle-hours
Benefit-Cost Analysis
Following an in-depth review of model results by the study team and the SCAG technical committee the study team performed a benefit-cost analysis (BCA) for each scenario
Using the California Benefit-Cost Model (Cal-BC) developed on behalf of Caltrans by the study team benefits in three key areas were estimated travel time savings vehicle operating cost savings and emission reduction savings The benefits generated from this exercise are based solely on congestion relief related benefits However these results are conservative since there are other benefits not captured by this analysis including benefits from deploying bus rapid transit which will achieve other accessibility benefits
Project costs were developed from SCAG and Caltrans project planning and programming documents These costs include construction and support costs in current dollars The study team estimated costs for projects that did not have cost
I-210 Corridor System Management Plan Executive Summary
Page 37 of 39
estimates by reviewing similar completed projects A BC greater than one means that a scenarios projects return greater benefits than it costs to construct or implement It is important to consider the total benefits that a project brings For example a large capital expansion project can cost a great deal and have a low BC ratio but brings much higher absolute benefits to the I-210 users Exhibit ES-29 shows the benefit to cost ranges classified from low (with a BC of one to two) to very high (with a BC of over 10)
The benefit-cost results for the South Corridor scenarios are shown in Exhibit ES-29
Exhibit ES-29 I-210 Scenario BenefitCost (BC) Results
Scenario Scenario Description
BenefitCost Ranges
Low Medium Medium-High High Very High
lt1 1 to 2 2 to 5 5 to 10 gt10
12 Expand Ramp Metering 34 Advanced Ramp Metering 56 Aux Lane Striping Ramp Improvs 78 Ramp Closures
910 On-Ramp amp Aux Lane Improvs 13 SR-134I-210 IC Modification
The benefit-cost findings for each scenario are as follows
diams Scenarios 1 and 2 (ramp metering expansion) shows a high benefit-cost ratio of over ten The relatively high benefit-cost ratio is due to the low cost of expanding ramp metering ($235 million)
diams Scenarios 3 and 4 (advanced ramp metering) resulted in an incremental benefitshycost ratio of over ten This is relatively high as compared to that of typical transportation management system project
diams Scenarios 5 and 6 (operational improvements) produced a benefit-cost ratio of over five This is relatively consistent with other typical operational improvement projects The benefits are substantial At estimated total cost of about $44 million these projects produced benefits of over $233 million
diams Scenarios 7 and 8 tested the ramp closures at eastbound Marengo westbound Lake and eastbound Mount Olive These ramp closured produced an extremely high incremental benefit-cost ratio of over ten due to the relatively very low cost However this benefit-cost calculation does not account for any potential increase in delay on various local arterials because of detours from the closed ramps
diams Scenarios 9 and 10 also produced a relatively high benefit-cost ratio of over ten The four operational projects in these scenarios are collectively estimated to cost
I-210 Corridor System Management Plan Executive Summary
Page 38 of 39
under $30 million and provide a substantial and optimistic benefit of over $670 million
diams Scenario 13 tested the SR-134I-210 interchange modification This project produced a benefit-cost ratio of between one and two consistent with other typical capital expansion projects This project produced benefits of over $200 million at a rough-estimate cost of about $150 million
diams Scenario 14 tested the westbound center drop ramp from Lake Avenue interchange and eastbound lane addition from Myrtle to I-605 These projects produced a relatively high benefit-cost ratio of about 6 to one as compared to other capital improvement projects These two capital projects are unique in that they have specific operational improvement element that addresses major bottleneck locations For an estimated total combined cost of about $70 million the projected benefits exceed $420 million
CONCLUSIONS AND RECOMMENDATIONS
This section summarizes the conclusions and recommendations based on the analysis discussed in the previous section It is important to note that many of these conclusions are based primarily on the micro-simulation model results The model was developed based on the best data available at the time The study team reviewed the model results and believe that both the calibrated base year forecast year and scenario results are reasonable However Caltrans should always be cautious to make decisions based on modeling alone especially complex micro-simulation models
Based on the results the study team offers the following conclusions and recommendations
diams The combination of all scenarios significantly reduces overall congestion on the corridor Projected 2020 congestion after implementation of all scenarios is below 2006 levels in both the AM and PM peak period In the AM peak period the model projects total delay in 2020 after delivering all projects to be less than 11700 vehicle-hours compared to the 2006 base year delay of 13000 vehicleshyhours This represents a reduction of over 10 percent In the PM peak period the model projects total delay in 2020 after delivering all projects to be around 9500 hours compared to the 2006 base year delay of almost 9300 vehicle-hours This represents a slight reduction of 2 percent Clearly the scenarios deliver significant mobility benefits to the corridor Despite the growth in demand future 2020 congestion will be less than experienced in 2006
diams The completed ramp metering expansion project is expected to produce substantial mobility benefits of over $400 million Delay has been significantly reduced since 2006
I-210 Corridor System Management Plan Executive Summary
Page 39 of 39
diams Advanced ramp metering could provide additional mobility improvements by significantly reducing congestion and returning over $100 million in benefits
diams Ramp closures at Marengo Lake and Mount Olive as alternatives seem promising by reducing delay up to 3000 vehicle-hours per day and providing substantial benefits of $280 million at an extremely low cost
diams Operational improvements such as auxiliary lanes and ramp improvements could leverage on the ramp metering projects by making the corridor more efficient and productive that could result in additional mobility benefits of over $230 million
diams Additional capital improvements with specific operational elements to address weaving at major bottleneck locations could produce significant mobility benefits of over $420 million
diams Enhanced incident management system associated with Scenarios 11 and 12 to address non-recurrent congestion proved effective with a delay reduction of over 300 vehicle-hours for one modest level incident with a typical duration of 35 minutes reduced to 25 minutes With the I-210 corridor experiencing up to 2400 collisions per year this translates to a total annual delay savings of over 700000 vehicle-hours for the study corridor
diams The benefit-cost ratio of all scenarios combined is about 64 to 1 If all projects were delivered at current cost estimates the public would get over six dollars of benefits for each dollar expended In current dollars costs total to over $17 billion whereas the benefits are estimated to be over $20 billion
diams The projects also alleviate greenhouse gas (GHG) emissions by over 15 million tons over 20 years averaging over a 75000-ton reduction per year The emissions are estimated using data from the California Air Resources Board (CARB) EMFAC model
This is the first generation CSMP for the I-210 corridor It is important to stress that CSMPs should be updated on a regular basis This is particularly important since traffic conditions and patterns can differ from current projections After projects are delivered it is also useful to compare actual results with estimated ones in this document so that models can be further improved as appropriate
CSMPs or a variation thereof should become the normal course of business that is based on detailed performance assessments an in-depth understanding of the reasons for performance deterioration and an analytical framework that allows for evaluating complementary operational strategies that maximize the productivity of the current system

I-210 Corridor System Management Plan Executive Summary
Page 18 of 39
Productivity
Productivity is a system efficiency measure used to analyze the throughput of the corridor during congested conditions Restoring lost productivity is one focus area of CSMPs
Exhibit ES-16 illustrates how congestion leads to lost productivity The exhibit uses observed I-210 data from sensors for a typical spring 2010 afternoon peak period (Thursday May 6 2010) It shows speeds (red line) and flow rates (blue line) on eastbound I-210 at Huntington Drive one of the most congested locations on the corridor
Flow rates (measured as vehicle-per-hour-per-lane or ldquovphplrdquo) at Huntington Drive averaged around 1800 vphpl between 200 PM and 300 PM Once volumes approach a maximum flow rate of around 2000 vphl traffic becomes unstable Any additional merging or weaving traffic breaks down and speeds can rapidly plummet to below 35 mph In essence every incremental merge takes up two spots on the freeway for a short time However since the volume is close to the capacity these merges lead to queues Moreover rather than accommodating the same number of vehicles flow rates also drop and vehicles back up creating bottlenecks and associated congestion
At the location shown in Exhibit ES-16 throughput drops by over 30 percent on average during the peak period (from over 1800 to around 1200 vphpl) This five-lane road therefore operates as if lost 30 percent capacity when demand is at its highest Stated differently just when the corridor needed the most capacity it performed in the least productive manner and effectively lost lanes This loss in throughput can be aggregated and presented as ldquoEquivalent Lost-Lane-Milesrdquo
I-210 Corridor System Management Plan Executive Summary
Page 19 of 39
Exhibit ES-16 Lost Productivity Illustrated
70 2000
65
60 1750
50
55 1500
SP
EE
D
45 1250
40
35 1000
30 Speed lt35mph
750 25
20 500 I-210 EB
15 Los Angeles County Huntington
10 PM=3338 250
May 6 2010 5 VDS ID 761141
0 -
FL
OW
RA
TE
(VP
HP
L)
140
0
143
0
150
0
153
0
160
0
163
0
170
0
173
0
180
0
183
0
190
0
193
0
TIME The estimated average non-holiday weekday lost lane-miles by period and year on Ishy210 are shown Exhibits ES-17 (mainline) and ES-18 (HOV) A few notes on these two exhibits
diams The trends in the productivity losses are comparable to the delay trends The largest productivity losses occurred in the eastbound direction during the PM peak hours which is the direction and time period that experienced the most congestion
diams On the mainline facility the westbound direction experienced nearly as high productivity loses during the AM peak period
diams On the HOV lanes a greater productivity loss in the eastbound peak period is more evident
Operational strategies are critical to recovering such productivity losses These strategies include building new or extending auxiliary lanes developing more aggressive ramp metering strategies without negatively influencing the arterial network and improving incident clearance times
I-210 Corridor System Management Plan Executive Summary
Page 20 of 39
Exhibit ES-17 Mainline Daily Equivalent Lost Lane-Miles by Direction and Period (2005-09)
-
10
20
30
40
50
60
70
80
90
100
110
120
130
140
150
160
2005 2006 2007 2008 2009 2005 2006 2007 2008 2009 2005 2006 2007 2008 2009 2005 2006 2007 2008 2009
Eastbound
Westbound
AM PM Midday Night Time Period and Year
Daily
Eq
uiv
ale
nt
Lost
Lan
e-M
iles
Exhibit ES-18 HOV Daily Equivalent Lost Lane-Miles by Direction and Period (2005-09)
-
10
20
30
40
2005 2006 2007 2008 2009 2005 2006 2007 2008 2009 2005 2006 2007 2008 2009 2005 2006 2007 2008 2009
Eastbound
Westbound
AM Midday PM Night
Daily
Eq
uiv
ale
nt
Lost
Lan
e-M
iles
Time Period and Year
I-210 Corridor System Management Plan Executive Summary
Page 21 of 39
BOTTLENECK IDENTIFICATION AND CAUSALITY ANALYSIS
Exhibits ES-19 and ES-20 summarize the eastbound and westbound bottleneck locations the time period that each bottleneck is generally active and the causes of the each bottleneck Exhibits ES-21 and ES-22 are maps of the corridor showing these bottleneck locations for the AM and PM peak periods respectively
Major bottlenecks are the primary cause of congestion and lost productivity By definition a bottleneck is a condition where traffic demand exceeds the effective carrying capacity of the roadway In most cases the cause of a bottleneck is related to a sudden reduction in capacity such as a lane drop merging and weaving driver distractions a surge in demand or a combination of factors
The specific location and causality of each major I-210 bottleneck was verified by multiple field observations on separate weekdays throughout the summer fall and winter of 2009 Some bottleneck locations were videotaped to validate bottlenecks and to assist in micro-simulation model calibration
The detailed final report explains in detail the process and results of the bottleneck identification and causality analysis
I-210 Corridor System Management Plan Executive Summary
Page 22 of 39
Exhibit ES-19 I-210 Eastbound Bottleneck Locations
Abs CA Bottleneck
Location
Active
Period Causality Summary
AM PM
250 R250 Fair Oaks Heavy ramp merge
265 R265 Lake On-ramp Heavy ramp merge
286 R287 San Gabriel On-ramp Heavy ramp merge roadway curves
294 R294 Rosemead On-ramp Heavy consecutive ramp merge
330 R327 Huntington Interchange Heavy ramp merge roadway curves
366 R363 I-605 On-ramp traffic weaving with the off-ramp
400 R397 Azusa On-ramp Heavy ramp merge
408 R406 Citrus On-ramp Heavy ramp merge
450 R450 SR-57 On-ramp Heavy ramp merge and lane drop
Exhibit ES-20 I-210 Westbound Bottleneck Locations
Abs CA
Bottleneck
Location
Active
Period Causality Summary
AM PM
401 R398 Azusa On-ramp Consecutive ramp merge curves
368 R365 I-605 Off-ramp Consecutive ramp merge weaving
322 R319 Santa Anita On-ramp Heavy ramp merge roadway curves
307 R304 Baldwin On-ramp Heavy consecutive ramp merge
297 L297 Rosemead On-ramp Three consecutive ramp merges weaving
280 R281 Altadena On-ramp Heavy ramp merge
261 R261 Lake On-ramp Heavy ramp merge
Bottleneck Locations
reg --Bottleneck
Westbound
Eastbound
0 1 2
I bull I I I bull I I I Miles
HJOUAIIO fl _
I-210 Corridor System Management Plan Executive Summary
Page 23 of 39
Exhibit ES-21 I-210 Map of AM Bottleneck Locations
Bottleneck Locations
reg Bottleneck - Westbound - Eastbound
N 0 1 2
bull I I II II II I ll) Mles s
HJOUAIIO fl _
I-210 Corridor System Management Plan Executive Summary
Page 24 of 39
Exhibit ES-22 I-210 Map of PM Bottleneck Locations
I-210 Corridor System Management Plan Executive Summary
Page 25 of 39
SCENARIO DEVELOPMENT AND ANALYSIS
Fully understanding how a corridor performs and why it performs the way it does sets the foundation for evaluating potential solutions Several steps were required to develop and evaluate improvements including
diams Developing traffic models for 2006 base year and 2020 long-term demand diams Combining projects in a logical manner for modeling and testing diams Evaluating model outputs and summarizing results diams Conducting a benefit-cost assessment of scenarios
Traffic Model Development
The study team developed a traffic model using the VISSIM micro-simulation software It is important to note that micro-simulation models are complex to develop and calibrate for a large urban corridor However it is one of the only tools capable of providing a reasonable approximation of bottleneck formation and queue development Therefore such tools help quantify the impacts of operational strategies which traditional travel demand models cannot
The model was calibrated against 2006 conditions This was a resource intensive effort requiring several iterations of submittals and review cycles until the model reasonably matched bottleneck locations and relative severity Once calibration was approved a 2020 model was also developed based on SCAGrsquos travel demand model demand projections
These two models were used to evaluate different scenarios (combinations of projects) to quantify the associated congestion relief benefits and to compare total project costs against their benefits
Exhibit ES-23 depicts the network included in the model There were no parallel arterials modeled with the exception of arterials at interchanges All freeway interchanges were included as well as on-ramps and off-ramps
I-210 Corridor System Management Plan Executive Summary
Page 26 of 39
Exhibit ES-23 Micro-Simulation Model Network
I-210 Corridor System Management Plan Executive Summary
Page 27 of 39
Scenario Development Framework
The study team developed a framework for combining projects into scenarios It would be desirable to evaluate every possible combination of projects However this would have entailed thousands of model runs Instead the team combined projects based on a number of factors including
diams Projects that were fully constructed and completed from 2006 to 2010 were tested with both the 2006 and 2020 models
diams Short- and mid- term operational projects were grouped into scenarios and tested with the both the 2006 and 2020 models
diams Longer-range projects to be delivered by 2020 and beyond were used to develop scenarios to be tested with the 2020 model only
diams Alternative ramp closures were grouped into isolated scenarios (future scenarios did not build on top of these) and tested with both the 2006 and 2020 models
The study assumes that projects delivered before 2016 could reasonably be evaluated using the 2006 base year model The 2020 forecast year for the I-210 study was consistent with the SCAG 2020 regional travel demand model origin-destination matrices used to develop the 2008 Regional Transportation Plan (RTP) When SCAG updates its travel demand model and Regional Transportation Plan (RTP) it may wish to update the micro-simulation model with revised demand projections
Project lists used to develop scenarios were part from the Regional Transportation Improvement Program (RTIP) the RTP and other sources such as special studies Projects that do not directly affect mobility were eliminated For instance sound wall landscaping or minor arterial improvement projects were not evaluated since microshysimulation models cannot evaluate them
Scenario testing performed for the performed for the I-210 CSMP differed from traditional ldquoalternatives evaluationsrdquo done for Major Investment Studies (MIS) or Environmental Impact Reports (EIRs) An MIS or EIR focuses on identifying alternative solutions to address current or projected corridor problems so each alternative is evaluated separately and results among competing alternatives are compared resulting in a locally preferred alternative In contrast for the I-210 CSMP scenarios build on each other in that a scenario contains the projects from the previous scenario plus one or more projects as long as the incremental scenario results showed an acceptable level of performance improvement This incremental scenario evaluation approach is important since CSMPs are new and are often compared with alternatives studies
Exhibit ES-24 summarizes the approach used and scenarios tested and provides a
I-210 Corridor System Management Plan Executive Summary
Page 28 of 39
general description of the projects included in the 2006 and 2020 micro-simulation runs Most projects were tested for both the short- and long-term timeframes Each scenario tested was built upon prior scenarios except for Scenarios 7 and 8 which were ldquostand alonerdquo scenarios used to test alternative ramp closures Later scenarios build on Scenarios 5 and 6 and do not include the improvements tested in Scenarios 7 and 8 Enhanced incident management was tested in Scenarios 11 and 12 by comparing a simulated incident without and with enhanced incident management system Scenarios 13 and 14 are expected for the longer term and were tested only with the 2020 model
Exhibit ES-24 Micro-Simulation Modeling Approach
Short-Term Scenarios Long-Term Scenarios
Calibrated 2006 Base Case
Scenario 1 Expand Ramp-
Metering
Scenario 3 Scenario 1 +
Adv Ramp-Meter w
Queue Control
Scenario 5 Scenario 3 + aux lane striping and
ramp improvements
2020 Horizon Year
2006 Network 2020 OD Matrices
Scenario 7 Scenario 5 +
Ramp Closures
Scenario 2 Expand Ramp-
Metering
Scenario 4 Scenario 2 +
Adv Ramp-Meter w
Queue Control
Scenario 6 Scenario 4 + aux lane striping and
ramp improvements
Scenario 8 Scenario 6 +
Ramp Closures
Scenario 14 Scenario 13 + Lake
Ave Drop Ramp
Lane Addition
Scenario 9 Scenario 5+
On-Ramp amp Aux
lane improvements
Scenario 10 Scenario 6 +
On-Ramp amp Aux
lane improvements
Scenario 11 Incident with No
Incident
Management
Scenario 12 Incident With
Incident
Management
Scenario 13 Scenario 10 +
134210 IC
modification
Incident Management Scenarios
I-210 Corridor System Management Plan Executive Summary
Page 29 of 39
Scenario Evaluation Results
Exhibits ES-25 and ES-26 show the delay results for all the 2006 scenarios evaluated for the AM and PM peak periods respectively Exhibits ES-27 and ES-28 show the delay results for all the 2020 scenarios evaluated for the AM and PM peak periods respectively For each scenario the modeling team produced results by facility type (ie mainline HOV arterials and ramps) and vehicle type (SOV HOV trucks) as well as speed contour diagrams (discussed in more detail in the full technical CSMP) The study team scrutinized to ensure that they were consistent with general traffic engineering principles The following summarizes the findings related to the four exhibits
Exhibit ES-25 2006 AM Peak Micro-Simulation Delay Results by Scenario
De
lay
(Pe
ak
Pe
rio
d V
eh
icle
-Ho
urs
)
2006 Base Year S1 S3 S5 S7 S9 Scenario
18000
16000
14000
12000
10000
8000
6000
4000
2000
-
S1 Expand Ramp Metering
S3 Adv Ramp Metering
S5 Aux Lane Striping Ramp Improvs
S7 Ramp Closures
S9 On-Ramp amp Aux Lane Improvs
-2 -3 -3
-16 -20
HOV WB I-210 WB
HOV EB I-210 EB
Ramps Arterials
I-210 Corridor System Management Plan Executive Summary
Page 30 of 39
Exhibit ES-26 2006 PM Peak Micro-Simulation Delay Results by Scenario
18000
De
lay
(Pe
ak
Pe
rio
d V
eh
icle
-Ho
urs
)
16000
14000
12000
10000
8000
6000
4000
2000
-
S1 Expand Ramp Metering
S3 Adv Ramp Metering
HOV WB
I-210 WB
S5 Aux Lane Striping Ramp Improvs
S7 Ramp Closures
S9 On-Ramp amp Aux Lane Improvs
HOV EB
I-210 EB
Ramps
Arterials
-17
-11
-18
-18 -28
2006 Base Year S1 S3 S5 S7 S9 Scenario
Exhibit ES-27 2020 AM Peak Micro-Simulation Delay Results by Scenario
30000
De
lay
(Pe
ak
Pe
rio
d V
eh
icle
-Ho
urs
)
25000
20000
15000
10000
5000
S2 Expand Ramp Metering
S4 Adv Ramp Metering
S6 Aux Lane Striping Ramp Improvs
S8 Ramp Closures
HOV WB
I-210 WB
HOV EB
-8
-2 -8
-13 -12
S10 On-Ramp amp Aux Lane Improvs
S13 SR-134I-210 IC Modification
S14 Lake Ave Drop Ramp Lane Addition
I-210 EB
Ramps
Arterials
-11
-23
-
2020 S2 S4 S6 S8 S10 S13 S14 Horizon Scenario
I-210 Corridor System Management Plan Executive Summary
Page 31 of 39
Exhibit ES-28 2020 PM Peak Micro-Simulation Delay Results by Scenario D
ela
y(P
ea
k P
eri
od
Ve
hic
le-H
ou
rs)
30000
25000
20000
15000
10000
5000
-
S2 Expand Ramp Metering
S4 Adv Ramp Metering
S6 Aux Lane Striping Ramp Improvs
S8 Ramp Closures
HOV WB
I-210 WB
HOV EB
-14
S10 On-Ramp amp Aux Lane Improvs
S13 SR-134I-210 IC Modification
S14 Lake Ave Drop Ramp Lane Addition
I-210 EB
Ramps
Arterials
-2 -5 -3 -28
-3 -19
2020 S2 S4 S6 S8 S10 S13 S14 Horizon Scenario
Base Year and Do Minimum Horizon Year
Absent any physical improvements the modeling team estimates that by 2020 total delay (mainline HOV ramps and arterials) would double compared to 2006 (from a total of around 22000 vehicle-hours daily to just fewer than 45000 vehicle-hours) in the combined AM and PM peak
Scenarios 1 and 2 (Expand Ramp Metering)
Scenarios 1 and 2 test the only project on the corridor that was fully constructed and completed The project installed new connector metering at the SR-57 and I-605 to Ishy210 freeway connector ramps The project also widened various ramps removed various HOV meter bypasses and upgraded the ramp metering system
The 2006 model estimates that Scenario 1 would reduce delay on the corridor by around 17 percent (or 1600 daily vehicle-hours) in the PM peak period but only around two percent (or 200 vehicle-hours) in the AM peak period The biggest benefits occur in the PM eastbound direction from Rosemead On-Ramp to Huntington interchange (with a delay reduction of over 1000 vehicle-hours) as well as from I-605 to the Azusa On-Ramp (delay reduction of 500 vehicle-hours) for single occupant vehicles The
I-210 Corridor System Management Plan Executive Summary
Page 32 of 39
westbound reductions in freeway delay are largely offset by increased on-ramp delay mostly from new connector metering at SR-57 and I-605
The 2020 model estimates that Scenario 2 will reduce delay by around 8 percent in the AM peak and 14 percent in the PM peak for a combined total reduction of 5000 daily vehicle-hours The long-term improvements are less than the short-term improvements due to the increase in demand
Scenarios 3 and 4 (Advanced Ramp Metering)
Scenarios 3 and 4 build on Scenarios 1 and 2 by adding advanced ramp metering system such as dynamic or adaptive ramp metering system
The 2006 model shows that Scenario 3 would reduce delay by an additional 850 daily vehicle-hours (or 11 percent) in the PM peak with a marginal reduction in the AM peak period However in conjunction with Scenario 1 Scenario 3 reduces delay in total by over 600 vehicle-hours in the AM peak These results suggest that queue control provides additional benefits beyond SWARM
The 2020 model estimates that Scenario 4 will modestly reduce delay by about 2 percent in both the AM and PM peaks or a combined total of 800 daily vehicle-hours Again the benefits are lower in percentage terms due to the increase in demand
Note that there are various types of advanced ramp metering systems deployed around the world including System-wide Adaptive Ramp Metering System or SWARM tested recently in Los Angeles I-210 freeway corridor For the I-210 model the Asservissement Lineaire drsquoEntreacutee Autoroutiere (ALINEA system) was tested as proxy for any advanced ramp metering system as its algorithm for the model was readily available It is not necessarily recommended that ALINEA be deployed but rather some type of advanced ramp metering system that would produce similar if not better results
Scenarios 5 and 6 (Auxiliary Lane Striping Ramp Improvements)
Scenarios 5 and 6 build on Scenarios 3 and 4 that include several relatively lower-cost operational improvements that could be implemented by 2015
diams Building a westbound auxiliary lane from Santa Anita to Baldwin and an eastbound auxiliary lane from Santa Anita to Huntington
diams Extending a lane to Lincoln on the westbound I-210 connector
diams Connecting and converging the Altadena on-ramps into a single on-ramp
I-210 Corridor System Management Plan Executive Summary
Page 33 of 39
diams Connecting and converging the Santa Anita on-ramps into a single on-ramp
diams Connecting and converging the Irwindale on-ramps into a single on-ramp
diams Restriping to add a lane in the eastbound direction from San Dimas to Fruit
The 2006 model shows that Scenario 5 reduces delay by 3 percent (nearly 400 vehicleshyhours) in the AM peak and 18 percent (1200 vehicle-hours) in the PM peak The segment that experienced the largest improvement in the eastbound during the PM peak was from Rosemead to Huntington This segment experienced a 45 percent improvement in delay (from 2700 vehicle-hours to 1500 vehicle-hours) which is likely attributed to the eastbound auxiliary lane from Santa Anita to Huntington In the westbound direction the auxiliary lane from Santa Anita to Baldwin shifts some traffic downstream to cause increased congestion at Michillinda (ie bottleneck shift) during the westbound AM peak However the auxiliary lane helps reduce both queue length and queue duration for the Santa Anita bottleneck
The 2020 model estimates that Scenario 6 would reduce delay by 8 percent in the AM peak and 5 percent in the PM peak for a total reduction of 2500 daily vehicle-hours A reduction in PM delay is expected to occur mostly in the westbound direction
Scenarios 7 and 8 (Ramp Closures)
Scenarios 7 and 8 build on Scenarios 5 and 6 and test the closure of several ramps
diams Eastbound Marengo on-ramp and westbound Lake on-ramp with signalization of the eastbound I-210 off-ramp at Maple and improvement to alternate routes along Corson and Maple
diams Eastbound Mount Olive ramps
Note that subsequent scenarios are not built on top of these scenarios as these are isolated to test ramp closure alternatives
The 2006 model shows that Scenario 7 would reduce delay significantly by 16 percent in the AM peak and 18 percent in the PM peak for a total delay reduction of nearly 3000 daily vehicle-hours The delay reductions are significant on the mainline during the peak direction of travel ndash 1400 vehicle-hours in the westbound AM and 912 vehicleshyhours in the eastbound PM In the westbound direction and AM peak period the segment from Altadena to Lake experienced over an 85 percent decrease in congestion (from 860 to 120 vehicle-hours of delay) This is likely attributed to the closure of the westbound Lake on-ramp In the eastbound direction and PM peak period the segment from Huntington to I-605 experienced a delay reduction of over 70 percent (from 2200
I-210 Corridor System Management Plan Executive Summary
Page 34 of 39
vehicle-hours to 600 vehicle-hours) which is likely attributed to the closure of the Mount Olive ramp
The 2020 model also shows that Scenario 8 improved delay by 12 percent in the AM and 3 percent in the PM for a total delay reduction of almost 3000 daily vehicle-hours On the mainline facility delay also improved for each peak direction of travel ndash by 1600 daily vehicle-hours in the westbound AM and by 750 vehicle-hours in the eastbound PM Delay reductions in the non-peak direction were not as significant
Scenarios 9 and 10 (On-ramp and Aux Lane Improvements)
Scenarios 9 and 10 build on Scenarios 5 and 6 and test four operational improvements that can be implemented in the short to medium range
diams Modify the RosemeadMichillinda interchange and converge the westbound I-210 on-ramps
diams Modify the northside of the Baldwin interchange and eliminate the collectorshydistributor
diams Construct an eastbound auxiliary lane from Azusa to Citrus
diams Converge the eastbound Citrus on-ramps and add an auxiliary lane to Grand
The 2006 model estimates that Scenario 9 will reduce delay by 20 percent (or 2400 daily vehicle-hours) in the AM peak and 28 percent (or 1600 daily vehicle-hours) in the PM peak compared to Scenario 5 In both AM and PM peak period the eastbound direction experienced the largest reduction in delay
The 2020 model estimates that Scenario 10 will reduce delay by 13 percent (or 2500 vehicle-hours) in the AM peak and 28 percent in the PM peak (or 4800 vehicle-hours) compared to Scenario 6 Similar to the 2006 model the 2020 model shows that these improvements produced a greater reduction in delay in the eastbound direction than the westbound direction
Scenarios 11 and 12 (Enhanced Incident Management)
Two incident scenarios were tested on top of Scenario 10 to evaluate the non-recurrent delay reductions resulting from enhanced incident management strategies An enhanced incident management system would entail upgrading or enhancing the current Caltrans incident management system that includes deployment of intelligent transportation system (ITS) field devices central controlcommunications software communications medium (ie fiber optic lines) advanced traveler information system
I-210 Corridor System Management Plan Executive Summary
Page 35 of 39
andor freeway service patrol (FSP) program to reduce incident detection verification response and clearance times
In the first scenario Scenario 11 one collision incident with one lane closure was simulated in the westbound direction in the AM peak period model and one in the eastbound direction in the PM peak period model The incident simulation location and duration were selected based on review of the 2010 actual incident data at one of the high frequency locations The following are the Scenario details
diams Westbound AM peak period starting at 800 AM close mainline lane 2 for 40 minutes at absolute post mile 2612 (at Lake Avenue)
diams Eastbound PM peak period starting at 500 PM close mainline lane 2 for 50 minutes at absolute post mile 3207 (west of Santa Anita)
In the second scenario Scenario 12 the same collision incidents were simulated with a reduction in duration by 10 minutes in the westbound direction and by 12 minutes in the eastbound direction It is estimated based on actual incident management data analysis results provided by Caltrans that an enhanced incident management system could reduce a 35-minute incident by about 10 minutes This scenario represents a typical moderate level incident at one location during the peak period direction Data suggest that incidents vary significantly in terms of impact and duration Some incidents last hundreds of minutes some close multiple lanes and some occur at multiple locations simultaneously There are also numerous minor incidents lasting only a few minutes without lane closures that can result in congestion Many other incidents also occur during off-peak hours
Without enhanced incident management Scenario 11 produced an 8 percent increase in congestion in both peak periods over Scenario 10 an increase of over 2300 hours of vehicle delay With enhanced incident management Scenario 12 evaluation resulted in delay decrease by 2 percent in the AM peak and 3 percent in the PM peak against Scenario 11 results a reduction of nearly 750 vehicle-hours for improving the incident detection verification response and clearance time of one moderate level incident for both of the peak hours
Scenario 13 (SR-134I-210 Interchange Modification)
Scenario 13 tests an improvement to modify the SR-134I-210 interchange to provide a direct connection for vehicles to continue on I-210 with three lanes in each direction This improvement was tested with the 2020 model since it is not likely to be implemented in the short-term
I-210 Corridor System Management Plan Executive Summary
Page 36 of 39
The 2020 model estimates that delay would be reduced by 11 percent (or 1800 daily vehicle-hours) in the AM and 3 percent in the PM (320 daily vehicle-hours) compared to Scenario 10 The westbound mainline experienced the greatest reduction in delay in the AM peak from 9600 vehicle-hours to 8600 vehicle hours after the interchange modification
Scenario 14 (Westbound Drop Ramp and Eastbound Widening)
Scenario 14 builds on Scenario 13 and tests Lake Avenue drop ramp to westbound Ishy210 center lanes (one HOV lane and one mainline) and eastbound I-210 widening from Myrtle to I-605 This improvement was tested with the 2020 model
The 2020 model estimates that delay would be reduced by about 20 percent in the AM or 3400 vehicle-hours and 20 percent in the PM or 2300 vehicle-hours compared to Scenario 13 The mobility improvements are significant with the westbound drop ramp that reduces weaving between SR-134 and SR-210 destined traffic and with the eastbound capacity addition to I-605 off that moves the off-ramp traffic away from the mainline and provides more room for the mainline through traffic
Post Scenario 14 Conditions
By 2020 with the inclusion of all the projects tested the model reveals some residual congestion that remains to address with future improvements According to the model results the total remaining delay on the corridor is around 21000 daily vehicle-hours
Benefit-Cost Analysis
Following an in-depth review of model results by the study team and the SCAG technical committee the study team performed a benefit-cost analysis (BCA) for each scenario
Using the California Benefit-Cost Model (Cal-BC) developed on behalf of Caltrans by the study team benefits in three key areas were estimated travel time savings vehicle operating cost savings and emission reduction savings The benefits generated from this exercise are based solely on congestion relief related benefits However these results are conservative since there are other benefits not captured by this analysis including benefits from deploying bus rapid transit which will achieve other accessibility benefits
Project costs were developed from SCAG and Caltrans project planning and programming documents These costs include construction and support costs in current dollars The study team estimated costs for projects that did not have cost
I-210 Corridor System Management Plan Executive Summary
Page 37 of 39
estimates by reviewing similar completed projects A BC greater than one means that a scenarios projects return greater benefits than it costs to construct or implement It is important to consider the total benefits that a project brings For example a large capital expansion project can cost a great deal and have a low BC ratio but brings much higher absolute benefits to the I-210 users Exhibit ES-29 shows the benefit to cost ranges classified from low (with a BC of one to two) to very high (with a BC of over 10)
The benefit-cost results for the South Corridor scenarios are shown in Exhibit ES-29
Exhibit ES-29 I-210 Scenario BenefitCost (BC) Results
Scenario Scenario Description
BenefitCost Ranges
Low Medium Medium-High High Very High
lt1 1 to 2 2 to 5 5 to 10 gt10
12 Expand Ramp Metering 34 Advanced Ramp Metering 56 Aux Lane Striping Ramp Improvs 78 Ramp Closures
910 On-Ramp amp Aux Lane Improvs 13 SR-134I-210 IC Modification
The benefit-cost findings for each scenario are as follows
diams Scenarios 1 and 2 (ramp metering expansion) shows a high benefit-cost ratio of over ten The relatively high benefit-cost ratio is due to the low cost of expanding ramp metering ($235 million)
diams Scenarios 3 and 4 (advanced ramp metering) resulted in an incremental benefitshycost ratio of over ten This is relatively high as compared to that of typical transportation management system project
diams Scenarios 5 and 6 (operational improvements) produced a benefit-cost ratio of over five This is relatively consistent with other typical operational improvement projects The benefits are substantial At estimated total cost of about $44 million these projects produced benefits of over $233 million
diams Scenarios 7 and 8 tested the ramp closures at eastbound Marengo westbound Lake and eastbound Mount Olive These ramp closured produced an extremely high incremental benefit-cost ratio of over ten due to the relatively very low cost However this benefit-cost calculation does not account for any potential increase in delay on various local arterials because of detours from the closed ramps
diams Scenarios 9 and 10 also produced a relatively high benefit-cost ratio of over ten The four operational projects in these scenarios are collectively estimated to cost
I-210 Corridor System Management Plan Executive Summary
Page 38 of 39
under $30 million and provide a substantial and optimistic benefit of over $670 million
diams Scenario 13 tested the SR-134I-210 interchange modification This project produced a benefit-cost ratio of between one and two consistent with other typical capital expansion projects This project produced benefits of over $200 million at a rough-estimate cost of about $150 million
diams Scenario 14 tested the westbound center drop ramp from Lake Avenue interchange and eastbound lane addition from Myrtle to I-605 These projects produced a relatively high benefit-cost ratio of about 6 to one as compared to other capital improvement projects These two capital projects are unique in that they have specific operational improvement element that addresses major bottleneck locations For an estimated total combined cost of about $70 million the projected benefits exceed $420 million
CONCLUSIONS AND RECOMMENDATIONS
This section summarizes the conclusions and recommendations based on the analysis discussed in the previous section It is important to note that many of these conclusions are based primarily on the micro-simulation model results The model was developed based on the best data available at the time The study team reviewed the model results and believe that both the calibrated base year forecast year and scenario results are reasonable However Caltrans should always be cautious to make decisions based on modeling alone especially complex micro-simulation models
Based on the results the study team offers the following conclusions and recommendations
diams The combination of all scenarios significantly reduces overall congestion on the corridor Projected 2020 congestion after implementation of all scenarios is below 2006 levels in both the AM and PM peak period In the AM peak period the model projects total delay in 2020 after delivering all projects to be less than 11700 vehicle-hours compared to the 2006 base year delay of 13000 vehicleshyhours This represents a reduction of over 10 percent In the PM peak period the model projects total delay in 2020 after delivering all projects to be around 9500 hours compared to the 2006 base year delay of almost 9300 vehicle-hours This represents a slight reduction of 2 percent Clearly the scenarios deliver significant mobility benefits to the corridor Despite the growth in demand future 2020 congestion will be less than experienced in 2006
diams The completed ramp metering expansion project is expected to produce substantial mobility benefits of over $400 million Delay has been significantly reduced since 2006
I-210 Corridor System Management Plan Executive Summary
Page 39 of 39
diams Advanced ramp metering could provide additional mobility improvements by significantly reducing congestion and returning over $100 million in benefits
diams Ramp closures at Marengo Lake and Mount Olive as alternatives seem promising by reducing delay up to 3000 vehicle-hours per day and providing substantial benefits of $280 million at an extremely low cost
diams Operational improvements such as auxiliary lanes and ramp improvements could leverage on the ramp metering projects by making the corridor more efficient and productive that could result in additional mobility benefits of over $230 million
diams Additional capital improvements with specific operational elements to address weaving at major bottleneck locations could produce significant mobility benefits of over $420 million
diams Enhanced incident management system associated with Scenarios 11 and 12 to address non-recurrent congestion proved effective with a delay reduction of over 300 vehicle-hours for one modest level incident with a typical duration of 35 minutes reduced to 25 minutes With the I-210 corridor experiencing up to 2400 collisions per year this translates to a total annual delay savings of over 700000 vehicle-hours for the study corridor
diams The benefit-cost ratio of all scenarios combined is about 64 to 1 If all projects were delivered at current cost estimates the public would get over six dollars of benefits for each dollar expended In current dollars costs total to over $17 billion whereas the benefits are estimated to be over $20 billion
diams The projects also alleviate greenhouse gas (GHG) emissions by over 15 million tons over 20 years averaging over a 75000-ton reduction per year The emissions are estimated using data from the California Air Resources Board (CARB) EMFAC model
This is the first generation CSMP for the I-210 corridor It is important to stress that CSMPs should be updated on a regular basis This is particularly important since traffic conditions and patterns can differ from current projections After projects are delivered it is also useful to compare actual results with estimated ones in this document so that models can be further improved as appropriate
CSMPs or a variation thereof should become the normal course of business that is based on detailed performance assessments an in-depth understanding of the reasons for performance deterioration and an analytical framework that allows for evaluating complementary operational strategies that maximize the productivity of the current system
I-210 Corridor System Management Plan Executive Summary
Page 19 of 39
Exhibit ES-16 Lost Productivity Illustrated
70 2000
65
60 1750
50
55 1500
SP
EE
D
45 1250
40
35 1000
30 Speed lt35mph
750 25
20 500 I-210 EB
15 Los Angeles County Huntington
10 PM=3338 250
May 6 2010 5 VDS ID 761141
0 -
FL
OW
RA
TE
(VP
HP
L)
140
0
143
0
150
0
153
0
160
0
163
0
170
0
173
0
180
0
183
0
190
0
193
0
TIME The estimated average non-holiday weekday lost lane-miles by period and year on Ishy210 are shown Exhibits ES-17 (mainline) and ES-18 (HOV) A few notes on these two exhibits
diams The trends in the productivity losses are comparable to the delay trends The largest productivity losses occurred in the eastbound direction during the PM peak hours which is the direction and time period that experienced the most congestion
diams On the mainline facility the westbound direction experienced nearly as high productivity loses during the AM peak period
diams On the HOV lanes a greater productivity loss in the eastbound peak period is more evident
Operational strategies are critical to recovering such productivity losses These strategies include building new or extending auxiliary lanes developing more aggressive ramp metering strategies without negatively influencing the arterial network and improving incident clearance times
I-210 Corridor System Management Plan Executive Summary
Page 20 of 39
Exhibit ES-17 Mainline Daily Equivalent Lost Lane-Miles by Direction and Period (2005-09)
-
10
20
30
40
50
60
70
80
90
100
110
120
130
140
150
160
2005 2006 2007 2008 2009 2005 2006 2007 2008 2009 2005 2006 2007 2008 2009 2005 2006 2007 2008 2009
Eastbound
Westbound
AM PM Midday Night Time Period and Year
Daily
Eq
uiv
ale
nt
Lost
Lan
e-M
iles
Exhibit ES-18 HOV Daily Equivalent Lost Lane-Miles by Direction and Period (2005-09)
-
10
20
30
40
2005 2006 2007 2008 2009 2005 2006 2007 2008 2009 2005 2006 2007 2008 2009 2005 2006 2007 2008 2009
Eastbound
Westbound
AM Midday PM Night
Daily
Eq
uiv
ale
nt
Lost
Lan
e-M
iles
Time Period and Year
I-210 Corridor System Management Plan Executive Summary
Page 21 of 39
BOTTLENECK IDENTIFICATION AND CAUSALITY ANALYSIS
Exhibits ES-19 and ES-20 summarize the eastbound and westbound bottleneck locations the time period that each bottleneck is generally active and the causes of the each bottleneck Exhibits ES-21 and ES-22 are maps of the corridor showing these bottleneck locations for the AM and PM peak periods respectively
Major bottlenecks are the primary cause of congestion and lost productivity By definition a bottleneck is a condition where traffic demand exceeds the effective carrying capacity of the roadway In most cases the cause of a bottleneck is related to a sudden reduction in capacity such as a lane drop merging and weaving driver distractions a surge in demand or a combination of factors
The specific location and causality of each major I-210 bottleneck was verified by multiple field observations on separate weekdays throughout the summer fall and winter of 2009 Some bottleneck locations were videotaped to validate bottlenecks and to assist in micro-simulation model calibration
The detailed final report explains in detail the process and results of the bottleneck identification and causality analysis
I-210 Corridor System Management Plan Executive Summary
Page 22 of 39
Exhibit ES-19 I-210 Eastbound Bottleneck Locations
Abs CA Bottleneck
Location
Active
Period Causality Summary
AM PM
250 R250 Fair Oaks Heavy ramp merge
265 R265 Lake On-ramp Heavy ramp merge
286 R287 San Gabriel On-ramp Heavy ramp merge roadway curves
294 R294 Rosemead On-ramp Heavy consecutive ramp merge
330 R327 Huntington Interchange Heavy ramp merge roadway curves
366 R363 I-605 On-ramp traffic weaving with the off-ramp
400 R397 Azusa On-ramp Heavy ramp merge
408 R406 Citrus On-ramp Heavy ramp merge
450 R450 SR-57 On-ramp Heavy ramp merge and lane drop
Exhibit ES-20 I-210 Westbound Bottleneck Locations
Abs CA
Bottleneck
Location
Active
Period Causality Summary
AM PM
401 R398 Azusa On-ramp Consecutive ramp merge curves
368 R365 I-605 Off-ramp Consecutive ramp merge weaving
322 R319 Santa Anita On-ramp Heavy ramp merge roadway curves
307 R304 Baldwin On-ramp Heavy consecutive ramp merge
297 L297 Rosemead On-ramp Three consecutive ramp merges weaving
280 R281 Altadena On-ramp Heavy ramp merge
261 R261 Lake On-ramp Heavy ramp merge
Bottleneck Locations
reg --Bottleneck
Westbound
Eastbound
0 1 2
I bull I I I bull I I I Miles
HJOUAIIO fl _
I-210 Corridor System Management Plan Executive Summary
Page 23 of 39
Exhibit ES-21 I-210 Map of AM Bottleneck Locations
Bottleneck Locations
reg Bottleneck - Westbound - Eastbound
N 0 1 2
bull I I II II II I ll) Mles s
HJOUAIIO fl _
I-210 Corridor System Management Plan Executive Summary
Page 24 of 39
Exhibit ES-22 I-210 Map of PM Bottleneck Locations
I-210 Corridor System Management Plan Executive Summary
Page 25 of 39
SCENARIO DEVELOPMENT AND ANALYSIS
Fully understanding how a corridor performs and why it performs the way it does sets the foundation for evaluating potential solutions Several steps were required to develop and evaluate improvements including
diams Developing traffic models for 2006 base year and 2020 long-term demand diams Combining projects in a logical manner for modeling and testing diams Evaluating model outputs and summarizing results diams Conducting a benefit-cost assessment of scenarios
Traffic Model Development
The study team developed a traffic model using the VISSIM micro-simulation software It is important to note that micro-simulation models are complex to develop and calibrate for a large urban corridor However it is one of the only tools capable of providing a reasonable approximation of bottleneck formation and queue development Therefore such tools help quantify the impacts of operational strategies which traditional travel demand models cannot
The model was calibrated against 2006 conditions This was a resource intensive effort requiring several iterations of submittals and review cycles until the model reasonably matched bottleneck locations and relative severity Once calibration was approved a 2020 model was also developed based on SCAGrsquos travel demand model demand projections
These two models were used to evaluate different scenarios (combinations of projects) to quantify the associated congestion relief benefits and to compare total project costs against their benefits
Exhibit ES-23 depicts the network included in the model There were no parallel arterials modeled with the exception of arterials at interchanges All freeway interchanges were included as well as on-ramps and off-ramps
I-210 Corridor System Management Plan Executive Summary
Page 26 of 39
Exhibit ES-23 Micro-Simulation Model Network
I-210 Corridor System Management Plan Executive Summary
Page 27 of 39
Scenario Development Framework
The study team developed a framework for combining projects into scenarios It would be desirable to evaluate every possible combination of projects However this would have entailed thousands of model runs Instead the team combined projects based on a number of factors including
diams Projects that were fully constructed and completed from 2006 to 2010 were tested with both the 2006 and 2020 models
diams Short- and mid- term operational projects were grouped into scenarios and tested with the both the 2006 and 2020 models
diams Longer-range projects to be delivered by 2020 and beyond were used to develop scenarios to be tested with the 2020 model only
diams Alternative ramp closures were grouped into isolated scenarios (future scenarios did not build on top of these) and tested with both the 2006 and 2020 models
The study assumes that projects delivered before 2016 could reasonably be evaluated using the 2006 base year model The 2020 forecast year for the I-210 study was consistent with the SCAG 2020 regional travel demand model origin-destination matrices used to develop the 2008 Regional Transportation Plan (RTP) When SCAG updates its travel demand model and Regional Transportation Plan (RTP) it may wish to update the micro-simulation model with revised demand projections
Project lists used to develop scenarios were part from the Regional Transportation Improvement Program (RTIP) the RTP and other sources such as special studies Projects that do not directly affect mobility were eliminated For instance sound wall landscaping or minor arterial improvement projects were not evaluated since microshysimulation models cannot evaluate them
Scenario testing performed for the performed for the I-210 CSMP differed from traditional ldquoalternatives evaluationsrdquo done for Major Investment Studies (MIS) or Environmental Impact Reports (EIRs) An MIS or EIR focuses on identifying alternative solutions to address current or projected corridor problems so each alternative is evaluated separately and results among competing alternatives are compared resulting in a locally preferred alternative In contrast for the I-210 CSMP scenarios build on each other in that a scenario contains the projects from the previous scenario plus one or more projects as long as the incremental scenario results showed an acceptable level of performance improvement This incremental scenario evaluation approach is important since CSMPs are new and are often compared with alternatives studies
Exhibit ES-24 summarizes the approach used and scenarios tested and provides a
I-210 Corridor System Management Plan Executive Summary
Page 28 of 39
general description of the projects included in the 2006 and 2020 micro-simulation runs Most projects were tested for both the short- and long-term timeframes Each scenario tested was built upon prior scenarios except for Scenarios 7 and 8 which were ldquostand alonerdquo scenarios used to test alternative ramp closures Later scenarios build on Scenarios 5 and 6 and do not include the improvements tested in Scenarios 7 and 8 Enhanced incident management was tested in Scenarios 11 and 12 by comparing a simulated incident without and with enhanced incident management system Scenarios 13 and 14 are expected for the longer term and were tested only with the 2020 model
Exhibit ES-24 Micro-Simulation Modeling Approach
Short-Term Scenarios Long-Term Scenarios
Calibrated 2006 Base Case
Scenario 1 Expand Ramp-
Metering
Scenario 3 Scenario 1 +
Adv Ramp-Meter w
Queue Control
Scenario 5 Scenario 3 + aux lane striping and
ramp improvements
2020 Horizon Year
2006 Network 2020 OD Matrices
Scenario 7 Scenario 5 +
Ramp Closures
Scenario 2 Expand Ramp-
Metering
Scenario 4 Scenario 2 +
Adv Ramp-Meter w
Queue Control
Scenario 6 Scenario 4 + aux lane striping and
ramp improvements
Scenario 8 Scenario 6 +
Ramp Closures
Scenario 14 Scenario 13 + Lake
Ave Drop Ramp
Lane Addition
Scenario 9 Scenario 5+
On-Ramp amp Aux
lane improvements
Scenario 10 Scenario 6 +
On-Ramp amp Aux
lane improvements
Scenario 11 Incident with No
Incident
Management
Scenario 12 Incident With
Incident
Management
Scenario 13 Scenario 10 +
134210 IC
modification
Incident Management Scenarios
I-210 Corridor System Management Plan Executive Summary
Page 29 of 39
Scenario Evaluation Results
Exhibits ES-25 and ES-26 show the delay results for all the 2006 scenarios evaluated for the AM and PM peak periods respectively Exhibits ES-27 and ES-28 show the delay results for all the 2020 scenarios evaluated for the AM and PM peak periods respectively For each scenario the modeling team produced results by facility type (ie mainline HOV arterials and ramps) and vehicle type (SOV HOV trucks) as well as speed contour diagrams (discussed in more detail in the full technical CSMP) The study team scrutinized to ensure that they were consistent with general traffic engineering principles The following summarizes the findings related to the four exhibits
Exhibit ES-25 2006 AM Peak Micro-Simulation Delay Results by Scenario
De
lay
(Pe
ak
Pe
rio
d V
eh
icle
-Ho
urs
)
2006 Base Year S1 S3 S5 S7 S9 Scenario
18000
16000
14000
12000
10000
8000
6000
4000
2000
-
S1 Expand Ramp Metering
S3 Adv Ramp Metering
S5 Aux Lane Striping Ramp Improvs
S7 Ramp Closures
S9 On-Ramp amp Aux Lane Improvs
-2 -3 -3
-16 -20
HOV WB I-210 WB
HOV EB I-210 EB
Ramps Arterials
I-210 Corridor System Management Plan Executive Summary
Page 30 of 39
Exhibit ES-26 2006 PM Peak Micro-Simulation Delay Results by Scenario
18000
De
lay
(Pe
ak
Pe
rio
d V
eh
icle
-Ho
urs
)
16000
14000
12000
10000
8000
6000
4000
2000
-
S1 Expand Ramp Metering
S3 Adv Ramp Metering
HOV WB
I-210 WB
S5 Aux Lane Striping Ramp Improvs
S7 Ramp Closures
S9 On-Ramp amp Aux Lane Improvs
HOV EB
I-210 EB
Ramps
Arterials
-17
-11
-18
-18 -28
2006 Base Year S1 S3 S5 S7 S9 Scenario
Exhibit ES-27 2020 AM Peak Micro-Simulation Delay Results by Scenario
30000
De
lay
(Pe
ak
Pe
rio
d V
eh
icle
-Ho
urs
)
25000
20000
15000
10000
5000
S2 Expand Ramp Metering
S4 Adv Ramp Metering
S6 Aux Lane Striping Ramp Improvs
S8 Ramp Closures
HOV WB
I-210 WB
HOV EB
-8
-2 -8
-13 -12
S10 On-Ramp amp Aux Lane Improvs
S13 SR-134I-210 IC Modification
S14 Lake Ave Drop Ramp Lane Addition
I-210 EB
Ramps
Arterials
-11
-23
-
2020 S2 S4 S6 S8 S10 S13 S14 Horizon Scenario
I-210 Corridor System Management Plan Executive Summary
Page 31 of 39
Exhibit ES-28 2020 PM Peak Micro-Simulation Delay Results by Scenario D
ela
y(P
ea
k P
eri
od
Ve
hic
le-H
ou
rs)
30000
25000
20000
15000
10000
5000
-
S2 Expand Ramp Metering
S4 Adv Ramp Metering
S6 Aux Lane Striping Ramp Improvs
S8 Ramp Closures
HOV WB
I-210 WB
HOV EB
-14
S10 On-Ramp amp Aux Lane Improvs
S13 SR-134I-210 IC Modification
S14 Lake Ave Drop Ramp Lane Addition
I-210 EB
Ramps
Arterials
-2 -5 -3 -28
-3 -19
2020 S2 S4 S6 S8 S10 S13 S14 Horizon Scenario
Base Year and Do Minimum Horizon Year
Absent any physical improvements the modeling team estimates that by 2020 total delay (mainline HOV ramps and arterials) would double compared to 2006 (from a total of around 22000 vehicle-hours daily to just fewer than 45000 vehicle-hours) in the combined AM and PM peak
Scenarios 1 and 2 (Expand Ramp Metering)
Scenarios 1 and 2 test the only project on the corridor that was fully constructed and completed The project installed new connector metering at the SR-57 and I-605 to Ishy210 freeway connector ramps The project also widened various ramps removed various HOV meter bypasses and upgraded the ramp metering system
The 2006 model estimates that Scenario 1 would reduce delay on the corridor by around 17 percent (or 1600 daily vehicle-hours) in the PM peak period but only around two percent (or 200 vehicle-hours) in the AM peak period The biggest benefits occur in the PM eastbound direction from Rosemead On-Ramp to Huntington interchange (with a delay reduction of over 1000 vehicle-hours) as well as from I-605 to the Azusa On-Ramp (delay reduction of 500 vehicle-hours) for single occupant vehicles The
I-210 Corridor System Management Plan Executive Summary
Page 32 of 39
westbound reductions in freeway delay are largely offset by increased on-ramp delay mostly from new connector metering at SR-57 and I-605
The 2020 model estimates that Scenario 2 will reduce delay by around 8 percent in the AM peak and 14 percent in the PM peak for a combined total reduction of 5000 daily vehicle-hours The long-term improvements are less than the short-term improvements due to the increase in demand
Scenarios 3 and 4 (Advanced Ramp Metering)
Scenarios 3 and 4 build on Scenarios 1 and 2 by adding advanced ramp metering system such as dynamic or adaptive ramp metering system
The 2006 model shows that Scenario 3 would reduce delay by an additional 850 daily vehicle-hours (or 11 percent) in the PM peak with a marginal reduction in the AM peak period However in conjunction with Scenario 1 Scenario 3 reduces delay in total by over 600 vehicle-hours in the AM peak These results suggest that queue control provides additional benefits beyond SWARM
The 2020 model estimates that Scenario 4 will modestly reduce delay by about 2 percent in both the AM and PM peaks or a combined total of 800 daily vehicle-hours Again the benefits are lower in percentage terms due to the increase in demand
Note that there are various types of advanced ramp metering systems deployed around the world including System-wide Adaptive Ramp Metering System or SWARM tested recently in Los Angeles I-210 freeway corridor For the I-210 model the Asservissement Lineaire drsquoEntreacutee Autoroutiere (ALINEA system) was tested as proxy for any advanced ramp metering system as its algorithm for the model was readily available It is not necessarily recommended that ALINEA be deployed but rather some type of advanced ramp metering system that would produce similar if not better results
Scenarios 5 and 6 (Auxiliary Lane Striping Ramp Improvements)
Scenarios 5 and 6 build on Scenarios 3 and 4 that include several relatively lower-cost operational improvements that could be implemented by 2015
diams Building a westbound auxiliary lane from Santa Anita to Baldwin and an eastbound auxiliary lane from Santa Anita to Huntington
diams Extending a lane to Lincoln on the westbound I-210 connector
diams Connecting and converging the Altadena on-ramps into a single on-ramp
I-210 Corridor System Management Plan Executive Summary
Page 33 of 39
diams Connecting and converging the Santa Anita on-ramps into a single on-ramp
diams Connecting and converging the Irwindale on-ramps into a single on-ramp
diams Restriping to add a lane in the eastbound direction from San Dimas to Fruit
The 2006 model shows that Scenario 5 reduces delay by 3 percent (nearly 400 vehicleshyhours) in the AM peak and 18 percent (1200 vehicle-hours) in the PM peak The segment that experienced the largest improvement in the eastbound during the PM peak was from Rosemead to Huntington This segment experienced a 45 percent improvement in delay (from 2700 vehicle-hours to 1500 vehicle-hours) which is likely attributed to the eastbound auxiliary lane from Santa Anita to Huntington In the westbound direction the auxiliary lane from Santa Anita to Baldwin shifts some traffic downstream to cause increased congestion at Michillinda (ie bottleneck shift) during the westbound AM peak However the auxiliary lane helps reduce both queue length and queue duration for the Santa Anita bottleneck
The 2020 model estimates that Scenario 6 would reduce delay by 8 percent in the AM peak and 5 percent in the PM peak for a total reduction of 2500 daily vehicle-hours A reduction in PM delay is expected to occur mostly in the westbound direction
Scenarios 7 and 8 (Ramp Closures)
Scenarios 7 and 8 build on Scenarios 5 and 6 and test the closure of several ramps
diams Eastbound Marengo on-ramp and westbound Lake on-ramp with signalization of the eastbound I-210 off-ramp at Maple and improvement to alternate routes along Corson and Maple
diams Eastbound Mount Olive ramps
Note that subsequent scenarios are not built on top of these scenarios as these are isolated to test ramp closure alternatives
The 2006 model shows that Scenario 7 would reduce delay significantly by 16 percent in the AM peak and 18 percent in the PM peak for a total delay reduction of nearly 3000 daily vehicle-hours The delay reductions are significant on the mainline during the peak direction of travel ndash 1400 vehicle-hours in the westbound AM and 912 vehicleshyhours in the eastbound PM In the westbound direction and AM peak period the segment from Altadena to Lake experienced over an 85 percent decrease in congestion (from 860 to 120 vehicle-hours of delay) This is likely attributed to the closure of the westbound Lake on-ramp In the eastbound direction and PM peak period the segment from Huntington to I-605 experienced a delay reduction of over 70 percent (from 2200
I-210 Corridor System Management Plan Executive Summary
Page 34 of 39
vehicle-hours to 600 vehicle-hours) which is likely attributed to the closure of the Mount Olive ramp
The 2020 model also shows that Scenario 8 improved delay by 12 percent in the AM and 3 percent in the PM for a total delay reduction of almost 3000 daily vehicle-hours On the mainline facility delay also improved for each peak direction of travel ndash by 1600 daily vehicle-hours in the westbound AM and by 750 vehicle-hours in the eastbound PM Delay reductions in the non-peak direction were not as significant
Scenarios 9 and 10 (On-ramp and Aux Lane Improvements)
Scenarios 9 and 10 build on Scenarios 5 and 6 and test four operational improvements that can be implemented in the short to medium range
diams Modify the RosemeadMichillinda interchange and converge the westbound I-210 on-ramps
diams Modify the northside of the Baldwin interchange and eliminate the collectorshydistributor
diams Construct an eastbound auxiliary lane from Azusa to Citrus
diams Converge the eastbound Citrus on-ramps and add an auxiliary lane to Grand
The 2006 model estimates that Scenario 9 will reduce delay by 20 percent (or 2400 daily vehicle-hours) in the AM peak and 28 percent (or 1600 daily vehicle-hours) in the PM peak compared to Scenario 5 In both AM and PM peak period the eastbound direction experienced the largest reduction in delay
The 2020 model estimates that Scenario 10 will reduce delay by 13 percent (or 2500 vehicle-hours) in the AM peak and 28 percent in the PM peak (or 4800 vehicle-hours) compared to Scenario 6 Similar to the 2006 model the 2020 model shows that these improvements produced a greater reduction in delay in the eastbound direction than the westbound direction
Scenarios 11 and 12 (Enhanced Incident Management)
Two incident scenarios were tested on top of Scenario 10 to evaluate the non-recurrent delay reductions resulting from enhanced incident management strategies An enhanced incident management system would entail upgrading or enhancing the current Caltrans incident management system that includes deployment of intelligent transportation system (ITS) field devices central controlcommunications software communications medium (ie fiber optic lines) advanced traveler information system
I-210 Corridor System Management Plan Executive Summary
Page 35 of 39
andor freeway service patrol (FSP) program to reduce incident detection verification response and clearance times
In the first scenario Scenario 11 one collision incident with one lane closure was simulated in the westbound direction in the AM peak period model and one in the eastbound direction in the PM peak period model The incident simulation location and duration were selected based on review of the 2010 actual incident data at one of the high frequency locations The following are the Scenario details
diams Westbound AM peak period starting at 800 AM close mainline lane 2 for 40 minutes at absolute post mile 2612 (at Lake Avenue)
diams Eastbound PM peak period starting at 500 PM close mainline lane 2 for 50 minutes at absolute post mile 3207 (west of Santa Anita)
In the second scenario Scenario 12 the same collision incidents were simulated with a reduction in duration by 10 minutes in the westbound direction and by 12 minutes in the eastbound direction It is estimated based on actual incident management data analysis results provided by Caltrans that an enhanced incident management system could reduce a 35-minute incident by about 10 minutes This scenario represents a typical moderate level incident at one location during the peak period direction Data suggest that incidents vary significantly in terms of impact and duration Some incidents last hundreds of minutes some close multiple lanes and some occur at multiple locations simultaneously There are also numerous minor incidents lasting only a few minutes without lane closures that can result in congestion Many other incidents also occur during off-peak hours
Without enhanced incident management Scenario 11 produced an 8 percent increase in congestion in both peak periods over Scenario 10 an increase of over 2300 hours of vehicle delay With enhanced incident management Scenario 12 evaluation resulted in delay decrease by 2 percent in the AM peak and 3 percent in the PM peak against Scenario 11 results a reduction of nearly 750 vehicle-hours for improving the incident detection verification response and clearance time of one moderate level incident for both of the peak hours
Scenario 13 (SR-134I-210 Interchange Modification)
Scenario 13 tests an improvement to modify the SR-134I-210 interchange to provide a direct connection for vehicles to continue on I-210 with three lanes in each direction This improvement was tested with the 2020 model since it is not likely to be implemented in the short-term
I-210 Corridor System Management Plan Executive Summary
Page 36 of 39
The 2020 model estimates that delay would be reduced by 11 percent (or 1800 daily vehicle-hours) in the AM and 3 percent in the PM (320 daily vehicle-hours) compared to Scenario 10 The westbound mainline experienced the greatest reduction in delay in the AM peak from 9600 vehicle-hours to 8600 vehicle hours after the interchange modification
Scenario 14 (Westbound Drop Ramp and Eastbound Widening)
Scenario 14 builds on Scenario 13 and tests Lake Avenue drop ramp to westbound Ishy210 center lanes (one HOV lane and one mainline) and eastbound I-210 widening from Myrtle to I-605 This improvement was tested with the 2020 model
The 2020 model estimates that delay would be reduced by about 20 percent in the AM or 3400 vehicle-hours and 20 percent in the PM or 2300 vehicle-hours compared to Scenario 13 The mobility improvements are significant with the westbound drop ramp that reduces weaving between SR-134 and SR-210 destined traffic and with the eastbound capacity addition to I-605 off that moves the off-ramp traffic away from the mainline and provides more room for the mainline through traffic
Post Scenario 14 Conditions
By 2020 with the inclusion of all the projects tested the model reveals some residual congestion that remains to address with future improvements According to the model results the total remaining delay on the corridor is around 21000 daily vehicle-hours
Benefit-Cost Analysis
Following an in-depth review of model results by the study team and the SCAG technical committee the study team performed a benefit-cost analysis (BCA) for each scenario
Using the California Benefit-Cost Model (Cal-BC) developed on behalf of Caltrans by the study team benefits in three key areas were estimated travel time savings vehicle operating cost savings and emission reduction savings The benefits generated from this exercise are based solely on congestion relief related benefits However these results are conservative since there are other benefits not captured by this analysis including benefits from deploying bus rapid transit which will achieve other accessibility benefits
Project costs were developed from SCAG and Caltrans project planning and programming documents These costs include construction and support costs in current dollars The study team estimated costs for projects that did not have cost
I-210 Corridor System Management Plan Executive Summary
Page 37 of 39
estimates by reviewing similar completed projects A BC greater than one means that a scenarios projects return greater benefits than it costs to construct or implement It is important to consider the total benefits that a project brings For example a large capital expansion project can cost a great deal and have a low BC ratio but brings much higher absolute benefits to the I-210 users Exhibit ES-29 shows the benefit to cost ranges classified from low (with a BC of one to two) to very high (with a BC of over 10)
The benefit-cost results for the South Corridor scenarios are shown in Exhibit ES-29
Exhibit ES-29 I-210 Scenario BenefitCost (BC) Results
Scenario Scenario Description
BenefitCost Ranges
Low Medium Medium-High High Very High
lt1 1 to 2 2 to 5 5 to 10 gt10
12 Expand Ramp Metering 34 Advanced Ramp Metering 56 Aux Lane Striping Ramp Improvs 78 Ramp Closures
910 On-Ramp amp Aux Lane Improvs 13 SR-134I-210 IC Modification
The benefit-cost findings for each scenario are as follows
diams Scenarios 1 and 2 (ramp metering expansion) shows a high benefit-cost ratio of over ten The relatively high benefit-cost ratio is due to the low cost of expanding ramp metering ($235 million)
diams Scenarios 3 and 4 (advanced ramp metering) resulted in an incremental benefitshycost ratio of over ten This is relatively high as compared to that of typical transportation management system project
diams Scenarios 5 and 6 (operational improvements) produced a benefit-cost ratio of over five This is relatively consistent with other typical operational improvement projects The benefits are substantial At estimated total cost of about $44 million these projects produced benefits of over $233 million
diams Scenarios 7 and 8 tested the ramp closures at eastbound Marengo westbound Lake and eastbound Mount Olive These ramp closured produced an extremely high incremental benefit-cost ratio of over ten due to the relatively very low cost However this benefit-cost calculation does not account for any potential increase in delay on various local arterials because of detours from the closed ramps
diams Scenarios 9 and 10 also produced a relatively high benefit-cost ratio of over ten The four operational projects in these scenarios are collectively estimated to cost
I-210 Corridor System Management Plan Executive Summary
Page 38 of 39
under $30 million and provide a substantial and optimistic benefit of over $670 million
diams Scenario 13 tested the SR-134I-210 interchange modification This project produced a benefit-cost ratio of between one and two consistent with other typical capital expansion projects This project produced benefits of over $200 million at a rough-estimate cost of about $150 million
diams Scenario 14 tested the westbound center drop ramp from Lake Avenue interchange and eastbound lane addition from Myrtle to I-605 These projects produced a relatively high benefit-cost ratio of about 6 to one as compared to other capital improvement projects These two capital projects are unique in that they have specific operational improvement element that addresses major bottleneck locations For an estimated total combined cost of about $70 million the projected benefits exceed $420 million
CONCLUSIONS AND RECOMMENDATIONS
This section summarizes the conclusions and recommendations based on the analysis discussed in the previous section It is important to note that many of these conclusions are based primarily on the micro-simulation model results The model was developed based on the best data available at the time The study team reviewed the model results and believe that both the calibrated base year forecast year and scenario results are reasonable However Caltrans should always be cautious to make decisions based on modeling alone especially complex micro-simulation models
Based on the results the study team offers the following conclusions and recommendations
diams The combination of all scenarios significantly reduces overall congestion on the corridor Projected 2020 congestion after implementation of all scenarios is below 2006 levels in both the AM and PM peak period In the AM peak period the model projects total delay in 2020 after delivering all projects to be less than 11700 vehicle-hours compared to the 2006 base year delay of 13000 vehicleshyhours This represents a reduction of over 10 percent In the PM peak period the model projects total delay in 2020 after delivering all projects to be around 9500 hours compared to the 2006 base year delay of almost 9300 vehicle-hours This represents a slight reduction of 2 percent Clearly the scenarios deliver significant mobility benefits to the corridor Despite the growth in demand future 2020 congestion will be less than experienced in 2006
diams The completed ramp metering expansion project is expected to produce substantial mobility benefits of over $400 million Delay has been significantly reduced since 2006
I-210 Corridor System Management Plan Executive Summary
Page 39 of 39
diams Advanced ramp metering could provide additional mobility improvements by significantly reducing congestion and returning over $100 million in benefits
diams Ramp closures at Marengo Lake and Mount Olive as alternatives seem promising by reducing delay up to 3000 vehicle-hours per day and providing substantial benefits of $280 million at an extremely low cost
diams Operational improvements such as auxiliary lanes and ramp improvements could leverage on the ramp metering projects by making the corridor more efficient and productive that could result in additional mobility benefits of over $230 million
diams Additional capital improvements with specific operational elements to address weaving at major bottleneck locations could produce significant mobility benefits of over $420 million
diams Enhanced incident management system associated with Scenarios 11 and 12 to address non-recurrent congestion proved effective with a delay reduction of over 300 vehicle-hours for one modest level incident with a typical duration of 35 minutes reduced to 25 minutes With the I-210 corridor experiencing up to 2400 collisions per year this translates to a total annual delay savings of over 700000 vehicle-hours for the study corridor
diams The benefit-cost ratio of all scenarios combined is about 64 to 1 If all projects were delivered at current cost estimates the public would get over six dollars of benefits for each dollar expended In current dollars costs total to over $17 billion whereas the benefits are estimated to be over $20 billion
diams The projects also alleviate greenhouse gas (GHG) emissions by over 15 million tons over 20 years averaging over a 75000-ton reduction per year The emissions are estimated using data from the California Air Resources Board (CARB) EMFAC model
This is the first generation CSMP for the I-210 corridor It is important to stress that CSMPs should be updated on a regular basis This is particularly important since traffic conditions and patterns can differ from current projections After projects are delivered it is also useful to compare actual results with estimated ones in this document so that models can be further improved as appropriate
CSMPs or a variation thereof should become the normal course of business that is based on detailed performance assessments an in-depth understanding of the reasons for performance deterioration and an analytical framework that allows for evaluating complementary operational strategies that maximize the productivity of the current system
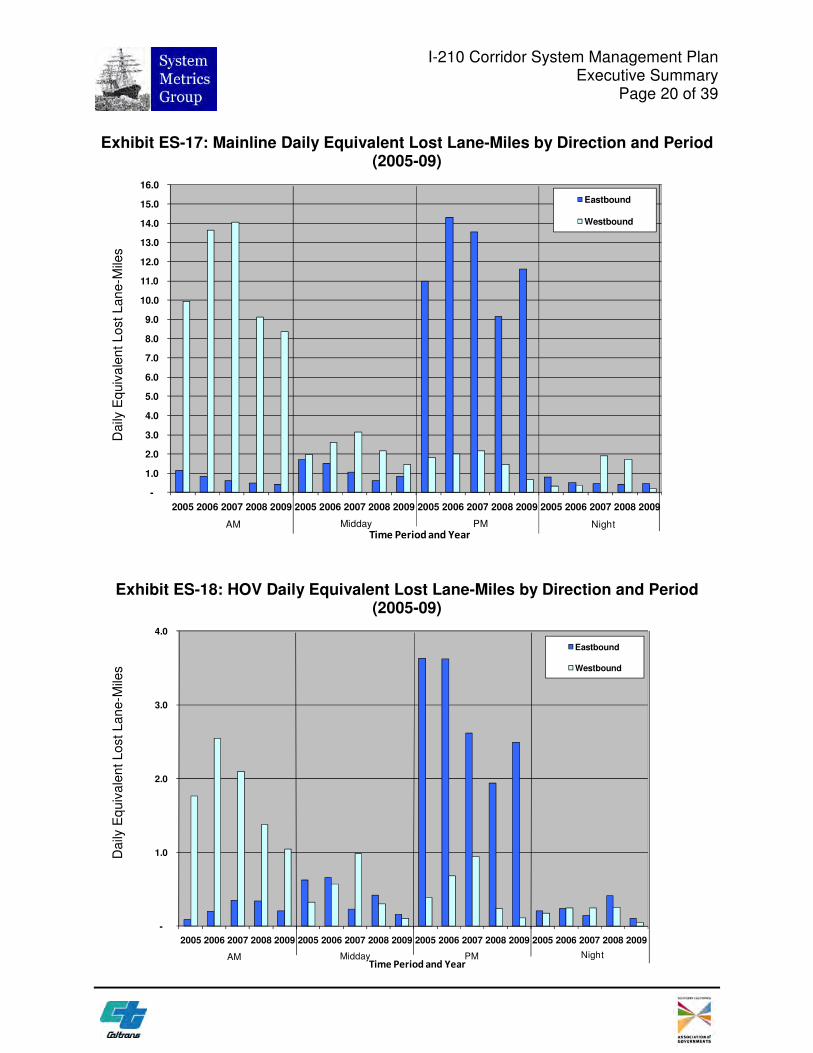
I-210 Corridor System Management Plan Executive Summary
Page 22 of 39
Exhibit ES-19 I-210 Eastbound Bottleneck Locations
Abs CA Bottleneck
Location
Active
Period Causality Summary
AM PM
250 R250 Fair Oaks Heavy ramp merge
265 R265 Lake On-ramp Heavy ramp merge
286 R287 San Gabriel On-ramp Heavy ramp merge roadway curves
294 R294 Rosemead On-ramp Heavy consecutive ramp merge
330 R327 Huntington Interchange Heavy ramp merge roadway curves
366 R363 I-605 On-ramp traffic weaving with the off-ramp
400 R397 Azusa On-ramp Heavy ramp merge
408 R406 Citrus On-ramp Heavy ramp merge
450 R450 SR-57 On-ramp Heavy ramp merge and lane drop
Exhibit ES-20 I-210 Westbound Bottleneck Locations
Abs CA
Bottleneck
Location
Active
Period Causality Summary
AM PM
401 R398 Azusa On-ramp Consecutive ramp merge curves
368 R365 I-605 Off-ramp Consecutive ramp merge weaving
322 R319 Santa Anita On-ramp Heavy ramp merge roadway curves
307 R304 Baldwin On-ramp Heavy consecutive ramp merge
297 L297 Rosemead On-ramp Three consecutive ramp merges weaving
280 R281 Altadena On-ramp Heavy ramp merge
261 R261 Lake On-ramp Heavy ramp merge
Bottleneck Locations
reg --Bottleneck
Westbound
Eastbound
0 1 2
I bull I I I bull I I I Miles
HJOUAIIO fl _
I-210 Corridor System Management Plan Executive Summary
Page 23 of 39
Exhibit ES-21 I-210 Map of AM Bottleneck Locations
Bottleneck Locations
reg Bottleneck - Westbound - Eastbound
N 0 1 2
bull I I II II II I ll) Mles s
HJOUAIIO fl _
I-210 Corridor System Management Plan Executive Summary
Page 24 of 39
Exhibit ES-22 I-210 Map of PM Bottleneck Locations
I-210 Corridor System Management Plan Executive Summary
Page 25 of 39
SCENARIO DEVELOPMENT AND ANALYSIS
Fully understanding how a corridor performs and why it performs the way it does sets the foundation for evaluating potential solutions Several steps were required to develop and evaluate improvements including
diams Developing traffic models for 2006 base year and 2020 long-term demand diams Combining projects in a logical manner for modeling and testing diams Evaluating model outputs and summarizing results diams Conducting a benefit-cost assessment of scenarios
Traffic Model Development
The study team developed a traffic model using the VISSIM micro-simulation software It is important to note that micro-simulation models are complex to develop and calibrate for a large urban corridor However it is one of the only tools capable of providing a reasonable approximation of bottleneck formation and queue development Therefore such tools help quantify the impacts of operational strategies which traditional travel demand models cannot
The model was calibrated against 2006 conditions This was a resource intensive effort requiring several iterations of submittals and review cycles until the model reasonably matched bottleneck locations and relative severity Once calibration was approved a 2020 model was also developed based on SCAGrsquos travel demand model demand projections
These two models were used to evaluate different scenarios (combinations of projects) to quantify the associated congestion relief benefits and to compare total project costs against their benefits
Exhibit ES-23 depicts the network included in the model There were no parallel arterials modeled with the exception of arterials at interchanges All freeway interchanges were included as well as on-ramps and off-ramps
I-210 Corridor System Management Plan Executive Summary
Page 26 of 39
Exhibit ES-23 Micro-Simulation Model Network
I-210 Corridor System Management Plan Executive Summary
Page 27 of 39
Scenario Development Framework
The study team developed a framework for combining projects into scenarios It would be desirable to evaluate every possible combination of projects However this would have entailed thousands of model runs Instead the team combined projects based on a number of factors including
diams Projects that were fully constructed and completed from 2006 to 2010 were tested with both the 2006 and 2020 models
diams Short- and mid- term operational projects were grouped into scenarios and tested with the both the 2006 and 2020 models
diams Longer-range projects to be delivered by 2020 and beyond were used to develop scenarios to be tested with the 2020 model only
diams Alternative ramp closures were grouped into isolated scenarios (future scenarios did not build on top of these) and tested with both the 2006 and 2020 models
The study assumes that projects delivered before 2016 could reasonably be evaluated using the 2006 base year model The 2020 forecast year for the I-210 study was consistent with the SCAG 2020 regional travel demand model origin-destination matrices used to develop the 2008 Regional Transportation Plan (RTP) When SCAG updates its travel demand model and Regional Transportation Plan (RTP) it may wish to update the micro-simulation model with revised demand projections
Project lists used to develop scenarios were part from the Regional Transportation Improvement Program (RTIP) the RTP and other sources such as special studies Projects that do not directly affect mobility were eliminated For instance sound wall landscaping or minor arterial improvement projects were not evaluated since microshysimulation models cannot evaluate them
Scenario testing performed for the performed for the I-210 CSMP differed from traditional ldquoalternatives evaluationsrdquo done for Major Investment Studies (MIS) or Environmental Impact Reports (EIRs) An MIS or EIR focuses on identifying alternative solutions to address current or projected corridor problems so each alternative is evaluated separately and results among competing alternatives are compared resulting in a locally preferred alternative In contrast for the I-210 CSMP scenarios build on each other in that a scenario contains the projects from the previous scenario plus one or more projects as long as the incremental scenario results showed an acceptable level of performance improvement This incremental scenario evaluation approach is important since CSMPs are new and are often compared with alternatives studies
Exhibit ES-24 summarizes the approach used and scenarios tested and provides a
I-210 Corridor System Management Plan Executive Summary
Page 28 of 39
general description of the projects included in the 2006 and 2020 micro-simulation runs Most projects were tested for both the short- and long-term timeframes Each scenario tested was built upon prior scenarios except for Scenarios 7 and 8 which were ldquostand alonerdquo scenarios used to test alternative ramp closures Later scenarios build on Scenarios 5 and 6 and do not include the improvements tested in Scenarios 7 and 8 Enhanced incident management was tested in Scenarios 11 and 12 by comparing a simulated incident without and with enhanced incident management system Scenarios 13 and 14 are expected for the longer term and were tested only with the 2020 model
Exhibit ES-24 Micro-Simulation Modeling Approach
Short-Term Scenarios Long-Term Scenarios
Calibrated 2006 Base Case
Scenario 1 Expand Ramp-
Metering
Scenario 3 Scenario 1 +
Adv Ramp-Meter w
Queue Control
Scenario 5 Scenario 3 + aux lane striping and
ramp improvements
2020 Horizon Year
2006 Network 2020 OD Matrices
Scenario 7 Scenario 5 +
Ramp Closures
Scenario 2 Expand Ramp-
Metering
Scenario 4 Scenario 2 +
Adv Ramp-Meter w
Queue Control
Scenario 6 Scenario 4 + aux lane striping and
ramp improvements
Scenario 8 Scenario 6 +
Ramp Closures
Scenario 14 Scenario 13 + Lake
Ave Drop Ramp
Lane Addition
Scenario 9 Scenario 5+
On-Ramp amp Aux
lane improvements
Scenario 10 Scenario 6 +
On-Ramp amp Aux
lane improvements
Scenario 11 Incident with No
Incident
Management
Scenario 12 Incident With
Incident
Management
Scenario 13 Scenario 10 +
134210 IC
modification
Incident Management Scenarios
I-210 Corridor System Management Plan Executive Summary
Page 29 of 39
Scenario Evaluation Results
Exhibits ES-25 and ES-26 show the delay results for all the 2006 scenarios evaluated for the AM and PM peak periods respectively Exhibits ES-27 and ES-28 show the delay results for all the 2020 scenarios evaluated for the AM and PM peak periods respectively For each scenario the modeling team produced results by facility type (ie mainline HOV arterials and ramps) and vehicle type (SOV HOV trucks) as well as speed contour diagrams (discussed in more detail in the full technical CSMP) The study team scrutinized to ensure that they were consistent with general traffic engineering principles The following summarizes the findings related to the four exhibits
Exhibit ES-25 2006 AM Peak Micro-Simulation Delay Results by Scenario
De
lay
(Pe
ak
Pe
rio
d V
eh
icle
-Ho
urs
)
2006 Base Year S1 S3 S5 S7 S9 Scenario
18000
16000
14000
12000
10000
8000
6000
4000
2000
-
S1 Expand Ramp Metering
S3 Adv Ramp Metering
S5 Aux Lane Striping Ramp Improvs
S7 Ramp Closures
S9 On-Ramp amp Aux Lane Improvs
-2 -3 -3
-16 -20
HOV WB I-210 WB
HOV EB I-210 EB
Ramps Arterials
I-210 Corridor System Management Plan Executive Summary
Page 30 of 39
Exhibit ES-26 2006 PM Peak Micro-Simulation Delay Results by Scenario
18000
De
lay
(Pe
ak
Pe
rio
d V
eh
icle
-Ho
urs
)
16000
14000
12000
10000
8000
6000
4000
2000
-
S1 Expand Ramp Metering
S3 Adv Ramp Metering
HOV WB
I-210 WB
S5 Aux Lane Striping Ramp Improvs
S7 Ramp Closures
S9 On-Ramp amp Aux Lane Improvs
HOV EB
I-210 EB
Ramps
Arterials
-17
-11
-18
-18 -28
2006 Base Year S1 S3 S5 S7 S9 Scenario
Exhibit ES-27 2020 AM Peak Micro-Simulation Delay Results by Scenario
30000
De
lay
(Pe
ak
Pe
rio
d V
eh
icle
-Ho
urs
)
25000
20000
15000
10000
5000
S2 Expand Ramp Metering
S4 Adv Ramp Metering
S6 Aux Lane Striping Ramp Improvs
S8 Ramp Closures
HOV WB
I-210 WB
HOV EB
-8
-2 -8
-13 -12
S10 On-Ramp amp Aux Lane Improvs
S13 SR-134I-210 IC Modification
S14 Lake Ave Drop Ramp Lane Addition
I-210 EB
Ramps
Arterials
-11
-23
-
2020 S2 S4 S6 S8 S10 S13 S14 Horizon Scenario
I-210 Corridor System Management Plan Executive Summary
Page 31 of 39
Exhibit ES-28 2020 PM Peak Micro-Simulation Delay Results by Scenario D
ela
y(P
ea
k P
eri
od
Ve
hic
le-H
ou
rs)
30000
25000
20000
15000
10000
5000
-
S2 Expand Ramp Metering
S4 Adv Ramp Metering
S6 Aux Lane Striping Ramp Improvs
S8 Ramp Closures
HOV WB
I-210 WB
HOV EB
-14
S10 On-Ramp amp Aux Lane Improvs
S13 SR-134I-210 IC Modification
S14 Lake Ave Drop Ramp Lane Addition
I-210 EB
Ramps
Arterials
-2 -5 -3 -28
-3 -19
2020 S2 S4 S6 S8 S10 S13 S14 Horizon Scenario
Base Year and Do Minimum Horizon Year
Absent any physical improvements the modeling team estimates that by 2020 total delay (mainline HOV ramps and arterials) would double compared to 2006 (from a total of around 22000 vehicle-hours daily to just fewer than 45000 vehicle-hours) in the combined AM and PM peak
Scenarios 1 and 2 (Expand Ramp Metering)
Scenarios 1 and 2 test the only project on the corridor that was fully constructed and completed The project installed new connector metering at the SR-57 and I-605 to Ishy210 freeway connector ramps The project also widened various ramps removed various HOV meter bypasses and upgraded the ramp metering system
The 2006 model estimates that Scenario 1 would reduce delay on the corridor by around 17 percent (or 1600 daily vehicle-hours) in the PM peak period but only around two percent (or 200 vehicle-hours) in the AM peak period The biggest benefits occur in the PM eastbound direction from Rosemead On-Ramp to Huntington interchange (with a delay reduction of over 1000 vehicle-hours) as well as from I-605 to the Azusa On-Ramp (delay reduction of 500 vehicle-hours) for single occupant vehicles The
I-210 Corridor System Management Plan Executive Summary
Page 32 of 39
westbound reductions in freeway delay are largely offset by increased on-ramp delay mostly from new connector metering at SR-57 and I-605
The 2020 model estimates that Scenario 2 will reduce delay by around 8 percent in the AM peak and 14 percent in the PM peak for a combined total reduction of 5000 daily vehicle-hours The long-term improvements are less than the short-term improvements due to the increase in demand
Scenarios 3 and 4 (Advanced Ramp Metering)
Scenarios 3 and 4 build on Scenarios 1 and 2 by adding advanced ramp metering system such as dynamic or adaptive ramp metering system
The 2006 model shows that Scenario 3 would reduce delay by an additional 850 daily vehicle-hours (or 11 percent) in the PM peak with a marginal reduction in the AM peak period However in conjunction with Scenario 1 Scenario 3 reduces delay in total by over 600 vehicle-hours in the AM peak These results suggest that queue control provides additional benefits beyond SWARM
The 2020 model estimates that Scenario 4 will modestly reduce delay by about 2 percent in both the AM and PM peaks or a combined total of 800 daily vehicle-hours Again the benefits are lower in percentage terms due to the increase in demand
Note that there are various types of advanced ramp metering systems deployed around the world including System-wide Adaptive Ramp Metering System or SWARM tested recently in Los Angeles I-210 freeway corridor For the I-210 model the Asservissement Lineaire drsquoEntreacutee Autoroutiere (ALINEA system) was tested as proxy for any advanced ramp metering system as its algorithm for the model was readily available It is not necessarily recommended that ALINEA be deployed but rather some type of advanced ramp metering system that would produce similar if not better results
Scenarios 5 and 6 (Auxiliary Lane Striping Ramp Improvements)
Scenarios 5 and 6 build on Scenarios 3 and 4 that include several relatively lower-cost operational improvements that could be implemented by 2015
diams Building a westbound auxiliary lane from Santa Anita to Baldwin and an eastbound auxiliary lane from Santa Anita to Huntington
diams Extending a lane to Lincoln on the westbound I-210 connector
diams Connecting and converging the Altadena on-ramps into a single on-ramp
I-210 Corridor System Management Plan Executive Summary
Page 33 of 39
diams Connecting and converging the Santa Anita on-ramps into a single on-ramp
diams Connecting and converging the Irwindale on-ramps into a single on-ramp
diams Restriping to add a lane in the eastbound direction from San Dimas to Fruit
The 2006 model shows that Scenario 5 reduces delay by 3 percent (nearly 400 vehicleshyhours) in the AM peak and 18 percent (1200 vehicle-hours) in the PM peak The segment that experienced the largest improvement in the eastbound during the PM peak was from Rosemead to Huntington This segment experienced a 45 percent improvement in delay (from 2700 vehicle-hours to 1500 vehicle-hours) which is likely attributed to the eastbound auxiliary lane from Santa Anita to Huntington In the westbound direction the auxiliary lane from Santa Anita to Baldwin shifts some traffic downstream to cause increased congestion at Michillinda (ie bottleneck shift) during the westbound AM peak However the auxiliary lane helps reduce both queue length and queue duration for the Santa Anita bottleneck
The 2020 model estimates that Scenario 6 would reduce delay by 8 percent in the AM peak and 5 percent in the PM peak for a total reduction of 2500 daily vehicle-hours A reduction in PM delay is expected to occur mostly in the westbound direction
Scenarios 7 and 8 (Ramp Closures)
Scenarios 7 and 8 build on Scenarios 5 and 6 and test the closure of several ramps
diams Eastbound Marengo on-ramp and westbound Lake on-ramp with signalization of the eastbound I-210 off-ramp at Maple and improvement to alternate routes along Corson and Maple
diams Eastbound Mount Olive ramps
Note that subsequent scenarios are not built on top of these scenarios as these are isolated to test ramp closure alternatives
The 2006 model shows that Scenario 7 would reduce delay significantly by 16 percent in the AM peak and 18 percent in the PM peak for a total delay reduction of nearly 3000 daily vehicle-hours The delay reductions are significant on the mainline during the peak direction of travel ndash 1400 vehicle-hours in the westbound AM and 912 vehicleshyhours in the eastbound PM In the westbound direction and AM peak period the segment from Altadena to Lake experienced over an 85 percent decrease in congestion (from 860 to 120 vehicle-hours of delay) This is likely attributed to the closure of the westbound Lake on-ramp In the eastbound direction and PM peak period the segment from Huntington to I-605 experienced a delay reduction of over 70 percent (from 2200
I-210 Corridor System Management Plan Executive Summary
Page 34 of 39
vehicle-hours to 600 vehicle-hours) which is likely attributed to the closure of the Mount Olive ramp
The 2020 model also shows that Scenario 8 improved delay by 12 percent in the AM and 3 percent in the PM for a total delay reduction of almost 3000 daily vehicle-hours On the mainline facility delay also improved for each peak direction of travel ndash by 1600 daily vehicle-hours in the westbound AM and by 750 vehicle-hours in the eastbound PM Delay reductions in the non-peak direction were not as significant
Scenarios 9 and 10 (On-ramp and Aux Lane Improvements)
Scenarios 9 and 10 build on Scenarios 5 and 6 and test four operational improvements that can be implemented in the short to medium range
diams Modify the RosemeadMichillinda interchange and converge the westbound I-210 on-ramps
diams Modify the northside of the Baldwin interchange and eliminate the collectorshydistributor
diams Construct an eastbound auxiliary lane from Azusa to Citrus
diams Converge the eastbound Citrus on-ramps and add an auxiliary lane to Grand
The 2006 model estimates that Scenario 9 will reduce delay by 20 percent (or 2400 daily vehicle-hours) in the AM peak and 28 percent (or 1600 daily vehicle-hours) in the PM peak compared to Scenario 5 In both AM and PM peak period the eastbound direction experienced the largest reduction in delay
The 2020 model estimates that Scenario 10 will reduce delay by 13 percent (or 2500 vehicle-hours) in the AM peak and 28 percent in the PM peak (or 4800 vehicle-hours) compared to Scenario 6 Similar to the 2006 model the 2020 model shows that these improvements produced a greater reduction in delay in the eastbound direction than the westbound direction
Scenarios 11 and 12 (Enhanced Incident Management)
Two incident scenarios were tested on top of Scenario 10 to evaluate the non-recurrent delay reductions resulting from enhanced incident management strategies An enhanced incident management system would entail upgrading or enhancing the current Caltrans incident management system that includes deployment of intelligent transportation system (ITS) field devices central controlcommunications software communications medium (ie fiber optic lines) advanced traveler information system
I-210 Corridor System Management Plan Executive Summary
Page 35 of 39
andor freeway service patrol (FSP) program to reduce incident detection verification response and clearance times
In the first scenario Scenario 11 one collision incident with one lane closure was simulated in the westbound direction in the AM peak period model and one in the eastbound direction in the PM peak period model The incident simulation location and duration were selected based on review of the 2010 actual incident data at one of the high frequency locations The following are the Scenario details
diams Westbound AM peak period starting at 800 AM close mainline lane 2 for 40 minutes at absolute post mile 2612 (at Lake Avenue)
diams Eastbound PM peak period starting at 500 PM close mainline lane 2 for 50 minutes at absolute post mile 3207 (west of Santa Anita)
In the second scenario Scenario 12 the same collision incidents were simulated with a reduction in duration by 10 minutes in the westbound direction and by 12 minutes in the eastbound direction It is estimated based on actual incident management data analysis results provided by Caltrans that an enhanced incident management system could reduce a 35-minute incident by about 10 minutes This scenario represents a typical moderate level incident at one location during the peak period direction Data suggest that incidents vary significantly in terms of impact and duration Some incidents last hundreds of minutes some close multiple lanes and some occur at multiple locations simultaneously There are also numerous minor incidents lasting only a few minutes without lane closures that can result in congestion Many other incidents also occur during off-peak hours
Without enhanced incident management Scenario 11 produced an 8 percent increase in congestion in both peak periods over Scenario 10 an increase of over 2300 hours of vehicle delay With enhanced incident management Scenario 12 evaluation resulted in delay decrease by 2 percent in the AM peak and 3 percent in the PM peak against Scenario 11 results a reduction of nearly 750 vehicle-hours for improving the incident detection verification response and clearance time of one moderate level incident for both of the peak hours
Scenario 13 (SR-134I-210 Interchange Modification)
Scenario 13 tests an improvement to modify the SR-134I-210 interchange to provide a direct connection for vehicles to continue on I-210 with three lanes in each direction This improvement was tested with the 2020 model since it is not likely to be implemented in the short-term
I-210 Corridor System Management Plan Executive Summary
Page 36 of 39
The 2020 model estimates that delay would be reduced by 11 percent (or 1800 daily vehicle-hours) in the AM and 3 percent in the PM (320 daily vehicle-hours) compared to Scenario 10 The westbound mainline experienced the greatest reduction in delay in the AM peak from 9600 vehicle-hours to 8600 vehicle hours after the interchange modification
Scenario 14 (Westbound Drop Ramp and Eastbound Widening)
Scenario 14 builds on Scenario 13 and tests Lake Avenue drop ramp to westbound Ishy210 center lanes (one HOV lane and one mainline) and eastbound I-210 widening from Myrtle to I-605 This improvement was tested with the 2020 model
The 2020 model estimates that delay would be reduced by about 20 percent in the AM or 3400 vehicle-hours and 20 percent in the PM or 2300 vehicle-hours compared to Scenario 13 The mobility improvements are significant with the westbound drop ramp that reduces weaving between SR-134 and SR-210 destined traffic and with the eastbound capacity addition to I-605 off that moves the off-ramp traffic away from the mainline and provides more room for the mainline through traffic
Post Scenario 14 Conditions
By 2020 with the inclusion of all the projects tested the model reveals some residual congestion that remains to address with future improvements According to the model results the total remaining delay on the corridor is around 21000 daily vehicle-hours
Benefit-Cost Analysis
Following an in-depth review of model results by the study team and the SCAG technical committee the study team performed a benefit-cost analysis (BCA) for each scenario
Using the California Benefit-Cost Model (Cal-BC) developed on behalf of Caltrans by the study team benefits in three key areas were estimated travel time savings vehicle operating cost savings and emission reduction savings The benefits generated from this exercise are based solely on congestion relief related benefits However these results are conservative since there are other benefits not captured by this analysis including benefits from deploying bus rapid transit which will achieve other accessibility benefits
Project costs were developed from SCAG and Caltrans project planning and programming documents These costs include construction and support costs in current dollars The study team estimated costs for projects that did not have cost
I-210 Corridor System Management Plan Executive Summary
Page 37 of 39
estimates by reviewing similar completed projects A BC greater than one means that a scenarios projects return greater benefits than it costs to construct or implement It is important to consider the total benefits that a project brings For example a large capital expansion project can cost a great deal and have a low BC ratio but brings much higher absolute benefits to the I-210 users Exhibit ES-29 shows the benefit to cost ranges classified from low (with a BC of one to two) to very high (with a BC of over 10)
The benefit-cost results for the South Corridor scenarios are shown in Exhibit ES-29
Exhibit ES-29 I-210 Scenario BenefitCost (BC) Results
Scenario Scenario Description
BenefitCost Ranges
Low Medium Medium-High High Very High
lt1 1 to 2 2 to 5 5 to 10 gt10
12 Expand Ramp Metering 34 Advanced Ramp Metering 56 Aux Lane Striping Ramp Improvs 78 Ramp Closures
910 On-Ramp amp Aux Lane Improvs 13 SR-134I-210 IC Modification
The benefit-cost findings for each scenario are as follows
diams Scenarios 1 and 2 (ramp metering expansion) shows a high benefit-cost ratio of over ten The relatively high benefit-cost ratio is due to the low cost of expanding ramp metering ($235 million)
diams Scenarios 3 and 4 (advanced ramp metering) resulted in an incremental benefitshycost ratio of over ten This is relatively high as compared to that of typical transportation management system project
diams Scenarios 5 and 6 (operational improvements) produced a benefit-cost ratio of over five This is relatively consistent with other typical operational improvement projects The benefits are substantial At estimated total cost of about $44 million these projects produced benefits of over $233 million
diams Scenarios 7 and 8 tested the ramp closures at eastbound Marengo westbound Lake and eastbound Mount Olive These ramp closured produced an extremely high incremental benefit-cost ratio of over ten due to the relatively very low cost However this benefit-cost calculation does not account for any potential increase in delay on various local arterials because of detours from the closed ramps
diams Scenarios 9 and 10 also produced a relatively high benefit-cost ratio of over ten The four operational projects in these scenarios are collectively estimated to cost
I-210 Corridor System Management Plan Executive Summary
Page 38 of 39
under $30 million and provide a substantial and optimistic benefit of over $670 million
diams Scenario 13 tested the SR-134I-210 interchange modification This project produced a benefit-cost ratio of between one and two consistent with other typical capital expansion projects This project produced benefits of over $200 million at a rough-estimate cost of about $150 million
diams Scenario 14 tested the westbound center drop ramp from Lake Avenue interchange and eastbound lane addition from Myrtle to I-605 These projects produced a relatively high benefit-cost ratio of about 6 to one as compared to other capital improvement projects These two capital projects are unique in that they have specific operational improvement element that addresses major bottleneck locations For an estimated total combined cost of about $70 million the projected benefits exceed $420 million
CONCLUSIONS AND RECOMMENDATIONS
This section summarizes the conclusions and recommendations based on the analysis discussed in the previous section It is important to note that many of these conclusions are based primarily on the micro-simulation model results The model was developed based on the best data available at the time The study team reviewed the model results and believe that both the calibrated base year forecast year and scenario results are reasonable However Caltrans should always be cautious to make decisions based on modeling alone especially complex micro-simulation models
Based on the results the study team offers the following conclusions and recommendations
diams The combination of all scenarios significantly reduces overall congestion on the corridor Projected 2020 congestion after implementation of all scenarios is below 2006 levels in both the AM and PM peak period In the AM peak period the model projects total delay in 2020 after delivering all projects to be less than 11700 vehicle-hours compared to the 2006 base year delay of 13000 vehicleshyhours This represents a reduction of over 10 percent In the PM peak period the model projects total delay in 2020 after delivering all projects to be around 9500 hours compared to the 2006 base year delay of almost 9300 vehicle-hours This represents a slight reduction of 2 percent Clearly the scenarios deliver significant mobility benefits to the corridor Despite the growth in demand future 2020 congestion will be less than experienced in 2006
diams The completed ramp metering expansion project is expected to produce substantial mobility benefits of over $400 million Delay has been significantly reduced since 2006
I-210 Corridor System Management Plan Executive Summary
Page 39 of 39
diams Advanced ramp metering could provide additional mobility improvements by significantly reducing congestion and returning over $100 million in benefits
diams Ramp closures at Marengo Lake and Mount Olive as alternatives seem promising by reducing delay up to 3000 vehicle-hours per day and providing substantial benefits of $280 million at an extremely low cost
diams Operational improvements such as auxiliary lanes and ramp improvements could leverage on the ramp metering projects by making the corridor more efficient and productive that could result in additional mobility benefits of over $230 million
diams Additional capital improvements with specific operational elements to address weaving at major bottleneck locations could produce significant mobility benefits of over $420 million
diams Enhanced incident management system associated with Scenarios 11 and 12 to address non-recurrent congestion proved effective with a delay reduction of over 300 vehicle-hours for one modest level incident with a typical duration of 35 minutes reduced to 25 minutes With the I-210 corridor experiencing up to 2400 collisions per year this translates to a total annual delay savings of over 700000 vehicle-hours for the study corridor
diams The benefit-cost ratio of all scenarios combined is about 64 to 1 If all projects were delivered at current cost estimates the public would get over six dollars of benefits for each dollar expended In current dollars costs total to over $17 billion whereas the benefits are estimated to be over $20 billion
diams The projects also alleviate greenhouse gas (GHG) emissions by over 15 million tons over 20 years averaging over a 75000-ton reduction per year The emissions are estimated using data from the California Air Resources Board (CARB) EMFAC model
This is the first generation CSMP for the I-210 corridor It is important to stress that CSMPs should be updated on a regular basis This is particularly important since traffic conditions and patterns can differ from current projections After projects are delivered it is also useful to compare actual results with estimated ones in this document so that models can be further improved as appropriate
CSMPs or a variation thereof should become the normal course of business that is based on detailed performance assessments an in-depth understanding of the reasons for performance deterioration and an analytical framework that allows for evaluating complementary operational strategies that maximize the productivity of the current system

Bottleneck Locations
reg --Bottleneck
Westbound
Eastbound
0 1 2
I bull I I I bull I I I Miles
HJOUAIIO fl _
I-210 Corridor System Management Plan Executive Summary
Page 23 of 39
Exhibit ES-21 I-210 Map of AM Bottleneck Locations
Bottleneck Locations
reg Bottleneck - Westbound - Eastbound
N 0 1 2
bull I I II II II I ll) Mles s
HJOUAIIO fl _
I-210 Corridor System Management Plan Executive Summary
Page 24 of 39
Exhibit ES-22 I-210 Map of PM Bottleneck Locations
I-210 Corridor System Management Plan Executive Summary
Page 25 of 39
SCENARIO DEVELOPMENT AND ANALYSIS
Fully understanding how a corridor performs and why it performs the way it does sets the foundation for evaluating potential solutions Several steps were required to develop and evaluate improvements including
diams Developing traffic models for 2006 base year and 2020 long-term demand diams Combining projects in a logical manner for modeling and testing diams Evaluating model outputs and summarizing results diams Conducting a benefit-cost assessment of scenarios
Traffic Model Development
The study team developed a traffic model using the VISSIM micro-simulation software It is important to note that micro-simulation models are complex to develop and calibrate for a large urban corridor However it is one of the only tools capable of providing a reasonable approximation of bottleneck formation and queue development Therefore such tools help quantify the impacts of operational strategies which traditional travel demand models cannot
The model was calibrated against 2006 conditions This was a resource intensive effort requiring several iterations of submittals and review cycles until the model reasonably matched bottleneck locations and relative severity Once calibration was approved a 2020 model was also developed based on SCAGrsquos travel demand model demand projections
These two models were used to evaluate different scenarios (combinations of projects) to quantify the associated congestion relief benefits and to compare total project costs against their benefits
Exhibit ES-23 depicts the network included in the model There were no parallel arterials modeled with the exception of arterials at interchanges All freeway interchanges were included as well as on-ramps and off-ramps
I-210 Corridor System Management Plan Executive Summary
Page 26 of 39
Exhibit ES-23 Micro-Simulation Model Network
I-210 Corridor System Management Plan Executive Summary
Page 27 of 39
Scenario Development Framework
The study team developed a framework for combining projects into scenarios It would be desirable to evaluate every possible combination of projects However this would have entailed thousands of model runs Instead the team combined projects based on a number of factors including
diams Projects that were fully constructed and completed from 2006 to 2010 were tested with both the 2006 and 2020 models
diams Short- and mid- term operational projects were grouped into scenarios and tested with the both the 2006 and 2020 models
diams Longer-range projects to be delivered by 2020 and beyond were used to develop scenarios to be tested with the 2020 model only
diams Alternative ramp closures were grouped into isolated scenarios (future scenarios did not build on top of these) and tested with both the 2006 and 2020 models
The study assumes that projects delivered before 2016 could reasonably be evaluated using the 2006 base year model The 2020 forecast year for the I-210 study was consistent with the SCAG 2020 regional travel demand model origin-destination matrices used to develop the 2008 Regional Transportation Plan (RTP) When SCAG updates its travel demand model and Regional Transportation Plan (RTP) it may wish to update the micro-simulation model with revised demand projections
Project lists used to develop scenarios were part from the Regional Transportation Improvement Program (RTIP) the RTP and other sources such as special studies Projects that do not directly affect mobility were eliminated For instance sound wall landscaping or minor arterial improvement projects were not evaluated since microshysimulation models cannot evaluate them
Scenario testing performed for the performed for the I-210 CSMP differed from traditional ldquoalternatives evaluationsrdquo done for Major Investment Studies (MIS) or Environmental Impact Reports (EIRs) An MIS or EIR focuses on identifying alternative solutions to address current or projected corridor problems so each alternative is evaluated separately and results among competing alternatives are compared resulting in a locally preferred alternative In contrast for the I-210 CSMP scenarios build on each other in that a scenario contains the projects from the previous scenario plus one or more projects as long as the incremental scenario results showed an acceptable level of performance improvement This incremental scenario evaluation approach is important since CSMPs are new and are often compared with alternatives studies
Exhibit ES-24 summarizes the approach used and scenarios tested and provides a
I-210 Corridor System Management Plan Executive Summary
Page 28 of 39
general description of the projects included in the 2006 and 2020 micro-simulation runs Most projects were tested for both the short- and long-term timeframes Each scenario tested was built upon prior scenarios except for Scenarios 7 and 8 which were ldquostand alonerdquo scenarios used to test alternative ramp closures Later scenarios build on Scenarios 5 and 6 and do not include the improvements tested in Scenarios 7 and 8 Enhanced incident management was tested in Scenarios 11 and 12 by comparing a simulated incident without and with enhanced incident management system Scenarios 13 and 14 are expected for the longer term and were tested only with the 2020 model
Exhibit ES-24 Micro-Simulation Modeling Approach
Short-Term Scenarios Long-Term Scenarios
Calibrated 2006 Base Case
Scenario 1 Expand Ramp-
Metering
Scenario 3 Scenario 1 +
Adv Ramp-Meter w
Queue Control
Scenario 5 Scenario 3 + aux lane striping and
ramp improvements
2020 Horizon Year
2006 Network 2020 OD Matrices
Scenario 7 Scenario 5 +
Ramp Closures
Scenario 2 Expand Ramp-
Metering
Scenario 4 Scenario 2 +
Adv Ramp-Meter w
Queue Control
Scenario 6 Scenario 4 + aux lane striping and
ramp improvements
Scenario 8 Scenario 6 +
Ramp Closures
Scenario 14 Scenario 13 + Lake
Ave Drop Ramp
Lane Addition
Scenario 9 Scenario 5+
On-Ramp amp Aux
lane improvements
Scenario 10 Scenario 6 +
On-Ramp amp Aux
lane improvements
Scenario 11 Incident with No
Incident
Management
Scenario 12 Incident With
Incident
Management
Scenario 13 Scenario 10 +
134210 IC
modification
Incident Management Scenarios
I-210 Corridor System Management Plan Executive Summary
Page 29 of 39
Scenario Evaluation Results
Exhibits ES-25 and ES-26 show the delay results for all the 2006 scenarios evaluated for the AM and PM peak periods respectively Exhibits ES-27 and ES-28 show the delay results for all the 2020 scenarios evaluated for the AM and PM peak periods respectively For each scenario the modeling team produced results by facility type (ie mainline HOV arterials and ramps) and vehicle type (SOV HOV trucks) as well as speed contour diagrams (discussed in more detail in the full technical CSMP) The study team scrutinized to ensure that they were consistent with general traffic engineering principles The following summarizes the findings related to the four exhibits
Exhibit ES-25 2006 AM Peak Micro-Simulation Delay Results by Scenario
De
lay
(Pe
ak
Pe
rio
d V
eh
icle
-Ho
urs
)
2006 Base Year S1 S3 S5 S7 S9 Scenario
18000
16000
14000
12000
10000
8000
6000
4000
2000
-
S1 Expand Ramp Metering
S3 Adv Ramp Metering
S5 Aux Lane Striping Ramp Improvs
S7 Ramp Closures
S9 On-Ramp amp Aux Lane Improvs
-2 -3 -3
-16 -20
HOV WB I-210 WB
HOV EB I-210 EB
Ramps Arterials
I-210 Corridor System Management Plan Executive Summary
Page 30 of 39
Exhibit ES-26 2006 PM Peak Micro-Simulation Delay Results by Scenario
18000
De
lay
(Pe
ak
Pe
rio
d V
eh
icle
-Ho
urs
)
16000
14000
12000
10000
8000
6000
4000
2000
-
S1 Expand Ramp Metering
S3 Adv Ramp Metering
HOV WB
I-210 WB
S5 Aux Lane Striping Ramp Improvs
S7 Ramp Closures
S9 On-Ramp amp Aux Lane Improvs
HOV EB
I-210 EB
Ramps
Arterials
-17
-11
-18
-18 -28
2006 Base Year S1 S3 S5 S7 S9 Scenario
Exhibit ES-27 2020 AM Peak Micro-Simulation Delay Results by Scenario
30000
De
lay
(Pe
ak
Pe
rio
d V
eh
icle
-Ho
urs
)
25000
20000
15000
10000
5000
S2 Expand Ramp Metering
S4 Adv Ramp Metering
S6 Aux Lane Striping Ramp Improvs
S8 Ramp Closures
HOV WB
I-210 WB
HOV EB
-8
-2 -8
-13 -12
S10 On-Ramp amp Aux Lane Improvs
S13 SR-134I-210 IC Modification
S14 Lake Ave Drop Ramp Lane Addition
I-210 EB
Ramps
Arterials
-11
-23
-
2020 S2 S4 S6 S8 S10 S13 S14 Horizon Scenario
I-210 Corridor System Management Plan Executive Summary
Page 31 of 39
Exhibit ES-28 2020 PM Peak Micro-Simulation Delay Results by Scenario D
ela
y(P
ea
k P
eri
od
Ve
hic
le-H
ou
rs)
30000
25000
20000
15000
10000
5000
-
S2 Expand Ramp Metering
S4 Adv Ramp Metering
S6 Aux Lane Striping Ramp Improvs
S8 Ramp Closures
HOV WB
I-210 WB
HOV EB
-14
S10 On-Ramp amp Aux Lane Improvs
S13 SR-134I-210 IC Modification
S14 Lake Ave Drop Ramp Lane Addition
I-210 EB
Ramps
Arterials
-2 -5 -3 -28
-3 -19
2020 S2 S4 S6 S8 S10 S13 S14 Horizon Scenario
Base Year and Do Minimum Horizon Year
Absent any physical improvements the modeling team estimates that by 2020 total delay (mainline HOV ramps and arterials) would double compared to 2006 (from a total of around 22000 vehicle-hours daily to just fewer than 45000 vehicle-hours) in the combined AM and PM peak
Scenarios 1 and 2 (Expand Ramp Metering)
Scenarios 1 and 2 test the only project on the corridor that was fully constructed and completed The project installed new connector metering at the SR-57 and I-605 to Ishy210 freeway connector ramps The project also widened various ramps removed various HOV meter bypasses and upgraded the ramp metering system
The 2006 model estimates that Scenario 1 would reduce delay on the corridor by around 17 percent (or 1600 daily vehicle-hours) in the PM peak period but only around two percent (or 200 vehicle-hours) in the AM peak period The biggest benefits occur in the PM eastbound direction from Rosemead On-Ramp to Huntington interchange (with a delay reduction of over 1000 vehicle-hours) as well as from I-605 to the Azusa On-Ramp (delay reduction of 500 vehicle-hours) for single occupant vehicles The
I-210 Corridor System Management Plan Executive Summary
Page 32 of 39
westbound reductions in freeway delay are largely offset by increased on-ramp delay mostly from new connector metering at SR-57 and I-605
The 2020 model estimates that Scenario 2 will reduce delay by around 8 percent in the AM peak and 14 percent in the PM peak for a combined total reduction of 5000 daily vehicle-hours The long-term improvements are less than the short-term improvements due to the increase in demand
Scenarios 3 and 4 (Advanced Ramp Metering)
Scenarios 3 and 4 build on Scenarios 1 and 2 by adding advanced ramp metering system such as dynamic or adaptive ramp metering system
The 2006 model shows that Scenario 3 would reduce delay by an additional 850 daily vehicle-hours (or 11 percent) in the PM peak with a marginal reduction in the AM peak period However in conjunction with Scenario 1 Scenario 3 reduces delay in total by over 600 vehicle-hours in the AM peak These results suggest that queue control provides additional benefits beyond SWARM
The 2020 model estimates that Scenario 4 will modestly reduce delay by about 2 percent in both the AM and PM peaks or a combined total of 800 daily vehicle-hours Again the benefits are lower in percentage terms due to the increase in demand
Note that there are various types of advanced ramp metering systems deployed around the world including System-wide Adaptive Ramp Metering System or SWARM tested recently in Los Angeles I-210 freeway corridor For the I-210 model the Asservissement Lineaire drsquoEntreacutee Autoroutiere (ALINEA system) was tested as proxy for any advanced ramp metering system as its algorithm for the model was readily available It is not necessarily recommended that ALINEA be deployed but rather some type of advanced ramp metering system that would produce similar if not better results
Scenarios 5 and 6 (Auxiliary Lane Striping Ramp Improvements)
Scenarios 5 and 6 build on Scenarios 3 and 4 that include several relatively lower-cost operational improvements that could be implemented by 2015
diams Building a westbound auxiliary lane from Santa Anita to Baldwin and an eastbound auxiliary lane from Santa Anita to Huntington
diams Extending a lane to Lincoln on the westbound I-210 connector
diams Connecting and converging the Altadena on-ramps into a single on-ramp
I-210 Corridor System Management Plan Executive Summary
Page 33 of 39
diams Connecting and converging the Santa Anita on-ramps into a single on-ramp
diams Connecting and converging the Irwindale on-ramps into a single on-ramp
diams Restriping to add a lane in the eastbound direction from San Dimas to Fruit
The 2006 model shows that Scenario 5 reduces delay by 3 percent (nearly 400 vehicleshyhours) in the AM peak and 18 percent (1200 vehicle-hours) in the PM peak The segment that experienced the largest improvement in the eastbound during the PM peak was from Rosemead to Huntington This segment experienced a 45 percent improvement in delay (from 2700 vehicle-hours to 1500 vehicle-hours) which is likely attributed to the eastbound auxiliary lane from Santa Anita to Huntington In the westbound direction the auxiliary lane from Santa Anita to Baldwin shifts some traffic downstream to cause increased congestion at Michillinda (ie bottleneck shift) during the westbound AM peak However the auxiliary lane helps reduce both queue length and queue duration for the Santa Anita bottleneck
The 2020 model estimates that Scenario 6 would reduce delay by 8 percent in the AM peak and 5 percent in the PM peak for a total reduction of 2500 daily vehicle-hours A reduction in PM delay is expected to occur mostly in the westbound direction
Scenarios 7 and 8 (Ramp Closures)
Scenarios 7 and 8 build on Scenarios 5 and 6 and test the closure of several ramps
diams Eastbound Marengo on-ramp and westbound Lake on-ramp with signalization of the eastbound I-210 off-ramp at Maple and improvement to alternate routes along Corson and Maple
diams Eastbound Mount Olive ramps
Note that subsequent scenarios are not built on top of these scenarios as these are isolated to test ramp closure alternatives
The 2006 model shows that Scenario 7 would reduce delay significantly by 16 percent in the AM peak and 18 percent in the PM peak for a total delay reduction of nearly 3000 daily vehicle-hours The delay reductions are significant on the mainline during the peak direction of travel ndash 1400 vehicle-hours in the westbound AM and 912 vehicleshyhours in the eastbound PM In the westbound direction and AM peak period the segment from Altadena to Lake experienced over an 85 percent decrease in congestion (from 860 to 120 vehicle-hours of delay) This is likely attributed to the closure of the westbound Lake on-ramp In the eastbound direction and PM peak period the segment from Huntington to I-605 experienced a delay reduction of over 70 percent (from 2200
I-210 Corridor System Management Plan Executive Summary
Page 34 of 39
vehicle-hours to 600 vehicle-hours) which is likely attributed to the closure of the Mount Olive ramp
The 2020 model also shows that Scenario 8 improved delay by 12 percent in the AM and 3 percent in the PM for a total delay reduction of almost 3000 daily vehicle-hours On the mainline facility delay also improved for each peak direction of travel ndash by 1600 daily vehicle-hours in the westbound AM and by 750 vehicle-hours in the eastbound PM Delay reductions in the non-peak direction were not as significant
Scenarios 9 and 10 (On-ramp and Aux Lane Improvements)
Scenarios 9 and 10 build on Scenarios 5 and 6 and test four operational improvements that can be implemented in the short to medium range
diams Modify the RosemeadMichillinda interchange and converge the westbound I-210 on-ramps
diams Modify the northside of the Baldwin interchange and eliminate the collectorshydistributor
diams Construct an eastbound auxiliary lane from Azusa to Citrus
diams Converge the eastbound Citrus on-ramps and add an auxiliary lane to Grand
The 2006 model estimates that Scenario 9 will reduce delay by 20 percent (or 2400 daily vehicle-hours) in the AM peak and 28 percent (or 1600 daily vehicle-hours) in the PM peak compared to Scenario 5 In both AM and PM peak period the eastbound direction experienced the largest reduction in delay
The 2020 model estimates that Scenario 10 will reduce delay by 13 percent (or 2500 vehicle-hours) in the AM peak and 28 percent in the PM peak (or 4800 vehicle-hours) compared to Scenario 6 Similar to the 2006 model the 2020 model shows that these improvements produced a greater reduction in delay in the eastbound direction than the westbound direction
Scenarios 11 and 12 (Enhanced Incident Management)
Two incident scenarios were tested on top of Scenario 10 to evaluate the non-recurrent delay reductions resulting from enhanced incident management strategies An enhanced incident management system would entail upgrading or enhancing the current Caltrans incident management system that includes deployment of intelligent transportation system (ITS) field devices central controlcommunications software communications medium (ie fiber optic lines) advanced traveler information system
I-210 Corridor System Management Plan Executive Summary
Page 35 of 39
andor freeway service patrol (FSP) program to reduce incident detection verification response and clearance times
In the first scenario Scenario 11 one collision incident with one lane closure was simulated in the westbound direction in the AM peak period model and one in the eastbound direction in the PM peak period model The incident simulation location and duration were selected based on review of the 2010 actual incident data at one of the high frequency locations The following are the Scenario details
diams Westbound AM peak period starting at 800 AM close mainline lane 2 for 40 minutes at absolute post mile 2612 (at Lake Avenue)
diams Eastbound PM peak period starting at 500 PM close mainline lane 2 for 50 minutes at absolute post mile 3207 (west of Santa Anita)
In the second scenario Scenario 12 the same collision incidents were simulated with a reduction in duration by 10 minutes in the westbound direction and by 12 minutes in the eastbound direction It is estimated based on actual incident management data analysis results provided by Caltrans that an enhanced incident management system could reduce a 35-minute incident by about 10 minutes This scenario represents a typical moderate level incident at one location during the peak period direction Data suggest that incidents vary significantly in terms of impact and duration Some incidents last hundreds of minutes some close multiple lanes and some occur at multiple locations simultaneously There are also numerous minor incidents lasting only a few minutes without lane closures that can result in congestion Many other incidents also occur during off-peak hours
Without enhanced incident management Scenario 11 produced an 8 percent increase in congestion in both peak periods over Scenario 10 an increase of over 2300 hours of vehicle delay With enhanced incident management Scenario 12 evaluation resulted in delay decrease by 2 percent in the AM peak and 3 percent in the PM peak against Scenario 11 results a reduction of nearly 750 vehicle-hours for improving the incident detection verification response and clearance time of one moderate level incident for both of the peak hours
Scenario 13 (SR-134I-210 Interchange Modification)
Scenario 13 tests an improvement to modify the SR-134I-210 interchange to provide a direct connection for vehicles to continue on I-210 with three lanes in each direction This improvement was tested with the 2020 model since it is not likely to be implemented in the short-term
I-210 Corridor System Management Plan Executive Summary
Page 36 of 39
The 2020 model estimates that delay would be reduced by 11 percent (or 1800 daily vehicle-hours) in the AM and 3 percent in the PM (320 daily vehicle-hours) compared to Scenario 10 The westbound mainline experienced the greatest reduction in delay in the AM peak from 9600 vehicle-hours to 8600 vehicle hours after the interchange modification
Scenario 14 (Westbound Drop Ramp and Eastbound Widening)
Scenario 14 builds on Scenario 13 and tests Lake Avenue drop ramp to westbound Ishy210 center lanes (one HOV lane and one mainline) and eastbound I-210 widening from Myrtle to I-605 This improvement was tested with the 2020 model
The 2020 model estimates that delay would be reduced by about 20 percent in the AM or 3400 vehicle-hours and 20 percent in the PM or 2300 vehicle-hours compared to Scenario 13 The mobility improvements are significant with the westbound drop ramp that reduces weaving between SR-134 and SR-210 destined traffic and with the eastbound capacity addition to I-605 off that moves the off-ramp traffic away from the mainline and provides more room for the mainline through traffic
Post Scenario 14 Conditions
By 2020 with the inclusion of all the projects tested the model reveals some residual congestion that remains to address with future improvements According to the model results the total remaining delay on the corridor is around 21000 daily vehicle-hours
Benefit-Cost Analysis
Following an in-depth review of model results by the study team and the SCAG technical committee the study team performed a benefit-cost analysis (BCA) for each scenario
Using the California Benefit-Cost Model (Cal-BC) developed on behalf of Caltrans by the study team benefits in three key areas were estimated travel time savings vehicle operating cost savings and emission reduction savings The benefits generated from this exercise are based solely on congestion relief related benefits However these results are conservative since there are other benefits not captured by this analysis including benefits from deploying bus rapid transit which will achieve other accessibility benefits
Project costs were developed from SCAG and Caltrans project planning and programming documents These costs include construction and support costs in current dollars The study team estimated costs for projects that did not have cost
I-210 Corridor System Management Plan Executive Summary
Page 37 of 39
estimates by reviewing similar completed projects A BC greater than one means that a scenarios projects return greater benefits than it costs to construct or implement It is important to consider the total benefits that a project brings For example a large capital expansion project can cost a great deal and have a low BC ratio but brings much higher absolute benefits to the I-210 users Exhibit ES-29 shows the benefit to cost ranges classified from low (with a BC of one to two) to very high (with a BC of over 10)
The benefit-cost results for the South Corridor scenarios are shown in Exhibit ES-29
Exhibit ES-29 I-210 Scenario BenefitCost (BC) Results
Scenario Scenario Description
BenefitCost Ranges
Low Medium Medium-High High Very High
lt1 1 to 2 2 to 5 5 to 10 gt10
12 Expand Ramp Metering 34 Advanced Ramp Metering 56 Aux Lane Striping Ramp Improvs 78 Ramp Closures
910 On-Ramp amp Aux Lane Improvs 13 SR-134I-210 IC Modification
The benefit-cost findings for each scenario are as follows
diams Scenarios 1 and 2 (ramp metering expansion) shows a high benefit-cost ratio of over ten The relatively high benefit-cost ratio is due to the low cost of expanding ramp metering ($235 million)
diams Scenarios 3 and 4 (advanced ramp metering) resulted in an incremental benefitshycost ratio of over ten This is relatively high as compared to that of typical transportation management system project
diams Scenarios 5 and 6 (operational improvements) produced a benefit-cost ratio of over five This is relatively consistent with other typical operational improvement projects The benefits are substantial At estimated total cost of about $44 million these projects produced benefits of over $233 million
diams Scenarios 7 and 8 tested the ramp closures at eastbound Marengo westbound Lake and eastbound Mount Olive These ramp closured produced an extremely high incremental benefit-cost ratio of over ten due to the relatively very low cost However this benefit-cost calculation does not account for any potential increase in delay on various local arterials because of detours from the closed ramps
diams Scenarios 9 and 10 also produced a relatively high benefit-cost ratio of over ten The four operational projects in these scenarios are collectively estimated to cost
I-210 Corridor System Management Plan Executive Summary
Page 38 of 39
under $30 million and provide a substantial and optimistic benefit of over $670 million
diams Scenario 13 tested the SR-134I-210 interchange modification This project produced a benefit-cost ratio of between one and two consistent with other typical capital expansion projects This project produced benefits of over $200 million at a rough-estimate cost of about $150 million
diams Scenario 14 tested the westbound center drop ramp from Lake Avenue interchange and eastbound lane addition from Myrtle to I-605 These projects produced a relatively high benefit-cost ratio of about 6 to one as compared to other capital improvement projects These two capital projects are unique in that they have specific operational improvement element that addresses major bottleneck locations For an estimated total combined cost of about $70 million the projected benefits exceed $420 million
CONCLUSIONS AND RECOMMENDATIONS
This section summarizes the conclusions and recommendations based on the analysis discussed in the previous section It is important to note that many of these conclusions are based primarily on the micro-simulation model results The model was developed based on the best data available at the time The study team reviewed the model results and believe that both the calibrated base year forecast year and scenario results are reasonable However Caltrans should always be cautious to make decisions based on modeling alone especially complex micro-simulation models
Based on the results the study team offers the following conclusions and recommendations
diams The combination of all scenarios significantly reduces overall congestion on the corridor Projected 2020 congestion after implementation of all scenarios is below 2006 levels in both the AM and PM peak period In the AM peak period the model projects total delay in 2020 after delivering all projects to be less than 11700 vehicle-hours compared to the 2006 base year delay of 13000 vehicleshyhours This represents a reduction of over 10 percent In the PM peak period the model projects total delay in 2020 after delivering all projects to be around 9500 hours compared to the 2006 base year delay of almost 9300 vehicle-hours This represents a slight reduction of 2 percent Clearly the scenarios deliver significant mobility benefits to the corridor Despite the growth in demand future 2020 congestion will be less than experienced in 2006
diams The completed ramp metering expansion project is expected to produce substantial mobility benefits of over $400 million Delay has been significantly reduced since 2006
I-210 Corridor System Management Plan Executive Summary
Page 39 of 39
diams Advanced ramp metering could provide additional mobility improvements by significantly reducing congestion and returning over $100 million in benefits
diams Ramp closures at Marengo Lake and Mount Olive as alternatives seem promising by reducing delay up to 3000 vehicle-hours per day and providing substantial benefits of $280 million at an extremely low cost
diams Operational improvements such as auxiliary lanes and ramp improvements could leverage on the ramp metering projects by making the corridor more efficient and productive that could result in additional mobility benefits of over $230 million
diams Additional capital improvements with specific operational elements to address weaving at major bottleneck locations could produce significant mobility benefits of over $420 million
diams Enhanced incident management system associated with Scenarios 11 and 12 to address non-recurrent congestion proved effective with a delay reduction of over 300 vehicle-hours for one modest level incident with a typical duration of 35 minutes reduced to 25 minutes With the I-210 corridor experiencing up to 2400 collisions per year this translates to a total annual delay savings of over 700000 vehicle-hours for the study corridor
diams The benefit-cost ratio of all scenarios combined is about 64 to 1 If all projects were delivered at current cost estimates the public would get over six dollars of benefits for each dollar expended In current dollars costs total to over $17 billion whereas the benefits are estimated to be over $20 billion
diams The projects also alleviate greenhouse gas (GHG) emissions by over 15 million tons over 20 years averaging over a 75000-ton reduction per year The emissions are estimated using data from the California Air Resources Board (CARB) EMFAC model
This is the first generation CSMP for the I-210 corridor It is important to stress that CSMPs should be updated on a regular basis This is particularly important since traffic conditions and patterns can differ from current projections After projects are delivered it is also useful to compare actual results with estimated ones in this document so that models can be further improved as appropriate
CSMPs or a variation thereof should become the normal course of business that is based on detailed performance assessments an in-depth understanding of the reasons for performance deterioration and an analytical framework that allows for evaluating complementary operational strategies that maximize the productivity of the current system
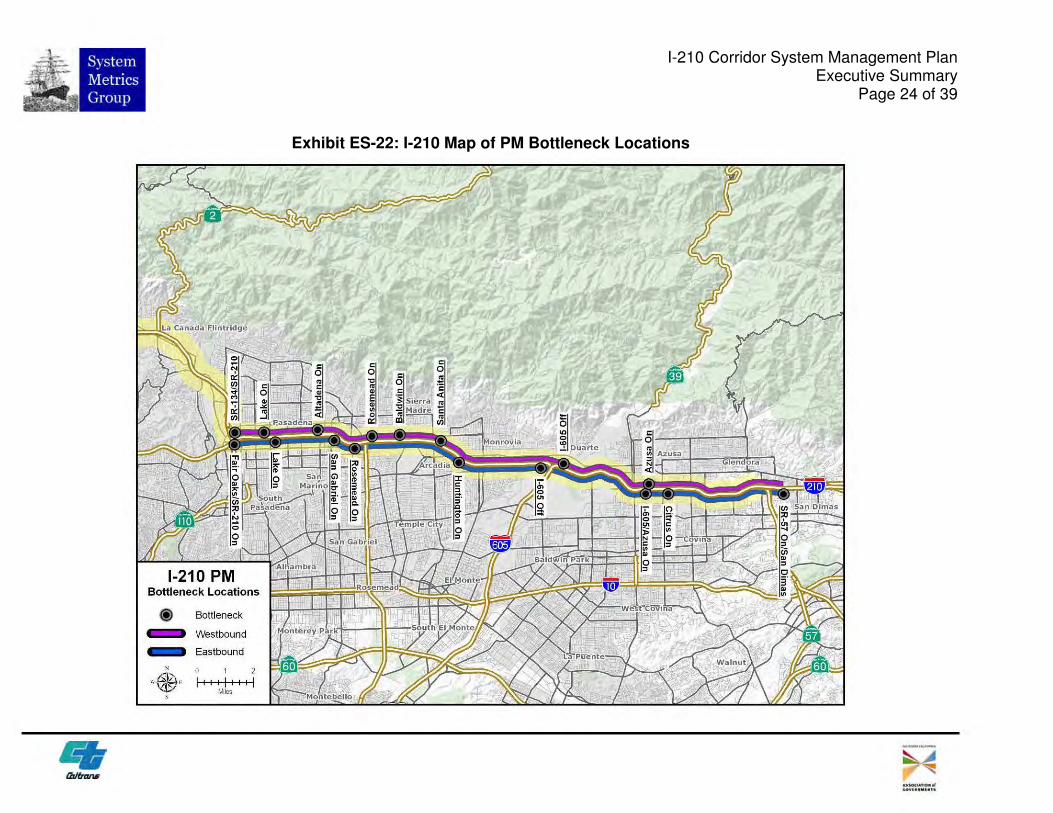
Bottleneck Locations
reg Bottleneck - Westbound - Eastbound
N 0 1 2
bull I I II II II I ll) Mles s
HJOUAIIO fl _
I-210 Corridor System Management Plan Executive Summary
Page 24 of 39
Exhibit ES-22 I-210 Map of PM Bottleneck Locations
I-210 Corridor System Management Plan Executive Summary
Page 25 of 39
SCENARIO DEVELOPMENT AND ANALYSIS
Fully understanding how a corridor performs and why it performs the way it does sets the foundation for evaluating potential solutions Several steps were required to develop and evaluate improvements including
diams Developing traffic models for 2006 base year and 2020 long-term demand diams Combining projects in a logical manner for modeling and testing diams Evaluating model outputs and summarizing results diams Conducting a benefit-cost assessment of scenarios
Traffic Model Development
The study team developed a traffic model using the VISSIM micro-simulation software It is important to note that micro-simulation models are complex to develop and calibrate for a large urban corridor However it is one of the only tools capable of providing a reasonable approximation of bottleneck formation and queue development Therefore such tools help quantify the impacts of operational strategies which traditional travel demand models cannot
The model was calibrated against 2006 conditions This was a resource intensive effort requiring several iterations of submittals and review cycles until the model reasonably matched bottleneck locations and relative severity Once calibration was approved a 2020 model was also developed based on SCAGrsquos travel demand model demand projections
These two models were used to evaluate different scenarios (combinations of projects) to quantify the associated congestion relief benefits and to compare total project costs against their benefits
Exhibit ES-23 depicts the network included in the model There were no parallel arterials modeled with the exception of arterials at interchanges All freeway interchanges were included as well as on-ramps and off-ramps
I-210 Corridor System Management Plan Executive Summary
Page 26 of 39
Exhibit ES-23 Micro-Simulation Model Network
I-210 Corridor System Management Plan Executive Summary
Page 27 of 39
Scenario Development Framework
The study team developed a framework for combining projects into scenarios It would be desirable to evaluate every possible combination of projects However this would have entailed thousands of model runs Instead the team combined projects based on a number of factors including
diams Projects that were fully constructed and completed from 2006 to 2010 were tested with both the 2006 and 2020 models
diams Short- and mid- term operational projects were grouped into scenarios and tested with the both the 2006 and 2020 models
diams Longer-range projects to be delivered by 2020 and beyond were used to develop scenarios to be tested with the 2020 model only
diams Alternative ramp closures were grouped into isolated scenarios (future scenarios did not build on top of these) and tested with both the 2006 and 2020 models
The study assumes that projects delivered before 2016 could reasonably be evaluated using the 2006 base year model The 2020 forecast year for the I-210 study was consistent with the SCAG 2020 regional travel demand model origin-destination matrices used to develop the 2008 Regional Transportation Plan (RTP) When SCAG updates its travel demand model and Regional Transportation Plan (RTP) it may wish to update the micro-simulation model with revised demand projections
Project lists used to develop scenarios were part from the Regional Transportation Improvement Program (RTIP) the RTP and other sources such as special studies Projects that do not directly affect mobility were eliminated For instance sound wall landscaping or minor arterial improvement projects were not evaluated since microshysimulation models cannot evaluate them
Scenario testing performed for the performed for the I-210 CSMP differed from traditional ldquoalternatives evaluationsrdquo done for Major Investment Studies (MIS) or Environmental Impact Reports (EIRs) An MIS or EIR focuses on identifying alternative solutions to address current or projected corridor problems so each alternative is evaluated separately and results among competing alternatives are compared resulting in a locally preferred alternative In contrast for the I-210 CSMP scenarios build on each other in that a scenario contains the projects from the previous scenario plus one or more projects as long as the incremental scenario results showed an acceptable level of performance improvement This incremental scenario evaluation approach is important since CSMPs are new and are often compared with alternatives studies
Exhibit ES-24 summarizes the approach used and scenarios tested and provides a
I-210 Corridor System Management Plan Executive Summary
Page 28 of 39
general description of the projects included in the 2006 and 2020 micro-simulation runs Most projects were tested for both the short- and long-term timeframes Each scenario tested was built upon prior scenarios except for Scenarios 7 and 8 which were ldquostand alonerdquo scenarios used to test alternative ramp closures Later scenarios build on Scenarios 5 and 6 and do not include the improvements tested in Scenarios 7 and 8 Enhanced incident management was tested in Scenarios 11 and 12 by comparing a simulated incident without and with enhanced incident management system Scenarios 13 and 14 are expected for the longer term and were tested only with the 2020 model
Exhibit ES-24 Micro-Simulation Modeling Approach
Short-Term Scenarios Long-Term Scenarios
Calibrated 2006 Base Case
Scenario 1 Expand Ramp-
Metering
Scenario 3 Scenario 1 +
Adv Ramp-Meter w
Queue Control
Scenario 5 Scenario 3 + aux lane striping and
ramp improvements
2020 Horizon Year
2006 Network 2020 OD Matrices
Scenario 7 Scenario 5 +
Ramp Closures
Scenario 2 Expand Ramp-
Metering
Scenario 4 Scenario 2 +
Adv Ramp-Meter w
Queue Control
Scenario 6 Scenario 4 + aux lane striping and
ramp improvements
Scenario 8 Scenario 6 +
Ramp Closures
Scenario 14 Scenario 13 + Lake
Ave Drop Ramp
Lane Addition
Scenario 9 Scenario 5+
On-Ramp amp Aux
lane improvements
Scenario 10 Scenario 6 +
On-Ramp amp Aux
lane improvements
Scenario 11 Incident with No
Incident
Management
Scenario 12 Incident With
Incident
Management
Scenario 13 Scenario 10 +
134210 IC
modification
Incident Management Scenarios
I-210 Corridor System Management Plan Executive Summary
Page 29 of 39
Scenario Evaluation Results
Exhibits ES-25 and ES-26 show the delay results for all the 2006 scenarios evaluated for the AM and PM peak periods respectively Exhibits ES-27 and ES-28 show the delay results for all the 2020 scenarios evaluated for the AM and PM peak periods respectively For each scenario the modeling team produced results by facility type (ie mainline HOV arterials and ramps) and vehicle type (SOV HOV trucks) as well as speed contour diagrams (discussed in more detail in the full technical CSMP) The study team scrutinized to ensure that they were consistent with general traffic engineering principles The following summarizes the findings related to the four exhibits
Exhibit ES-25 2006 AM Peak Micro-Simulation Delay Results by Scenario
De
lay
(Pe
ak
Pe
rio
d V
eh
icle
-Ho
urs
)
2006 Base Year S1 S3 S5 S7 S9 Scenario
18000
16000
14000
12000
10000
8000
6000
4000
2000
-
S1 Expand Ramp Metering
S3 Adv Ramp Metering
S5 Aux Lane Striping Ramp Improvs
S7 Ramp Closures
S9 On-Ramp amp Aux Lane Improvs
-2 -3 -3
-16 -20
HOV WB I-210 WB
HOV EB I-210 EB
Ramps Arterials
I-210 Corridor System Management Plan Executive Summary
Page 30 of 39
Exhibit ES-26 2006 PM Peak Micro-Simulation Delay Results by Scenario
18000
De
lay
(Pe
ak
Pe
rio
d V
eh
icle
-Ho
urs
)
16000
14000
12000
10000
8000
6000
4000
2000
-
S1 Expand Ramp Metering
S3 Adv Ramp Metering
HOV WB
I-210 WB
S5 Aux Lane Striping Ramp Improvs
S7 Ramp Closures
S9 On-Ramp amp Aux Lane Improvs
HOV EB
I-210 EB
Ramps
Arterials
-17
-11
-18
-18 -28
2006 Base Year S1 S3 S5 S7 S9 Scenario
Exhibit ES-27 2020 AM Peak Micro-Simulation Delay Results by Scenario
30000
De
lay
(Pe
ak
Pe
rio
d V
eh
icle
-Ho
urs
)
25000
20000
15000
10000
5000
S2 Expand Ramp Metering
S4 Adv Ramp Metering
S6 Aux Lane Striping Ramp Improvs
S8 Ramp Closures
HOV WB
I-210 WB
HOV EB
-8
-2 -8
-13 -12
S10 On-Ramp amp Aux Lane Improvs
S13 SR-134I-210 IC Modification
S14 Lake Ave Drop Ramp Lane Addition
I-210 EB
Ramps
Arterials
-11
-23
-
2020 S2 S4 S6 S8 S10 S13 S14 Horizon Scenario
I-210 Corridor System Management Plan Executive Summary
Page 31 of 39
Exhibit ES-28 2020 PM Peak Micro-Simulation Delay Results by Scenario D
ela
y(P
ea
k P
eri
od
Ve
hic
le-H
ou
rs)
30000
25000
20000
15000
10000
5000
-
S2 Expand Ramp Metering
S4 Adv Ramp Metering
S6 Aux Lane Striping Ramp Improvs
S8 Ramp Closures
HOV WB
I-210 WB
HOV EB
-14
S10 On-Ramp amp Aux Lane Improvs
S13 SR-134I-210 IC Modification
S14 Lake Ave Drop Ramp Lane Addition
I-210 EB
Ramps
Arterials
-2 -5 -3 -28
-3 -19
2020 S2 S4 S6 S8 S10 S13 S14 Horizon Scenario
Base Year and Do Minimum Horizon Year
Absent any physical improvements the modeling team estimates that by 2020 total delay (mainline HOV ramps and arterials) would double compared to 2006 (from a total of around 22000 vehicle-hours daily to just fewer than 45000 vehicle-hours) in the combined AM and PM peak
Scenarios 1 and 2 (Expand Ramp Metering)
Scenarios 1 and 2 test the only project on the corridor that was fully constructed and completed The project installed new connector metering at the SR-57 and I-605 to Ishy210 freeway connector ramps The project also widened various ramps removed various HOV meter bypasses and upgraded the ramp metering system
The 2006 model estimates that Scenario 1 would reduce delay on the corridor by around 17 percent (or 1600 daily vehicle-hours) in the PM peak period but only around two percent (or 200 vehicle-hours) in the AM peak period The biggest benefits occur in the PM eastbound direction from Rosemead On-Ramp to Huntington interchange (with a delay reduction of over 1000 vehicle-hours) as well as from I-605 to the Azusa On-Ramp (delay reduction of 500 vehicle-hours) for single occupant vehicles The
I-210 Corridor System Management Plan Executive Summary
Page 32 of 39
westbound reductions in freeway delay are largely offset by increased on-ramp delay mostly from new connector metering at SR-57 and I-605
The 2020 model estimates that Scenario 2 will reduce delay by around 8 percent in the AM peak and 14 percent in the PM peak for a combined total reduction of 5000 daily vehicle-hours The long-term improvements are less than the short-term improvements due to the increase in demand
Scenarios 3 and 4 (Advanced Ramp Metering)
Scenarios 3 and 4 build on Scenarios 1 and 2 by adding advanced ramp metering system such as dynamic or adaptive ramp metering system
The 2006 model shows that Scenario 3 would reduce delay by an additional 850 daily vehicle-hours (or 11 percent) in the PM peak with a marginal reduction in the AM peak period However in conjunction with Scenario 1 Scenario 3 reduces delay in total by over 600 vehicle-hours in the AM peak These results suggest that queue control provides additional benefits beyond SWARM
The 2020 model estimates that Scenario 4 will modestly reduce delay by about 2 percent in both the AM and PM peaks or a combined total of 800 daily vehicle-hours Again the benefits are lower in percentage terms due to the increase in demand
Note that there are various types of advanced ramp metering systems deployed around the world including System-wide Adaptive Ramp Metering System or SWARM tested recently in Los Angeles I-210 freeway corridor For the I-210 model the Asservissement Lineaire drsquoEntreacutee Autoroutiere (ALINEA system) was tested as proxy for any advanced ramp metering system as its algorithm for the model was readily available It is not necessarily recommended that ALINEA be deployed but rather some type of advanced ramp metering system that would produce similar if not better results
Scenarios 5 and 6 (Auxiliary Lane Striping Ramp Improvements)
Scenarios 5 and 6 build on Scenarios 3 and 4 that include several relatively lower-cost operational improvements that could be implemented by 2015
diams Building a westbound auxiliary lane from Santa Anita to Baldwin and an eastbound auxiliary lane from Santa Anita to Huntington
diams Extending a lane to Lincoln on the westbound I-210 connector
diams Connecting and converging the Altadena on-ramps into a single on-ramp
I-210 Corridor System Management Plan Executive Summary
Page 33 of 39
diams Connecting and converging the Santa Anita on-ramps into a single on-ramp
diams Connecting and converging the Irwindale on-ramps into a single on-ramp
diams Restriping to add a lane in the eastbound direction from San Dimas to Fruit
The 2006 model shows that Scenario 5 reduces delay by 3 percent (nearly 400 vehicleshyhours) in the AM peak and 18 percent (1200 vehicle-hours) in the PM peak The segment that experienced the largest improvement in the eastbound during the PM peak was from Rosemead to Huntington This segment experienced a 45 percent improvement in delay (from 2700 vehicle-hours to 1500 vehicle-hours) which is likely attributed to the eastbound auxiliary lane from Santa Anita to Huntington In the westbound direction the auxiliary lane from Santa Anita to Baldwin shifts some traffic downstream to cause increased congestion at Michillinda (ie bottleneck shift) during the westbound AM peak However the auxiliary lane helps reduce both queue length and queue duration for the Santa Anita bottleneck
The 2020 model estimates that Scenario 6 would reduce delay by 8 percent in the AM peak and 5 percent in the PM peak for a total reduction of 2500 daily vehicle-hours A reduction in PM delay is expected to occur mostly in the westbound direction
Scenarios 7 and 8 (Ramp Closures)
Scenarios 7 and 8 build on Scenarios 5 and 6 and test the closure of several ramps
diams Eastbound Marengo on-ramp and westbound Lake on-ramp with signalization of the eastbound I-210 off-ramp at Maple and improvement to alternate routes along Corson and Maple
diams Eastbound Mount Olive ramps
Note that subsequent scenarios are not built on top of these scenarios as these are isolated to test ramp closure alternatives
The 2006 model shows that Scenario 7 would reduce delay significantly by 16 percent in the AM peak and 18 percent in the PM peak for a total delay reduction of nearly 3000 daily vehicle-hours The delay reductions are significant on the mainline during the peak direction of travel ndash 1400 vehicle-hours in the westbound AM and 912 vehicleshyhours in the eastbound PM In the westbound direction and AM peak period the segment from Altadena to Lake experienced over an 85 percent decrease in congestion (from 860 to 120 vehicle-hours of delay) This is likely attributed to the closure of the westbound Lake on-ramp In the eastbound direction and PM peak period the segment from Huntington to I-605 experienced a delay reduction of over 70 percent (from 2200
I-210 Corridor System Management Plan Executive Summary
Page 34 of 39
vehicle-hours to 600 vehicle-hours) which is likely attributed to the closure of the Mount Olive ramp
The 2020 model also shows that Scenario 8 improved delay by 12 percent in the AM and 3 percent in the PM for a total delay reduction of almost 3000 daily vehicle-hours On the mainline facility delay also improved for each peak direction of travel ndash by 1600 daily vehicle-hours in the westbound AM and by 750 vehicle-hours in the eastbound PM Delay reductions in the non-peak direction were not as significant
Scenarios 9 and 10 (On-ramp and Aux Lane Improvements)
Scenarios 9 and 10 build on Scenarios 5 and 6 and test four operational improvements that can be implemented in the short to medium range
diams Modify the RosemeadMichillinda interchange and converge the westbound I-210 on-ramps
diams Modify the northside of the Baldwin interchange and eliminate the collectorshydistributor
diams Construct an eastbound auxiliary lane from Azusa to Citrus
diams Converge the eastbound Citrus on-ramps and add an auxiliary lane to Grand
The 2006 model estimates that Scenario 9 will reduce delay by 20 percent (or 2400 daily vehicle-hours) in the AM peak and 28 percent (or 1600 daily vehicle-hours) in the PM peak compared to Scenario 5 In both AM and PM peak period the eastbound direction experienced the largest reduction in delay
The 2020 model estimates that Scenario 10 will reduce delay by 13 percent (or 2500 vehicle-hours) in the AM peak and 28 percent in the PM peak (or 4800 vehicle-hours) compared to Scenario 6 Similar to the 2006 model the 2020 model shows that these improvements produced a greater reduction in delay in the eastbound direction than the westbound direction
Scenarios 11 and 12 (Enhanced Incident Management)
Two incident scenarios were tested on top of Scenario 10 to evaluate the non-recurrent delay reductions resulting from enhanced incident management strategies An enhanced incident management system would entail upgrading or enhancing the current Caltrans incident management system that includes deployment of intelligent transportation system (ITS) field devices central controlcommunications software communications medium (ie fiber optic lines) advanced traveler information system
I-210 Corridor System Management Plan Executive Summary
Page 35 of 39
andor freeway service patrol (FSP) program to reduce incident detection verification response and clearance times
In the first scenario Scenario 11 one collision incident with one lane closure was simulated in the westbound direction in the AM peak period model and one in the eastbound direction in the PM peak period model The incident simulation location and duration were selected based on review of the 2010 actual incident data at one of the high frequency locations The following are the Scenario details
diams Westbound AM peak period starting at 800 AM close mainline lane 2 for 40 minutes at absolute post mile 2612 (at Lake Avenue)
diams Eastbound PM peak period starting at 500 PM close mainline lane 2 for 50 minutes at absolute post mile 3207 (west of Santa Anita)
In the second scenario Scenario 12 the same collision incidents were simulated with a reduction in duration by 10 minutes in the westbound direction and by 12 minutes in the eastbound direction It is estimated based on actual incident management data analysis results provided by Caltrans that an enhanced incident management system could reduce a 35-minute incident by about 10 minutes This scenario represents a typical moderate level incident at one location during the peak period direction Data suggest that incidents vary significantly in terms of impact and duration Some incidents last hundreds of minutes some close multiple lanes and some occur at multiple locations simultaneously There are also numerous minor incidents lasting only a few minutes without lane closures that can result in congestion Many other incidents also occur during off-peak hours
Without enhanced incident management Scenario 11 produced an 8 percent increase in congestion in both peak periods over Scenario 10 an increase of over 2300 hours of vehicle delay With enhanced incident management Scenario 12 evaluation resulted in delay decrease by 2 percent in the AM peak and 3 percent in the PM peak against Scenario 11 results a reduction of nearly 750 vehicle-hours for improving the incident detection verification response and clearance time of one moderate level incident for both of the peak hours
Scenario 13 (SR-134I-210 Interchange Modification)
Scenario 13 tests an improvement to modify the SR-134I-210 interchange to provide a direct connection for vehicles to continue on I-210 with three lanes in each direction This improvement was tested with the 2020 model since it is not likely to be implemented in the short-term
I-210 Corridor System Management Plan Executive Summary
Page 36 of 39
The 2020 model estimates that delay would be reduced by 11 percent (or 1800 daily vehicle-hours) in the AM and 3 percent in the PM (320 daily vehicle-hours) compared to Scenario 10 The westbound mainline experienced the greatest reduction in delay in the AM peak from 9600 vehicle-hours to 8600 vehicle hours after the interchange modification
Scenario 14 (Westbound Drop Ramp and Eastbound Widening)
Scenario 14 builds on Scenario 13 and tests Lake Avenue drop ramp to westbound Ishy210 center lanes (one HOV lane and one mainline) and eastbound I-210 widening from Myrtle to I-605 This improvement was tested with the 2020 model
The 2020 model estimates that delay would be reduced by about 20 percent in the AM or 3400 vehicle-hours and 20 percent in the PM or 2300 vehicle-hours compared to Scenario 13 The mobility improvements are significant with the westbound drop ramp that reduces weaving between SR-134 and SR-210 destined traffic and with the eastbound capacity addition to I-605 off that moves the off-ramp traffic away from the mainline and provides more room for the mainline through traffic
Post Scenario 14 Conditions
By 2020 with the inclusion of all the projects tested the model reveals some residual congestion that remains to address with future improvements According to the model results the total remaining delay on the corridor is around 21000 daily vehicle-hours
Benefit-Cost Analysis
Following an in-depth review of model results by the study team and the SCAG technical committee the study team performed a benefit-cost analysis (BCA) for each scenario
Using the California Benefit-Cost Model (Cal-BC) developed on behalf of Caltrans by the study team benefits in three key areas were estimated travel time savings vehicle operating cost savings and emission reduction savings The benefits generated from this exercise are based solely on congestion relief related benefits However these results are conservative since there are other benefits not captured by this analysis including benefits from deploying bus rapid transit which will achieve other accessibility benefits
Project costs were developed from SCAG and Caltrans project planning and programming documents These costs include construction and support costs in current dollars The study team estimated costs for projects that did not have cost
I-210 Corridor System Management Plan Executive Summary
Page 37 of 39
estimates by reviewing similar completed projects A BC greater than one means that a scenarios projects return greater benefits than it costs to construct or implement It is important to consider the total benefits that a project brings For example a large capital expansion project can cost a great deal and have a low BC ratio but brings much higher absolute benefits to the I-210 users Exhibit ES-29 shows the benefit to cost ranges classified from low (with a BC of one to two) to very high (with a BC of over 10)
The benefit-cost results for the South Corridor scenarios are shown in Exhibit ES-29
Exhibit ES-29 I-210 Scenario BenefitCost (BC) Results
Scenario Scenario Description
BenefitCost Ranges
Low Medium Medium-High High Very High
lt1 1 to 2 2 to 5 5 to 10 gt10
12 Expand Ramp Metering 34 Advanced Ramp Metering 56 Aux Lane Striping Ramp Improvs 78 Ramp Closures
910 On-Ramp amp Aux Lane Improvs 13 SR-134I-210 IC Modification
The benefit-cost findings for each scenario are as follows
diams Scenarios 1 and 2 (ramp metering expansion) shows a high benefit-cost ratio of over ten The relatively high benefit-cost ratio is due to the low cost of expanding ramp metering ($235 million)
diams Scenarios 3 and 4 (advanced ramp metering) resulted in an incremental benefitshycost ratio of over ten This is relatively high as compared to that of typical transportation management system project
diams Scenarios 5 and 6 (operational improvements) produced a benefit-cost ratio of over five This is relatively consistent with other typical operational improvement projects The benefits are substantial At estimated total cost of about $44 million these projects produced benefits of over $233 million
diams Scenarios 7 and 8 tested the ramp closures at eastbound Marengo westbound Lake and eastbound Mount Olive These ramp closured produced an extremely high incremental benefit-cost ratio of over ten due to the relatively very low cost However this benefit-cost calculation does not account for any potential increase in delay on various local arterials because of detours from the closed ramps
diams Scenarios 9 and 10 also produced a relatively high benefit-cost ratio of over ten The four operational projects in these scenarios are collectively estimated to cost
I-210 Corridor System Management Plan Executive Summary
Page 38 of 39
under $30 million and provide a substantial and optimistic benefit of over $670 million
diams Scenario 13 tested the SR-134I-210 interchange modification This project produced a benefit-cost ratio of between one and two consistent with other typical capital expansion projects This project produced benefits of over $200 million at a rough-estimate cost of about $150 million
diams Scenario 14 tested the westbound center drop ramp from Lake Avenue interchange and eastbound lane addition from Myrtle to I-605 These projects produced a relatively high benefit-cost ratio of about 6 to one as compared to other capital improvement projects These two capital projects are unique in that they have specific operational improvement element that addresses major bottleneck locations For an estimated total combined cost of about $70 million the projected benefits exceed $420 million
CONCLUSIONS AND RECOMMENDATIONS
This section summarizes the conclusions and recommendations based on the analysis discussed in the previous section It is important to note that many of these conclusions are based primarily on the micro-simulation model results The model was developed based on the best data available at the time The study team reviewed the model results and believe that both the calibrated base year forecast year and scenario results are reasonable However Caltrans should always be cautious to make decisions based on modeling alone especially complex micro-simulation models
Based on the results the study team offers the following conclusions and recommendations
diams The combination of all scenarios significantly reduces overall congestion on the corridor Projected 2020 congestion after implementation of all scenarios is below 2006 levels in both the AM and PM peak period In the AM peak period the model projects total delay in 2020 after delivering all projects to be less than 11700 vehicle-hours compared to the 2006 base year delay of 13000 vehicleshyhours This represents a reduction of over 10 percent In the PM peak period the model projects total delay in 2020 after delivering all projects to be around 9500 hours compared to the 2006 base year delay of almost 9300 vehicle-hours This represents a slight reduction of 2 percent Clearly the scenarios deliver significant mobility benefits to the corridor Despite the growth in demand future 2020 congestion will be less than experienced in 2006
diams The completed ramp metering expansion project is expected to produce substantial mobility benefits of over $400 million Delay has been significantly reduced since 2006
I-210 Corridor System Management Plan Executive Summary
Page 39 of 39
diams Advanced ramp metering could provide additional mobility improvements by significantly reducing congestion and returning over $100 million in benefits
diams Ramp closures at Marengo Lake and Mount Olive as alternatives seem promising by reducing delay up to 3000 vehicle-hours per day and providing substantial benefits of $280 million at an extremely low cost
diams Operational improvements such as auxiliary lanes and ramp improvements could leverage on the ramp metering projects by making the corridor more efficient and productive that could result in additional mobility benefits of over $230 million
diams Additional capital improvements with specific operational elements to address weaving at major bottleneck locations could produce significant mobility benefits of over $420 million
diams Enhanced incident management system associated with Scenarios 11 and 12 to address non-recurrent congestion proved effective with a delay reduction of over 300 vehicle-hours for one modest level incident with a typical duration of 35 minutes reduced to 25 minutes With the I-210 corridor experiencing up to 2400 collisions per year this translates to a total annual delay savings of over 700000 vehicle-hours for the study corridor
diams The benefit-cost ratio of all scenarios combined is about 64 to 1 If all projects were delivered at current cost estimates the public would get over six dollars of benefits for each dollar expended In current dollars costs total to over $17 billion whereas the benefits are estimated to be over $20 billion
diams The projects also alleviate greenhouse gas (GHG) emissions by over 15 million tons over 20 years averaging over a 75000-ton reduction per year The emissions are estimated using data from the California Air Resources Board (CARB) EMFAC model
This is the first generation CSMP for the I-210 corridor It is important to stress that CSMPs should be updated on a regular basis This is particularly important since traffic conditions and patterns can differ from current projections After projects are delivered it is also useful to compare actual results with estimated ones in this document so that models can be further improved as appropriate
CSMPs or a variation thereof should become the normal course of business that is based on detailed performance assessments an in-depth understanding of the reasons for performance deterioration and an analytical framework that allows for evaluating complementary operational strategies that maximize the productivity of the current system

I-210 Corridor System Management Plan Executive Summary
Page 25 of 39
SCENARIO DEVELOPMENT AND ANALYSIS
Fully understanding how a corridor performs and why it performs the way it does sets the foundation for evaluating potential solutions Several steps were required to develop and evaluate improvements including
diams Developing traffic models for 2006 base year and 2020 long-term demand diams Combining projects in a logical manner for modeling and testing diams Evaluating model outputs and summarizing results diams Conducting a benefit-cost assessment of scenarios
Traffic Model Development
The study team developed a traffic model using the VISSIM micro-simulation software It is important to note that micro-simulation models are complex to develop and calibrate for a large urban corridor However it is one of the only tools capable of providing a reasonable approximation of bottleneck formation and queue development Therefore such tools help quantify the impacts of operational strategies which traditional travel demand models cannot
The model was calibrated against 2006 conditions This was a resource intensive effort requiring several iterations of submittals and review cycles until the model reasonably matched bottleneck locations and relative severity Once calibration was approved a 2020 model was also developed based on SCAGrsquos travel demand model demand projections
These two models were used to evaluate different scenarios (combinations of projects) to quantify the associated congestion relief benefits and to compare total project costs against their benefits
Exhibit ES-23 depicts the network included in the model There were no parallel arterials modeled with the exception of arterials at interchanges All freeway interchanges were included as well as on-ramps and off-ramps
I-210 Corridor System Management Plan Executive Summary
Page 26 of 39
Exhibit ES-23 Micro-Simulation Model Network
I-210 Corridor System Management Plan Executive Summary
Page 27 of 39
Scenario Development Framework
The study team developed a framework for combining projects into scenarios It would be desirable to evaluate every possible combination of projects However this would have entailed thousands of model runs Instead the team combined projects based on a number of factors including
diams Projects that were fully constructed and completed from 2006 to 2010 were tested with both the 2006 and 2020 models
diams Short- and mid- term operational projects were grouped into scenarios and tested with the both the 2006 and 2020 models
diams Longer-range projects to be delivered by 2020 and beyond were used to develop scenarios to be tested with the 2020 model only
diams Alternative ramp closures were grouped into isolated scenarios (future scenarios did not build on top of these) and tested with both the 2006 and 2020 models
The study assumes that projects delivered before 2016 could reasonably be evaluated using the 2006 base year model The 2020 forecast year for the I-210 study was consistent with the SCAG 2020 regional travel demand model origin-destination matrices used to develop the 2008 Regional Transportation Plan (RTP) When SCAG updates its travel demand model and Regional Transportation Plan (RTP) it may wish to update the micro-simulation model with revised demand projections
Project lists used to develop scenarios were part from the Regional Transportation Improvement Program (RTIP) the RTP and other sources such as special studies Projects that do not directly affect mobility were eliminated For instance sound wall landscaping or minor arterial improvement projects were not evaluated since microshysimulation models cannot evaluate them
Scenario testing performed for the performed for the I-210 CSMP differed from traditional ldquoalternatives evaluationsrdquo done for Major Investment Studies (MIS) or Environmental Impact Reports (EIRs) An MIS or EIR focuses on identifying alternative solutions to address current or projected corridor problems so each alternative is evaluated separately and results among competing alternatives are compared resulting in a locally preferred alternative In contrast for the I-210 CSMP scenarios build on each other in that a scenario contains the projects from the previous scenario plus one or more projects as long as the incremental scenario results showed an acceptable level of performance improvement This incremental scenario evaluation approach is important since CSMPs are new and are often compared with alternatives studies
Exhibit ES-24 summarizes the approach used and scenarios tested and provides a
I-210 Corridor System Management Plan Executive Summary
Page 28 of 39
general description of the projects included in the 2006 and 2020 micro-simulation runs Most projects were tested for both the short- and long-term timeframes Each scenario tested was built upon prior scenarios except for Scenarios 7 and 8 which were ldquostand alonerdquo scenarios used to test alternative ramp closures Later scenarios build on Scenarios 5 and 6 and do not include the improvements tested in Scenarios 7 and 8 Enhanced incident management was tested in Scenarios 11 and 12 by comparing a simulated incident without and with enhanced incident management system Scenarios 13 and 14 are expected for the longer term and were tested only with the 2020 model
Exhibit ES-24 Micro-Simulation Modeling Approach
Short-Term Scenarios Long-Term Scenarios
Calibrated 2006 Base Case
Scenario 1 Expand Ramp-
Metering
Scenario 3 Scenario 1 +
Adv Ramp-Meter w
Queue Control
Scenario 5 Scenario 3 + aux lane striping and
ramp improvements
2020 Horizon Year
2006 Network 2020 OD Matrices
Scenario 7 Scenario 5 +
Ramp Closures
Scenario 2 Expand Ramp-
Metering
Scenario 4 Scenario 2 +
Adv Ramp-Meter w
Queue Control
Scenario 6 Scenario 4 + aux lane striping and
ramp improvements
Scenario 8 Scenario 6 +
Ramp Closures
Scenario 14 Scenario 13 + Lake
Ave Drop Ramp
Lane Addition
Scenario 9 Scenario 5+
On-Ramp amp Aux
lane improvements
Scenario 10 Scenario 6 +
On-Ramp amp Aux
lane improvements
Scenario 11 Incident with No
Incident
Management
Scenario 12 Incident With
Incident
Management
Scenario 13 Scenario 10 +
134210 IC
modification
Incident Management Scenarios
I-210 Corridor System Management Plan Executive Summary
Page 29 of 39
Scenario Evaluation Results
Exhibits ES-25 and ES-26 show the delay results for all the 2006 scenarios evaluated for the AM and PM peak periods respectively Exhibits ES-27 and ES-28 show the delay results for all the 2020 scenarios evaluated for the AM and PM peak periods respectively For each scenario the modeling team produced results by facility type (ie mainline HOV arterials and ramps) and vehicle type (SOV HOV trucks) as well as speed contour diagrams (discussed in more detail in the full technical CSMP) The study team scrutinized to ensure that they were consistent with general traffic engineering principles The following summarizes the findings related to the four exhibits
Exhibit ES-25 2006 AM Peak Micro-Simulation Delay Results by Scenario
De
lay
(Pe
ak
Pe
rio
d V
eh
icle
-Ho
urs
)
2006 Base Year S1 S3 S5 S7 S9 Scenario
18000
16000
14000
12000
10000
8000
6000
4000
2000
-
S1 Expand Ramp Metering
S3 Adv Ramp Metering
S5 Aux Lane Striping Ramp Improvs
S7 Ramp Closures
S9 On-Ramp amp Aux Lane Improvs
-2 -3 -3
-16 -20
HOV WB I-210 WB
HOV EB I-210 EB
Ramps Arterials
I-210 Corridor System Management Plan Executive Summary
Page 30 of 39
Exhibit ES-26 2006 PM Peak Micro-Simulation Delay Results by Scenario
18000
De
lay
(Pe
ak
Pe
rio
d V
eh
icle
-Ho
urs
)
16000
14000
12000
10000
8000
6000
4000
2000
-
S1 Expand Ramp Metering
S3 Adv Ramp Metering
HOV WB
I-210 WB
S5 Aux Lane Striping Ramp Improvs
S7 Ramp Closures
S9 On-Ramp amp Aux Lane Improvs
HOV EB
I-210 EB
Ramps
Arterials
-17
-11
-18
-18 -28
2006 Base Year S1 S3 S5 S7 S9 Scenario
Exhibit ES-27 2020 AM Peak Micro-Simulation Delay Results by Scenario
30000
De
lay
(Pe
ak
Pe
rio
d V
eh
icle
-Ho
urs
)
25000
20000
15000
10000
5000
S2 Expand Ramp Metering
S4 Adv Ramp Metering
S6 Aux Lane Striping Ramp Improvs
S8 Ramp Closures
HOV WB
I-210 WB
HOV EB
-8
-2 -8
-13 -12
S10 On-Ramp amp Aux Lane Improvs
S13 SR-134I-210 IC Modification
S14 Lake Ave Drop Ramp Lane Addition
I-210 EB
Ramps
Arterials
-11
-23
-
2020 S2 S4 S6 S8 S10 S13 S14 Horizon Scenario
I-210 Corridor System Management Plan Executive Summary
Page 31 of 39
Exhibit ES-28 2020 PM Peak Micro-Simulation Delay Results by Scenario D
ela
y(P
ea
k P
eri
od
Ve
hic
le-H
ou
rs)
30000
25000
20000
15000
10000
5000
-
S2 Expand Ramp Metering
S4 Adv Ramp Metering
S6 Aux Lane Striping Ramp Improvs
S8 Ramp Closures
HOV WB
I-210 WB
HOV EB
-14
S10 On-Ramp amp Aux Lane Improvs
S13 SR-134I-210 IC Modification
S14 Lake Ave Drop Ramp Lane Addition
I-210 EB
Ramps
Arterials
-2 -5 -3 -28
-3 -19
2020 S2 S4 S6 S8 S10 S13 S14 Horizon Scenario
Base Year and Do Minimum Horizon Year
Absent any physical improvements the modeling team estimates that by 2020 total delay (mainline HOV ramps and arterials) would double compared to 2006 (from a total of around 22000 vehicle-hours daily to just fewer than 45000 vehicle-hours) in the combined AM and PM peak
Scenarios 1 and 2 (Expand Ramp Metering)
Scenarios 1 and 2 test the only project on the corridor that was fully constructed and completed The project installed new connector metering at the SR-57 and I-605 to Ishy210 freeway connector ramps The project also widened various ramps removed various HOV meter bypasses and upgraded the ramp metering system
The 2006 model estimates that Scenario 1 would reduce delay on the corridor by around 17 percent (or 1600 daily vehicle-hours) in the PM peak period but only around two percent (or 200 vehicle-hours) in the AM peak period The biggest benefits occur in the PM eastbound direction from Rosemead On-Ramp to Huntington interchange (with a delay reduction of over 1000 vehicle-hours) as well as from I-605 to the Azusa On-Ramp (delay reduction of 500 vehicle-hours) for single occupant vehicles The
I-210 Corridor System Management Plan Executive Summary
Page 32 of 39
westbound reductions in freeway delay are largely offset by increased on-ramp delay mostly from new connector metering at SR-57 and I-605
The 2020 model estimates that Scenario 2 will reduce delay by around 8 percent in the AM peak and 14 percent in the PM peak for a combined total reduction of 5000 daily vehicle-hours The long-term improvements are less than the short-term improvements due to the increase in demand
Scenarios 3 and 4 (Advanced Ramp Metering)
Scenarios 3 and 4 build on Scenarios 1 and 2 by adding advanced ramp metering system such as dynamic or adaptive ramp metering system
The 2006 model shows that Scenario 3 would reduce delay by an additional 850 daily vehicle-hours (or 11 percent) in the PM peak with a marginal reduction in the AM peak period However in conjunction with Scenario 1 Scenario 3 reduces delay in total by over 600 vehicle-hours in the AM peak These results suggest that queue control provides additional benefits beyond SWARM
The 2020 model estimates that Scenario 4 will modestly reduce delay by about 2 percent in both the AM and PM peaks or a combined total of 800 daily vehicle-hours Again the benefits are lower in percentage terms due to the increase in demand
Note that there are various types of advanced ramp metering systems deployed around the world including System-wide Adaptive Ramp Metering System or SWARM tested recently in Los Angeles I-210 freeway corridor For the I-210 model the Asservissement Lineaire drsquoEntreacutee Autoroutiere (ALINEA system) was tested as proxy for any advanced ramp metering system as its algorithm for the model was readily available It is not necessarily recommended that ALINEA be deployed but rather some type of advanced ramp metering system that would produce similar if not better results
Scenarios 5 and 6 (Auxiliary Lane Striping Ramp Improvements)
Scenarios 5 and 6 build on Scenarios 3 and 4 that include several relatively lower-cost operational improvements that could be implemented by 2015
diams Building a westbound auxiliary lane from Santa Anita to Baldwin and an eastbound auxiliary lane from Santa Anita to Huntington
diams Extending a lane to Lincoln on the westbound I-210 connector
diams Connecting and converging the Altadena on-ramps into a single on-ramp
I-210 Corridor System Management Plan Executive Summary
Page 33 of 39
diams Connecting and converging the Santa Anita on-ramps into a single on-ramp
diams Connecting and converging the Irwindale on-ramps into a single on-ramp
diams Restriping to add a lane in the eastbound direction from San Dimas to Fruit
The 2006 model shows that Scenario 5 reduces delay by 3 percent (nearly 400 vehicleshyhours) in the AM peak and 18 percent (1200 vehicle-hours) in the PM peak The segment that experienced the largest improvement in the eastbound during the PM peak was from Rosemead to Huntington This segment experienced a 45 percent improvement in delay (from 2700 vehicle-hours to 1500 vehicle-hours) which is likely attributed to the eastbound auxiliary lane from Santa Anita to Huntington In the westbound direction the auxiliary lane from Santa Anita to Baldwin shifts some traffic downstream to cause increased congestion at Michillinda (ie bottleneck shift) during the westbound AM peak However the auxiliary lane helps reduce both queue length and queue duration for the Santa Anita bottleneck
The 2020 model estimates that Scenario 6 would reduce delay by 8 percent in the AM peak and 5 percent in the PM peak for a total reduction of 2500 daily vehicle-hours A reduction in PM delay is expected to occur mostly in the westbound direction
Scenarios 7 and 8 (Ramp Closures)
Scenarios 7 and 8 build on Scenarios 5 and 6 and test the closure of several ramps
diams Eastbound Marengo on-ramp and westbound Lake on-ramp with signalization of the eastbound I-210 off-ramp at Maple and improvement to alternate routes along Corson and Maple
diams Eastbound Mount Olive ramps
Note that subsequent scenarios are not built on top of these scenarios as these are isolated to test ramp closure alternatives
The 2006 model shows that Scenario 7 would reduce delay significantly by 16 percent in the AM peak and 18 percent in the PM peak for a total delay reduction of nearly 3000 daily vehicle-hours The delay reductions are significant on the mainline during the peak direction of travel ndash 1400 vehicle-hours in the westbound AM and 912 vehicleshyhours in the eastbound PM In the westbound direction and AM peak period the segment from Altadena to Lake experienced over an 85 percent decrease in congestion (from 860 to 120 vehicle-hours of delay) This is likely attributed to the closure of the westbound Lake on-ramp In the eastbound direction and PM peak period the segment from Huntington to I-605 experienced a delay reduction of over 70 percent (from 2200
I-210 Corridor System Management Plan Executive Summary
Page 34 of 39
vehicle-hours to 600 vehicle-hours) which is likely attributed to the closure of the Mount Olive ramp
The 2020 model also shows that Scenario 8 improved delay by 12 percent in the AM and 3 percent in the PM for a total delay reduction of almost 3000 daily vehicle-hours On the mainline facility delay also improved for each peak direction of travel ndash by 1600 daily vehicle-hours in the westbound AM and by 750 vehicle-hours in the eastbound PM Delay reductions in the non-peak direction were not as significant
Scenarios 9 and 10 (On-ramp and Aux Lane Improvements)
Scenarios 9 and 10 build on Scenarios 5 and 6 and test four operational improvements that can be implemented in the short to medium range
diams Modify the RosemeadMichillinda interchange and converge the westbound I-210 on-ramps
diams Modify the northside of the Baldwin interchange and eliminate the collectorshydistributor
diams Construct an eastbound auxiliary lane from Azusa to Citrus
diams Converge the eastbound Citrus on-ramps and add an auxiliary lane to Grand
The 2006 model estimates that Scenario 9 will reduce delay by 20 percent (or 2400 daily vehicle-hours) in the AM peak and 28 percent (or 1600 daily vehicle-hours) in the PM peak compared to Scenario 5 In both AM and PM peak period the eastbound direction experienced the largest reduction in delay
The 2020 model estimates that Scenario 10 will reduce delay by 13 percent (or 2500 vehicle-hours) in the AM peak and 28 percent in the PM peak (or 4800 vehicle-hours) compared to Scenario 6 Similar to the 2006 model the 2020 model shows that these improvements produced a greater reduction in delay in the eastbound direction than the westbound direction
Scenarios 11 and 12 (Enhanced Incident Management)
Two incident scenarios were tested on top of Scenario 10 to evaluate the non-recurrent delay reductions resulting from enhanced incident management strategies An enhanced incident management system would entail upgrading or enhancing the current Caltrans incident management system that includes deployment of intelligent transportation system (ITS) field devices central controlcommunications software communications medium (ie fiber optic lines) advanced traveler information system
I-210 Corridor System Management Plan Executive Summary
Page 35 of 39
andor freeway service patrol (FSP) program to reduce incident detection verification response and clearance times
In the first scenario Scenario 11 one collision incident with one lane closure was simulated in the westbound direction in the AM peak period model and one in the eastbound direction in the PM peak period model The incident simulation location and duration were selected based on review of the 2010 actual incident data at one of the high frequency locations The following are the Scenario details
diams Westbound AM peak period starting at 800 AM close mainline lane 2 for 40 minutes at absolute post mile 2612 (at Lake Avenue)
diams Eastbound PM peak period starting at 500 PM close mainline lane 2 for 50 minutes at absolute post mile 3207 (west of Santa Anita)
In the second scenario Scenario 12 the same collision incidents were simulated with a reduction in duration by 10 minutes in the westbound direction and by 12 minutes in the eastbound direction It is estimated based on actual incident management data analysis results provided by Caltrans that an enhanced incident management system could reduce a 35-minute incident by about 10 minutes This scenario represents a typical moderate level incident at one location during the peak period direction Data suggest that incidents vary significantly in terms of impact and duration Some incidents last hundreds of minutes some close multiple lanes and some occur at multiple locations simultaneously There are also numerous minor incidents lasting only a few minutes without lane closures that can result in congestion Many other incidents also occur during off-peak hours
Without enhanced incident management Scenario 11 produced an 8 percent increase in congestion in both peak periods over Scenario 10 an increase of over 2300 hours of vehicle delay With enhanced incident management Scenario 12 evaluation resulted in delay decrease by 2 percent in the AM peak and 3 percent in the PM peak against Scenario 11 results a reduction of nearly 750 vehicle-hours for improving the incident detection verification response and clearance time of one moderate level incident for both of the peak hours
Scenario 13 (SR-134I-210 Interchange Modification)
Scenario 13 tests an improvement to modify the SR-134I-210 interchange to provide a direct connection for vehicles to continue on I-210 with three lanes in each direction This improvement was tested with the 2020 model since it is not likely to be implemented in the short-term
I-210 Corridor System Management Plan Executive Summary
Page 36 of 39
The 2020 model estimates that delay would be reduced by 11 percent (or 1800 daily vehicle-hours) in the AM and 3 percent in the PM (320 daily vehicle-hours) compared to Scenario 10 The westbound mainline experienced the greatest reduction in delay in the AM peak from 9600 vehicle-hours to 8600 vehicle hours after the interchange modification
Scenario 14 (Westbound Drop Ramp and Eastbound Widening)
Scenario 14 builds on Scenario 13 and tests Lake Avenue drop ramp to westbound Ishy210 center lanes (one HOV lane and one mainline) and eastbound I-210 widening from Myrtle to I-605 This improvement was tested with the 2020 model
The 2020 model estimates that delay would be reduced by about 20 percent in the AM or 3400 vehicle-hours and 20 percent in the PM or 2300 vehicle-hours compared to Scenario 13 The mobility improvements are significant with the westbound drop ramp that reduces weaving between SR-134 and SR-210 destined traffic and with the eastbound capacity addition to I-605 off that moves the off-ramp traffic away from the mainline and provides more room for the mainline through traffic
Post Scenario 14 Conditions
By 2020 with the inclusion of all the projects tested the model reveals some residual congestion that remains to address with future improvements According to the model results the total remaining delay on the corridor is around 21000 daily vehicle-hours
Benefit-Cost Analysis
Following an in-depth review of model results by the study team and the SCAG technical committee the study team performed a benefit-cost analysis (BCA) for each scenario
Using the California Benefit-Cost Model (Cal-BC) developed on behalf of Caltrans by the study team benefits in three key areas were estimated travel time savings vehicle operating cost savings and emission reduction savings The benefits generated from this exercise are based solely on congestion relief related benefits However these results are conservative since there are other benefits not captured by this analysis including benefits from deploying bus rapid transit which will achieve other accessibility benefits
Project costs were developed from SCAG and Caltrans project planning and programming documents These costs include construction and support costs in current dollars The study team estimated costs for projects that did not have cost
I-210 Corridor System Management Plan Executive Summary
Page 37 of 39
estimates by reviewing similar completed projects A BC greater than one means that a scenarios projects return greater benefits than it costs to construct or implement It is important to consider the total benefits that a project brings For example a large capital expansion project can cost a great deal and have a low BC ratio but brings much higher absolute benefits to the I-210 users Exhibit ES-29 shows the benefit to cost ranges classified from low (with a BC of one to two) to very high (with a BC of over 10)
The benefit-cost results for the South Corridor scenarios are shown in Exhibit ES-29
Exhibit ES-29 I-210 Scenario BenefitCost (BC) Results
Scenario Scenario Description
BenefitCost Ranges
Low Medium Medium-High High Very High
lt1 1 to 2 2 to 5 5 to 10 gt10
12 Expand Ramp Metering 34 Advanced Ramp Metering 56 Aux Lane Striping Ramp Improvs 78 Ramp Closures
910 On-Ramp amp Aux Lane Improvs 13 SR-134I-210 IC Modification
The benefit-cost findings for each scenario are as follows
diams Scenarios 1 and 2 (ramp metering expansion) shows a high benefit-cost ratio of over ten The relatively high benefit-cost ratio is due to the low cost of expanding ramp metering ($235 million)
diams Scenarios 3 and 4 (advanced ramp metering) resulted in an incremental benefitshycost ratio of over ten This is relatively high as compared to that of typical transportation management system project
diams Scenarios 5 and 6 (operational improvements) produced a benefit-cost ratio of over five This is relatively consistent with other typical operational improvement projects The benefits are substantial At estimated total cost of about $44 million these projects produced benefits of over $233 million
diams Scenarios 7 and 8 tested the ramp closures at eastbound Marengo westbound Lake and eastbound Mount Olive These ramp closured produced an extremely high incremental benefit-cost ratio of over ten due to the relatively very low cost However this benefit-cost calculation does not account for any potential increase in delay on various local arterials because of detours from the closed ramps
diams Scenarios 9 and 10 also produced a relatively high benefit-cost ratio of over ten The four operational projects in these scenarios are collectively estimated to cost
I-210 Corridor System Management Plan Executive Summary
Page 38 of 39
under $30 million and provide a substantial and optimistic benefit of over $670 million
diams Scenario 13 tested the SR-134I-210 interchange modification This project produced a benefit-cost ratio of between one and two consistent with other typical capital expansion projects This project produced benefits of over $200 million at a rough-estimate cost of about $150 million
diams Scenario 14 tested the westbound center drop ramp from Lake Avenue interchange and eastbound lane addition from Myrtle to I-605 These projects produced a relatively high benefit-cost ratio of about 6 to one as compared to other capital improvement projects These two capital projects are unique in that they have specific operational improvement element that addresses major bottleneck locations For an estimated total combined cost of about $70 million the projected benefits exceed $420 million
CONCLUSIONS AND RECOMMENDATIONS
This section summarizes the conclusions and recommendations based on the analysis discussed in the previous section It is important to note that many of these conclusions are based primarily on the micro-simulation model results The model was developed based on the best data available at the time The study team reviewed the model results and believe that both the calibrated base year forecast year and scenario results are reasonable However Caltrans should always be cautious to make decisions based on modeling alone especially complex micro-simulation models
Based on the results the study team offers the following conclusions and recommendations
diams The combination of all scenarios significantly reduces overall congestion on the corridor Projected 2020 congestion after implementation of all scenarios is below 2006 levels in both the AM and PM peak period In the AM peak period the model projects total delay in 2020 after delivering all projects to be less than 11700 vehicle-hours compared to the 2006 base year delay of 13000 vehicleshyhours This represents a reduction of over 10 percent In the PM peak period the model projects total delay in 2020 after delivering all projects to be around 9500 hours compared to the 2006 base year delay of almost 9300 vehicle-hours This represents a slight reduction of 2 percent Clearly the scenarios deliver significant mobility benefits to the corridor Despite the growth in demand future 2020 congestion will be less than experienced in 2006
diams The completed ramp metering expansion project is expected to produce substantial mobility benefits of over $400 million Delay has been significantly reduced since 2006
I-210 Corridor System Management Plan Executive Summary
Page 39 of 39
diams Advanced ramp metering could provide additional mobility improvements by significantly reducing congestion and returning over $100 million in benefits
diams Ramp closures at Marengo Lake and Mount Olive as alternatives seem promising by reducing delay up to 3000 vehicle-hours per day and providing substantial benefits of $280 million at an extremely low cost
diams Operational improvements such as auxiliary lanes and ramp improvements could leverage on the ramp metering projects by making the corridor more efficient and productive that could result in additional mobility benefits of over $230 million
diams Additional capital improvements with specific operational elements to address weaving at major bottleneck locations could produce significant mobility benefits of over $420 million
diams Enhanced incident management system associated with Scenarios 11 and 12 to address non-recurrent congestion proved effective with a delay reduction of over 300 vehicle-hours for one modest level incident with a typical duration of 35 minutes reduced to 25 minutes With the I-210 corridor experiencing up to 2400 collisions per year this translates to a total annual delay savings of over 700000 vehicle-hours for the study corridor
diams The benefit-cost ratio of all scenarios combined is about 64 to 1 If all projects were delivered at current cost estimates the public would get over six dollars of benefits for each dollar expended In current dollars costs total to over $17 billion whereas the benefits are estimated to be over $20 billion
diams The projects also alleviate greenhouse gas (GHG) emissions by over 15 million tons over 20 years averaging over a 75000-ton reduction per year The emissions are estimated using data from the California Air Resources Board (CARB) EMFAC model
This is the first generation CSMP for the I-210 corridor It is important to stress that CSMPs should be updated on a regular basis This is particularly important since traffic conditions and patterns can differ from current projections After projects are delivered it is also useful to compare actual results with estimated ones in this document so that models can be further improved as appropriate
CSMPs or a variation thereof should become the normal course of business that is based on detailed performance assessments an in-depth understanding of the reasons for performance deterioration and an analytical framework that allows for evaluating complementary operational strategies that maximize the productivity of the current system
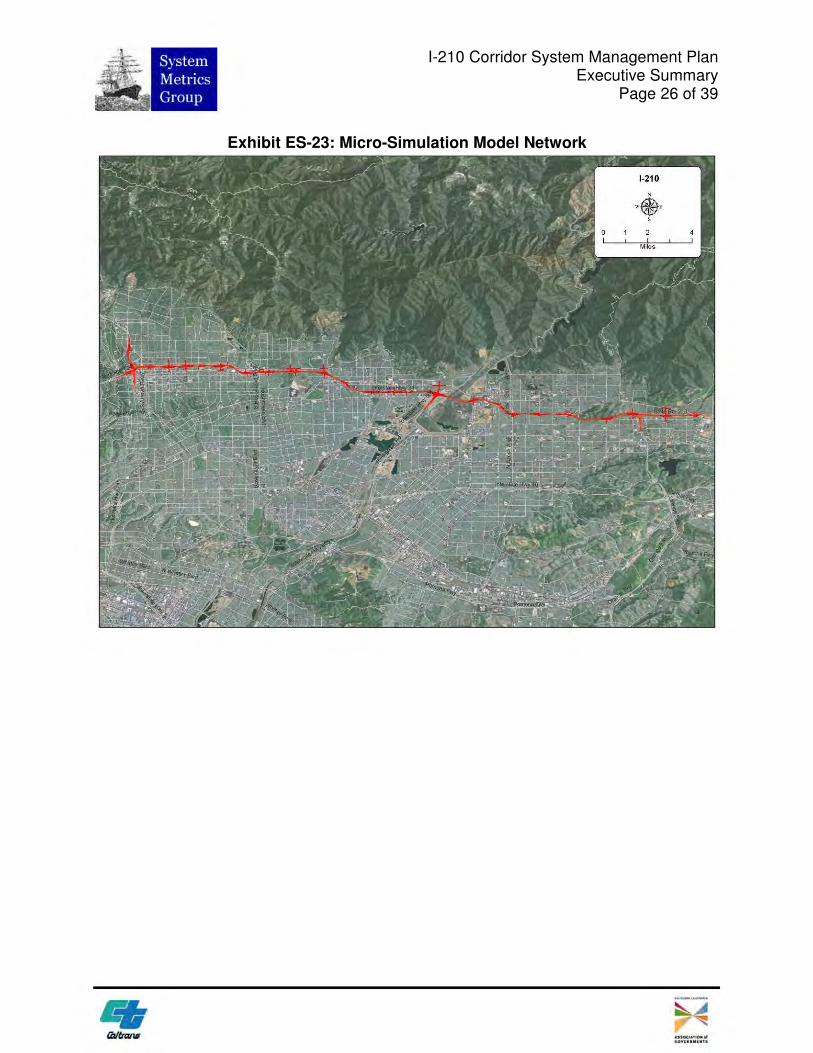
I-210 Corridor System Management Plan Executive Summary
Page 26 of 39
Exhibit ES-23 Micro-Simulation Model Network
I-210 Corridor System Management Plan Executive Summary
Page 27 of 39
Scenario Development Framework
The study team developed a framework for combining projects into scenarios It would be desirable to evaluate every possible combination of projects However this would have entailed thousands of model runs Instead the team combined projects based on a number of factors including
diams Projects that were fully constructed and completed from 2006 to 2010 were tested with both the 2006 and 2020 models
diams Short- and mid- term operational projects were grouped into scenarios and tested with the both the 2006 and 2020 models
diams Longer-range projects to be delivered by 2020 and beyond were used to develop scenarios to be tested with the 2020 model only
diams Alternative ramp closures were grouped into isolated scenarios (future scenarios did not build on top of these) and tested with both the 2006 and 2020 models
The study assumes that projects delivered before 2016 could reasonably be evaluated using the 2006 base year model The 2020 forecast year for the I-210 study was consistent with the SCAG 2020 regional travel demand model origin-destination matrices used to develop the 2008 Regional Transportation Plan (RTP) When SCAG updates its travel demand model and Regional Transportation Plan (RTP) it may wish to update the micro-simulation model with revised demand projections
Project lists used to develop scenarios were part from the Regional Transportation Improvement Program (RTIP) the RTP and other sources such as special studies Projects that do not directly affect mobility were eliminated For instance sound wall landscaping or minor arterial improvement projects were not evaluated since microshysimulation models cannot evaluate them
Scenario testing performed for the performed for the I-210 CSMP differed from traditional ldquoalternatives evaluationsrdquo done for Major Investment Studies (MIS) or Environmental Impact Reports (EIRs) An MIS or EIR focuses on identifying alternative solutions to address current or projected corridor problems so each alternative is evaluated separately and results among competing alternatives are compared resulting in a locally preferred alternative In contrast for the I-210 CSMP scenarios build on each other in that a scenario contains the projects from the previous scenario plus one or more projects as long as the incremental scenario results showed an acceptable level of performance improvement This incremental scenario evaluation approach is important since CSMPs are new and are often compared with alternatives studies
Exhibit ES-24 summarizes the approach used and scenarios tested and provides a
I-210 Corridor System Management Plan Executive Summary
Page 28 of 39
general description of the projects included in the 2006 and 2020 micro-simulation runs Most projects were tested for both the short- and long-term timeframes Each scenario tested was built upon prior scenarios except for Scenarios 7 and 8 which were ldquostand alonerdquo scenarios used to test alternative ramp closures Later scenarios build on Scenarios 5 and 6 and do not include the improvements tested in Scenarios 7 and 8 Enhanced incident management was tested in Scenarios 11 and 12 by comparing a simulated incident without and with enhanced incident management system Scenarios 13 and 14 are expected for the longer term and were tested only with the 2020 model
Exhibit ES-24 Micro-Simulation Modeling Approach
Short-Term Scenarios Long-Term Scenarios
Calibrated 2006 Base Case
Scenario 1 Expand Ramp-
Metering
Scenario 3 Scenario 1 +
Adv Ramp-Meter w
Queue Control
Scenario 5 Scenario 3 + aux lane striping and
ramp improvements
2020 Horizon Year
2006 Network 2020 OD Matrices
Scenario 7 Scenario 5 +
Ramp Closures
Scenario 2 Expand Ramp-
Metering
Scenario 4 Scenario 2 +
Adv Ramp-Meter w
Queue Control
Scenario 6 Scenario 4 + aux lane striping and
ramp improvements
Scenario 8 Scenario 6 +
Ramp Closures
Scenario 14 Scenario 13 + Lake
Ave Drop Ramp
Lane Addition
Scenario 9 Scenario 5+
On-Ramp amp Aux
lane improvements
Scenario 10 Scenario 6 +
On-Ramp amp Aux
lane improvements
Scenario 11 Incident with No
Incident
Management
Scenario 12 Incident With
Incident
Management
Scenario 13 Scenario 10 +
134210 IC
modification
Incident Management Scenarios
I-210 Corridor System Management Plan Executive Summary
Page 29 of 39
Scenario Evaluation Results
Exhibits ES-25 and ES-26 show the delay results for all the 2006 scenarios evaluated for the AM and PM peak periods respectively Exhibits ES-27 and ES-28 show the delay results for all the 2020 scenarios evaluated for the AM and PM peak periods respectively For each scenario the modeling team produced results by facility type (ie mainline HOV arterials and ramps) and vehicle type (SOV HOV trucks) as well as speed contour diagrams (discussed in more detail in the full technical CSMP) The study team scrutinized to ensure that they were consistent with general traffic engineering principles The following summarizes the findings related to the four exhibits
Exhibit ES-25 2006 AM Peak Micro-Simulation Delay Results by Scenario
De
lay
(Pe
ak
Pe
rio
d V
eh
icle
-Ho
urs
)
2006 Base Year S1 S3 S5 S7 S9 Scenario
18000
16000
14000
12000
10000
8000
6000
4000
2000
-
S1 Expand Ramp Metering
S3 Adv Ramp Metering
S5 Aux Lane Striping Ramp Improvs
S7 Ramp Closures
S9 On-Ramp amp Aux Lane Improvs
-2 -3 -3
-16 -20
HOV WB I-210 WB
HOV EB I-210 EB
Ramps Arterials
I-210 Corridor System Management Plan Executive Summary
Page 30 of 39
Exhibit ES-26 2006 PM Peak Micro-Simulation Delay Results by Scenario
18000
De
lay
(Pe
ak
Pe
rio
d V
eh
icle
-Ho
urs
)
16000
14000
12000
10000
8000
6000
4000
2000
-
S1 Expand Ramp Metering
S3 Adv Ramp Metering
HOV WB
I-210 WB
S5 Aux Lane Striping Ramp Improvs
S7 Ramp Closures
S9 On-Ramp amp Aux Lane Improvs
HOV EB
I-210 EB
Ramps
Arterials
-17
-11
-18
-18 -28
2006 Base Year S1 S3 S5 S7 S9 Scenario
Exhibit ES-27 2020 AM Peak Micro-Simulation Delay Results by Scenario
30000
De
lay
(Pe
ak
Pe
rio
d V
eh
icle
-Ho
urs
)
25000
20000
15000
10000
5000
S2 Expand Ramp Metering
S4 Adv Ramp Metering
S6 Aux Lane Striping Ramp Improvs
S8 Ramp Closures
HOV WB
I-210 WB
HOV EB
-8
-2 -8
-13 -12
S10 On-Ramp amp Aux Lane Improvs
S13 SR-134I-210 IC Modification
S14 Lake Ave Drop Ramp Lane Addition
I-210 EB
Ramps
Arterials
-11
-23
-
2020 S2 S4 S6 S8 S10 S13 S14 Horizon Scenario
I-210 Corridor System Management Plan Executive Summary
Page 31 of 39
Exhibit ES-28 2020 PM Peak Micro-Simulation Delay Results by Scenario D
ela
y(P
ea
k P
eri
od
Ve
hic
le-H
ou
rs)
30000
25000
20000
15000
10000
5000
-
S2 Expand Ramp Metering
S4 Adv Ramp Metering
S6 Aux Lane Striping Ramp Improvs
S8 Ramp Closures
HOV WB
I-210 WB
HOV EB
-14
S10 On-Ramp amp Aux Lane Improvs
S13 SR-134I-210 IC Modification
S14 Lake Ave Drop Ramp Lane Addition
I-210 EB
Ramps
Arterials
-2 -5 -3 -28
-3 -19
2020 S2 S4 S6 S8 S10 S13 S14 Horizon Scenario
Base Year and Do Minimum Horizon Year
Absent any physical improvements the modeling team estimates that by 2020 total delay (mainline HOV ramps and arterials) would double compared to 2006 (from a total of around 22000 vehicle-hours daily to just fewer than 45000 vehicle-hours) in the combined AM and PM peak
Scenarios 1 and 2 (Expand Ramp Metering)
Scenarios 1 and 2 test the only project on the corridor that was fully constructed and completed The project installed new connector metering at the SR-57 and I-605 to Ishy210 freeway connector ramps The project also widened various ramps removed various HOV meter bypasses and upgraded the ramp metering system
The 2006 model estimates that Scenario 1 would reduce delay on the corridor by around 17 percent (or 1600 daily vehicle-hours) in the PM peak period but only around two percent (or 200 vehicle-hours) in the AM peak period The biggest benefits occur in the PM eastbound direction from Rosemead On-Ramp to Huntington interchange (with a delay reduction of over 1000 vehicle-hours) as well as from I-605 to the Azusa On-Ramp (delay reduction of 500 vehicle-hours) for single occupant vehicles The
I-210 Corridor System Management Plan Executive Summary
Page 32 of 39
westbound reductions in freeway delay are largely offset by increased on-ramp delay mostly from new connector metering at SR-57 and I-605
The 2020 model estimates that Scenario 2 will reduce delay by around 8 percent in the AM peak and 14 percent in the PM peak for a combined total reduction of 5000 daily vehicle-hours The long-term improvements are less than the short-term improvements due to the increase in demand
Scenarios 3 and 4 (Advanced Ramp Metering)
Scenarios 3 and 4 build on Scenarios 1 and 2 by adding advanced ramp metering system such as dynamic or adaptive ramp metering system
The 2006 model shows that Scenario 3 would reduce delay by an additional 850 daily vehicle-hours (or 11 percent) in the PM peak with a marginal reduction in the AM peak period However in conjunction with Scenario 1 Scenario 3 reduces delay in total by over 600 vehicle-hours in the AM peak These results suggest that queue control provides additional benefits beyond SWARM
The 2020 model estimates that Scenario 4 will modestly reduce delay by about 2 percent in both the AM and PM peaks or a combined total of 800 daily vehicle-hours Again the benefits are lower in percentage terms due to the increase in demand
Note that there are various types of advanced ramp metering systems deployed around the world including System-wide Adaptive Ramp Metering System or SWARM tested recently in Los Angeles I-210 freeway corridor For the I-210 model the Asservissement Lineaire drsquoEntreacutee Autoroutiere (ALINEA system) was tested as proxy for any advanced ramp metering system as its algorithm for the model was readily available It is not necessarily recommended that ALINEA be deployed but rather some type of advanced ramp metering system that would produce similar if not better results
Scenarios 5 and 6 (Auxiliary Lane Striping Ramp Improvements)
Scenarios 5 and 6 build on Scenarios 3 and 4 that include several relatively lower-cost operational improvements that could be implemented by 2015
diams Building a westbound auxiliary lane from Santa Anita to Baldwin and an eastbound auxiliary lane from Santa Anita to Huntington
diams Extending a lane to Lincoln on the westbound I-210 connector
diams Connecting and converging the Altadena on-ramps into a single on-ramp
I-210 Corridor System Management Plan Executive Summary
Page 33 of 39
diams Connecting and converging the Santa Anita on-ramps into a single on-ramp
diams Connecting and converging the Irwindale on-ramps into a single on-ramp
diams Restriping to add a lane in the eastbound direction from San Dimas to Fruit
The 2006 model shows that Scenario 5 reduces delay by 3 percent (nearly 400 vehicleshyhours) in the AM peak and 18 percent (1200 vehicle-hours) in the PM peak The segment that experienced the largest improvement in the eastbound during the PM peak was from Rosemead to Huntington This segment experienced a 45 percent improvement in delay (from 2700 vehicle-hours to 1500 vehicle-hours) which is likely attributed to the eastbound auxiliary lane from Santa Anita to Huntington In the westbound direction the auxiliary lane from Santa Anita to Baldwin shifts some traffic downstream to cause increased congestion at Michillinda (ie bottleneck shift) during the westbound AM peak However the auxiliary lane helps reduce both queue length and queue duration for the Santa Anita bottleneck
The 2020 model estimates that Scenario 6 would reduce delay by 8 percent in the AM peak and 5 percent in the PM peak for a total reduction of 2500 daily vehicle-hours A reduction in PM delay is expected to occur mostly in the westbound direction
Scenarios 7 and 8 (Ramp Closures)
Scenarios 7 and 8 build on Scenarios 5 and 6 and test the closure of several ramps
diams Eastbound Marengo on-ramp and westbound Lake on-ramp with signalization of the eastbound I-210 off-ramp at Maple and improvement to alternate routes along Corson and Maple
diams Eastbound Mount Olive ramps
Note that subsequent scenarios are not built on top of these scenarios as these are isolated to test ramp closure alternatives
The 2006 model shows that Scenario 7 would reduce delay significantly by 16 percent in the AM peak and 18 percent in the PM peak for a total delay reduction of nearly 3000 daily vehicle-hours The delay reductions are significant on the mainline during the peak direction of travel ndash 1400 vehicle-hours in the westbound AM and 912 vehicleshyhours in the eastbound PM In the westbound direction and AM peak period the segment from Altadena to Lake experienced over an 85 percent decrease in congestion (from 860 to 120 vehicle-hours of delay) This is likely attributed to the closure of the westbound Lake on-ramp In the eastbound direction and PM peak period the segment from Huntington to I-605 experienced a delay reduction of over 70 percent (from 2200
I-210 Corridor System Management Plan Executive Summary
Page 34 of 39
vehicle-hours to 600 vehicle-hours) which is likely attributed to the closure of the Mount Olive ramp
The 2020 model also shows that Scenario 8 improved delay by 12 percent in the AM and 3 percent in the PM for a total delay reduction of almost 3000 daily vehicle-hours On the mainline facility delay also improved for each peak direction of travel ndash by 1600 daily vehicle-hours in the westbound AM and by 750 vehicle-hours in the eastbound PM Delay reductions in the non-peak direction were not as significant
Scenarios 9 and 10 (On-ramp and Aux Lane Improvements)
Scenarios 9 and 10 build on Scenarios 5 and 6 and test four operational improvements that can be implemented in the short to medium range
diams Modify the RosemeadMichillinda interchange and converge the westbound I-210 on-ramps
diams Modify the northside of the Baldwin interchange and eliminate the collectorshydistributor
diams Construct an eastbound auxiliary lane from Azusa to Citrus
diams Converge the eastbound Citrus on-ramps and add an auxiliary lane to Grand
The 2006 model estimates that Scenario 9 will reduce delay by 20 percent (or 2400 daily vehicle-hours) in the AM peak and 28 percent (or 1600 daily vehicle-hours) in the PM peak compared to Scenario 5 In both AM and PM peak period the eastbound direction experienced the largest reduction in delay
The 2020 model estimates that Scenario 10 will reduce delay by 13 percent (or 2500 vehicle-hours) in the AM peak and 28 percent in the PM peak (or 4800 vehicle-hours) compared to Scenario 6 Similar to the 2006 model the 2020 model shows that these improvements produced a greater reduction in delay in the eastbound direction than the westbound direction
Scenarios 11 and 12 (Enhanced Incident Management)
Two incident scenarios were tested on top of Scenario 10 to evaluate the non-recurrent delay reductions resulting from enhanced incident management strategies An enhanced incident management system would entail upgrading or enhancing the current Caltrans incident management system that includes deployment of intelligent transportation system (ITS) field devices central controlcommunications software communications medium (ie fiber optic lines) advanced traveler information system
I-210 Corridor System Management Plan Executive Summary
Page 35 of 39
andor freeway service patrol (FSP) program to reduce incident detection verification response and clearance times
In the first scenario Scenario 11 one collision incident with one lane closure was simulated in the westbound direction in the AM peak period model and one in the eastbound direction in the PM peak period model The incident simulation location and duration were selected based on review of the 2010 actual incident data at one of the high frequency locations The following are the Scenario details
diams Westbound AM peak period starting at 800 AM close mainline lane 2 for 40 minutes at absolute post mile 2612 (at Lake Avenue)
diams Eastbound PM peak period starting at 500 PM close mainline lane 2 for 50 minutes at absolute post mile 3207 (west of Santa Anita)
In the second scenario Scenario 12 the same collision incidents were simulated with a reduction in duration by 10 minutes in the westbound direction and by 12 minutes in the eastbound direction It is estimated based on actual incident management data analysis results provided by Caltrans that an enhanced incident management system could reduce a 35-minute incident by about 10 minutes This scenario represents a typical moderate level incident at one location during the peak period direction Data suggest that incidents vary significantly in terms of impact and duration Some incidents last hundreds of minutes some close multiple lanes and some occur at multiple locations simultaneously There are also numerous minor incidents lasting only a few minutes without lane closures that can result in congestion Many other incidents also occur during off-peak hours
Without enhanced incident management Scenario 11 produced an 8 percent increase in congestion in both peak periods over Scenario 10 an increase of over 2300 hours of vehicle delay With enhanced incident management Scenario 12 evaluation resulted in delay decrease by 2 percent in the AM peak and 3 percent in the PM peak against Scenario 11 results a reduction of nearly 750 vehicle-hours for improving the incident detection verification response and clearance time of one moderate level incident for both of the peak hours
Scenario 13 (SR-134I-210 Interchange Modification)
Scenario 13 tests an improvement to modify the SR-134I-210 interchange to provide a direct connection for vehicles to continue on I-210 with three lanes in each direction This improvement was tested with the 2020 model since it is not likely to be implemented in the short-term
I-210 Corridor System Management Plan Executive Summary
Page 36 of 39
The 2020 model estimates that delay would be reduced by 11 percent (or 1800 daily vehicle-hours) in the AM and 3 percent in the PM (320 daily vehicle-hours) compared to Scenario 10 The westbound mainline experienced the greatest reduction in delay in the AM peak from 9600 vehicle-hours to 8600 vehicle hours after the interchange modification
Scenario 14 (Westbound Drop Ramp and Eastbound Widening)
Scenario 14 builds on Scenario 13 and tests Lake Avenue drop ramp to westbound Ishy210 center lanes (one HOV lane and one mainline) and eastbound I-210 widening from Myrtle to I-605 This improvement was tested with the 2020 model
The 2020 model estimates that delay would be reduced by about 20 percent in the AM or 3400 vehicle-hours and 20 percent in the PM or 2300 vehicle-hours compared to Scenario 13 The mobility improvements are significant with the westbound drop ramp that reduces weaving between SR-134 and SR-210 destined traffic and with the eastbound capacity addition to I-605 off that moves the off-ramp traffic away from the mainline and provides more room for the mainline through traffic
Post Scenario 14 Conditions
By 2020 with the inclusion of all the projects tested the model reveals some residual congestion that remains to address with future improvements According to the model results the total remaining delay on the corridor is around 21000 daily vehicle-hours
Benefit-Cost Analysis
Following an in-depth review of model results by the study team and the SCAG technical committee the study team performed a benefit-cost analysis (BCA) for each scenario
Using the California Benefit-Cost Model (Cal-BC) developed on behalf of Caltrans by the study team benefits in three key areas were estimated travel time savings vehicle operating cost savings and emission reduction savings The benefits generated from this exercise are based solely on congestion relief related benefits However these results are conservative since there are other benefits not captured by this analysis including benefits from deploying bus rapid transit which will achieve other accessibility benefits
Project costs were developed from SCAG and Caltrans project planning and programming documents These costs include construction and support costs in current dollars The study team estimated costs for projects that did not have cost
I-210 Corridor System Management Plan Executive Summary
Page 37 of 39
estimates by reviewing similar completed projects A BC greater than one means that a scenarios projects return greater benefits than it costs to construct or implement It is important to consider the total benefits that a project brings For example a large capital expansion project can cost a great deal and have a low BC ratio but brings much higher absolute benefits to the I-210 users Exhibit ES-29 shows the benefit to cost ranges classified from low (with a BC of one to two) to very high (with a BC of over 10)
The benefit-cost results for the South Corridor scenarios are shown in Exhibit ES-29
Exhibit ES-29 I-210 Scenario BenefitCost (BC) Results
Scenario Scenario Description
BenefitCost Ranges
Low Medium Medium-High High Very High
lt1 1 to 2 2 to 5 5 to 10 gt10
12 Expand Ramp Metering 34 Advanced Ramp Metering 56 Aux Lane Striping Ramp Improvs 78 Ramp Closures
910 On-Ramp amp Aux Lane Improvs 13 SR-134I-210 IC Modification
The benefit-cost findings for each scenario are as follows
diams Scenarios 1 and 2 (ramp metering expansion) shows a high benefit-cost ratio of over ten The relatively high benefit-cost ratio is due to the low cost of expanding ramp metering ($235 million)
diams Scenarios 3 and 4 (advanced ramp metering) resulted in an incremental benefitshycost ratio of over ten This is relatively high as compared to that of typical transportation management system project
diams Scenarios 5 and 6 (operational improvements) produced a benefit-cost ratio of over five This is relatively consistent with other typical operational improvement projects The benefits are substantial At estimated total cost of about $44 million these projects produced benefits of over $233 million
diams Scenarios 7 and 8 tested the ramp closures at eastbound Marengo westbound Lake and eastbound Mount Olive These ramp closured produced an extremely high incremental benefit-cost ratio of over ten due to the relatively very low cost However this benefit-cost calculation does not account for any potential increase in delay on various local arterials because of detours from the closed ramps
diams Scenarios 9 and 10 also produced a relatively high benefit-cost ratio of over ten The four operational projects in these scenarios are collectively estimated to cost
I-210 Corridor System Management Plan Executive Summary
Page 38 of 39
under $30 million and provide a substantial and optimistic benefit of over $670 million
diams Scenario 13 tested the SR-134I-210 interchange modification This project produced a benefit-cost ratio of between one and two consistent with other typical capital expansion projects This project produced benefits of over $200 million at a rough-estimate cost of about $150 million
diams Scenario 14 tested the westbound center drop ramp from Lake Avenue interchange and eastbound lane addition from Myrtle to I-605 These projects produced a relatively high benefit-cost ratio of about 6 to one as compared to other capital improvement projects These two capital projects are unique in that they have specific operational improvement element that addresses major bottleneck locations For an estimated total combined cost of about $70 million the projected benefits exceed $420 million
CONCLUSIONS AND RECOMMENDATIONS
This section summarizes the conclusions and recommendations based on the analysis discussed in the previous section It is important to note that many of these conclusions are based primarily on the micro-simulation model results The model was developed based on the best data available at the time The study team reviewed the model results and believe that both the calibrated base year forecast year and scenario results are reasonable However Caltrans should always be cautious to make decisions based on modeling alone especially complex micro-simulation models
Based on the results the study team offers the following conclusions and recommendations
diams The combination of all scenarios significantly reduces overall congestion on the corridor Projected 2020 congestion after implementation of all scenarios is below 2006 levels in both the AM and PM peak period In the AM peak period the model projects total delay in 2020 after delivering all projects to be less than 11700 vehicle-hours compared to the 2006 base year delay of 13000 vehicleshyhours This represents a reduction of over 10 percent In the PM peak period the model projects total delay in 2020 after delivering all projects to be around 9500 hours compared to the 2006 base year delay of almost 9300 vehicle-hours This represents a slight reduction of 2 percent Clearly the scenarios deliver significant mobility benefits to the corridor Despite the growth in demand future 2020 congestion will be less than experienced in 2006
diams The completed ramp metering expansion project is expected to produce substantial mobility benefits of over $400 million Delay has been significantly reduced since 2006
I-210 Corridor System Management Plan Executive Summary
Page 39 of 39
diams Advanced ramp metering could provide additional mobility improvements by significantly reducing congestion and returning over $100 million in benefits
diams Ramp closures at Marengo Lake and Mount Olive as alternatives seem promising by reducing delay up to 3000 vehicle-hours per day and providing substantial benefits of $280 million at an extremely low cost
diams Operational improvements such as auxiliary lanes and ramp improvements could leverage on the ramp metering projects by making the corridor more efficient and productive that could result in additional mobility benefits of over $230 million
diams Additional capital improvements with specific operational elements to address weaving at major bottleneck locations could produce significant mobility benefits of over $420 million
diams Enhanced incident management system associated with Scenarios 11 and 12 to address non-recurrent congestion proved effective with a delay reduction of over 300 vehicle-hours for one modest level incident with a typical duration of 35 minutes reduced to 25 minutes With the I-210 corridor experiencing up to 2400 collisions per year this translates to a total annual delay savings of over 700000 vehicle-hours for the study corridor
diams The benefit-cost ratio of all scenarios combined is about 64 to 1 If all projects were delivered at current cost estimates the public would get over six dollars of benefits for each dollar expended In current dollars costs total to over $17 billion whereas the benefits are estimated to be over $20 billion
diams The projects also alleviate greenhouse gas (GHG) emissions by over 15 million tons over 20 years averaging over a 75000-ton reduction per year The emissions are estimated using data from the California Air Resources Board (CARB) EMFAC model
This is the first generation CSMP for the I-210 corridor It is important to stress that CSMPs should be updated on a regular basis This is particularly important since traffic conditions and patterns can differ from current projections After projects are delivered it is also useful to compare actual results with estimated ones in this document so that models can be further improved as appropriate
CSMPs or a variation thereof should become the normal course of business that is based on detailed performance assessments an in-depth understanding of the reasons for performance deterioration and an analytical framework that allows for evaluating complementary operational strategies that maximize the productivity of the current system
I-210 Corridor System Management Plan Executive Summary
Page 30 of 39
Exhibit ES-26 2006 PM Peak Micro-Simulation Delay Results by Scenario
18000
De
lay
(Pe
ak
Pe
rio
d V
eh
icle
-Ho
urs
)
16000
14000
12000
10000
8000
6000
4000
2000
-
S1 Expand Ramp Metering
S3 Adv Ramp Metering
HOV WB
I-210 WB
S5 Aux Lane Striping Ramp Improvs
S7 Ramp Closures
S9 On-Ramp amp Aux Lane Improvs
HOV EB
I-210 EB
Ramps
Arterials
-17
-11
-18
-18 -28
2006 Base Year S1 S3 S5 S7 S9 Scenario
Exhibit ES-27 2020 AM Peak Micro-Simulation Delay Results by Scenario
30000
De
lay
(Pe
ak
Pe
rio
d V
eh
icle
-Ho
urs
)
25000
20000
15000
10000
5000
S2 Expand Ramp Metering
S4 Adv Ramp Metering
S6 Aux Lane Striping Ramp Improvs
S8 Ramp Closures
HOV WB
I-210 WB
HOV EB
-8
-2 -8
-13 -12
S10 On-Ramp amp Aux Lane Improvs
S13 SR-134I-210 IC Modification
S14 Lake Ave Drop Ramp Lane Addition
I-210 EB
Ramps
Arterials
-11
-23
-
2020 S2 S4 S6 S8 S10 S13 S14 Horizon Scenario
I-210 Corridor System Management Plan Executive Summary
Page 31 of 39
Exhibit ES-28 2020 PM Peak Micro-Simulation Delay Results by Scenario D
ela
y(P
ea
k P
eri
od
Ve
hic
le-H
ou
rs)
30000
25000
20000
15000
10000
5000
-
S2 Expand Ramp Metering
S4 Adv Ramp Metering
S6 Aux Lane Striping Ramp Improvs
S8 Ramp Closures
HOV WB
I-210 WB
HOV EB
-14
S10 On-Ramp amp Aux Lane Improvs
S13 SR-134I-210 IC Modification
S14 Lake Ave Drop Ramp Lane Addition
I-210 EB
Ramps
Arterials
-2 -5 -3 -28
-3 -19
2020 S2 S4 S6 S8 S10 S13 S14 Horizon Scenario
Base Year and Do Minimum Horizon Year
Absent any physical improvements the modeling team estimates that by 2020 total delay (mainline HOV ramps and arterials) would double compared to 2006 (from a total of around 22000 vehicle-hours daily to just fewer than 45000 vehicle-hours) in the combined AM and PM peak
Scenarios 1 and 2 (Expand Ramp Metering)
Scenarios 1 and 2 test the only project on the corridor that was fully constructed and completed The project installed new connector metering at the SR-57 and I-605 to Ishy210 freeway connector ramps The project also widened various ramps removed various HOV meter bypasses and upgraded the ramp metering system
The 2006 model estimates that Scenario 1 would reduce delay on the corridor by around 17 percent (or 1600 daily vehicle-hours) in the PM peak period but only around two percent (or 200 vehicle-hours) in the AM peak period The biggest benefits occur in the PM eastbound direction from Rosemead On-Ramp to Huntington interchange (with a delay reduction of over 1000 vehicle-hours) as well as from I-605 to the Azusa On-Ramp (delay reduction of 500 vehicle-hours) for single occupant vehicles The
I-210 Corridor System Management Plan Executive Summary
Page 32 of 39
westbound reductions in freeway delay are largely offset by increased on-ramp delay mostly from new connector metering at SR-57 and I-605
The 2020 model estimates that Scenario 2 will reduce delay by around 8 percent in the AM peak and 14 percent in the PM peak for a combined total reduction of 5000 daily vehicle-hours The long-term improvements are less than the short-term improvements due to the increase in demand
Scenarios 3 and 4 (Advanced Ramp Metering)
Scenarios 3 and 4 build on Scenarios 1 and 2 by adding advanced ramp metering system such as dynamic or adaptive ramp metering system
The 2006 model shows that Scenario 3 would reduce delay by an additional 850 daily vehicle-hours (or 11 percent) in the PM peak with a marginal reduction in the AM peak period However in conjunction with Scenario 1 Scenario 3 reduces delay in total by over 600 vehicle-hours in the AM peak These results suggest that queue control provides additional benefits beyond SWARM
The 2020 model estimates that Scenario 4 will modestly reduce delay by about 2 percent in both the AM and PM peaks or a combined total of 800 daily vehicle-hours Again the benefits are lower in percentage terms due to the increase in demand
Note that there are various types of advanced ramp metering systems deployed around the world including System-wide Adaptive Ramp Metering System or SWARM tested recently in Los Angeles I-210 freeway corridor For the I-210 model the Asservissement Lineaire drsquoEntreacutee Autoroutiere (ALINEA system) was tested as proxy for any advanced ramp metering system as its algorithm for the model was readily available It is not necessarily recommended that ALINEA be deployed but rather some type of advanced ramp metering system that would produce similar if not better results
Scenarios 5 and 6 (Auxiliary Lane Striping Ramp Improvements)
Scenarios 5 and 6 build on Scenarios 3 and 4 that include several relatively lower-cost operational improvements that could be implemented by 2015
diams Building a westbound auxiliary lane from Santa Anita to Baldwin and an eastbound auxiliary lane from Santa Anita to Huntington
diams Extending a lane to Lincoln on the westbound I-210 connector
diams Connecting and converging the Altadena on-ramps into a single on-ramp
I-210 Corridor System Management Plan Executive Summary
Page 33 of 39
diams Connecting and converging the Santa Anita on-ramps into a single on-ramp
diams Connecting and converging the Irwindale on-ramps into a single on-ramp
diams Restriping to add a lane in the eastbound direction from San Dimas to Fruit
The 2006 model shows that Scenario 5 reduces delay by 3 percent (nearly 400 vehicleshyhours) in the AM peak and 18 percent (1200 vehicle-hours) in the PM peak The segment that experienced the largest improvement in the eastbound during the PM peak was from Rosemead to Huntington This segment experienced a 45 percent improvement in delay (from 2700 vehicle-hours to 1500 vehicle-hours) which is likely attributed to the eastbound auxiliary lane from Santa Anita to Huntington In the westbound direction the auxiliary lane from Santa Anita to Baldwin shifts some traffic downstream to cause increased congestion at Michillinda (ie bottleneck shift) during the westbound AM peak However the auxiliary lane helps reduce both queue length and queue duration for the Santa Anita bottleneck
The 2020 model estimates that Scenario 6 would reduce delay by 8 percent in the AM peak and 5 percent in the PM peak for a total reduction of 2500 daily vehicle-hours A reduction in PM delay is expected to occur mostly in the westbound direction
Scenarios 7 and 8 (Ramp Closures)
Scenarios 7 and 8 build on Scenarios 5 and 6 and test the closure of several ramps
diams Eastbound Marengo on-ramp and westbound Lake on-ramp with signalization of the eastbound I-210 off-ramp at Maple and improvement to alternate routes along Corson and Maple
diams Eastbound Mount Olive ramps
Note that subsequent scenarios are not built on top of these scenarios as these are isolated to test ramp closure alternatives
The 2006 model shows that Scenario 7 would reduce delay significantly by 16 percent in the AM peak and 18 percent in the PM peak for a total delay reduction of nearly 3000 daily vehicle-hours The delay reductions are significant on the mainline during the peak direction of travel ndash 1400 vehicle-hours in the westbound AM and 912 vehicleshyhours in the eastbound PM In the westbound direction and AM peak period the segment from Altadena to Lake experienced over an 85 percent decrease in congestion (from 860 to 120 vehicle-hours of delay) This is likely attributed to the closure of the westbound Lake on-ramp In the eastbound direction and PM peak period the segment from Huntington to I-605 experienced a delay reduction of over 70 percent (from 2200
I-210 Corridor System Management Plan Executive Summary
Page 34 of 39
vehicle-hours to 600 vehicle-hours) which is likely attributed to the closure of the Mount Olive ramp
The 2020 model also shows that Scenario 8 improved delay by 12 percent in the AM and 3 percent in the PM for a total delay reduction of almost 3000 daily vehicle-hours On the mainline facility delay also improved for each peak direction of travel ndash by 1600 daily vehicle-hours in the westbound AM and by 750 vehicle-hours in the eastbound PM Delay reductions in the non-peak direction were not as significant
Scenarios 9 and 10 (On-ramp and Aux Lane Improvements)
Scenarios 9 and 10 build on Scenarios 5 and 6 and test four operational improvements that can be implemented in the short to medium range
diams Modify the RosemeadMichillinda interchange and converge the westbound I-210 on-ramps
diams Modify the northside of the Baldwin interchange and eliminate the collectorshydistributor
diams Construct an eastbound auxiliary lane from Azusa to Citrus
diams Converge the eastbound Citrus on-ramps and add an auxiliary lane to Grand
The 2006 model estimates that Scenario 9 will reduce delay by 20 percent (or 2400 daily vehicle-hours) in the AM peak and 28 percent (or 1600 daily vehicle-hours) in the PM peak compared to Scenario 5 In both AM and PM peak period the eastbound direction experienced the largest reduction in delay
The 2020 model estimates that Scenario 10 will reduce delay by 13 percent (or 2500 vehicle-hours) in the AM peak and 28 percent in the PM peak (or 4800 vehicle-hours) compared to Scenario 6 Similar to the 2006 model the 2020 model shows that these improvements produced a greater reduction in delay in the eastbound direction than the westbound direction
Scenarios 11 and 12 (Enhanced Incident Management)
Two incident scenarios were tested on top of Scenario 10 to evaluate the non-recurrent delay reductions resulting from enhanced incident management strategies An enhanced incident management system would entail upgrading or enhancing the current Caltrans incident management system that includes deployment of intelligent transportation system (ITS) field devices central controlcommunications software communications medium (ie fiber optic lines) advanced traveler information system
I-210 Corridor System Management Plan Executive Summary
Page 35 of 39
andor freeway service patrol (FSP) program to reduce incident detection verification response and clearance times
In the first scenario Scenario 11 one collision incident with one lane closure was simulated in the westbound direction in the AM peak period model and one in the eastbound direction in the PM peak period model The incident simulation location and duration were selected based on review of the 2010 actual incident data at one of the high frequency locations The following are the Scenario details
diams Westbound AM peak period starting at 800 AM close mainline lane 2 for 40 minutes at absolute post mile 2612 (at Lake Avenue)
diams Eastbound PM peak period starting at 500 PM close mainline lane 2 for 50 minutes at absolute post mile 3207 (west of Santa Anita)
In the second scenario Scenario 12 the same collision incidents were simulated with a reduction in duration by 10 minutes in the westbound direction and by 12 minutes in the eastbound direction It is estimated based on actual incident management data analysis results provided by Caltrans that an enhanced incident management system could reduce a 35-minute incident by about 10 minutes This scenario represents a typical moderate level incident at one location during the peak period direction Data suggest that incidents vary significantly in terms of impact and duration Some incidents last hundreds of minutes some close multiple lanes and some occur at multiple locations simultaneously There are also numerous minor incidents lasting only a few minutes without lane closures that can result in congestion Many other incidents also occur during off-peak hours
Without enhanced incident management Scenario 11 produced an 8 percent increase in congestion in both peak periods over Scenario 10 an increase of over 2300 hours of vehicle delay With enhanced incident management Scenario 12 evaluation resulted in delay decrease by 2 percent in the AM peak and 3 percent in the PM peak against Scenario 11 results a reduction of nearly 750 vehicle-hours for improving the incident detection verification response and clearance time of one moderate level incident for both of the peak hours
Scenario 13 (SR-134I-210 Interchange Modification)
Scenario 13 tests an improvement to modify the SR-134I-210 interchange to provide a direct connection for vehicles to continue on I-210 with three lanes in each direction This improvement was tested with the 2020 model since it is not likely to be implemented in the short-term
I-210 Corridor System Management Plan Executive Summary
Page 36 of 39
The 2020 model estimates that delay would be reduced by 11 percent (or 1800 daily vehicle-hours) in the AM and 3 percent in the PM (320 daily vehicle-hours) compared to Scenario 10 The westbound mainline experienced the greatest reduction in delay in the AM peak from 9600 vehicle-hours to 8600 vehicle hours after the interchange modification
Scenario 14 (Westbound Drop Ramp and Eastbound Widening)
Scenario 14 builds on Scenario 13 and tests Lake Avenue drop ramp to westbound Ishy210 center lanes (one HOV lane and one mainline) and eastbound I-210 widening from Myrtle to I-605 This improvement was tested with the 2020 model
The 2020 model estimates that delay would be reduced by about 20 percent in the AM or 3400 vehicle-hours and 20 percent in the PM or 2300 vehicle-hours compared to Scenario 13 The mobility improvements are significant with the westbound drop ramp that reduces weaving between SR-134 and SR-210 destined traffic and with the eastbound capacity addition to I-605 off that moves the off-ramp traffic away from the mainline and provides more room for the mainline through traffic
Post Scenario 14 Conditions
By 2020 with the inclusion of all the projects tested the model reveals some residual congestion that remains to address with future improvements According to the model results the total remaining delay on the corridor is around 21000 daily vehicle-hours
Benefit-Cost Analysis
Following an in-depth review of model results by the study team and the SCAG technical committee the study team performed a benefit-cost analysis (BCA) for each scenario
Using the California Benefit-Cost Model (Cal-BC) developed on behalf of Caltrans by the study team benefits in three key areas were estimated travel time savings vehicle operating cost savings and emission reduction savings The benefits generated from this exercise are based solely on congestion relief related benefits However these results are conservative since there are other benefits not captured by this analysis including benefits from deploying bus rapid transit which will achieve other accessibility benefits
Project costs were developed from SCAG and Caltrans project planning and programming documents These costs include construction and support costs in current dollars The study team estimated costs for projects that did not have cost
I-210 Corridor System Management Plan Executive Summary
Page 37 of 39
estimates by reviewing similar completed projects A BC greater than one means that a scenarios projects return greater benefits than it costs to construct or implement It is important to consider the total benefits that a project brings For example a large capital expansion project can cost a great deal and have a low BC ratio but brings much higher absolute benefits to the I-210 users Exhibit ES-29 shows the benefit to cost ranges classified from low (with a BC of one to two) to very high (with a BC of over 10)
The benefit-cost results for the South Corridor scenarios are shown in Exhibit ES-29
Exhibit ES-29 I-210 Scenario BenefitCost (BC) Results
Scenario Scenario Description
BenefitCost Ranges
Low Medium Medium-High High Very High
lt1 1 to 2 2 to 5 5 to 10 gt10
12 Expand Ramp Metering 34 Advanced Ramp Metering 56 Aux Lane Striping Ramp Improvs 78 Ramp Closures
910 On-Ramp amp Aux Lane Improvs 13 SR-134I-210 IC Modification
The benefit-cost findings for each scenario are as follows
diams Scenarios 1 and 2 (ramp metering expansion) shows a high benefit-cost ratio of over ten The relatively high benefit-cost ratio is due to the low cost of expanding ramp metering ($235 million)
diams Scenarios 3 and 4 (advanced ramp metering) resulted in an incremental benefitshycost ratio of over ten This is relatively high as compared to that of typical transportation management system project
diams Scenarios 5 and 6 (operational improvements) produced a benefit-cost ratio of over five This is relatively consistent with other typical operational improvement projects The benefits are substantial At estimated total cost of about $44 million these projects produced benefits of over $233 million
diams Scenarios 7 and 8 tested the ramp closures at eastbound Marengo westbound Lake and eastbound Mount Olive These ramp closured produced an extremely high incremental benefit-cost ratio of over ten due to the relatively very low cost However this benefit-cost calculation does not account for any potential increase in delay on various local arterials because of detours from the closed ramps
diams Scenarios 9 and 10 also produced a relatively high benefit-cost ratio of over ten The four operational projects in these scenarios are collectively estimated to cost
I-210 Corridor System Management Plan Executive Summary
Page 38 of 39
under $30 million and provide a substantial and optimistic benefit of over $670 million
diams Scenario 13 tested the SR-134I-210 interchange modification This project produced a benefit-cost ratio of between one and two consistent with other typical capital expansion projects This project produced benefits of over $200 million at a rough-estimate cost of about $150 million
diams Scenario 14 tested the westbound center drop ramp from Lake Avenue interchange and eastbound lane addition from Myrtle to I-605 These projects produced a relatively high benefit-cost ratio of about 6 to one as compared to other capital improvement projects These two capital projects are unique in that they have specific operational improvement element that addresses major bottleneck locations For an estimated total combined cost of about $70 million the projected benefits exceed $420 million
CONCLUSIONS AND RECOMMENDATIONS
This section summarizes the conclusions and recommendations based on the analysis discussed in the previous section It is important to note that many of these conclusions are based primarily on the micro-simulation model results The model was developed based on the best data available at the time The study team reviewed the model results and believe that both the calibrated base year forecast year and scenario results are reasonable However Caltrans should always be cautious to make decisions based on modeling alone especially complex micro-simulation models
Based on the results the study team offers the following conclusions and recommendations
diams The combination of all scenarios significantly reduces overall congestion on the corridor Projected 2020 congestion after implementation of all scenarios is below 2006 levels in both the AM and PM peak period In the AM peak period the model projects total delay in 2020 after delivering all projects to be less than 11700 vehicle-hours compared to the 2006 base year delay of 13000 vehicleshyhours This represents a reduction of over 10 percent In the PM peak period the model projects total delay in 2020 after delivering all projects to be around 9500 hours compared to the 2006 base year delay of almost 9300 vehicle-hours This represents a slight reduction of 2 percent Clearly the scenarios deliver significant mobility benefits to the corridor Despite the growth in demand future 2020 congestion will be less than experienced in 2006
diams The completed ramp metering expansion project is expected to produce substantial mobility benefits of over $400 million Delay has been significantly reduced since 2006
I-210 Corridor System Management Plan Executive Summary
Page 39 of 39
diams Advanced ramp metering could provide additional mobility improvements by significantly reducing congestion and returning over $100 million in benefits
diams Ramp closures at Marengo Lake and Mount Olive as alternatives seem promising by reducing delay up to 3000 vehicle-hours per day and providing substantial benefits of $280 million at an extremely low cost
diams Operational improvements such as auxiliary lanes and ramp improvements could leverage on the ramp metering projects by making the corridor more efficient and productive that could result in additional mobility benefits of over $230 million
diams Additional capital improvements with specific operational elements to address weaving at major bottleneck locations could produce significant mobility benefits of over $420 million
diams Enhanced incident management system associated with Scenarios 11 and 12 to address non-recurrent congestion proved effective with a delay reduction of over 300 vehicle-hours for one modest level incident with a typical duration of 35 minutes reduced to 25 minutes With the I-210 corridor experiencing up to 2400 collisions per year this translates to a total annual delay savings of over 700000 vehicle-hours for the study corridor
diams The benefit-cost ratio of all scenarios combined is about 64 to 1 If all projects were delivered at current cost estimates the public would get over six dollars of benefits for each dollar expended In current dollars costs total to over $17 billion whereas the benefits are estimated to be over $20 billion
diams The projects also alleviate greenhouse gas (GHG) emissions by over 15 million tons over 20 years averaging over a 75000-ton reduction per year The emissions are estimated using data from the California Air Resources Board (CARB) EMFAC model
This is the first generation CSMP for the I-210 corridor It is important to stress that CSMPs should be updated on a regular basis This is particularly important since traffic conditions and patterns can differ from current projections After projects are delivered it is also useful to compare actual results with estimated ones in this document so that models can be further improved as appropriate
CSMPs or a variation thereof should become the normal course of business that is based on detailed performance assessments an in-depth understanding of the reasons for performance deterioration and an analytical framework that allows for evaluating complementary operational strategies that maximize the productivity of the current system

I-210 Corridor System Management Plan Executive Summary
Page 31 of 39
Exhibit ES-28 2020 PM Peak Micro-Simulation Delay Results by Scenario D
ela
y(P
ea
k P
eri
od
Ve
hic
le-H
ou
rs)
30000
25000
20000
15000
10000
5000
-
S2 Expand Ramp Metering
S4 Adv Ramp Metering
S6 Aux Lane Striping Ramp Improvs
S8 Ramp Closures
HOV WB
I-210 WB
HOV EB
-14
S10 On-Ramp amp Aux Lane Improvs
S13 SR-134I-210 IC Modification
S14 Lake Ave Drop Ramp Lane Addition
I-210 EB
Ramps
Arterials
-2 -5 -3 -28
-3 -19
2020 S2 S4 S6 S8 S10 S13 S14 Horizon Scenario
Base Year and Do Minimum Horizon Year
Absent any physical improvements the modeling team estimates that by 2020 total delay (mainline HOV ramps and arterials) would double compared to 2006 (from a total of around 22000 vehicle-hours daily to just fewer than 45000 vehicle-hours) in the combined AM and PM peak
Scenarios 1 and 2 (Expand Ramp Metering)
Scenarios 1 and 2 test the only project on the corridor that was fully constructed and completed The project installed new connector metering at the SR-57 and I-605 to Ishy210 freeway connector ramps The project also widened various ramps removed various HOV meter bypasses and upgraded the ramp metering system
The 2006 model estimates that Scenario 1 would reduce delay on the corridor by around 17 percent (or 1600 daily vehicle-hours) in the PM peak period but only around two percent (or 200 vehicle-hours) in the AM peak period The biggest benefits occur in the PM eastbound direction from Rosemead On-Ramp to Huntington interchange (with a delay reduction of over 1000 vehicle-hours) as well as from I-605 to the Azusa On-Ramp (delay reduction of 500 vehicle-hours) for single occupant vehicles The
I-210 Corridor System Management Plan Executive Summary
Page 32 of 39
westbound reductions in freeway delay are largely offset by increased on-ramp delay mostly from new connector metering at SR-57 and I-605
The 2020 model estimates that Scenario 2 will reduce delay by around 8 percent in the AM peak and 14 percent in the PM peak for a combined total reduction of 5000 daily vehicle-hours The long-term improvements are less than the short-term improvements due to the increase in demand
Scenarios 3 and 4 (Advanced Ramp Metering)
Scenarios 3 and 4 build on Scenarios 1 and 2 by adding advanced ramp metering system such as dynamic or adaptive ramp metering system
The 2006 model shows that Scenario 3 would reduce delay by an additional 850 daily vehicle-hours (or 11 percent) in the PM peak with a marginal reduction in the AM peak period However in conjunction with Scenario 1 Scenario 3 reduces delay in total by over 600 vehicle-hours in the AM peak These results suggest that queue control provides additional benefits beyond SWARM
The 2020 model estimates that Scenario 4 will modestly reduce delay by about 2 percent in both the AM and PM peaks or a combined total of 800 daily vehicle-hours Again the benefits are lower in percentage terms due to the increase in demand
Note that there are various types of advanced ramp metering systems deployed around the world including System-wide Adaptive Ramp Metering System or SWARM tested recently in Los Angeles I-210 freeway corridor For the I-210 model the Asservissement Lineaire drsquoEntreacutee Autoroutiere (ALINEA system) was tested as proxy for any advanced ramp metering system as its algorithm for the model was readily available It is not necessarily recommended that ALINEA be deployed but rather some type of advanced ramp metering system that would produce similar if not better results
Scenarios 5 and 6 (Auxiliary Lane Striping Ramp Improvements)
Scenarios 5 and 6 build on Scenarios 3 and 4 that include several relatively lower-cost operational improvements that could be implemented by 2015
diams Building a westbound auxiliary lane from Santa Anita to Baldwin and an eastbound auxiliary lane from Santa Anita to Huntington
diams Extending a lane to Lincoln on the westbound I-210 connector
diams Connecting and converging the Altadena on-ramps into a single on-ramp
I-210 Corridor System Management Plan Executive Summary
Page 33 of 39
diams Connecting and converging the Santa Anita on-ramps into a single on-ramp
diams Connecting and converging the Irwindale on-ramps into a single on-ramp
diams Restriping to add a lane in the eastbound direction from San Dimas to Fruit
The 2006 model shows that Scenario 5 reduces delay by 3 percent (nearly 400 vehicleshyhours) in the AM peak and 18 percent (1200 vehicle-hours) in the PM peak The segment that experienced the largest improvement in the eastbound during the PM peak was from Rosemead to Huntington This segment experienced a 45 percent improvement in delay (from 2700 vehicle-hours to 1500 vehicle-hours) which is likely attributed to the eastbound auxiliary lane from Santa Anita to Huntington In the westbound direction the auxiliary lane from Santa Anita to Baldwin shifts some traffic downstream to cause increased congestion at Michillinda (ie bottleneck shift) during the westbound AM peak However the auxiliary lane helps reduce both queue length and queue duration for the Santa Anita bottleneck
The 2020 model estimates that Scenario 6 would reduce delay by 8 percent in the AM peak and 5 percent in the PM peak for a total reduction of 2500 daily vehicle-hours A reduction in PM delay is expected to occur mostly in the westbound direction
Scenarios 7 and 8 (Ramp Closures)
Scenarios 7 and 8 build on Scenarios 5 and 6 and test the closure of several ramps
diams Eastbound Marengo on-ramp and westbound Lake on-ramp with signalization of the eastbound I-210 off-ramp at Maple and improvement to alternate routes along Corson and Maple
diams Eastbound Mount Olive ramps
Note that subsequent scenarios are not built on top of these scenarios as these are isolated to test ramp closure alternatives
The 2006 model shows that Scenario 7 would reduce delay significantly by 16 percent in the AM peak and 18 percent in the PM peak for a total delay reduction of nearly 3000 daily vehicle-hours The delay reductions are significant on the mainline during the peak direction of travel ndash 1400 vehicle-hours in the westbound AM and 912 vehicleshyhours in the eastbound PM In the westbound direction and AM peak period the segment from Altadena to Lake experienced over an 85 percent decrease in congestion (from 860 to 120 vehicle-hours of delay) This is likely attributed to the closure of the westbound Lake on-ramp In the eastbound direction and PM peak period the segment from Huntington to I-605 experienced a delay reduction of over 70 percent (from 2200
I-210 Corridor System Management Plan Executive Summary
Page 34 of 39
vehicle-hours to 600 vehicle-hours) which is likely attributed to the closure of the Mount Olive ramp
The 2020 model also shows that Scenario 8 improved delay by 12 percent in the AM and 3 percent in the PM for a total delay reduction of almost 3000 daily vehicle-hours On the mainline facility delay also improved for each peak direction of travel ndash by 1600 daily vehicle-hours in the westbound AM and by 750 vehicle-hours in the eastbound PM Delay reductions in the non-peak direction were not as significant
Scenarios 9 and 10 (On-ramp and Aux Lane Improvements)
Scenarios 9 and 10 build on Scenarios 5 and 6 and test four operational improvements that can be implemented in the short to medium range
diams Modify the RosemeadMichillinda interchange and converge the westbound I-210 on-ramps
diams Modify the northside of the Baldwin interchange and eliminate the collectorshydistributor
diams Construct an eastbound auxiliary lane from Azusa to Citrus
diams Converge the eastbound Citrus on-ramps and add an auxiliary lane to Grand
The 2006 model estimates that Scenario 9 will reduce delay by 20 percent (or 2400 daily vehicle-hours) in the AM peak and 28 percent (or 1600 daily vehicle-hours) in the PM peak compared to Scenario 5 In both AM and PM peak period the eastbound direction experienced the largest reduction in delay
The 2020 model estimates that Scenario 10 will reduce delay by 13 percent (or 2500 vehicle-hours) in the AM peak and 28 percent in the PM peak (or 4800 vehicle-hours) compared to Scenario 6 Similar to the 2006 model the 2020 model shows that these improvements produced a greater reduction in delay in the eastbound direction than the westbound direction
Scenarios 11 and 12 (Enhanced Incident Management)
Two incident scenarios were tested on top of Scenario 10 to evaluate the non-recurrent delay reductions resulting from enhanced incident management strategies An enhanced incident management system would entail upgrading or enhancing the current Caltrans incident management system that includes deployment of intelligent transportation system (ITS) field devices central controlcommunications software communications medium (ie fiber optic lines) advanced traveler information system
I-210 Corridor System Management Plan Executive Summary
Page 35 of 39
andor freeway service patrol (FSP) program to reduce incident detection verification response and clearance times
In the first scenario Scenario 11 one collision incident with one lane closure was simulated in the westbound direction in the AM peak period model and one in the eastbound direction in the PM peak period model The incident simulation location and duration were selected based on review of the 2010 actual incident data at one of the high frequency locations The following are the Scenario details
diams Westbound AM peak period starting at 800 AM close mainline lane 2 for 40 minutes at absolute post mile 2612 (at Lake Avenue)
diams Eastbound PM peak period starting at 500 PM close mainline lane 2 for 50 minutes at absolute post mile 3207 (west of Santa Anita)
In the second scenario Scenario 12 the same collision incidents were simulated with a reduction in duration by 10 minutes in the westbound direction and by 12 minutes in the eastbound direction It is estimated based on actual incident management data analysis results provided by Caltrans that an enhanced incident management system could reduce a 35-minute incident by about 10 minutes This scenario represents a typical moderate level incident at one location during the peak period direction Data suggest that incidents vary significantly in terms of impact and duration Some incidents last hundreds of minutes some close multiple lanes and some occur at multiple locations simultaneously There are also numerous minor incidents lasting only a few minutes without lane closures that can result in congestion Many other incidents also occur during off-peak hours
Without enhanced incident management Scenario 11 produced an 8 percent increase in congestion in both peak periods over Scenario 10 an increase of over 2300 hours of vehicle delay With enhanced incident management Scenario 12 evaluation resulted in delay decrease by 2 percent in the AM peak and 3 percent in the PM peak against Scenario 11 results a reduction of nearly 750 vehicle-hours for improving the incident detection verification response and clearance time of one moderate level incident for both of the peak hours
Scenario 13 (SR-134I-210 Interchange Modification)
Scenario 13 tests an improvement to modify the SR-134I-210 interchange to provide a direct connection for vehicles to continue on I-210 with three lanes in each direction This improvement was tested with the 2020 model since it is not likely to be implemented in the short-term
I-210 Corridor System Management Plan Executive Summary
Page 36 of 39
The 2020 model estimates that delay would be reduced by 11 percent (or 1800 daily vehicle-hours) in the AM and 3 percent in the PM (320 daily vehicle-hours) compared to Scenario 10 The westbound mainline experienced the greatest reduction in delay in the AM peak from 9600 vehicle-hours to 8600 vehicle hours after the interchange modification
Scenario 14 (Westbound Drop Ramp and Eastbound Widening)
Scenario 14 builds on Scenario 13 and tests Lake Avenue drop ramp to westbound Ishy210 center lanes (one HOV lane and one mainline) and eastbound I-210 widening from Myrtle to I-605 This improvement was tested with the 2020 model
The 2020 model estimates that delay would be reduced by about 20 percent in the AM or 3400 vehicle-hours and 20 percent in the PM or 2300 vehicle-hours compared to Scenario 13 The mobility improvements are significant with the westbound drop ramp that reduces weaving between SR-134 and SR-210 destined traffic and with the eastbound capacity addition to I-605 off that moves the off-ramp traffic away from the mainline and provides more room for the mainline through traffic
Post Scenario 14 Conditions
By 2020 with the inclusion of all the projects tested the model reveals some residual congestion that remains to address with future improvements According to the model results the total remaining delay on the corridor is around 21000 daily vehicle-hours
Benefit-Cost Analysis
Following an in-depth review of model results by the study team and the SCAG technical committee the study team performed a benefit-cost analysis (BCA) for each scenario
Using the California Benefit-Cost Model (Cal-BC) developed on behalf of Caltrans by the study team benefits in three key areas were estimated travel time savings vehicle operating cost savings and emission reduction savings The benefits generated from this exercise are based solely on congestion relief related benefits However these results are conservative since there are other benefits not captured by this analysis including benefits from deploying bus rapid transit which will achieve other accessibility benefits
Project costs were developed from SCAG and Caltrans project planning and programming documents These costs include construction and support costs in current dollars The study team estimated costs for projects that did not have cost
I-210 Corridor System Management Plan Executive Summary
Page 37 of 39
estimates by reviewing similar completed projects A BC greater than one means that a scenarios projects return greater benefits than it costs to construct or implement It is important to consider the total benefits that a project brings For example a large capital expansion project can cost a great deal and have a low BC ratio but brings much higher absolute benefits to the I-210 users Exhibit ES-29 shows the benefit to cost ranges classified from low (with a BC of one to two) to very high (with a BC of over 10)
The benefit-cost results for the South Corridor scenarios are shown in Exhibit ES-29
Exhibit ES-29 I-210 Scenario BenefitCost (BC) Results
Scenario Scenario Description
BenefitCost Ranges
Low Medium Medium-High High Very High
lt1 1 to 2 2 to 5 5 to 10 gt10
12 Expand Ramp Metering 34 Advanced Ramp Metering 56 Aux Lane Striping Ramp Improvs 78 Ramp Closures
910 On-Ramp amp Aux Lane Improvs 13 SR-134I-210 IC Modification
The benefit-cost findings for each scenario are as follows
diams Scenarios 1 and 2 (ramp metering expansion) shows a high benefit-cost ratio of over ten The relatively high benefit-cost ratio is due to the low cost of expanding ramp metering ($235 million)
diams Scenarios 3 and 4 (advanced ramp metering) resulted in an incremental benefitshycost ratio of over ten This is relatively high as compared to that of typical transportation management system project
diams Scenarios 5 and 6 (operational improvements) produced a benefit-cost ratio of over five This is relatively consistent with other typical operational improvement projects The benefits are substantial At estimated total cost of about $44 million these projects produced benefits of over $233 million
diams Scenarios 7 and 8 tested the ramp closures at eastbound Marengo westbound Lake and eastbound Mount Olive These ramp closured produced an extremely high incremental benefit-cost ratio of over ten due to the relatively very low cost However this benefit-cost calculation does not account for any potential increase in delay on various local arterials because of detours from the closed ramps
diams Scenarios 9 and 10 also produced a relatively high benefit-cost ratio of over ten The four operational projects in these scenarios are collectively estimated to cost
I-210 Corridor System Management Plan Executive Summary
Page 38 of 39
under $30 million and provide a substantial and optimistic benefit of over $670 million
diams Scenario 13 tested the SR-134I-210 interchange modification This project produced a benefit-cost ratio of between one and two consistent with other typical capital expansion projects This project produced benefits of over $200 million at a rough-estimate cost of about $150 million
diams Scenario 14 tested the westbound center drop ramp from Lake Avenue interchange and eastbound lane addition from Myrtle to I-605 These projects produced a relatively high benefit-cost ratio of about 6 to one as compared to other capital improvement projects These two capital projects are unique in that they have specific operational improvement element that addresses major bottleneck locations For an estimated total combined cost of about $70 million the projected benefits exceed $420 million
CONCLUSIONS AND RECOMMENDATIONS
This section summarizes the conclusions and recommendations based on the analysis discussed in the previous section It is important to note that many of these conclusions are based primarily on the micro-simulation model results The model was developed based on the best data available at the time The study team reviewed the model results and believe that both the calibrated base year forecast year and scenario results are reasonable However Caltrans should always be cautious to make decisions based on modeling alone especially complex micro-simulation models
Based on the results the study team offers the following conclusions and recommendations
diams The combination of all scenarios significantly reduces overall congestion on the corridor Projected 2020 congestion after implementation of all scenarios is below 2006 levels in both the AM and PM peak period In the AM peak period the model projects total delay in 2020 after delivering all projects to be less than 11700 vehicle-hours compared to the 2006 base year delay of 13000 vehicleshyhours This represents a reduction of over 10 percent In the PM peak period the model projects total delay in 2020 after delivering all projects to be around 9500 hours compared to the 2006 base year delay of almost 9300 vehicle-hours This represents a slight reduction of 2 percent Clearly the scenarios deliver significant mobility benefits to the corridor Despite the growth in demand future 2020 congestion will be less than experienced in 2006
diams The completed ramp metering expansion project is expected to produce substantial mobility benefits of over $400 million Delay has been significantly reduced since 2006
I-210 Corridor System Management Plan Executive Summary
Page 39 of 39
diams Advanced ramp metering could provide additional mobility improvements by significantly reducing congestion and returning over $100 million in benefits
diams Ramp closures at Marengo Lake and Mount Olive as alternatives seem promising by reducing delay up to 3000 vehicle-hours per day and providing substantial benefits of $280 million at an extremely low cost
diams Operational improvements such as auxiliary lanes and ramp improvements could leverage on the ramp metering projects by making the corridor more efficient and productive that could result in additional mobility benefits of over $230 million
diams Additional capital improvements with specific operational elements to address weaving at major bottleneck locations could produce significant mobility benefits of over $420 million
diams Enhanced incident management system associated with Scenarios 11 and 12 to address non-recurrent congestion proved effective with a delay reduction of over 300 vehicle-hours for one modest level incident with a typical duration of 35 minutes reduced to 25 minutes With the I-210 corridor experiencing up to 2400 collisions per year this translates to a total annual delay savings of over 700000 vehicle-hours for the study corridor
diams The benefit-cost ratio of all scenarios combined is about 64 to 1 If all projects were delivered at current cost estimates the public would get over six dollars of benefits for each dollar expended In current dollars costs total to over $17 billion whereas the benefits are estimated to be over $20 billion
diams The projects also alleviate greenhouse gas (GHG) emissions by over 15 million tons over 20 years averaging over a 75000-ton reduction per year The emissions are estimated using data from the California Air Resources Board (CARB) EMFAC model
This is the first generation CSMP for the I-210 corridor It is important to stress that CSMPs should be updated on a regular basis This is particularly important since traffic conditions and patterns can differ from current projections After projects are delivered it is also useful to compare actual results with estimated ones in this document so that models can be further improved as appropriate
CSMPs or a variation thereof should become the normal course of business that is based on detailed performance assessments an in-depth understanding of the reasons for performance deterioration and an analytical framework that allows for evaluating complementary operational strategies that maximize the productivity of the current system
I-210 Corridor System Management Plan Executive Summary
Page 33 of 39
diams Connecting and converging the Santa Anita on-ramps into a single on-ramp
diams Connecting and converging the Irwindale on-ramps into a single on-ramp
diams Restriping to add a lane in the eastbound direction from San Dimas to Fruit
The 2006 model shows that Scenario 5 reduces delay by 3 percent (nearly 400 vehicleshyhours) in the AM peak and 18 percent (1200 vehicle-hours) in the PM peak The segment that experienced the largest improvement in the eastbound during the PM peak was from Rosemead to Huntington This segment experienced a 45 percent improvement in delay (from 2700 vehicle-hours to 1500 vehicle-hours) which is likely attributed to the eastbound auxiliary lane from Santa Anita to Huntington In the westbound direction the auxiliary lane from Santa Anita to Baldwin shifts some traffic downstream to cause increased congestion at Michillinda (ie bottleneck shift) during the westbound AM peak However the auxiliary lane helps reduce both queue length and queue duration for the Santa Anita bottleneck
The 2020 model estimates that Scenario 6 would reduce delay by 8 percent in the AM peak and 5 percent in the PM peak for a total reduction of 2500 daily vehicle-hours A reduction in PM delay is expected to occur mostly in the westbound direction
Scenarios 7 and 8 (Ramp Closures)
Scenarios 7 and 8 build on Scenarios 5 and 6 and test the closure of several ramps
diams Eastbound Marengo on-ramp and westbound Lake on-ramp with signalization of the eastbound I-210 off-ramp at Maple and improvement to alternate routes along Corson and Maple
diams Eastbound Mount Olive ramps
Note that subsequent scenarios are not built on top of these scenarios as these are isolated to test ramp closure alternatives
The 2006 model shows that Scenario 7 would reduce delay significantly by 16 percent in the AM peak and 18 percent in the PM peak for a total delay reduction of nearly 3000 daily vehicle-hours The delay reductions are significant on the mainline during the peak direction of travel ndash 1400 vehicle-hours in the westbound AM and 912 vehicleshyhours in the eastbound PM In the westbound direction and AM peak period the segment from Altadena to Lake experienced over an 85 percent decrease in congestion (from 860 to 120 vehicle-hours of delay) This is likely attributed to the closure of the westbound Lake on-ramp In the eastbound direction and PM peak period the segment from Huntington to I-605 experienced a delay reduction of over 70 percent (from 2200
I-210 Corridor System Management Plan Executive Summary
Page 34 of 39
vehicle-hours to 600 vehicle-hours) which is likely attributed to the closure of the Mount Olive ramp
The 2020 model also shows that Scenario 8 improved delay by 12 percent in the AM and 3 percent in the PM for a total delay reduction of almost 3000 daily vehicle-hours On the mainline facility delay also improved for each peak direction of travel ndash by 1600 daily vehicle-hours in the westbound AM and by 750 vehicle-hours in the eastbound PM Delay reductions in the non-peak direction were not as significant
Scenarios 9 and 10 (On-ramp and Aux Lane Improvements)
Scenarios 9 and 10 build on Scenarios 5 and 6 and test four operational improvements that can be implemented in the short to medium range
diams Modify the RosemeadMichillinda interchange and converge the westbound I-210 on-ramps
diams Modify the northside of the Baldwin interchange and eliminate the collectorshydistributor
diams Construct an eastbound auxiliary lane from Azusa to Citrus
diams Converge the eastbound Citrus on-ramps and add an auxiliary lane to Grand
The 2006 model estimates that Scenario 9 will reduce delay by 20 percent (or 2400 daily vehicle-hours) in the AM peak and 28 percent (or 1600 daily vehicle-hours) in the PM peak compared to Scenario 5 In both AM and PM peak period the eastbound direction experienced the largest reduction in delay
The 2020 model estimates that Scenario 10 will reduce delay by 13 percent (or 2500 vehicle-hours) in the AM peak and 28 percent in the PM peak (or 4800 vehicle-hours) compared to Scenario 6 Similar to the 2006 model the 2020 model shows that these improvements produced a greater reduction in delay in the eastbound direction than the westbound direction
Scenarios 11 and 12 (Enhanced Incident Management)
Two incident scenarios were tested on top of Scenario 10 to evaluate the non-recurrent delay reductions resulting from enhanced incident management strategies An enhanced incident management system would entail upgrading or enhancing the current Caltrans incident management system that includes deployment of intelligent transportation system (ITS) field devices central controlcommunications software communications medium (ie fiber optic lines) advanced traveler information system
I-210 Corridor System Management Plan Executive Summary
Page 35 of 39
andor freeway service patrol (FSP) program to reduce incident detection verification response and clearance times
In the first scenario Scenario 11 one collision incident with one lane closure was simulated in the westbound direction in the AM peak period model and one in the eastbound direction in the PM peak period model The incident simulation location and duration were selected based on review of the 2010 actual incident data at one of the high frequency locations The following are the Scenario details
diams Westbound AM peak period starting at 800 AM close mainline lane 2 for 40 minutes at absolute post mile 2612 (at Lake Avenue)
diams Eastbound PM peak period starting at 500 PM close mainline lane 2 for 50 minutes at absolute post mile 3207 (west of Santa Anita)
In the second scenario Scenario 12 the same collision incidents were simulated with a reduction in duration by 10 minutes in the westbound direction and by 12 minutes in the eastbound direction It is estimated based on actual incident management data analysis results provided by Caltrans that an enhanced incident management system could reduce a 35-minute incident by about 10 minutes This scenario represents a typical moderate level incident at one location during the peak period direction Data suggest that incidents vary significantly in terms of impact and duration Some incidents last hundreds of minutes some close multiple lanes and some occur at multiple locations simultaneously There are also numerous minor incidents lasting only a few minutes without lane closures that can result in congestion Many other incidents also occur during off-peak hours
Without enhanced incident management Scenario 11 produced an 8 percent increase in congestion in both peak periods over Scenario 10 an increase of over 2300 hours of vehicle delay With enhanced incident management Scenario 12 evaluation resulted in delay decrease by 2 percent in the AM peak and 3 percent in the PM peak against Scenario 11 results a reduction of nearly 750 vehicle-hours for improving the incident detection verification response and clearance time of one moderate level incident for both of the peak hours
Scenario 13 (SR-134I-210 Interchange Modification)
Scenario 13 tests an improvement to modify the SR-134I-210 interchange to provide a direct connection for vehicles to continue on I-210 with three lanes in each direction This improvement was tested with the 2020 model since it is not likely to be implemented in the short-term
I-210 Corridor System Management Plan Executive Summary
Page 36 of 39
The 2020 model estimates that delay would be reduced by 11 percent (or 1800 daily vehicle-hours) in the AM and 3 percent in the PM (320 daily vehicle-hours) compared to Scenario 10 The westbound mainline experienced the greatest reduction in delay in the AM peak from 9600 vehicle-hours to 8600 vehicle hours after the interchange modification
Scenario 14 (Westbound Drop Ramp and Eastbound Widening)
Scenario 14 builds on Scenario 13 and tests Lake Avenue drop ramp to westbound Ishy210 center lanes (one HOV lane and one mainline) and eastbound I-210 widening from Myrtle to I-605 This improvement was tested with the 2020 model
The 2020 model estimates that delay would be reduced by about 20 percent in the AM or 3400 vehicle-hours and 20 percent in the PM or 2300 vehicle-hours compared to Scenario 13 The mobility improvements are significant with the westbound drop ramp that reduces weaving between SR-134 and SR-210 destined traffic and with the eastbound capacity addition to I-605 off that moves the off-ramp traffic away from the mainline and provides more room for the mainline through traffic
Post Scenario 14 Conditions
By 2020 with the inclusion of all the projects tested the model reveals some residual congestion that remains to address with future improvements According to the model results the total remaining delay on the corridor is around 21000 daily vehicle-hours
Benefit-Cost Analysis
Following an in-depth review of model results by the study team and the SCAG technical committee the study team performed a benefit-cost analysis (BCA) for each scenario
Using the California Benefit-Cost Model (Cal-BC) developed on behalf of Caltrans by the study team benefits in three key areas were estimated travel time savings vehicle operating cost savings and emission reduction savings The benefits generated from this exercise are based solely on congestion relief related benefits However these results are conservative since there are other benefits not captured by this analysis including benefits from deploying bus rapid transit which will achieve other accessibility benefits
Project costs were developed from SCAG and Caltrans project planning and programming documents These costs include construction and support costs in current dollars The study team estimated costs for projects that did not have cost
I-210 Corridor System Management Plan Executive Summary
Page 37 of 39
estimates by reviewing similar completed projects A BC greater than one means that a scenarios projects return greater benefits than it costs to construct or implement It is important to consider the total benefits that a project brings For example a large capital expansion project can cost a great deal and have a low BC ratio but brings much higher absolute benefits to the I-210 users Exhibit ES-29 shows the benefit to cost ranges classified from low (with a BC of one to two) to very high (with a BC of over 10)
The benefit-cost results for the South Corridor scenarios are shown in Exhibit ES-29
Exhibit ES-29 I-210 Scenario BenefitCost (BC) Results
Scenario Scenario Description
BenefitCost Ranges
Low Medium Medium-High High Very High
lt1 1 to 2 2 to 5 5 to 10 gt10
12 Expand Ramp Metering 34 Advanced Ramp Metering 56 Aux Lane Striping Ramp Improvs 78 Ramp Closures
910 On-Ramp amp Aux Lane Improvs 13 SR-134I-210 IC Modification
The benefit-cost findings for each scenario are as follows
diams Scenarios 1 and 2 (ramp metering expansion) shows a high benefit-cost ratio of over ten The relatively high benefit-cost ratio is due to the low cost of expanding ramp metering ($235 million)
diams Scenarios 3 and 4 (advanced ramp metering) resulted in an incremental benefitshycost ratio of over ten This is relatively high as compared to that of typical transportation management system project
diams Scenarios 5 and 6 (operational improvements) produced a benefit-cost ratio of over five This is relatively consistent with other typical operational improvement projects The benefits are substantial At estimated total cost of about $44 million these projects produced benefits of over $233 million
diams Scenarios 7 and 8 tested the ramp closures at eastbound Marengo westbound Lake and eastbound Mount Olive These ramp closured produced an extremely high incremental benefit-cost ratio of over ten due to the relatively very low cost However this benefit-cost calculation does not account for any potential increase in delay on various local arterials because of detours from the closed ramps
diams Scenarios 9 and 10 also produced a relatively high benefit-cost ratio of over ten The four operational projects in these scenarios are collectively estimated to cost
I-210 Corridor System Management Plan Executive Summary
Page 38 of 39
under $30 million and provide a substantial and optimistic benefit of over $670 million
diams Scenario 13 tested the SR-134I-210 interchange modification This project produced a benefit-cost ratio of between one and two consistent with other typical capital expansion projects This project produced benefits of over $200 million at a rough-estimate cost of about $150 million
diams Scenario 14 tested the westbound center drop ramp from Lake Avenue interchange and eastbound lane addition from Myrtle to I-605 These projects produced a relatively high benefit-cost ratio of about 6 to one as compared to other capital improvement projects These two capital projects are unique in that they have specific operational improvement element that addresses major bottleneck locations For an estimated total combined cost of about $70 million the projected benefits exceed $420 million
CONCLUSIONS AND RECOMMENDATIONS
This section summarizes the conclusions and recommendations based on the analysis discussed in the previous section It is important to note that many of these conclusions are based primarily on the micro-simulation model results The model was developed based on the best data available at the time The study team reviewed the model results and believe that both the calibrated base year forecast year and scenario results are reasonable However Caltrans should always be cautious to make decisions based on modeling alone especially complex micro-simulation models
Based on the results the study team offers the following conclusions and recommendations
diams The combination of all scenarios significantly reduces overall congestion on the corridor Projected 2020 congestion after implementation of all scenarios is below 2006 levels in both the AM and PM peak period In the AM peak period the model projects total delay in 2020 after delivering all projects to be less than 11700 vehicle-hours compared to the 2006 base year delay of 13000 vehicleshyhours This represents a reduction of over 10 percent In the PM peak period the model projects total delay in 2020 after delivering all projects to be around 9500 hours compared to the 2006 base year delay of almost 9300 vehicle-hours This represents a slight reduction of 2 percent Clearly the scenarios deliver significant mobility benefits to the corridor Despite the growth in demand future 2020 congestion will be less than experienced in 2006
diams The completed ramp metering expansion project is expected to produce substantial mobility benefits of over $400 million Delay has been significantly reduced since 2006
I-210 Corridor System Management Plan Executive Summary
Page 39 of 39
diams Advanced ramp metering could provide additional mobility improvements by significantly reducing congestion and returning over $100 million in benefits
diams Ramp closures at Marengo Lake and Mount Olive as alternatives seem promising by reducing delay up to 3000 vehicle-hours per day and providing substantial benefits of $280 million at an extremely low cost
diams Operational improvements such as auxiliary lanes and ramp improvements could leverage on the ramp metering projects by making the corridor more efficient and productive that could result in additional mobility benefits of over $230 million
diams Additional capital improvements with specific operational elements to address weaving at major bottleneck locations could produce significant mobility benefits of over $420 million
diams Enhanced incident management system associated with Scenarios 11 and 12 to address non-recurrent congestion proved effective with a delay reduction of over 300 vehicle-hours for one modest level incident with a typical duration of 35 minutes reduced to 25 minutes With the I-210 corridor experiencing up to 2400 collisions per year this translates to a total annual delay savings of over 700000 vehicle-hours for the study corridor
diams The benefit-cost ratio of all scenarios combined is about 64 to 1 If all projects were delivered at current cost estimates the public would get over six dollars of benefits for each dollar expended In current dollars costs total to over $17 billion whereas the benefits are estimated to be over $20 billion
diams The projects also alleviate greenhouse gas (GHG) emissions by over 15 million tons over 20 years averaging over a 75000-ton reduction per year The emissions are estimated using data from the California Air Resources Board (CARB) EMFAC model
This is the first generation CSMP for the I-210 corridor It is important to stress that CSMPs should be updated on a regular basis This is particularly important since traffic conditions and patterns can differ from current projections After projects are delivered it is also useful to compare actual results with estimated ones in this document so that models can be further improved as appropriate
CSMPs or a variation thereof should become the normal course of business that is based on detailed performance assessments an in-depth understanding of the reasons for performance deterioration and an analytical framework that allows for evaluating complementary operational strategies that maximize the productivity of the current system

I-210 Corridor System Management Plan Executive Summary
Page 38 of 39
under $30 million and provide a substantial and optimistic benefit of over $670 million
diams Scenario 13 tested the SR-134I-210 interchange modification This project produced a benefit-cost ratio of between one and two consistent with other typical capital expansion projects This project produced benefits of over $200 million at a rough-estimate cost of about $150 million
diams Scenario 14 tested the westbound center drop ramp from Lake Avenue interchange and eastbound lane addition from Myrtle to I-605 These projects produced a relatively high benefit-cost ratio of about 6 to one as compared to other capital improvement projects These two capital projects are unique in that they have specific operational improvement element that addresses major bottleneck locations For an estimated total combined cost of about $70 million the projected benefits exceed $420 million
CONCLUSIONS AND RECOMMENDATIONS
This section summarizes the conclusions and recommendations based on the analysis discussed in the previous section It is important to note that many of these conclusions are based primarily on the micro-simulation model results The model was developed based on the best data available at the time The study team reviewed the model results and believe that both the calibrated base year forecast year and scenario results are reasonable However Caltrans should always be cautious to make decisions based on modeling alone especially complex micro-simulation models
Based on the results the study team offers the following conclusions and recommendations
diams The combination of all scenarios significantly reduces overall congestion on the corridor Projected 2020 congestion after implementation of all scenarios is below 2006 levels in both the AM and PM peak period In the AM peak period the model projects total delay in 2020 after delivering all projects to be less than 11700 vehicle-hours compared to the 2006 base year delay of 13000 vehicleshyhours This represents a reduction of over 10 percent In the PM peak period the model projects total delay in 2020 after delivering all projects to be around 9500 hours compared to the 2006 base year delay of almost 9300 vehicle-hours This represents a slight reduction of 2 percent Clearly the scenarios deliver significant mobility benefits to the corridor Despite the growth in demand future 2020 congestion will be less than experienced in 2006
diams The completed ramp metering expansion project is expected to produce substantial mobility benefits of over $400 million Delay has been significantly reduced since 2006
I-210 Corridor System Management Plan Executive Summary
Page 39 of 39
diams Advanced ramp metering could provide additional mobility improvements by significantly reducing congestion and returning over $100 million in benefits
diams Ramp closures at Marengo Lake and Mount Olive as alternatives seem promising by reducing delay up to 3000 vehicle-hours per day and providing substantial benefits of $280 million at an extremely low cost
diams Operational improvements such as auxiliary lanes and ramp improvements could leverage on the ramp metering projects by making the corridor more efficient and productive that could result in additional mobility benefits of over $230 million
diams Additional capital improvements with specific operational elements to address weaving at major bottleneck locations could produce significant mobility benefits of over $420 million
diams Enhanced incident management system associated with Scenarios 11 and 12 to address non-recurrent congestion proved effective with a delay reduction of over 300 vehicle-hours for one modest level incident with a typical duration of 35 minutes reduced to 25 minutes With the I-210 corridor experiencing up to 2400 collisions per year this translates to a total annual delay savings of over 700000 vehicle-hours for the study corridor
diams The benefit-cost ratio of all scenarios combined is about 64 to 1 If all projects were delivered at current cost estimates the public would get over six dollars of benefits for each dollar expended In current dollars costs total to over $17 billion whereas the benefits are estimated to be over $20 billion
diams The projects also alleviate greenhouse gas (GHG) emissions by over 15 million tons over 20 years averaging over a 75000-ton reduction per year The emissions are estimated using data from the California Air Resources Board (CARB) EMFAC model
This is the first generation CSMP for the I-210 corridor It is important to stress that CSMPs should be updated on a regular basis This is particularly important since traffic conditions and patterns can differ from current projections After projects are delivered it is also useful to compare actual results with estimated ones in this document so that models can be further improved as appropriate
CSMPs or a variation thereof should become the normal course of business that is based on detailed performance assessments an in-depth understanding of the reasons for performance deterioration and an analytical framework that allows for evaluating complementary operational strategies that maximize the productivity of the current system