Embed Size (px)
Citation preview
FINALI‐15 Corridor System Characteristics:
Socioeconomics
March 2012
F i n a l T e c h n i c a l M e m o r a n d u m
I-15 Corridor System Master Plan
Corridor System Characteristics: Socioeconomics
Prepared for:
I-15 Mobility Alliance March 2012
Prepared By:
Jennifer Daigre, PE
Contributors:
Candice Hein Dan Andersen
Loren Bloomberg, PE Bardia Nezhati, PE, PTOE
Robert E. Lang, Ph.D. Barry Banks- WSA David Hurst- WSA
Alex Barnum- WSA
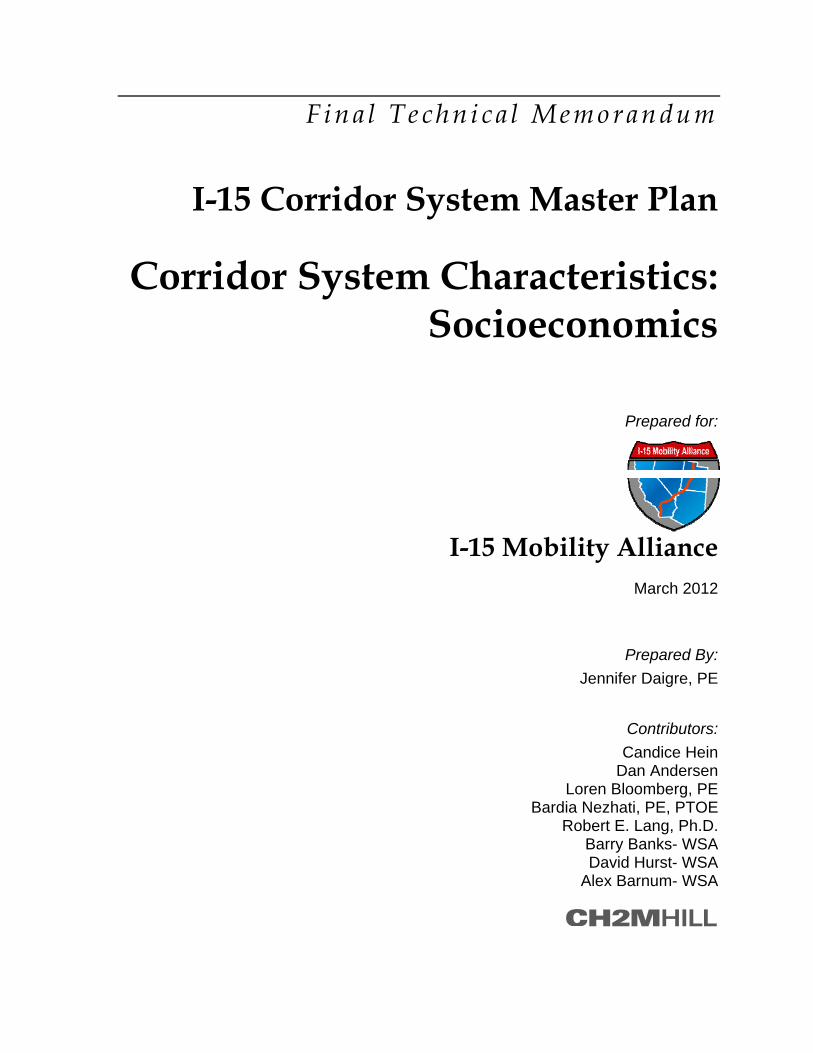
Table of Contents
I-15 Corridor ......................................................................................................................................... 1
I-15 Mobility Alliance and Corridor System Master Plan ................................................ 2 Study Area ............................................................................................................................... 2 Corridor System Characteristics Technical Memoranda .................................................. 4
Socioeconomic Characteristics ........................................................................................................... 5 San Diego Region ................................................................................................................... 7 Southern California Region ................................................................................................. 11 Las Vegas Region .................................................................................................................. 13 Phoenix Region ..................................................................................................................... 14 Salt Lake Region ................................................................................................................... 16 Economic Development (Future Growth Trends, Goods Movement) ......................... 21
List of Acronyms ............................................................................................................................... 24 Works Cited ........................................................................................................................................ 28
List of Exhibits Exhibit 1: Corridors of the Future ..................................................................................................... 1 Exhibit 2: Study Area .......................................................................................................................... 3 Exhibit 3: Population by Mega-Region, 2009 and 2050 .................................................................. 7 Exhibit 4: Employment by Mega-Region, 2009 and 2050 ............................................................... 7 Exhibit 5: San Diego Region Population and Employment Growth ............................................ 8 Exhibit 6: San Diego Population Growth Rate ................................................................................ 8 Exhibit 7: San Diego Region 2050 Population Densities ................................................................ 9 Exhibit 8: San Diego Region 2050 Employment Densities ........................................................... 10 Exhibit 9: Southern California Region Population and Employment ........................................ 11 Exhibit 10: Southern California Region Population Increase, 2003 - 2035 ................................. 12 Exhibit 11: Southern California Region Employment Increase, 2003 - 2035 ............................. 12 Exhibit 12: Southern Nevada Population and Employment Growth ........................................ 13 Exhibit 13: Clark County Population and Employment Growth ............................................... 14 Exhibit 14: Maricopa County Population and Employment Growth ........................................ 15 Exhibit 15: Maricopa County Population Density 2050 ............................................................... 15 Exhibit 16: Maricopa County Employment Density 2050 ............................................................ 16 Exhibit 17: Wasatch Front Region Population and Employment ............................................... 17 Exhibit 18: Utah Population by Multi-County District ................................................................ 17 Exhibit 19: Wasatch Front Urban Area 2030 .................................................................................. 19 Exhibit 20: Wasatch Front Urban Area 2030 .................................................................................. 19 Exhibit 21: Washington County Population and Employment Growth .................................... 20 Exhibit 22: Unemployment Rates for California, Nevada, Arizona and Utah ......................... 22 Exhibit 23: San Pedro Bay Ports Yearly Container Totals in TEUs ............................................. 23
List of Tables
Table 1: Population along I-15 Corridor ........................................................................................... 6 Table 2: U.S. Economic Indicators ................................................................................................... 21
I-15CSMP_CORRCHAR_SOCIO-ECONOMICS 1
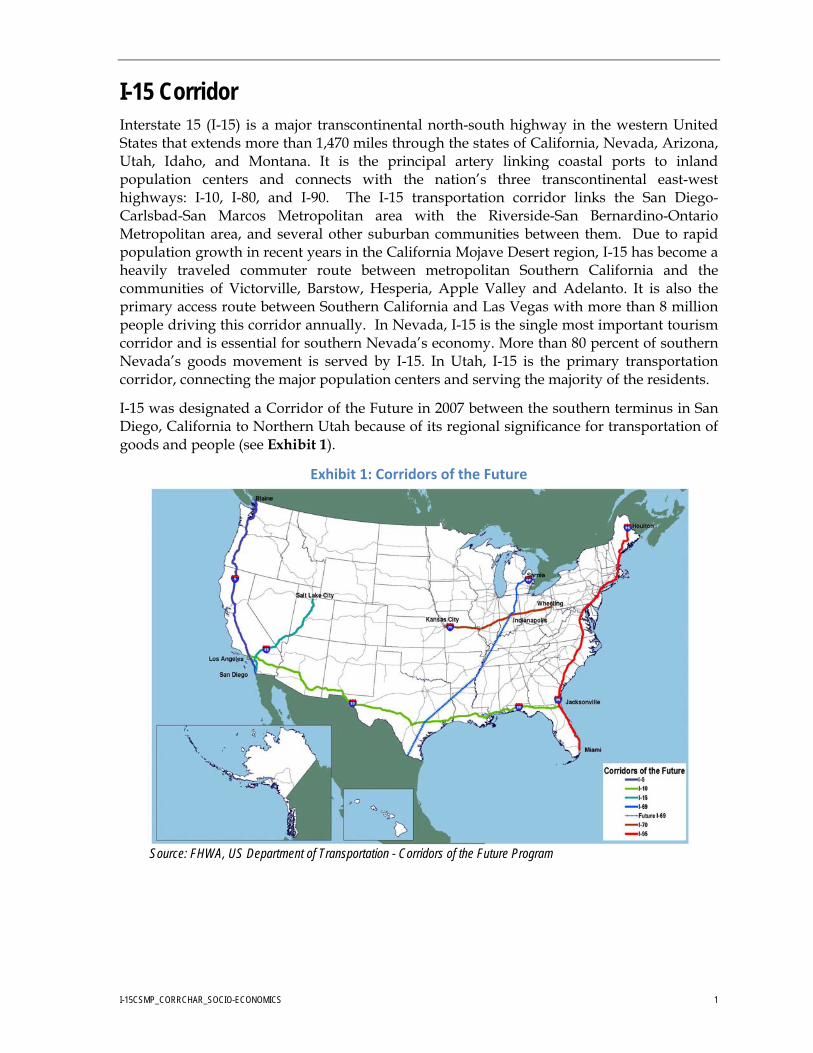
I-15 Corridor Interstate 15 (I-15) is a major transcontinental north-south highway in the western United States that extends more than 1,470 miles through the states of California, Nevada, Arizona, Utah, Idaho, and Montana. It is the principal artery linking coastal ports to inland population centers and connects with the nation’s three transcontinental east-west highways: I-10, I-80, and I-90. The I-15 transportation corridor links the San Diego-Carlsbad-San Marcos Metropolitan area with the Riverside-San Bernardino-Ontario Metropolitan area, and several other suburban communities between them. Due to rapid population growth in recent years in the California Mojave Desert region, I-15 has become a heavily traveled commuter route between metropolitan Southern California and the communities of Victorville, Barstow, Hesperia, Apple Valley and Adelanto. It is also the primary access route between Southern California and Las Vegas with more than 8 million people driving this corridor annually. In Nevada, I-15 is the single most important tourism corridor and is essential for southern Nevada’s economy. More than 80 percent of southern Nevada’s goods movement is served by I-15. In Utah, I-15 is the primary transportation corridor, connecting the major population centers and serving the majority of the residents.
I-15 was designated a Corridor of the Future in 2007 between the southern terminus in San Diego, California to Northern Utah because of its regional significance for transportation of goods and people (see Exhibit 1).
Exhibit 1: Corridors of the Future
Source: FHWA, US Department of Transportation - Corridors of the Future Program
I-15CSMP_CORRCHAR_SOCIO-ECONOMICS 2
I-15 Mobility Alliance and Corridor System Master Plan The Departments of Transportation (DOTs) in California, Nevada, Arizona, and Utah have formed a cooperative alliance (I-15 Mobility Alliance) to develop a long-range multimodal transportation system master plan that will address current and future mobility needs along the I-15 corridor from Southern California to Northern Utah. This is an alliance of public and private agencies and users of the I-15 corridor working together to enhance the movement of people, freight and other commodities for decades to come.
The I-15 Corridor System Master Plan (Master Plan) contains multimodal solutions to mobility challenges within the corridor including moving more people and goods via rail, air, and transit in addition to potential highway and local/regional road network improvements. This Master Plan will also consider sustainable transportation solutions that integrate energy, data, and communications within the corridor.
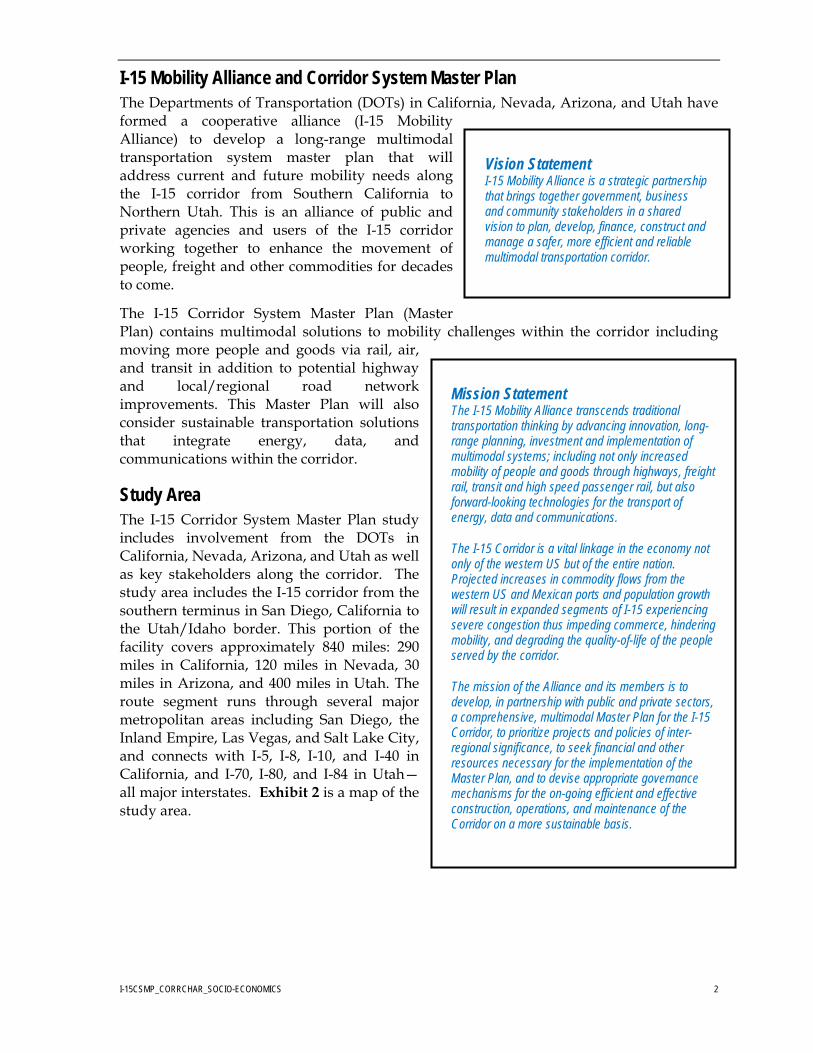
Study Area The I-15 Corridor System Master Plan study includes involvement from the DOTs in California, Nevada, Arizona, and Utah as well as key stakeholders along the corridor. The study area includes the I-15 corridor from the southern terminus in San Diego, California to the Utah/Idaho border. This portion of the facility covers approximately 840 miles: 290 miles in California, 120 miles in Nevada, 30 miles in Arizona, and 400 miles in Utah. The route segment runs through several major metropolitan areas including San Diego, the Inland Empire, Las Vegas, and Salt Lake City, and connects with I-5, I-8, I-10, and I-40 in California, and I-70, I-80, and I-84 in Utah—all major interstates. Exhibit 2 is a map of the study area.
Mission Statement The I-15 Mobility Alliance transcends traditional transportation thinking by advancing innovation, long-range planning, investment and implementation of multimodal systems; including not only increased mobility of people and goods through highways, freight rail, transit and high speed passenger rail, but also forward-looking technologies for the transport of energy, data and communications.
The I-15 Corridor is a vital linkage in the economy not only of the western US but of the entire nation. Projected increases in commodity flows from the western US and Mexican ports and population growth will result in expanded segments of I-15 experiencing severe congestion thus impeding commerce, hindering mobility, and degrading the quality-of-life of the people served by the corridor.
The mission of the Alliance and its members is to develop, in partnership with public and private sectors, a comprehensive, multimodal Master Plan for the I-15 Corridor, to prioritize projects and policies of inter-regional significance, to seek financial and other resources necessary for the implementation of the Master Plan, and to devise appropriate governance mechanisms for the on-going efficient and effective construction, operations, and maintenance of the Corridor on a more sustainable basis.
Vision Statement I-15 Mobility Alliance is a strategic partnership that brings together government, business and community stakeholders in a shared vision to plan, develop, finance, construct and manage a safer, more efficient and reliable multimodal transportation corridor.

I-15CSMP_CORRCHAR_SOCIO-ECONOMICS 3
Exhibit 2: Study Area
I-15CSMP_CORRCHAR_SOCIO-ECONOMICS 4
Corridor System Characteristics Technical Memoranda These technical memoranda provide an overview of the regional and corridor characteristics, including details of the mega-regions along the corridor (San Diego, Southern California, Las Vegas, Phoenix and Salt Lake) and how they are interconnected. They also provide descriptions of the existing and future conditions of various modes along the corridor. There are six sections including:
Socioeconomic Characteristics – provides a detailed discussion of the population and employment growth for each mega-region.
Highways – includes a description of existing and future I-15 corridor characteristics such as average daily traffic (ADT) volumes, number of lanes, posted speeds, major interchanges, safety and ITS elements.
Passenger Rail – provides a description of existing and future passenger rail systems including information on future high speed rail projects.
Aviation - contains information on the airports affecting I-15 in each mega-region along the corridor.
ITS – provides an overview of existing ITS elements and potential future highway technologies applicable to the I-15 corridor.
Bicycling – provides an overview of existing and future bicycle route systems including the United States Bicycle Route System (USBRS).
I-15CSMP_CORRCHAR_SOCIO-ECONOMICS 5
Socioeconomic Characteristics The I-15 Corridor traverses through some of the most densely populated and fastest growing counties in the United States (US), including the urban and/or suburban areas of San Diego, Los Angeles, Las Vegas, Salt Lake City. According to the US Census Bureau, the total population of the counties located within 100 miles of the I-15 Corridor was roughly 24 million in 2009, which represents a 13 percent increase from the 2000 census. During this period, total US population increased by about 9 percent. Population in the counties that are located within 100 miles of the I-15 Corridor accounted for about 7.7 percent of total US population in 2009.
According to the US Census Bureau, Nevada, Arizona and Utah were the fastest growing states in the US with population increases of 25 to 32 percent from the 2000 census. Based on forecast data, it is anticipated that these states within the I-15 Corridor will continue to grow at relatively high rates as shown in Table 1. In particular, Clark County’s population reached 1.9 million in 2009 and is expected to more than double by 2050. Table 1-1 includes counties that are within 100 miles of I-15. Population in the counties located within 100 miles of the I-15 Corridor is projected to account for over 10% of the total US population in 2050 with over 43 million people.
Five mega-regions were evaluated along the I-15 Corridor between Southern California and Northern Utah. These mega-regions include the San Diego, Southern California, Las Vegas, Phoenix and Salt Lake regions. Population and employment characteristics of the five mega-regions are identified in this section. Future population and employment estimates are also provided based on projections developed by each region.
Estimates of the existing population and employment in the study area were based on 2009 data from the United States Census Bureau and the United States Bureau of Labor Statistics. Future 2050 projections were based on data from various sources available for each mega-region. Exhibit 3 and Exhibit 4 provide a summary of existing 2009 and future 2050 projections of population and employment in each mega-region. A detailed discussion of the population and employment growth for each mega-region is provided in the subsections below.

I-15CSMP_CORRCHAR_SOCIO-ECONOMICS 6
Table 1: Population along I‐15 Corridor
Population
2000 2009 2050
California
San Diego 2,813,833 3,185,642 4,384,867
Riverside 1,545,387 2,125,440 4,730,922
San Bernardino 1,709,434 2,017,673 3,662,193
Los Angeles 9,519,331 9,848,011 12,920,082
Orange 2,846,297 3,026,786 3,788,186
Ventura 753,186 802,983 1,067,227
Kern 661,645 807,407 2,106,024
Imperial 142,361 166,874 357,579
Inyo* 17,945 17,293 17,616
Nevada
Clark 1,375,765 1,902,834 3,925,800
Lincoln* 4,165 4,794 9,480*
Nye* 32,485 44,234 222,490*
Arizona
Mohave 155,032 194,825 400,695
Coconino 116,318 129,849 198,149
Utah
Washington 90,354 137,473 709,674
Iron 33,779 45,280 137,240
Beaver 6,005 6,267 21,971
Millard 12,405 12,276 28,538
Juab 8,238 10,244 29,728
Utah 368,536 545,307 1,261,653
Salt Lake 898,387 1,034,989 1,853,891
Davis 238,994 300,827 424,318
Weber 196,533 231,834 429,628
Box Elder 42,745 49,902 102,910
Kane 6,046 6,601 14,267
Garfield 4,735 4,625 8,738
Piute 1,435 1,431 2,035
Sevier 18,842 19,976 29,828
Sanpete 22,763 25,946 45,624
Wasatch 15,215 21,600 86,393
Summit 29,736 36,969 131,594
Morgan 7,129 8,908 48,662
Rich 1,961 2,160 3,473
Cache 91,391 115,269 274,527
Tooele 40,735 58,335 192,007
Duchesne 14,371 17,948 24,586
Carbon 20,425 19,989 28,275
Emery 10,962 10,629 13,313
Total I-15 Corridor 23,838,256 26,950,402 43,462,213
Total US 281,421,906 307,006,550 419,853,587 % I-15 Corridor/US 8.5% 8.8% 10.4%
* Calculated 2050 population based on annual growth rate from 2000 to 2009 census data for Inyo, Lincoln & Nye Counties Sources: US Census Bureau, SANDAG, CA Department of Finance, Kern COG, UNLV Center for Business and Economic Research, AZ Department of Economic Security, and Utah Governor’s Office of Planning and Budget

I-15CSMP_CORRCHAR_SOCIO-ECONOMICS 7
Exhibit 3: Population by Mega‐Region, 2009 and 2050
Sources: US Census Bureau, SANDAG, SCAG, Kern COG, UNLV, MAG, and Utah Governor’s Office of Planning and Budget
Exhibit 4: Employment by Mega‐Region, 2009 and 2050
Sources: Existing data from the US Bureau of Labor Statistics, SCAG, SANDAG, Kern COG, UNLV, MAG, and Utah Governor’s Office of Planning and Budget
San Diego Region
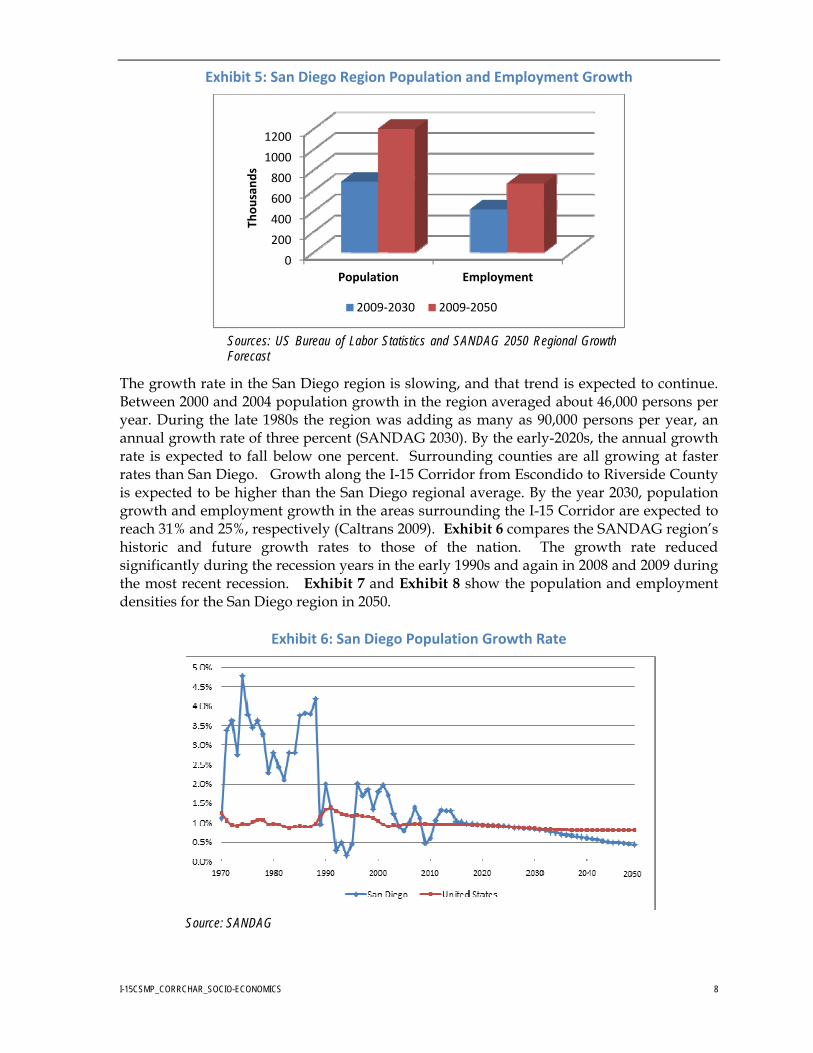
Population/Employment The San Diego region includes San Diego County, which is the second most populated county in the state of California after Los Angeles (US Census Bureau 2009). The San Diego Association of Governments (SANDAG) 2050 Regional Growth Forecast projects that between 2009 and 2030, the region will add about 680,000 more people and roughly half a million new jobs. Between 2009 and 2050 there will be approximately 1.2 million more people and approximately 670,000 new jobs (see Exhibit 5).
0
5000
10000
15000
20000
25000
30000
San Diego Southern California
Las Vegas Phoenix Salt Lake
Thousands
Existing 2009 Future 2050
0
2000
4000
6000
8000
10000
12000
San Diego Southern California
Las Vegas Phoenix Salt Lake
Thousands
Existing 2009 Future 2050
I-15CSMP_CORRCHAR_SOCIO-ECONOMICS 8
Exhibit 5: San Diego Region Population and Employment Growth
Sources: US Bureau of Labor Statistics and SANDAG 2050 Regional Growth Forecast
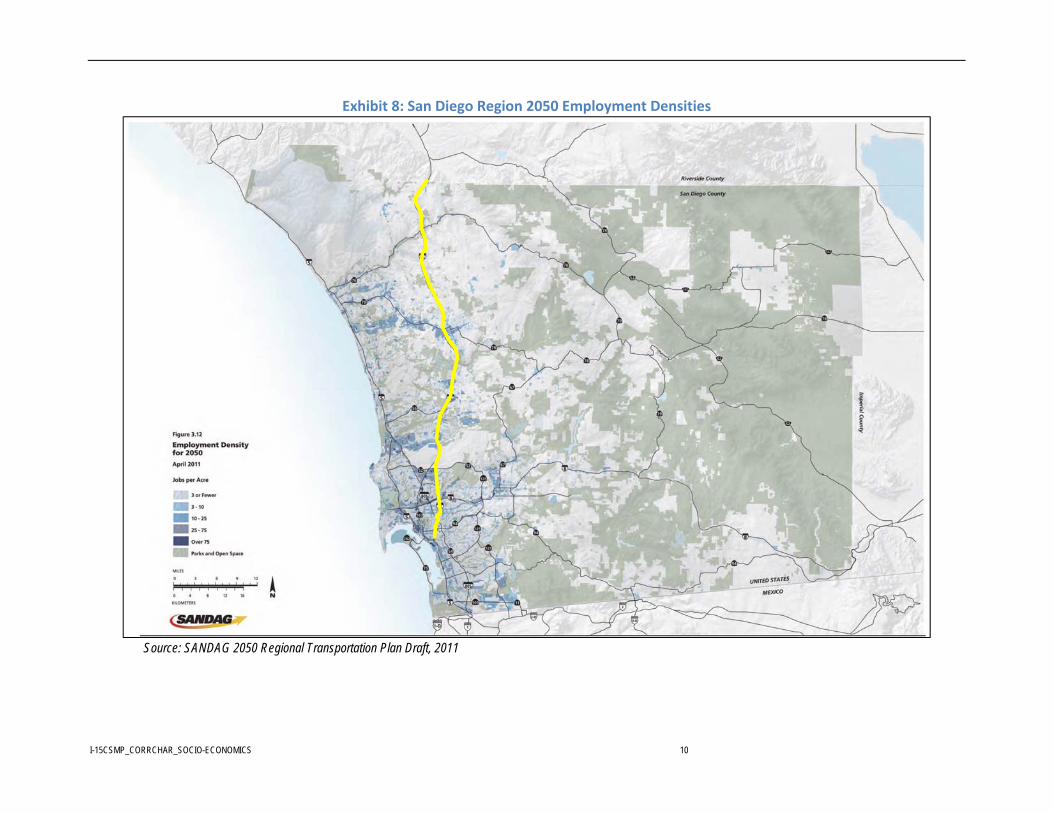
The growth rate in the San Diego region is slowing, and that trend is expected to continue. Between 2000 and 2004 population growth in the region averaged about 46,000 persons per year. During the late 1980s the region was adding as many as 90,000 persons per year, an annual growth rate of three percent (SANDAG 2030). By the early-2020s, the annual growth rate is expected to fall below one percent. Surrounding counties are all growing at faster rates than San Diego. Growth along the I-15 Corridor from Escondido to Riverside County is expected to be higher than the San Diego regional average. By the year 2030, population growth and employment growth in the areas surrounding the I-15 Corridor are expected to reach 31% and 25%, respectively (Caltrans 2009). Exhibit 6 compares the SANDAG region’s historic and future growth rates to those of the nation. The growth rate reduced significantly during the recession years in the early 1990s and again in 2008 and 2009 during the most recent recession. Exhibit 7 and Exhibit 8 show the population and employment densities for the San Diego region in 2050.
Exhibit 6: San Diego Population Growth Rate
Source: SANDAG
0
200
400
600
800
1000
1200
Population Employment
Thousands
2009‐2030 2009‐2050

I-15CSMP_CORRCHAR_SOCIO-ECONOMICS 9
Exhibit 7: San Diego Region 2050 Population Densities
Source: SANDAG 2050 Regional Transportation Plan Draft, 2011
I-15CSMP_CORRCHAR_SOCIO-ECONOMICS 10
Exhibit 8: San Diego Region 2050 Employment Densities
Source: SANDAG 2050 Regional Transportation Plan Draft, 2011
I-15CSMP_CORRCHAR_SOCIO-ECONOMICS 11
Southern California Region
Population/Employment The Southern California region includes five counties: Kern, Los Angeles, Orange, Riverside, and San Bernardino Counties. Nearly half of all California residents live in this region and it is the second most populated area in the country. According to the US Census Bureau, in 2009 the region’s population had reached almost 18 million residents, having grown by 1.6 million residents (10 percent) from 16.2 million people in 2000. Kern Council of Governments (COG) is the metropolitan planning organization (MPO) for Kern County. Southern California Association of Governments (SCAG) MPO represents six counties including Los Angeles, Orange, Riverside and San Bernardino.
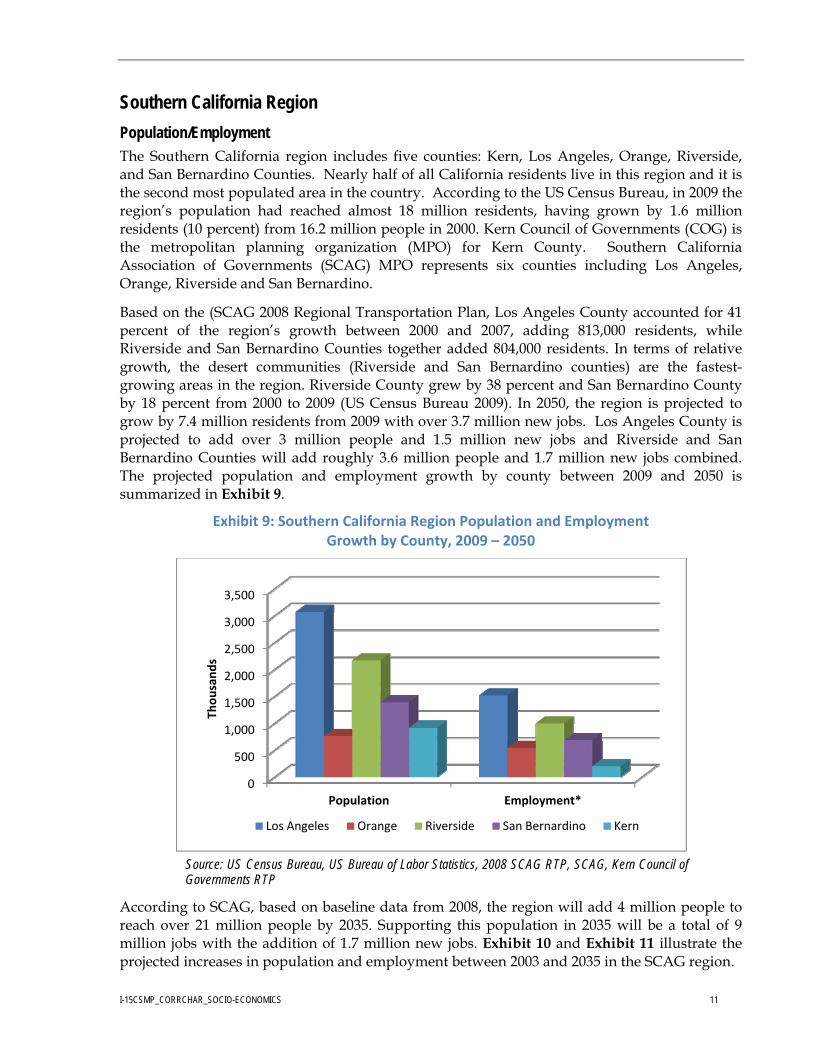
Based on the (SCAG 2008 Regional Transportation Plan, Los Angeles County accounted for 41 percent of the region’s growth between 2000 and 2007, adding 813,000 residents, while Riverside and San Bernardino Counties together added 804,000 residents. In terms of relative growth, the desert communities (Riverside and San Bernardino counties) are the fastest-growing areas in the region. Riverside County grew by 38 percent and San Bernardino County by 18 percent from 2000 to 2009 (US Census Bureau 2009). In 2050, the region is projected to grow by 7.4 million residents from 2009 with over 3.7 million new jobs. Los Angeles County is projected to add over 3 million people and 1.5 million new jobs and Riverside and San Bernardino Counties will add roughly 3.6 million people and 1.7 million new jobs combined. The projected population and employment growth by county between 2009 and 2050 is summarized in Exhibit 9.
Exhibit 9: Southern California Region Population and Employment Growth by County, 2009 – 2050
Source: US Census Bureau, US Bureau of Labor Statistics, 2008 SCAG RTP, SCAG, Kern Council of Governments RTP
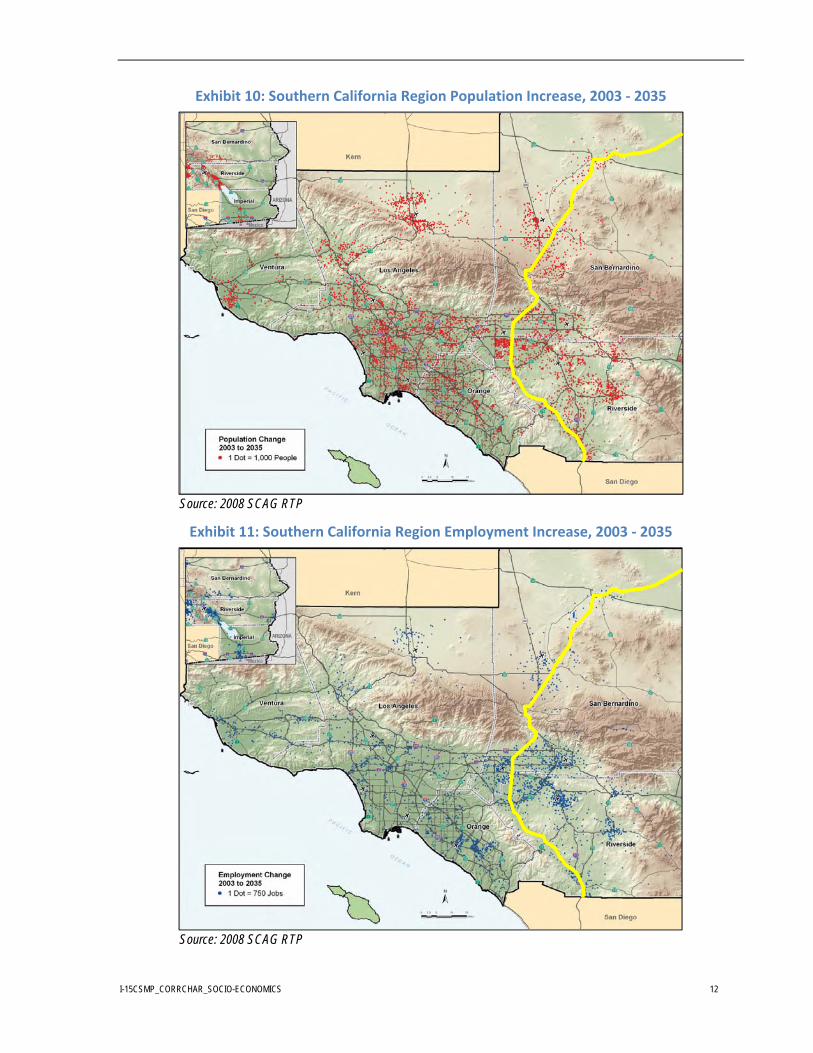
According to SCAG, based on baseline data from 2008, the region will add 4 million people to reach over 21 million people by 2035. Supporting this population in 2035 will be a total of 9 million jobs with the addition of 1.7 million new jobs. Exhibit 10 and Exhibit 11 illustrate the projected increases in population and employment between 2003 and 2035 in the SCAG region.
0
500
1,000
1,500
2,000
2,500
3,000
3,500
Population Employment*
Thousands
Los Angeles Orange Riverside San Bernardino Kern
I-15CSMP_CORRCHAR_SOCIO-ECONOMICS 12
Exhibit 10: Southern California Region Population Increase, 2003 ‐ 2035
Source: 2008 SCAG RTP
Exhibit 11: Southern California Region Employment Increase, 2003 ‐ 2035
Source: 2008 SCAG RTP
I-15CSMP_CORRCHAR_SOCIO-ECONOMICS 13
Kern County According to the Kern Council of Governments’ 2011 Regional Transportation Plan, Kern County was one of the top six fastest growing counties in California between 2008 and 2009 and is California’s thirteenth most populated of 58 counties. The most recently adopted growth forecast from October 2009 projects population to increase by approximately 500,000 by 2035, and doubling to 1.7 million by 2050.
Kern County is one of the prime agricultural regions in the nation, linking goods to other counties and regions. Kern County is a leading agricultural producer, and a prominent producer of oil and other minerals which all rely heavily on bulk movement by truck, rail and pipeline. There is an increasing demand for freight transportation and trucking is the dominant mode of freight transport, accounting for 87 percent of outbound tonnage and 81 percent of inbound tonnage. The San Joaquin Valley is one of the largest generators of truck freight in the western US and these trucks use SR 58 and US 395 to access I-15.
Las Vegas Region
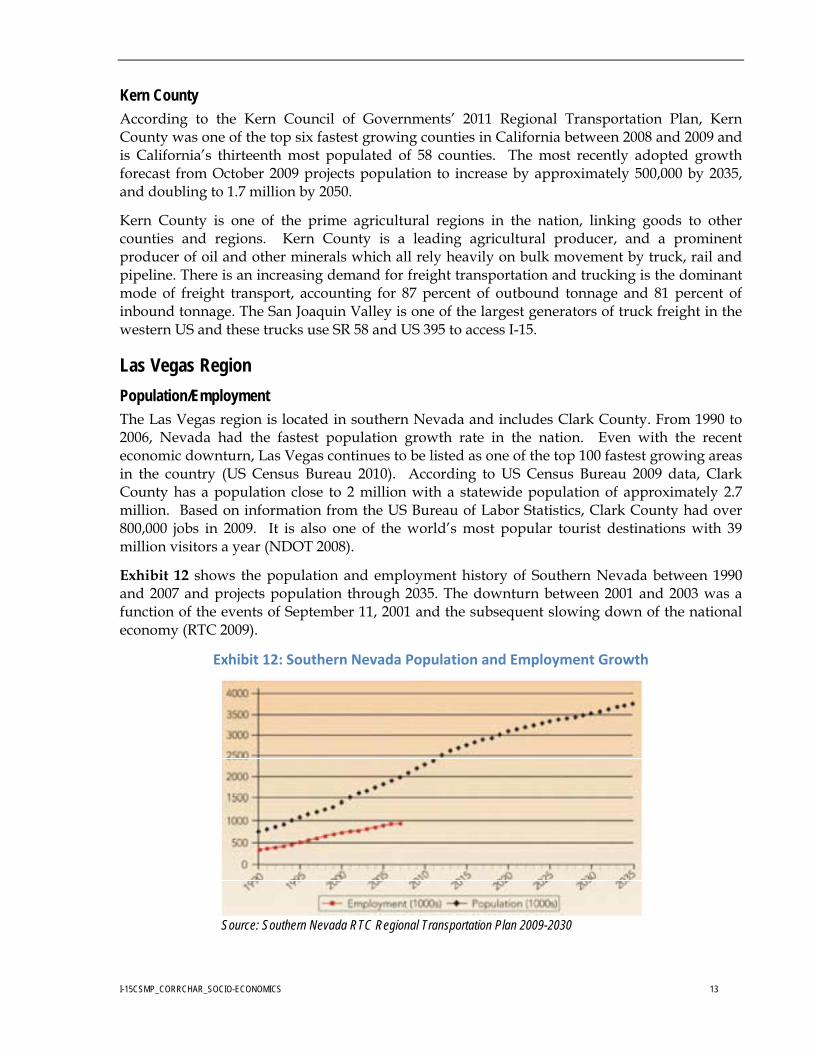
Population/Employment The Las Vegas region is located in southern Nevada and includes Clark County. From 1990 to 2006, Nevada had the fastest population growth rate in the nation. Even with the recent economic downturn, Las Vegas continues to be listed as one of the top 100 fastest growing areas in the country (US Census Bureau 2010). According to US Census Bureau 2009 data, Clark County has a population close to 2 million with a statewide population of approximately 2.7 million. Based on information from the US Bureau of Labor Statistics, Clark County had over 800,000 jobs in 2009. It is also one of the world’s most popular tourist destinations with 39 million visitors a year (NDOT 2008).
Exhibit 12 shows the population and employment history of Southern Nevada between 1990 and 2007 and projects population through 2035. The downturn between 2001 and 2003 was a function of the events of September 11, 2001 and the subsequent slowing down of the national economy (RTC 2009).
Exhibit 12: Southern Nevada Population and Employment Growth
Source: Southern Nevada RTC Regional Transportation Plan 2009-2030
I-15CSMP_CORRCHAR_SOCIO-ECONOMICS 14
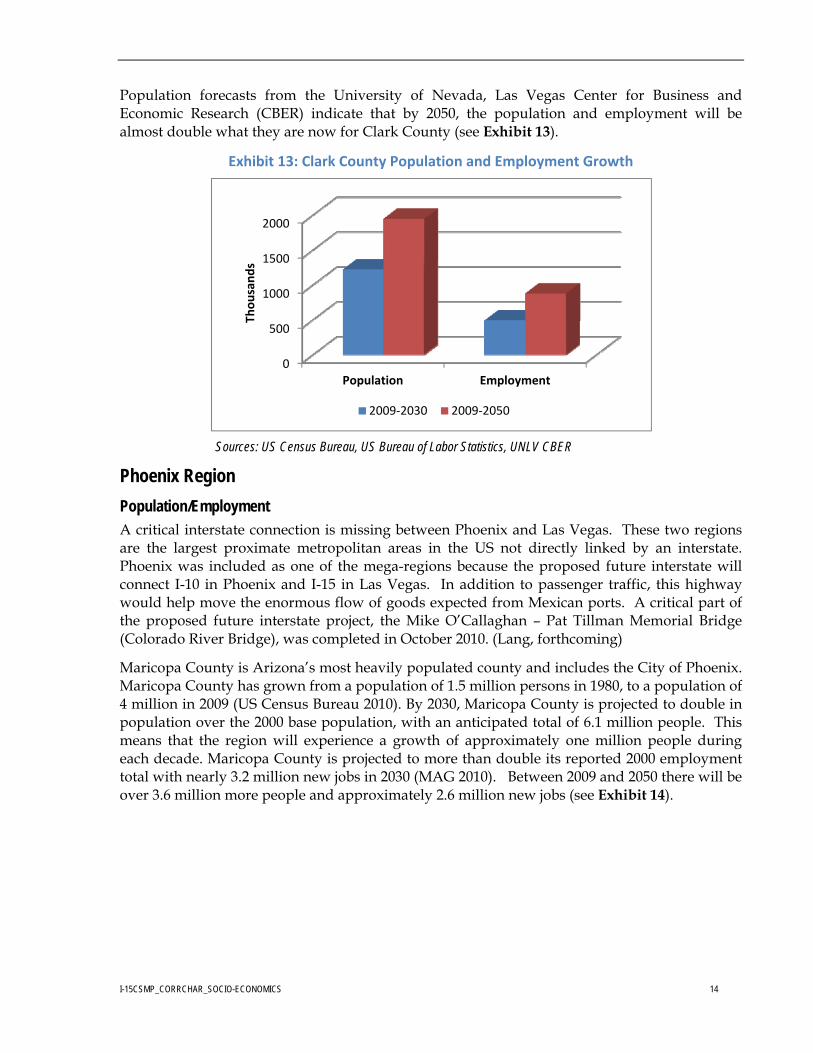
Population forecasts from the University of Nevada, Las Vegas Center for Business and Economic Research (CBER) indicate that by 2050, the population and employment will be almost double what they are now for Clark County (see Exhibit 13).
Exhibit 13: Clark County Population and Employment Growth
Sources: US Census Bureau, US Bureau of Labor Statistics, UNLV CBER
Phoenix Region
Population/Employment A critical interstate connection is missing between Phoenix and Las Vegas. These two regions are the largest proximate metropolitan areas in the US not directly linked by an interstate. Phoenix was included as one of the mega-regions because the proposed future interstate will connect I-10 in Phoenix and I-15 in Las Vegas. In addition to passenger traffic, this highway would help move the enormous flow of goods expected from Mexican ports. A critical part of the proposed future interstate project, the Mike O’Callaghan – Pat Tillman Memorial Bridge (Colorado River Bridge), was completed in October 2010. (Lang, forthcoming)
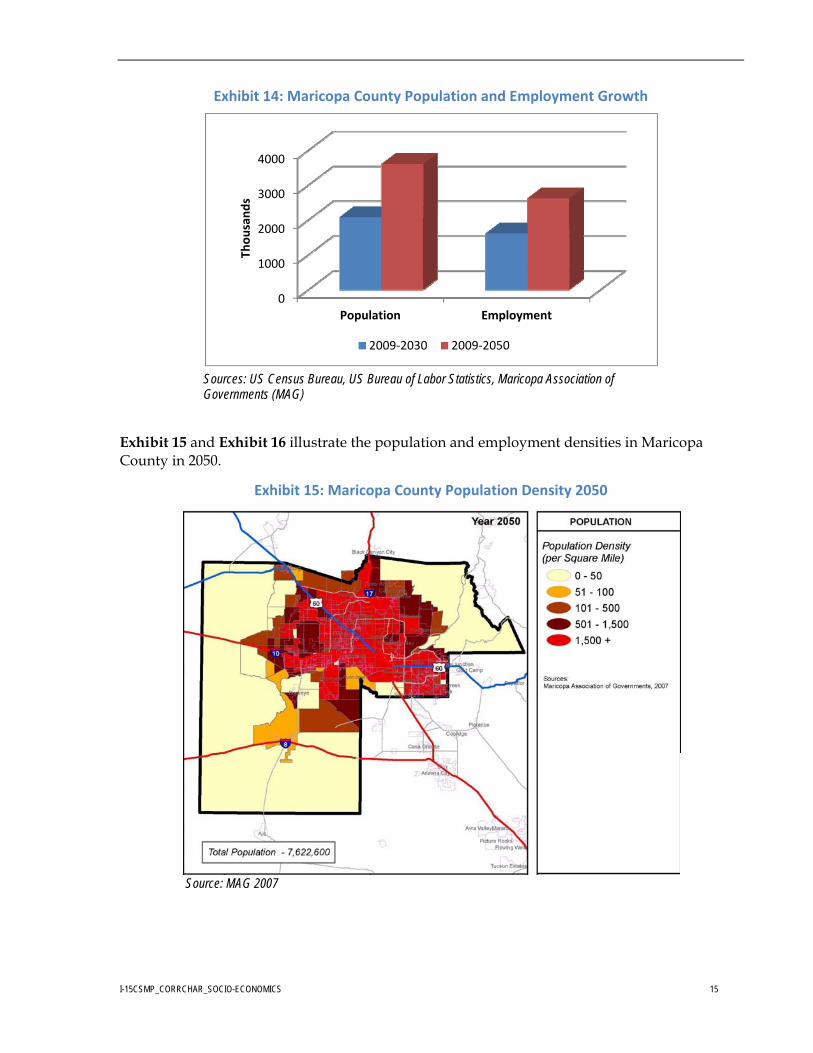
Maricopa County is Arizona’s most heavily populated county and includes the City of Phoenix. Maricopa County has grown from a population of 1.5 million persons in 1980, to a population of 4 million in 2009 (US Census Bureau 2010). By 2030, Maricopa County is projected to double in population over the 2000 base population, with an anticipated total of 6.1 million people. This means that the region will experience a growth of approximately one million people during each decade. Maricopa County is projected to more than double its reported 2000 employment total with nearly 3.2 million new jobs in 2030 (MAG 2010). Between 2009 and 2050 there will be over 3.6 million more people and approximately 2.6 million new jobs (see Exhibit 14).
0
500
1000
1500
2000
Population Employment
Thousands
2009‐2030 2009‐2050
I-15CSMP_CORRCHAR_SOCIO-ECONOMICS 15
Exhibit 14: Maricopa County Population and Employment Growth
Sources: US Census Bureau, US Bureau of Labor Statistics, Maricopa Association of Governments (MAG)
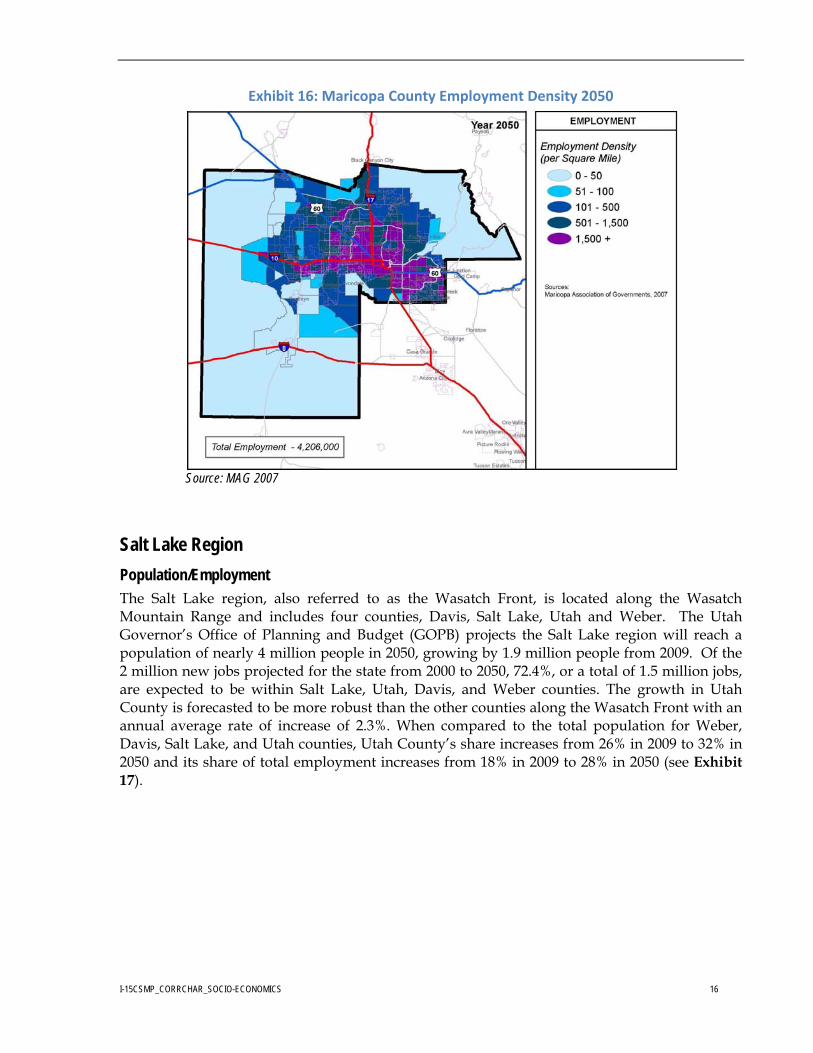
Exhibit 15 and Exhibit 16 illustrate the population and employment densities in Maricopa County in 2050.
Exhibit 15: Maricopa County Population Density 2050
Source: MAG 2007
0
1000
2000
3000
4000
Population Employment
Thousands
2009‐2030 2009‐2050
I-15CSMP_CORRCHAR_SOCIO-ECONOMICS 16
Exhibit 16: Maricopa County Employment Density 2050
Source: MAG 2007
Salt Lake Region
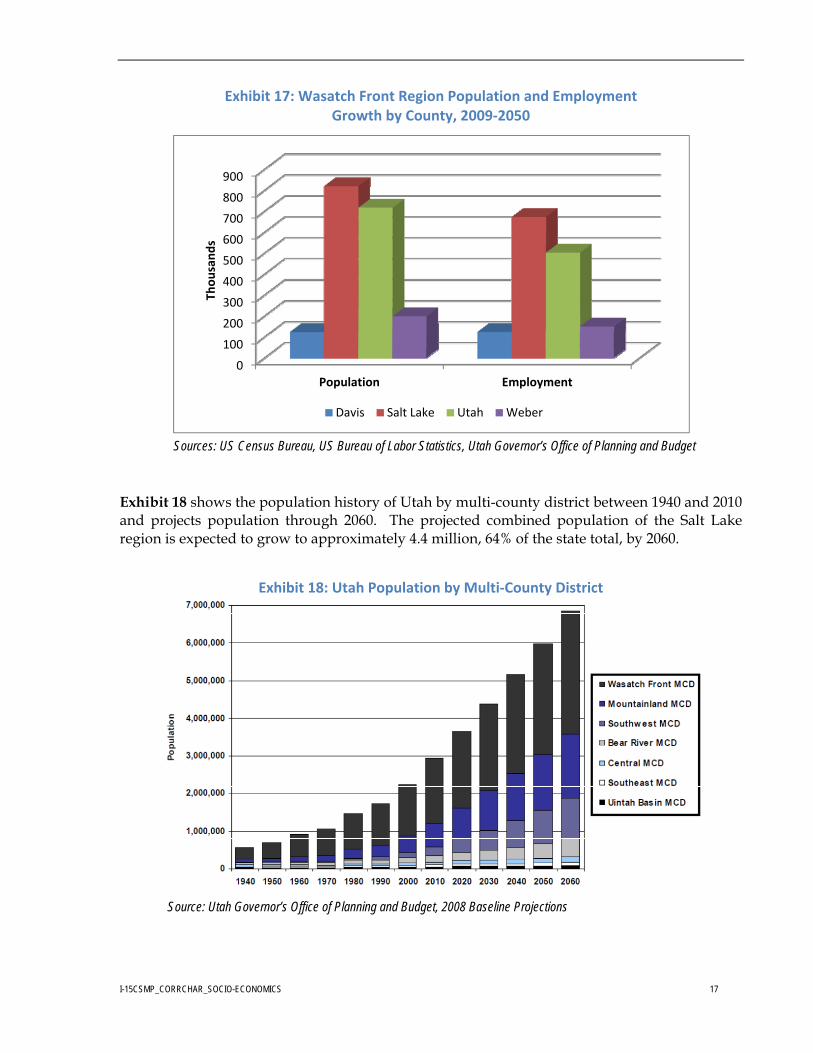
Population/Employment The Salt Lake region, also referred to as the Wasatch Front, is located along the Wasatch Mountain Range and includes four counties, Davis, Salt Lake, Utah and Weber. The Utah Governor’s Office of Planning and Budget (GOPB) projects the Salt Lake region will reach a population of nearly 4 million people in 2050, growing by 1.9 million people from 2009. Of the 2 million new jobs projected for the state from 2000 to 2050, 72.4%, or a total of 1.5 million jobs, are expected to be within Salt Lake, Utah, Davis, and Weber counties. The growth in Utah County is forecasted to be more robust than the other counties along the Wasatch Front with an annual average rate of increase of 2.3%. When compared to the total population for Weber, Davis, Salt Lake, and Utah counties, Utah County’s share increases from 26% in 2009 to 32% in 2050 and its share of total employment increases from 18% in 2009 to 28% in 2050 (see Exhibit 17).
I-15CSMP_CORRCHAR_SOCIO-ECONOMICS 17
Exhibit 17: Wasatch Front Region Population and Employment Growth by County, 2009‐2050
Sources: US Census Bureau, US Bureau of Labor Statistics, Utah Governor’s Office of Planning and Budget
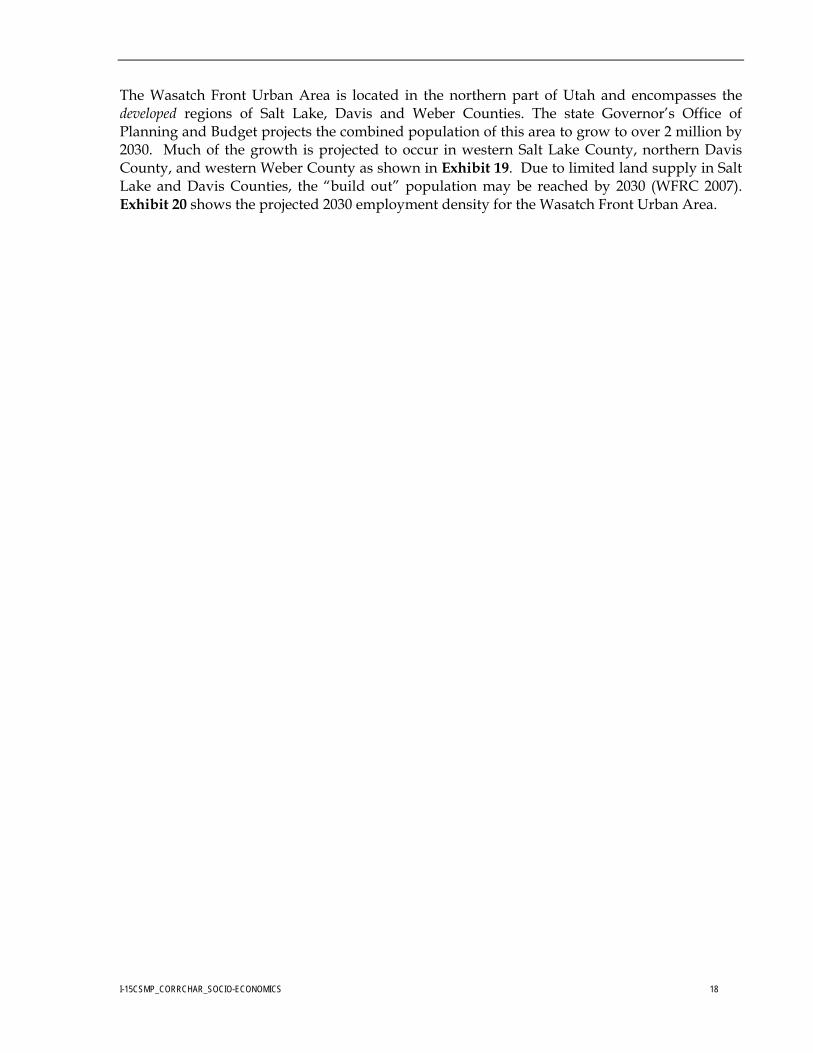
Exhibit 18 shows the population history of Utah by multi-county district between 1940 and 2010 and projects population through 2060. The projected combined population of the Salt Lake region is expected to grow to approximately 4.4 million, 64% of the state total, by 2060.
Exhibit 18: Utah Population by Multi‐County District
Source: Utah Governor’s Office of Planning and Budget, 2008 Baseline Projections
0
100
200
300
400
500
600
700
800
900
Population Employment
Thousands
Davis Salt Lake Utah Weber
I-15CSMP_CORRCHAR_SOCIO-ECONOMICS 18
The Wasatch Front Urban Area is located in the northern part of Utah and encompasses the developed regions of Salt Lake, Davis and Weber Counties. The state Governor’s Office of Planning and Budget projects the combined population of this area to grow to over 2 million by 2030. Much of the growth is projected to occur in western Salt Lake County, northern Davis County, and western Weber County as shown in Exhibit 19. Due to limited land supply in Salt Lake and Davis Counties, the “build out” population may be reached by 2030 (WFRC 2007). Exhibit 20 shows the projected 2030 employment density for the Wasatch Front Urban Area.

I-15CSMP_CORRCHAR_SOCIO-ECONOMICS 19
Exhibit 19: Wasatch Front Urban Area 2030 Population Density
Source: Wasatch Front Regional Transportation Plan, 2007-2030
Exhibit 20: Wasatch Front Urban Area 2030 Employment Density
Source: Wasatch Front Regional Transportation Plan, 2007-2030
I-15CSMP_CORRCHAR_SOCIO-ECONOMICS 20
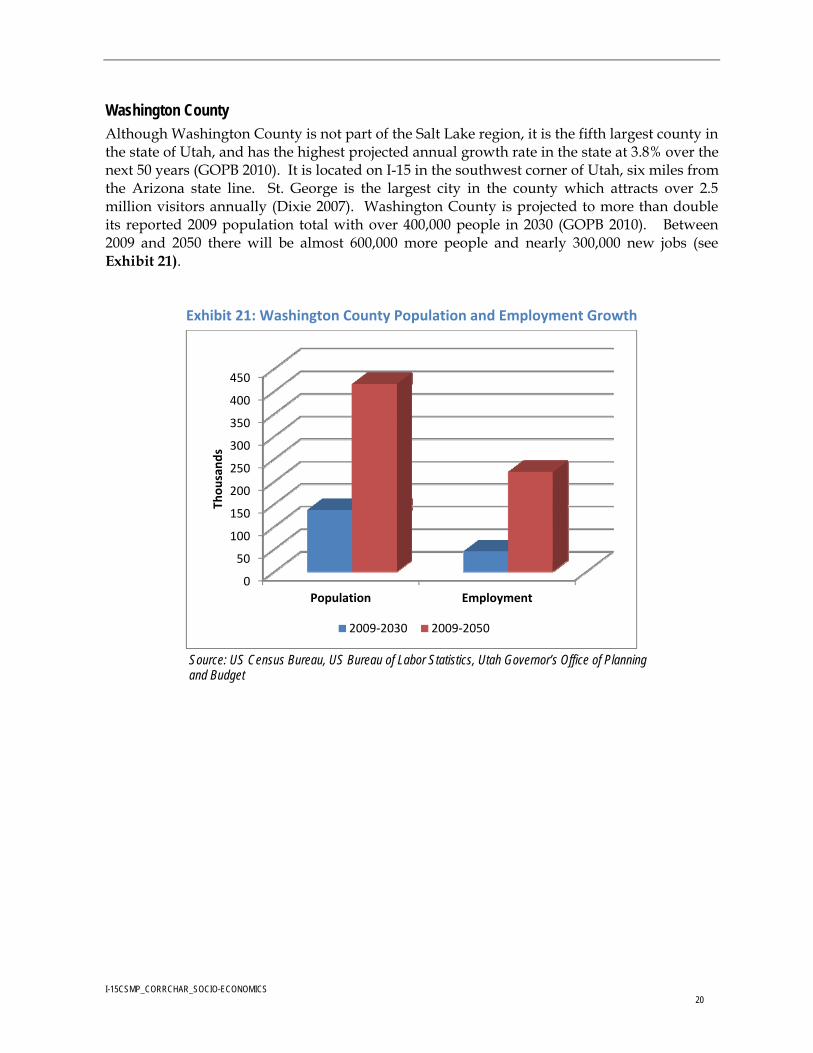
Washington County Although Washington County is not part of the Salt Lake region, it is the fifth largest county in the state of Utah, and has the highest projected annual growth rate in the state at 3.8% over the next 50 years (GOPB 2010). It is located on I-15 in the southwest corner of Utah, six miles from the Arizona state line. St. George is the largest city in the county which attracts over 2.5 million visitors annually (Dixie 2007). Washington County is projected to more than double its reported 2009 population total with over 400,000 people in 2030 (GOPB 2010). Between 2009 and 2050 there will be almost 600,000 more people and nearly 300,000 new jobs (see Exhibit 21).
Exhibit 21: Washington County Population and Employment Growth
Source: US Census Bureau, US Bureau of Labor Statistics, Utah Governor’s Office of Planning and Budget
0
50
100
150
200
250
300
350
400
450
Population Employment
Thousands
2009‐2030 2009‐2050
I-15CSMP_CORRCHAR_SOCIO-ECONOMICS 21
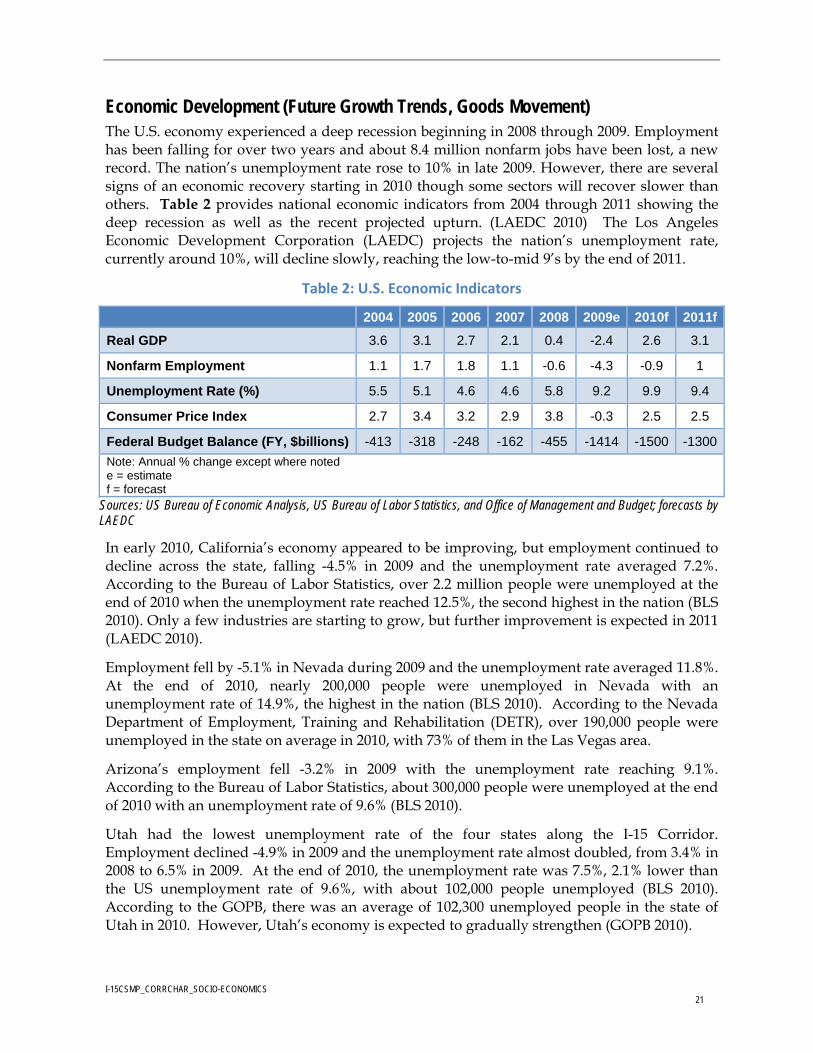
Economic Development (Future Growth Trends, Goods Movement) The U.S. economy experienced a deep recession beginning in 2008 through 2009. Employment has been falling for over two years and about 8.4 million nonfarm jobs have been lost, a new record. The nation’s unemployment rate rose to 10% in late 2009. However, there are several signs of an economic recovery starting in 2010 though some sectors will recover slower than others. Table 2 provides national economic indicators from 2004 through 2011 showing the deep recession as well as the recent projected upturn. (LAEDC 2010) The Los Angeles Economic Development Corporation (LAEDC) projects the nation’s unemployment rate, currently around 10%, will decline slowly, reaching the low-to-mid 9’s by the end of 2011.
Table 2: U.S. Economic Indicators
2004 2005 2006 2007 2008 2009e 2010f 2011f
Real GDP 3.6 3.1 2.7 2.1 0.4 -2.4 2.6 3.1
Nonfarm Employment 1.1 1.7 1.8 1.1 -0.6 -4.3 -0.9 1
Unemployment Rate (%) 5.5 5.1 4.6 4.6 5.8 9.2 9.9 9.4
Consumer Price Index 2.7 3.4 3.2 2.9 3.8 -0.3 2.5 2.5
Federal Budget Balance (FY, $billions) -413 -318 -248 -162 -455 -1414 -1500 -1300
Note: Annual % change except where noted e = estimate f = forecast
Sources: US Bureau of Economic Analysis, US Bureau of Labor Statistics, and Office of Management and Budget; forecasts by LAEDC
In early 2010, California’s economy appeared to be improving, but employment continued to decline across the state, falling -4.5% in 2009 and the unemployment rate averaged 7.2%. According to the Bureau of Labor Statistics, over 2.2 million people were unemployed at the end of 2010 when the unemployment rate reached 12.5%, the second highest in the nation (BLS 2010). Only a few industries are starting to grow, but further improvement is expected in 2011 (LAEDC 2010).
Employment fell by -5.1% in Nevada during 2009 and the unemployment rate averaged 11.8%. At the end of 2010, nearly 200,000 people were unemployed in Nevada with an unemployment rate of 14.9%, the highest in the nation (BLS 2010). According to the Nevada Department of Employment, Training and Rehabilitation (DETR), over 190,000 people were unemployed in the state on average in 2010, with 73% of them in the Las Vegas area.
Arizona’s employment fell -3.2% in 2009 with the unemployment rate reaching 9.1%. According to the Bureau of Labor Statistics, about 300,000 people were unemployed at the end of 2010 with an unemployment rate of 9.6% (BLS 2010).
Utah had the lowest unemployment rate of the four states along the I-15 Corridor. Employment declined -4.9% in 2009 and the unemployment rate almost doubled, from 3.4% in 2008 to 6.5% in 2009. At the end of 2010, the unemployment rate was 7.5%, 2.1% lower than the US unemployment rate of 9.6%, with about 102,000 people unemployed (BLS 2010). According to the GOPB, there was an average of 102,300 unemployed people in the state of Utah in 2010. However, Utah’s economy is expected to gradually strengthen (GOPB 2010).
I-15CSMP_CORRCHAR_SOCIO-ECONOMICS 22
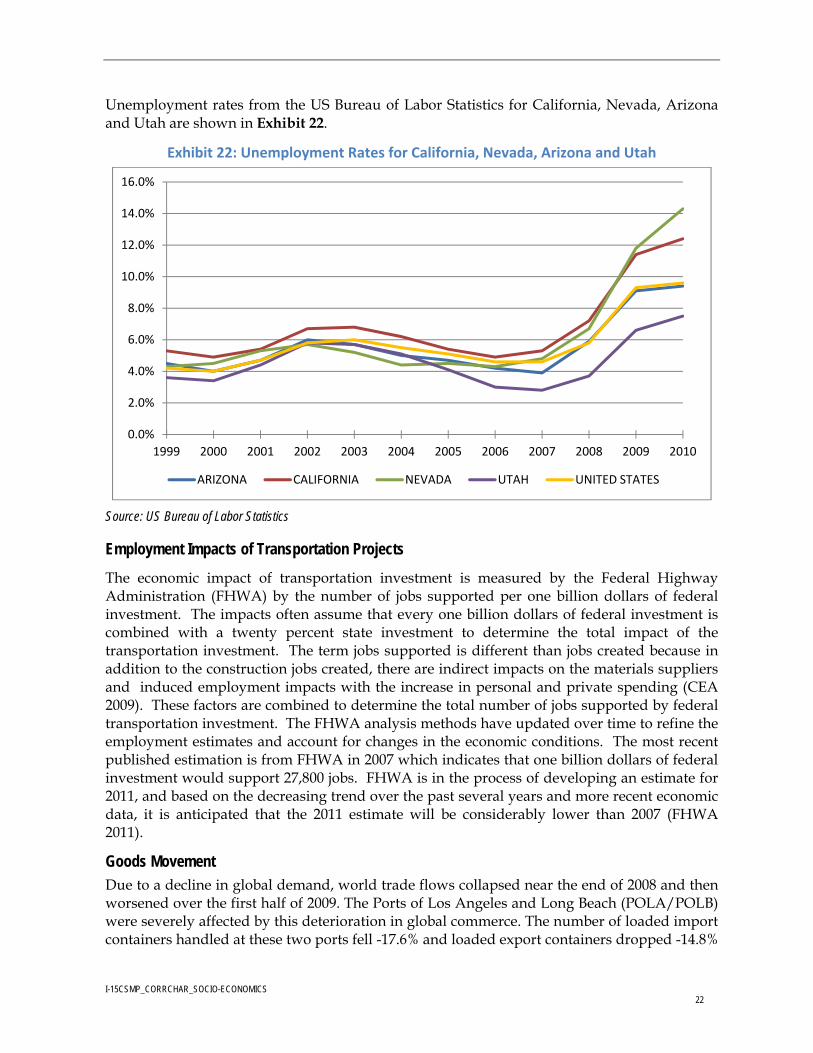
Unemployment rates from the US Bureau of Labor Statistics for California, Nevada, Arizona and Utah are shown in Exhibit 22.
Exhibit 22: Unemployment Rates for California, Nevada, Arizona and Utah
Source: US Bureau of Labor Statistics
Employment Impacts of Transportation Projects
The economic impact of transportation investment is measured by the Federal Highway Administration (FHWA) by the number of jobs supported per one billion dollars of federal investment. The impacts often assume that every one billion dollars of federal investment is combined with a twenty percent state investment to determine the total impact of the transportation investment. The term jobs supported is different than jobs created because in addition to the construction jobs created, there are indirect impacts on the materials suppliers and induced employment impacts with the increase in personal and private spending (CEA 2009). These factors are combined to determine the total number of jobs supported by federal transportation investment. The FHWA analysis methods have updated over time to refine the employment estimates and account for changes in the economic conditions. The most recent published estimation is from FHWA in 2007 which indicates that one billion dollars of federal investment would support 27,800 jobs. FHWA is in the process of developing an estimate for 2011, and based on the decreasing trend over the past several years and more recent economic data, it is anticipated that the 2011 estimate will be considerably lower than 2007 (FHWA 2011).
Goods Movement Due to a decline in global demand, world trade flows collapsed near the end of 2008 and then worsened over the first half of 2009. The Ports of Los Angeles and Long Beach (POLA/POLB) were severely affected by this deterioration in global commerce. The number of loaded import containers handled at these two ports fell -17.6% and loaded export containers dropped -14.8%
0.0%
2.0%
4.0%
6.0%
8.0%
10.0%
12.0%
14.0%
16.0%
1999 2000 2001 2002 2003 2004 2005 2006 2007 2008 2009 2010
ARIZONA CALIFORNIA NEVADA UTAH UNITED STATES

I-15CSMP_CORRCHAR_SOCIO-ECONOMICS 23
in 2009. The ports of Los Angeles and Long Beach maintained their top two rankings during 2009 based on the number of containers handled. The port of Los Angeles also remained the top port in the nation in 2009, with regards to total two-way trade valued at $197.2 billion, while the port of Long Beach was still ranked #9 with a value of $68.6 billion (LAEDC 2010).
Global trade will help lead the global economic recovery. Total container traffic at the San Pedro Bay ports increased by 2.3 million twenty-foot equivalent units (TEUs) in 2010. Port shipping terminals moved a total of 14.1 million twenty-foot equivalent containers in 2010, a nearly 20 percent increase over 2009 as shown in Exhibit 23. This almost recovered the losses between 2008 and 2009 when the ports containerized cargo decreased by 2.5 million TEUs (POLB/POLA 2010). The developing nations of Asia will lead the overall recovery and will see the largest export and import growth. The advanced economies will also contribute to the overall recovery in trade as manufacturers and retailers restock inventories, which will lead to a renewal of Asian exports. The anticipated improvement in trade will positively impact both the Port of Long Beach and the Port of Los Angeles (LAEDC 2010).
Exhibit 23: San Pedro Bay Ports Yearly Container Totals in TEUs
Sources: Port of Long Beach and Port of Los Angeles
0.0
2.0
4.0
6.0
8.0
10.0
12.0
14.0
16.0
18.0
1995 1997 1999 2001 2003 2005 2007 2009
Million TEU
s
POLB POLA San Pedro Bay Ports
I-15CSMP_CORRCHAR_SOCIO-ECONOMICS 24
List of Acronyms AADT Average Annual Daily Traffic
AADTT Average Annual Daily Truck Traffic
AAR American Association of Railroads
AASHTO American Association of State Highway and Transportation Officials
ACI Airports Council International
ADT Average Daily Traffic
ADOT Arizona Department of Transportation
AFB Air Force Base
ARRA American Recovery and Reinvestment Act
ATM Active Traffic Management
ATRI American Transportation Research Institute
AVC Automated Vehicle Classification
AVI Automated Vehicle Identification
AZ Arizona
BNSF Burlington Northern Santa Fe
BTS Bureau of Transportation Statistics
BUR Bob Hope/ Burbank Airport
C2C Center to Center
CA California
CAD Computer Aided Dispatch
CALNEV Pipeline from Los Angeles to Las Vegas
Caltrans California Department of Transportation
CBER Center for Business and Economic Research
CCDOA Clark County Department of Aviation
CCTV Closed Circuit Television
CHP California Highway Patrol
CNSSTC California-Nevada Super Speed Train Commission
COG Council of Governments
CSX Class I Railroad Corporation
CVISN Commercial Vehicle Information Systems and Networks
CVO Commercial Vehicle Operations
I-15CSMP_CORRCHAR_SOCIO-ECONOMICS 25
DEIS Draft Environmental Impact Statement
DETR Department of Employment, Training and Rehabilitation
DMS Dynamic Message Sign
DOT Department of Transportation
DHL International Express Mail Service Company
DSRC Dedicated Short-Range Communications
ETC Electronic Toll Collection
EV Electronic Vehicle
FAA Federal Aviation Administration
FAF Freight Analysis Framework
FARS Fatality Analysis Reporting System
FAST Freeway and Arterial System of Transportation
FHWA Federal Highway Administration
FMCSA Federal Motor Carrier Safety Administration
FRA Federal Railroad Administration
GAP Grupo Aeroportuario del Pacifico
GDP Gross Domestic Product
GOPB Governor’s Office of Planning and Budget
GVW Gross Vehicle Weight
HAR Highway Advisory Radio
HELP Heavy Vehicle Electronic License Plate
HNTB Architecture and Engineering Consulting Firm
HOS Hours of Service
HOT High-Occupancy Toll
HOV High-Occupancy Vehicle
HPMS Highway Performance Monitoring System
ITRP Integrated Transportation Reliability Program
ITS Intelligent Transportation System
LAEDC Los Angeles Economic Development Corporation
LAS Las Vegas McCarran International Airport
LAX Los Angeles International Airport
LCV Longer Combination Vehicle
LED Light-Emitting Diode
I-15CSMP_CORRCHAR_SOCIO-ECONOMICS 26
LGB Long Beach Airport
LNG Liquid Natural Gas
LOS Level of Service
LTL Less than truckload
MAG Maricopa Association of Governments
Maglev Magnetic Levitation
MIP March Inland Port Airport
MPO Metropolitan Planning Organization
MVMT Million Vehicle Miles Traveled
NDOT Nevada Department of Transportation
NextGen Next Generation Air Transportation System
NHPN National Highway Planning Network
NHTSA National Highway Traffic Safety Administration
NSTPRC National Surface Transportation Policy and Revenue Commission
NV Nevada
ONT Ontario International Airport
PHX Phoenix Sky Harbor International Airport
PM Particulate matter
PMD Palmdale Regional Airport
POE Port of Entry
POLA Port of Los Angeles
POLB Port of Long Beach
PRWG Passenger Rail Working Group
PSP Palm Springs Airport
RFID Radio Frequency Identification
RITA Research and Innovative Technology Administration
RTC Regional Transportation Commission of Southern Nevada
RTP Regional Transportation Plan
RWIS Road Weather Information System
SAN San Diego International Airport
SANBAG San Bernardino Associated Governments
SANDAG San Diego Association of Governments
SBD San Bernardino International Airport
I-15CSMP_CORRCHAR_SOCIO-ECONOMICS 27
SDCRAA San Diego County Regional Airport Authority
SCAG Southern California Association of Governments
SCLA Southern California Logistics Airport
SLC Salt Lake City International Airport
SLCIA Salt Lake City International Airport
SLCDA Salt Lake City Department of Airports
SNA John Wayne/ Orange County Airport
SR State Route
TAF Terminal Area Forecast
TEA-21 Transportation Equity Act of the 21st Century
TEU Twenty-foot Equivalent Unit
TIM Traffic Incident Management
TL Truckload
TMC Traffic Management Center
TOC Traffic Operations Center
TTI Texas Transportation Institute
UDOT Utah Department of Transportation
UNEV Pipeline serving Southern Utah and Las Vegas
UNLV University of Nevada, Las Vegas
UP Union Pacific
UPS United Parcel Service
US United States
USBR United States Bicycle Route
USBRS United States Bicycle Route System
USDOE United States Department of Energy
USDOT United States Department of Transportation
UT Utah
UTA Utah Transit Authority
WFRC Wasatch Front Regional Council
WIM Weigh-In-Motion
WSA Wilbur Smith and Associates
I-15CSMP_CORRCHAR_SOCIO-ECONOMICS 28
Works Cited AASHTO. 2008. Intercity Passenger Rail Transportation. Available at:
http://rail.transportation.org/Documents/2008_AASHTO_Passenger_Rail_Update.doc. Accessed January 31, 2011.
AASHTO. 2007. Future Needs of the U.S. Surface Transportation System. Available at: ftp://ftp.mdt.mt.gov/research/LIBRARY/TIF1-1-FUTURE_NEEDS-AASHTO.PDF. Accessed March 10, 2011
Airports Council International (ACI). 2010. Annual Traffic Data. Available at: http://www.airports.org/cda/aci_common/display/main/aci_content07_c.jsp?zn=aci&cp=1-5-54_666_2__. Accessed January 4, 2011.
American Transportation Research Institute (ATRI), 2009. Bottleneck Analysis of 100 Freight Significant Highway Locations. Available at http://www.atri-online.org/research/results/ATRI_100_Bottleneck_Report.pdf Accessed February 1, 2011.
Amtrak. 2010. Interactive Route Atlas. Available at http://www.amtrak.com/servlet/ContentServer?c=AM_Content_C&pagename=am%2FLayout&cid=1241245660945. Accessed January 10, 2011.
Applied Management and Planning Group. 2006. LAX Air Passenger Survey Report. Available at: http://www.lawa.org/welcome_LAX.aspx?id=1126. Accessed December 28, 2010.
Arizona Department of Economic Security, 2006. Arizona Population Projections 2006 – 2055.
Arizona Department of Transportation (ADOT), 2010. Statewide Travel Demand Model Population and Employment Projections. Available at http://www.azdot.gov/bqaz/PDF/SED_2_5_Maricopa.pdf. Accessed January 4, 2011.
Arizona Department of Transportation (ADOT) with Cambridge Systematics. Move Arizona Long Range Transportation Plan. Available at: http://azmemory.lib.az.us/cdm4/item_viewer.php?CISOROOT=/statepubs&CISOPTR=2460&CISOBOX=1&REC=3. Accessed December 20, 2010.
Arizona Transportation Research Center (ATRC). 2003. Research Implementation Report. Available at: http://www.azdot.gov/TPD/ATRC/Publications/implementation/PDF/Report_2002.pdf.
Aurther C. Nelson and Robert E. Lang. Forthcoming. Megapolitan America: The Rise of the New Metropolis. Prepared for American Planning Association and Lincoln Institute of Land Policy.
Bureau of Transportation Statistics. 2011. Passengers All Carriers- All Airports. Available at: http://www.transtats.bts.gov/Data_Elements.aspx?Data=1. Accessed January 20, 2011.
California Department of Finance, 2010. http://www.dof.ca.gov/research/demographic/reports/projections/p-1/documents/P-1%20Report%20Tables.xls. Accessed January 4, 2011.
California High Speed Rail Authority. 2011. California High Speed Train Project: Los Angeles to San Diego via the Inland Empire Section Fact Sheet. Available at: http://www.cahighspeedrail.ca.gov/assets/0/152/256/261/5a5f64fc-8caa-439f-9927-677ef3f1ec05.pdf.
California- Nevada Super Speed Train Commission. 2008. Timeline. Available at: http://www.canv-maglev.com/pid6timeline.html

I-15CSMP_CORRCHAR_SOCIO-ECONOMICS 29
Cambridge Systematics, Inc. 2007. National Rail Freight Infrastructure Capacity and Investment Study. Available at: www.camsys.com/pubs/AAR_Nat_%20Rail_Cap_Study.pdf. Accessed January 26, 2011.
CH2M HILL. 2010. Project Neon Change of Control of Access Report.
City of Phoenix. 2010. Phoenix Sky Harbor Airport Statistics Jan-Dec 2009. Available at: http://skyharbor.com/about/AirportStats.html. Accessed January 4, 2011.
City of Phoenix. 2011. RAPID Public Transit. Available at: http://phoenix.gov/publictransit/rapid.html. Accessed April 25, 2011.
City of St. George. 2008. SGU Municipal Airport. Available at: http://www.sguconstruction.com/index.php. Accessed December 28, 2010.
Clark County Department of Aviation (CCDOA). 2011. Statistics. Available at: http://www.mccarran.com/04_04_stats_01.aspx. Accessed January 4, 2011.
Clark County Department of Aviation (CCDOA). 2011. Ivanpah Airport. Available at: http://mccarran.com/ga_ivanpah.aspx. Accessed April 21, 2011.
Coffman Associates, Inc. June 2006. Meadows Field Airport Master Plan. Available at: http://www.meadowsfield.com/master-plans.asp. Accessed April 25, 2011.
Council of Economic Advisers, Executive Office of the President. 2009. Estimates of Job Creation from the American Recovery and Reinvestment Act of 2009. Available at: http://www.whitehouse.gov/administration/eop/cea/estimate-of-job-creation/. Accessed March 22, 2012.
Dixie Metropolitan Planning Organization. 2007. 2007 – 2030 Regional Transportation Plan. Available at http://dixiempo.wordpress.com/plans-reports-studies/. Accessed December 13, 2010.
Dr. Lazar N. Spasovic et al. 2004. Study to Determine the Need for Innovative Technologies for Container Transportation System.
Federal Aviation Administration. 2007. Capacity Needs in the National Air Space System. Available at: http://www.faa.gov/airports/planning_capacity/. Accessed December 29, 2010.
Federal Aviation Administration. 2008. The Economic Impact of Civil Aviation on the U.S. Economy. Available at: www.faa.gov/nextgen/why.../08%20economic%20impact%20report.pdf. Accessed January 24, 2011
Federal Aviation Administration (FAA). 2009. Primary and Non-primary Commercial Service Enplanements (by Rank). http://www.faa.gov/airports/planning_capacity/passenger_allcargo_stats/passenger/. Accessed December 28, 2010.
Federal Aviation Administration (FAA). 2010. Terminal Area Forecast (TAF). Available at: http://aspm.faa.gov/main/taf.asp. Accessed January 4, 2011.
Federal Highway Administration. 2007. Active Traffic Management: The Next Step in Congestion Management. Available at http://international.fhwa.dot.gov/pubs/pl07012/atm_eu07.pdf
Federal Highway Administration. 2007. Corridors of the Future Program. Available at: http://www.corridors.dot.gov/. Accessed April 28, 2011.
Federal Highway Administration. 2010. http://www.fhwa.dot.gov/publications/publicroads/10novdec/02.cfm. Accessed June 9, 2011.
Federal Highway Administration. 2011. Employment Impacts of Highway Infrastructure Investment. Available at: http://www.fhwa.dot.gov/policy/otps/pubs/impacts/index.htm. Accessed March 22, 2012.
I-15CSMP_CORRCHAR_SOCIO-ECONOMICS 30
Federal Motor Carrier Safety Administration. http://www.fmcsa.dot.gov/facts-research/cvisn/
Federal Rail Association (FRA). 2009. Preliminary National Rail Plan. Available at: www.fra.dot.gov/downloads/RailPlanPrelim10-15.pdf. Accessed February 1, 2011.
Federal Railroad Administration. 2009. Desert Xpress High Speed Passenger Train Draft EIS. Available at: http://www.fra.dot.gov/rpd/freight/1703.shtml. Accessed February 17, 2011.
Georgia Institute of Technology. 2011. Transportation Planning for Sustainability Guidebook. Available at http://www.fhwa.dot.gov/hep/climate/sustainability/sustain.pdf
Gurpo Aeroportuario del Pacifico. 2010. Tijuana December 2010 Traffic Report. Available at: http://aeropuertosgap.com.mx/english/investors/traffic-report.html. Accessed June 7, 2011.
HDR. 2010. San Diego and Imperial Valley Gateway Study. Available at: http://www.sandag.org/uploads/publicationid/publicationid_1479_10924.pdf. Accessed January 31, 2011.
HNTB. 2006. Salt Lake City International Airport- Airport Layout Plan Update. Available at: http://www.slcairport.com/plans.asp. Accessed December 28, 2010.
Kern Council of Governments (COG). 2009. Final Regional Growth Forecast Report. Available at: http://www.kerncog.org/docs/transmodel/growth_forecast_20091015.pdf. Accessed April 7, 2011.
Kern Council of Governments (COG). 2010. 2011 Regional Transportation Plan Available at: http://www.kerncog.org/cms/transportation/rtp. Accessed April 7, 2011
Kern County. 2011. Passenger Enplanements and Deplanements. Available at: http://www.meadowsfield.com/statistics.asp. Accessed April 25, 2011.
Kimley-Horn and Associates, Inc. (KHA). 2010. NDOT Statewide Integrated Transportation Reliability Program. Available at: http://www.kimley-horn.com/projects/NevadaITRP/project.html.
Las Vegas Railway Express, Inc. 2011. The X-Train. Available at: http://www.xtrainvegas.com/. Accessed April 25, 2011.
Leachman and Associates. 2005. Inland Empire Railroad Main Line Study. Available at: http://www.ieor.berkeley.edu/People/Faculty/leachman-pubs/InlandEmpire.pdf. Accessed January 28, 2011.
Long Beach Airport (LBA). May 2010. Long Beach Airport Status Report. Available at: http://www.longbeach.gov/airport/news.asp. Accessed December 28, 2010.
Los Angeles County Economic Development Corporation (LAEDC), 2010. 2010-2011 Economic Forecast and Industry Outlook. Available at http://www.laedc.org/reports/Forecast-2010-02.pdf. Access January 12, 2011.
Maricopa Association of Governments (MAG). 2010. Regional Transportation Plan July 2010. Available at: http://www.letskeepmoving.com/. Accessed December 20, 2010.
Metrolink. 2010. Route Map. Available at: http://www.metrolinktrains.com/. Accessed January 10, 2011.
Mountainland Metropolitan Planning Organization. 2007. Regional Transportation Plan 2007 - 2030. Available at http://www.mountainland.org/index.php?option=com_content&task=view&id=261&Itemid=22. Accessed December 13, 2010.
National Surface Transportation Policy and Revenue Study Commission, 2007. Transportation for Tomorrow. Available at http://transportationfortomorrow.com/final_report/index.htm.
I-15CSMP_CORRCHAR_SOCIO-ECONOMICS 31
Nevada Department of Transportation (NDOT). 2008. Statewide Transportation Plan- Moving Nevada Through 2028. Available at: http://www.nevadadot.com/planning/statewidetransportationplan/. Accessed December 17, 2010.
Passenger Rail Working Group. 2007. Vision for the Future: U.S. Intercity Passenger Rail Network through 2050. Available at: http://www.dot.state.wi.us/projects/state/rail-vision-2050.htm Accessed February 16, 2011.
PrePass. http://www.prepass.com/
Regional Transportation Commission of Southern Nevada. 2009. Regional Transportation Plan 2009-2030. Available at: http://www.rtcsouthernnevada.com/mpo/plansstudies/. Accessed December 17, 2010.
Regional Transportation Commission of Southern Nevada. 2011. Routes Maps and Schedules. Available at: http://www.rtcsnv.com/transit/route/. Accessed April 25, 2011.
Research and Innovative Technology Administration. 2010. ITS technology adoption and observed market trends from ITS deployment tracking. Available at http://ntlsearch.bts.gov/repository/record/ntl/34991.html
Ricondo and Associates. 2010. Southern Nevada Supplemental Airport Layout Plan. Prepared for Clark County Department of Aviation.
Ricondo and Associates. 2007. Updated Forecast of Aviation Activity in the Las Vegas Metropolitan Area. Prepared for Clark County Department of Aviation.
Salt Lake City Department of Airports (SLCDA). 2010. Salt Lake City International Airport Draft Environmental Assessment. Accessed February 2, 2011.
Salt Lake City International Airport (SLCIA). 2010. Airport Overview. Available at: http://www.slcairport.com/airport-overview.asp. Accessed January 4, 2011.
San Diego Association of Governments (SANDAG). 2005. Mobility 2030: The Transportation Plan for the San Diego Region. Available at: http://www.sandag.org/index.asp?projectid=197&fuseaction=projects.detail. Accessed December 10, 2010.
San Diego Association of Governments (SANDAG). 2007. 2030 San Diego Regional Transportation Plan. Available at: http://www.sandag.org/index.asp?projectid=292&fuseaction=projects.detail. Accessed December 10, 2010.
San Diego Association of Governments (SANDAG). 2011. Draft 2050 San Diego Regional Transportation Plan. Available at: http://www.sandag.org/index.asp?projectid=349&fuseaction=projects.detail. Accessed June 6, 2011.
San Diego Association of Governments (SANDAG), 2010. 2050 Regional Growth Forecast Process and Model Documentation. Available at http://www.sandag.org/index.asp?publicationid=1490&fuseaction=publications.detail. Accessed December 22, 2010.
San Diego County Regional Airport Authority (SDCRAA). 2010. Airport Fast Facts. Available at: http://www.san.org/sdia/at_the_airport/education/airport_statistics.aspx. Accessed December 29, 2010.
Southern California Association of Governments (SCAG). 2004. Regional Aviation Plan for the 2004 Regional Transportation Plan. Available at: http://www.scag.ca.gov/aviation/. Accessed January 4, 2011.
Southern California Association of Governments (SCAG). 2008. 2008 Regional Transportation Plan. Available at: http://www.scag.ca.gov/rtp2008/final.htm. Accessed December 10, 2010.
Southern California Association of Governments (SCAG). 2010. Aviation Regional Data Statistics. Available at: http://www.scag.ca.gov/aviation/. Accessed January 4, 2011.
I-15CSMP_CORRCHAR_SOCIO-ECONOMICS 32
Southern California Edison (SCE). 2007. Southern California Gateway Region Distribution and Logistics Profile. Available at: http://www.sce.com/NR/rdonlyres/28D4473B-D936-4C79-9623-DD3DF5465104/0/DistributionAndLogisticsProfile.pdf. Accessed December 13, 2010.
Southern California Logistics Airport (SCLA). 2010. Global Air Cargo Distribution Map. Available at: http://www.logisticsairport.com/. Accessed January 3, 2011.
State of Utah Demographic and Economic Analysis Section, 2010. 2010 Economic Report to the Governor. Available at http://www.governor.utah.gov/DEA/ERG/2010ERG.pdf. Accessed December 14, 2011.
Texas Transportation Institute (TTI), 2010. 2010 Urban Mobility Report. Available at http://mobility.tamu.edu/ums/report/. Accessed February 16, 2011.
The Brookings Institution. 2008. Mountain Megas: America’s Newest Metropolitan Places and a Federal Partnership to Help Them Prosper. Available at http://www.brookings.edu/~/media/Files/rc/reports/2008/0720_intermountain_west_sarzynski/IMW_full_report.pdf
The Brookings Institution. 2009. Expect Delays: An Analysis of Air Travel Trends in the United States. Available at: http://www.brookings.edu/reports/2009/1008_air_travel_tomer_puentes.aspx. Accessed January 3, 2011.
Todorovich and Hagler. 2011. High Speed Rail in America. Available at: http://www.kintera.org/TR.asp?a=hoJHIRNAJgJGJYK&s=dnKJKQMsF9IKIWOwFqF&m=9fJNITNrFbLHK1J. Accessed January 11, 2011.
Transportation Research Board - Committee for the Conference on Introducing Sustainability into Surface Transportation Planning. 2004. Integrating Sustainability into the Transportation Planning Process.
University of Las Vegas (UNLV) Center for Business and Economic Research (CBER), 2010. 2010 CBER Clark County Long-Term Population Forecast. Available at http://www.remi.com/uploads/File/Presentations/Seminars/Users_Conference_2010/Guest/2010_Clark_County_Population_Forecast.pdf. Accessed January 4, 2011.
Utah Department of Transportation (UDOT). 2007. UDOT’s Long Range Transportation Plan 2007-2030. Available at http://www.udot.utah.gov/main/f?p=100:pg:4432279209762686::::V,T:,207. Accessed December 13, 2010.
Utah Department of Transportation (UDOT). 2007. Utah Continuous Airport System Master Plan. Available at: http://udot.utah.gov/main/uconowner.gf?n=947118327175611311. Accessed January 24, 2011.
Utah Department of Transportation (UDOT). 2008. Incident Management Team Emergency Vehicle Operations. Available at: http://www.udot.utah.gov/main/uconowner.gf?n=10469804599522308.
Utah Transit Authority. 2011. Frontlines 2015. Available at: http://legacy.rideuta.com/projects/BRT/. Accessed April 25, 2011.
Utah Transit Authority. 2008. MAX Bus Rapid Transit. Available at: http://www.rideuta.com/mc/?page=Projects-Frontlines2015. Accessed January 11, 2011.
Utah Governor’s Office of Planning and Budget. 2010. Available at: http://www.governor.state.ut.us/gopb/. Accessed April 28, 2011.
US Bureau of Labor Statistics, 2009. http://www.bls.gov/cew/. Accessed January 4, 2011.
US Census Bureau. http://www.census.gov/popest/counties/counties.html Accessed January 4, 2011.
US Department of Energy. 2011. One Million Electric Vehicles By 2015 February 2011 Status Report. Available at http://www.eere.energy.gov/vehiclesandfuels/pdfs/1_million_electric_vehicles_rpt.pdf
I-15CSMP_CORRCHAR_SOCIO-ECONOMICS 33
Wasatch Front Regional Council. 2007. Wasatch Front Regional Transportation Plan 2007-2030. Available at: http://www.wfrc.org/cms/index.php?option=com_content&view=article&id=92&Itemid=78. Accessed December 10, 2010.
Western High Speed Rail Alliance. http://www.whsra.com/ Accessed May 2011
Wilbur Smith Associates Inc. et al. 2008. Multi-County Goods Movement Action Plan. Prepared for Metro, OCTA, RCTC, SANBAG, VCTC, Caltrans, SANDAG, SCAG. Available at http://www.metro.net/projects/mcgmap/goods_action_plan/. Accessed December 16, 2010.