Embed Size (px)
Citation preview
International Journal of Scientific & Engineering Research, Volume 6, Issue 6, June-2015 1626 ISSN 2229-5518
IJSER © 2015 http://www.ijser.org
Ethylene oxide Selectivity Enhancement from Oxidation of Ethylene on Silver
Catalyst By Mathematical Modeling
Adeyinka S. Yusuff*, Abel A. Adeyi, Oseh O. Jeffrey
Department of Chemical & Petroleum Engineering, AfeBabalola University,
K.m 8.5 AfeBabalola Way, Ado-Ekiti, Ekiti State Nigeria.
*Corresponding Author: [email protected]
Abstract
The selectivity enhancement of ethylene oxide from oxidation of ethylene on silver catalyst at various operating conditions was studied. The effects of two factors on the ethylene oxide selectivity and its reactor performance were examined. The first was the variation of selectivity with flow rate for different total feed rates at constant temperature, while the second factor was the variation of selectivity with oxygen conversion for different flow rates at constant temperature. A kinetic model based on the definition of selectivity was introduced. It was assumed that oxygen is basic for conversion, flow pattern is ideal, constant pressure drop across the reactor and selective reaction is accompanied by side-reaction. It was found that ethylene oxide selectivity decreases with increasing total feed rate while increases with increasing volumetric flow rate and fraction conversion of oxygen. Also, it was more enhanced at low temperature. Therefore, the selectivity of ethylene oxide and its reactor performance could be enhanced by operating its reactor at high volumetric flow rate, low feed rate, high oxygen conversion and low temperature.
Keyword: selectivity, ethylene oxide, reactor, kinetic model, enhancement, catalyst.
1.0 Introduction
Ethylene oxide also known as oxirane is the simplest cyclic ester. It is a colourless gas or liquid and has sweet odour. Ethylene oxide is very reactive and toxic because its highly strained ring can easily be opened, and is thus one of the most versatile chemical intermediates (Siegfried et al., 2012).
IJSER

International Journal of Scientific & Engineering Research, Volume 6, Issue 6, June-2015 1627 ISSN 2229-5518
IJSER © 2015 http://www.ijser.org
Ethylene oxide is manufactured commercially from oxidation of ethylene over supported silver catalysts (Stoukides et al., 1981). Silver has been found as the appropriate process catalyst for ethylene oxidation reaction because of its effectiveness in oxygen adsorption (Zahedi et al., 2011). The reaction between ethylene and oxygen to produce ethylene oxide is fairly selective, but accompanied by a side reaction. This reaction is catalyzed by silver on an alumina carrier. The side reaction is accompanied by huge amount of heat, total combustion of ethylene to carbon dioxide and water (Schouten et al., 1996).
It is necessary to understand precisely the kinetics of both selective and side reactions in order to describe the reactor selectivity and thermal behavior accurately (Schouten et al., 1996). Large number of researchers had investigated the activation energies and reaction orders of the reactions (Voge et al., 1967; Kilty et al., 1974; Sachtler et al., 1981; Berteau et al., 1982; Gu et al., 2003). A number of parameters that affect the selectivity of ethylene oxide had also been investigated and reported (Kilty et al., 1974; Kilty et al., 1972). Temkin et al (1979) studied the relationship that exists between the selectivity and ethylene oxide/oxygen ratio. A linear decrease of the selectivity with increasing ethylene oxide/oxygen ratio was observed. However, Force et al (1975) recorded an increase in selectivity with increasing ethylene oxide concentration although this change is temporary. Most of this researcher s considered only the concentration dependent on selectivity and this is not enough to describe the reactor performance in term of reactant conversion and thermal behavior.
This study aims at studying the ethylene oxide selectivity enhancement in an ideal reactor, using kinetic model similar to the Gu et al version, with the oxygen as the limiting reactant (Basis for conversion) in the selective reaction. Effects of various operating conditions such as volumetric flow rate, temperature, feed rate, oxygen conversion on the reactor selectivity are investigated.
2.0 Model Development
It is aimed to develop a model able to describe the selectivity and yield of ethylene oxide (desired product) in parallel system, the model developed assumes the following:
(1) Oxygen is the reactant (basis for conversion) in the selective reaction. (2) The pressure drop across the reactor is constant. (3) The ideal flow pattern is assumed. (4) The reaction between ethylene and oxygen is fairly selective, but accompanied by a
side-reaction.
IJSER

International Journal of Scientific & Engineering Research, Volume 6, Issue 6, June-2015 1628 ISSN 2229-5518
IJSER © 2015 http://www.ijser.org
2.1. Kinetics of Reaction
In the ethylene oxide (EO) production process, the combine stoichiometry equation of reaction between ethylene and oxygen is thus written as:
Selective reaction: 2 4 2 2 412
AgC H O C H O+ →
Side reaction: 2 4 2 2 23 2 2AgC H O CO H O+ → +
The rates of production of ethylene oxide (desired product) and carbon dioxide (unwanted product) (Gu et al., 2003) are as follows:
2
0.751EO ET Or k P P= 1
2 22CO ET Or k P P= 2
Where:
1exp(10.30 8358.5 )
(1 )n
TkD−
=+
3
2exp(12.54 9835.2 )
(1 )n
TkD−
=+
4
nD is determined as follows:
2 2 2
1 exp(9612.8 21.68) exp(16129.2 34.58)n CO O H OD T P T P P= + − + − 5
The ideal gas equation is written as:
i iP C RT= 6
Introducing equation (6) in equations (1), (2) and (5), yield;
( )2
1.75 0.751EO ET Or k RT C C= 7
( )2 2
22CO ET Or k RT C C= 8
( ) ( )( )2 2 2
1.5 0.51 exp 9612.8 21.68 exp 16129.2 34.58n CO O H OD T C RT T RT C C= + − + − 9
IJSER
International Journal of Scientific & Engineering Research, Volume 6, Issue 6, June-2015 1629 ISSN 2229-5518
IJSER © 2015 http://www.ijser.org
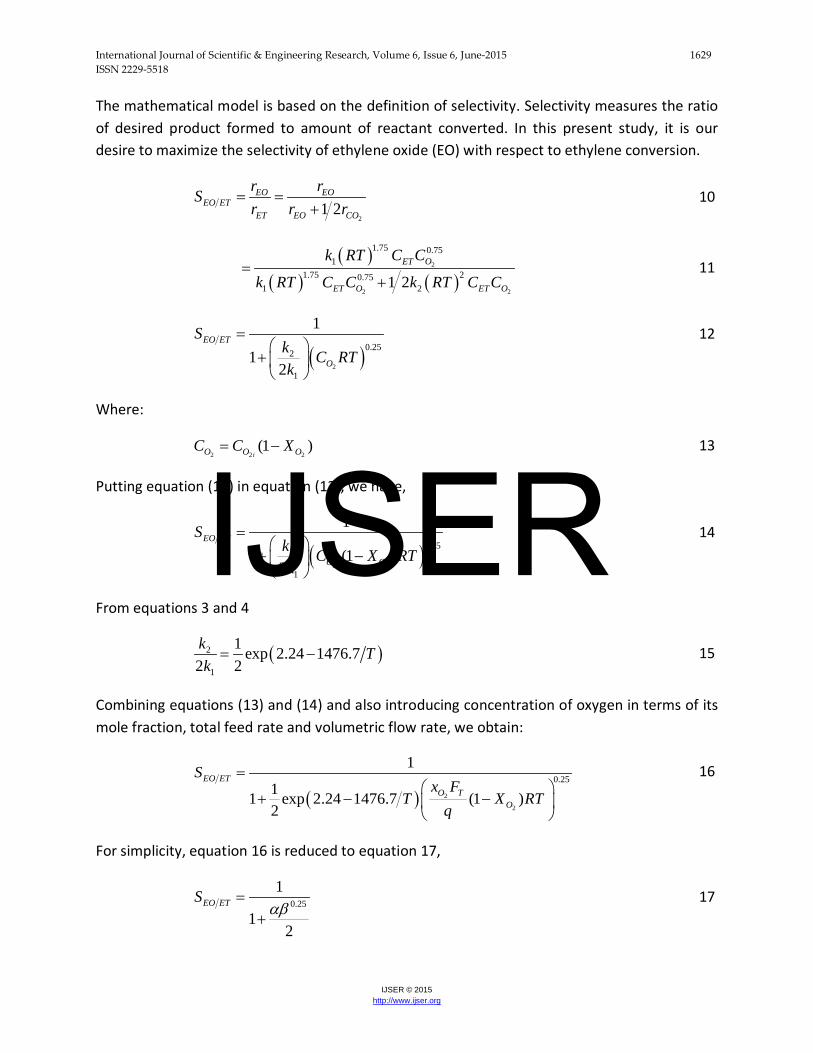
The mathematical model is based on the definition of selectivity. Selectivity measures the ratio of desired product formed to amount of reactant converted. In this present study, it is our desire to maximize the selectivity of ethylene oxide (EO) with respect to ethylene conversion.
2
1 2EO EO
EO ETET EO CO
r rSr r r
= =+
10
( )
( ) ( )2
2 2
1.75 0.751
1.75 20.751 21 2
ET O
ET O ET O
k RT C C
k RT C C k RT C C=
+ 11
( )2
0.252
1
1
12
EO ET
O
Sk C RTk
=
+
12
Where:
2 2 2
(1 )iO O OC C X= − 13
Putting equation (13) in equation (12), we have,
( )2 2
0.252
1
1
1 (1 )2 i
EO ET
O O
Sk C X RTk
=
+ −
14
From equations 3 and 4
( )2
1
1 exp 2.24 1476.72 2k Tk= − 15
Combining equations (13) and (14) and also introducing concentration of oxygen in terms of its mole fraction, total feed rate and volumetric flow rate, we obtain:
( ) 2
2
0.251
11 exp 2.24 1476.7 (1 )2
EO ETO T
O
Sx F
T X RTq
=
+ − −
16
For simplicity, equation 16 is reduced to equation 17,
0.251
12
EO ETSαβ
=+
17
IJSER
International Journal of Scientific & Engineering Research, Volume 6, Issue 6, June-2015 1630 ISSN 2229-5518
IJSER © 2015 http://www.ijser.org
Where:
exp(2.24 1476.7 )Tα = −
2 2
(1 )iO OC X RTβ = − 18
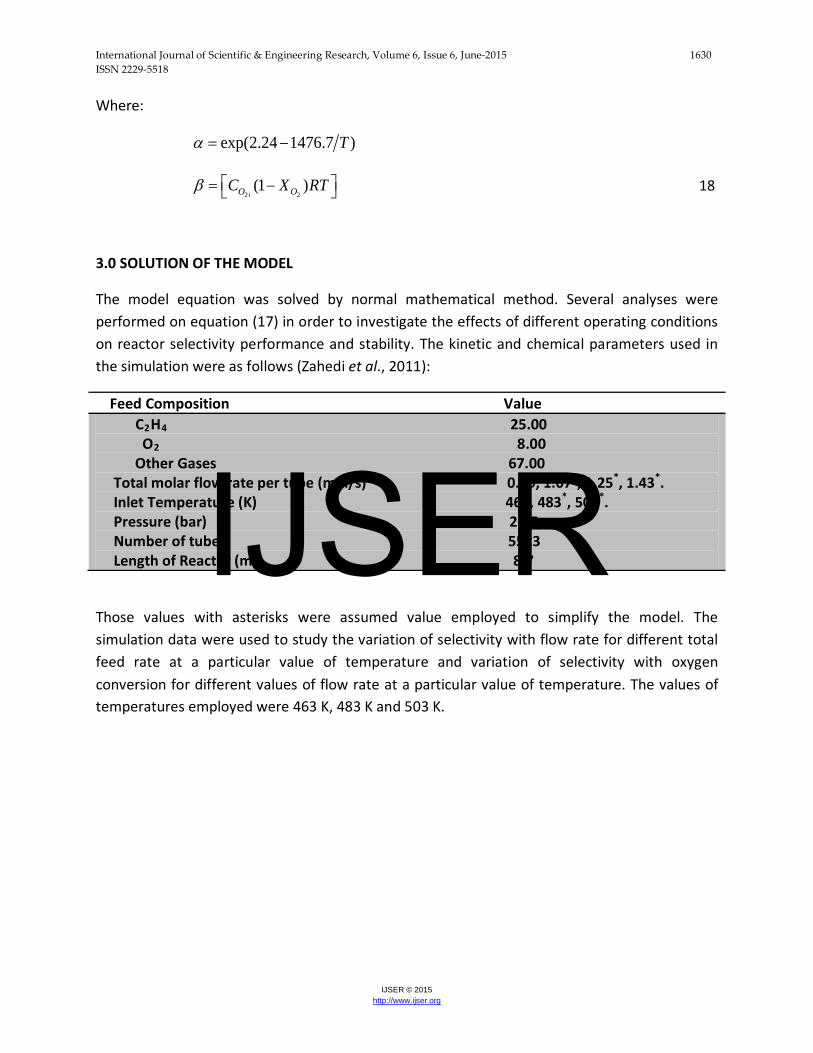
3.0 SOLUTION OF THE MODEL
The model equation was solved by normal mathematical method. Several analyses were performed on equation (17) in order to investigate the effects of different operating conditions on reactor selectivity performance and stability. The kinetic and chemical parameters used in the simulation were as follows (Zahedi et al., 2011):
Feed Composition Value C2H4 25.00 O2 8.00 Other Gases 67.00 Total molar flow rate per tube (mol/s) 0.89, 1.07*, 1.25*, 1.43*. Inlet Temperature (K) 463, 483*, 503*. Pressure (bar) 21.7 Number of tube 5523 Length of Reactor (m) 8.7
Those values with asterisks were assumed value employed to simplify the model. The simulation data were used to study the variation of selectivity with flow rate for different total feed rate at a particular value of temperature and variation of selectivity with oxygen conversion for different values of flow rate at a particular value of temperature. The values of temperatures employed were 463 K, 483 K and 503 K.
IJSER
International Journal of Scientific & Engineering Research, Volume 6, Issue 6, June-2015 1631 ISSN 2229-5518
IJSER © 2015 http://www.ijser.org
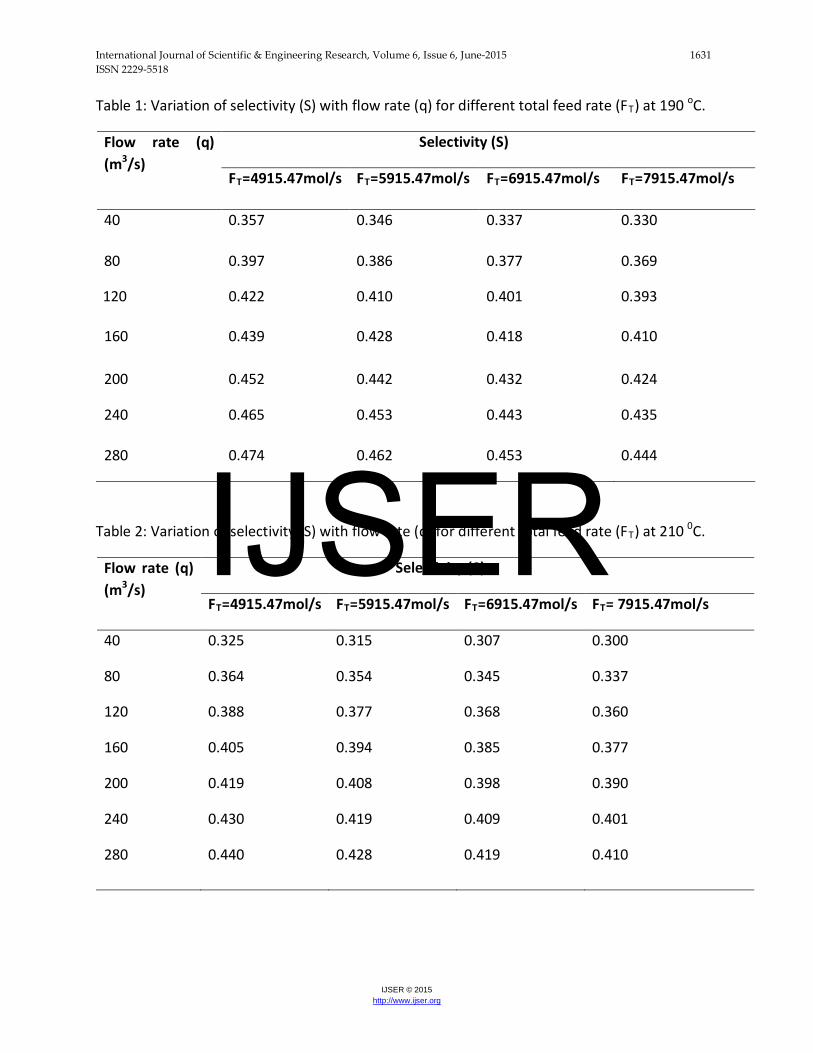
Table 1: Variation of selectivity (S) with flow rate (q) for different total feed rate (FT) at 190 oC.
Flow rate (q) (m3/s)
Selectivity (S)
FT=4915.47mol/s FT=5915.47mol/s FT=6915.47mol/s FT=7915.47mol/s
40 0.357 0.346 0.337 0.330
80 0.397 0.386 0.377 0.369
120 0.422 0.410 0.401 0.393
160 0.439 0.428 0.418 0.410
200 0.452 0.442 0.432 0.424
240 0.465 0.453 0.443 0.435
280 0.474 0.462 0.453 0.444
Table 2: Variation of selectivity (S) with flow rate (q) for different total feed rate (FT) at 210 0C.
Flow rate (q) (m3/s)
Selectivity (S)
FT=4915.47mol/s FT=5915.47mol/s FT=6915.47mol/s FT= 7915.47mol/s
40 0.325 0.315 0.307 0.300
80 0.364 0.354 0.345 0.337
120 0.388 0.377 0.368 0.360
160 0.405 0.394 0.385 0.377
200 0.419 0.408 0.398 0.390
240 0.430 0.419 0.409 0.401
280 0.440 0.428 0.419 0.410
IJSER
International Journal of Scientific & Engineering Research, Volume 6, Issue 6, June-2015 1632 ISSN 2229-5518
IJSER © 2015 http://www.ijser.org
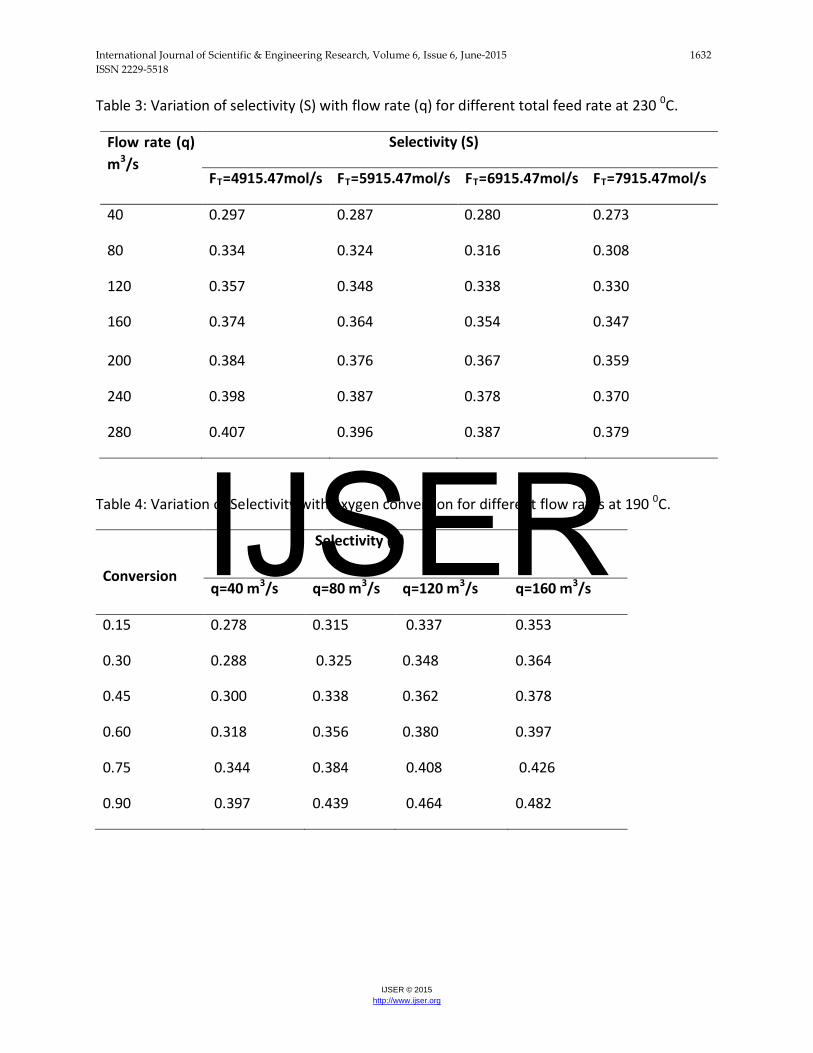
Table 3: Variation of selectivity (S) with flow rate (q) for different total feed rate at 230 0C.
Flow rate (q) m3/s
Selectivity (S)
FT=4915.47mol/s FT=5915.47mol/s FT=6915.47mol/s FT=7915.47mol/s
40 0.297 0.287 0.280 0.273
80 0.334 0.324 0.316 0.308
120 0.357 0.348 0.338 0.330
160 0.374 0.364 0.354 0.347
200 0.384 0.376 0.367 0.359
240 0.398 0.387 0.378 0.370
280 0.407 0.396 0.387 0.379
Table 4: Variation of Selectivity with oxygen conversion for different flow rates at 190 0C.
Conversion
Selectivity (S)
q=40 m3/s q=80 m3/s q=120 m3/s q=160 m3/s
0.15 0.278 0.315 0.337 0.353
0.30 0.288 0.325 0.348 0.364
0.45 0.300 0.338 0.362 0.378
0.60 0.318 0.356 0.380 0.397
0.75 0.344 0.384 0.408 0.426
0.90 0.397 0.439 0.464 0.482
IJSER
International Journal of Scientific & Engineering Research, Volume 6, Issue 6, June-2015 1633 ISSN 2229-5518
IJSER © 2015 http://www.ijser.org
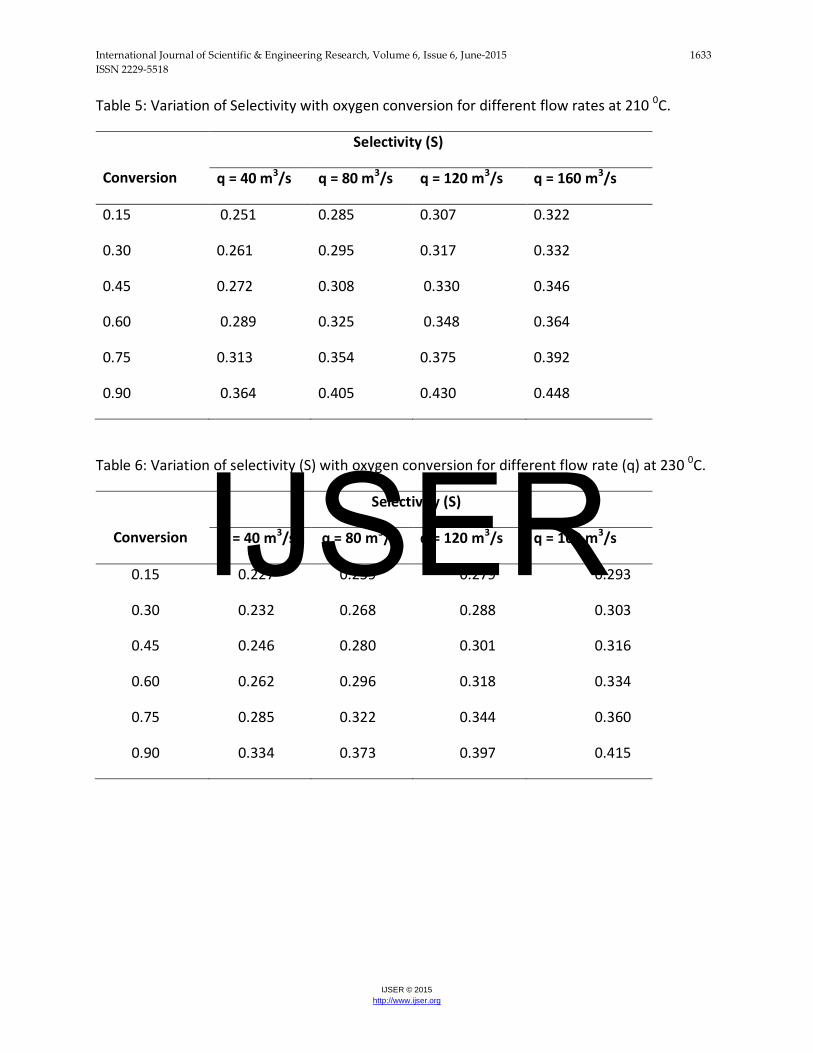
Table 5: Variation of Selectivity with oxygen conversion for different flow rates at 210 0C.
Conversion
Selectivity (S)
q = 40 m3/s q = 80 m3/s q = 120 m3/s q = 160 m3/s
0.15 0.251 0.285 0.307 0.322
0.30 0.261 0.295 0.317 0.332
0.45 0.272 0.308 0.330 0.346
0.60 0.289 0.325 0.348 0.364
0.75 0.313 0.354 0.375 0.392
0.90 0.364 0.405 0.430 0.448
Table 6: Variation of selectivity (S) with oxygen conversion for different flow rate (q) at 230 0C.
Conversion
Selectivity (S)
q = 40 m3/s q = 80 m3/s q = 120 m3/s q = 160 m3/s
0.15 0.227 0.259 0.279 0.293
0.30 0.232 0.268 0.288 0.303
0.45 0.246 0.280 0.301 0.316
0.60 0.262 0.296 0.318 0.334
0.75 0.285 0.322 0.344 0.360
0.90 0.334 0.373 0.397 0.415
IJSER
International Journal of Scientific & Engineering Research, Volume 6, Issue 6, June-2015 1634 ISSN 2229-5518
IJSER © 2015 http://www.ijser.org
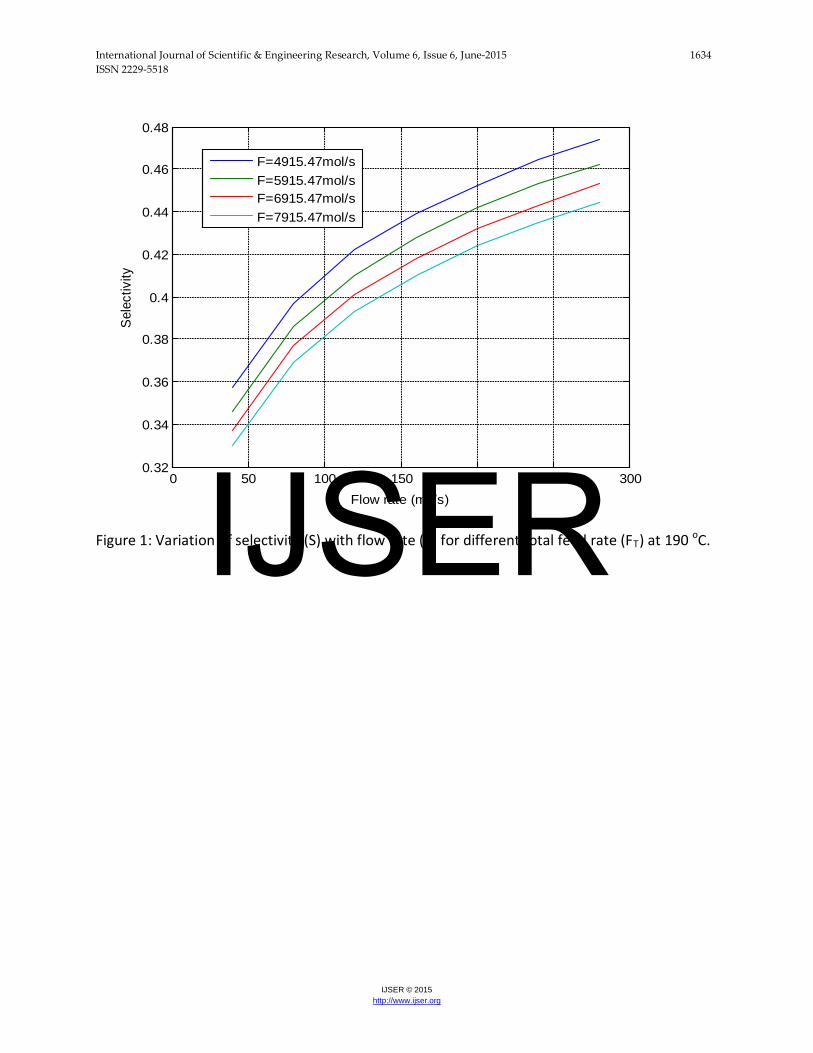
Figure 1: Variation of selectivity (S) with flow rate (q) for different total feed rate (FT) at 190 oC.
0 50 100 150 200 250 3000.32
0.34
0.36
0.38
0.4
0.42
0.44
0.46
0.48
Flow rate (m3/s)
Sele
ctiv
ity
F=4915.47mol/sF=5915.47mol/sF=6915.47mol/sF=7915.47mol/s
IJSER
International Journal of Scientific & Engineering Research, Volume 6, Issue 6, June-2015 1635 ISSN 2229-5518
IJSER © 2015 http://www.ijser.org
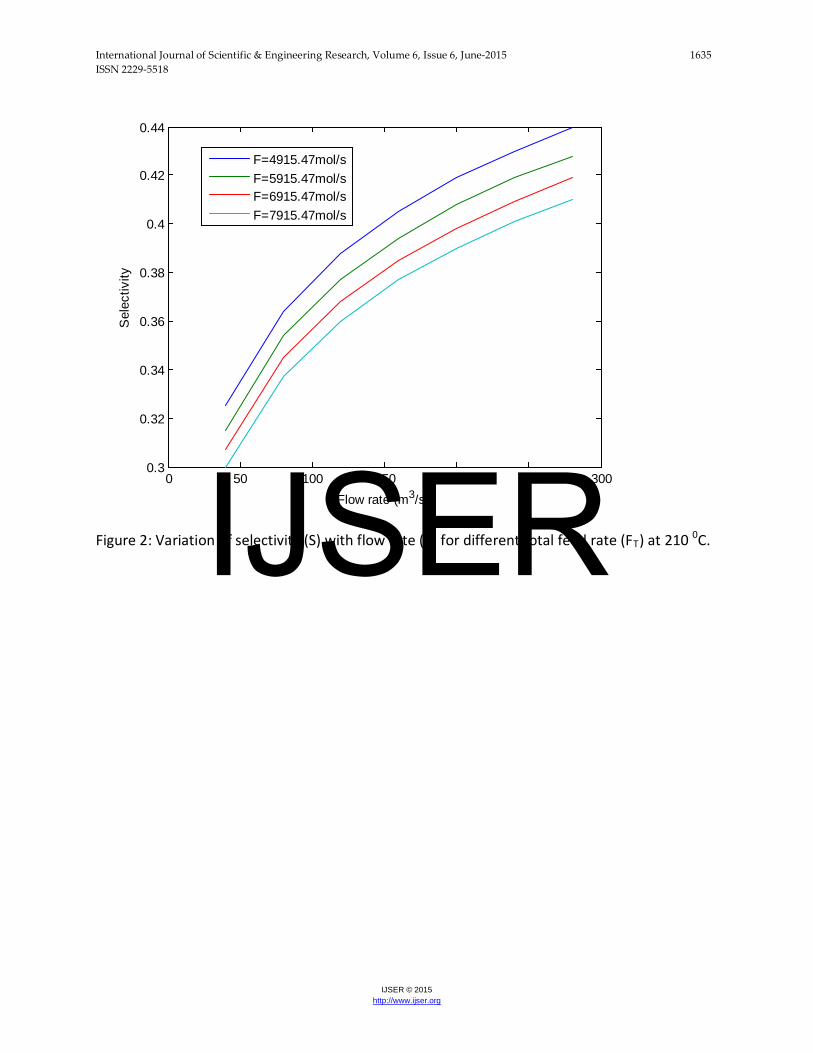
Figure 2: Variation of selectivity (S) with flow rate (q) for different total feed rate (FT) at 210 0C.
0 50 100 150 200 250 3000.3
0.32
0.34
0.36
0.38
0.4
0.42
0.44
Flow rate (m3/s)
Sel
ectiv
ity
F=4915.47mol/sF=5915.47mol/sF=6915.47mol/sF=7915.47mol/s
IJSER
International Journal of Scientific & Engineering Research, Volume 6, Issue 6, June-2015 1636 ISSN 2229-5518
IJSER © 2015 http://www.ijser.org
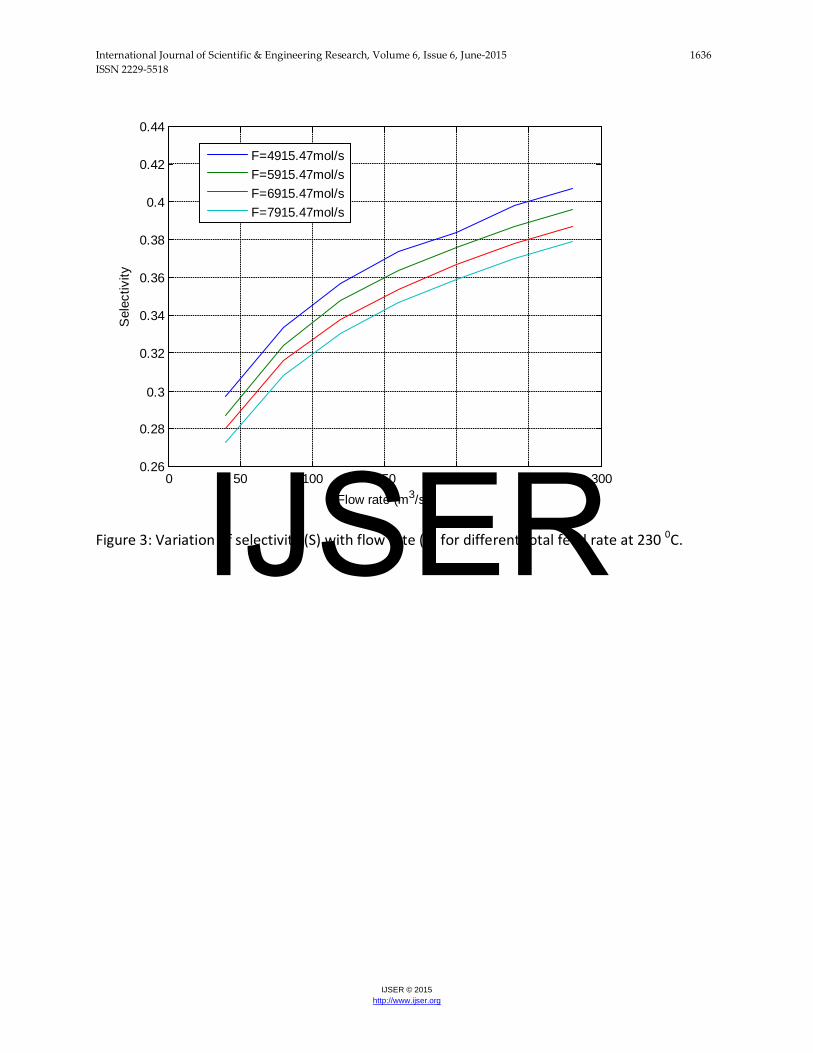
Figure 3: Variation of selectivity (S) with flow rate (q) for different total feed rate at 230 0C.
0 50 100 150 200 250 3000.26
0.28
0.3
0.32
0.34
0.36
0.38
0.4
0.42
0.44
Flow rate (m3/s)
Sel
ectiv
ity
F=4915.47mol/sF=5915.47mol/sF=6915.47mol/sF=7915.47mol/s
IJSER
International Journal of Scientific & Engineering Research, Volume 6, Issue 6, June-2015 1637 ISSN 2229-5518
IJSER © 2015 http://www.ijser.org
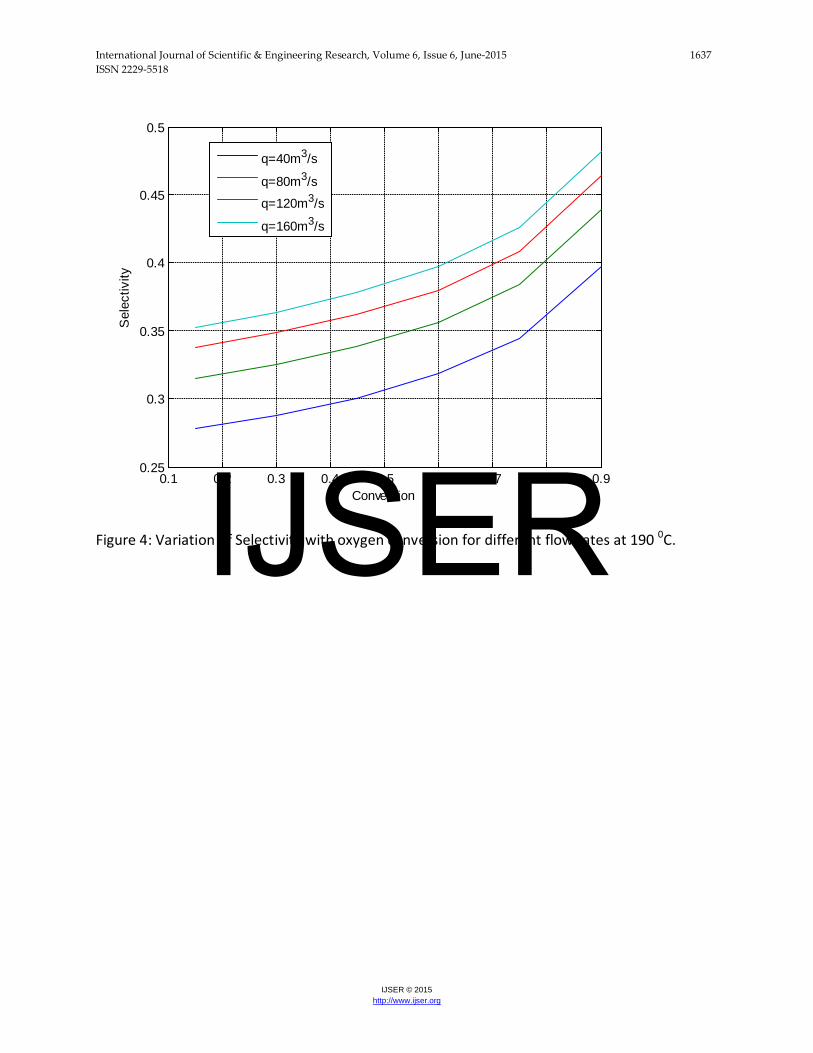
Figure 4: Variation of Selectivity with oxygen conversion for different flow rates at 190 0C.
0.1 0.2 0.3 0.4 0.5 0.6 0.7 0.8 0.90.25
0.3
0.35
0.4
0.45
0.5
Conversion
Sel
ectiv
ity
q=40m3/s
q=80m3/s
q=120m3/s
q=160m3/s
IJSER
International Journal of Scientific & Engineering Research, Volume 6, Issue 6, June-2015 1638 ISSN 2229-5518
IJSER © 2015 http://www.ijser.org
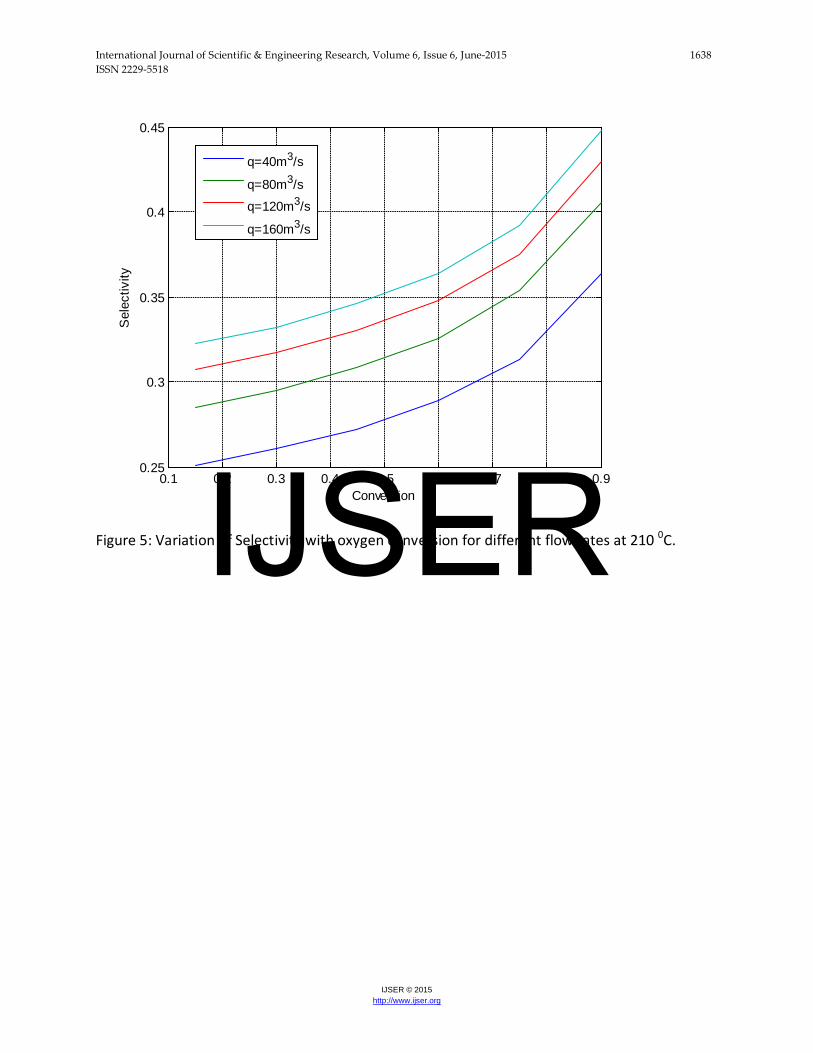
Figure 5: Variation of Selectivity with oxygen conversion for different flow rates at 210 0C.
0.1 0.2 0.3 0.4 0.5 0.6 0.7 0.8 0.90.25
0.3
0.35
0.4
0.45
Conversion
Sel
ectiv
ity
q=40m3/s
q=80m3/s
q=120m3/s
q=160m3/s
IJSER
International Journal of Scientific & Engineering Research, Volume 6, Issue 6, June-2015 1639 ISSN 2229-5518
IJSER © 2015 http://www.ijser.org
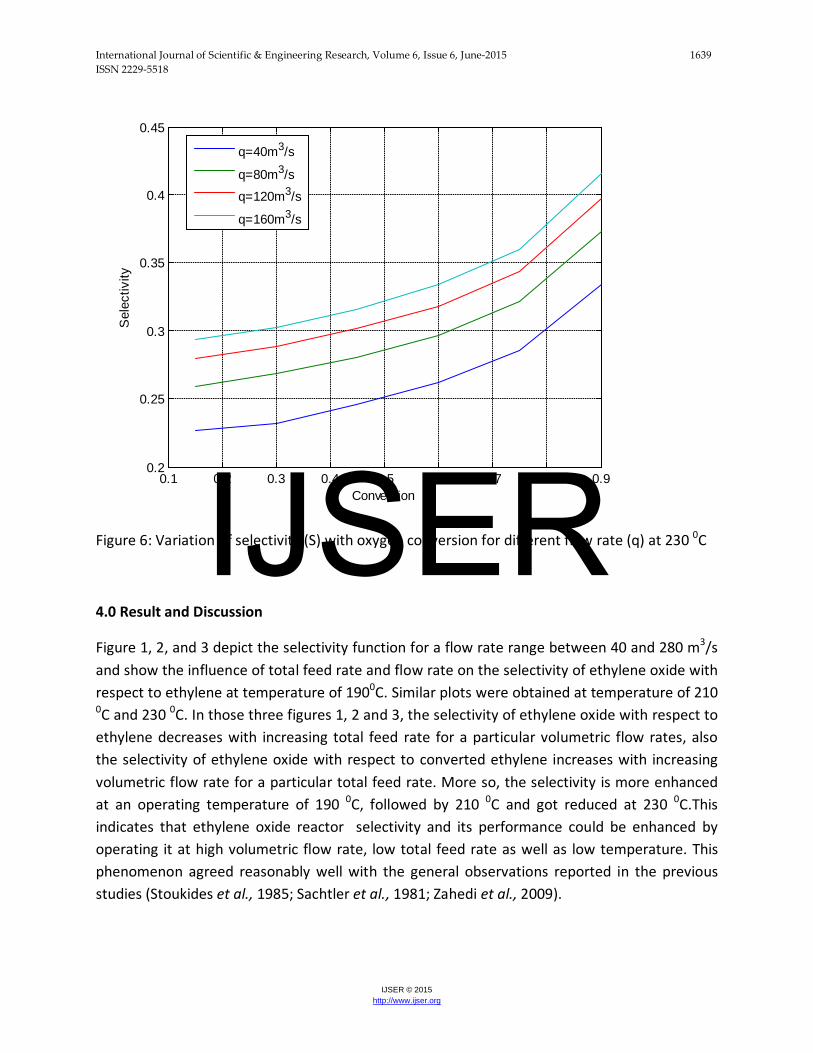
Figure 6: Variation of selectivity (S) with oxygen conversion for different flow rate (q) at 230 0C
4.0 Result and Discussion
Figure 1, 2, and 3 depict the selectivity function for a flow rate range between 40 and 280 m3/s and show the influence of total feed rate and flow rate on the selectivity of ethylene oxide with respect to ethylene at temperature of 1900C. Similar plots were obtained at temperature of 210 0C and 230 0C. In those three figures 1, 2 and 3, the selectivity of ethylene oxide with respect to ethylene decreases with increasing total feed rate for a particular volumetric flow rates, also the selectivity of ethylene oxide with respect to converted ethylene increases with increasing volumetric flow rate for a particular total feed rate. More so, the selectivity is more enhanced at an operating temperature of 190 0C, followed by 210 0C and got reduced at 230 0C.This indicates that ethylene oxide reactor selectivity and its performance could be enhanced by operating it at high volumetric flow rate, low total feed rate as well as low temperature. This phenomenon agreed reasonably well with the general observations reported in the previous studies (Stoukides et al., 1985; Sachtler et al., 1981; Zahedi et al., 2009).
0.1 0.2 0.3 0.4 0.5 0.6 0.7 0.8 0.90.2
0.25
0.3
0.35
0.4
0.45
Conversion
Sel
ectiv
ity
q=40m3/s
q=80m3/s
q=120m3/s
q=160m3/s
IJSER
International Journal of Scientific & Engineering Research, Volume 6, Issue 6, June-2015 1640 ISSN 2229-5518
IJSER © 2015 http://www.ijser.org
Figures 4-6 show the effects of varying the total feed rate and fractional conversion of oxygen (limiting reactant) on the ethylene oxide reactor selectivity and performance. In those figures, the selectivity of ethylene oxide with respect to ethylene converted increases with increasing volumetric flow rate for a particular fractional conversion of oxygen, also, the selectivity increases with increasing fractional conversion of oxygen for a particular volumetric flow rate. Meanwhile, the ethyleneoxide selectivity is more enhanced at an operating temperature of 190 0C, followed by 210 0C and got reduced at 230 0C. This indicates that ethylene oxide reactor selectivity and its performance could be enhanced by operating it at high volumetric flow rate, low total feed rate, high oxygen fractional conversion, as well as low temperature. This phenomenon agreed reasonably well with the general observation reported in the literature.
5.0 Conclusion
The effects of various operating parameters on the selectivity of ethylene oxide and reactor performance had been studied. It was found that ethylene oxide selectivity decreases with increasing total feed rate while increases with increasing volumetric flow rate and fractional conversion of oxygen. Also, ethylene oxide selectivity is enhanced at low operating temperature. In order to enhance the selectivity of ethylene oxide and its reactor performance, it is pertinent to operate ethylene oxide reactor at high volumetric flow rate, high oxygen fractional conversion, low feed rate and low temperature.
NOTATION
C concentration of species, kmol/m3
Dn parameter in equations 3 and 4
F feed rate, mol/s
P partial pressure, atm
K rate constant,
q volumetric flow rate, m3/s.
r rate of reaction,
R universal gas constant, J/mol.K
SEO/E selectivity of ethylene oxide with respect to ethylene
T temperature, K
SUBSCRPTS
IJSER
International Journal of Scientific & Engineering Research, Volume 6, Issue 6, June-2015 1641 ISSN 2229-5518
IJSER © 2015 http://www.ijser.org
CO2 carbon dioxide
EO ethylene oxide
ET ethylene
O2 oxygen
H2O water
T total
GREEK LETTER
exp(2.24 1476.7 / )Tα = −
( )2 21
iO OC X RTβ = −
REFERENCE
(1) R. Siegfried, M. Dieter (2012). “Encyclopedia of Industrial Chemistry, Wiley-VCH Verlag GmbH & Co. kGaA- Weinheim.
(2) M. Stoukides, C.G. Vayenas (1985). “Solid Electrolyte Aided Study of the Ethylene Oxidation on Polycrystalline Silver”. J. Catal. 69, 18.
(3) G. Zahedi, A. Lohi (2009). “Heterogeneous Dynamic Modeling and Simulation of an Industrial Ethylene Oxide Reactor Experiencing Catalyst deactivation.” Journal .Chem. Engr. 3(2009) 18-26.
(4) E.P.S. Schouten, P.C. Borman, K.R. Westerp (1996). “Determination of the Kinetic of EtheneEpoxidation “, Chemical Engineering and Processing 35 (1996) 43-55.
(5) H.H,Vogel, C.R, Adams (1967). “Catalytic Oxidation of Olefins”, Adv. Catal. 17, 154. (6) P.A. Kilty, W.M.H, Sachtler (1974). “The Mechanism of the Selective Oxidation of
Ethylene to Ethylene Oxide”, Cat. Rev. Sci.Eng. 10, 1. (7) P.A, Kilty, N.C. Rol, W.M.H, Sachtler (1972). “Identification of Oxygen Complexes
Adsorbed on Silver and Their Function in the Catalytic Oxidation of Ethylene”, 5th Int. Congress on Catalysis, Miami, Paper 64.
(8) M.A, Barteau, R.J. Madix (1982). “The Chemical Physics of Solid Surfaces and Heterogeneous Catalysis”, D.A. King and D.P. Woodruff, Editors, Vol.4.
(9) W.M.H, Sachtler, C, Backx, R.A, Santen (1981). “On the Mechanism of Ethylene Epoxidation” Cat. Rev. Sci. Eng. 23, 127.
(10) M.I, Temkin (1979). “Oxidation of Ethylene into Ethylene Oxide”, Adv. Cat. 28, 230.
IJSER

International Journal of Scientific & Engineering Research, Volume 6, Issue 6, June-2015 1642 ISSN 2229-5518
IJSER © 2015 http://www.ijser.org
(11) E.L, Force, A.T, Bell (1975). “The Relationship of Adsorbed Species Observed by Infrared Spectroscopy to the Mechanism of Ethylene Oxidation Over Silver’’, J. Catal. 40, 356.
(12) G, Zahedi, A, Lohi, K.A, Mahdi (2011). “Hybrid Modeling of Ethylene to Ethylene Oxide Heterogeneous Reactor”, Fuel Process Technology 92, 1725-1732.
IJSER