Embed Size (px)
Citation preview

Board Mtg Date Item #
JM 6.23.16 3B
ETF 6.23.16 4B
Reviewed and approved by Robert J. Conlin, Secretary
Electronically Signed 6/10/16
Correspondence Memorandum
Date: June 10, 2016 To: Employee Trust Funds Board From: Robert C. Willett, CPA Chief Trust Finance Officer Subject: WRS Active Lives Valuation & Gain / Loss Analysis Staff requests that the Employee Trust Funds Board (Board) approve the Thirty-Fifth Annual Actuarial Valuation and Gain/Loss Analysis as of December 31, 2015. Gabriel Roeder Smith & Company GRS) has completed the actuarial valuation of non-retired members of the Wisconsin Retirement System. The results of the study are summarized below (millions $):
December 31, 2015 2014 Actuarial Accrued Liability $ 91,526.5 $ 89,392.1 Actuarial Value of Assets 91,502.4 89,360.4 Unfunded Actuarial Accrued Liability 24.1 31.7 Funded Ratio 99.97% 99.96%
GRS is recommending the following adjustments to contribution rates for 2017.
General, Teachers,
Executive and Elected Officials
Protective Occupations
With Social Security
Without Social Security
2017 2016 2017 2016 2017 2016 Employer Normal Cost 6.80% 6.60% 10.60% 9.40% 14.9% 13.2% Participant Normal Cost 6.80% 6.60% 6.80% 6.60% 6.80% 6.60%
Total Normal Cost 13.6% 13.2% 17.4% 16.0% 21.7% 19.8% Actuaries from GRS will be at the Board meeting to present their report and to answer any questions. Attachment: Thirty-Fifth Annual Actuarial Valuation and Gain/Loss Analysis
STATE OF WISCONSIN Department of Employee Trust Funds
Robert J. Conlin SECRETARY
801 W Badger Road PO Box 7931 Madison WI 53707-7931 1-877-533-5020 (toll free) Fax 608-267-4549 etf.wi.gov
WISCONSIN RETIREMENT SYSTEM T H I R T Y - F I F T H A N N U A L A C T U A R I A L V A L U A T I O N A N D G A I N / L O S S A N A L Y S I S
D E C E M B E R 3 1 , 2 0 1 5

Wisconsin Retirement System
OUTLINE OF CONTENTS
Section Pages Items Introduction
Section A Executive Summary 1-4 Executive Summary
Section B Funding Results 1-7 Valuation Results
Section C Fund Assets 1-2
3
Financial Data Market Recognition Account
Section D 1 2
3-4 5
6-9 10
Gain/Loss Active Member Gain/Loss Analysis Population Development Comments Actual vs. Expected Changes in EAR Gains and Losses During 2015 Gain (Loss) from Investment Income
Section E Census Data
1-9 Non-Retired Participant Data
Section F Financial Reporting 1
2-3 4 5
Summary of Assumptions and Methods Statement of Net Plan Assets Schedule of Funding Progress & Accrued Liabilities Solvency and Contributions
Section G 1 2
3-9
Methods and Assumptions Actuarial Valuation Method Asset Valuation Method Summary of Assumptions
Section H Plan Provisions
1-4 Benefit Provisions
Appendix 1 Appendix 2 Appendix 3
Glossary Valuation Process Gain/Loss Exhibits
June 10, 2016 Employee Trust Funds Board Wisconsin Department of Employee Trust Funds 801 West Badger Road Madison, Wisconsin 53713 Ladies and Gentlemen: The results of the December 31, 2015 annual actuarial valuations of non-retired members covered by the Wisconsin Retirement System are presented in this report. The valuations establish contribution rates for the 2017 calendar year in conformance with Chapter 40 of the Wisconsin Statutes. This report should not be relied upon for any other purpose. This report may be distributed to parties other than the Fund only in its entirety and only with the permission of the Board. GRS is not responsible for unauthorized use of this report. Determinations of financial results, associated with the benefits described in this report, for purposes other than those identified above may be significantly different. The change in the normal cost rates from last year are shown below:
General and Protective ProtectiveExecutive/Elected with SS without SS
0.4% 1.4% 1.9%
The valuations are based upon our understanding of the main plan provisions related to General, Executive and Elected, and Protective Occupation employment with and without Social Security coverage. The plan provisions evaluated are summarized in Section H of this report. Please advise us of any material misstatements in the summary and do not rely on this report until such are resolved. The individual member statistical data required for the valuations was furnished by the Department of Employee Trust Funds (DETF), together with pertinent data on financial operations. The cooperation of DETF staff in furnishing these materials is acknowledged with appreciation. We checked for internal reasonability and year to year consistency but did not audit the data. We are not responsible for the accuracy or completeness of the information provided by others. Actuarial valuations are based upon assumptions regarding future activity in specific risk areas including the rates of investment return and payroll growth, eligibility for the various classes of benefits, and longevity among retired lives. The Board adopts these assumptions after considering the advice of the actuary and other professionals. Each actuarial valuation takes into account all prior differences between actual and assumed experience in each risk area and adjusts the contribution rates as needed. The December 31, 2015 valuations were based upon assumptions that were recommended in connection with a study of experience during 2012-2014 and benefit provisions in effect on December 31, 2015.

Employee Trust Funds Board Wisconsin Department of Employee Trust Funds June 8, 2016 Page 2 Future actuarial measurements may differ significantly from those presented in this report due to such factors as experience differing from that anticipated by actuarial assumptions, changes in plan provisions, actuarial assumptions/methods or applicable law. Due to the limited scope of this assignment, we did not perform an analysis of the potential range of future measurements. To the best of our knowledge, this report is complete and accurate and was made in accordance with generally recognized actuarial methods. Brian B. Murphy, Mark Buis, and James D. Anderson are Members of the American Academy of Actuaries (MAAA), and meet the Qualification Standards of the American Academy of Actuaries to render the actuarial opinions contained herein. The signing actuaries are independent of the plan sponsor. The valuations were completed by qualified actuaries in accordance with accepted actuarial procedures as prescribed by the Actuarial Standards Board. It is our opinion that the Wisconsin Retirement System is operating in accordance with actuarial principles of level percent-of-payroll financing. Respectfully submitted,
Brian B. Murphy, FSA, EA, FCA, MAAA
Mark Buis, FSA, EA, FCA, MAAA James D. Anderson, FSA, EA, MAAA BBM/MB/JDA:ah

SECTION A E X E C UTI VE S UM M ARY

Wisconsin Retirement System A-1
EXECUTIVE SUMMARY
1. Required Employer Contributions to Support Retirement Benefits
2017 2016 2017 2016 2017 2016
Employer Normal Cost 6.80% 6.60% 10.60% 9.40% 14.90% 13.20%
Participant Normal Cost 6.80% 6.60% 6.80% 6.60% 6.80% 6.60%
Total Normal Cost 13.6% 13.2% 17.4% 16.0% 21.7% 19.8%
Unfunded Actuarial Accrued Liability (UAAL)^ 0.07% 0.00% 0.08% 0.00% 0.14% 0.20%
WRS Average Total 13.7% 13.2% 17.5% 16.0% 21.8% 20.0%
General, Executive &
Elected Officials*
Protective OccupationWith Without
Soc. Sec. Soc. Sec.
* Beginning with calendar year 2017, contribution rates for the General and Executive & Elected
groups were combined. The 2016 contribution rates shown above are for the General Group only, please refer to the December 31, 2014 valuation report for the Executive and Elected Officials 2016 contribution rate.
^ Method for reporting the average UAL rate was revised from prior year. Actual employer contributions did not change.
Under Section 40.05 of the Wisconsin statutes updated for Act 10 and 32 of 2011, contribution rates
are split evenly between the employer normal cost and the participant normal cost for both General
Participants and Executive and Elected Officials. For protective occupations, the participant normal
cost is set equal to the participant normal cost for General Participants. Act 10 of 2011 eliminated the
benefit adjustment contribution.
Rates shown for UAAL are weighted averages of rates that vary by employer units based on amounts
paid in the prior year. Each affected employer unit has a separately determined UAL rate.
Contributions to support the Section 40.65 Duty Disability Program and the Accumulated Sick Leave
Conversion Credit Program are in addition to the WRS rates shown above.
Wisconsin Retirement System A-2
EXECUTIVE SUMMARY
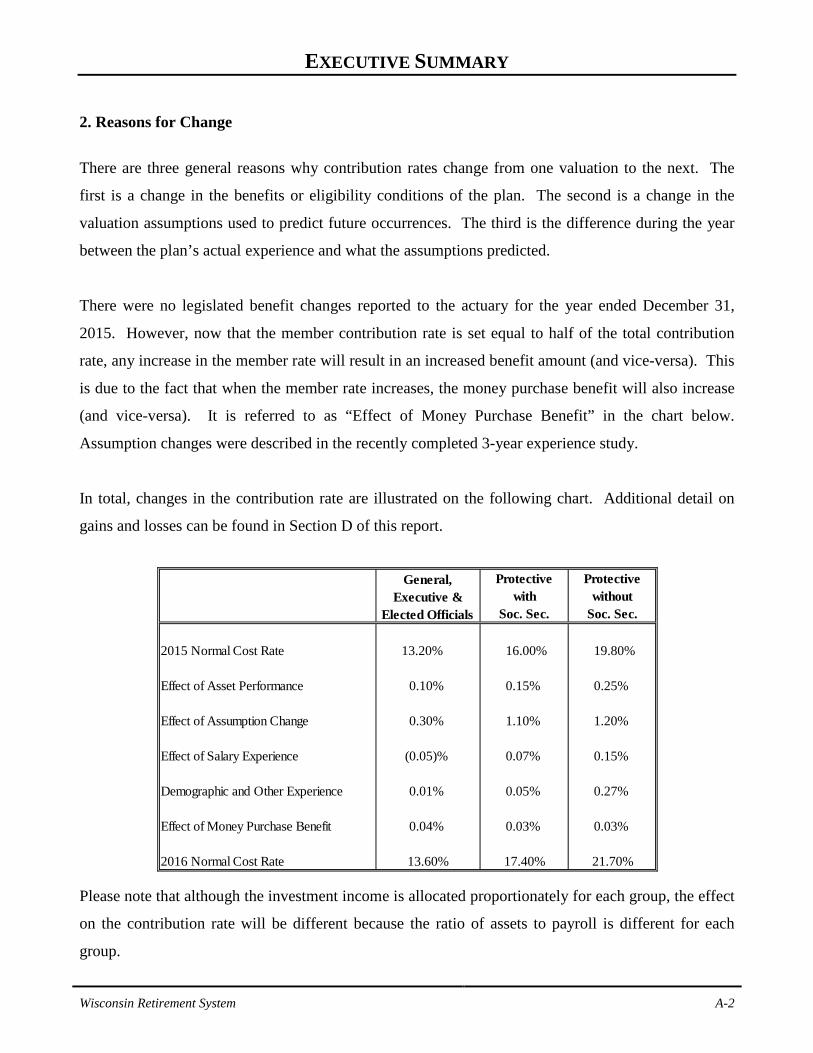
2. Reasons for Change
There are three general reasons why contribution rates change from one valuation to the next. The
first is a change in the benefits or eligibility conditions of the plan. The second is a change in the
valuation assumptions used to predict future occurrences. The third is the difference during the year
between the plan’s actual experience and what the assumptions predicted.
There were no legislated benefit changes reported to the actuary for the year ended December 31,
2015. However, now that the member contribution rate is set equal to half of the total contribution
rate, any increase in the member rate will result in an increased benefit amount (and vice-versa). This
is due to the fact that when the member rate increases, the money purchase benefit will also increase
(and vice-versa). It is referred to as “Effect of Money Purchase Benefit” in the chart below.
Assumption changes were described in the recently completed 3-year experience study.
In total, changes in the contribution rate are illustrated on the following chart. Additional detail on
gains and losses can be found in Section D of this report.
Protective Protectivewith without
Soc. Sec. Soc. Sec.
2015 Normal Cost Rate 13.20% 16.00% 19.80%
Effect of Asset Performance 0.10% 0.15% 0.25%
Effect of Assumption Change 0.30% 1.10% 1.20%
Effect of Salary Experience (0.05)% 0.07% 0.15%
Demographic and Other Experience 0.01% 0.05% 0.27%
Effect of Money Purchase Benefit 0.04% 0.03% 0.03%
2016 Normal Cost Rate 13.60% 17.40% 21.70%
General, Executive &
Elected Officials
Please note that although the investment income is allocated proportionately for each group, the effect
on the contribution rate will be different because the ratio of assets to payroll is different for each
group.

Wisconsin Retirement System A-3
EXECUTIVE SUMMARY
3. General Comments Based upon this valuation, normal cost contribution rates increased for all groups primarily due to
changes in actuarial assumptions and unfavorable investment performance from prior years flowing
through the Market Recognition Account (MRA).
In total, during 2015, investment return was below the assumed 2015 level of 7.20% on a market
value basis. Under the asset valuation method (using the MRA), gains and losses are phased-in over a
five year period, resulting in a 6.3% return on an Actuarial Value of Assets basis in the Core Fund.
The Actuarial Value of Assets exceeds the Market Value of Assets by approximately 4% as of the
valuation date. The statutory asset valuation method will recognize all of the differences between
actuarial value and market value of $3.4 billion over four future years.
This valuation includes liabilities for future claims under the Long Term Disability Insurance (LTDI)
program that became operational late in 1992. Inter-fund transfers between WRS and the LTDI
program to support claims currently payable are addressed in a separate report to the Group Insurance
and Employee Trust Funds Boards.
Conclusion. Based upon the results of the December 31, 2015 regular annual actuarial valuation, it is
our opinion that the Wisconsin Retirement System continues to operate in accordance with actuarial
principles of level percent-of-payroll financing.

Wisconsin Retirement System A-4
OTHER OBSERVATIONS
General Implications of Contribution Allocation Procedure or Funding Policy on Future Expected Plan Contributions and Funded Status Given the plan’s contribution allocation procedure, if all actuarial assumptions are met (including the assumption of the plan earning 7.2% on the actuarial value of assets), it is expected that:
(1) The normal cost as a percentage of pay will decrease to the level of the future service
normal cost as time passes. (2) The unfunded liability will decrease in dollar amount until it is fully funded. (3) The funded status of the plan will remain very close to a 100% funded ratio.
Limitations of Funded Status Measurements Unless otherwise indicated, a funded ratio measurement presented in this report is based upon the actuarial accrued liability and the market value of assets. Unless otherwise indicated, with regard to any funded status measurements presented in this report:
(1) The measurement is inappropriate for assessing the sufficiency of plan assets to cover the estimated cost of settling the plan’s benefit obligations, in other words of transferring the obligations to a unrelated third party in an arm’s length market value type transaction.
(2) The measurement is dependent upon the actuarial cost method which, in combination with the plan’s amortization policy, affects the timing and amounts of future contributions. The amount of future contributions will most certainly differ from those assumed in this report due to future actual experience differing from assumed experience based upon actuarial assumptions. A funded ratio measurement in this report of 100% is not synonymous with no required future contributions. If the funded ratio were 100%, the plan would still require future normal cost contributions (i.e., contributions to cover the cost of the active membership accruing an additional year of service credit).
(3) The measurement would produce a different result if the market value of assets were used instead of the actuarial value of assets, unless the market value of assets is used in the measurement.
Limitation of Project Scope Actuarial standards do not require the actuary to evaluate the ability of the plan sponsor or other contributing entity to make required contributions to the plan when due. Such an evaluation was not within the scope of this project and is not within the actuary’s domain of expertise. Consequently, the actuary performed no such evaluation.

SECTION B F UN D I N G RE S ULT S
Wisconsin Retirement System B-1
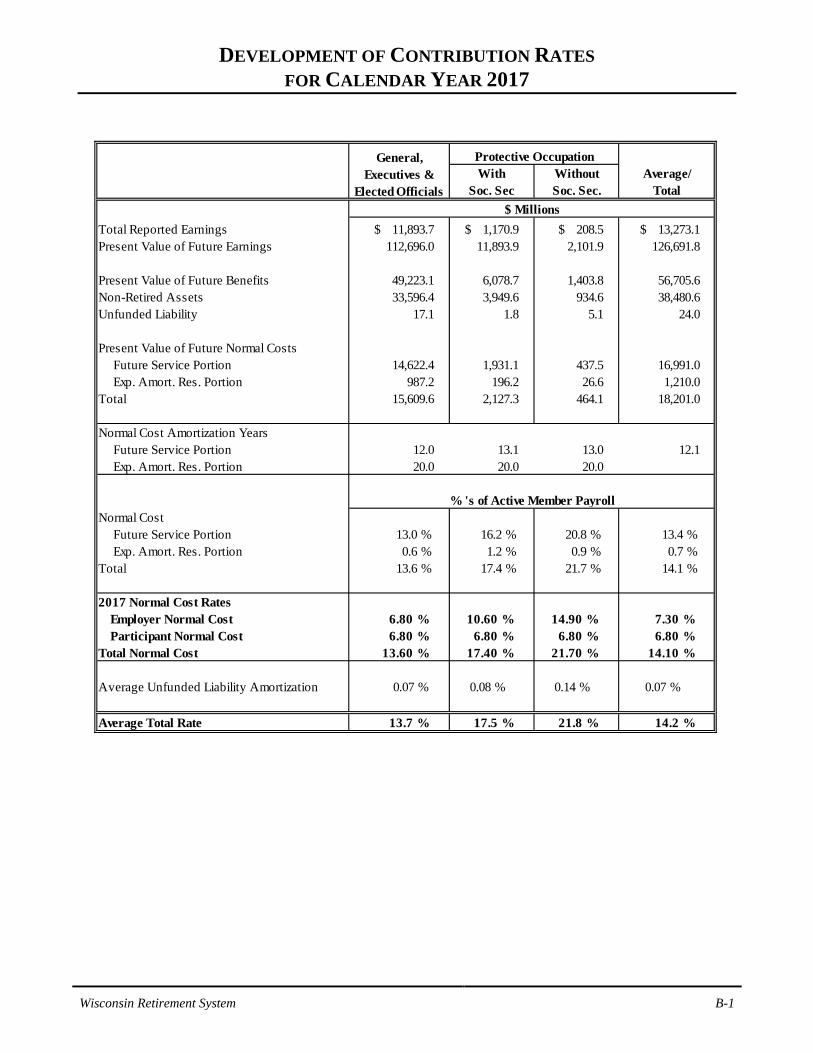
DEVELOPMENT OF CONTRIBUTION RATES
FOR CALENDAR YEAR 2017
With Without Average/Soc. Sec Soc. Sec. Total
Total Reported Earnings $ 11,893.7 $ 1,170.9 $ 208.5 $ 13,273.1 Present Value of Future Earnings 112,696.0 11,893.9 2,101.9 126,691.8
Present Value of Future Benefits 49,223.1 6,078.7 1,403.8 56,705.6 Non-Retired Assets 33,596.4 3,949.6 934.6 38,480.6 Unfunded Liability 17.1 1.8 5.1 24.0
Present Value of Future Normal Costs Future Service Portion 14,622.4 1,931.1 437.5 16,991.0 Exp. Amort. Res. Portion 987.2 196.2 26.6 1,210.0 Total 15,609.6 2,127.3 464.1 18,201.0
Normal Cost Amortization Years Future Service Portion 12.0 13.1 13.0 12.1 Exp. Amort. Res. Portion 20.0 20.0 20.0
Normal Cost Future Service Portion 13.0 % 16.2 % 20.8 % 13.4 % Exp. Amort. Res. Portion 0.6 % 1.2 % 0.9 % 0.7 % Total 13.6 % 17.4 % 21.7 % 14.1 %
2017 Normal Cost Rates Employer Normal Cost 6.80 % 10.60 % 14.90 % 7.30 % Participant Normal Cost 6.80 % 6.80 % 6.80 % 6.80 % Total Normal Cost 13.60 % 17.40 % 21.70 % 14.10 %
Average Unfunded Liability Amortization 0.07 % 0.08 % 0.14 % 0.07 %
Average Total Rate 13.7 % 17.5 % 21.8 % 14.2 %
Protective Occupation
$ Millions
% 's of Active Member Payroll
General, Executives &
Elected Officials

Wisconsin Retirement System B-2
FINANCING $109.7 BILLION* OF BENEFIT PROMISES FOR PRESENT ACTIVE AND RETIRED PARTICIPANTS
DECEMBER 31, 2015
Present Assets -$91.5
Employer Normal Cost -
$9.7
Partic. Normal Cost - $8.5
UAAL Payments -$0.0
Sources of Funds
Present Retired -$52.9
Future retired based on service
already rendered -$39.8 Future retired
based on service yet to be
rendered - $17.0
Uses of Funds
* Present value of future benefits; all divisions combined.
Wisconsin Retirement System B-3
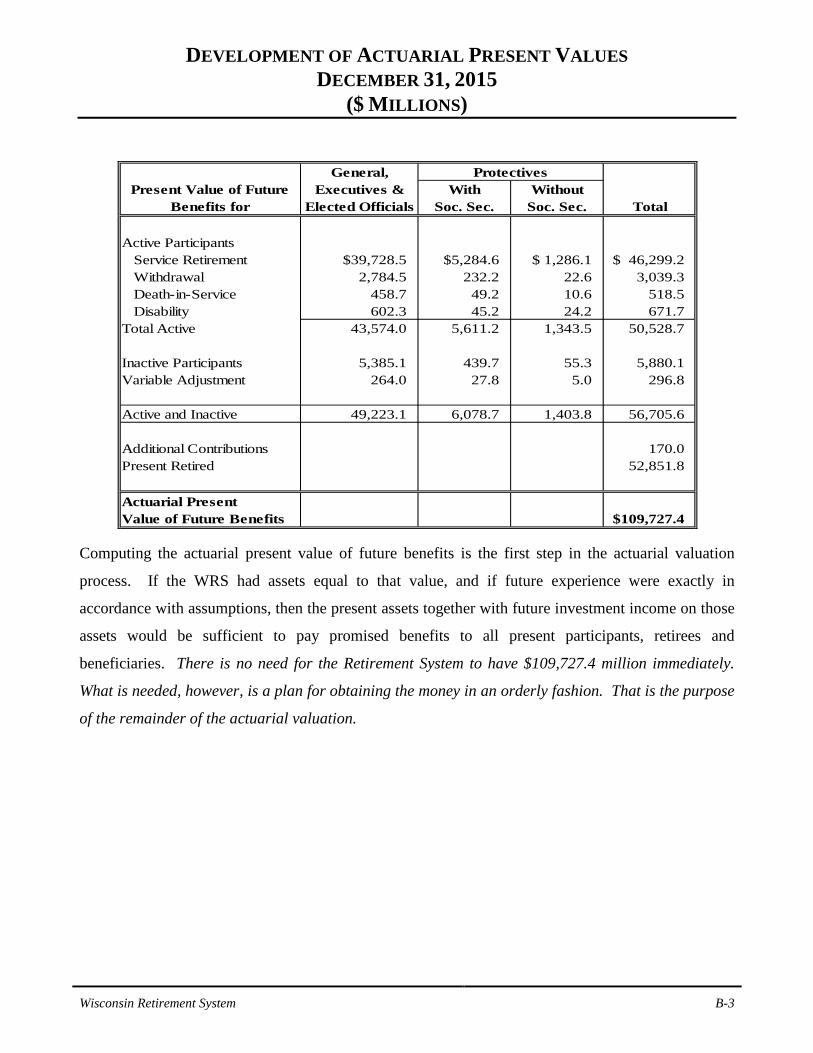
DEVELOPMENT OF ACTUARIAL PRESENT VALUES
DECEMBER 31, 2015 ($ MILLIONS)
General,Present Value of Future Executives & With Without
Benefits for Elected Officials Soc. Sec. Soc. Sec. Total
Active ParticipantsService Retirement $39,728.5 $5,284.6 $ 1,286.1 $ 46,299.2 Withdrawal 2,784.5 232.2 22.6 3,039.3 Death-in-Service 458.7 49.2 10.6 518.5 Disability 602.3 45.2 24.2 671.7
Total Active 43,574.0 5,611.2 1,343.5 50,528.7
Inactive Participants 5,385.1 439.7 55.3 5,880.1 Variable Adjustment 264.0 27.8 5.0 296.8
Active and Inactive 49,223.1 6,078.7 1,403.8 56,705.6
Additional Contributions 170.0 Present Retired 52,851.8
Actuarial PresentValue of Future Benefits $109,727.4
Protectives
Computing the actuarial present value of future benefits is the first step in the actuarial valuation
process. If the WRS had assets equal to that value, and if future experience were exactly in
accordance with assumptions, then the present assets together with future investment income on those
assets would be sufficient to pay promised benefits to all present participants, retirees and
beneficiaries. There is no need for the Retirement System to have $109,727.4 million immediately.
What is needed, however, is a plan for obtaining the money in an orderly fashion. That is the purpose
of the remainder of the actuarial valuation.

Wisconsin Retirement System B-4
EXPERIENCE AMORTIZATION RESERVE (EAR)
Actuarial gains or losses arising from the difference between actual and assumed experience are
reflected in the determination of the normal cost. The computed normal cost is made up of two parts:
(i) the pure Entry-Age Normal Cost (EANC) determined without regard to past gains or losses, and
(ii) an experience amortization component. Section 40.04(1) of the Wisconsin Statutes provides
authority to maintain accounts and reserves determined to be “useful in achieving the funds’
purposes...” A fundamental WRS objective is stable contribution rates. Accordingly, the experience
portion of the normal cost is separately calculated each year and the amortization period is varied
upward or downward in order to minimize short-term rate fluctuations. A positive EAR indicates
amortization of gains. A negative EAR indicates amortization of losses.
Development of EAR as of December 31, 2015
With WithoutSoc. Sec Soc. Sec. Total
1. Present Value of FutureBenefits for Non-Retired $49,223.1 $6,078.7 $1,403.8 $56,705.6
2. Present Value of FutureEntry Age Normal Costs 14,622.5 1,931.1 437.5 16,991.1
3. Entry Age AccruedLiability: (1)-(2) 34,600.6 4,147.6 966.3 39,714.5
4. Non-Retired Assets -WRS 33,625.7 3,957.5 935.9 38,519.1 -LTDI (29.3) (7.9) (1.3) (38.5) -Total 33,596.4 3,949.6 934.6 38,480.6
5. Entry Age UnfundedAccrued Liability: (3)-(4) 1,004.2 198.0 31.7 1,233.9
6. WRS Frozen UnfundedAccrued Liability 17.1 1.8 5.1 24.1
7. EAR: (6)-(5) $ (987.1) $ (196.2) $ (26.6) $ (1,209.8)
8. Prior Year EAR $ (410.7) $ (8.1) $ 16.9 $ (401.9)
Protective Occupation
$ Millions
General, Executives &
Elected Officials
LTDI reserves provided by Milliman

Wisconsin Retirement System B-5
UNFUNDED ACTUARIAL ACCRUED LIABILITY (UAAL)
DECEMBER 31, 2015
With WithoutSoc. Sec Soc. Sec Totals
Balance January 1, 2015 $24,063,894 $2,645,907 $ 5,040,054 $31,749,855
Plus: New Employers 0 0 0 0 Less: Adjustments 0 0 0 0 Less: Payments (8,070,797) (941,407) (281,587) (9,293,791) Plus: Interest 1,151,503 122,724 342,610 1,616,837
Balance December 31, 2015 $17,144,600 $1,827,224 $ 5,101,077 $24,072,901
Protective Occupation General, Executives &
Elected Officials
The UAAL is amortized as a level percent of payroll. A separate calculation is made for each affected employer.
Wisconsin Retirement System B-6
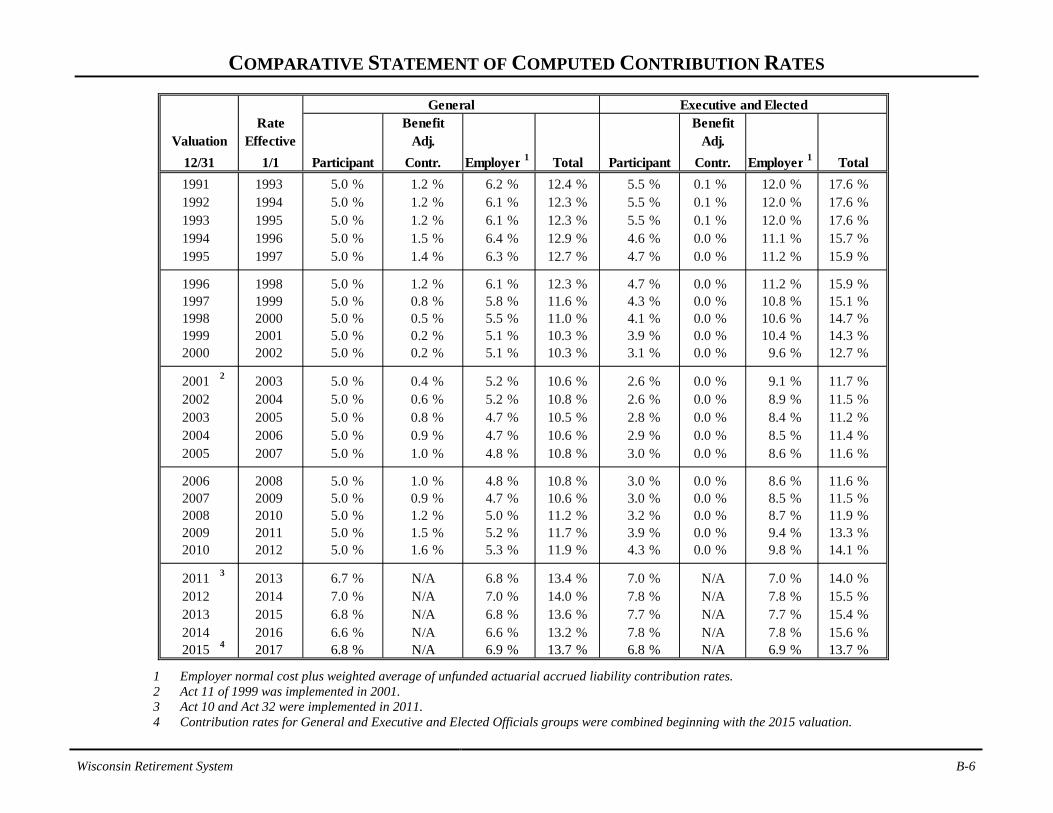
COMPARATIVE STATEMENT OF COMPUTED CONTRIBUTION RATES
Rate Benefit BenefitEffective Adj. Adj.
1/1 Participant Contr. Employer 1 Total Participant Contr. Employer*1 Total1991 1993 5.0 % 1.2 % 6.2 % 12.4 % 5.5 % 0.1 % 12.0 % 17.6 % 1992 1994 5.0 % 1.2 % 6.1 % 12.3 % 5.5 % 0.1 % 12.0 % 17.6 % 1993 1995 5.0 % 1.2 % 6.1 % 12.3 % 5.5 % 0.1 % 12.0 % 17.6 % 1994 1996 5.0 % 1.5 % 6.4 % 12.9 % 4.6 % 0.0 % 11.1 % 15.7 % 1995 1997 5.0 % 1.4 % 6.3 % 12.7 % 4.7 % 0.0 % 11.2 % 15.9 %
1996 1998 5.0 % 1.2 % 6.1 % 12.3 % 4.7 % 0.0 % 11.2 % 15.9 % 1997 1999 5.0 % 0.8 % 5.8 % 11.6 % 4.3 % 0.0 % 10.8 % 15.1 % 1998 2000 5.0 % 0.5 % 5.5 % 11.0 % 4.1 % 0.0 % 10.6 % 14.7 % 1999 2001 5.0 % 0.2 % 5.1 % 10.3 % 3.9 % 0.0 % 10.4 % 14.3 % 2000 2002 5.0 % 0.2 % 5.1 % 10.3 % 3.1 % 0.0 % 9.6 % 12.7 %
2001 2 2003 5.0 % 0.4 % 5.2 % 10.6 % 2.6 % 0.0 % 9.1 % 11.7 % 2002 2004 5.0 % 0.6 % 5.2 % 10.8 % 2.6 % 0.0 % 8.9 % 11.5 % 2003 2005 5.0 % 0.8 % 4.7 % 10.5 % 2.8 % 0.0 % 8.4 % 11.2 % 2004 2006 5.0 % 0.9 % 4.7 % 10.6 % 2.9 % 0.0 % 8.5 % 11.4 % 2005 2007 5.0 % 1.0 % 4.8 % 10.8 % 3.0 % 0.0 % 8.6 % 11.6 %
2006 2008 5.0 % 1.0 % 4.8 % 10.8 % 3.0 % 0.0 % 8.6 % 11.6 % 2007 2009 5.0 % 0.9 % 4.7 % 10.6 % 3.0 % 0.0 % 8.5 % 11.5 % 2008 2010 5.0 % 1.2 % 5.0 % 11.2 % 3.2 % 0.0 % 8.7 % 11.9 % 2009 2011 5.0 % 1.5 % 5.2 % 11.7 % 3.9 % 0.0 % 9.4 % 13.3 % 2010 2012 5.0 % 1.6 % 5.3 % 11.9 % 4.3 % 0.0 % 9.8 % 14.1 %
2011 3 2013 6.7 % N/A 6.8 % 13.4 % 7.0 % N/A 7.0 % 14.0 % 2012 2014 7.0 % N/A 7.0 % 14.0 % 7.8 % N/A 7.8 % 15.5 % 2013 2015 6.8 % N/A 6.8 % 13.6 % 7.7 % N/A 7.7 % 15.4 % 2014 2016 6.6 % N/A 6.6 % 13.2 % 7.8 % N/A 7.8 % 15.6 % 2015 4 2017 6.8 % N/A 6.9 % 13.7 % 6.8 % N/A 6.9 % 13.7 %
Executive and ElectedGeneral
Valuation12/31
1 Employer normal cost plus weighted average of unfunded actuarial accrued liability contribution rates. 2 Act 11 of 1999 was implemented in 2001. 3 Act 10 and Act 32 were implemented in 2011. 4 Contribution rates for General and Executive and Elected Officials groups were combined beginning with the 2015 valuation.

Wisconsin Retirement System B-7
COMPARATIVE STATEMENT OF COMPUTED CONTRIBUTION RATES
Rate Benefit BenefitEffective Adj. Adj.
1/1 Participant Contr. Employer 1 Total Participant Contr. Employer 1 Total
1991 1993 6.0 % 0.6 % 10.7 % 17.3 % 7.5 % 16.4 % 23.9 % 1992 1994 6.0 % 0.6 % 10.7 % 17.3 % 7.5 % 16.3 % 23.8 % 1993 1995 6.0 % 0.5 % 10.6 % 17.1 % 7.2 % 16.0 % 23.2 % 1994 1996 6.0 % 0.1 % 10.2 % 16.3 % 6.8 % 15.7 % 22.5 % 1995 1997 5.8 % 0.0 % 9.8 % 15.6 % 6.2 % 15.1 % 21.3 %
1996 1998 5.4 % 0.0 % 9.4 % 14.8 % 5.8 % 14.6 % 20.4 % 1997 1999 4.9 % 0.0 % 8.9 % 13.8 % 5.4 % 14.3 % 19.7 % 1998 2000 4.1 % 0.0 % 8.0 % 12.1 % 4.4 % 13.3 % 17.7 % 1999 2001 3.8 % 0.0 % 7.6 % 11.4 % 3.3 % 12.2 % 15.5 % 2000 2002 4.0 % 0.0 % 7.8 % 11.8 % 3.0 % 11.9 % 14.9 %
2001 2 2003 4.0 % 0.0 % 7.7 % 11.7 % 2.4 % 11.3 % 13.7 % 2002 2004 4.5 % 0.0 % 8.0 % 12.5 % 3.2 % 11.8 % 15.0 % 2003 2005 4.9 % 0.0 % 8.1 % 13.0 % 3.3 % 11.3 % 14.6 % 2004 2006 5.0 % 0.0 % 8.2 % 13.2 % 3.3 % 11.1 % 14.4 % 2005 2007 5.1 % 0.0 % 8.3 % 13.4 % 3.4 % 11.2 % 14.6 %
2006 2008 5.1 % 0.0 % 8.3 % 13.4 % 3.4 % 11.2 % 14.6 % 2007 2009 5.0 % 0.0 % 8.2 % 13.2 % 3.2 % 10.9 % 14.1 % 2008 2010 5.5 % 0.0 % 8.6 % 14.1 % 3.9 % 11.6 % 15.5 % 2009 2011 5.8 % 0.0 % 8.9 % 14.7 % 4.8 % 12.5 % 17.3 % 2010 2012 5.9 % 0.0 % 9.0 % 14.9 % 4.9 % 12.6 % 17.5 %
2011 3 2013 6.7 % N/A 9.8 % 16.4 % 6.7 % 12.7 % 19.3 % 2012 2014 7.0 % N/A 10.1 % 17.1 % 7.0 % 14.0 % 21.0 % 2013 2015 6.8 % N/A 9.5 % 16.3 % 6.8 % 13.4 % 20.2 % 2014 2016 6.6 % N/A 9.4 % 16.0 % 6.6 % 13.4 % 20.0 % 2015 2017 6.8 % N/A 10.7 % 17.5 % 6.8 % 15.0 % 21.8 %
Protective Without Social SecurityProtective With Social Security
Valuation12/31
1 Employer normal cost plus weighted average of unfunded actuarial accrued liability contribution rates. 2 Act 11 of 1999 was implemented in 2001. 3 Act 10 and Act 32 were implemented in 2011.

SECTION C F UN D AS S E T S

Wisconsin Retirement System C-1
DEVELOPMENT OF PARTICIPANT AND EMPLOYER RESERVES DURING THE YEAR
Participant Accumulation
Core Variable Total Core Variable Total Grand Total
Ending Balance December 31, 2014 $14,751,143,675 $1,492,195,247 $16,243,338,922 $20,505,128,808 $1,487,378,885 $21,992,507,693 $38,235,846,615 Closing Adjustments (684,516) 159,760 (524,756) 4,319,175 5,074,598 9,393,773 8,869,017
Beginning Balance January 1, 2015 14,750,459,159 1,492,355,007 16,242,814,166 20,509,447,983 1,492,453,483 22,001,901,466 38,244,715,632
Revenues: Employer Contributions - - - 878,992,051 99,948,629 978,940,680 978,940,680 Participant Contributions 826,408,591 100,677,365 927,085,957 - - - 927,085,957
Total Revenues 826,408,591 100,677,365 927,085,957 878,992,051 99,948,629 978,940,680 1,906,026,637
Expenses: Separations 34,886,749 2,517,901 37,404,650 - - - 37,404,650 Retirement Single Sums 21,382,252 707,968 22,090,220 23,981,127 661,372 24,642,499 46,732,719 Death Benefits 18,040,275 1,743,556 19,783,831 11,250,782 216,988 11,467,770 31,251,600 Disability Insurance - - - 43,296,474 - 43,296,474 43,296,474
74,309,276 4,969,425 79,278,701 78,528,383 878,360 79,406,743 158,685,443
Transfers: Earnings Allocation 875,534,577 1,614,903 877,149,480 1,271,296,276 - 1,271,296,276 2,148,445,756
Annuities Awarded (1,343,137,358) (86,396,969) (1,429,534,327) (2,095,287,416) (95,895,430) (2,191,182,846) (3,620,717,173) Intra-Fund Transfers (1,024,694) 12,135 (1,012,559) 256,400 39,130 295,530 (717,029) Inter-Fund Transfers 44,195,529 (44,195,529) - 36,569,966 (36,569,966) - -
(424,431,945) (128,965,461) (553,397,406) (787,164,774) (132,426,266) (919,591,040) (1,472,988,446)
Ending December 31, 2015 $15,078,126,529 $1,459,097,486 $16,537,224,016 $20,522,746,877 $1,459,097,486 $21,981,844,363 $38,519,068,379
Internal Rate of Return 6.0% 0.1% 5.5% 6.4% 0.0% 6.0% 5.8%
Employer Accumulation

Wisconsin Retirement System C-2
RESERVES FOR NON-RETIRED PARTICIPANTS BALANCES BY VALUATION GROUP
December 31, 2014Participant Employer Total * (Total in $ Millions)
General, Executives & Elected $14,962,633,678 $18,663,107,291 $33,625,740,969 $33,364.6
Protective with Soc. Sec. 1,307,584,571 2,649,892,478 3,957,477,049 3,928.7
Protective w/o Soc. Sec. 267,005,767 668,844,592 935,850,359 942.5
Total $16,537,224,016 $21,981,844,361 $38,519,068,377 $38,235.8
Reserve for Year EndedDecember 31, 2015
* Totals differ slightly from page C-1 due to rounding.
The above schedule shows the distribution of Participant and Employer reserves among the valuation
groups according to WRS accounting records. This separation of assets is needed because the
valuation groups are separately experience rated. The assets are pooled for investment purposes.

Wisconsin Retirement System C-3
CORE INVESTMENT TRUST: MARKET RECOGNITION ACCOUNT
For the Year Ended December 31
2013 2014 2015 2016 2017 2018 2019
a. Funding value $76,023,146,068 $81,635,165,224 $86,109,303,264 $88,673,713,483 $88,833,842,834 $88,200,703,697 $86,614,143,384b. Market value 78,474,591,615 86,355,982,436 88,649,071,976 85,270,319,670 85,270,319,670 85,270,319,670 85,270,319,670
c. Market value 86,355,982,436 88,649,071,976 85,270,319,670 d. Non-investment cash flow
(contributions minus benefits) (2,277,395,348) (2,288,570,809) (2,760,138,582)
e. Investment income e1. Total investment income 10,158,786,169 4,581,660,350 (618,613,725) e2. Assumed rate 7.2% 7.2% 7.2%e3. Amount for immediate recognition 5,391,680,284 5,795,343,347 6,100,504,846 - - - - e4. Amount for phased-in recognition: e1-e3 4,767,105,884 (1,213,682,997) (6,719,118,571) - - - -
f. Phased-in recognition of investment incomef1. Current year: 0.2 x e4 953,421,177 (242,736,599) (1,343,823,714) - - - - f2. First prior year 793,268,488 953,421,177 (242,736,599) (1,343,823,714) - - - f3. Second prior year (936,085,396) 793,268,488 953,421,177 (242,736,599) (1,343,823,714) - - f4. Third prior year 399,497,833 (936,085,396) 793,268,488 953,421,177 (242,736,599) (1,343,823,714) - f5. Fourth prior year 1,287,632,117 399,497,833 (936,085,396) 793,268,488 953,421,177 (242,736,599) (1,343,823,714)
f6. Total MRA recognition 2,497,734,219 967,365,503 (775,956,045) 160,129,351 (633,139,137) (1,586,560,314) (1,343,823,714) f7. Amount for MRA recognition - - - - - - -
f8. Total recognized gain (loss) 2,497,734,219 967,365,503 (775,956,045) 160,129,351 (633,139,137) (1,586,560,314) (1,343,823,714)
g. Total recognized investment income: e3 + f8 7,889,414,504 6,762,708,850 5,324,548,801 160,129,351 (633,139,137) (1,586,560,314) (1,343,823,714)
h. Funding value end of year: a + d + e3 + f8 81,635,165,224 86,109,303,264 88,673,713,483 88,833,842,834 88,200,703,697 86,614,143,384 85,270,319,670
i. Difference between market and funding values 4,720,817,212 2,539,768,712 (3,403,393,814) (3,563,523,165) (2,930,384,028) (1,343,823,714) -
j. Recognized rate of return 10.5% 8.4% 6.3%
k. Market rate of return 13.1% 5.4% (0.7)%
End of year
Beginning of year

SECTION D G AI N /L O S S

Wisconsin Retirement System D-1
ACTIVE MEMBER GAIN/LOSS ANALYSIS
Purpose of Gain/Loss Analysis. Regular actuarial valuations provide information about the
composite change in computed contribution rates and total liabilities -- whether or not the rates and
related liabilities are increasing or decreasing, and by how much. However, valuations do not show
the portion of the change attributable to each risk area within the Retirement System financial
mechanism: the rate of recognized investment income on plan assets; the rates of withdrawal of
active participants who leave covered employment; the rates of mortality; the rates of disability; the
rates of salary increases; and the assumed ages at actual retirement. In an actuarial valuation,
assumptions are made as to what these rates will be for the next year and for decades in the future.
The objective of a gain and loss analysis is to determine the portion of the change that is
attributable to each risk area.
The fact that actual experience differs from assumed experience should be expected. The future
cannot be predicted with complete precision. Further, year-to-year statistical fluctuations occur, even
in very large groups. This year's report reflects just a single year’s experience. Changes in the
valuation assumed experience for a risk area should be made only when the differences between
assumed and actual experience have been observed to be sizable and persistent. One year’s gain and
loss analysis may or may not be indicative of long-term trends, which are the basis of actuarial
assumptions. However, a persistent series of gains and losses can indicate a need for an assumption
change or a method change, even if on a demographic basis, the assumptions appear to model reality
well. In the Wisconsin Retirement System, longer term trends are reviewed in connection with the
regular 3-year investigation of experience (the most recent 3-year investigation covered the period
January 1, 2012 to December 31, 2014). It is the results of the 3-year investigation that lead to
recommendations for changes in the actuarial assumptions.
Overall Experience Overall experience resulted in a net actuarial loss of $175 million for the 2015 calendar year. The loss
was primarily attributable to unfavorable investment performance. The net result was an increase in
the overall 2017 contribution rate of 0.4% of payroll.

Wisconsin Retirement System D-2
POPULATION DEVELOPMENT DURING CALENDAR YEAR 2015
Executive General & Elected With S.S. Without S.S. Total Expected
Beginning Census 232,433 1,401 19,533 2,733 256,100
(-) Normal Retirement 3,495 54 534 86 4,169 4,123
(-) Early Retirement 3,768 18 97 7 3,890 4,241
(-) Death 116 2 7 1 126 253
(-) Disability Retirement -Total disabilities approved 113 0 12 2 127 195 -Less pending at beginning of year 24 0 5 0 29 -Net new from active status 89 0 7 2 98
(-) Other Separations 13,640 57 774 40 14,511 12,025
(-) Transfers Out 1,287 35 256 8 1,586
(+) Transfers In 1,273 57 220 36 1,586
(+) New Entrants 20,320 88 1,195 105 21,708
Ending Census 231,631 1,380 19,273 2,730 255,014
Protective
This schedule reconciles the active member populations reported in connection with the December 31,
2015 and the prior year valuations. Assumptions related to population development are a primary
focus of the gain/loss analysis. They generally tend to be more stable than economic assumptions,
and therefore, measurements have more meaning. Please note also that the table above represents
changes in actual and expected counts of members. Beginning with the 2009 valuations, some of the
actuarial assumptions (retirement, turnover, etc.) are based on liability weighted rates. Therefore,
comparing actual to expected number counts alone may not form the basis for our conclusions.
Transfers for the General group include transfer between subgroups (teachers, university, general employees, etc.)

Wisconsin Retirement System D-3
COMMENTS
Population Results Normal Retirements varied by group and gender. Overall normal retirements were slightly higher
than expected. In general, more normal retirements than assumed often creates a loss. However,
looking at counts alone is not always an accurate predictor of whether a gain or loss occurs. If there
are fewer retirements in shorter service, lower paid groups and more retirements than expected in
longer service, higher paid groups, there will be a net loss to the System even if the actual total counts
might be equal to or less than expected. In order to account for this, retirement rates are now
developed partially on a liability weighted methodology. The net result for this past year was a small
loss.
Early Retirements were lower than expected, overall producing a small loss.
Deaths among active participants were lower than expected. The net result for the past year was a
small loss.
Disabilities were less than expected and produced a gain. This means that the reserves needed for the
disability benefit were slightly smaller than the reserves that had been held for retirement benefits.
Other Separations varied by group, gender, and service but were overall higher than expected. The
net result for the past year was a small gain.
In total, the population risk areas (retirement, death, disability, and other separations) produced gains
and losses that almost entirely offset each other, producing a small net loss during 2015.
Economic Results On a market value basis investment return was (0.7)% and investment activity produced a loss for
all groups due to continuous recognition of past activity in the MRA. The recognized investment loss
of $538 million was partially offset by a $336 million loss in the combined value of variable excess
benefits and money purchase benefits (as shown on page D-10), resulting in a net investment loss of
about $202 million.
Pay Increases were overall less than expected, producing a gain.

Wisconsin Retirement System D-4
COMMENTS
Other Analysis The schedule on page D-8 analyzes gains or losses due to sources other than the demographic and
economic areas. The Reserve difference produced a loss of about $22 million. This is primarily
attributable to adjustments related to estimated annuities for which final computations have now been
made. The Re-established liability represents the liability for new or rehired active members who
were not active in the prior year. Typically, it is expected that a new hire will have very little liability.
However, often new members appear with more than one year of service or with liability greater than
contributions made on their behalf. Although this amount is difficult to determine accurately due to
the timing of contribution amounts, we estimate the Re-established liability loss at about $57 million.

Wisconsin Retirement System D-5
ACTUAL VS. EXPECTED CHANGES IN UNFUNDED ACTUARIAL ACCRUED LIABILITY (UAAL) - CALENDAR YEAR DECEMBER 31, 2015
($ MILLIONS)
Year EndedDecember 31, 2015
Executive ProtectiveGeneral & Elected With S.S. Without S.S. Total
(1) Entry Age UAAL at start of year 380.3 $ 54.5 $ 10.7 $ (11.9) $ 433.6 $
(2) Normal cost from last valuation (Total) 1,573.1 15.2 193.7 43.6 1,825.6
(3) Actual contributions 1,650.6 17.4 195.7 42.3 1,906.0
(4) Interest 24.6 3.8 0.7 (0.8) 28.3
(5) Expected UAAL before changes: (1) + (2) - (3) + (4) 327.4 56.1 9.4 (11.4) 381.5
(6) Change in actuarial assumptions 504.0 4.2 133.3 20.1 661.6
(7) Other changes 0.0 0.0 0.0 0.0 0.0
(8) Expected UAAL after changes: (5) + (6) + (7) 831.4 60.3 142.7 8.7 1,043.1
(9) Actual Entry Age UAAL at end of year 930.7 61.5 194.7 31.1 1,218.0
(10) Gain (loss): (8) - (9) (99.3) $ (1.2) $ (52.0) $ $ (22.4) $ (174.9)
The gain/loss analysis is intended to explain the financial effect of differences between actual and assumed experience in basic risk areas: Investment income, pay increases, retirement rates, turnover rates, etc. In order for the gain/loss analysis to proceed, the change in the Entry Age Unfunded Actuarial Accrued Liabilities from one year to the next is analyzed to remove the effect of expected changes. The table above develops this year's gain or loss (line 10) which is added to the Experience Amortization Reserve (EAR). When the EAR increases "unexpectedly," this is favorable experience and downward pressure is exerted on contribution rates. Similarly, an unexpected decrease in the EAR is unfavorable experience and upward pressure is exerted on contribution rates. In addition to the gain or loss described in line 10, non-recurring changes in lines 6 and 7 also may affect contribution rates. By measuring gains and losses each year and, to the extent possible, determining the "responsible" assumptions, insight is gained into how well the actuarial assumptions estimate WRS liabilities. Such information aids in understanding financial effects of emerging trends and is particularly useful during preparation of the WRS experience study.
Wisconsin Retirement System D-6
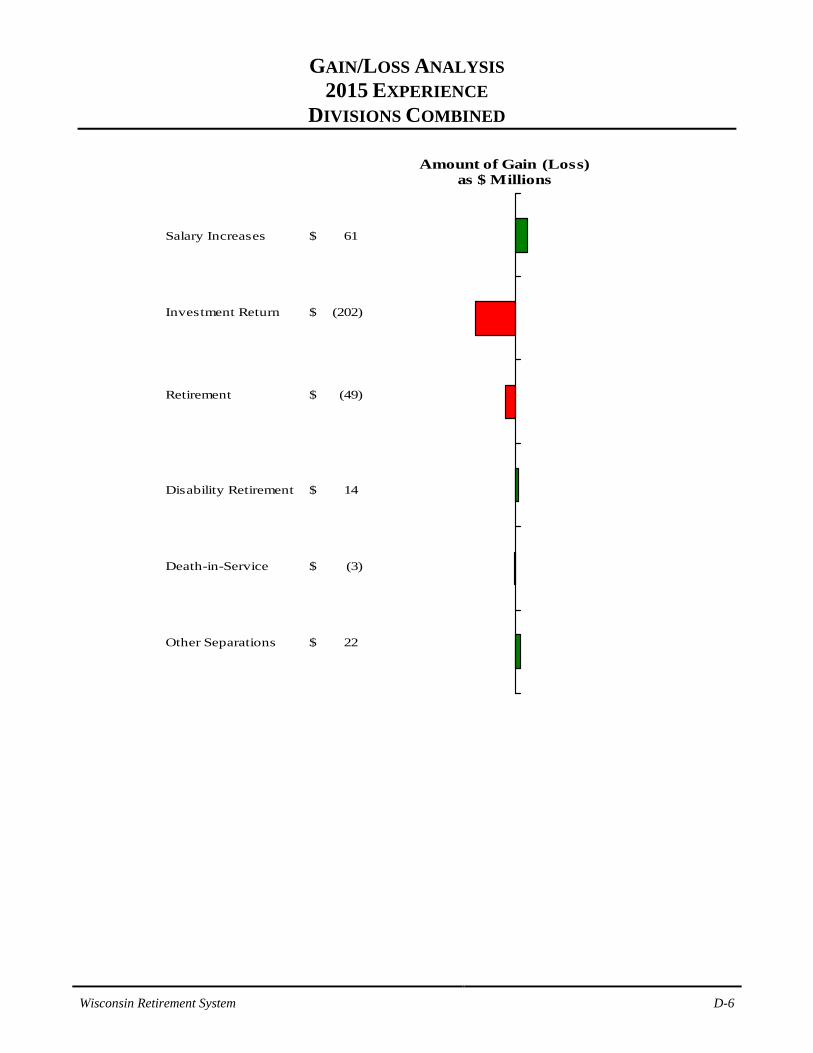
GAIN/LOSS ANALYSIS
2015 EXPERIENCE DIVISIONS COMBINED
Salary Increases 61$
Investment Return (202)$
Retirement (49)$
Disability Retirement 14$
Death-in-Service (3)$
Other Separations 22$
Amount of Gain (Loss) as $ Millions

Wisconsin Retirement System D-7
ACTUARIAL GAINS & LOSSES DURING CALENDAR YEAR 2015 ($ MILLIONS)
Executive
Type of Activity General & Elected With S.S. Without S.S. Total
Decrement Risk Areas
Normal Retirement $ (7.7) $ 2.2 $ (14.6) $ (1.9) $ (22.0)
Early Retirement (25.6) 0.0 (1.3) 0.1 (26.8)
Disability Retirement 13.5 0.1 0.6 0.2 14.4
Death with Benefit (3.0) 0.1 0.1 0.2 (2.6)
Other Separations 23.8 (1.3) 1.3 (1.6) 22.2
Economic Risk Areas
Salary Increases 74.5 2.8 (11.1) (5.5) 60.7 Investment Return (163.0) (0.7) (30.3) (7.8) (201.8)
Other Activity (11.8) (4.4) 3.3 (6.1) (19.0)
Total Gain (Loss) $ (99.3) $ (1.2) $ (52.0) $ (22.4) $(174.9) -% of Accrued Liability (0.3)% (0.5)% (1.3)% (2.4)% (0.5)%
Protective

Wisconsin Retirement System D-8
ANALYSIS OF OTHER ACTIVITY ($ MILLIONS)
General TotalExpected Reserve Transfers
Normal Retirement $1,664 $28 $ 299 $82 $2,073
Early Retirement 1,121 5 55 5 1,186
Death 19 0 2 0 21
Disability Retirement 35 0 4 2 41
Deferred Retirement 295 3 26 9 333
Expected Total Reserve Transfers 3,134 36 386 98 3,654
Actual Reserve Transfer 3,114 41 377 100 3,632 (From Retiree Report)
Reserve Difference 20 (5) 9 (2) 22
Expected Refunds 53 0 2 0 55
Actual Refunds 34 0 3 1 38
Refund Difference 19 0 (1) (1) 17
Re-established Liability (49) (1) (6) (1) (57)
Total Explained Difference (10) (6) 2 (4) (18)
Unknown Difference (2) 2 1 (2) (1)
Total Other Activity (12) (4) 3 (6) (19)
Other Activity as % of Liabilities (0.04)% (1.72)% 0.08 % (0.64)% (0.05)%
& ElectedProtective
With S.S. Without S.S.Executive
This schedule analyzes reserve transfers and contribution refunds and shows the portion of “other” activity that can be explained by those sources. Amounts may not sum due to rounding.

Wisconsin Retirement System D-9
COMPARATIVE SCHEDULE OF EXPERIENCE
5-YEAR HISTORY OF GAINS AND LOSSES ($ MILLIONS)
Disability Other Salary InvestmentYear Retmt. Retmt. Separations* Increases Return Other Total
2011 (126.8) $ 16.9 $ (2.0) $ 270.1 $ (1,247.5) $ (125.6) $ (1,214.9) $ 2012 (35.6) 15.2 20.7 610.0 (1,058.3) (82.8) (530.8) 2013 (32.2) 16.8 27.2 250.8 624.2 (125.0) 761.8 2014 (25.5) 18.1 24.5 14.5 269.0 (111.0) 189.6 2015 (33.3) 13.5 20.8 74.5 (163.0) (11.8) (99.3)
2011 (2.0) $ 0.1 $ 1.4 $ 5.2 $ (10.2) $ (7.2) $ (12.7) $ 2012 2.0 0.1 (1.9) 1.4 (13.0) 4.3 (7.1) 2013 (1.1) 0.1 - 1.6 2.1 (1.4) 1.3 2014 1.8 0.1 (0.7) (0.7) 2.1 (6.4) (3.8) 2015 2.2 0.1 (1.2) 2.8 (0.7) (4.4) (1.2)
2011 (21.7) $ 1.4 $ (3.5) $ 30.6 $ (183.5) $ (20.4) $ (197.1) $ 2012 (14.6) 1.5 (0.8) 100.8 (154.4) (10.0) (77.5) 2013 (8.6) 1.6 1.0 52.2 106.1 (7.5) 144.8 2014 (6.1) 1.5 0.3 13.0 42.6 (14.9) 36.4 2015 (15.9) 0.6 1.4 (11.1) (30.3) 3.3 (52.0)
2011 1.0 $ 0.6 $ (1.3) $ 7.9 $ (50.9) $ (5.9) $ (48.6) $ 2012 (0.6) 0.6 (1.3) 6.2 (40.3) (3.7) (39.1) 2013 (2.6) 0.6 (1.7) 3.6 31.5 (3.7) 27.7 2014 (0.3) 0.6 (0.7) (3.3) 11.8 (7.4) 0.7 2015 (1.8) 0.2 (1.4) (5.5) (7.8) (6.1) (22.4)
EXECUTIVE & ELECTED
GENERAL
PROTECTIVE WITH SOCIAL SECURITY
PROTECTIVE WITHOUT SOCIAL SECURITY
* Includes separation due to death.
Wisconsin Retirement System D-10
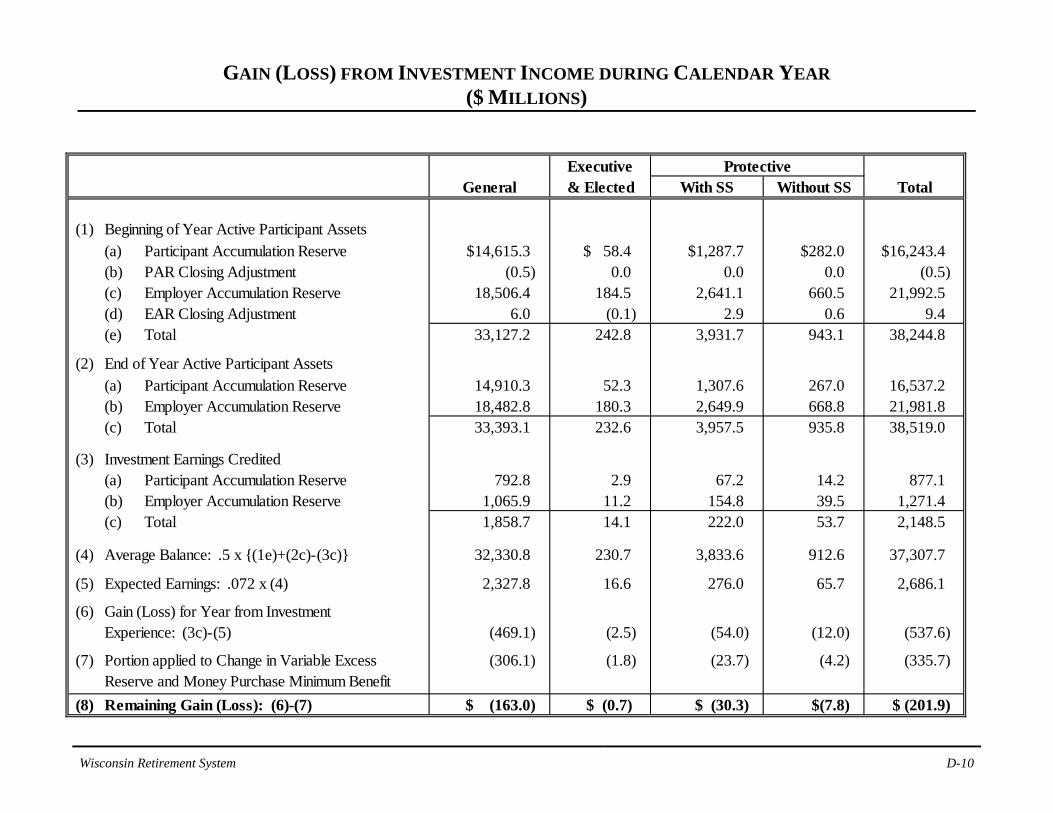
GAIN (LOSS) FROM INVESTMENT INCOME DURING CALENDAR YEAR ($ MILLIONS)
ExecutiveGeneral & Elected With SS Without SS Total
(1) Beginning of Year Active Participant Assets(a) Participant Accumulation Reserve $14,615.3 $ 58.4 $1,287.7 $282.0 $16,243.4 (b) PAR Closing Adjustment (0.5) 0.0 0.0 0.0 (0.5) (c) Employer Accumulation Reserve 18,506.4 184.5 2,641.1 660.5 21,992.5 (d) EAR Closing Adjustment 6.0 (0.1) 2.9 0.6 9.4 (e) Total 33,127.2 242.8 3,931.7 943.1 38,244.8
(2) End of Year Active Participant Assets(a) Participant Accumulation Reserve 14,910.3 52.3 1,307.6 267.0 16,537.2 (b) Employer Accumulation Reserve 18,482.8 180.3 2,649.9 668.8 21,981.8 (c) Total 33,393.1 232.6 3,957.5 935.8 38,519.0
(3) Investment Earnings Credited(a) Participant Accumulation Reserve 792.8 2.9 67.2 14.2 877.1 (b) Employer Accumulation Reserve 1,065.9 11.2 154.8 39.5 1,271.4 (c) Total 1,858.7 14.1 222.0 53.7 2,148.5
(4) Average Balance: .5 x {(1e)+(2c)-(3c)} 32,330.8 230.7 3,833.6 912.6 37,307.7
(5) Expected Earnings: .072 x (4) 2,327.8 16.6 276.0 65.7 2,686.1
(6) Gain (Loss) for Year from InvestmentExperience: (3c)-(5) (469.1) (2.5) (54.0) (12.0) (537.6)
(7) Portion applied to Change in Variable Excess (306.1) (1.8) (23.7) (4.2) (335.7) Reserve and Money Purchase Minimum Benefit
(8) Remaining Gain (Loss): (6)-(7) $ (163.0) $ (0.7) $ (30.3) $(7.8) $ (201.9)
Protective

SECTION E C E N S US D ATA

Wisconsin Retirement System E-1
ACTIVE PARTICIPANTS INCLUDED IN VALUATIONS
DECEMBER 31, 2015 Active participants included in the valuations totaled 255,014 with an annual payroll totaling
$13,273.1 million, as follows:
AnnualEarnings Years of
Valuation Group Number ($Millions) Earnings Age Service Contribs.
General 231,631 $11,785.7 $50,881 45.7 11.5 $53,670
Executive Group &Elected Officials 1,380 108.0 78,230 55.2 13.7 100,731
Protective Occupationwith Social Security 19,273 1,170.9 60,755 40.6 12.9 63,246
Protective Occupationwithout Social Security 2,730 208.5 76,376 41.1 14.2 77,683
Total Active Participants 255,014 $13,273.1 $52,048 45.3 11.7 $54,906
Prior Year 256,100 $13,037.4 $50,907 45.5 11.7 $53,731
Group Averages
Group averages are not used in the valuation, but are shown here for their general interest.
Wisconsin Retirement System E-2
INACTIVE PARTICIPANTS INCLUDED IN VALUATIONS
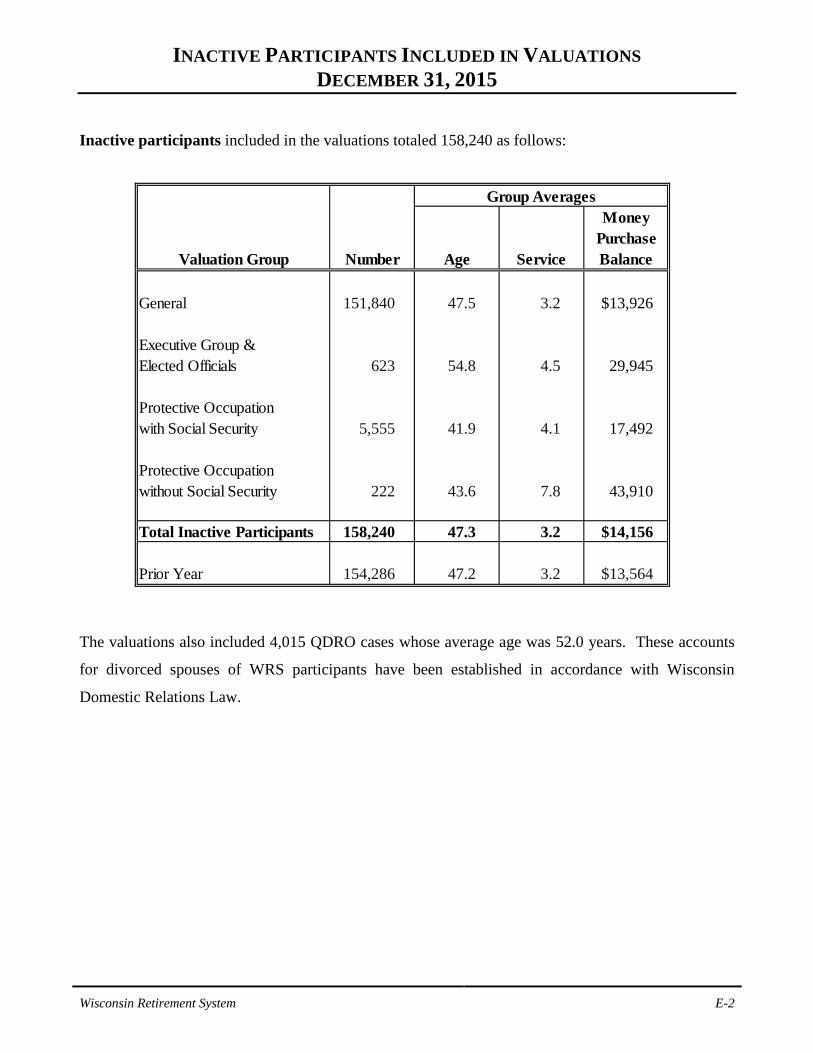
DECEMBER 31, 2015 Inactive participants included in the valuations totaled 158,240 as follows:
Money Purchase
Valuation Group Number Age Service Balance
General 151,840 47.5 3.2 $13,926
Executive Group &Elected Officials 623 54.8 4.5 29,945
Protective Occupationwith Social Security 5,555 41.9 4.1 17,492
Protective Occupationwithout Social Security 222 43.6 7.8 43,910
Total Inactive Participants 158,240 47.3 3.2 $14,156
Prior Year 154,286 47.2 3.2 $13,564
Group Averages
The valuations also included 4,015 QDRO cases whose average age was 52.0 years. These accounts
for divorced spouses of WRS participants have been established in accordance with Wisconsin
Domestic Relations Law.

Wisconsin Retirement System E-3
GENERAL PARTICIPANTS AS OF DECEMBER 31, 2015
BY ATTAINED AGE AND YEARS OF SERVICE
Attained ValuationAges 0-4 5-9 10-14 15-19 20-24 25-29 30 Plus No. Payroll
15-19 80 80 $ 1,631,52720-24 4,503 10 4,513 139,209,11425-29 17,446 1,612 14 19,072 749,545,10330-34 12,747 9,591 1,588 19 23,945 1,082,865,436
35-39 9,629 7,134 8,772 1,701 13 27,249 1,387,499,99840-44 7,854 5,214 5,788 7,779 1,008 17 27,660 1,505,364,61845-49 7,605 5,378 5,395 6,700 6,338 1,283 12 32,711 1,803,862,98750-54 6,512 5,368 5,502 5,905 5,285 5,576 1,257 35,405 1,922,311,181
55 1,210 1,037 1,153 1,255 955 1,147 879 7,636 409,704,37156 1,086 922 1,090 1,186 927 969 896 7,076 379,804,14657 950 943 1,070 1,137 866 987 929 6,882 373,853,33258 965 777 1,009 1,104 753 779 837 6,224 328,340,07759 855 794 892 1,006 789 720 808 5,864 306,255,617
60 771 615 805 853 659 606 746 5,055 263,817,28061 673 620 777 829 670 528 676 4,773 249,962,76062 613 519 573 725 557 471 581 4,039 212,134,03763 474 406 525 556 449 372 452 3,234 168,132,32964 413 370 424 468 357 298 373 2,703 140,097,743
65 347 296 275 347 274 207 315 2,061 104,863,66366 238 201 224 227 151 137 205 1,383 72,606,53467 196 146 122 144 89 86 123 906 45,407,86668 190 104 85 107 80 66 99 731 36,841,12469 167 91 93 82 65 50 89 637 31,084,300
70 110 46 46 47 29 29 57 364 17,006,44671 90 47 31 28 29 29 48 302 13,173,07172 89 37 29 22 14 12 32 235 9,474,18273 78 38 26 21 19 15 32 229 9,256,52674 58 27 18 15 8 4 15 145 4,843,312
75 & Up 216 105 36 43 26 27 64 517 16,747,008
Totals 76,165 42,448 36,362 32,306 20,410 14,415 9,525 231,631 $11,785,695,688
Years of Service to Valuation Date Totals

Wisconsin Retirement System E-4
EXECUTIVE GROUP AND ELECTED OFFICIALS
AS OF DECEMBER 31, 2015 BY ATTAINED AGE AND YEARS OF SERVICE
Attained ValuationAges 0-4 5-9 10-14 15-19 20-24 25-29 30 Plus No. Payroll
15-19 1 1 $ 27,27320-2425-29 14 3 17 915,61430-34 24 6 1 31 1,939,77235-39 20 16 15 4 55 3,651,88140-44 44 20 26 27 117 9,096,42045-49 57 28 30 25 22 4 1 167 12,726,96150-54 63 36 26 31 28 24 4 212 16,944,662
55 13 11 4 8 10 8 8 62 5,212,32756 15 2 8 8 3 12 9 57 4,779,20157 16 5 5 11 3 10 10 60 5,143,91558 15 7 6 11 6 6 11 62 5,132,97459 10 2 3 4 3 10 12 44 3,532,809
60 12 4 3 5 9 6 11 50 5,177,92561 10 9 3 3 3 4 10 42 2,892,52462 16 11 3 9 6 7 13 65 5,400,68063 8 5 4 3 9 5 3 37 3,618,07864 13 5 4 9 4 6 16 57 4,564,974
65 2 6 3 5 7 5 9 37 3,328,16066 6 7 3 5 1 6 2 30 2,434,73767 11 4 3 3 2 4 27 2,035,13168 7 8 4 2 1 2 5 29 2,468,29669 3 6 3 3 3 1 6 25 2,187,905
70 7 1 2 1 11 723,95871 5 3 1 1 2 12 963,67172 2 3 2 1 2 2 12 872,65673 5 4 3 2 1 1 16 756,29174 2 1 1 1 5 227,826
75 & Up 17 15 2 2 4 40 1,200,836
Totals 418 227 163 182 124 122 144 1,380 $107,957,457
Years of Service to Valuation Date Totals

Wisconsin Retirement System E-5
PROTECTIVE OCCUPATION PARTICIPANTS WITH SOCIAL SECURITY AS OF DECEMBER 31, 2015
BY ATTAINED AGE AND YEARS OF SERVICE
Attained ValuationAges 0-4 5-9 10-14 15-19 20-24 25-29 30 Plus No. Payroll
15-19 7 7 $ 201,37320-24 688 1 689 27,131,91325-29 1,895 427 9 2,331 115,933,92330-34 957 1,438 538 15 2,948 167,959,197
35-39 423 655 1,228 627 9 2,942 176,840,53040-44 233 321 661 1,445 404 6 3,070 198,393,50845-49 179 225 433 894 1,288 368 2 3,389 227,352,590
50 17 34 70 110 153 173 7 564 38,814,76251 19 27 72 78 123 181 13 513 35,736,73652 20 27 48 66 115 153 33 462 31,614,20053 28 24 51 63 87 131 55 439 30,321,03354 22 27 48 59 70 90 39 355 23,532,562
55 15 24 41 49 65 58 48 300 20,022,57356 13 10 33 36 47 43 43 225 15,185,04657 6 18 45 29 36 25 44 203 13,489,13058 8 19 34 27 26 21 27 162 10,226,74259 10 14 32 23 20 19 34 152 9,282,678
60 10 16 22 27 21 17 22 135 7,712,30261 11 8 26 17 20 12 26 120 7,129,34662 3 4 19 7 13 10 11 67 3,853,40263 9 4 13 11 8 5 9 59 3,056,08164 4 2 9 6 4 14 8 47 2,618,929
65 1 6 7 7 7 3 4 35 1,879,03866 3 2 3 3 2 13 599,26567 2 2 2 5 3 2 1 17 893,77568 3 1 2 1 7 255,71369 2 2 1 1 6 323,482
70 & Up 7 2 2 3 1 1 16 568,805
Totals 4,595 3,337 3,449 3,606 2,523 1,333 430 19,273 $1,170,928,634
Years of Service to Valuation Date Totals

Wisconsin Retirement System E-6
PROTECTIVE OCCUPATION PARTICIPANTS WITHOUT SOCIAL SECURITY
AS OF DECEMBER 31, 2015 BY ATTAINED AGE AND YEARS OF SERVICE
Attained ValuationAges 0-4 5-9 10-14 15-19 20-24 25-29 30 Plus No. Payroll
20-24 65 65 $ 3,126,13825-29 206 80 286 17,640,54530-34 142 195 59 1 397 27,018,227
35-39 47 143 176 82 448 32,798,73440-44 17 45 99 249 48 1 459 36,353,62745-49 7 16 65 172 163 61 484 40,015,548
50 1 3 5 27 32 26 2 96 8,257,02151 6 15 31 31 5 88 7,282,60252 2 5 6 28 41 10 92 7,805,37053 4 2 1 9 17 31 11 75 6,654,53154 1 3 12 13 29 12 70 6,425,134
55 1 1 4 13 14 15 48 4,263,65356 1 8 8 12 9 38 3,327,78657 1 1 2 3 8 9 3 27 2,395,66958 1 1 3 7 4 16 1,427,30159 3 1 3 2 2 11 988,830
60 1 2 1 4 370,13161 1 2 5 2 10 891,28362 1 1 6 3 2 13 1,191,39963 1 1 2 185,8366465 1 1 87,292
Totals 494 491 424 591 376 275 79 2,730 $208,506,657
Years of Service to Valuation Date Totals

Wisconsin Retirement System E-7
ACTIVE PARTICIPANTS
AS OF DECEMBER 31, 2015 BY YEARS OF SERVICE AND GENDER
Completed Yearsof Service Males Females Totals Total Average
0 6,675 13,570 20,245 $ 591,014,116 $29,193 1 6,769 12,247 19,016 710,991,147 37,389 2 5,882 10,662 16,544 672,597,595 40,655 3 5,296 8,730 14,026 598,455,066 42,668 4 4,267 7,574 11,841 524,951,958 44,333
5 3,379 6,282 9,661 438,304,301 45,368 6 2,878 5,775 8,653 401,582,443 46,410 7 3,431 6,355 9,786 478,631,009 48,910 8 3,468 6,108 9,576 487,390,183 50,897 9 3,144 5,683 8,827 457,187,757 51,794
10 2,788 5,412 8,200 430,660,466 52,520 11 2,796 5,085 7,881 427,707,560 54,271 12 2,593 4,838 7,431 405,877,529 54,620 13 2,822 5,189 8,011 455,537,272 56,864 14 3,519 5,356 8,875 516,650,860 58,214
15 & Up 36,599 49,842 86,441 5,675,549,173 65,658
Totals 96,306 158,708 255,014 $13,273,088,435 $52,048
Average Age 45.4 45.3 45.3 Service 12.4 11.2 11.7
Valuation Payroll

Wisconsin Retirement System E-8
COMPARATIVE STATEMENT OF ACTIVE PARTICIPANTS IN VALUATIONS
Valuation12/31 No. $ Millions Average % Incr. No. $ Millions Average % Incr.
1991 202,048 $ 5,357 $ 26,517 5.1% 1,496 56 37,535 6.7 % 1992 207,882 5,747 27,643 4.2% 1,463 58 39,598 5.5 % 1993 210,627 6,084 28,886 4.5% 1,452 60 41,476 4.7 % 1994 214,280 6,342 29,595 2.5% 1,450 63 43,528 4.9 % 1995 216,434 6,597 30,479 3.0% 1,475 67 45,135 3.7 %
1996 219,265 6,832 31,160 2.2% 1,459 67 45,967 1.8 % 1997 222,888 7,128 31,980 2.6% 1,455 71 48,881 6.3 % 1998 227,017 7,457 32,847 2.7% 1,450 73 50,664 3.6 % 1999* 229,657 7,704 34,445 4.9% 1,468 77 53,263 5.1 % 2000 234,076 8,335 35,610 3.4% 1,486 83 55,582 4.4 %
2001 238,944 8,746 36,605 2.8% 1,486 85 57,060 2.7 % 2002 240,990 9,007 37,377 2.1% 1,476 87 58,865 3.2 % 2003 239,696 9,273 38,686 3.5% 1,468 86 58,336 (0.9)% 2004 238,943 9,501 39,764 2.8% 1,469 89 60,379 3.5 % 2005 237,501 9,661 40,678 2.3% 1,452 90 61,788 2.3 %
2006 236,877 9,933 41,935 3.1% 1,436 93 64,480 4.4 % 2007 237,124 10,278 43,344 3.4% 1,427 95 66,320 2.9 % 2008** 238,994 10,806 45,216 4.3% 1,430 101 70,316 6.0 % 2009 240,401 11,098 46,165 2.1% 1,427 101 70,786 0.7 % 2010 239,959 11,195 46,655 1.1% 1,418 101 71,394 0.9 %
2011 232,518 10,947 47,080 0.9% 1,393 99 70,802 (0.8)% 2012 231,765 11,041 47,639 1.2% 1,408 104 73,968 4.5 % 2013 231,973 11,270 48,584 2.0% 1,397 106 76,125 2.9 % 2014 232,433 11,574 49,794 2.5% 1,401 109 77,998 2.5 % 2015 231,631 11,786 50,881 2.2% 1,380 108 78,230 0.3 %
GeneralEarnings Earnings
Executive and Elected
* After change in method of calculating average pay. ** Some groups had a 27 period payroll during 2008.

Wisconsin Retirement System E-9
COMPARATIVE STATEMENT OF ACTIVE PARTICIPANTS IN VALUATIONS
Valuation12/31 No. $ Millions Average % Incr. No. $ Millions Average % Incr.
1991 11,666 $ 357 $ 30,606 2.9% 2,585 92 35,650 5.5 % 1992 12,160 390 32,049 4.7% 2,622 100 38,007 6.6 % 1993 12,388 408 32,928 2.7% 2,611 103 39,371 3.6 % 1994 12,825 436 34,005 3.3% 2,612 106 40,633 3.2 % 1995 13,434 467 34,747 2.2% 2,630 112 42,478 4.5 %
1996 13,820 495 35,807 3.1% 2,625 116 44,063 3.7 % 1997 14,232 536 37,625 5.1% 2,654 121 45,568 3.4 % 1998 14,810 570 38,509 2.3% 2,658 127 47,733 4.8 % 1999* 16,483 649 39,864 3.5% 2,691 131 48,947 2.5 % 2000 16,970 717 42,263 6.0% 2,685 135 50,423 3.0 %
2001 17,981 772 42,914 1.5% 2,715 142 52,339 3.8 % 2002 18,325 804 43,871 2.2% 2,709 148 54,603 4.3 % 2003 18,660 856 45,891 4.6% 2,714 154 56,673 3.8 % 2004 18,964 896 47,266 3.0% 2,709 159 58,546 3.3 % 2005 19,036 920 48,330 2.3% 2,689 162 60,241 2.9 %
2006 19,297 977 50,622 4.7% 2,692 167 62,153 3.2 % 2007 19,757 1,036 52,419 3.5% 2,695 174 64,449 3.7 %
2008** 20,038 1,099 54,859 4.7% 2,724 181 66,502 3.2 % 2009 20,205 1,124 55,636 1.4% 2,733 189 69,149 4.0 % 2010 20,019 1,125 56,184 1.0% 2,754 189 68,559 (0.9)%
2011 19,610 1,119 57,065 1.6% 2,711 189 69,898 2.0 % 2012 19,353 1,105 57,104 0.1% 2,727 193 70,949 1.5 % 2013 19,290 1,121 58,127 1.8% 2,736 197 71,960 1.4 % 2014 19,533 1,151 58,916 1.4% 2,733 204 74,487 3.5 % 2015 19,273 1,171 60,755 3.1% 2,730 209 76,376 2.5 %
Earnings EarningsProtective with Social Security Protective without Social Security
* After change in method of calculating average pay. ** Some groups had a 27 period payroll during 2008.

SECTION F F I N AN C I AL R E P O R TI N G GASB 67 and 68 Information is provided in a separate report.

Wisconsin Retirement System F-1
SUMMARY OF ACTUARIAL ASSUMPTIONS AND METHODS
Valuation Date December 31, 2015
Actuarial Cost Method Frozen Entry Age
Amortization Method Level Percent -- Closed Period
Amortization Period 30-Year closed from date of participation in WRS
Asset Valuation Method 5-Year Smoothed Market (Closed)
Actuarial AssumptionsNet Investment Rate of Return 5.5% Weighted based on assumed rate for: Retired participants 5.0% Post-retirement active participants 5.0% Pre-retirement active participants 7.2%Projected Salary Increases* 3.3% to 8.8% Payroll Growth Rate 3.2%Population Growth Rate 0.0%
* Includes merit and seniority increases that vary by service plus wage inflation of 3.2%/year.
Wisconsin Retirement System F-2
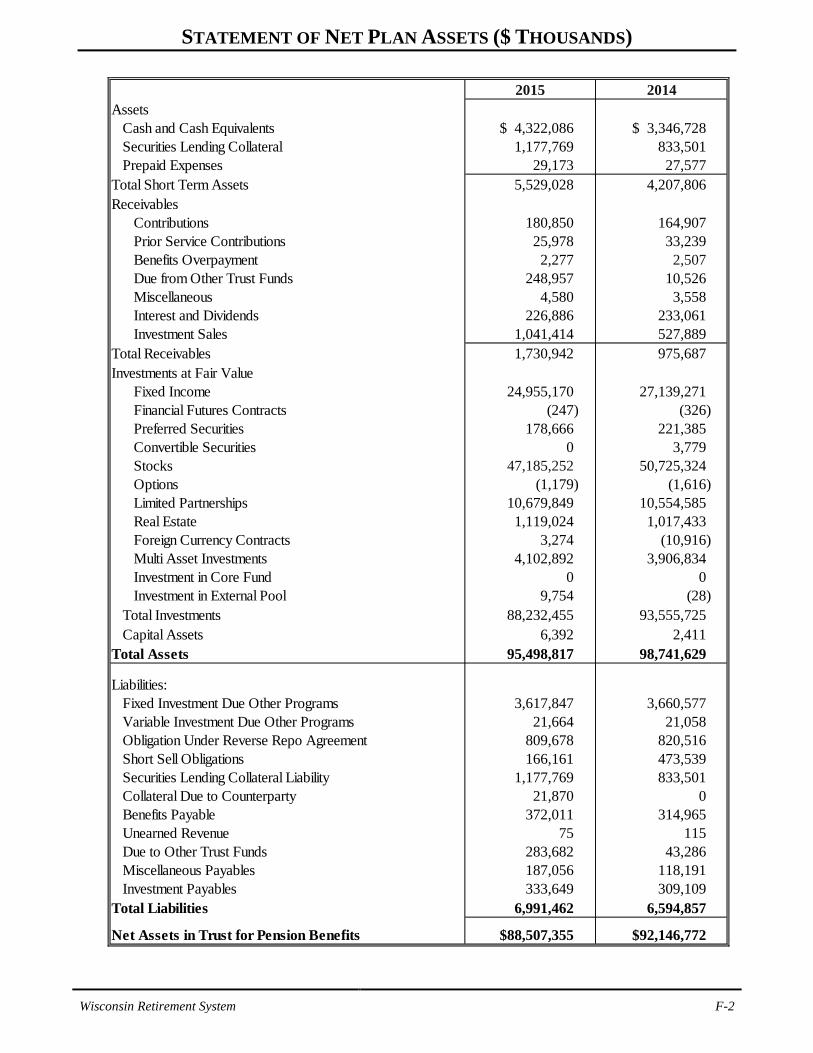
STATEMENT OF NET PLAN ASSETS ($ THOUSANDS)
2015 2014Assets
Cash and Cash Equivalents $ 4,322,086 $ 3,346,728 Securities Lending Collateral 1,177,769 833,501 Prepaid Expenses 29,173 27,577
Total Short Term Assets 5,529,028 4,207,806 Receivables
Contributions 180,850 164,907 Prior Service Contributions 25,978 33,239 Benefits Overpayment 2,277 2,507 Due from Other Trust Funds 248,957 10,526 Miscellaneous 4,580 3,558 Interest and Dividends 226,886 233,061 Investment Sales 1,041,414 527,889
Total Receivables 1,730,942 975,687 Investments at Fair Value
Fixed Income 24,955,170 27,139,271 Financial Futures Contracts (247) (326) Preferred Securities 178,666 221,385 Convertible Securities 0 3,779 Stocks 47,185,252 50,725,324 Options (1,179) (1,616) Limited Partnerships 10,679,849 10,554,585 Real Estate 1,119,024 1,017,433 Foreign Currency Contracts 3,274 (10,916) Multi Asset Investments 4,102,892 3,906,834 Investment in Core Fund 0 0 Investment in External Pool 9,754 (28)
Total Investments 88,232,455 93,555,725 Capital Assets 6,392 2,411
Total Assets 95,498,817 98,741,629
Liabilities:Fixed Investment Due Other Programs 3,617,847 3,660,577 Variable Investment Due Other Programs 21,664 21,058 Obligation Under Reverse Repo Agreement 809,678 820,516 Short Sell Obligations 166,161 473,539 Securities Lending Collateral Liability 1,177,769 833,501 Collateral Due to Counterparty 21,870 0 Benefits Payable 372,011 314,965 Unearned Revenue 75 115 Due to Other Trust Funds 283,682 43,286 Miscellaneous Payables 187,056 118,191 Investment Payables 333,649 309,109
Total Liabilities 6,991,462 6,594,857
Net Assets in Trust for Pension Benefits $88,507,355 $92,146,772

Wisconsin Retirement System F-3
STATEMENT OF CHANGES IN ASSETS ($ THOUSANDS)
2015 2014Additions: Contributions: Employer Contributions $ 977,734 $ 987,793 Employee Contributions 937,225 941,903 Total Contributions 1,914,959 1,929,696 Investment Income: Net Appreciation (Depreciation) in Fair Value of Investments (2,328,202) 3,167,373 Interest 550,054 665,878 Dividends 1,206,311 1,354,765 Securities Lending Income 35,068 28,453 Other 188,537 221,680
Less Current Income Distributed 26,710 (190,690) SWIB Investment Expense (350,036) (356,811) Investment Income Distributed to Securities Lending Rebates and Fees (2,867) (2,407) Net Investment Income (674,425) 4,888,241 Interest on Prior Service Receivable 1,617 2,133 Miscellaneous Income 17 642 Total Additions 1,242,168 6,820,712 Deductions: Benefits and Refunds: Retirement, Disability, and Beneficiary 4,780,079 4,497,945 Separation Benefits 37,642 34,401 Total Benefits and Refunds 4,817,721 4,532,346 ETF Administrative Expenses 20,567 24,037 Other Expenses 43,296 42,303 Total Deductions 4,881,584 4,598,686 Net Increase (Decrease) (3,639,416) 2,222,026 Net Assets Held in Trust: Beginning of Year $92,146,772 $89,924,747 End of Year $88,507,355 $92,146,772
Activity During Year

Wisconsin Retirement System F-4
SCHEDULE OF FUNDING PROGRESS & ACCRUED LIABILITIES $ MILLIONS
Actuarial Actuarial Accrued Unfunded UAAL as a
Valuation Value Liability (AAL) AAL Covered Percent of Date of Assets Frozen Entry Age (UAAL) F-I-L Entry Payroll Covered Payroll
Dec. 31 (a) (b) (b) - (a) (a)/(b) Age (c) [(b) - (a)] / (c)
2003* $ 62,685.3 $ 63,211.7 $ 526.4 99.2 % $ 10,502.4 5.0 % 2004 66,209.4 66,622.3 412.9 99.4 % 10,897.6 3.8 % 2005 68,615.1 68,987.5 372.5 99.5 % 10,973.4 3.4 % 2006 73,415.3 73,735.8 320.5 99.6 % 11,308.2 2.8 % 2007 79,791.9 80,079.7 287.8 99.6 % 11,720.2 2.5 % 2008 77,159.4 77,412.0 252.6 99.7 % 12,289.6 2.1 % 2009 78,911.3 79,104.6 193.3 99.8 % 12,622.2 1.5 % 2010 80,626.9 80,758.8 131.9 99.8 % 12,744.0 1.0 % 2011 78,940.0 79,039.3 99.3 99.9 % 12,855.6 0.8 % 2012 78,613.0 78,682.7 69.7 99.9 % 12,627.6 0.6 % 2013 85,276.1 85,328.7 52.6 99.9 % 12,884.8 0.4 % 2014 89,360.4 89,392.1 31.7 100.0 % 99.5 % 13,219.5 0.2 % 2015 91,502.4 91,526.5 24.1 100.0 % 98.7 % 13,530.5 0.2 %
FundedRatio
* Affected by prepayment of UAAL in connection with Pension Obligation Bond issued by the state and various local
government employers.

SOLVENCY TEST ($MILLIONS)
Valuation Annuitants Active & Annuitants Active & Date Valuation and Member Inactive and Participant Inactive
Dec. 31 Assets Beneficiaries Contribs. Members Total Beneficiaries Contributions Members Total 2002 $57,861.9 $26,041.7 $14,022.9 $19,554.2 $59,618.8 100.0% 100.0% 91.0% 97.1%2003 62,685.3 28,707.8 14,503.1 20,000.8 63,211.7 100.0% 100.0% 97.4% 99.2%2004 66,209.4 30,829.9 15,050.3 20,742.1 66,622.3 100.0% 100.0% 98.0% 99.4%2005 68,615.1 32,668.0 15,155.3 21,164.2 68,987.5 100.0% 100.0% 98.2% 99.5%2006 73,415.3 35,774.7 15,902.4 22,058.7 73,735.8 100.0% 100.0% 98.5% 99.6%2007 79,791.9 39,675.1 16,795.4 23,609.2 80,079.7 100.0% 100.0% 98.8% 99.6%2008 77,159.4 38,372.6 16,045.3 22,994.1 77,412.0 100.0% 100.0% 98.9% 99.7%2009 78,911.3 39,734.2 16,156.6 23,213.8 79,104.6 100.0% 100.0% 99.2% 99.8%2010 80,626.9 41,139.0 16,253.6 23,366.2 80,758.8 100.0% 100.0% 99.4% 99.8%2011 78,940.0 43,609.4 14,434.4 20,995.5 79,039.3 100.0% 100.0% 99.5% 99.9%2012 78,613.0 44,055.5 14,401.1 20,226.1 78,682.7 100.0% 100.0% 99.7% 99.9%2013 85,276.1 48,460.5 15,559.2 21,309.0 85,328.7 100.0% 100.0% 99.8% 99.9%2014 89,360.4 51,131.1 16,259.3 22,001.7 89,392.1 100.0% 100.0% 99.9% 100.0%2015 91,502.4 52,851.8 16,707.2 21,967.5 91,526.5 100.0% 100.0% 99.9% 100.0%
F-I-L Accrued Liability for Percent Funded for
CONTRIBUTIONS REQUIRED AND CONTRIBUTIONS MADE
Year AnnualEnded Required Percent
December 31 Contribution Contributed *
2002 $426.9 99.8% 2003 462.7 334.0% 2004 497.6 121.0% 2005 535.6 108.0% 2006 569.0 104.0% 2007 614.0 105.0% 2008 644.8 105.0% 2009 699.3 108.0% 2010 686.7 108.0% 2011 784.1 104.0% 2012 826.1 100.0% 2013 912.4 100.0% 2014 977.1 100.0% 2015 966.5 100.0%
* Includes additional UAAL payments when amount is greater than 100%.
Employers did not make the full actuarially required contribution for 2000 through 2002. In lieu of
the full contribution, employers were allowed to recognize a credit due to a distribution from the TAA
in accordance with the provisions of Act 11 of 1999. 2003 percent contributed includes pension
obligation proceeds.
SECTION G M E T H OD S AN D AS S UM P T I O N S

Wisconsin Retirement System G-1
ACTUARIAL VALUATION METHOD The actuarial funding method prescribed in the statute for WRS is the Frozen Entry Age Method.
Under this method, the amount of remaining unfunded actuarial accrued liabilities at any valuation
date is affected only by the monthly amortization payments, compound interest, the added liability
created by new employer units, and any added liabilities caused by changes in benefit provisions.
Actuarial gains or losses arising from the difference between actual and assumed experience are
reflected in the determination of the normal cost. In this manner, experience gains or losses in any
year are amortized (spread) over the average future working lifetime of the active participant group - a
period of approximately 20 years. Hence, the computed normal cost is made up of two parts:
• The pure entry-age normal cost (EANC) determined without regard to past gains or losses,
and
• an experience amortization component.
Section 40.04(1) of the Wisconsin Statutes provides authority to maintain accounts and reserves
determined to be “useful in achieving the funds’ purposes - - -”. A fundamental WRS objective is
stable contribution rates. Accordingly, based on the authority granted under Section 40.04, the
experience portion of the normal cost is separately calculated each year and the amortization period is
varied upward or downward in order to minimize short-term rate fluctuations. The policy regarding
the EAR amortization period is described below:
• The standard period is set 20 years.
• The standard period is reconsidered as part of each triennial experience study (no changes were made with the most recent experience study).
• Temporary interim changes in the period are made only when there are large, but mostly offsetting market gains and losses known to be flowing through the MRA that would otherwise result in contribution rate volatility. Large changes would be defined as those which, over a 2-year period, were expected to result in contribution rate changes of at least 0.4% of payroll.
• The minimum and maximum EAR amortization periods are 10 years and 30 years respectively.
• The amortization policy will be applied in the same manner to market gains and losses flowing through the MRA.
• For 2015, a 20-year period was used.

Wisconsin Retirement System G-2
ASSET VALUATION METHOD
An essential step in the valuation process is comparing valuation assets with computed liabilities. Computed liabilities result from actuarial calculations involving the covered population, the benefits, and actuarial assumptions. Valuation assets are those assets that are recognized and available to fund the System’s liabilities. WRS assets are invested in the Core Investment Trust, and in the Variable Investment Trust, both of which are managed by the State of Wisconsin Investment Board (SWIB). Assets in the Variable Investment Trust are marked to market each year. Assets in the Core Investment Trust (most of the assets) are valued (or recognized) using an “asset valuation method.” Asset valuation methods are distinguished by the timing of the recognition of investment return. Total investment return is the sum of ordinary income and capital value changes. Under a book value approach, ordinary income is recognized immediately and capital gains (or losses) are recognized only when securities are sold. Book value investment return is directly affected by the timing of sales activity and underlying experience may be distorted. Under a pure market value approach, ordinary investment income and all capital value changes are recognized immediately. Because of market volatility, use of pure market values in retirement funding can result in volatile contribution rates and unstable financial ratios, contrary to WRS objectives. The asset valuation method used for WRS valuations is statutory, and is referred to as the “Market Recognition Account” or MRA. Act 11 of 1999 closed the former Transaction Amortization Account (TAA) and created the Market Recognition Account (MRA). The MRA recognizes assumed returns fully each year. Differences between actual and assumed returns are phased in over a closed 5-year period. The objective is to give recognition to long-term changes in asset values while minimizing the effect of short-term fluctuations in the capital markets. In accordance with its smoothing objective, the MRA will tend to exceed the market value when the markets are doing poorly, and will fall short of the market value when markets are doing well. Some retirement systems set limits on the amount by which the recognized value of assets can differ from the market value.

Wisconsin Retirement System G-3
SUMMARY OF ASSUMPTIONS USED FOR ANNUAL ACTUARIAL VALUATIONS
ASSUMPTIONS ADOPTED BY ETF BOARD AFTER CONSULTING WITH ACTUARY
ECONOMIC ASSUMPTIONS
For determining plan liabilities, the discount rate is 5.0% for retired participants, 5.0% for active and inactive participants following retirement, and 7.2% for active participants prior to their retirement. A valuation performed assuming a 5.5% discount rate for all participants at all stages of life, reproduces the results of an actuarial valuation using the 5.0% post-retirement and 7.2% pre-retirement assumptions. Thus, it can be said that the net discount rate assumed in the valuations was 5.5% per year, compounded annually (net after administrative expenses). The Wage Inflation Rate assumed in this valuation was 3.2% per year. The wage inflation rate is defined to be the portion of total pay increases for an individual that are due to macro economic forces including productivity, price inflation, and labor market conditions. The wage inflation rate does not include pay changes rated to individual merit and seniority effects. No specific Price Inflation assumption is required to perform this valuation. The price inflation assumption used to evaluate the investment return assumption is 2.7%. The assumed Real Rate of Return over wage inflation is defined to be the portion of total investment return that is more than the assumed total wage growth rate. Considering other economic assumptions, the 7.2% pre-retirement investment return rate translates to an assumed real rate of return over wage inflation of 4.0%. The assumed real rate of return over price inflation is 4.5% considering an inflation assumption of 2.7%. Pay increase assumptions for individual active members are shown for sample services below. Part of the assumption for each age is for merit and/or seniority increase, and the other 3.2% recognizes wage inflation, including price inflation, productivity increases, and other macro economic forces.
University Public School Exec. &Service Gen. Teachers Teachers With S.S. W/O S.S. Elec.
1 3.5 % 3.0 % 5.6 % 4.8 % 5.5 % 2.5 % 2 3.5 % 3.0 % 5.6 % 4.8 % 5.5 % 2.5 % 3 3.1 % 2.9 % 5.2 % 4.1 % 4.7 % 2.0 % 4 2.8 % 2.8 % 4.7 % 3.5 % 3.8 % 1.6 % 5 2.5 % 2.7 % 4.3 % 2.8 % 3.0 % 1.1 %
10 1.5 % 2.2 % 2.6 % 1.1 % 0.9 % 0.2 % 15 1.1 % 1.7 % 1.4 % 0.8 % 0.5 % 0.2 % 20 0.9 % 1.2 % 0.6 % 0.7 % 0.4 % 0.2 % 25 0.6 % 0.9 % 0.3 % 0.6 % 0.3 % 0.2 % 30 0.4 % 0.7 % 0.2 % 0.5 % 0.2 % 0.2 %
Protective% Merit and Longevity Increase Next Year

Wisconsin Retirement System G-4
DECREMENT PROBABILITIES
The Active Member Population is assumed to remain constant. For purposes of financing the unfunded liabilities and amortizing the EAR, total payroll is assumed to grow at the wage inflation rate – 3.20% per year.
The mortality table used to measure mortality for retired participants was the Wisconsin 2012 Mortality Table. The rates in this table were based on actual WRS experience adjusted for future mortality improvements using the MP-2015 fully generational improvement scale (multiplied by 50%). This mortality assumption was adopted by the Board in connection with the 2012-2014 Experience Study. Sample retirement values from this table are shown below. This assumption is used to measure the probabilities of participants dying before retirement and the probabilities of each benefit payment being made after retirement.
Single Life Retirement Values Wisconsin 2012 Mortality Table with 5% Interest
SampleAttained
Ages in 2015 Males Females
40 44.6 47.8 45 39.6 42.8 50 34.6 37.8 55 29.8 32.9
60 25.2 28.1 65 20.8 23.5 70 16.6 19.0 75 12.7 14.8
80 9.3 11.0 85 6.5 7.7
179.86
$212.10 203.48 192.71
Future LifeExpectancy (years)Monthly for Life
Present Value of $1
Males Females
95.73 72.64
165.48 148.22 128.60
$217.24 209.77 200.54 189.35
84.12 62.91
176.01 159.83 140.64 118.97 106.86
The values shown above are for non-disabled participants in 2015. For disabled participants, the following table was used:
SampleAttained
Ages in 2015 Males Females
40 37.1 41.4 45 32.2 36.4 50 27.4 31.5 55 22.9 26.8
60 18.6 22.2 65 14.6 17.8 70 10.9 13.7 75 7.8 10.0
80 5.4 7.0 85 3.6 4.8
$207.38 197.56 185.67 171.51
53.57 37.90
154.59 134.77 112.57
89.09 72.99
66.61 48.58
117.55 95.28
156.72
138.06
$198.57 186.57 172.73
Future LifeExpectancy (years)Monthly for Life
Present Value of $1
Males Females

Wisconsin Retirement System G-5
ACTIVE PARTICIPANT MORTALITY RATES
SampleAttained Ages in 2015
20253035
40455055
6065707580
Mortality RatesMales
0.000138
Females
0.000079
0.0043540.004555
0.001221
0.000466
0.001755
0.000690
0.0082570.0122420.022508
0.007198
0.015445
0.0001650.0002060.000359
0.0004850.0006420.0008660.002011
0.002854
0.0000880.0001180.000210
0.000298
0.002683
This assumption is used to measure the probability of participants dying while in service.

Wisconsin Retirement System G-6
RATES OF RETIREMENT FOR THOSE ELIGIBLE TO RETIRE Normal Retirement
Exec. &Age Male Female Male Female Male Female With S.S. W/O S.S. Elected50 6% 4% 51 7% 4% 52 9% 5% 53 23% 17% 54 19% 25% 55 19% 21% 56 19% 27% 57 18% 15% 36% 28% 12% 14% 19% 30% 12% 58 18% 15% 31% 28% 12% 12% 18% 30% 12% 59 18% 15% 24% 28% 12% 10% 16% 30% 12% 60 18% 15% 30% 28% 12% 12% 20% 26% 12% 61 18% 15% 28% 28% 12% 16% 20% 15% 12% 62 25% 25% 37% 36% 12% 14% 22% 20% 12% 63 30% 25% 32% 30% 12% 19% 26% 40% 12% 64 25% 25% 27% 27% 12% 13% 17% 40% 12% 65 25% 28% 29% 35% 15% 18% 30% 40% 12% 66 32% 32% 33% 35% 17% 22% 25% 40% 20% 67 26% 26% 27% 30% 16% 17% 30% 40% 15% 68 19% 22% 24% 30% 16% 16% 30% 40% 15% 69 19% 20% 24% 30% 16% 14% 30% 40% 10% 70 19% 20% 20% 35% 16% 18% 100% 100% 10% 71 19% 20% 20% 30% 18% 18% 100% 100% 10% 72 19% 20% 20% 22% 14% 18% 100% 100% 15% 73 19% 20% 20% 22% 14% 18% 100% 100% 15% 74 19% 20% 20% 22% 10% 18% 100% 100% 15% 75 100% 100% 100% 100% 100% 100% 100% 100% 100%
General Public School University Protective*
* Includes reduced retirements for protective with 20+ years of service. .
Reduced Retirement
Exec. &Age Male Female Male Female Male Female Elected55 9.0% 7.0% 13.0% 12.0% 4.0% 5.5% 3.0% 56 9.0% 7.0% 13.0% 12.0% 3.0% 5.5% 3.0% 57 4.8% 5.0% 12.0% 12.0% 2.5% 4.0% 3.0% 58 5.8% 6.0% 13.0% 12.0% 2.5% 5.5% 3.0% 59 6.5% 6.0% 14.0% 13.0% 3.0% 6.5% 3.0%
60 8.5% 8.5% 14.0% 17.0% 4.3% 8.0% 5.0% 61 8.5% 8.5% 15.0% 17.0% 5.0% 6.0% 5.0% 62 16.0% 16.0% 21.0% 23.0% 6.0% 12.0% 63 17.0% 16.0% 21.0% 23.0% 7.0% 12.0% 64 17.0% 16.0% 21.0% 23.0% 7.0% 12.0%
UniversityPublic SchoolGeneral% Retiring Next Year

Wisconsin Retirement System G-7
The assumed rates of separation from employment prior to service retirement due to disability and other causes are shown below for sample ages. For other terminations it was assumed that a percentage, depending on age of participants terminating after age 35 with 5 or more years service, will leave their contributions on deposit and be paid a benefit at normal retirement age and that the remaining participants would take a separation benefit. The percentage taking a separation benefit is 25% at age 35, grading downward to 0% at retirement eligibility. All participants terminating prior to normal retirement age with less than 5 years of service were assumed to take a separation benefit.
Assumed Termination Rates by Attained Age and Years of Service
With WithoutSoc. Soc. Exec. &
Age Service Sec. Sec. Males Females Elected Males0 17.0% 4.0% 18.3% 16.0% 18.0% 16.8% 1 8.0% 3.5% 11.0% 15.0% 14.0% 12.7% 2 5.0% 1.5% 7.8% 13.0% 12.0% 9.0% 3 4.3% 1.3% 5.9% 10.0% 10.0% 7.3% 4 3.8% 1.2% 4.9% 9.9% 10.0% 7.0% 5 3.1% 1.1% 3.6% 8.4% 8.0% 4.8% 6 3.0% 1.0% 3.2% 6.4% 7.0% 4.3% 7 2.9% 0.9% 2.6% 5.7% 6.0% 4.2% 8 2.5% 0.8% 2.6% 4.7% 6.0% 3.4% 9 2.2% 0.7% 2.4% 4.2% 6.0% 3.1%
25 10 & Over 2.0% 0.7% 1.3% 5.0% 6.0% 2.5% 30 1.8% 0.7% 1.3% 4.6% 5.1% 2.5% 35 1.6% 0.7% 1.3% 4.2% 4.3% 2.4% 40 1.3% 0.6% 1.3% 3.4% 4.1% 2.1% 45 1.1% 0.6% 1.3% 2.6% 3.2% 1.8% 50 1.0% 0.5% 1.3% 2.1% 2.5% 1.5% 55 1.0% 0.5% 1.3% 2.0% 2.4% 1.5% 60 1.0% 0.5% 1.3% 2.0% 2.4% 1.5%
% of Active Participants Terminating
4.5% 4.3% 3.5%
16.0% 14.1% 11.0% 8.9%
1.6%
General
20.0% FemalesMalesFemales
5.8%
2.3% 1.9% 1.8% 1.8% 1.8%
2.2% 1.9% 1.8%
1.0%
10.0% 8.5%
4.0% 3.9%
8.0%
5.7%
4.0%
3.6%
1.0% 1.0% 1.1% 1.3%
5.0%
7.7%
1.9% 2.2%
Protective
4.3%
3.4%
2.5%
Public Schools
10.8%
2.8%
3.8%
University
3.1%
16.0% 14.0% 12.0%
4.5%
5.0% 4.6% 4.7%
6.7% 7.5% 5.6%
2.7%
8.5%
Disability Rates
Age202530354045505560
0.09%
0.00% 0.00%
0.02% 0.03% 0.03% 0.06%
Males
0.04% 0.04%
0.01% 0.01% 0.01% 0.00%
0.00%
Males
0.14%
0.02% 0.05% 0.10%
0.21%
0.01% 0.01%
ProtectiveW/O SS0.04% 0.01%
With SS Females
0.03% 0.06% 0.87% 0.48%
0.14%
0.04% 0.06% 0.11% 0.64%
0.23%
General
0.13% 0.24% 0.43%
Females0.01% 0.01%
0.01% 0.03%
0.09% 0.16%
0.06%
0.02% 0.03% 0.04% 0.06%
Males0.01% 0.01% 0.01%
% of Active Participants Becoming Disabled
0.02% 0.02% 0.09% 0.09%
0.01% 0.01% 0.01% 0.01%
0.00%
University
0.02% 0.05%
Females
0.00% 0.01% 0.01% 0.02% 0.02%
Public SchoolsMales
0.00% 0.00% 0.00%
0.11% 0.11%
Exec. & Elected
0.00% 0.01% 0.01%
Females0.00% 0.00%
0.26%
0.01% 0.03% 0.08% 0.16%
0.01% 0.01% 0.01% 0.01%
0.13% 0.07% 1.46%
0.00% 0.01%

Wisconsin Retirement System G-8
MISCELLANEOUS AND TECHNICAL ASSUMPTIONS
Expenses: Assumed investment return is net of administrative and investment expenses.
Marriage Assumption: 80% of males and 70% of females are assumed to be married for purposes of death-in-service benefits. Male spouses are assumed to be three years older than female spouses.
Pay Increase Timing: Beginning of (calendar) year for most people. Middle of calendar year for teachers.
Pay Annualization: Reported pay for members with less than twelve contributing months was annualized by the ratio of 12 to the number of contributing months in the year.
Final Average Salary: For present value of future benefit purposes, final average salary was calculated in accordance with pay increase assumptions, but was not permitted to fall below the final average salary reported in the data.
Decrement Timing: Decrements of all types are assumed to occur mid-year.
Decrement Operation: Disability operates during the retirement pattern.
Decrement Relativity: Decrement rates are used directly from the experience study, without adjustment for multiple decrement table effects.
Eligibility Testing: Eligibility for benefits is determined based upon the age nearest birthday and total service (in all benefit groups) nearest whole year on the date the decrement is assumed to occur.
Benefit Service: Exact fractional service on the decrement date is used to determine the amount of benefit payable.
Non-Benefit Service: Liabilities for service in divisions other than the division in which the individual is currently active are calculated as indexed deferred vested benefits. Benefits are indexed in accordance with the salary adjustment factors for the division where the member was formerly employed. People are assumed to retire at the earliest age that full benefits will become available. The liabilities are assigned to the division in which the service was rendered.
Service Credit Accruals: It is assumed that members accrue one year of service credit per year.
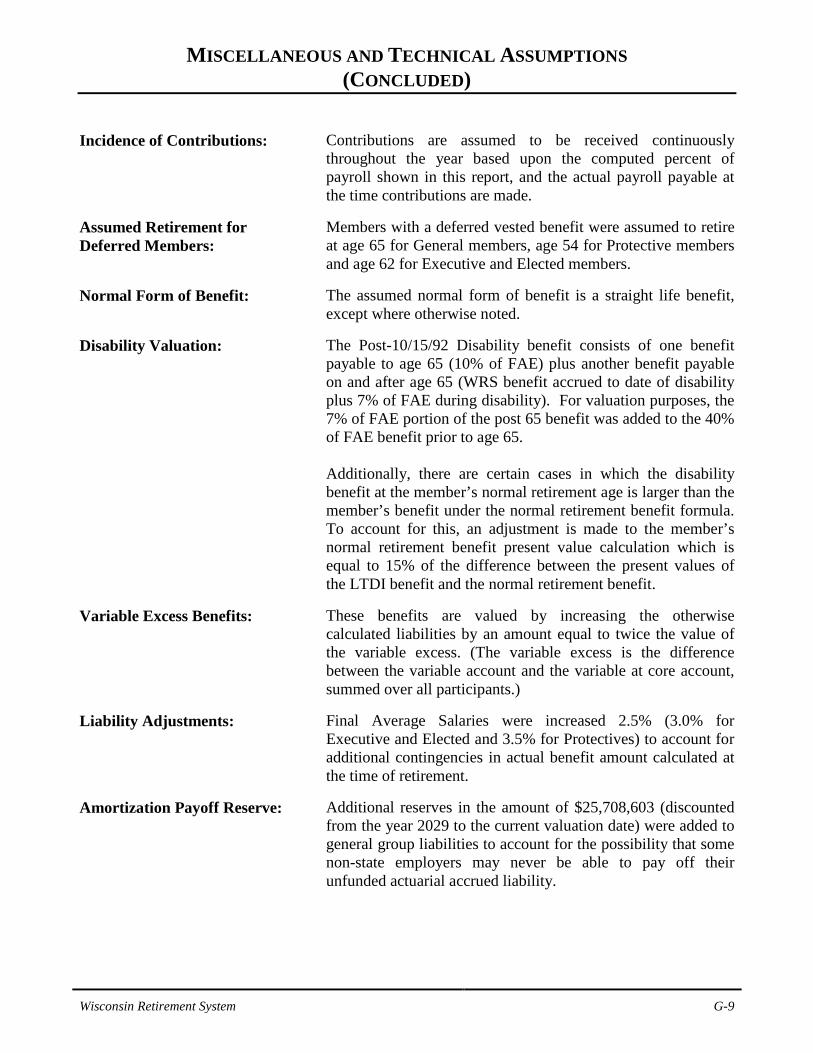
Wisconsin Retirement System G-9
MISCELLANEOUS AND TECHNICAL ASSUMPTIONS
(CONCLUDED) Incidence of Contributions: Contributions are assumed to be received continuously
throughout the year based upon the computed percent of payroll shown in this report, and the actual payroll payable at the time contributions are made.
Assumed Retirement for Deferred Members:
Members with a deferred vested benefit were assumed to retire at age 65 for General members, age 54 for Protective members and age 62 for Executive and Elected members.
Normal Form of Benefit: The assumed normal form of benefit is a straight life benefit, except where otherwise noted.
Disability Valuation: The Post-10/15/92 Disability benefit consists of one benefit payable to age 65 (10% of FAE) plus another benefit payable on and after age 65 (WRS benefit accrued to date of disability plus 7% of FAE during disability). For valuation purposes, the 7% of FAE portion of the post 65 benefit was added to the 40% of FAE benefit prior to age 65. Additionally, there are certain cases in which the disability benefit at the member’s normal retirement age is larger than the member’s benefit under the normal retirement benefit formula. To account for this, an adjustment is made to the member’s normal retirement benefit present value calculation which is equal to 15% of the difference between the present values of the LTDI benefit and the normal retirement benefit.
Variable Excess Benefits: These benefits are valued by increasing the otherwise calculated liabilities by an amount equal to twice the value of the variable excess. (The variable excess is the difference between the variable account and the variable at core account, summed over all participants.)
Liability Adjustments: Final Average Salaries were increased 2.5% (3.0% for Executive and Elected and 3.5% for Protectives) to account for additional contingencies in actual benefit amount calculated at the time of retirement.
Amortization Payoff Reserve: Additional reserves in the amount of $25,708,603 (discounted from the year 2029 to the current valuation date) were added to general group liabilities to account for the possibility that some non-state employers may never be able to pay off their unfunded actuarial accrued liability.

SECTION H P L AN P R O VIS I O N S

Wisconsin Retirement System H-1
SUMMARY OF BENEFIT PROVISIONS EVALUATED
DECEMBER 31, 2015 ACTUARIAL VALUATION Normal Retirement Eligibility The age a participant becomes eligible for an unreduced age and service annuity is:
General Protective Executive & Elected
Age Service Age Service Age Service
65 Any* 54 Any* 62 Any* 57 30 53 25 57 30
* Participants first employed after 1989 and terminated before April 24, 1998 must have
creditable service in 5 calendar years. Normal Retirement Annuity The age and service annuity payable at Normal Retirement Age is based on Final Average Earnings
(FAE) and Creditable Service (CS) as follows:
Multiplier for Service Rendered
Before 2000
Between 2000 and 2011
After 2011
Group
2.165% 2.0% 1.6% Executive group and elected officials
2.165% 2.0% 2.0% Protective occupation participants covered by Social Security
2.665% 2.5% 2.5% Protective occupation participants not covered by Social Security
1.765% 1.6% 1.6% All other participants FAE is generally the average of the 3 highest years of earnings (July 1 - June 30 for teachers,
educational support staff, and judges; calendar year for others) preceding retirement. These years do
not have to be consecutive. For legislators and state constitutional officers who are ineligible to
receive pay increases during their term, FAE is the statutory rate of earnings at termination.
Maximum formula annuity is 85% of FAE for protective occupation participants not covered by
Social Security, 65% of FAE for protectives covered by Social Security, and 70% for all other
participants. If greater than the formula amount, an annuity equal to the actuarial equivalent of two
times the required accumulated contributions is paid in lieu of the formula amount.

Wisconsin Retirement System H-2
Reduced Retirement. Any participant who has attained age 55 and any Protective occupation participant who has attained age 50 may apply for an early retirement annuity. The benefit is reduced 0.4% for each month that the annuity effective date precedes the Normal Retirement Age. For Non-Protective participants terminating after 6/30/90, the 0.4% is reduced for months after the attainment of age 57 and before the annuity effective date by .001111% for each month of creditable service.
Voluntary Termination Before Immediate Benefit Eligibility. Participant may either (i) receive a refund of accumulated contributions, or (ii) leave contributions on deposit and apply for a retirement annuity on or after the minimum retirement age based upon age and accrued service at time of termination.
Post-Retirement Adjustments. Annuities are increased annually if the investment income credited to retired life funds is in excess of the assumed benefit rate (presently 5%), other plan experiences are within projected ranges, and the resulting adjustment would be at least 0.5% (2.0% for the variable fund).
Disability Annuity. Eligibility: generally total and permanent incapacity to engage in gainful employment. Participant must have completed at least 6 months of creditable service (in at least 5 out of the last 7 calendar years) preceding application for disability. Service requirement is waived if disability is from service-related causes. For Protective occupations, eligibility also can be met if a member has 15 years of service, is between the ages of 50 and 55 and unable to safely and efficiently perform one’s duties.
Disability Amounts. Amounts payable in case of disability depend upon the plan from which payment is made and are described below.
Pre-10/16/1992 WRS Plan Post-10/15/1992 LTDI Plan
Participants covered Participants hired before 10/16/1992 who do not elect LTDI coverage.
Participants entering after 10/15/1992 and
participants on 10/15/1992 who elect LTDI coverage.
Benefit to age 65* WRS formula benefit based on service 40% of FAE for participants covered by projected to normal retirement age. Social Security; 50% of FAE for non- covered participants who cannot qualify for Social Security disability benefits.
Benefit at age 65* Continuation of pre-65 amount. WRS benefit accrued to date of disability plus 7% of FAE money purchase benefit during disability period, both of which are adjusted in accordance with dividend rate. * Conversion age is later for participants becoming disabled after age 61.

Wisconsin Retirement System H-3
Death-in-Service.
(a) Prior to age 50 for Protective participants, age 55 for others, the benefit is the
equivalent of twice the accumulated employee contributions required and all additional
contributions and employer amounts contributed prior to 1974 for teachers, or 1966 for
others.
(b) After age 50 for Protective participants, age 55 for others, the benefit is the amount that
would have been paid if participant had retired and elected 100% survivor option.
Benefit is payable to any natural living person.
Interest Credits. For years after 1999, and for people with some active service after 1999,
participant core accounts (including the variable at core accounts) are credited with interest at the full
(core) effective rate. For others, accounts are credited with interest as follows:
Rate Credited for Purpose of Money Purchase
Date of Participation Minimum Refunds
Prior to 1982 Actual Actual January 1, 1982 & Later 5% 3%
Participant variable accounts are credited with interest based on the earnings in the variable portfolio.
Contribution Rates. The financial objective of WRS is to establish and receive contributions that
will remain level from year to year and decade to decade.
Statutory required participant contributions prior to July 1, 2011 were as follows:
General 5.0% Executives & Elected
Officials 5.5 Protectives
- With Social Security 6.0 - Without Social Security 8.0
Statutory required participant contributions after July 1, 2011 are set equal to one-half of the
actuarially determined rate for General participants and Executive and Elected Officials. Participant
contributions for Protective participants are set equal to the participant contribution for General
members.

Wisconsin Retirement System H-4
Normal Form of Benefit. The normal form of benefit is a straight life annuity with no death
benefits. Optional forms of benefit which are actuarially reduced are listed below:
• A life annuity with 60 or 180 monthly payments guaranteed.
• A joint survivorship annuity with 75% continued to beneficiary.
• A joint survivorship annuity with 100% continued to beneficiary.
• A joint survivorship annuity reduced 25% upon either your death or your beneficiary’s
death.
• A joint survivorship annuity with 100% continued to beneficiary combined with 180
monthly payments guaranteed.
For formula benefit calculations, optional forms are calculated at the lower of the current age or age
62 (Normal Retirement Age for Protective occupations).
Vesting. Participants hired prior to July 1, 2011 vest immediately. After July 1, 2011, participants
vest after 5 years of service.
APPENDIX 1 G L O S S ARY
Wisconsin Retirement System Appendix 1-1
GLOSSARY
Actuarial Accrued Liability. The difference between (i) the actuarial present value of future plan benefits, and (ii) the actuarial present value of future normal cost. Sometimes referred to as “accrued liability” or “past service liability.” Accrued Service. The service credited under the plan which was rendered before the date of the actuarial valuation. Actuarial Assumptions. Estimates of future plan experience with respect to rates of mortality, disability, turnover, retirement, rate or rates of investment income and salary increases. Decrement assumptions (rates of mortality, disability, turnover and retirement) are generally based on past experience, often modified for projected changes in conditions. Economic assumptions (salary increases and investment income) consist of an underlying rate in an inflation-free environment plus a provision for a long-term average rate of inflation. Actuarial Cost Method. A mathematical budgeting procedure for allocating the dollar amount of the “actuarial present value of future plan benefits” between the actuarial present value of future normal cost and the actuarial accrued liability. Sometimes referred to as the “actuarial funding method.” Actuarial Equivalent. A series of payments is called an actuarial equivalent of another series of payments if the two series have the same actuarial present value. Actuarial Present Value. The amount of funds presently required to provide a payment or series of payments in the future. It is determined by discounting the future payments at a predetermined rate of interest, taking into account the probability of payment. Amortization. Paying off an interest-bearing liability by means of periodic payments of interest and principal, as opposed to paying it off with a lump sum payment. Experience Gain (Loss). A measure of the difference between actual experience and that expected based upon a set of actuarial assumptions during the period between two actuarial valuation dates, in accordance with the actuarial cost method being used.

Wisconsin Retirement System Appendix 1-2
GLOSSARY
(CONCLUDED) Normal Cost. The annual cost assumed, under the actuarial funding method, for current and subsequent plan years. Sometimes referred to as “current service cost.” Any payment toward the unfunded actuarial accrued liability is not part of the normal cost. Plan Termination Liability. The actuarial present value of future plan benefits based on the assumption that there will be no future accruals for future service and salary. The termination liability will generally be less than the liabilities computed on a “going-concern” basis and is not normally determined in a routine actuarial valuation. Reserve Account. An account used to indicate that funds have been set aside for a specific purpose and are not generally available for other uses. Unfunded Actuarial Accrued Liability. The difference between the actuarial accrued liability and valuation assets. Sometimes referred to as “unfunded accrued liability.” Valuation Assets. The value of current plan assets recognized for valuation purposes. Generally based on book value plus a portion of unrealized appreciation or depreciation.

APPENDIX 2 VAL UAT I O N P R O C E S S

Wisconsin Retirement System Appendix 2-1
FINANCIAL PRINCIPLES & OPERATIONAL TECHNIQUES OF THE WISCONSIN RETIREMENT SYSTEM
Benefit Promises Made Which Must be Paid For. A retirement program is an orderly means of
handing out, keeping track of, and financing contingent retirement promises. As each participant of
the Retirement System acquires a unit of service credit he is, in effect, handed an “IOU” which reads:
“The Wisconsin Retirement System promises to pay you one unit of annuity benefits, payments in
cash commencing when you retire.”
The principal related financial question is: When shall the money required to cover the “IOU” be
contributed? This year, when the benefit of the participant’s unit of service is received? Or, some
future year, when the “IOU” becomes a cash demand?
The law governing the Wisconsin Retirement System financing intends that the money to cover an
“IOU” is contributed in the year the “IOU” is handed out. In this way contribution rates expressed
as percents of participant payroll can be determined so as to remain approximately level from year to
year and decade to decade as long as the basic experience and make-up of the group of participants
does not change significantly. This means that for equivalent benefits each generation of Wisconsin
taxpayers will contribute at approximately the same payroll rates.
Translated into actuarial terminology, the level percent-of-payroll contribution objective means that
the contribution rate must total at least:
Normal Cost (the current discounted value of benefits likely to be paid on account of
participants’ service rendered in the current year)
… plus …
Interest on Unfunded Actuarial Accrued Liabilities (unfunded actuarial accrued
liabilities are the difference between (i) the present value of future benefits and (ii) the
present value of future normal costs, and reduced by the assets on hand at the valuation
date).

Wisconsin Retirement System Appendix 2-2
If contributions to the system are less than the preceding amount, the difference, plus investment
earnings not realized thereon, will have to be contributed at some later time, or benefits will have to
be reduced, to satisfy the fundamental equation under which all retirement programs must operate;
that is:
B = C + I – E
Benefit payments to any group of participants and their beneficiaries cannot exceed
Contributions received on behalf of the group … plus …
Investment earnings on those contributions … minus …
Expenses incurred in operating the program. There are retirement programs (Social Security is an example) designed to defer the bulk of
contributions far into the future. The present contribution rate for such systems is artificially low, but
is destined to increase relentlessly to a level which may be greatly in excess of the level percent-of-
payroll rate.
A by-product of a level percent-of-payroll contribution objective is the accumulation of invested
assets for varying periods of time. Investment income becomes the third and largest contributor to the
retirement system and the amount is directly related to the amount of contributions and investment
performance.
Computing Contribution Rates to Finance Benefits. From a given schedule of benefits and from
the data furnished, the actuary calculates the contribution rates by means of an actuarial valuation –
the technique of assigning monetary values to the risks assumed in operating a retirement program.

Wisconsin Retirement System Appendix 2-3
ACTUARIAL METHOD AND ASSUMPTIONS USED IN VALUATIONS
The principal areas of risk assumption are:
• long-term rates of investment income likely to be generated by system assets
• rates of mortality among participants, retirants and beneficiaries
• rates of withdrawal of active participants
• rates of disability among participants
• patterns of salary increases to be experienced by participants
• the age and service distribution of actual retirements In an actuarial valuation, the actuary projects the monetary effect of each risk assumption for each
distinct experience group, for the next year and for each year over the next half-century or longer.
Once actual risk experience has occurred and been observed, it will not coincide exactly with assumed
risk experience, regardless of the skill of the actuary, the completeness of the data, and the precision
of the calculations. Each valuation provides a complete recalculation of assumed future risk
experience and takes into account all past differences between assumed and actual risk experience.
The result is a continual series of small adjustments to the computed contribution rate. From time to
time it becomes necessary to adjust the package of risk measurements to reflect basic experience
trends – but not random year-to-year fluctuations.

Wisconsin Retirement System Appendix 2-4

Wisconsin Retirement System Appendix 2-5
CASH BENEFITS LINE. This relentlessly increasing line is the fundamental reality of retirement plan financing. It happens each time a new benefit is added for future retirements (and happens regardless of the design for contributing for benefits). LEVEL CONTRIBUTION LINE. Determining the level contribution line requires detailed assumptions concerning a variety of experiences in future decades, including: Economic Risk Areas Rates of investment return Rates of pay increase Changes in active member group size Non-Economic Risk Areas Ages at actual retirement Rates of mortality Rates of withdrawal of active members (turnover) Rates of disability

APPENDIX 3 G AI N /L O S S E X HI B IT S

Wisconsin Retirement System Appendix 3-1
GENERAL MALES
WITHDRAWAL EXPERIENCE DURING CALENDAR YEAR 2015
Male Service-Based Withdrawals All Ages
Service Crude Current Expected Index Withdrawals Exposure Rates Rates Withdrawals
1 386 2,206 0.1750 0.1680 371 2 532 4,125 0.1290 0.1270 524 3 332 3,343 0.0993 0.0900 301 4 283 2,986 0.0948 0.0730 218 5 171 2,094 0.0817 0.0700 147 6 129 1,569 0.0822 0.0480 75 7 103 1,695 0.0608 0.0430 73 8 94 1,844 0.0510 0.0420 77 9 96 1,645 0.0584 0.0340 56 10 78 1,407 0.0554 0.0310 44
Totals 2,204 22,914 0.0962 0.0823 1,886
Male Age-Based Withdrawals
10+ Years of Service
Crude Current ExpectedAge Withdrawals Exposure Rates Rates Withdrawals
25-29 - 5 0.0000 0.0250 - 30-34 14 311 0.0450 0.0250 8 35-39 44 1,332 0.0330 0.0225 30 40-44 66 2,238 0.0295 0.0200 45 45-49 74 3,645 0.0203 0.0160 58 50-54 137 5,181 0.0264 0.0150 78
Over 54 129 11,255 0.0115 129 Totals 464 23,967 0.0194 0.0145 348

Wisconsin Retirement System Appendix 3-2
GENERAL FEMALES
WITHDRAWAL EXPERIENCE DURING CALENDAR YEAR 2015
Female Service-Based Withdrawals All Ages
Service Crude Current Expected Index Withdrawals Exposure Rates Rates Withdrawals
1 942 4,672 0.2016 0.2000 934 2 1,387 8,477 0.1636 0.1410 1,195 3 899 7,005 0.1283 0.1100 771 4 621 5,483 0.1133 0.0890 488 5 385 4,334 0.0888 0.0850 368 6 355 3,699 0.0960 0.0670 248 7 308 3,804 0.0810 0.0560 213 8 225 3,578 0.0629 0.0500 179 9 201 3,393 0.0592 0.0470 159 10 166 3,078 0.0539 0.0450 139
Totals 5,489 47,523 0.1155 0.0988 4,694
Female Age-Based Withdrawals 10+ Years of Service
Crude Current ExpectedAge Withdrawals Exposure Rates Rates Withdrawals
25-29 2 14 0.1429 0.0450 1 30-34 28 507 0.0552 0.0420 21 35-39 97 2,121 0.0457 0.0300 64 40-44 137 3,296 0.0416 0.0250 82 45-49 150 5,063 0.0296 0.0200 101 50-54 268 8,141 0.0329 0.0175 142
Over 54 271 19,382 0.0140 271 Totals 953 38,524 0.0247 0.0177 682

Wisconsin Retirement System Appendix 3-3
PUBLIC SCHOOLS MALES
WITHDRAWAL EXPERIENCE DURING CALENDAR YEAR 2015
Male Service-Based Withdrawals All Ages
Service Crude Current Expected Index Withdrawals Exposure Rates Rates Withdrawals
1 75 578 0.1298 0.1830 106 2 132 1,098 0.1202 0.1100 121 3 96 1,091 0.0880 0.0780 85 4 67 988 0.0678 0.0590 58 5 57 823 0.0693 0.0490 40 6 35 629 0.0556 0.0360 23 7 34 654 0.0520 0.0320 21 8 31 706 0.0439 0.0260 18 9 26 721 0.0361 0.0260 19 10 27 701 0.0385 0.0240 17
Totals 580 7,989 0.0726 0.0636 508
Male Age-Based Withdrawals 10+ Years of Service
Crude Current ExpectedAge Withdrawals Exposure Rates Rates Withdrawals
25-29 - - N/A 0.0125 - 30-34 7 219 0.0320 0.0125 3 35-39 49 1,791 0.0274 0.0125 22 40-44 38 2,535 0.0150 0.0125 32 45-49 52 2,783 0.0187 0.0125 35 50-54 60 2,550 0.0235 0.0125 32
Over 54 36 3,029 0.0119 36 Totals 242 12,907 0.0187 0.0124 160

Wisconsin Retirement System Appendix 3-4
PUBLIC SCHOOLS FEMALES WITHDRAWAL EXPERIENCE
DURING CALENDAR YEAR 2015
Female Service-Based Withdrawals All Ages
Service Crude Current Expected Index Withdrawals Exposure Rates Rates Withdrawals
1 172 1,740 0.0989 0.1600 278 2 346 3,363 0.1029 0.1080 363 3 274 3,152 0.0869 0.0770 243 4 168 2,756 0.0610 0.0580 160 5 121 2,286 0.0529 0.0500 114 6 130 2,068 0.0629 0.0430 89 7 97 2,118 0.0458 0.0380 80 8 100 2,338 0.0428 0.0340 79 9 90 2,237 0.0402 0.0280 63 10 86 2,184 0.0394 0.0250 55
Totals 1,584 24,242 0.0653 0.0629 1,524
Female Age-Based Withdrawals 10+ Years of Service
Crude Current ExpectedAge Withdrawals Exposure Rates Rates Withdrawals
25-29 - - N\A 0.0220 - 30-34 15 695 0.0216 0.0175 12 35-39 98 4,700 0.0209 0.0150 71 40-44 110 5,898 0.0187 0.0120 71 45-49 140 6,977 0.0201 0.0110 77 50-54 142 6,523 0.0218 0.0100 65
Over 54 96 8,347 0.0115 96 Totals 601 33,140 0.0181 0.0118 392

Wisconsin Retirement System Appendix 3-5
UNIVERSITY MALES WITHDRAWAL EXPERIENCE
DURING CALENDAR YEAR 2015
Male Service-Based Withdrawals All Ages
Service Crude Current Expected Index Withdrawals Exposure Rates Rates Withdrawals
1 62 347 0.1787 0.1600 56 2 142 709 0.2003 0.1400 99 3 115 728 0.1580 0.1200 87 4 85 622 0.1367 0.1000 62 5 52 469 0.1109 0.0850 40 6 49 428 0.1145 0.0800 34 7 31 384 0.0807 0.0750 29 8 24 405 0.0593 0.0570 23 9 24 341 0.0704 0.0460 16 10 24 309 0.0777 0.0400 12
Totals 608 4,742 0.1282 0.0966 458
Male Age-Based Withdrawals 10+ Years of Service
Crude Current ExpectedAge Withdrawals Exposure Rates Rates Withdrawals
25-29 - - N/A 0.0400 - 30-34 2 19 0.1053 0.0375 1 35-39 14 189 0.0741 0.0350 7 40-44 10 446 0.0224 0.0275 12 45-49 28 791 0.0354 0.0200 16 50-54 36 888 0.0405 0.0175 16
Over 54 16 2,715 0.0059 16 Totals 106 5,048 0.0210 0.0135 68

Wisconsin Retirement System Appendix 3-6
UNIVERSITY FEMALES WITHDRAWAL EXPERIENCE
DURING CALENDAR YEAR 2015
Female Service-Based Withdrawals All Ages
Service Crude Current Expected Index Withdrawals Exposure Rates Rates Withdrawals
1 72 443 0.1625 0.1600 71 2 143 871 0.1642 0.1500 131 3 141 895 0.1575 0.1300 116 4 86 693 0.1241 0.1000 69 5 68 624 0.1090 0.0990 62 6 50 488 0.1025 0.0840 41 7 46 533 0.0863 0.0640 34 8 36 558 0.0645 0.0570 32 9 37 436 0.0849 0.0470 20 10 17 436 0.0390 0.0420 18
Totals 696 5,977 0.1164 0.0994 594
Female Age-Based Withdrawals 10+ Years of Service
Crude Current ExpectedAge Withdrawals Exposure Rates Rates Withdrawals
25-29 - - N/A 0.0500 - 30-34 1 44 0.0227 0.0440 2 35-39 19 298 0.0638 0.0400 12 40-44 20 544 0.0368 0.0300 16 45-49 25 776 0.0322 0.0230 18 50-54 29 955 0.0304 0.0200 19
Over 54 19 2,227 0.0085 19 Totals 113 4,844 0.0233 0.0178 86

Wisconsin Retirement System Appendix 3-7
PROTECTIVE WITH SOCIAL SECURITY WITHDRAWAL EXPERIENCE
DURING CALENDAR YEAR 2015
Male and Female Service-Based Withdrawals All Ages
Service Crude Current Expected Index Withdrawals Exposure Rates Rates Withdrawals
1 89 515 0.1728 0.1700 88 2 148 1,190 0.1244 0.0800 95 3 75 944 0.0794 0.0500 47 4 43 847 0.0508 0.0430 36 5 32 623 0.0514 0.0380 24 6 33 526 0.0627 0.0310 16 7 43 684 0.0629 0.0300 21 8 41 833 0.0492 0.0290 24 9 32 786 0.0407 0.0250 20 10 22 701 0.0314 0.0220 15
Totals 558 7,649 0.0730 0.0505 386
Male and Female Age-Based Withdrawals 10+ Years of Service
Crude Current ExpectedAge Withdrawals Exposure Rates Rates Withdrawals
25-29 - 4 0.0000 0.0200 - 30-34 18 562 0.0320 0.0170 10 35-39 58 1,923 0.0302 0.0150 29 40-44 58 2,626 0.0221 0.0120 32 45-49 42 2,951 0.0142 0.0110 32 50-54 24 2,263 0.0106 0.0100 23
Over 54 16 1,544 0.0104 16 Totals 216 11,873 0.0182 0.0120 142

Wisconsin Retirement System Appendix 3-8
PROTECTIVE WITHOUT SOCIAL SECURITY WITHDRAWAL EXPERIENCE
DURING CALENDAR YEAR 2015
Male and Female Service-Based Withdrawals All Ages
Service Crude Current Expected Index Withdrawals Exposure Rates Rates Withdrawals
1 - 22 0.0000 0.0400 1 2 3 108 0.0278 0.0350 4 3 4 113 0.0354 0.0150 2 4 2 100 0.0200 0.0130 1 5 - 92 0.0000 0.0120 1 6 1 101 0.0099 0.0110 1 7 - 90 0.0000 0.0100 1 8 - 104 0.0000 0.0090 1 9 - 87 0.0000 0.0080 1 10 4 108 0.0370 0.0070 1
Totals 14 925 0.0151 0.0151 14
Male and Female Age-Based Withdrawals 10+ Years of Service
Crude Current ExpectedAge Withdrawals Exposure Rates Rates Withdrawals
25-29 - - N/A 0.0070 - 30-34 3 56 0.0536 0.0070 - 35-39 1 248 0.0040 0.0065 2 40-44 3 409 0.0073 0.0060 2 45-49 - 460 0.0000 0.0055 3 50-54 10 429 0.0233 0.0050 2 Totals 17 1,602 0.0106 0.0056 9

Wisconsin Retirement System Appendix 3-9
EXECUTIVE AND ELECTED MALES WITHDRAWAL EXPERIENCE
DURING CALENDAR YEAR 2015
Male and Female Service-Based Withdrawals All Ages
Service Crude Current Expected Index Withdrawals Exposure Rates Rates Withdrawals
1 7 56 0.1250 0.1800 10 2 3 82 0.0366 0.1400 11 3 11 96 0.1146 0.1200 12 4 5 65 0.0769 0.1000 7 5 7 88 0.0795 0.1000 9 6 3 41 0.0732 0.0800 3 7 1 44 0.0227 0.0700 3 8 - 37 0.0000 0.0600 2 9 2 45 0.0444 0.0600 3 10 - 19 0.0000 0.0600 1
Totals 39 573 0.0681 0.1065 61
Male and Female Age-Based Withdrawals 10+ Years of Service
Crude Current ExpectedAge Withdrawals Exposure Rates Rates Withdrawals
25-29 - - N/A 0.0600 - 30-34 - 1 0.0000 0.0450 - 35-39 1 16 0.0625 0.0420 1 40-44 3 60 0.0500 0.0400 2 45-49 3 79 0.0380 0.0260 2 50-54 6 123 0.0488 0.0240 3
Over 54 5 499 0.0100 5 Totals 18 778 0.0231 0.0167 13

Wisconsin Retirement System Appendix 3-10
GENERAL DISABILITY EXPERIENCE
DURING CALENDAR YEAR 2015
Male Disability Experience
Crude Current ExpectedAge Disabilities Exposure Rates Rates Disabilities
Under 20 - - N/A 0.0001 - 20-24 - 11 0.0000 0.0001 - 25-29 - 459 0.0000 0.0001 - 30-34 - 1,856 0.0000 0.0001 - 35-39 - 2,817 0.0000 0.0002 - 40-44 - 3,374 0.0000 0.0005 2 45-49 2 4,838 0.0004 0.0006 3 50-54 3 6,352 0.0005 0.0017 10 55-59 13 6,122 0.0021 0.0030 18 60-64 11 3,715 0.0030 0.0059 22 65-69 - 932 0.0000 0.0023 2 70-74 - 206 0.0000 0.0020 -
75 and over - - N/A 0.0020 - Totals 29 30,682 0.0009 0.0019 57
Female Disability Experience
Crude Current ExpectedAge Disabilities Exposure Rates Rates Disabilities
Under 20 - - N/A 0.0001 - 20-24 - 19 0.0000 0.0001 - 25-29 - 867 0.0000 0.0001 - 30-34 - 3,131 0.0000 0.0002 1 35-39 - 4,537 0.0000 0.0003 1 40-44 - 5,533 0.0000 0.0004 2 45-49 3 8,026 0.0004 0.0006 5 50-54 11 11,641 0.0009 0.0010 12 55-59 17 12,065 0.0014 0.0020 24 60-64 11 7,402 0.0015 0.0025 18 65-69 - 1,775 0.0000 0.0020 4 70-74 - 319 0.0000 0.0017 1
75 and over - - N/A 0.0017 - Totals 42 55,315 0.0008 0.0012 68
The people shown on this page are cases involving §40.63 disability benefits and includes those who were either active or inactive with pending benefits at the beginning of the year. The LTDI plan is described in a separate report.

Wisconsin Retirement System Appendix 3-11
PUBLIC SCHOOLS DISABILITY EXPERIENCE
DURING CALENDAR YEAR 2015
Male Disability Experience
Crude Current ExpectedAge Disabilities Exposure Rates Rates Disabilities
Under 20 - - N/A 0.0001 - 20-24 - - N/A 0.0001 - 25-29 - 229 0.0000 0.0001 - 30-34 - 1,660 0.0000 0.0001 - 35-39 - 2,644 0.0000 0.0001 - 40-44 - 2,967 0.0000 0.0002 1 45-49 - 3,064 0.0000 0.0004 1 50-54 4 2,770 0.0014 0.0013 4 55-59 1 1,797 0.0006 0.0017 3 60-64 1 696 0.0014 0.0031 2 65-69 - 147 0.0000 0.0043 1 70-74 - 37 0.0000 0.0045 -
75 and over - - N/A 0.0045 - Totals 6 16,011 0.0004 0.0007 12
Female Disability Experience
Crude Current ExpectedAge Disabilities Exposure Rates Rates Disabilities
Under 20 - - N/A 0.0001 - 20-24 - - N/A 0.0001 - 25-29 - 888 0.0000 0.0001 - 30-34 - 5,370 0.0000 0.0001 - 35-39 - 6,943 0.0000 0.0001 1 40-44 - 7,126 0.0000 0.0002 2 45-49 - 8,129 0.0000 0.0008 7 50-54 3 7,337 0.0004 0.0011 8 55-59 5 5,271 0.0009 0.0017 9 60-64 1 2,185 0.0005 0.0024 5 65-69 - 386 0.0000 0.0014 1 70-74 - 56 0.0000 0.0011 -
75 and over - - N/A 0.0011 - Totals 9 43,691 0.0002 0.0008 33
The people shown on this page are cases involving §40.63 disability benefits and includes those who were either active or inactive with pending benefits at the beginning of the year. The LTDI plan is described in a separate report prepared by a different actuarial firm.

Wisconsin Retirement System Appendix 3-12
UNIVERSITY DISABILITY EXPERIENCE
DURING CALENDAR YEAR 2015
Male Disability Experience
Crude Current ExpectedAge Disabilities Exposure Rates Rates Disabilities
Under 20 - - N/A 0.0000 - 20-24 - - N/A 0.0000 - 25-29 - 36 0.0000 0.0000 - 30-34 - 263 0.0000 0.0000 - 35-39 - 640 0.0000 0.0000 - 40-44 - 937 0.0000 0.0001 - 45-49 - 1,119 0.0000 0.0001 - 50-54 - 1,104 0.0000 0.0002 - 55-59 - 1,095 0.0000 0.0007 1 60-64 2 847 0.0024 0.0007 1 65-69 - 253 0.0000 0.0009 - 70-74 - 44 0.0000 0.0008 -
75 and over - - N/A 0.0008 - Totals 2 6,338 0.0003 0.0003 2
Female Disability Experience
Crude Current ExpectedAge Disabilities Exposure Rates Rates Disabilities
Under 20 - - N/A 0.0000 - 20-24 - - N/A 0.0000 - 25-29 - 83 0.0000 0.0000 - 30-34 - 490 0.0000 0.0000 - 35-39 - 941 0.0000 0.0003 - 40-44 - 1,049 0.0000 0.0004 - 45-49 - 1,166 0.0000 0.0003 - 50-54 - 1,263 0.0000 0.0007 1 55-59 1 1,099 0.0009 0.0010 1 60-64 - 769 0.0000 0.0015 1 65-69 - 192 0.0000 0.0010 - 70-74 - 37 0.0000 0.0009 -
75 and over - - N/A 0.0009 - Totals 1 7,089 0.0001 0.0004 3
The people shown on this page are cases involving §40.63 disability benefits and includes those who were either active or inactive with pending benefits at the beginning of the year. The LTDI plan is described in a separate report prepared by a different actuarial firm.

Wisconsin Retirement System Appendix 3-13
PROTECTIVE WITH SOCIAL SECURITY DISABILITY EXPERIENCE
DURING CALENDAR YEAR 2015
Male and Female Disability Experience
Crude Current ExpectedAge Disabilities Exposure Rates Rates Disabilities
Under 20 - - N/A 0.0004 - 20-24 - 2 0.0000 0.0004 - 25-29 - 99 0.0000 0.0004 - 30-34 - 270 0.0000 0.0004 - 35-39 - 398 0.0000 0.0004 - 40-44 - 460 0.0000 0.0007 - 45-49 2 480 0.0042 0.0014 1 50-54 - 318 0.0000 0.0098 3 55-59 - 45 0.0000 0.0014 - 60-64 - 7 0.0000 0.0014 - 65-69 - - N/A 0.0014 - 70-74 - - N/A 0.0014 -
75 and over - - N/A 0.0014 - Totals 2 2,079 0.0010 0.0019 4
The people shown on this page are cases involving §40.63 disability benefits and includes those who were either active or inactive with pending benefits at the beginning of the year. The LTDI plan is described in a separate report prepared by a different actuarial firm.

Wisconsin Retirement System Appendix 3-14
PROTECTIVE WITHOUT SOCIAL SECURITY DISABILITY EXPERIENCE
DURING CALENDAR YEAR 2015
Male and Female Disability Experience
Crude Current ExpectedAge Disabilities Exposure Rates Rates Disabilities
Under 20 - - N/A 0.0001 - 20-24 - 7 0.0000 0.0001 - 25-29 - 620 0.0000 0.0001 - 30-34 - 2,166 0.0000 0.0001 - 35-39 - 2,639 0.0000 0.0002 1 40-44 - 2,998 0.0000 0.0003 1 45-49 2 3,213 0.0006 0.0004 1 50-54 5 1,997 0.0025 0.0007 1 55-59 - 602 0.0000 0.0140 8 60-64 - 280 0.0000 0.0150 4 65-69 - 61 0.0000 0.0010 - 70-74 - - N/A 0.0010 -
75 and over - - N/A 0.0010 - Totals 7 14,583 0.0005 0.0011 16
The people shown on this page are cases involving §40.63 disability benefits and includes those who were either active or inactive with pending benefits at the beginning of the year. The LTDI plan is described in a separate report prepared by a different actuarial firm.

Wisconsin Retirement System Appendix 3-15
EXECUTIVE AND ELECTED DISABILITY EXPERIENCE
DURING CALENDAR YEAR 2015
Male and Female Disability Experience
Crude Current ExpectedAge Disabilities Exposure Rates Rates Disabilities
Under 20 - - N/A 0.0000 - 20-24 - - N/A 0.0000 - 25-29 - 3 0.0000 0.0000 - 30-34 - 8 0.0000 0.0000 - 35-39 - 30 0.0000 0.0001 - 40-44 - 82 0.0000 0.0001 - 45-49 - 114 0.0000 0.0002 - 50-54 - 160 0.0000 0.0003 - 55-59 - 188 0.0000 0.0012 - 60-64 - 131 0.0000 0.0011 - 65-69 - 79 0.0000 0.0009 - 70-74 - 33 0.0000 0.0009 -
75 and over - - N/A 0.0009 - Totals - 828 N/A N/A -
The people shown on this page are cases involving §40.63 disability benefits and includes those who were either active or inactive with pending benefits at the beginning of the year. The LTDI plan is described in a separate report prepared by a different actuarial firm.

Wisconsin Retirement System Appendix 3-16
GENERAL
PAY INCREASE ASSUMPTION DURING CALENDAR YEAR 2015
Service-Based Pay Increase Experience
Beginningof Year Number Actual Expected
1-5 38,443 10.32 % 7.45 % 6-10 23,584 4.05 % 5.90 % 11-15 19,307 3.12 % 5.25 % 16-20 15,326 2.49 % 5.00 % 21-25 9,897 2.19 % 4.75 % 26-30 6,837 1.95 % 4.50 % 31-35 3,407 1.79 % 4.30 % 36-40 1,597 1.58 % 4.20 %
Over 40 304 2.15 % 4.10 % Total 118,702
Service Group Total % Increase

Wisconsin Retirement System Appendix 3-17
PUBLIC SCHOOLS
PAY INCREASE ASSUMPTION DURING CALENDAR YEAR 2015
Service-Based Pay Increase Experience
Beginningof Year Number Actual Expected
1-5 16,297 11.65 % 9.60 % 6-10 13,593 5.14 % 7.40 % 11-15 13,956 3.81 % 6.10 % 16-20 12,789 2.89 % 5.00 % 21-25 8,669 2.46 % 4.35 % 26-30 5,348 2.13 % 4.20 % 31-35 1,830 1.98 % 4.15 % 36-40 413 2.02 % 4.10 %
Over 40 73 3.25 % 4.05 % Total 72,968
Service Group Total % Increase

Wisconsin Retirement System Appendix 3-18
UNIVERSITY
PAY INCREASE ASSUMPTION DURING CALENDAR YEAR 2015
Service-Based Pay Increase Experience
Beginningof Year Number Actual Expected
1-5 5,370 14.20 % 7.00 % 6-10 3,888 3.66 % 6.50 % 11-15 3,217 2.90 % 6.00 % 16-20 2,416 2.35 % 5.50 % 21-25 1,482 1.72 % 4.95 % 26-30 1,081 1.85 % 4.80 % 31-35 594 1.48 % 4.60 % 36-40 220 1.91 % 4.20 %
Over 40 99 1.91 % 4.10 % Total 18,367
Service Group Total % Increase

Wisconsin Retirement System Appendix 3-19
PROTECTIVE WITH SOCIAL SECURITY
PAY INCREASE ASSUMPTION DURING CALENDAR YEAR 2015
Male and Female Service-Based Pay Increase Experience
Beginningof Year Number Actual Expected
1-5 3,614 14.66 % 8.75 % 6-10 3,293 4.57 % 5.50 % 11-15 3,533 3.86 % 4.90 % 16-20 3,504 3.34 % 4.80 % 21-25 2,395 3.33 % 4.70 % 26-30 1,147 3.24 % 4.60 % 31-35 293 2.23 % 4.50 % 36-40 68 3.85 % 4.40 %
Over 40 11 1.34 % 4.20 % Total 17,858
Service Group Total % Increase

Wisconsin Retirement System Appendix 3-20
PROTECTIVE WITHOUT SOCIAL SECURITY
PAY INCREASE ASSUMPTION DURING CALENDAR YEAR 2015
Male and Female Service-Based Pay Increase Experience
Beginningof Year Number Actual Expected
1-5 422 17.34 % 9.50 % 6-10 485 4.46 % 5.30 % 11-15 421 3.87 % 4.60 % 16-20 566 3.93 % 4.50 % 21-25 383 4.06 % 4.40 % 26-30 255 4.66 % 4.30 % 31-35 53 3.55 % 4.20 % 36-40 4 2.54 % 4.10 %
Over 40 - N/A 4.05 % Total 2,589
Service Group Total % Increase

Wisconsin Retirement System Appendix 3-21
EXECUTIVE AND ELECTED
PAY INCREASE ASSUMPTION DURING CALENDAR YEAR 2015
Service-Based Pay Increase Experience
Beginningof Year Number Actual Expected
1-5 368 6.55 % 6.50 % 6-10 183 2.65 % 4.20 % 11-15 165 2.02 % 4.20 % 16-20 164 1.19 % 4.20 % 21-25 123 1.27 % 4.20 % 26-30 103 3.36 % 4.20 % 31-35 69 1.39 % 4.20 % 36-40 48 1.53 % 4.20 %
Over 40 12 1.17 % 4.20 % Total 1,235
Service Group Total % Increase

Wisconsin Retirement System Appendix 3-22
GENERAL MALES
NORMAL RETIREMENT EXPERIENCE DURING CALENDAR YEAR 2015
Male Age-Based Retirement Experience
Crude Current ExpectedAge Retirements Exposure Rates Rates Retirements
57 64 272 0.2353 0.1800 49 58 56 284 0.1972 0.1800 51 59 49 294 0.1667 0.1800 53 60 52 265 0.1962 0.1800 48 61 51 258 0.1977 0.1800 46 62 61 243 0.2510 0.2500 61 63 65 219 0.2968 0.3000 66 64 48 147 0.3265 0.2500 37 65 146 626 0.2332 0.2500 157 66 127 415 0.3060 0.3200 133 67 90 322 0.2795 0.2600 84 68 48 256 0.1875 0.1900 49 69 37 188 0.1968 0.1900 36 70 19 113 0.1681 0.1900 21 71 7 103 0.0680 0.1900 20 72 9 83 0.1084 0.1900 16 73 13 72 0.1806 0.1900 14 74 4 59 0.0678 0.1900 11
Totals 946 4,219 0.2242 0.2256 952 75 & Over 20 221 221
Totals 966 4,440 1,173

Wisconsin Retirement System Appendix 3-23
GENERAL MALES
EARLY RETIREMENT EXPERIENCE DURING CALENDAR YEAR 2015
Male Age-Based Reduced Retirement Experience
Crude Current Expected Age Retirements Exposure Rates Rates Retirements
55 87 1,504 0.0578 0.0900 135 56 74 1,434 0.0516 0.0900 129 57 55 1,184 0.0465 0.0475 56 58 46 1,048 0.0439 0.0580 61 59 49 952 0.0515 0.0650 62 60 68 925 0.0735 0.0850 79 61 68 846 0.0804 0.0850 72 62 128 770 0.1662 0.1600 123 63 112 661 0.1694 0.1700 112 64 91 513 0.1774 0.1700 87
Totals 778 9,837 0.0791 0.0931 916

Wisconsin Retirement System Appendix 3-24
GENERAL FEMALES
NORMAL RETIREMENT EXPERIENCE DURING CALENDAR YEAR 2015
Female Age-Based Retirement Experience
Crude Current ExpectedAge Retirements Exposure Rates Rates Retirements
57 74 384 0.1927 0.1500 58 58 68 392 0.1735 0.1500 59 59 42 314 0.1338 0.1500 47 60 63 303 0.2079 0.1500 45 61 45 277 0.1625 0.1500 42 62 73 252 0.2897 0.2500 63 63 64 197 0.3249 0.2500 49 64 37 158 0.2342 0.2500 40 65 260 1,051 0.2474 0.2800 294 66 200 675 0.2963 0.3200 216 67 127 506 0.2510 0.2600 132 68 76 332 0.2289 0.2200 73 69 49 263 0.1863 0.2000 53 70 38 163 0.2331 0.2000 33 71 23 124 0.1855 0.2000 25 72 19 124 0.1532 0.2000 25 73 14 109 0.1284 0.2000 22 74 1 53 0.0189 0.2000 11
Totals 1,273 5,677 0.2242 0.2267 1,287 75 & Over 41 241 241
Totals 1,314 5,918 1,528

Wisconsin Retirement System Appendix 3-25
GENERAL FEMALES
EARLY RETIREMENT EXPERIENCE DURING CALENDAR YEAR 2015
Female Age-Based Reduced Retirement Experience
Crude Current ExpectedAge Retirements Exposure Rates Rates Retirements
55 119 2,812 0.0423 0.0700 197 56 128 2,759 0.0464 0.0700 193 57 95 2,268 0.0419 0.0500 113 58 119 2,238 0.0532 0.0600 134 59 129 1,988 0.0649 0.0600 119 60 145 1,890 0.0767 0.0850 161 61 149 1,743 0.0855 0.0850 148 62 216 1,523 0.1418 0.1600 244 63 191 1,220 0.1566 0.1600 195 64 199 1,026 0.1940 0.1600 164
Totals 1,490 19,467 0.0765 0.0857 1,668

Wisconsin Retirement System Appendix 3-26
PUBLIC SCHOOL MALES
NORMAL RETIREMENT EXPERIENCE DURING CALENDAR YEAR 2015
Male Age-Based Retirement Experience
Crude Current ExpectedAge Retirements Exposure Rates Rates Retirements
57 42 125 0.3360 0.3600 45 58 37 113 0.3274 0.3100 35 59 24 73 0.3288 0.2400 18 60 29 89 0.3258 0.3000 27 61 11 46 0.2391 0.2800 13 62 10 36 0.2778 0.3700 13 63 12 34 0.3529 0.3200 11 64 9 24 0.3750 0.2700 6 65 32 109 0.2936 0.2900 32 66 22 78 0.2821 0.3300 26 67 15 55 0.2727 0.2700 15 68 15 56 0.2679 0.2400 13 69 3 30 0.1000 0.2400 7 70 4 26 0.1538 0.2000 5 71 5 26 0.1923 0.2000 5 72 1 9 0.1111 0.2000 2 73 1 10 0.1000 0.2000 2 74 1 7 0.1429 0.2000 1
Totals 273 946 0.2886 0.2918 276 75 & Over 3 25 25
Totals 276 971 301

Wisconsin Retirement System Appendix 3-27
PUBLIC SCHOOL MALES
EARLY RETIREMENT EXPERIENCE DURING CALENDAR YEAR 2015
Male Age-Based Reduced Retirement Experience
Crude Current Expected Age Retirements Exposure Rates Rates Retirements
55 49 523 0.0937 0.1300 68 56 48 497 0.0966 0.1300 65 57 38 325 0.1169 0.1200 39 58 37 255 0.1451 0.1300 33 59 22 197 0.1117 0.1400 28 60 19 172 0.1105 0.1400 24 61 28 173 0.1618 0.1500 26 62 26 124 0.2097 0.2100 26 63 15 120 0.1250 0.2100 25 64 27 107 0.2523 0.2100 22
Totals 309 2,493 0.1239 0.1428 356

Wisconsin Retirement System Appendix 3-28
PUBLIC SCHOOL FEMALES
NORMAL RETIREMENT EXPERIENCE DURING CALENDAR YEAR 2015
Female Age-Based Retirement Experience
Crude Current ExpectedAge Retirements Exposure Rates Rates Retirements
57 65 264 0.2462 0.2800 74 58 59 239 0.2469 0.2800 67 59 41 172 0.2384 0.2800 48 60 57 184 0.3098 0.2800 52 61 38 136 0.2794 0.2800 38 62 33 87 0.3793 0.3600 31 63 29 87 0.3333 0.3000 26 64 18 44 0.4091 0.2700 12 65 87 273 0.3187 0.3500 96 66 67 183 0.3661 0.3500 64 67 23 107 0.2150 0.3000 32 68 23 93 0.2473 0.3000 28 69 7 49 0.1429 0.3000 15 70 5 37 0.1351 0.3500 13 71 6 23 0.2609 0.3000 7 72 1 17 0.0588 0.2200 4 73 2 17 0.1176 0.2200 4 74 - 10 0.0000 0.2200 2
Totals 561 2,022 0.2774 0.3032 613 75 & Over 6 47 47
Totals 567 2,069 660
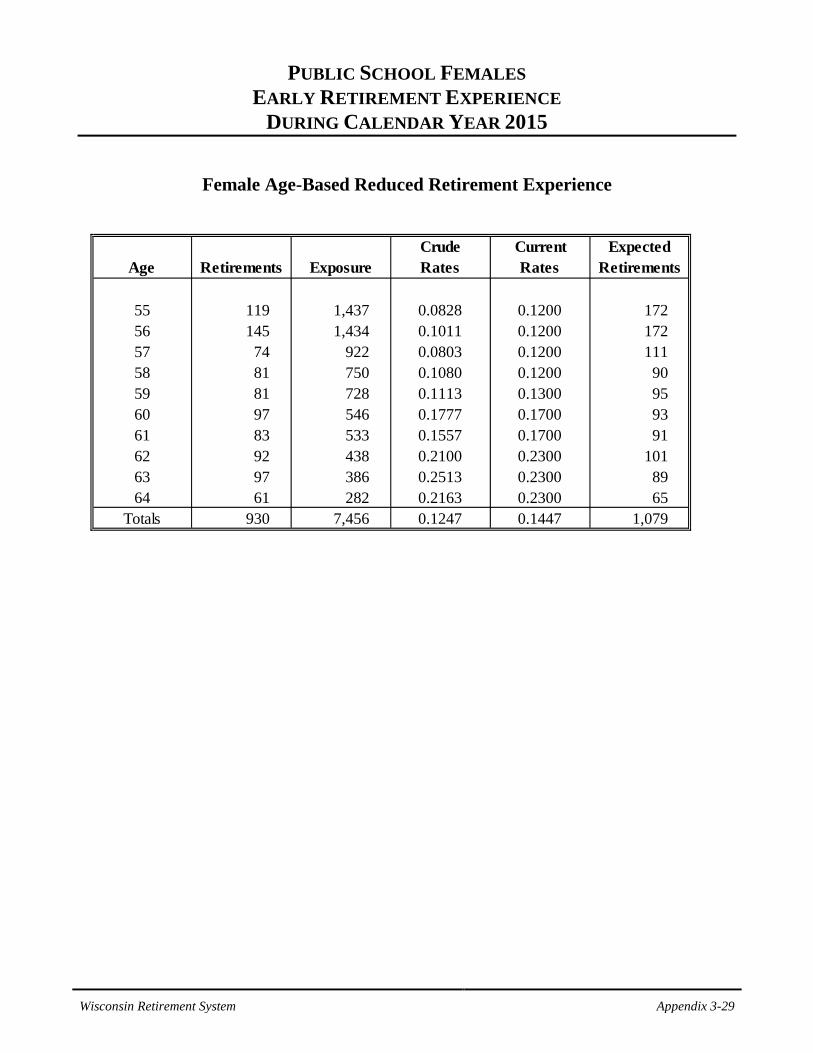
Wisconsin Retirement System Appendix 3-29
PUBLIC SCHOOL FEMALES
EARLY RETIREMENT EXPERIENCE DURING CALENDAR YEAR 2015
Female Age-Based Reduced Retirement Experience
Crude Current ExpectedAge Retirements Exposure Rates Rates Retirements
55 119 1,437 0.0828 0.1200 172 56 145 1,434 0.1011 0.1200 172 57 74 922 0.0803 0.1200 111 58 81 750 0.1080 0.1200 90 59 81 728 0.1113 0.1300 95 60 97 546 0.1777 0.1700 93 61 83 533 0.1557 0.1700 91 62 92 438 0.2100 0.2300 101 63 97 386 0.2513 0.2300 89 64 61 282 0.2163 0.2300 65
Totals 930 7,456 0.1247 0.1447 1,079

Wisconsin Retirement System Appendix 3-30
UNIVERSITY MALES
NORMAL RETIREMENT EXPERIENCE DURING CALENDAR YEAR 2015
Male Age-Based Retirement Experience
Crude Current ExpectedAge Retirements Exposure Rates Rates Retirements
57 6 26 0.2308 0.1200 3 58 5 31 0.1613 0.1200 4 59 2 38 0.0526 0.1200 5 60 9 43 0.2093 0.1200 5 61 4 51 0.0784 0.1200 6 62 7 54 0.1296 0.1200 6 63 8 51 0.1569 0.1200 6 64 8 67 0.1194 0.1200 8 65 36 186 0.1935 0.1500 28 66 36 143 0.2517 0.1700 24 67 22 107 0.2056 0.1600 17 68 14 105 0.1333 0.1600 17 69 8 77 0.1039 0.1600 12 70 5 55 0.0909 0.1600 9 71 9 48 0.1875 0.1800 9 72 5 33 0.1515 0.1400 5 73 2 23 0.0870 0.1400 3 74 4 21 0.1905 0.1000 2
Totals 190 1,159 0.1639 0.1458 169 75 & Over 9 59 59
Totals 199 1,218 228

Wisconsin Retirement System Appendix 3-31
UNIVERSITY MALES
EARLY RETIREMENT EXPERIENCE DURING CALENDAR YEAR 2015
Male Age-Based Reduced Retirement Experience
Crude Current Expected Age Retirements Exposure Rates Rates Retirements
55 8 220 0.0364 0.0400 9 56 9 235 0.0383 0.0300 7 57 8 215 0.0372 0.0250 5 58 7 220 0.0318 0.0250 6 59 6 205 0.0293 0.0300 6 60 12 201 0.0597 0.0425 9 61 14 198 0.0707 0.0500 10 62 13 166 0.0783 0.0600 10 63 14 148 0.0946 0.0700 10 64 18 134 0.1343 0.0700 9
Totals 109 1,942 0.0561 0.0417 81

Wisconsin Retirement System Appendix 3-32
UNIVERSITY FEMALES
NORMAL RETIREMENT EXPERIENCE DURING CALENDAR YEAR 2015
Female Age-Based Retirement Experience
Crude Current ExpectedAge Retirements Exposure Rates Rates Retirements
57 4 22 0.1818 0.1400 3 58 5 24 0.2083 0.1200 3 59 6 37 0.1622 0.1000 4 60 2 33 0.0606 0.1150 4 61 4 36 0.1111 0.1600 6 62 6 30 0.2000 0.1400 4 63 11 48 0.2292 0.1850 9 64 14 40 0.3500 0.1300 5 65 32 125 0.2560 0.1800 23 66 27 103 0.2621 0.2200 23 67 23 74 0.3108 0.1700 13 68 14 56 0.2500 0.1550 9 69 3 29 0.1034 0.1350 4 70 6 35 0.1714 0.1800 6 71 6 18 0.3333 0.1800 3 72 4 14 0.2857 0.1800 3 73 1 10 0.1000 0.1800 2 74 1 9 0.1111 0.1800 2
Totals 169 743 0.2275 0.1696 126 75 & Over 4 22 22
Totals 173 765 148

Wisconsin Retirement System Appendix 3-33
UNIVERSITY FEMALES
EARLY RETIREMENT EXPERIENCE DURING CALENDAR YEAR 2015
Female Age-Based Reduced Retirement Experience
Crude Current ExpectedAge Retirements Exposure Rates Rates Retirements
55 8 258 0.0310 0.0550 14 56 12 261 0.0460 0.0550 14 57 10 189 0.0529 0.0400 8 58 4 203 0.0197 0.0550 11 59 13 188 0.0691 0.0650 12 60 16 176 0.0909 0.0800 14 61 23 204 0.1127 0.0600 12 62 22 159 0.1384 0.1200 19 63 13 113 0.1150 0.1200 14 64 31 117 0.2650 0.1200 14
Totals 152 1,868 0.0814 0.0707 132
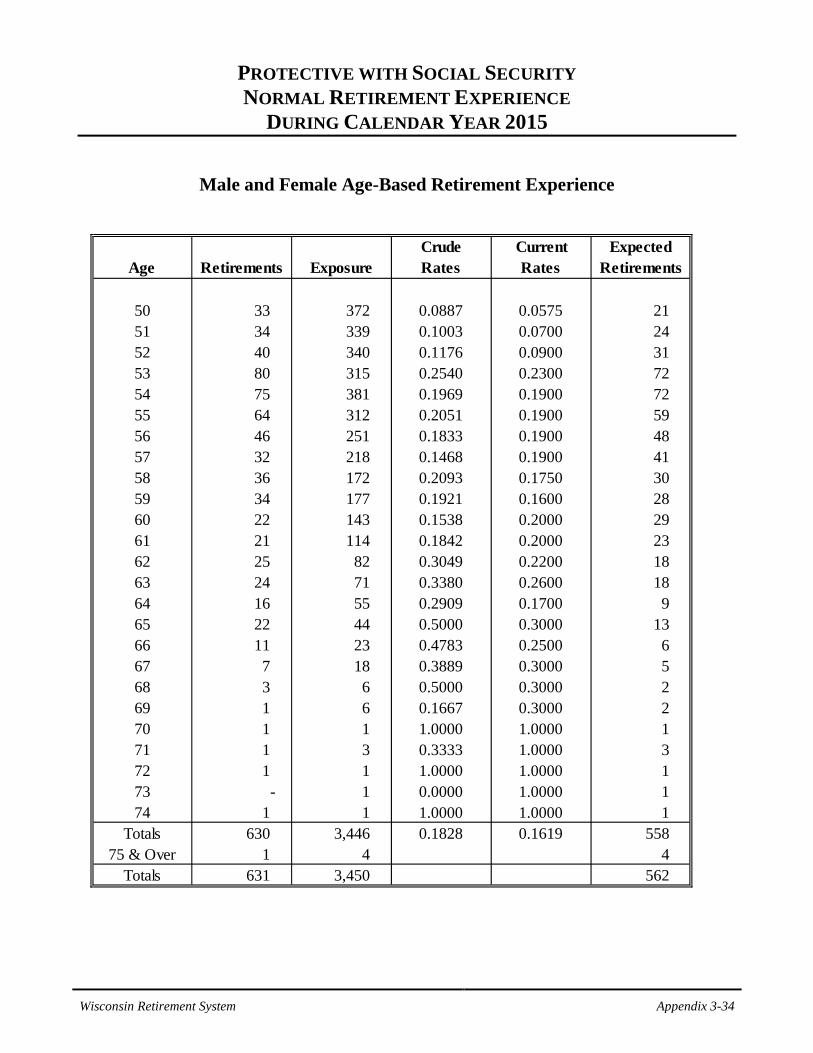
Wisconsin Retirement System Appendix 3-34
PROTECTIVE WITH SOCIAL SECURITY NORMAL RETIREMENT EXPERIENCE
DURING CALENDAR YEAR 2015
Male and Female Age-Based Retirement Experience
Crude Current ExpectedAge Retirements Exposure Rates Rates Retirements
50 33 372 0.0887 0.0575 21 51 34 339 0.1003 0.0700 24 52 40 340 0.1176 0.0900 31 53 80 315 0.2540 0.2300 72 54 75 381 0.1969 0.1900 72 55 64 312 0.2051 0.1900 59 56 46 251 0.1833 0.1900 48 57 32 218 0.1468 0.1900 41 58 36 172 0.2093 0.1750 30 59 34 177 0.1921 0.1600 28 60 22 143 0.1538 0.2000 29 61 21 114 0.1842 0.2000 23 62 25 82 0.3049 0.2200 18 63 24 71 0.3380 0.2600 18 64 16 55 0.2909 0.1700 9 65 22 44 0.5000 0.3000 13 66 11 23 0.4783 0.2500 6 67 7 18 0.3889 0.3000 5 68 3 6 0.5000 0.3000 2 69 1 6 0.1667 0.3000 2 70 1 1 1.0000 1.0000 1 71 1 3 0.3333 1.0000 3 72 1 1 1.0000 1.0000 1 73 - 1 0.0000 1.0000 1 74 1 1 1.0000 1.0000 1
Totals 630 3,446 0.1828 0.1619 558 75 & Over 1 4 4
Totals 631 3,450 562

Wisconsin Retirement System Appendix 3-35
PROTECTIVE WITHOUT SOCIAL SECURITY
NORMAL RETIREMENT EXPERIENCE DURING CALENDAR YEAR 2015
Male and Female Age-Based Retirement Experience
Crude Current ExpectedAge Retirements Exposure Rates Rates Retirements
50 1 67 0.0149 0.0350 2 51 1 84 0.0119 0.0375 3 52 4 71 0.0563 0.0450 3 53 11 71 0.1549 0.1700 12 54 11 71 0.1549 0.2500 18 55 14 59 0.2373 0.2100 12 56 13 45 0.2889 0.2700 12 57 5 21 0.2381 0.3000 6 58 10 25 0.4000 0.3000 8 59 10 17 0.5882 0.3000 5 60 2 13 0.1538 0.2600 3 61 5 15 0.3333 0.1500 2 62 3 8 0.3750 0.2000 2 63 2 4 0.5000 0.4000 2 64 1 2 0.5000 0.4000 1 65 - - N\A 0.4000 - 66 - - N/A 0.4000 - 67 - - N/A 0.4000 - 68 - - N/A 0.4000 - 69 - - N/A 0.4000 - 70 - - N/A 1.0000 - 71 - - N/A 1.0000 - 72 - - N/A 1.0000 - 73 - - N/A 1.0000 - 74 - - N/A 1.0000 -
Totals 93 573 0.1623 0.1588 91 75 & Over - - N/A -
Totals 93 573 91

Wisconsin Retirement System Appendix 3-36
EXECUTIVE AND ELECTED
NORMAL RETIREMENT EXPERIENCE DURING CALENDAR YEAR 2015
Male and Female Age-Based Retirement Experience
Crude Current ExpectedAge Retirements Exposure Rates Rates Retirements
57 - 11 0.0000 0.1200 1 58 1 17 0.0588 0.1200 2 59 1 9 0.1111 0.1200 1 60 2 11 0.1818 0.1200 1 61 2 17 0.1176 0.1200 2 62 4 36 0.1111 0.1200 4 63 5 41 0.1220 0.1200 5 64 7 50 0.1400 0.1200 6 65 5 41 0.1220 0.1200 5 66 7 23 0.3043 0.2000 5 67 3 21 0.1429 0.1500 3 68 - 26 0.0000 0.1500 4 69 6 17 0.3529 0.1000 2 70 4 12 0.3333 0.1000 1 71 2 9 0.2222 0.1000 1 72 1 13 0.0769 0.1500 2 73 1 8 0.1250 0.1500 1 74 1 8 0.1250 0.1500 1
Totals 52 370 0.1405 0.1270 47 75 & Over 2 22 22
Totals 54 392 69

Wisconsin Retirement System Appendix 3-37
EXECUTIVE AND ELECTED
EARLY RETIREMENT EXPERIENCE DURING CALENDAR YEAR 2015
Male and Female Age-Based Reduced Retirement Experience
Crude Current Expected Age Retirements Exposure Rates Rates Retirements
55 5 55 0.0909 0.0300 2 56 2 34 0.0588 0.0300 1 57 2 38 0.0526 0.0300 1 58 - 29 0.0000 0.0300 1 59 - 32 0.0000 0.0300 1 60 4 22 0.1818 0.0500 1 61 4 40 0.1000 0.0500 2 62 - 15 0.0000 0.0200 - 63 - 12 0.0000 0.0200 - 64 - 5 0.0000 0.0200 -
Over 64 1 66 0.0152Totals 18 348 9

Wisconsin Retirement System Appendix 3-38
DEATH-IN-SERVICE DURING CALENDAR YEAR 2015
Male
Crude Current ExpectedAge Deaths Exposure Rates Rates Deaths
Under 20 - 5 0.0000 0.0001 - 20-24 1 1,362 0.0007 0.0002 - 25-29 2 7,171 0.0003 0.0002 1 30-34 1 10,319 0.0001 0.0003 3 35-39 2 11,649 0.0002 0.0004 5 40-44 2 12,376 0.0002 0.0005 7 45-49 5 14,083 0.0004 0.0007 10 50-54 8 14,499 0.0006 0.0012 18 55-59 15 12,967 0.0012 0.0024 32 60-64 14 8,527 0.0016 0.0032 27 65-69 6 2,959 0.0020 0.0054 16 70-74 5 740 0.0068 0.0088 7
75 and over 2 1 2.0000 0.0154 - Totals 63 96,658 0.0007 0.0013 126
Female
Crude Current ExpectedAge Deaths Exposure Rates Rates Deaths
Under 20 - 27 0.0000 0.0001 - 20-24 - 2,534 0.0000 0.0001 - 25-29 - 13,064 0.0000 0.0001 1 30-34 2 16,465 0.0001 0.0002 3 35-39 1 18,136 0.0001 0.0002 4 40-44 - 19,027 0.0000 0.0004 7 45-49 12 22,618 0.0005 0.0005 12 50-54 13 24,685 0.0005 0.0009 21 55-59 13 23,460 0.0006 0.0014 33 60-64 12 13,995 0.0009 0.0021 29 65-69 5 3,979 0.0013 0.0032 13 70-74 3 775 0.0039 0.0058 4
75 and over 2 - N/A 0.0106 - Totals 63 158,765 0.0004 0.0008 127


![Accrued Interest en[1]](https://img.pdfslide.us/doc/110x75/577d231d1a28ab4e1e99053c/accrued-interest-en1.jpg)