Embed Size (px)
Citation preview

Correlations
Renan Levine
POL 242
July 12, 2006

Association
: Crosstabulation
Category Specifics
Symmetry Specification
Measure of Association
Indication of Direction
Nominal X Nominal Only (2 X 2) Symmetrical Phi Yes
Nominal X Nominal Greater than (2X2) - Cramer's V No
Nominal X Ordinal At least (2 X 3) - Cramer's V No
Ordinal X Ordinal Square (e.g., 3 X 3) SymmetricalKendall's Tau-
bYes
Ordinal X Ordinal Rectangle (e.g., 3 X 4) AsymmetricalKendall's Tau-
cYes
Interval X Interval (not taught yet)
- -Pearson's R (not yet
taught)Yes

Today: Correlations
Correlation is a measure of a relationship between variables. Measured with a coefficient [Pearson’s r] that ranges from -1 to 1.
Measure strength of relationship of interval or ratio variables
r = Σ(Zx * Zy)/n – 1 Zx=Z scores for X variable and Z scores for Y variable.
Sum the products and divide by number of paired cases minus one.
How to calculate Z scores can be found on-line.

Correlation r
Absolute values closer to 0 indicate that there is little or no linear relationship. Generally, 0.2-0.4 is weak, 0.4-0.6 is okay, 0.6 or
higher is strong. If correlation is very high, then its probably something
related that you might considering indexing or choosing just one variable.
The closer the coefficient is to the absolute value of 1 the stronger the relationship between the variables being correlated.

Positive Relationship
If two variables are related positively or directly r > 0
Variables “track together” – high values on Variable X are associated with high values on Variable Y. Low values on X associated with low
values.

Example
Robert D. Putnam; Robert Leonardi; Raffaella Y. Nanetti; Franco Pavoncello. “Explaining Institutional Success: The Case of Italian Regional Government.” The American Political Science Review 77:1 (Mar. 1983), pp. 55-74
More fun examples: http://www.nationmaster.com/correlations/eco_gdp-economy-gdp-nominal

Example II0
1020
3040
5060
7080
9010
0F
eelin
g T
herm
omet
er P
alin
0 10 20 30 40 50 60 70 80 90 100Feeling Thermometer McCain
Opinion towards Palin & McCain
r = 0.84

Negative or Inverse Relationship Variables can be inversely or negatively
related High values of X are associated with low values
of Y.
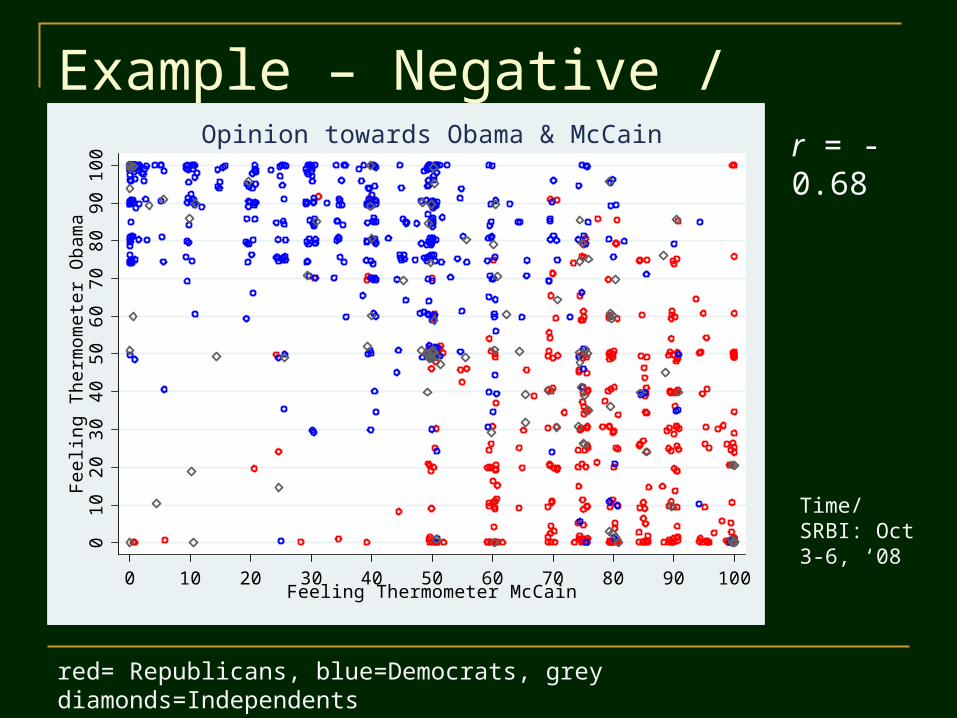
Example – Negative / Inverse0
1020
3040
5060
7080
9010
0F
eelin
g T
herm
omet
er O
bam
a
0 10 20 30 40 50 60 70 80 90 100Feeling Thermometer McCain
Opinion towards Obama & McCain r = -0.68
red= Republicans, blue=Democrats, grey diamonds=Independents
Time/SRBI: Oct 3-6, ‘08

Data
You need interval-level data. You will find many interval-level variables in:
Countries / World Provinces Election studies (feeling thermometers, odds of
party entering government, etc) You can often use the index you created as
an interval-level variable.
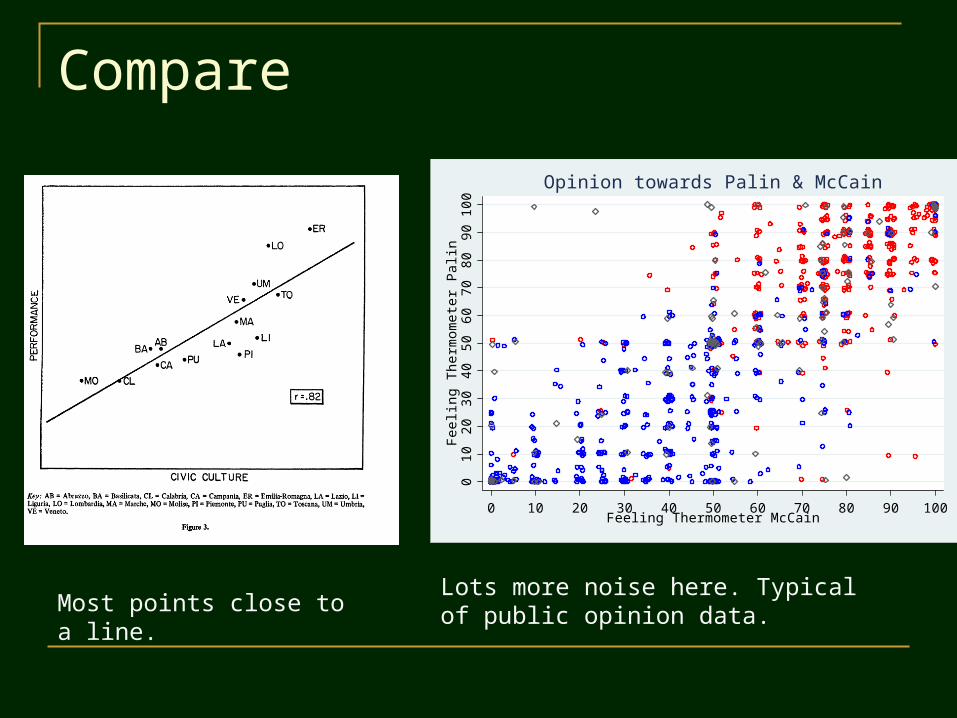
Compare
Lots more noise here. Typical of public opinion data.Most points close to a line.
010
2030
4050
6070
8090
100
Fee
ling
The
rmom
eter
Pal
in
0 10 20 30 40 50 60 70 80 90 100Feeling Thermometer McCain
Opinion towards Palin & McCain

Differences between Public Opinion and Aggregate Data Although it is not uncommon to have
one/some outliers in aggregate data, public opinion data tends to be “noisy”. Feeling thermometer example:
Many respondents gave both candidates a 50; Quite a few respondents liked both candidates Even though most who liked McCain disliked Obama
A high Pearson’s r for public opinion data may be low for an association in aggregate data.

Guidelines for Public Opinion DataMAGNITUDE OF ASSOCIATION QUALIFICATION COMMENTS
0.00 No RelationshipKnowing the independent variable does not reduce the number of errors in
predicting the dependent variable at all.
.00 to .15 Not Useful Not Acceptable
.15 to .20 Very Weak Minimally acceptable
.20 to .25 Moderately Strong Acceptable
.25 to .30 Fairly Strong Good Work
.30 to .40 Strong Great Work
.40 to .70 Very Strong/Worrisomely StrongEITHER an excellent relationship OR the two variables are measuring the same
thing
.70 to .99 Redundant (?) Proceed with caution: are the two variables testing the same thing?
1.00 Perfect Relationship. If we the know the independent variable, we can predict the dependent variable with
absolute success.

Rough Guidelines for Aggregate DataMAGNITUDE OF ASSOCIATION QUALIFICATION COMMENTS
0.00 No RelationshipKnowing the independent variable does not reduce the number of errors in
predicting the dependent variable at all.
.00 to .30 Not useful, very weak Not Acceptable
.30 to .50 Weak Minimally acceptable
.50 to .70 Fairly Strong Acceptable
.70 to .85 Strong Good Work
.80 to .90 Very Strong/Worrisomely StrongEITHER an excellent relationship OR the two variables are measuring the same
thing
.90 to .99 Redundant (?) Proceed with caution: are the two variables testing the same thing?
1.00 Perfect Relationship. If we the know the independent variable, we can predict the dependent variable with
absolute success.
Very Strong or Worrisome??
Public Opinion: above |0.40| Aggregate: above |0.80| But these are just guidelines. It depends on
how good the data is: Lots of variation in data Large scale (10, 20, 100 pts – like prediction
odds, physicians per 100,000 people, feeling thermometer scales)
Number of observations (N) Provinces dataset is small

Outstanding or the same?
You either have an outstanding relationship OR the variables may be measuring the same idea. Ex. unemployment and GDP both measure economic
health Ex. Feeling thermometer Barack Obama and feeling
thermometer for Joe Biden both measure attitudes towards the Democratic ticket
Also inverse relationship Example above: Obama and McCain feeling thermometers
– different sides of the same coin, as both seem to measure partisanship.
Use Yo’ Brain Computer cannot tell you if it’s a good, strong
relationship or two measures looking at the same thing.
Need to understand what each variable is measuring Same thought process about the index creation.
Use your knowledge of world and theory to decide whether two variables measure the same thing or two different things.
Example (above): Putnam’s relationship between civic culture and government performance.
Failed states survey - appears that the higher an indicator value, the worse off the country in that particular field.
http://www.fundforpeace.org/web/index.php?option=com_content&task=view&id=99&Itemid=140

Flip side
Relationship you expect is strong is surprisingly not ?!?!?
Make certain both variables are interval Double check that you cleaned up data
Missing values are missing Next week: there may be the need to qualify the
relationship as some sub-group of the data is not like the others and those need to be identified.
Think about relationship – maybe its not linear, so that relationship is only present for part of range.

Usefulness
Quick, easy way to look at several variables to see if they are related.
With strong association, you can begin to think about predicting values of Y based on a value of X. Ex. Positive correlation – you know a high value of X is
associated with a high value of Y!

Webstats Output - - Correlation Coefficients - -
Q375A1 Q305 Q375A3 Q1005
Q375A1 1.0000 .2916 .5320 -.3163 ( 686) ( 666) ( 667) ( 672) P= . P= .000 P= .000 P= .000
Q305 .2916 1.0000 .2679 -.1272 ( 666) ( 2776) ( 660) ( 2721) P= .000 P= . P= .000 P= .000
Q375A3 .5320 .2679 1.0000 -.2020 ( 667) ( 660) ( 682) ( 666) P= .000 P= .000 P= . P= .000
Q1005 -.3163 -.1272 -.2020 1.0000 ( 672) ( 2721) ( 666) ( 3181) P= .000 P= .000 P= .000 P= .
Coefficients (Pearson’s r)
N

Significance?
Webstats will tell you whether or not the correlation coefficient is significant.
Remember that this is just telling you whether the relationship may be due to chance. Not the strength of the relationship
Almost unheard of to have a strong relationship that is insignificant when using survey data.
So, don’t spend any time discussing significance.
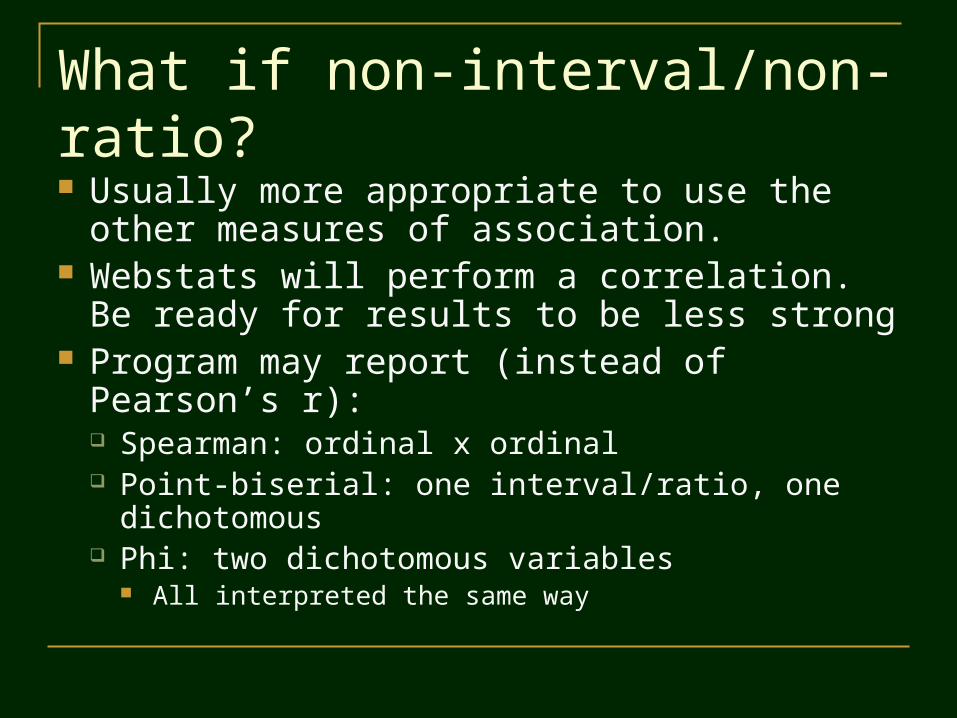
What if non-interval/non-ratio? Usually more appropriate to use the other
measures of association. Webstats will perform a correlation. Be ready
for results to be less strong Program may report (instead of Pearson’s r):
Spearman: ordinal x ordinal Point-biserial: one interval/ratio, one dichotomous Phi: two dichotomous variables
All interpreted the same way


![Ernest Renan - Life of Jesus [1897]](https://img.pdfslide.us/doc/110x75/577cbccf1a28aba7118dc8d3/ernest-renan-life-of-jesus-1897.jpg)