Embed Size (px)
Citation preview
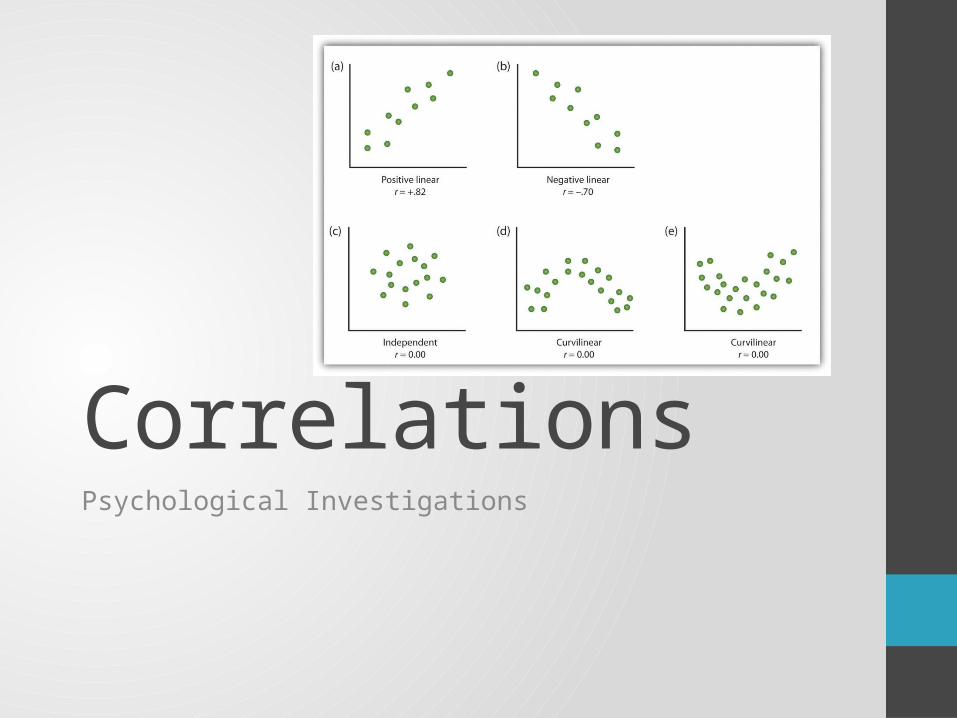
CorrelationsPsychological Investigations
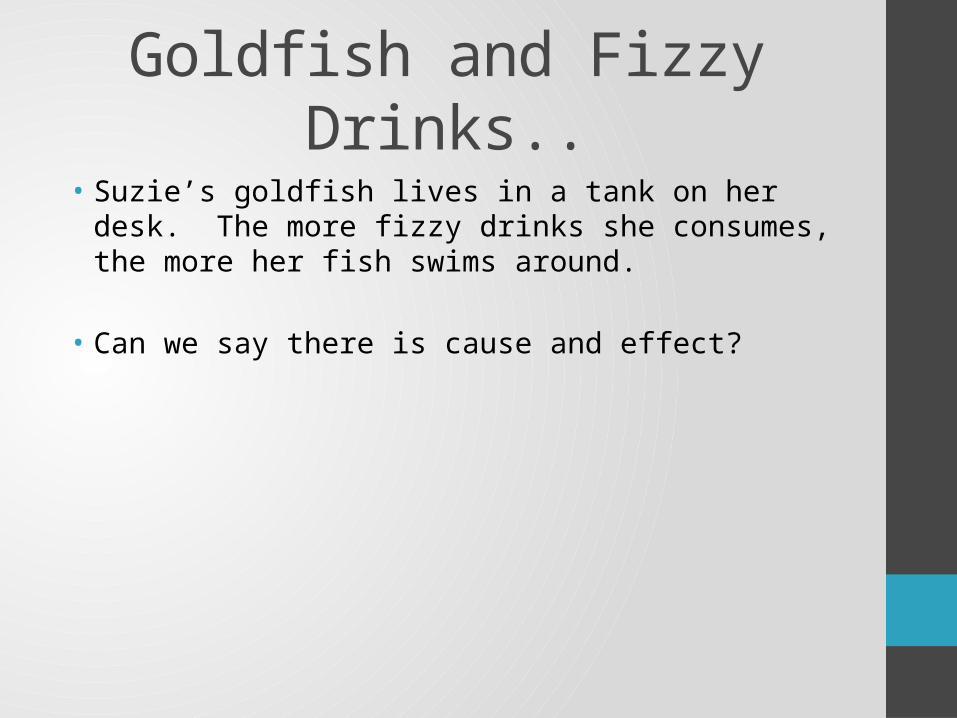
• Suzie’s goldfish lives in a tank on her desk. The more fizzy drinks she consumes, the more her fish swims around.
• Can we say there is cause and effect?
Goldfish and Fizzy Drinks..
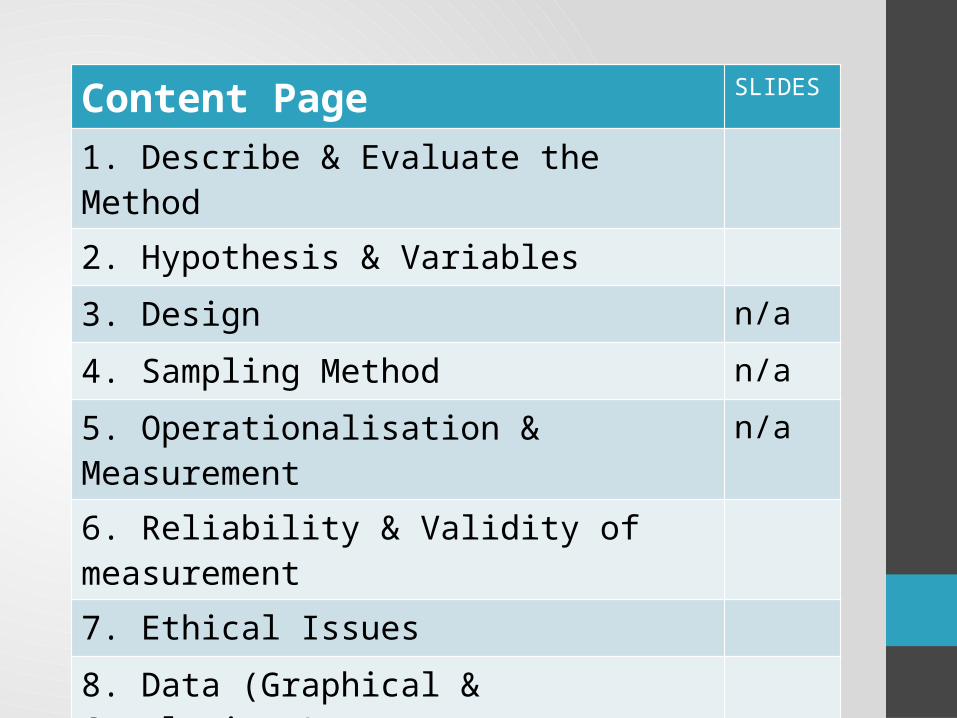
Content Page SLIDES
1. Describe & Evaluate the Method
2. Hypothesis & Variables
3. Design n/a
4. Sampling Method n/a
5. Operationalisation & Measurement n/a
6. Reliability & Validity of measurement
7. Ethical Issues
8. Data (Graphical & Conclusions)
9. How would improve…?
10. Writing a Procedure
1. Description & Evaluation
Correlations
What is a correlation?
Strengths and Weaknesses
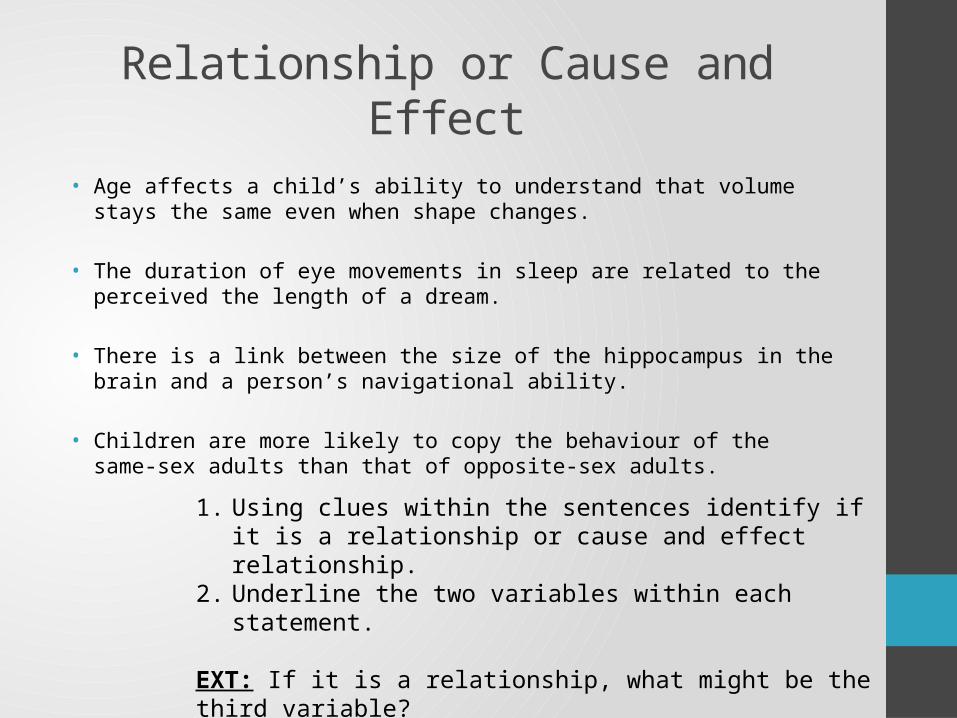
• Age affects a child’s ability to understand that volume stays the same even when shape changes.
• The duration of eye movements in sleep are related to the perceived the length of a dream.
• There is a link between the size of the hippocampus in the brain and a person’s navigational ability.
• Children are more likely to copy the behaviour of the same-sex adults than that of opposite-sex adults.
Relationship or Cause and Effect
1. Using clues within the sentences identify if it is a relationship or cause and effect relationship.
2. Underline the two variables within each statement.
EXT: If it is a relationship, what might be the third variable?
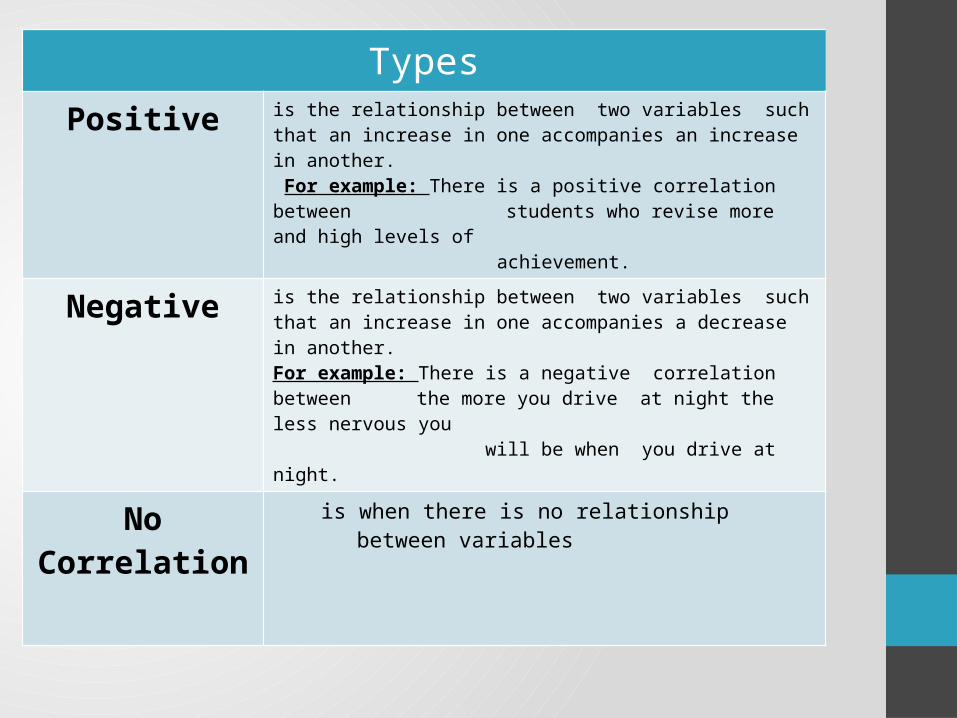
Types
Positive is the relationship between two variables such that an increase in one accompanies an increase in another. For example: There is a positive correlation between
students who revise more and high levels of achievement.
Negative is the relationship between two variables such that an increase in one accompanies a decrease in another.For example: There is a negative correlation between
the more you drive at night the less nervous you will be when you drive at night.
No Correlation is when there is no relationship between variables
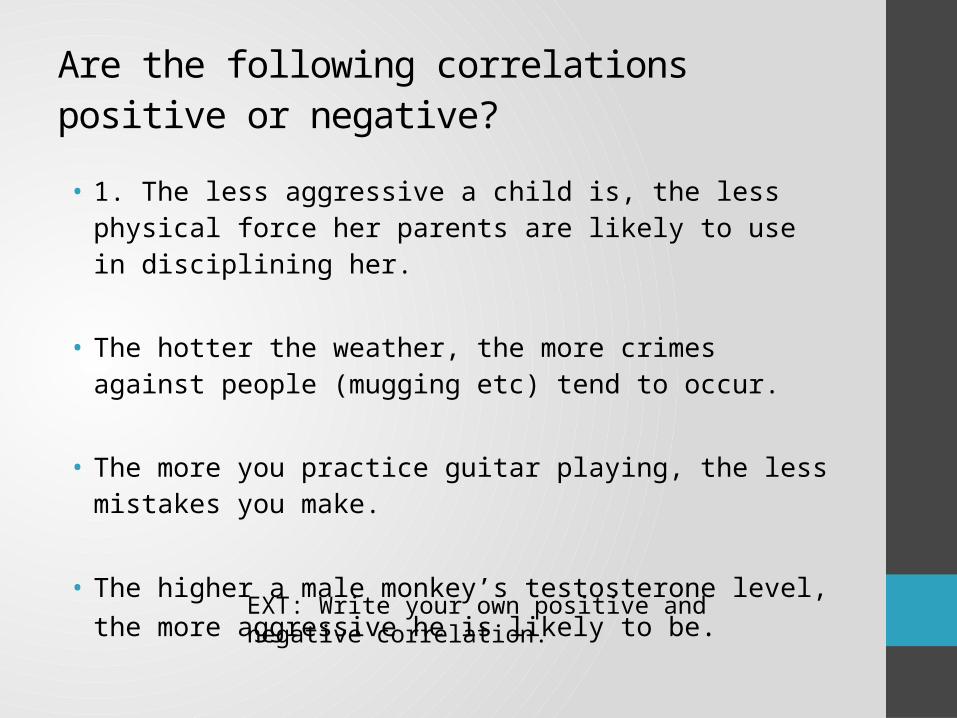
• 1. The less aggressive a child is, the less physical force her parents are likely to use in disciplining her.
• The hotter the weather, the more crimes against people (mugging etc) tend to occur.
• The more you practice guitar playing, the less mistakes you make.
• The higher a male monkey’s testosterone level, the more aggressive he is likely to be.
Are the following correlations positive or negative?
EXT: Write your own positive and negative correlation.
2. Hypothesis
Correlations
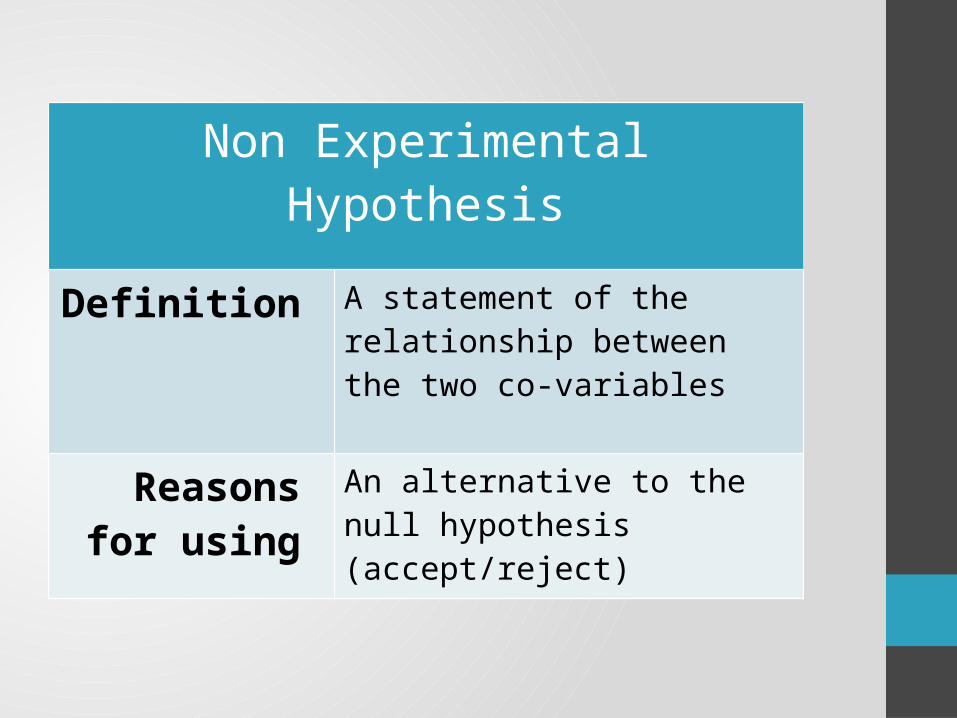
Non Experimental Hypothesis
Definition A statement of the relationship between the two co-variables
Reasons for using
An alternative to the null hypothesis (accept/reject)
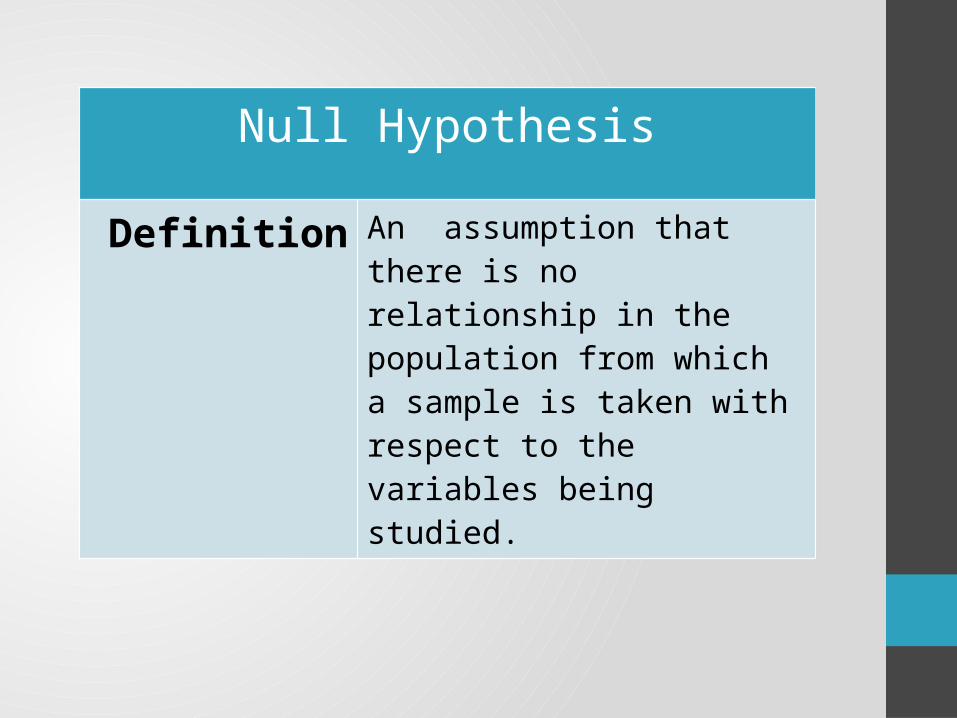
Null Hypothesis
Definition An assumption that there is no relationship in the population from which a sample is taken with respect to the variables being studied.
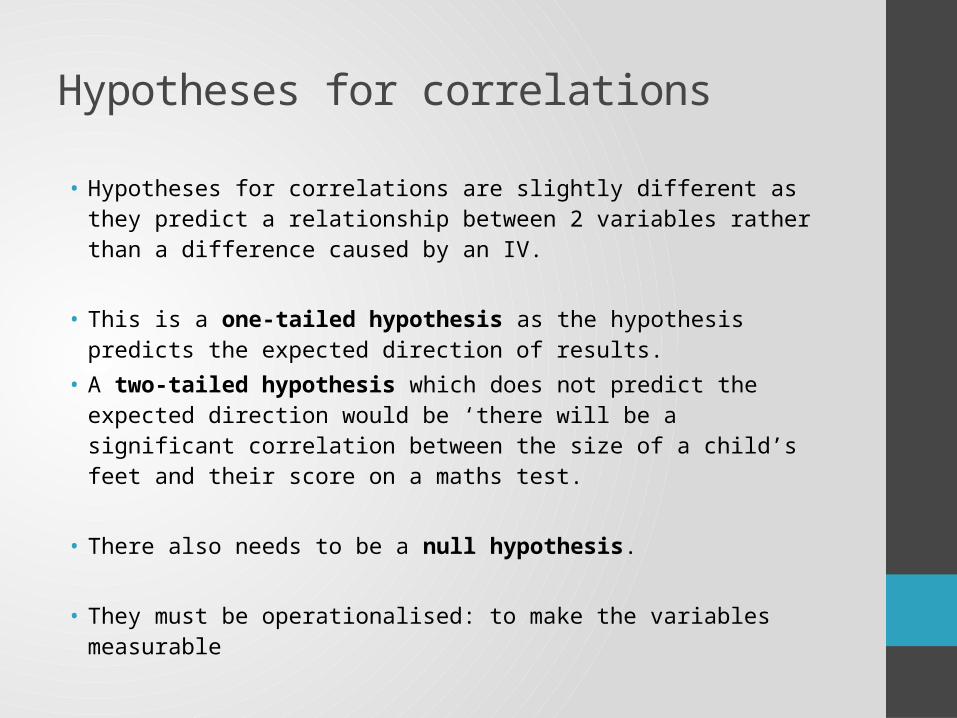
• Hypotheses for correlations are slightly different as they predict a relationship between 2 variables rather than a difference caused by an IV.
• This is a one-tailed hypothesis as the hypothesis predicts the expected direction of results.
• A two-tailed hypothesis which does not predict the expected direction would be ‘there will be a significant correlation between the size of a child’s feet and their score on a maths test.
• There also needs to be a null hypothesis.
• They must be operationalised: to make the variables measurable
Hypotheses for correlations
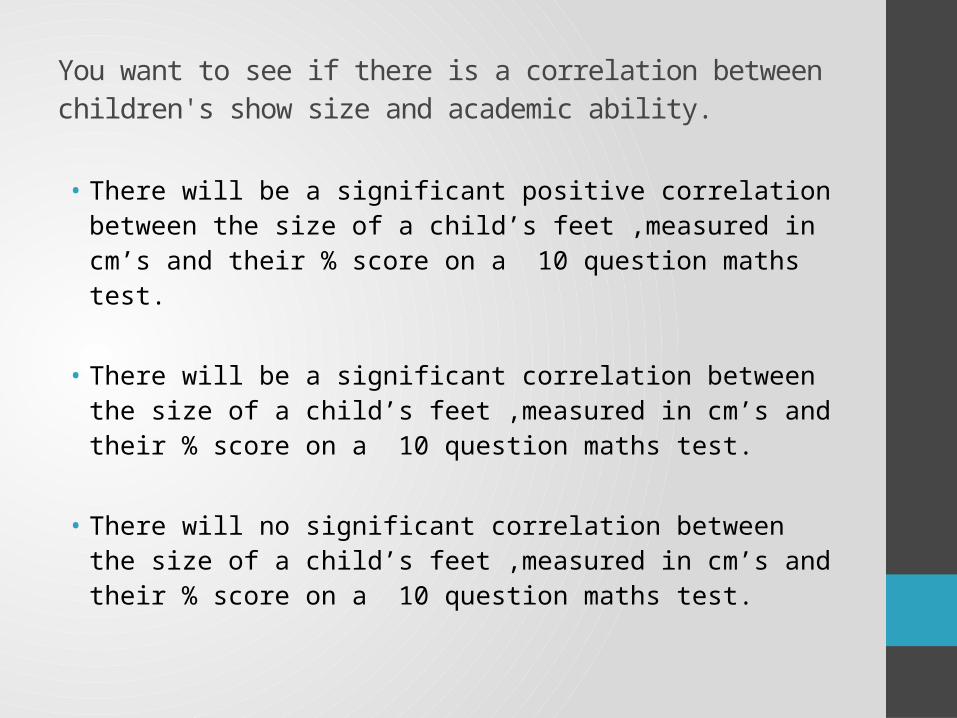
You want to see if there is a correlation between children's show size and academic ability.
• There will be a significant positive correlation between the size of a child’s feet ,measured in cm’s and their % score on a 10 question maths test.
• There will be a significant correlation between the size of a child’s feet ,measured in cm’s and their % score on a 10 question maths test.
• There will no significant correlation between the size of a child’s feet ,measured in cm’s and their % score on a 10 question maths test.
• Write an operationalised correlational hypothesis and a null hypothesis for an investigation into cognitive ability and alertness
• Correlational Hypothesis:
• Null Hypothesis:
Hypotheses for correlations
• Write an operationalised correlational hypothesis and a null hypothesis for an investigation into amount of sunshine and ice-creams sold
• Correlational Hypothesis:
• Null Hypothesis:
Hypotheses for correlations
Let’s go back to the correlation we conducted last lesson and construct a:
• One tailed hypothesis
• Two tailed hypothesis
• Null hypothesis

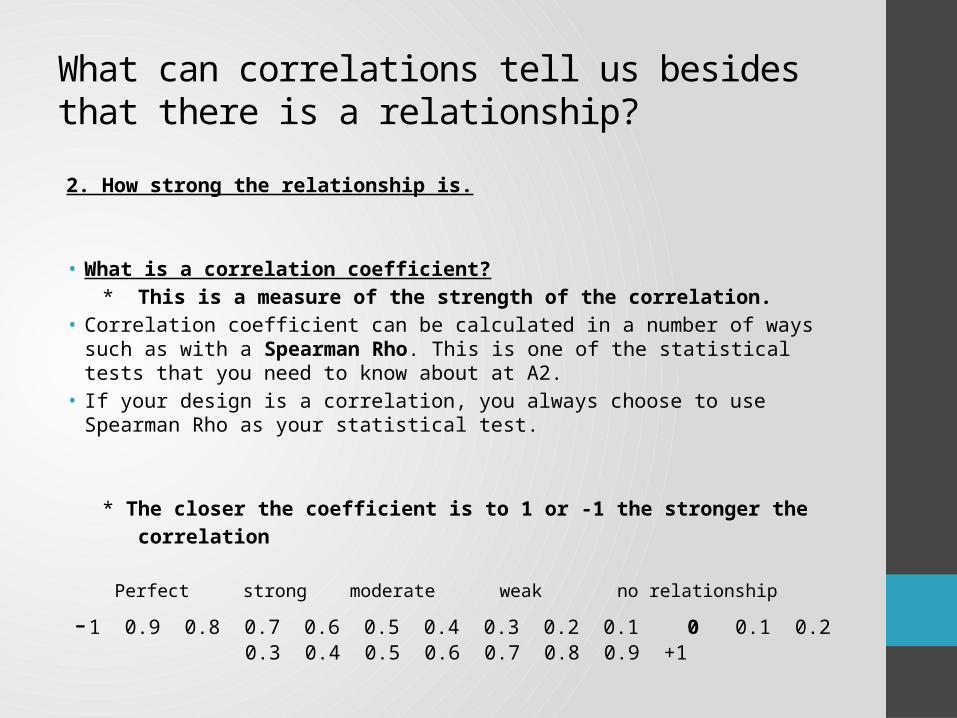
2. How strong the relationship is.
• What is a correlation coefficient? * This is a measure of the strength of the correlation.• Correlation coefficient can be calculated in a number of ways such as
with a Spearman Rho. This is one of the statistical tests that you need to know about at A2.
• If your design is a correlation, you always choose to use Spearman Rho as your statistical test.
* The closer the coefficient is to 1 or -1 the stronger the correlation
Perfect strong moderate weak no relationship
-1 0.9 0.8 0.7 0.6 0.5 0.4 0.3 0.2 0.1 0 0.1 0.2 0.3 0.4 0.5 0.6 0.7 0.8 0.9 +1
What can correlations tell us besides that there is a relationship?
6. Reliability & Validity of Measurement
• Evaluate/Assess
• How could you assess
• How could you improve
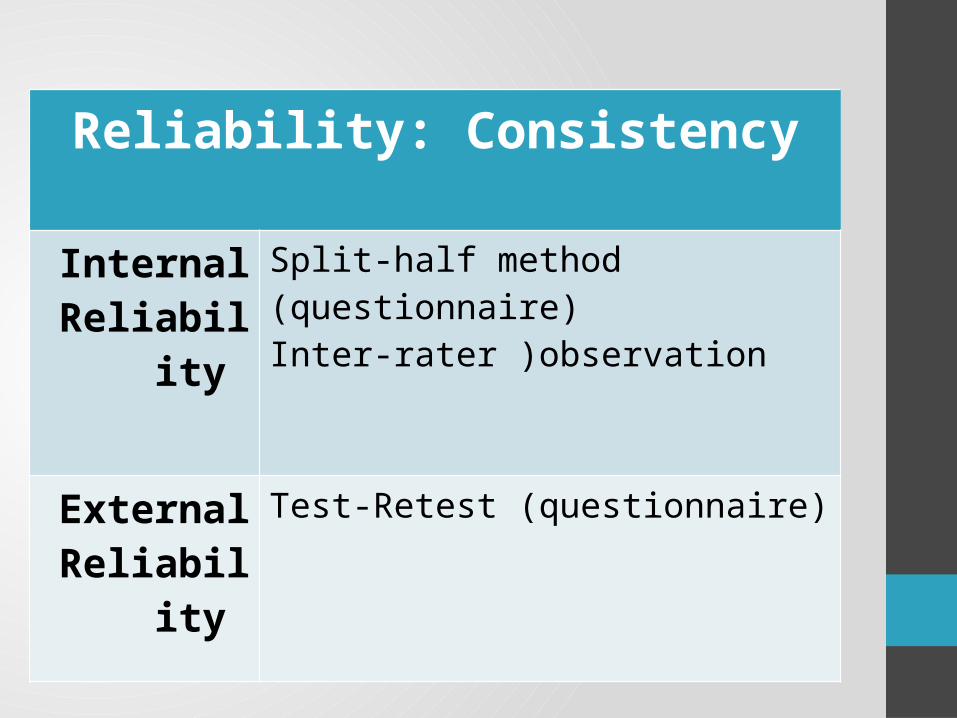
Reliability: Consistency
Internal Reliability
Split-half method (questionnaire)Inter-rater )observation
External Reliability
Test-Retest (questionnaire)
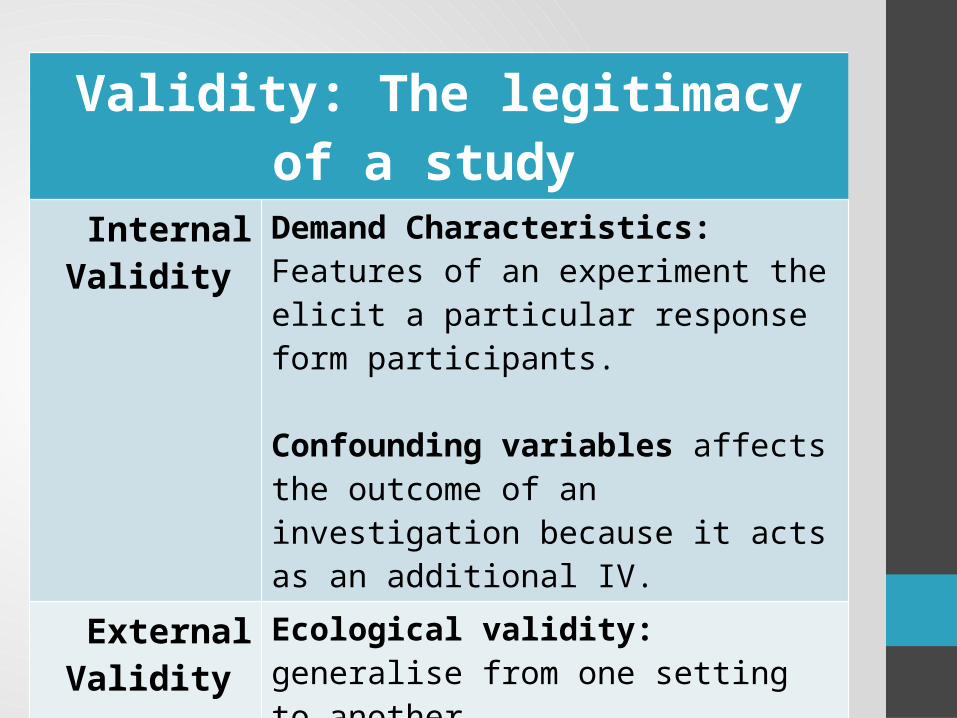
Validity: The legitimacy of a study
Internal Validity
Demand Characteristics: Features of an experiment the elicit a particular response form participants.
Confounding variables affects the outcome of an investigation because it acts as an additional IV.
External Validity
Ecological validity: generalise from one setting to another
Population validity: generalise from one group of people to everyone
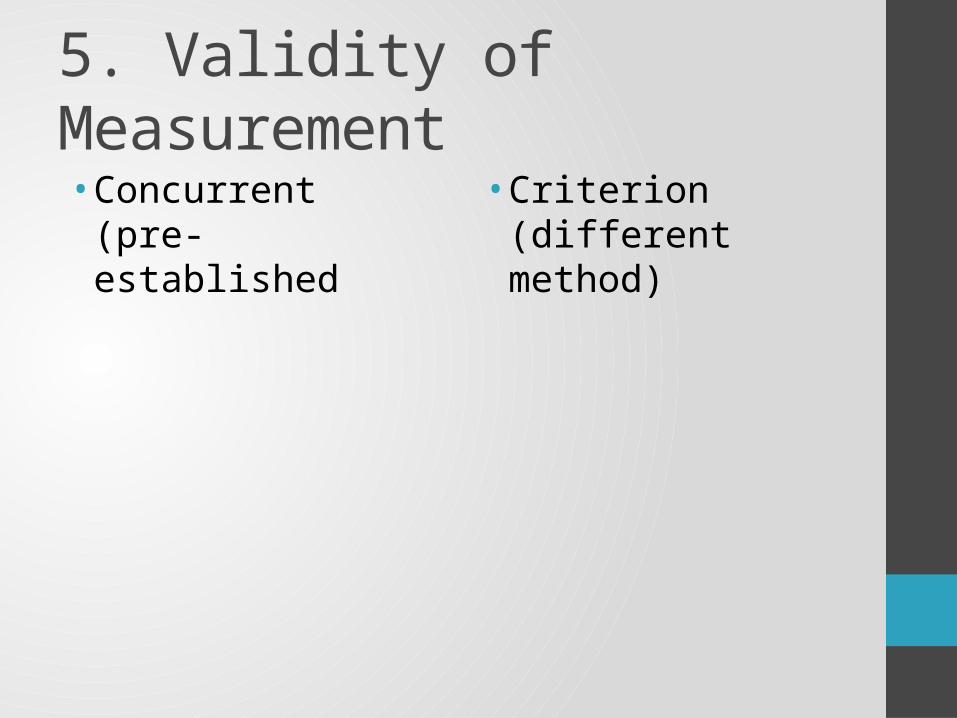
5. Validity of Measurement • Concurrent (pre-
established• Criterion (different
method)
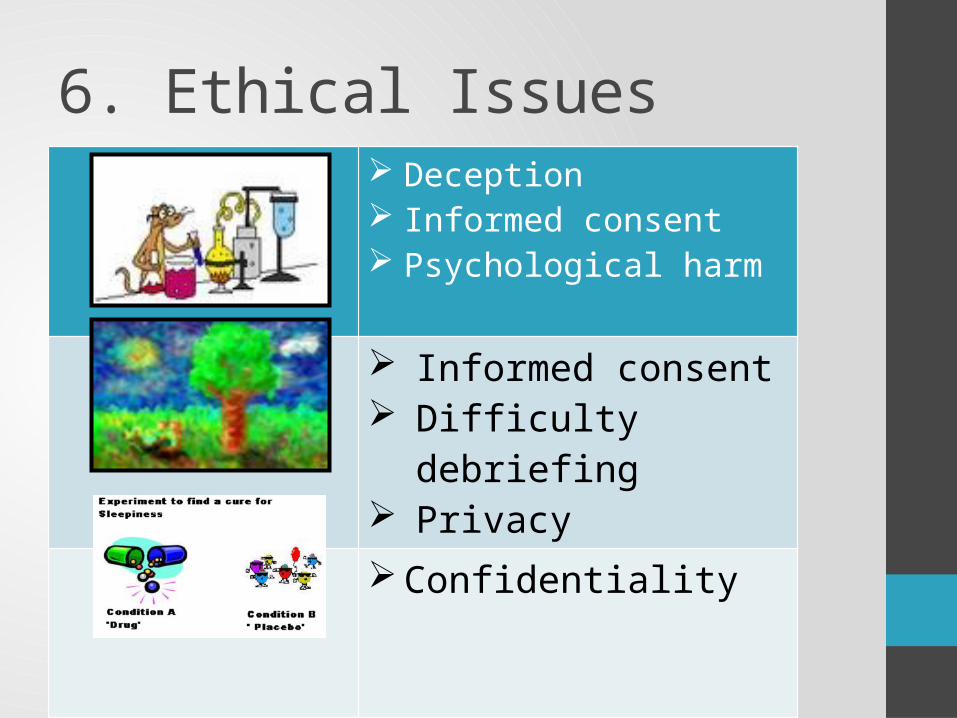
6. Ethical Issues Deception Informed consent Psychological harm
Informed consent Difficulty debriefing Privacy
Confidentiality
7. Data
2. How strong the relationship is.
• What is a correlation coefficient? * This is a measure of the strength of the correlation.• Correlation coefficient can be calculated in a number of ways such as
with a Spearman Rho. This is one of the statistical tests that you need to know about at A2.
• If your design is a correlation, you always choose to use Spearman Rho as your statistical test.
* The closer the coefficient is to 1 or -1 the stronger the correlation
Perfect strong moderate weak no relationship
-1 0.9 0.8 0.7 0.6 0.5 0.4 0.3 0.2 0.1 0 0.1 0.2 0.3 0.4 0.5 0.6 0.7 0.8 0.9 +1
What can correlations tell us besides that there is a relationship?
• Correlational analysis always involves quantitative data.
• When carrying out correlational analysis the data is summarised by presenting the data in a scattergram (or scattergraph). A scattergraph is a graph that shows the correlation between two sets of data (or co-variables) by plotting dots to represent each pair of scores. For each individual we obtain a score for each co-variable.
• It is important that the scattergram has a title and both axes are labelled. From the scattergram we may be able to say whether there is a strong positive correlation, a weak positive correlation, no correlation, a weak negative correlation or a strong negative correlation but we can not make a conclusion about the hypothesis.
Scatter Graphs
Parts of a Scatter graph
• Draw scatter graphs for the following:• Positive correlation
• Negative correlation
• No correlation
Scatter Graphs
How do the following Scatter graphs look?+1 Correlation
0.5 Correlation
-1.0
• Today we are going to test out whether there is a relationship between the number of hours you sleep and the amount of energy you have.
• Before we start what are the key words in the above statement?
Let’s try one….
EXT: What type of correlation would you expect?
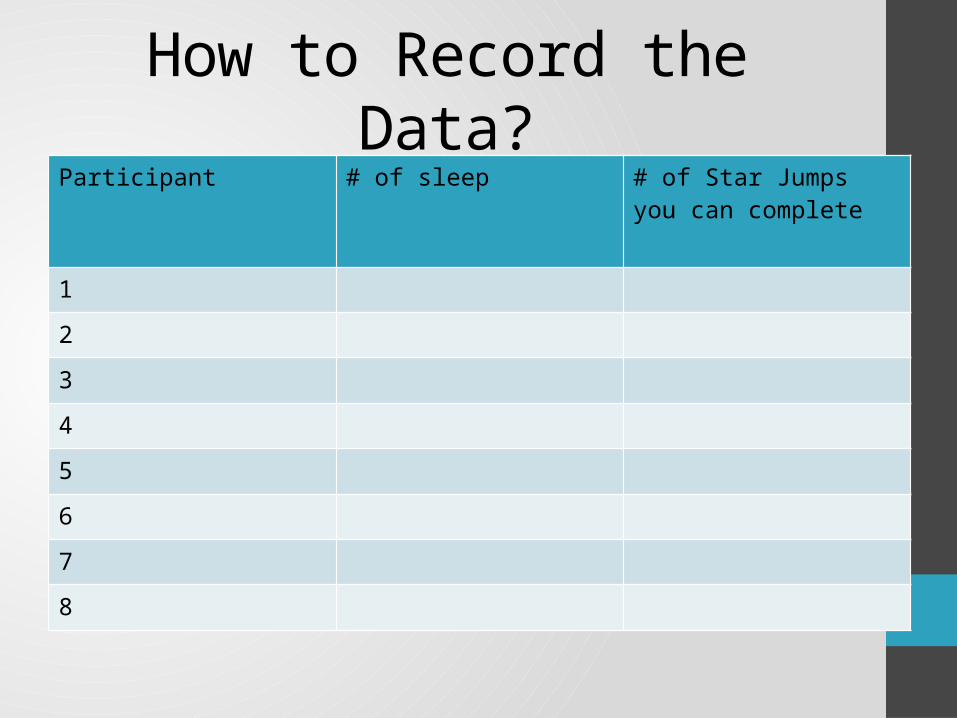
Participant # of sleep # of Star Jumps you can complete
1
2
3
4
5
6
7
8
How to Record the Data?
Let’s Display our Data
8. How would you improve • Validity • Reliability • Ethics
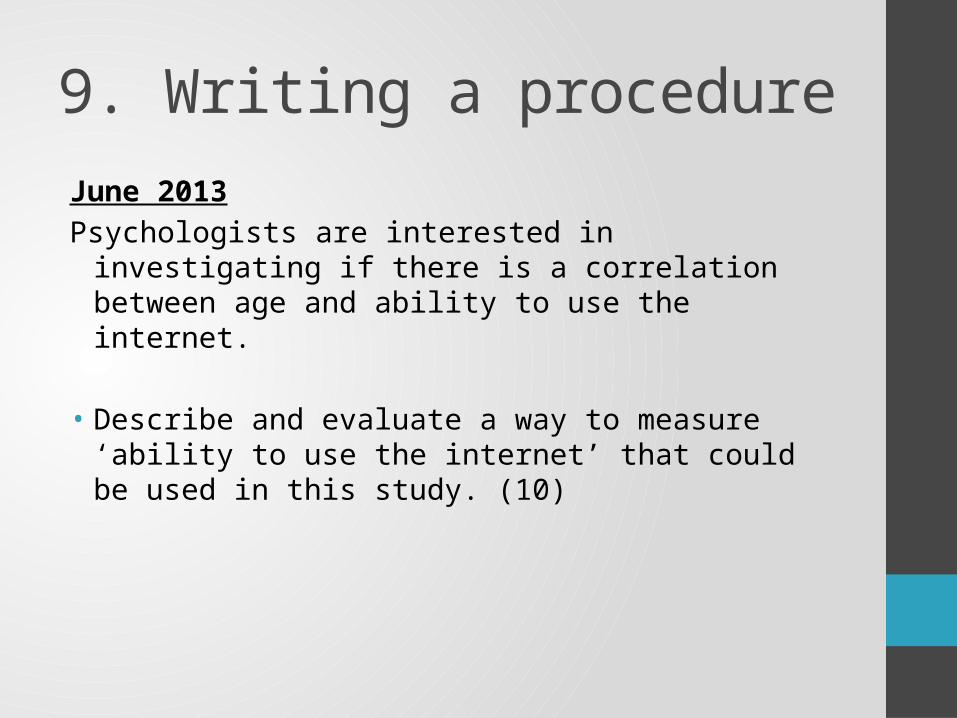
9. Writing a procedure
June 2013Psychologists are interested in investigating if there is a
correlation between age and ability to use the internet.
• Describe and evaluate a way to measure ‘ability to use the internet’ that could be used in this study. (10)