Embed Size (px)
Citation preview
Applied Energy 52 (1995) 55~4 Elsevier Science Limited Printed in Great Britain
0306-2619/95/$9.50 ELSEVIER 0 3 0 6 - 2 6 1 9 ( 9 5 ) 0 0 0 1 5 - 1
Correlations for the Estimation of Hourly Global Solar Radiation
S. K. Srivastava, O. P. Singh & G. N. Pandey
Department of Applied Sciences, Energy Laboratory, Institute of Engineering and Technology, Lucknow 226020, India
A B S T R A C T
Empirical correlations for estimating the ratios of monthly mean hourly to daily global solar radiation received on horizontal surfaces have been compared and their validities tested. The correlation of Collares-Pereira and Rabl [Solar Energy, 22, (1979) 155] yields the best results, while the correlations of Liu and Jordan [Solar Energy, 4 (1960) 19], and Garg and Garg [Solar & Wind Technology 4 (1987) 113] give satisfactory values. Calculated ratios show small deviations from observed ratios around the solar noon. Measured ratios are generally lower than the calculated ratios in the morning and evening hours, while the reverse is observed for the hours around the solar noon.
INTRODUCTION
Solar energy systems require detailed information concerning the avail- ability of solar radiation. The total amount of solar energy depends upon the season of the year and sky conditions during day time. The perfor- mance calculations of solar energy systems are sometimes carried out on an hourly basis. To make such performance calculations for a system, it is necessary to have an idea of the hourly values of the radiation. Using monthly average data from a number of stations, statistical studies of the time distribution of the total radiation on horizontal surfaces through the day have led to generalized charts of the ratio of hourly total (/) to daily total (H) radiation on a horizontal surface, represented hereafter as r, a function of day length and the hour in question. Such studies were made by Whillier, 1,2 Hottel and Whillier 3 and Liu and Jordan. 4 The hours are designated by the time at the midpoint of the hour, and days are
55
56 S. K. Srivastava, O. P. Singh, G. N. Pandey
considered to be symmetrical about the solar noon. According to Whillier, 1 this process can be used for individual clear days. Bensman 5 suggested that it is adequate for individual days, with the best results being obtained for clear days and increasingly uncertain results as the daily total radiation decreases. For lack of a better alternative, it is applied to individual days. The objective of the present study is to compare the measured and calculated values of monthly mean ratios of hourly to daily global solar radiation on a horizontal surface. Three correlations have beenused to calculate the ratios of hourly to daily global solar radi- ations on a horizontal surface and a comparative study has been made to test the suitability of the correlations.
EXPERIMENTAL SET-UP
Measurements of the global solar radiation on a horizontal surface were made at Lucknow (latitude 26.75°N; longitude 80.50°E, altitude 120 m above sea level) using a precision pyranometer (No. 0317) manufactured by National Instruments Limited, (Calcutta, India), having a calibration factor 5.50 mV/Cal cm 2 min. The pyranometer used consists of a thin blackened surface, supported inside a relatively massive well-polished case. When exposed to solar radiation, the blackened surface rises in tempera- ture until its rate of loss of heat by all causes equals the rate of gain of heat by radiation. This rise of temperature sets up a thermal electromotive force which is measured on a recording millivoltmeter. The potentiometric chart recorder, used to record the output of the pyranometer, has a range of 0-10 mV, a chartwidth of 160 mm, and a normal chart speed of 20 mm/h.
Measured data of global solar radiation on a horizontal surface have been taken from October 1989 to September 1991. The hourly data val- ues as well as the daily total values of the radiation are computed from the record obtained from the potentiometric chart recorder. The observa- tion site has no obstacle obscuring the pyranometer sensor from the incoming radiation.
CORRELATIONS TO ESTIMATE THE HOURLY RADIATION ON A HORIZONTAL SURFACE
Correlation of Liu and Jordan
Liu and Jordan 6 proposed the following correlation to estimate the monthly mean hourly global radiation on a horizontal surface from the
Hourly global solar radiation 57
monthly mean daily radiation on a horizontal surface:
monthly mean hourly radiation on horizontal surface r - - -
monthly mean daily radiation on horizontal surface
(~r / 24) (cos W - cos Ws)
sin Ws - (21rW s / 360) cos W~
where W is the hour angle in degrees for the midpoint of the hour for which the calculation is to be made and Ws is the sunset hour angle.
Correlation of Collares-Pereira and Rabl
Collares-Pereira and Rabl 7 verified Liu and Jordan's work by using the curves of r and proposed the following correlation to estimate the monthly mean global hourly radiation values on a horizontal surface:
(1r / 24) (cos W - cos Ws) r = (a+b cos/4/)
sin Ws - (27rWs / 360) cos W~
where the coefficients a and b are defined as:
a = 0.409 + 0.5016 sin(W~-60) b = 0.6609 - 0.4767 sin(W~-60)
Correlation of Garg and Garg
Garg and Garg 8 checked the adequacy of the Liu and Jordan correlation to estimate the hourly horizontal global radiation for various Indian sta- tions and showed that the correlation is not suitable for determining the monthly mean hourly global radiation on a horizontal surface from the monthly mean daily radiation on a horizontal surface. Therefore they proposed the following new correlation:
(zr/24) (cos W - cos Ws) r = - 0-008 sin3(W-0.65)
sinW s - (2zrW s / 360) cosWs
RESULTS AND DISCUSSION
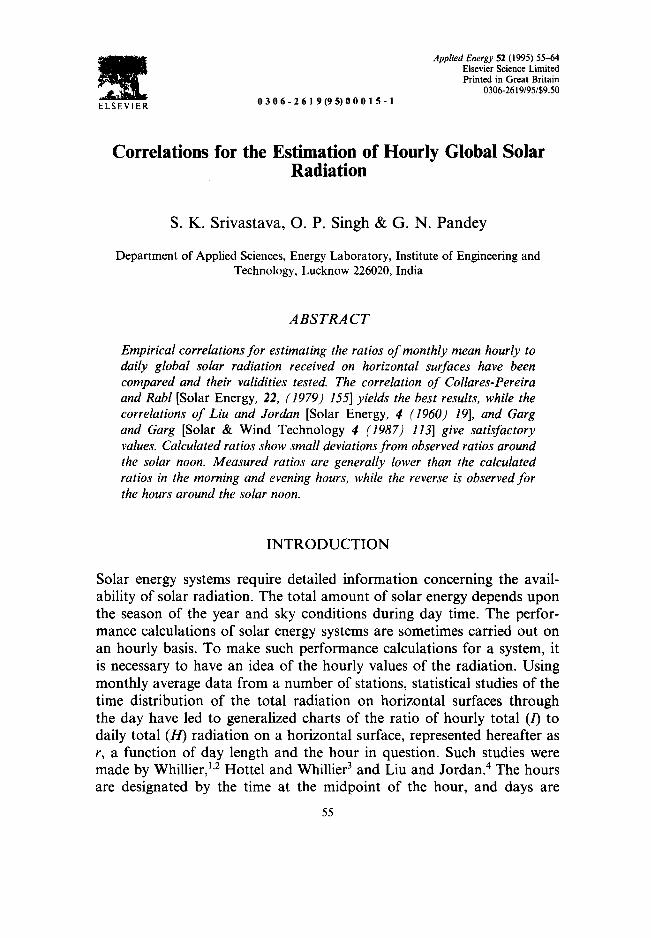
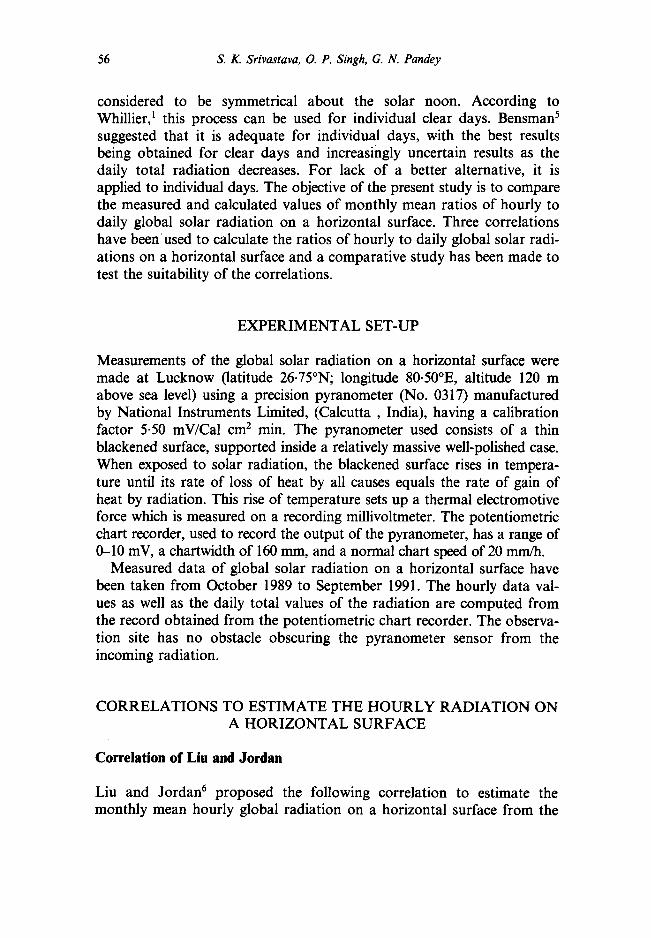
Three different correlations have been used to calculate the ratio of the monthly mean hourly to daily radiation on a horizontal surface and have been compared with the experimental values. The results thus obtained for all the months are presented in Figs 1-12. It may be observed that the correlation of Callares-Pereira and Rabl yields the best results.
58 S. K. Srivastava, O. P. Singh, G. iV. Pandey
The correlations of Liu and Jordan, and Garg and Garg also give satisfac- tory results. The Collares-Pereira and Rabl correlation predicts better results than the correlation of Garg and Garg, which has been developed using data
Fig. 1.
Fig. 2.
0.16
0.14
"~ 0.12
O.lO
~0.08
~,~° 0.06
N o.114
g 0.02
0.110
,,o.th J..a
! ~ - - i ~ u l g ~ : G ] i reira & Rab.
I I I l I I I I I I I 06.00 07.00 08.00 09.00 10.00 11.00 12.00 13.00 14.00 15.00 16.00 17.00
Comparison
Time (hours)
of measured and evaluated values (hourly/daily) global radiation.
of monthly mean
0.16 l 0
~ 0.14
~ 0.12 - .
• :,
~, ~ ira & Rabl x
i 0.02 -
O.OC t l i I l, I I I l I "~ ~0 06.00 07.00 08.00 09,00 I.O.O0 ll.O0 12.00 13.00 14,00 15.00 16.00 17.00
Time ( h o u r s )
Comparison of measured and evaluated values of monthly mean (hourly/daily) global radiation.
Hourly global solar radiation 59
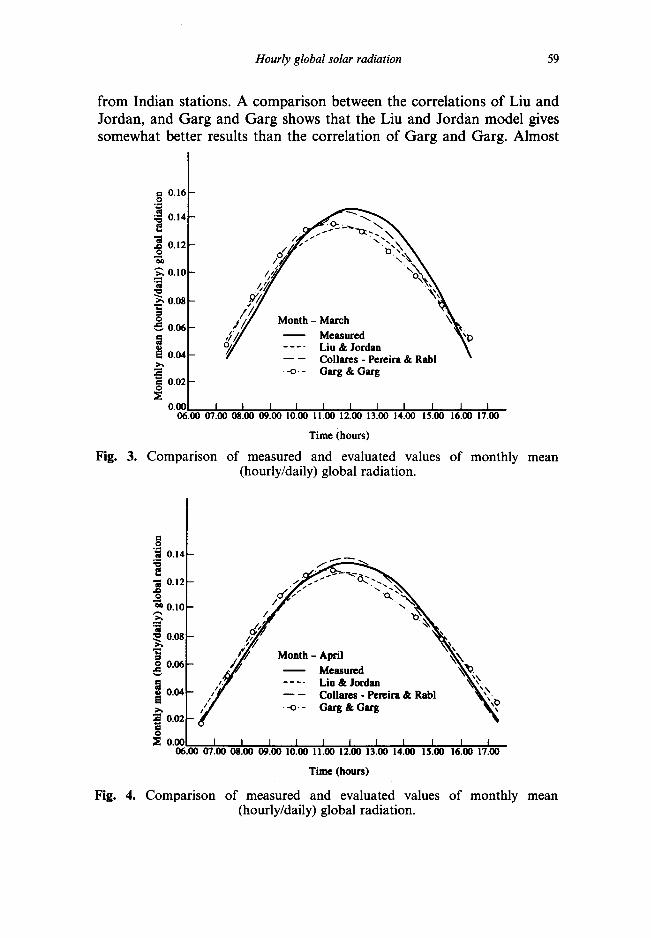
from Indian stations. A comparison between the correlations of Liu and Jordan, and Garg and Garg shows that the Liu and Jordan model gives somewhat better results than the correlation of Garg and Garg. Almost
: 0.16 0
;~ 0.14
~ 0.12 0
~ 0.10
~ O.OS 0 ~ o.o6
~ 0.04
~ o.o2 0
0 . ~
, / / / Measured ~b
O / __-- ~ :areJOr.d;nreira & Rab ' • - o - G a r g & G a r g
I I I I I I I l I l I 06.00 07.00 08.00 09.00 10.00 11.00 12.00 13.00 14.00 15.00 16.00 17.00
Time (hours)
Fig. 3. Comparison of measured and evaluated values of monthly mean (hourly/daily) global radiation.
Fig. 4.
.o 0.14
'~ 0.12 O
Ii O.IO a
~0.08
~ 0.06
~ O.IN
"~ O.O2
0
• o.~
: . . . . . . . \
I I I I I I I I I I I 06.00 07.00 08.00 09.00 10.00 11.00 12.00 13.00 14.00 15.00 16.00 17.00
Time (hours)
Comparison of measured and evaluated values of monthly mean (hourly/daily) global radiation.
60 S. K. Srivastava, O. P. Singh, G. N. Pandey
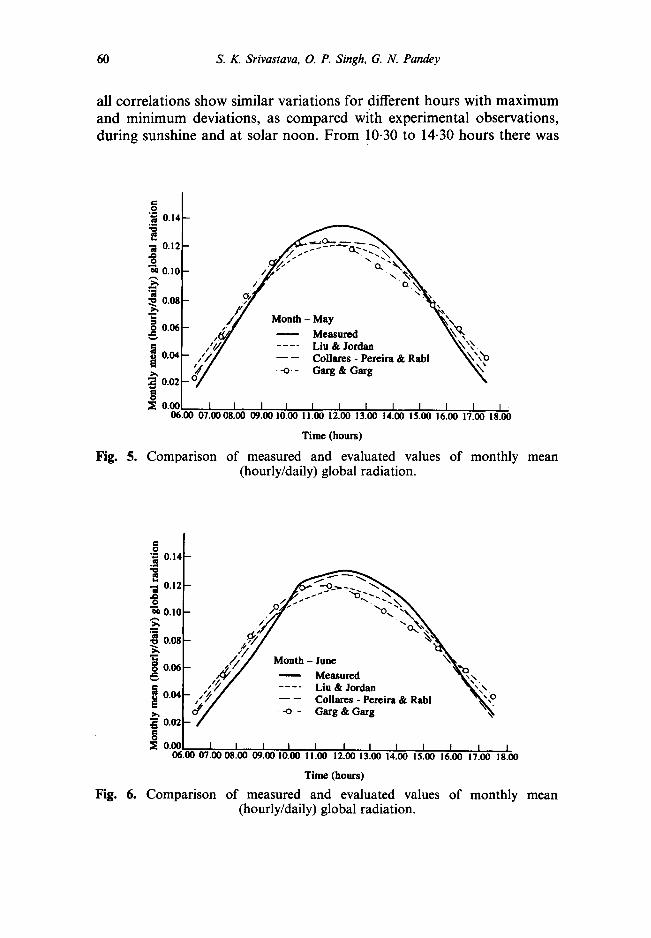
all correlations show similar variations for different hours with maximum and minimum deviations, as compared with experimental observations, during sunshine and at solar noon. From 10.30 to 14.30 hours there was
C 0 "~ 0.14
.~ 0.12
_0.10
~ 0.08 t ~
g 0.0e
0.04
.~ 0.02 0
b
/ ~ ' / . . . . Liu & Jordan ' ~ , x / / / - ' - -- Collm~s - Pcrcira & Rabl ~ , .Xo
o~" .--o.- G~.~ ~g "~
'~ 0.00 l I I l I I I l I I I I -
06.00 07.0008.00 09.0010.00 11.00 12.00 13.00 14.00 15.00 16.00 17.00 18.00
Time ( h o u r s )
Fig. 5. Comparison of measured and evaluated values of monthly mean (hourly/daily) global radiation.
O
"~ 0.14
N 0.12
~ 0.10 _a ~., 0.08
g o.~
g o.o4
~ 0.02 g ~ o .~
Month ,ono \
" ~ ~ - ~ - - C G ° i ~ G ' ~ g "reira & Rab'
I I I t I I I I I I I I 06.00 07.0008.00 09.00 10.00 11.00 12.00 13.00 14.00 15.00 16.00 17.00 18.00
Time ( h o u r s )
Fig. 6. Comparison of measured and evaluated values (hourly/daily) global radiation.
of monthly mean
Hourly global solar radiation 61
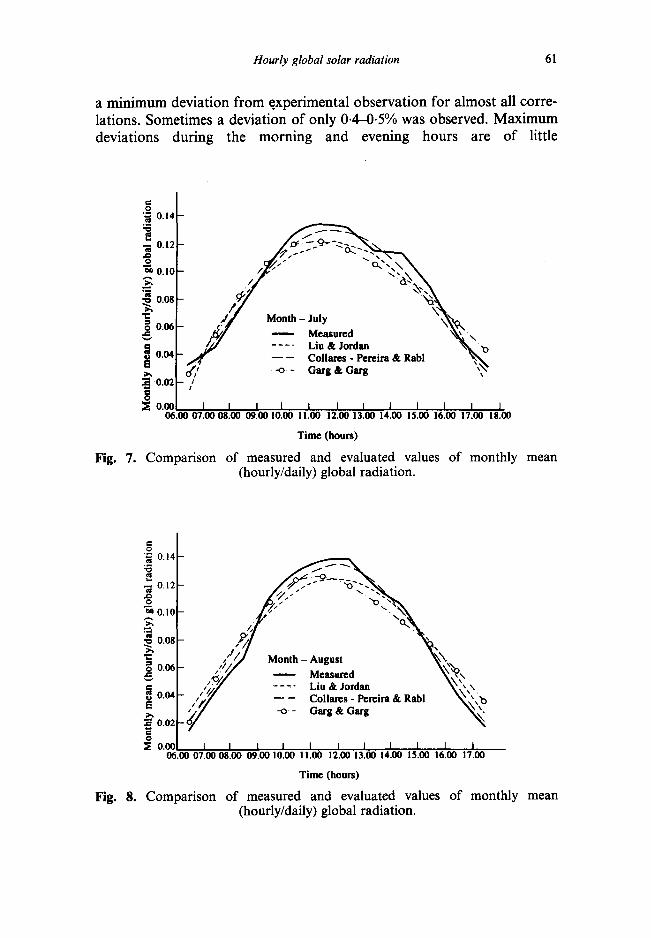
a minimum deviation from e.xperimental observation for almost all corre- lations. Sometimes a deviation of only 0.4-0-5% was observed. Maximum deviations during the morning and evening hours are of little
Fig. 7.
t- O "~ 0.14
• ~ 0.12 _e ~ 0.11
~ 0.01
I o . o 4 i ra & R a b l
'~' 0 . 0 2 ,'
0 0 . 0 0 I I I 1 I I I t I I I I 06.00 0 7 . 0 0 0 8 . 0 0 0 9 . 0 0 10 .00 1 1 .0 0 12 .00 13 .00 14 .00 15 .00 16 .00 17 .00 18 .00
Time ( h o u r s )
Comparison of measured and evaluated values of monthly mean (hourly/daily) global radiation.
Fig. .
"~ 0.14
- - 0.12 O
~0.10 a ~ 0 . 0 8
~ 0.06
~O.(N
0.02 O
o.oo
/ / / J Month - August ~ \
i ~'~-" ii?~:rda~Pgteira & Rabl ~
I I I I I I 1 I I 1 I 06.00 07.0008.00 09.0010.00 11.00 12.00 13.00 14.00 15.00 16.00 17.00 Time (hours)
Comparison of measured and evaluated values of monthly mean (hourly/daily) global radiation.
62 S. K. Srivastava, O. P. Singh, G. N. Pandey
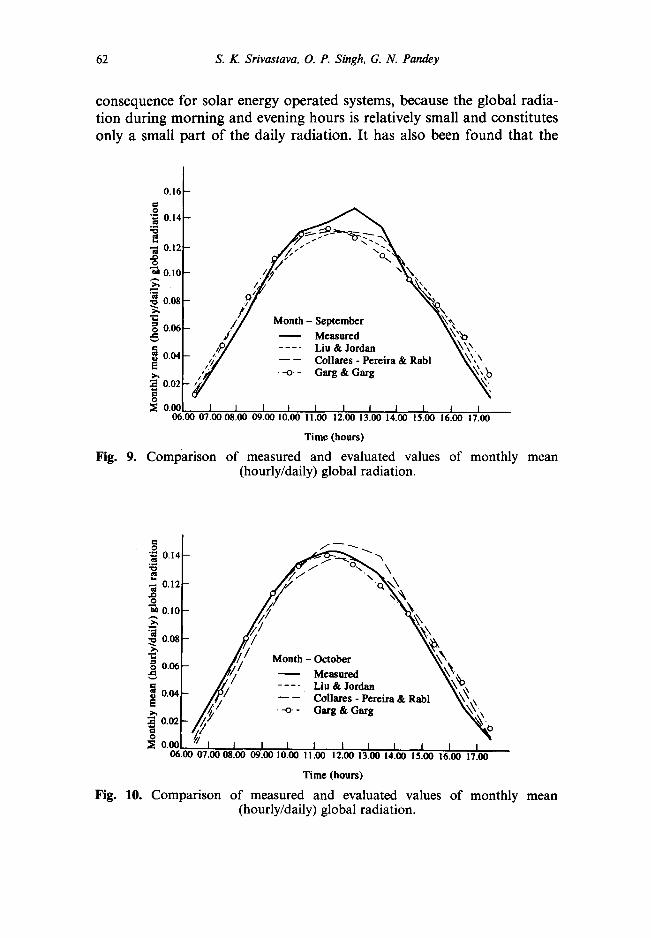
consequence for solar energy operated systems, because the global radia- tion during morning and evening hours is relatively small and constitutes only a small part of the daily radiation. It has also been found that the
= 0.16~
0.14
-~ o.12
~ O.lO a 0.08
~0.06 e~
N 0.1N
0.02 O
0.00 I I I I I I I I I I I 06.00 07.00 08.00 09.00 10.00 11.00 12.00 13.00 14.00 15.00 16.00 17.00
Time (hours)
F i g . 9. C o m p a r i s o n o f m e a s u r e d a n d e v a l u a t e d v a l u e s o f m o n t h l y m e a n (hourly/daily) global radiat ion.
~ o.14- ~ ' ~ -., ,= E / ~,,.xN \ 0Ol / % ¢a es
o tm 0.11
2 g o.0, ,',\
~0.06
~ 0.04
~ 0.02
~ O.00 06.00 07.111108.00 I)9.00111 10.1~ 11.00 12.00 13.00111 14.00111 15.00 16.1111 17.00111
Time (hours) Fig. 10. C o m p a r i s o n o f measured and evaluated values o f mon th ly mean
(hourly/daily) global radiat ion.
Hourly global solar radiation 63
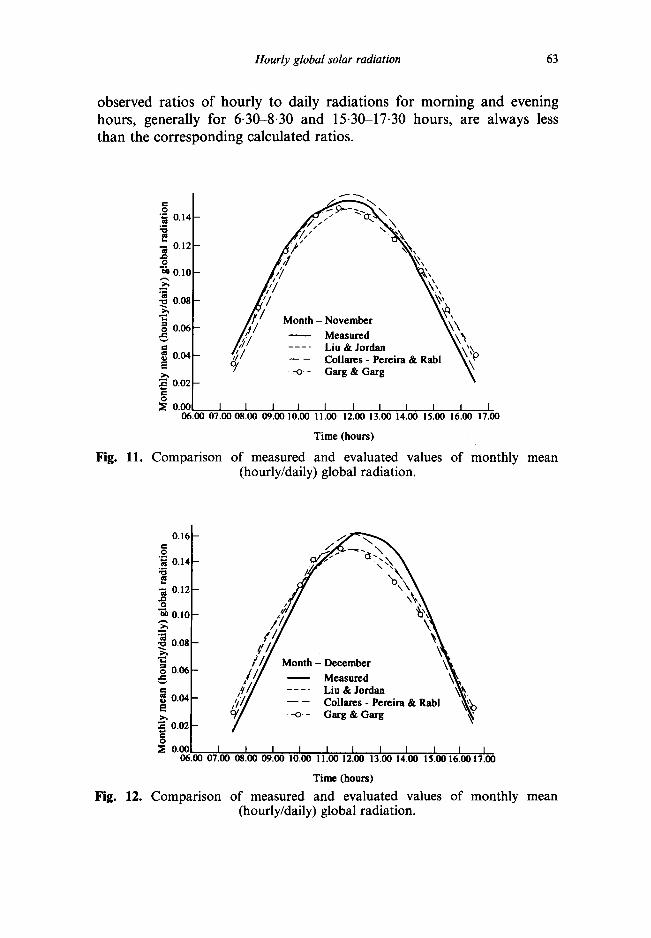
observed ratios of hourly to daily radiations for morning and evening hours, generally for 6-30-8.30 and 15-30-17.30 hours, are always less than the corresponding calculated ratios.
c- o '~ 0.14
- - 0.12 r~ o
" ~ 0 . 1 0
_a ~ 0 . 0 8
~ 0.06
e~ 0.04
0.02 t~ 0
o.oo
f ~
/ / Month- November ~ ~ \
/ ~-o- Garg & Garg
I I I I I I I I I I I 06.00 07.00 08.00 09.00 10.00 11.00 12.00 13.00 14.00 15.00 16.00 17.00
Time (hours)
Fig. 11. Comparison of measured and evaluated values of monthly mean (hourly/daily) global radiation.
O.lq
.2
.~ o.1,
• ~ o.12 0
0 .11
_a ~ 0.0!
~ 0.o6
cl ~ 0.04
~ 0.02 0
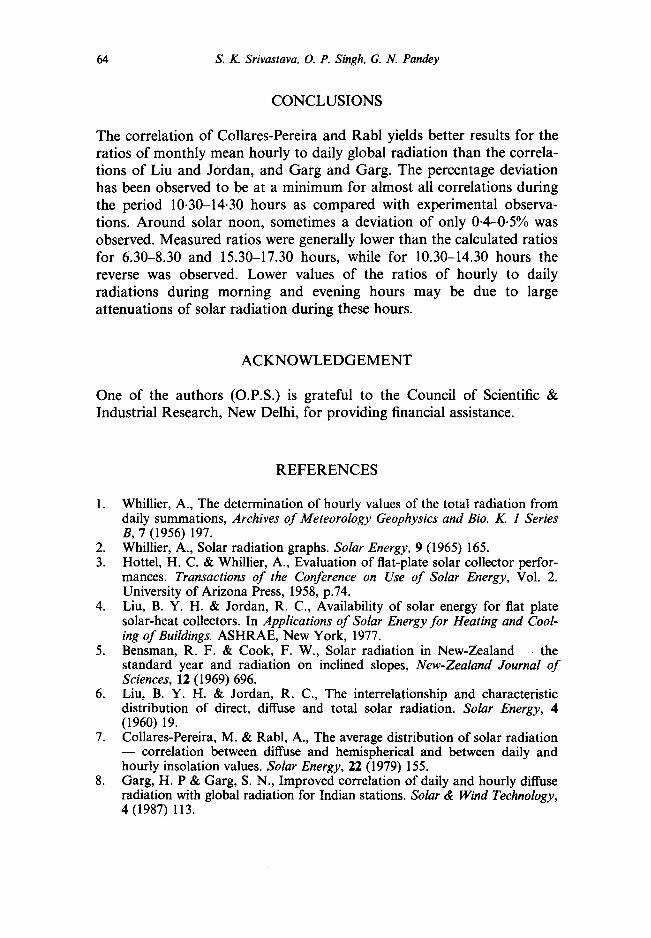
onth-Oecem r i -~3-- C°a~llg~SGP;reira & Rabl " ~ ~"
0 . 0 0 I I I I I I I I I I 06.00 07.00 08.00 09.00 1 0 . 0 0 I I . 0 0 12.00 13.00 14.00 15.0016.0017.00
Time (hours)
Fig. 12. Compar ison of measured and evaluated values of monthly mean (hourly/daily) global radiation.
64 s. K. Srivastava, O. P. Singh, G. N. Pandey
CONCLUSIONS
The correlation of Collares-Pereira and Rabl yields better results for the ratios of monthly mean hourly to daily global radiation than the correla- tions of Liu and Jordan, and Garg and Garg. The percentage deviation has been observed to be at a minimum for almost all correlations during the period 10.30-14.30 hours as compared with experimental observa- tions. Around solar noon, sometimes a deviation of only 0.4-0.5% was observed. Measured ratios were generally lower than the calculated ratios for 6.30-8.30 and 15.30-17.30 hours, while for 10.30-14.30 hours the reverse was observed. Lower values of the ratios of hourly to daily radiations during morning and evening hours may be due to large attenuations of solar radiation during these hours.
A C K N O W L E D G E M E N T
One of the authors (O.P.S.) is grateful to the Council of Scientific & Industrial Research, New Delhi, for providing financial assistance.
REFERENCES
1. Whillier, A., The determination of hourly values of the total radiation from daily summations, Archives of Meteorology Geophysics and Bio. K. 1 Series B, 7 (1956) 197.
2. Whillier, A., Solar radiation graphs. Solar Energy, 9 (1965) 165. 3. Hottel, H. C. & Whillier, A., Evaluation of flat-plate solar collector perfor-
mances. Transactions of the Conference on Use of Solar Energy, Vol. 2. University of Arizona Press, 1958, p.74.
4. Liu, B. Y. H. & Jordan, R. C., Availability of solar energy for flat plate solar-heat collectors. In Applications of Solar Energy for Heating and Cool- ing of Buildings. ASHRAE, New York, 1977.
5. Bensman, R. F. & Cook, F. W., Solar radiation in New-Zealand - - the standard year and radiation on inclined slopes, New-Zealand Journal of Sciences, 12 (1969) 696.
6. Liu, B. Y. H. & Jordan, R. C., The interrelationship and characteristic distribution of direct, diffuse and total solar radiation. Solar Energy, 4 (1960) 19.
7. Collares-Pereira, M. & Rabl, A., The average distribution of solar radiation - - correlation between diffuse and hemispherical and between daily and hourly insolation values. Solar Energy, 22 (1979) 155.
8. Garg, H. P & Garg, S. N., Improved correlation of daily and hourly diffuse radiation with global radiation for Indian stations. Solar & Wind Technology, 4 (1987) 113.