Embed Size (px)
Citation preview

29. PHYSICAL PROPERTIES, SYNTHETIC SEISMOGRAMS, AND SEISMIC REFLECTIONS:CORRELATIONS AT DEEP SEA DRILLING PROJECT SITE 534, BLAKE-BAHAMA BASIN1
Thomas H. Shipley,2 Scripps Institution of Oceanography, University of California, San Diego, La Jolla, California
ABSTRACT
Laboratory measurements on sediment samples and density well logs run at DSDP Site 534 in the Blake-Bahama Ba-sin were used to establish an in situ velocity and density structure. Synthetic seismograms were generated for compari-son to reprocessed seismic reflection data in the vicinity of the Site. Uncertainties in the relative positions of the holeand seismic reflection data, velocity corrections, and the composition of the unrecovered section were evaluated. Inlight of the errors and compressed section, no unique correlation of the seismic reflection data to the drill hole is com-pletely defensible either in this chapter or elsewhere.
The preferred correlation resulting from this exercise is as follows, with the Site 534 report correlation shown inparentheses where different. Horizon ß', 887 m; Horizon ß, 950 m (975 m); Horizon C , 1202 m (1250 m); Horizon C,1268 m (1340 m); Horizon D', 1342 m (1432 m); Horizon D, 1550 m (1552 m).
The major differences in these correlations arise from the use of slightly different velocities and hole location rela-tive to the seismic profiles. The Site 534 report results rely on hole placement on a basement flank, whereas in this chap-ter we locate it within a basement depression still within the uncertainty of the navigation. The Site 534 report also usesdrilling rates, CDP velocity analyses, sonobuoy data, and previous similar drilling correlation methods used at Site 391,along with other geologic considerations in arriving at differing results. Although the correlation method used in this in-vestigation is more objective and the hole location uncertainties better defined, in order to have confidence in anyresults we will require drilling in areas where reflections are either more widely spaced or where we have better verticalvelocity control in the hole.
INTRODUCTION
Some of the first sediments deposited in the newlyformed North Atlantic were sampled in the Blake-Baha-ma Basin at Deep Sea Drilling Site 534 (Fig. 1). BecauseSite 534 was successful in drilling 1666 m to reach mid-dle Callovian sediments overlying volcanic basement, itis destined to be one cornerstone in deciphering the earlyphases of rifting and spreading of the North Atlantic.Extrapolation of the drilling results to the regional geol-ogy of this continental margin will rely on correlationto the established seismic-stratigraphic framework—thepurpose of this investigation.
Rather significant improvements in seismic reflectiondata collection and analysis methods have resulted in acomprehensive deep-sea seismic-stratigraphic frameworkfor this area (Bryan et al., 1980; Buffler et al., 1978;Jansa et al., 1979; Klitgord and Grow, 1980; Sheridan etal., 1974, 1978, 1979, and this volume; Shipley et al.,1978; Shipley and Watkins, 1978; Tucholke, 1979; Tu-cholke and Mountain, 1979). Although we will notdwell on this stratigraphic framework, because it is cov-ered in other chapters in this volume, a brief summaryof the seismic- and lithostratigraphy and age relation-ships will be useful. The basic seismic reflections of re-gional extent so far identified in this area are designatedM, X, A, ß, C (or JO, D (or J?), and J3. At Site 534 wedrilled through the section equivalent to A, ß, C, and D.
28° 20' -
28° 10'-75° 30' -75° 20'
Sheridan, R. E., Gradstein, F. M., et al., Init. Repts. DSDP, 76: Washington (U.S.Govt. Printing Office.
2 Present address: University of Texas, Institute of Geophysics, Austin, Texas.
Figure 1. Chart showing location of DSDP Sites 391 and 534. (Tracksare Lamont-Doherty Geological Observatory [LDGO] 24-channelseismic reflection lines. Thick lines represent portions reprocessedat Scripps Institution of Oceanography [as shown in Figs. 3-5].Dot-dash line is LDGO processed line extending toward Site 391and shown in Fig. 2. The intersections of the track lines are shownat points A, B, and C.)
Horizon Ac (a reflection) has been shown to be relatedto either the shallowest occurrence of cherts or calcare-ous turbidites of the Eocene (Tucholke, 1979; Tucholkeand Mountain, 1979). Along the margin the sedimentaryunit associated with Ac is missing and replaced by a ma-jor erosional unconformity, also marked by a prominentreflection, called Horizon Au. The unconformity be-tween either early Miocene and late Eocene and/or lateEocene and early Maestrichtian rocks at Site 534 is Au;various cherty porcellanites were common near thissame level.
653

T. H. SHIPLEY
Horizon Beta (ß) is another prominent reflection cor-related by Tucholke (1979) with the first appearancedown-section of carbonate-rich sediments usually of theBarremian or Hauterivian. This transition, basically re-lated to a shallowing of the CCD, is believed to producethe prominent reflection observed in much of the NorthAtlantic.
Horizon C is a reflection that has only been routinelyidentified in more recent seismic surveys. It too is an ex-tensive and continuous feature in the older part of theBasin (Dillon et al., 1976; Grow and Markl, 1977; Sher-idan et al., 1978; Shipley et al., 1978). An age assignmenthas been made by Sheridan et al. (1978) and Jansa et al.(1979) on the basis of available data—essentially DSDPSites 99, 100, 105, and 391—that places Horizon C inthe Tithonian related to the change down-section tomore argillaceous (red) claystone observed at Site 391(Benson et al., 1978).
Horizon D is a prominent reflection in the older partof the western Basin (Bryan et al., 1980; Grow andMarkl, 1977; Shipley et al., 1978). As far as is known,this reflector does not crop out at the seafloor and wasnot previously sampled by drilling. Based on extrapola-tion of sedimentation rates below the drilled section atSite 391, Bryan et al. (1980) estimated the reflector at155 m.y. near the base of the Callovian.
An assumption in the preceding review is that the cor-relation of the seismic data to the well hole was possibleand correct. I will address in this report one method ofimproving our confidence in correlation of seismic re-flection data to drill holes by using DSDP Site 534 to il-lustrate the problems, uncertainties, and reliability ofwell hole-seismic reflection correlations. I will also pre-sent an alternative to the Site 534 report correlation.
In its simplest form, correlation problems arise fromtrying to equate the seismic section, a time-domain rec-ord, to well hole stratigraphy, a depth-domain record.This procedure requires derivation of a velocity func-tion to invert the time section to depth or the drill depthto time, which in practice is difficult. Because recoveryis often incomplete, deep-sea drilling holes provide in-formation on lithofacies but often not precise depths ofstratigraphic breaks. For example, in the cored intervalat Site 534, recovery was only 56%. Velocity of repre-sentative lithologies is routinely acquired in the ship-board laboratory but must in some way be corrected toin situ values. Then the corrected velocities must beweighted to the estimated lithology abundances beforetraveltime inversion of the data. Well logging has notbeen particularly successful or always possible in Glo-mar Challenger holes, preventing full use of these data.
The more common method used to find equivalencein drill hole depths and seismic reflection time sections isto correlate striking changes in lithology and occasion-ally drilling rate changes with major high-amplitude re-flections using available regional geophysically derivedvelocities to estimate depths, when such information isavailable (i.e., Winterer et al., 1973; Hollister et al.,1972; Sheridan et al., 1978 and Site 534 report, this vol-ume). Such methods of correlation are imprecise, butoften no superior method is available. It is important to
remember these problems when evaluating the publishedliterature.
Most of these correlations directly equate lithologychanges with seismic reflections. However, the soundenergy as a complex wave train is reflected from positiveand negative impedance boundaries (mismatches of theproduct of density and velocity), which may or may notcorrespond to obvious lithology changes. Indeed, the re-turned energy is the sum of the source wave train add-ed to the various impedance boundaries added to otherpropagation effects, including internal multiples, spread-ing wave fronts and Fresnel zone averaging, which makeit difficult to predict what causes reflections. Even withcareful processing of seismic data to produce the sharp-est image (or shortest wave train), we still must contendwith the interference from adjacent impedance bound-aries that may cancel or sum depending on the physicalproperties and their vertical spacing in the section.
Relying on correlations from other well holes, evennearby ones, requires some basic concept of what geo-logic information is contained in continuous reflectionstraced from some point to some other distant point. Thephysics of seismic reflections is well known; the verticalincident energy reflected from an interface is propor-tional to the change in the density-velocity productabove and below an interface. The geologic significanceor information portrayed in a seismic reflection sectionis not well understood. The geologic significance of re-flections may be separated into two rather differentproblems. One is specifically related to a reflection at asingle location, the other to the significance of laterallycontinuous reflections.
At a point a reflection may be caused by a change inlithology (facies) with depth that results in a change ofvelocity or density. The integration of the impedancefunction (caused by the velocity or density change) withthe seismic wavelet is recorded on seismic sections. Thusreflections at a point are in response to vertical varia-tions in lithofacies or sediment facies. Generally, later-ally continuous reflection events do not follow faciesboundaries. When we examine exposures of stratifiedrocks on land, the stratifications (bedding planes) arethe laterally persistent physical surfaces that pass throughfacies boundaries and textural changes. Of course, thevertical variation in texture and composition betweenbeds is usually greater than horizontal changes within anindividual bed. Thus, as discussed by Vail et al. (1977),most laterally persistent reflections are probably relatedto bedding plane geometry and have some time signifi-cance. These same reflections may also have facies sig-nificance only if the facies changes are nearly instanta-neous at the observation scale.
SEISMIC REFLECTION DATA
The seismic sections in the vicinity of Sites 391 and534 that were used in the final selection of Site 534 are24-fold multichannel data collected and processed byLamont-Doherty Geological Observatory (LDGO) (Bry-an et al., 1980). The source consisted of four 466-in.3 airguns fired at about 2000 psi. The Bolt air guns wereequipped with wave-shaping devices.
654

PHYSICAL PROPERTIES, SYNTHETIC SEISMOGRAMS AND SEISMIC REFLECTIONS
Processing at LDGO consisted of Berg-type deconvo-lution (maximum entropy), time-varying filtering, andgaining, all after normal moveout and stacking (Fig. 2).Copies of three portions of the unstacked (though sort-ed) data where the lines form a triangle about Site 534(Fig. 1) were obtained from LDGO. We reprocessed thesethree small portions of data, focusing on the deep re-flections.
The processing sequence followed at Scripps Insti-tution of Oceanography (SIO) was similar to that atLDGO. After correcting some problems resulting fromsorting geometry, we ran semblance velocity analysis atfive adjacent gathers nearest the drill Site on each of thethree lines. The derived RMS (root mean square) veloc-ity function was used to apply moveout to the databefore stacking. The semblance velocities are consideredunreliable for interval velocity calculations, because thedata were sorted assuming perfect 24-fold coverage thatthe shot and receiver spacing shows to be incorrect, andin any event, deep-water interval velocities are difficultto extract using the standard length array. The data werethen deconvolved with a spiking operator designed fromthe data trace between 6.5 and 8.0 s. Finally, the datawere bandpass filtered 6 to 45 Hz (Figs. 3, 4 and 5). Anumber of tests of velocity functions, constant velocitygathers, filter and deconvolution parameters (particu-
larly shorter design windows) applied before and afterstack did not yield significantly better results between7.2 and 8.0 s, the zone of primary interest.
The LDGO processing is clearly superior in the shal-lower section (compare Figs. 2 and 3). However, the de-convolution operator was not particularly successful atgreater depths where the velocity was much higher andthus the wave-train periodicity was greatly lengthened.The spiking deconvolution used at SIO did not signifi-cantly reduce the seafloor reflection doublet to a singlespike but it did modify the deep reflections below 7.4 s.Comparison of filtered (Fig. 6) versus deconvolved andfiltered data (Fig. 5) shows that the primary reflectionswere not altered but that a possible bubble pulse hasbeen reduced. The particular deconvolution parametersused in these plots were selected because of their abilityto sharpen the deeper reflections. A different set of pa-rameters (or time-varying deconvolution) will improvethe shallow portion of the section as shown by the LDGOsection in Figure 5, but this was not the objective of thisproject.
An objection can always be raised that the deconvo-lution operator is being designed on reflections havinggeologic significance. This was evaluated in two ways.First, a before and after deconvolution comparison is il-lustrated in Figures 6 and 5, respectively. Note that just
0400 A Site 534 0500i -6.5
M —
X **•
A -
ß ' -ß -
11i»•» '"'..'" ", .~T'!""!.,!" I' ""''" .!,"" '.'. iii•iinini" >Mi.»m:a»»»iiruatt•»i' '|'|ii»w«imwLW*» "'.<mimi' 'ifftEiiUCTWfcmtrsijg> <IL"1"""1"""""!' " "" "•i'W?ii'i'!ir••>• '
•#r« »<»w :
Figure 2. LDGO 24-channel seismic reflection section through Site 534 (see Fig. 1 for location).
655
T. H. SHIPLEY
SF
Site 534 A 0330
TTI—1 Tmrr TTTTT ~~~,———: f] ~ ~ — — ~ ' ' ' ' " " — — J —
....*,. M > V r V t l V - r r t V i i i > i r » » i » > » r t t l V • ' i V m V ^ > > l ü > m Y > ' >>>>>I 7 m " » > » » m V > » » » 7 » » > > M > >7m>»M»7>»>7>>>>>>>>7>«>>»»»»>>»»7,»»>>>>>>>I »>>»»>>
' . l i r i l f f l l l l i i m i i i i i i r i r i v l i i i ' 1 ' ' 1 • " ' • ! ' • • t i i i l l • i . ^ " ' ' ' ' ' ' : ' ' " ' L t l " ' ! ' ' " ; " " " ! " ' ' ' ! ' ' ' : - ; ; • ' L l - L ; " • •• . " " i ' " i '^l! ' • '»T,•, , ,v1v, ,r»v.',Tiv.•»v.iV»..i»v.•,,•>v.l.>•.v,,^.^•.>? >•,•,•,^^^Sv,,^-.-.-.iv^..•.^•.v.•^>v,',v^l.«v»^w.^v/.^v/,volWw}^^^,uUv.v.•.v,>l,v,',•>v.v,',v.,•.v.v.•,•,•,.
8.0
L " " ^ ; : •': ^ ^ y ^ ' W > *
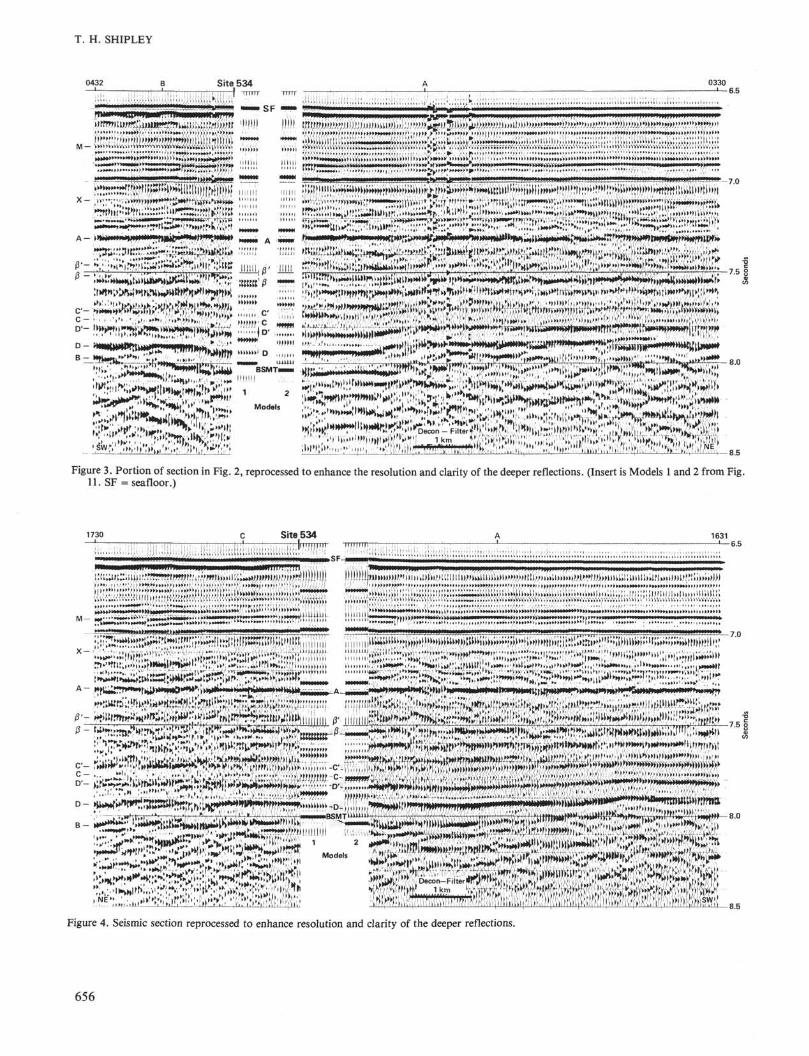
Figure 3. Portion of section in Fig. 2, reprocessed to enhance the resolution and clarity of the deeper reflections. (Insert is Models 1 and 2 from Fig.11. SF = seafloor.)
Site 534— |i|iimi
1631
>; """""
X -
[•t ^ W W W Mrtt>" Iwti>HMMnw>>>µiUijtff>W>w>r>>>>Ht<^>>M>i><tww>>H
ß - ^W»!»»rlS.tftó®^S‰iBS^^Bffi
8.5
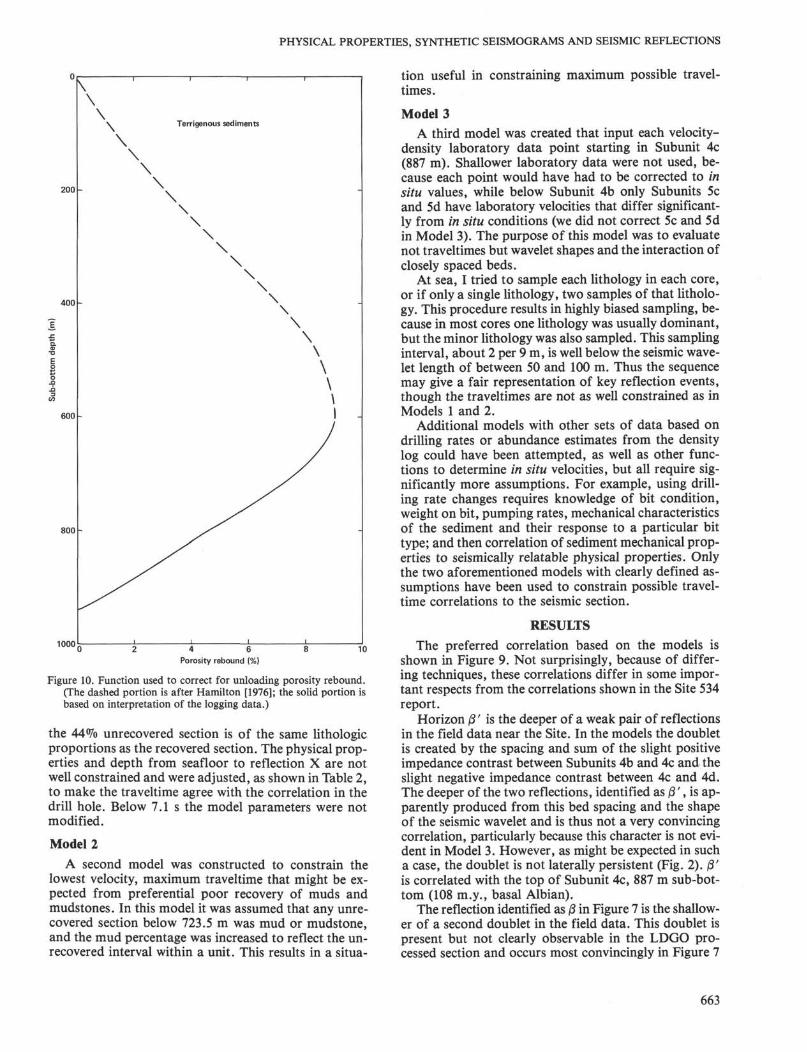
Figure 4. Seismic section reprocessed to enhance resolution and clarity of the deeper reflections.
656

PHYSICAL PROPERTIES, SYNTHETIC SEISMOGRAMS AND SEISMIC REFLECTIONS
0456 B Site 534:,:" ' ' • • i i n n H i | p i l ! i l ! i i l l r ' | ! ! i : : i ; i | ^ i l ü i l i i l i π i i ! ! ' 1 ! ! ! 1 ' - ! 1 ! ! 1 ! ! 1 :;'' i ' : I'
- . " v ; . d : ' •• ^ ' l v ; " . • ! i . , ; ^ v w ; ; >;.iv' >w•v•.•i••••.u»::j.i::»••;:!:,i,,
0358
-7.5
'»>»
iBSMTLum^-
1 1
Figure 5. Seismic section reprocessed to enhance resolution and clarity of the deeper reflections. (Note the thickness change and relief labeled near7.7 s. This may denote a change in depositional patterns [from sheet drape below to basin-fill above] and possible minor unconformity.)
0456
M - kwv•
B
::;;;::u:;;;
Site 534 ci ,,
IIMI>>II>I>IIIII
03586.5
Figure 6. Same seismic section as in Figure 5 but without deconvolution to evaluate the quality of the processing procedure.
657

T. H. SHIPLEY
above C' in Figure 6 a pair of reflections shows a thin-ning geometry. This same subtle feature is observed inthe deconvolved version (Fig. 5), suggesting that the de-convolution is not destroying the geometrical relation-ships. A second attempt to evaluate the effect of decon-volution was to deconvolve the synthetic seismogram ofModel 3 (discussed later), which has 176 layers. The de-convolution did not significantly alter the input again,suggesting that there is no obvious periodicity in thegeology.
The navigation for the seismic array was LORANC—an accurate system that, when available, is superiorto satellite systems for underway ships. Fixes can be ob-tained at any time and the ship's velocity is not a vaMa-able in solving for the position, as in the present satellitesystems. The location of the Site is based on the mean ofa number of satellite fixes while the Glomar Challengerwas positioned on site. Location of both the hole andthe seismic data are quite good. However, the frames ofreference are not readily comparable. Thus the positionof the Site relative to the seismic data is not exactlyknown. To evaluate the significance of this problem wehave noted the variation in traveltimes to identified re-flections along the seismic sections that form a trianglearound the Site (tabulated in Table 1). The triangle hasno error significance but does form a convenient limitfor investigating variations in the geology near the Site.
The portions of the seismic lines within the triangleare shown in Figure 7. These data illustrate that the trav-eltimes are nearly constant down to Horizon C . Onlybelow Horizon C, that is D, D' , and basement, is theresignificant relief and variation in traveltime, and thusrelative hole location errors become more important.Even so it seems most important only for basement,which varies in total round-trip travel time 0.15 s, where-as D varies only 0.04 s.
Table 1. Two-way traveltime to identified seismicreflections in seconds on three lines surround-ing Site 534.
Reflection
SeafloorAß'ßCCD'D
Basement
Reflection timea
6.57-6.607.30-7.327.46-7.487.51-7.547.71-7.747.76-7.797.81-7.857.91-7.957.91-8.06
Closest approachmeanb
6.587.317.477.527.747.797.847.948.05c
a Maximum range of reflection times. Note thatthese are extreme values and that the Δ range be-tween any two reflections is always much less(i.e., most sediments are draping basement).
•3 The mean of the times at the closest approachpoint on each of the three lines (see Fig. 7).
c Calculated basement time in Model 1 is 7.99 sand in Model 2 is 8.03 s, both less than the mean.This is one measure of the integrated errors, intraveltimes and location.
The correlations to identified seismic reflections onFigures 2 through 7 are from Bryan et al. (1980), modi-fied slightly by Sheridan et al. (this volume).
PHYSICAL PROPERTIES
A variety of physical property measurements wasmade on the materials recovered at Site 534 and fromdownhole logging of density (Figs. 8 and 9 and Table 2).Density and caliper logs were collected between 490 and730 m, 925 and 1375 m, and 1410 and 1480 m. Velocitydata with malfunctioning caliper were collected between490 and 725 m. The laboratory measurements sufferfrom various uncertainties (see the Explanatory Noteschapter). The most significant problems are with meth-ods to extrapolate the effect of in-place conditions ondensity and velocity and of weighting the appropriatevalues to represent the real distribution at the drill site,because the drilling procedure creates a bias in recovery.
A velocity and density function appropriate to in situconditions was calculated as follows. Porosity reboundwas taken from Hamilton (1976) and entered on a crossplot of laboratory porosity and vertical velocity toestablish the estimate of in situ velocity. The in situ ve-locity was then entered on a cross plot of the velocityand density to establish an in situ density. This proce-dure to calculate in situ vertical velocities from the po-rosity rebound was modified only where the density logindicated significant departures from the results of cal-culated in situ density.
The lithologic units defined by the sedimentologists(Site 534 report) were used to subdivide the section intointervals. Within each interval means of measured ve-locity, density, and porosity of each major lithologywere calculated. Lithology Units 3, 5a, and 6a were fur-ther subdivided because of detected changes in physicalproperties or abundances not considered relevant to thesedimentology. Using these units results in a fairly unbi-ased subdivision of the sedimentary section.
The first-order porosity correction to the laboratorydata at Site 534 is based on empirical consolidation testson terrigenous and carbonate deep-sea sediments byHamilton (1976). Specifically, the porosity reboundfrom pressure unloading was based on the sediment li-thology according to Hamilton's data. Below 950 m thedensity log in the terrigenous mudstones was interpretedto suggest no systematic rebound (though data are lack-ing between about 700 and 925 m), and a rebound cor-rection combining this fact with Hamilton's data to600 m was used (Fig. 10). Note that these densities resultin mudstone in situ vertical velocities of 1.8 to 1.9 km/sin the intervals between 764 and 950 m. We assume thatthe rebound function in Figure 10 is reasonable, but theabsence of logging data in the interval leaves doubtabout this trend. The log data also suggest that reboundin the carbonate chalks and oozes closely follows Ham-ilton^ curve and is limited to depths < 700 m. No signif-icant amount of chalk was encountered between 714 and976 m and no extrapolation of Hamilton's data wasnecessary. Below 976 m the "chalks" were lithifiedenough that rebound was probably insignificant, which
658

PHYSICAL PROPERTIES, SYNTHETIC SEISMOGRAMS AND SEISMIC REFLECTIONS
8.0-rtt*
>HH**HiHiJüiuiUtti>iilfrLilrtt
» r» ki>1! m • v " " • »πiV>•>)• ' J ' ^ r • r* \ > V\K
Figure 7. Portions of seismic lines that form a triangle around Site 534. (These sections allow us to estimate maximum likely variation in reflectiontimes resulting from uncertainties in drill hole location relative to the seismic reflection lines [see Table 1].)
is supported by the density log (Fig. 9). No systematicrebound was detected or applied to the lithified lime-stones.
A number of other conditions that have not been dis-cussed also have an effect on the physical properties, themost important being temperature and pressure, whichincrease the velocity of sound in water in the pore spaces(see Boyce, 1976). Laboratory measurements were madeat 1 atm and at about 20 °C while in situ pressures variedfrom 500 to 600 atm and from 20 °C at 600 m to 45 °C at1600 m. At 600 m the combined effect is about a 6% in-crease in sound velocity in water and at 1600 m an 11%increase (Press, 1966). The exact relationship betweensound velocity in the water of the pore spaces and veloc-ity in the saturated sample at high pressures is not welldocumented (Boyce, 1976). However, the inferred high-er velocities in the pore waters imply that the muds mayhave velocities perhaps up to 3 or 4% higher than shownin Table 2 and slightly greater at the base of the hole.The lithified chalks and limestones probably have alesser increase in velocity.
When the corrected density model is overlain by thelog density data (Fig. 9), departures from predicted val-ues are noted in Subunits 2a, 2b, 2c, 5c, and 5d. In Sub-units 2a through c the differences did not significantlyalter velocities, because the slope of the density versusvelocity function at these low densities is gentle (Fig. 8).I see no obvious reason for the departure from Hamil-ton^ data. In Subunits 5c and 5d, where there were par-
ticularly good hole conditions and in Subunit 5d with anearly uniform limestone lithology, the calculated densi-ties appear too low, though in adjacent units the labora-tory and log data are similar. These high densities forthe limestone suggest significantly higher velocities, asshown in Table 2. The section contained more homoge-neous nannofossil limestones than some other units, so Iremain puzzled as to the cause of the shift in densities.
Corrections similar to those for Units 2 and 5 werenot applied to other units without good log data, be-cause the density corrections are not systematic. Also,the assumption is not proven that the well logs providebetter estimates of in situ densities than do the correctedlaboratory values. Drilling may have caused fracturingand deformation of the soft mudstones, and surface saltwater could have replaced the formation fluid. Perhapsmost important, the density tool samples a rather largerpart of the formation, averaging both horizontal andvertical variations in physical properties (on the order of30 cm at minimum hole diameter [Boyce, 19801). Logresolution is further reduced by vertical motion of theship relative to the hole.
The vertical velocity and density for each unit wasweighted to the relative abundances of the lithologies inthe recovered section to produce a mean velocity anddensity for each unit (Table 2, Model 1). These relativeabundances may be biased, however, by the preferentialrecovery of more massive moderately firm layers, where-as the drilling process may tend to wash away muds,
659

T. H. SHIPLEY
1.5
2.0
2.5
3.0
5 3.5ε
ity
oαi
> 4.0
4.5
5.0
5.5
6.0
A
..; y
.*
. " "1" ._
• Basalt•Basalt
•Basalt
•Basalt• Basalt
. "Basalt
• Basalt
• Red claystone
-
-
-
-
-
-
2 . 0 -
2.5 -
3.0 -
5 3.5
iI> 4.0
4.5-
5.0
10 20 30 40Porosity (%)
50 60 706.0
B
-
-
. ' "y.'\.
Red claystone
•
Siltstone-
" '*••
t
•
• Siltstone
•
."**• * *•
*»
Basalt-# B a
• Chert
i
-
-
-
_
-
salt
*.
•Basalt
Basalt.Basalt.
Basalt •
Basalt
1.5 2.0Density (g/cm )
2.5
Figure 8. Cross plots of the vertical velocity versus porosity and density measured in the laboratory on the same samples at Site 534 (see Site 534report). (These plots were used to determine trends for estimating in situ density and velocity.)
very hard thin layers, or interbeds of muds. In an at-tempt to evaluate the significance of this problem forthe likely case in which much of the cored but unrecov-ered section may consist of mud, mean unit values wererecalculated using mud (mudstone) velocity and densityfor all the unrecovered sections. This then gives onelikely end member in the total traveltime through thesection (Table 2, Model 2).
Another problem at Site 534 is that we only cored be-tween 545 m and total depth. Casing was set to 536 mand the sediments were not cored or logged between 3and 545 m. I have used a combination of data from near-by Site 391 and published velocity information to con-strain the physical properties models in this interval.The velocities and thickness of the upper section wereadjusted to position reflector X at 7.1 s subsurface andproceeded below 500 m with velocities and densities de-rived directly from the data at Site 534, as discussed ear-lier. The Eocene-Maestrichtian unconformity at 723.5 mis correlated with Horizon A. This correlation and thedepth at which basalt was first encountered at 1639 mare two end points in the seismic modeling.
SEISMIC MODELS
Synthetic seismograms were produced from the phys-ical property data collected at this Site. Three modelswere generated, two mainly to place some limits on thetraveltimes involved and a third to evaluate in a crudemanner reflection characteristics (Fig. 11).
All models used wave-theory solutions based on awavelet defined in the frequency domain as 10 to 35 Hzwith a nearly zero-phase character. This particular wave-let was picked on the basis of the frequency spectra ofthe stacked field data. Rather arbitrarily we assumed asource depth of 10 m and a receiver depth of 20 m forcalculation of the surface ghost. The attenuation effectswere ignored and the model output was filtered and am-plitude adjusted to approximate the amplitude of theprocessed field data. For simplicity, the velocity anddensity functions were modeled with horizontal layers.
Model 1
The first model used as input to the velocity-densityfunction is shown in Table 2. This model assumes that
660

PHYSICAL PROPERTIES, SYNTHETIC SEISMOGRAMS AND SEISMIC REFLECTIONS
Lithology Density 8 Caliper Density1 5 Density":
<%) (g/cm 3 ) (in.) (g/cm 3 ) (g/cm 3 ) Site 534 This Age
0 100 1.5 2.0 2.5 3.0 10 15 1.5 2.0 2.5 3.0 1.5 2.0 2.5 3.0 report chapter (m.y.)
T.D. 1666m
Mud Chalk Limestone βasalt
Mud
- ß~
~ ß ~
Figure 9. Profile showing major lithologies and densities versus depth at Site 534. (Density8 column shows laboratory data points and calculated insitu unit densities for each major lithology [up to four per unit, solid lines]. Density13 column is density measured in the hole during logging. Holediameter is shown in column labeled caliper. Density0 column shows logging densities overlain with corrected in situ densities for each majorlithology. Note that additional corrections were necessary in Units 2 [a, b, c] and 5 [c, d].)
661

T. H. SHIPLEY
Table 2. Summary of physical property data, Site 534.
Sub-bottomdeptha
(m)
0
146.9
203.5326.0354.5500.0
545.8
566.6
595.2
660.0
696.5
714.5
723.5
764.5887.0914.0
950.0
976.0
1044.5
1107.5
1202.0
1268.0
1342.0
1395.5
1429.0
1495.6
1549.8
1572.0
1617.11625.3
1635.3
Lithologyunit
2a
2b
2c
2d
3l b
324a
4b4c4d
5ai
5a2
5a3
5b
5c
5d
6aj
6a2
6b
7a
7b
7c
7d7e
8
Lithologycomponent
MudOozeMudOozeChalkMudChalkMudChalk
MudChalkMudChalkMudChalkLimestoneChalkLimestone
"Mud"ChalkMud
ChertMudMudMudMud
MudChalkLimestoneMudChalkLimestoneMudChalkLimestoneSandstoneMudChalkLimestoneMudChalkLimestoneLimestone
MudLimestoneMudLimestoneMudLimestoneMudLimestoneMudLimestoneMudLimestoneMudMud
Basalt
Abundance0
(%)
85155
951001001002575
35653070454510955
959
100
2575
100100100
25651015 (55)30 (15)55 (30)35 (60)45 (25)15 (10)5(5)
1560255(25)
70 (55)25 (20)
100
50 (70)50 (30)70 (80)30 (20)40 (85)60 (15)90(100)10(0)50 (95)50(5)50 (80)50 (20)
100100
100
Verticalvelocity(km/s)
1.491.481.571.591.811.661.871.701.93
1.672.431.702.061.752.083.982.334.98
2.202.331.76
4.871.761.781.901.77
1.832.433.761.852.684.181.992.063.532.512.002.743.532.312.733.313.40
2.593.952.252.882.474.832.734.052.534.682.863.472.302.48
5.18
Laboratory^
Density(g/cm3)
1.591.591.551.691.871.511.841.511.90
1.602.141.692.031.722.012.472.222.56
1.922.222.04
2.482.042.022.071.98
2.062.262.442.092.322.562.162.222.492.322.182.322.482.252.322.452.43
2.352.552.272.462.382.652.382.612.312.642.432.542.292.41
2.73
Porosity(*)
696965605065485045
60325638543913288
402843
43444242
4025154024103530152534231530231817
2410291823
4
237
255
184
2522
12
Calculated in situe
Verticalvelocity(km/s)
1.491.501.601.641.871.691.931.782.01
1.722.601.742.251.782.303.982.604.98
2.402.701.90
4.871.881.871.901.77
Density(g/cm3)
1.591.591.601.761.951.611.961.652.00
1.90(1.70)2.30 (2.10)2.00 (1.74)2.18 (2.10)2.02(1.85)2.182.472.342.56
2.352.322.10
2.482.102.102.071.98
Same aslaboratory
3.153.604.00
2.45 (2.32)2.52 (2.45)2.60 (2.43)
Same aslaboratory
Model 1
Verticalvelocity(m/s)
1750
1900
200018002100
2000
1960
2050
2210
2720
2420
1900
2630
187019001770
2410
3380
2280
2830
3220
4000
3270
2440
3890
2860
3610
31702300
2480
5180
Density(g/cm3)
1.70
2.00
2.052.052.10
2.05
1.96
1.99
2.06
2.35
2.35
2.10
2.20
2.102.071.98
2.23
2.42
2.24
2.34
2.46
2.60
2.45
2.33
2.54
2.40
2.48
2.492.29
2.41
2.73
Model 2
Verticalvelocity(m/s)
Density(g/cm3)
Same asModel 1
2410
2670
2190
2830
3030
4000
3000
2380
2820
2730
2640
29802300
2480
5180
2.23
2.27
2.22
2.34
2.41
2.60
2.41
2.31
2.42
2.38
2.33
2.452.29
2.41
2.73
a From 0 to 500 m, values are from Site 391; from 500 to 545.8 m, values are a combination of data from both sites.Subscript shows further subdivision of the lithologic subunit to indicate changes in physical properties or abundances not considered relevant to the sedi-mentology.
c Component estimates in brackets assume all unrecovered section is mud-mudstone. These were used in Model 2.° Laboratory data from gravimetric wet-bulk density and vertical velocities measured at Site 534, supplemented in a few places with data extrapolated from
adjacent units.e In situ corrections based on porosity rebound of Hamilton (1976) with qualification that the density log was interpreted to indicate no systematic rebound
for terrigenous sediments below 940 m and below 700 m for chalks. Where log densities varied significantly from calculated values (shown in parentheses),these were used to determine in situ velocity and used in the models. There are no corrections for hydrostatic pressure or temperature.
662
PHYSICAL PROPERTIES, SYNTHETIC SEISMOGRAMS AND SEISMIC REFLECTIONS
200 -
400 -
1000
600 -
800 -
4 6Porosity rebound (%)
Figure 10. Function used to correct for unloading porosity rebound.(The dashed portion is after Hamilton [1976]; the solid portion isbased on interpretation of the logging data.)
the 44% unrecovered section is of the same lithologicproportions as the recovered section. The physical prop-erties and depth from seafloor to reflection X are notwell constrained and were adjusted, as shown in Table 2,to make the traveltime agree with the correlation in thedrill hole. Below 7.1 s the model parameters were notmodified.
Model 2
A second model was constructed to constrain thelowest velocity, maximum traveltime that might be ex-pected from preferential poor recovery of muds andmudstones. In this model it was assumed that any unre-covered section below 723.5 m was mud or mudstone,and the mud percentage was increased to reflect the un-recovered interval within a unit. This results in a situa-
tion useful in constraining maximum possible travel-times.
Model 3A third model was created that input each velocity-
density laboratory data point starting in Subunit 4c(887 m). Shallower laboratory data were not used, be-cause each point would have had to be corrected to insitu values, while below Subunit 4b only Subunits 5cand 5d have laboratory velocities that differ significant-ly from in situ conditions (we did not correct 5c and 5din Model 3). The purpose of this model was to evaluatenot traveltimes but wavelet shapes and the interaction ofclosely spaced beds.
At sea, I tried to sample each lithology in each core,or if only a single lithology, two samples of that litholo-gy. This procedure results in highly biased sampling, be-cause in most cores one lithology was usually dominant,but the minor lithology was also sampled. This samplinginterval, about 2 per 9 m, is well below the seismic wave-let length of between 50 and 100 m. Thus the sequencemay give a fair representation of key reflection events,though the traveltimes are not as well constrained as inModels 1 and 2.
Additional models with other sets of data based ondrilling rates or abundance estimates from the densitylog could have been attempted, as well as other func-tions to determine in situ velocities, but all require sig-nificantly more assumptions. For example, using drill-ing rate changes requires knowledge of bit condition,weight on bit, pumping rates, mechanical characteristicsof the sediment and their response to a particular bittype; and then correlation of sediment mechanical prop-erties to seismically relatable physical properties. Onlythe two aforementioned models with clearly defined as-sumptions have been used to constrain possible travel-time correlations to the seismic section.
RESULTS
The preferred correlation based on the models isshown in Figure 9. Not surprisingly, because of differ-ing techniques, these correlations differ in some impor-tant respects from the correlations shown in the Site 534report.
Horizon ß' is the deeper of a weak pair of reflectionsin the field data near the Site. In the models the doubletis created by the spacing and sum of the slight positiveimpedance contrast between Subunits 4b and 4c and theslight negative impedance contrast between 4c and 4d.The deeper of the two reflections, identified as ß', is ap-parently produced from this bed spacing and the shapeof the seismic wavelet and is thus not a very convincingcorrelation, particularly because this character is not evi-dent in Model 3. However, as might be expected in sucha case, the doublet is not laterally persistent (Fig. 2). ß'is correlated with the top of Subunit 4c, 887 m sub-bot-tom (108 m.y., basal Albian).
The reflection identified as ß in Figure 7 is the shallow-er of a second doublet in the field data. This doublet ispresent but not clearly observable in the LDGO pro-cessed section and occurs most convincingly in Figure 7
663

T. H. SHIPLEY
Model 1 Model 2plus mudstone
Model 3(176 layers)
6 . 5 -
iiii i I i { S S3 S3 53 i ian
-6.5
w > >» >>>>>>>>>λ >
<iuttuuuo>>>>>M> »»»l
7 0
WWmmww mJ
lilililllll>i lii y.7.5
') S S ' ) ' ) S (>' > V> '>') S S S S ' .i' >' > V > ' ) ' ) ) ' i ' ) ' ) ) S ' ) )' V > >>-VVVVVr1)V) > V V V W 1
r>v>v>Y>w>v>•>v>^w>v>v>s
Figure 11. Output of three basic models described in text. (Below arrows to the right of Models 2 and 3 are portions of models that were varied fromModel 1. Shaded bars at indicated reflection horizons represent range of observed traveltime to the horizons near Site 534.)
near the Site. In both models the reflection correspond-ing to the upper part of the doublet in the field data isat 950 m. The impedance contrast between 4d and 5a isstronger than the one between 5a! and 5a2 (0.21 versus0.06 in Model 2) and is associated with the rapid increasein chalks. Thus Beta is correlated to the top of the chalksat 950 m, in the upper Barremian.
Three reflections generally occur between ß and Con the field records. These may correspond to the posi-tive contrast between Subunits 5ai and 5a2 (976 m) atthe first occurrence of limestones, a strong negative con-trast between 5a2 and 5a3 (1044 m), and moderate posi-tive contrast between 5a3 and 5b (1107 m). For this sim-plistic correlation, the thickness of the units must be such
as to reinforce the reflections. This may be evident fromthe variation in amplitudes and spacings of these reflec-tions in the different models in Figure 11. Although thesecorrelations are plausible, they are truly below the reso-lution of the data.
Horizon C correlates to the boundary between Sub-units 5b and 5c at a depth of 1202 m (early Valanginian).It also seems to represent a transition from a sheet drapedeposit below to a more ponded basin fill deposit above(Fig. 5). Yet the sedimentology of Subunits 5b and 5care similar and do not indicate this expected facieschange.
Horizon C is correlated with the marked change fromlaminated chalks to rather pure bioturbated limestones
664

PHYSICAL PROPERTIES, SYNTHETIC SEISMOGRAMS AND SEISMIC REFLECTIONS
that occurs at the 5c/5d boundary at 1268 m in the up-per Berriasian.
Horizon D' correlates with a reversed polarity wave-let formed near the 5d/6a boundary (1342 m) in the Ti-thonian. This is the position at which there is a 20-mtransition to significantly more mudstones.
The reflection in the field data between D' and D(Fig. 7) may correlate with a rather high impedance con-trast between 6a2 and 6b at 1430 m (Kimmeridgian).This is the level at which limestones with very high ve-locity (4.8 km/s) and low porosity (4%) first becomeimportant (Table 2).
Horizon D correlates with the marked increase in lime-stone abundance in Subunit 7b at 1549 m. This correla-tion, identical to the Site 534 report, places D in the ear-ly Oxfordian.
CONCLUSIONS
The correlations in this chapter are based on the (1)calculation of in situ velocities from measurements ofvelocity, density, and porosity at the surfaces correctedusing a published porosity rebound model and checkedwith the density logs, (2) evaluation of the uncertainty inestimates of the unrecovered lithologic section, and (3)observation of traveltime variations related to the accu-racy of the relative location of the seismic data and thewell.
Models 1 and 2 evaluate two possible velocity func-tions derived from different estimates of the lithology ofthe unrecovered portion in the well hole. The shadedportions between Models 1 and 2 in Figure 11 show thelimits of traveltime variations related to possible errorsin location of the Site. I am unable to estimate the mag-nitude of possible errors in the correction of the labora-tory velocity data to in situ data.
The Site 534 report correlations vary significantlyfrom those presented in this paper in placement of C',C, and D ' . It is not easy to analyze in detail why thesecorrelations differ or to explain these differences on thebasis of some single factor. The comparison of resultscan be discussed within three different domains; travel-times, velocities, or depths. In depths the Site 534 reportcorrelations are systematically shallower: ß by 25 m, Cby 48 m, C by 72 m, D' 90 m, and D by 2 m. TheSite 534 report placement of the reflections in the holewas not based on a velocity structure (see Table 18 in theSite 534 report) but on an approximate velocity functionrefined with obvious paleontological hiatuses, lithologicchanges, and abrupt variations in drilling rate.
The real discrepancy between the correlations pre-sented here and in the Site 534 report appear in the place-ment of C , C, and D' . Individually, the exact place-ment of these reflections is certainly below the resolu-tion of the velocity model because of their close spacing.The biggest mismatch occurs in the interval D' to D(208 m versus 120 m), and even here the resolution is notadequate. Within the triangle the D'-D interval, whichprobably represents somewhat more variation than canbe attributed to navigation errors, is 0.06 to 0.11 s. Thethickness variation between the two correlations is justslightly more than the extreme maximum time varia-
tions. It is obvious that the resolution is not entirely ade-quate for providing significant confidence in our results.However, the fact that the Site 534 report correlationsagree with the results of Site 391 nearby is not at all sig-nificant because the same assumptions were made whencorrelations were established for Site 391 as were madefor the Site 534 report in this volume.
Perhaps the point of this investigation should be thatwe cannot expect unequivocal well hole to seismic re-flection correlations where the seismic reflections arespaced nearly at the wavelet length, well below our reso-lution. Further, only after deliberate shore-based workshould correlations be made. Perhaps better velocitycontrol from improved logging tools or near-bottom orin-hole seismic experiments will be forthcoming. If not,seismic reflection correlation requirements need to bebetter understood and weighed in consideration withother needs in future drilling plans.
ACKNOWLEDGMENTS
We thank E. Pye of Geoquest International for providing model-ing programs to SIO and Paul Henkart and Tom Birtley for program-ming support. George Bryan kindly provided copies of the seismictapes. A continuing dialogue with Bob Sheridan helped in focusingthis project and providing corrections to the reflections correlations.The chapter was reviewed by R. E. Boyce, W. P. Dillon, and E. L.Hamilton. This work was supported by ONR contract N00014-80-C-00440.
REFERENCES
Benson, W. E., Sheridan, R. E., et al., 1978. Init. Repts. DSDP, 44:Washington (U.S. Govt. Printing Office).
Boyce, R. E., 1976. Sound velocity-density parameters of sedimentand rock from DSDP drill Sites 315-318 on the Line Islands Chain,Manihiki Plateau, and Tuamotu Ridge in the Pacific Ocean. InSchlanger, S. O. Jackson, E. D., et al., Init. Repts. DSDP, 33:Washington (U.S. Govt. Printing Office), 695-729.
, 1980. Determination of the relationship of electrical resis-tivity, sound velocity, and density/porosity of sediment and rockby laboratory techniques and well logs from DSDP Sites 415 and416 off the coast of Morocco. In Lancelot, Y., Winterer, E. L., etal., Init. Repts. DSDP, 50: Washington (U.S. Govt. Printing Of-fice), 305-318.
Bryan, G. M., Markl, R. G., and Sheridan, R. E., 1980. IPOD SiteSurveys in the Blake-Bahama Basin. Mar. Geol., 35:43-63.
Buffler, R. T., Shipley, T. H., and Watkins, J. S., 1978. Blake conti-nental margin seismic section. Am. Assoc. Pet. Geol. Seismic Sec-tion Ser. 2.
Dillon, W. P., Sheridan, R. E., and Fail, J. P., 1976. Structure of thewestern Blake-Bahama Basin as shown by 24-channel CDP profil-ing. Geology, 4:459-462.
Grow, J. A., and Markl, R. G., 1977. IPOD-USGS multichannel seis-mic-reflection profile from Cape Hatteras to the Mid-AtlanticRidge. Geology, 5:625-630.
Hamilton, E. L., 1976. Variations of density and porosity with depthin deep-sea sediments. J. Sediment. Petrol., 46:280-300.
Hollister, C. D., Ewing, J. I., et al., 1972. Init. Repts. DSDP, 11:Washington (U.S. Govt. Printing Office).
Jansa, L. R, Enos, P., Tucholke, B. E., Gradstein, F. M., and Sheri-dan, R. E., 1979. Mesozoic-cenozoic sedimentary formations ofthe North American Basin; western North Atlantic. In Talwani,M., Hay, W., and Ryan, W. B. F. (Eds.), Deep Drilling Results inthe Atlantic Ocean: Continental Margins and Paleoenvironment.Am. Geophys. Union, Maurice Ewing Series, 3:1-57.
Klitgord, K. D., and Grow, J. A., 1980. Jurassic seismic stratigraphyand basement structure of the western Atlantic Magnetic QuietZone. Am. Assoc. Pet. Geol. Bull., 64:1658-1680.
Press, F., 1966. Seismic velocities. In Clark, S. P., Jr. (Ed.), Geol. Soc.Am. Mem., 97:195-218.
665

T. H. SHIPLEY
Sheridan, R. E., Golovchenko, X., and Ewing, J. I., 1974. Late Mio-cene turbidite horizon in the Blake-Bahama Basins. Am. Assoc.Pet. Geol. Bull., 58:1797-1805.
Sheridan, R. E., Patouret, L., and Mosditchian, G., 1978. Seismicstratigraphy and related lithofacies of the Blake-Bahama Basin. InBenson, W. E, Sheridan, R. E., et al., Init. Repts. DSDP, 44:Washington (U.S. Govt. Printing Office), 529-546.
Sheridan, R. E., Windish, C. C , Ewing, J. I., and Stoffa, P. L.,1979. Stratigraphy and structure across the Blake Escarpment basedon seismic reflection profiles. Am. Assoc. Pet. Geol. Mem., 29:177-186.
Shipley, T. H., Buffler, R. ‰ and Watkins, J. S., 1978. Seismic stra-tigraphy and geologic history of the Blake Plateau and adjacentwestern Atlantic continental margin. Am. Assoc. Pet. Geol., 62:792-812.
Shipley, T. H., and Watkins, J. S., 1978. Fine-scale seismic stratigra-phy in the western North Atlantic. Geology, 6:635-639.
Tucholke, B. E., 1979. Relationship between acoustic stratigraphy andlithostratigraphy in the western North Atlantic Basin. In Tuchol-
ke, B. E., Vogt, P. R., et al., Init. Repts. DSDP, 43: Washington(U.S. Govt. Printing Office), 827-846.
Tucholke, B. E., and Mountain, G. S., 1979. Seismic stratigraphy,lithostratigraphy, and paleosedimentation patterns in the NorthAmerican Basin. In Talwani, M., Hay, W., and Ryan, W. B. F.(Eds.), Deep Drilling Results in the Atlantic Ocean: ContinentalMargins and Paleoenvironment. Am. Geophys. Union, MauriceEwing Series, 3:58-86.
Tucholke, B. E., and Vogt, P. R., 1979. Western North Atlantic: sedi-mentary evolution and aspects of tectonic history. In Tucholke, B.E., Vogt, P. R., et al., Init. Repts. DSDP, 43: Washington (U.S.Govt. Printing Office), 791-823.
Vail, P. R., Mitchum, R. M., and Thompson, S., 1977. Seismic stra-tigraphy and global changes in sea level. In Payton, C. E. (Ed.),Seismic Stratigraphy—Application to Hydrocarbon Exploration.Am. Assoc. Pet. Geol. Mem., 26:49-212.
Winterer, E. L., Ewing, J. I., et al., 1973. Init. Repts. DSDP, 17:Washington (U.S. Govt. Printing Office).
666