Embed Size (px)
Citation preview

Correlation study between CBR and DCP indexes of two
tropical soils from the Brazilian Northeast as an instrument
for in situ technological control
Bruma Morganna Mendonca de Souza
University of New Hampshire, Durham, NH, United States, [email protected]
Lucas Fonseca Fernandes1, Guilherme de Oliveira Souza2, Osvaldo de Freitas Neto3
Federal University of Rio Grande do Norte, Natal, RN, Brazil,
[email protected], [email protected] 2, [email protected]
ABSTRACT: To guarantee safety and functionality for any road construction project, technological control using in situ
and laboratory tests is an essential tool. In this context, the use of the Dynamic Cone Penetrometer (DCP) has gained
popularity to estimate soil parameters, such as the California Bearing Ratio (CBR), through correlation studies. Therefore,
this paper is aimed to establish empirical relationships between CBR and DCP indexes of typical soils from Natal/RN, in
the Brazilian Northeast. After an initial characterization, results were correlated from approximately 80 tests, performed
on both soils at two different compaction energies and various moisture contents in-mold, subjected to distinct immersion
conditions. According to the characterization tests, soil 1 was classified as a silty sand (SM), and soil two was classified
as a well-graded silty sand (SM-SW). Additionally, both samples were considered as A-2-4 according to the highway
classification. The obtainment of coefficients of determination (R²) higher than 0.90 in 75% of the developed correlations,
characterizes the applicability of DCP as a valid field-testing instrument for technological control of local paving works,
as it is a simple, fast and low-cost test. The findings of this study represent an advancement in definition and standardi-
zation of a simple, efficient, and safe methodology to the estimate of empirical correlations between these two soil pa-
rameters.
Keywords: California Bearing Ratio; Dynamic Cone Penetrometer; Correlation Study; Technological Control; Field
Testing.
1. Introduction
The need for technological control in paving is evident
by the significant increase in traffic loads over the years
[1]. To perform a proper soil analysis, it is highly recom-
mended to conduct field and laboratory investigations to
obtain strength and compressibility parameters that de-
fine the soil overall behavior.
Although investigation techniques such as the Stand-
ard Penetration Test (SPT), Cone Penetration Test (CPT)
and California Bearing Ratio (CBR) are still indispensa-
ble for road design, other types of equipment can also be
used to estimate soil strength at significantly lower costs.
In this context, noninvasive and non-destructive methods
have received significant attention [2] since they allow
for soil analyses with little or no damage by ensuring
minimal disturbance in situ. Therefore, the dynamic cone
penetrometer (DCP) has been broadly utilized as an effi-
cient complementary tool to evaluate soil strength in pav-
ing works due to its simplicity, and inexpensive cost [3].
Since CBR is still the most used method to evaluate
soils before designing a pavement, the increasing need
for in situ technological control has motivated research-
ers to conduct correlation studies between CBR and more
straightforward tests to evaluate soil penetration re-
sistance. Previous studies developed in different coun-
tries have obtained, with distinct soil types, equations
able to estimate CBR from DCP results, demonstrating
that there is a clear correlation between both parameters.
Even though determining empirical correlations sim-
plifies the estimate of soil parameters, previous investi-
gations highlight that the use of these equations should
only be reliable if tests are performed at identical soil
classification, and at the same location where the experi-
mental research was conducted [4, 5]. Such necessity is
evidenced, especially in Brazil, a country that presents a
wide range of soil types and weather conditions between
different regions.
Due to the lack of scientific evidence regarding corre-
lation studies developed in the Brazilian Northeast, this
paper aimed to perform correlation studies in two tropical
soils from Natal, state of Rio Grande do Norte.
2. Background
2.1. Dynamic cone penetration test (DCP)
The dynamic cone penetration test is conducted by
gradually penetrating a standardized, metallic cone tip in
the soil by dropping an 8 kg hammer from a 575 mm
height (Fig. 1). This procedure follows specifications of
the American Society for Testing and Materials (ASTM),
standard D-6951-2018 [6].
Determining the DCP index requires constant readings
of the cummulative penetration depth reached by the tip
of the equipment. Standard practice involves counting the
number of blows necessary to penetrate a certain depth,
usually considered to be 10 cm. However, for low-
strength soils, readings are usually taken for each blow to

get a better representation of the soil penetration re-
sistance.
Figure 1. Dynamic cone penetrometer [6].
Although the DCP test cannot be used to replace la-
boratory testing completely, several authors point out the
low-complexity operation at inexpensive costs as the
main advantage of this equipment. Its procedure can pro-
vide a significant amount of testing in a short time inter-
val, including in areas of difficult access for equipment
to perform SPT, CPT or in-situ CBR testing [5, 7, 8].
Due to the reduced surface contact of the cone tip with
the ground when the equipment is correctly positioned
for the test, it is recommended that the reading corre-
sponding to the first blow (zeroth blow) should be disre-
garded [4, 5, 9]. During the test, the number of blows and
the penetration of the tip is recorded with the help of a
ruler positioned next to the drive rod. The DCP index is
then calculated using Eq. 1, where Zn and Z1 are the off-
sets produced by the nth and first blows, where n is the
number of blows. Additionally, soil layers of different
strengths must be assigned different penetration rates.
𝐼𝐷𝐶𝑃 =𝑍𝑛−𝑍1
𝑛−1 (1)
DCP tests can be performed both in situ and in a the
laboratory [3]. In these circumstances, soil specimens are
molded in the large compaction cylinder (152 mm diam-
eter, 178 mm height with a 63.5 mm high steel disc in-
side), and the test can be performed under compacted or
undeformed sample conditions.
Due to its ease of reproduction and possible use in both
field and laboratory, the DCP has a high potential for sev-
eral purposes, such as soil compaction control, detection
of collapsible porous soils, identification of structural de-
ficiencies, and structural evaluation of pavements [2, 10
- 12].
In this context, results from the DCP test have often
been used to estimate strength and deformability param-
eters obtainable by other test methods through the devel-
opment of correlation studies. Thus, the dynamic cone
penetrometer optimizes and facilitates technological con-
trol in the field during the paving process, as it can be
related to parameters such as the CBR index itself, and
other soil properties depending on the available equip-
ment in situ.
2.2. Correlations between DCP and CBR
Correlation studies between DCP and CBR are
developed when a structural pavement assessment is to
be carried out [5] at low costs. The use of correlations
may be justified by the difficulty of performing in situ
CBR testing and the increasing need to optimize quality
control in road infrastructure works [10].
In addition to requiring prior characterization of the
evaluated sample, it is essential to mention that these
studies should preferably be performed at soils under
identical conditions of moisture content and compaction,
either in situ or during laboratory molding. This
precaution should be taken to ensure the reproductibility
of results in soil samples that have the same classification
and condition as the investigated soil.
In general, the correlations between the DCP and CBR
indexes found in the relevant literature assume the power
(Eq. 2) and logarithmic (Eq. 3) forms, as a function of
two dimensionless parameters, A and B. These
parameters depend on the soil properties and the
boundary conditions to which it is subjected. The DCP
index is given in millimeters per blow (mm/blow) and the
CBR index is given as a percentage (%). In this paper, to
ensure a consistent comparison, all logarithmic equations
published by previous studies were converted to the
format of Eq. 2, as parameters A and B are identical in
both cases.
𝐶𝐵𝑅 = 𝐴 × 𝐷𝐶𝑃𝐵 (2)
𝐿𝑜𝑔(𝐶𝐵𝑅) = 𝐿𝑜𝑔(𝐴) + 𝐵 × 𝐿𝑜𝑔(𝐷𝐶𝑃) (3)
ASTM D6951:2018 recommends three correlations
for estimating the California bearing ratio [13].
According to the standard, Eq. 4 applies to all soil types
except for high compressibility (CH) and low
compressibility (CL) clays with CBR less than 10%. On
the other hand, Eqs. 5 and 6 are appropriate for CH and
CL soils under these strength conditions, respectively. As
in the previous equations, CBR is given as a percentage,
and DCP is introduced in terms of mm/blow.
𝐶𝐵𝑅 = 292 𝐷𝐶𝑃−1.12 (4)
𝐶𝐵𝑅 =1
0.002871𝐷𝐶𝑃−1 (5)
𝐶𝐵𝑅 =1
0.017019𝐷𝐶𝑃−2 (6)
The validity of the models presented in Eqs. 2 and 3 is
also attested by a vast amount of studies that empirically
relate these two types of tests (DCP and CBR) in one of
these formats. The establishment of the correlation is
based on a set of experimental points (DCP, CBR) that
will define a trendline that will present an equation and
its coefficient of determination (R²). This coefficient is
used as an indicator of the reliability of the equation
obtained.
Thus, in addition to the correlations determined by
ASTM, this literature review analyzed several correlation
studies conducted in different countries. This analysis
included the study areas, soil classifications, test
conditions, equations, and their respective determination
coefficients.
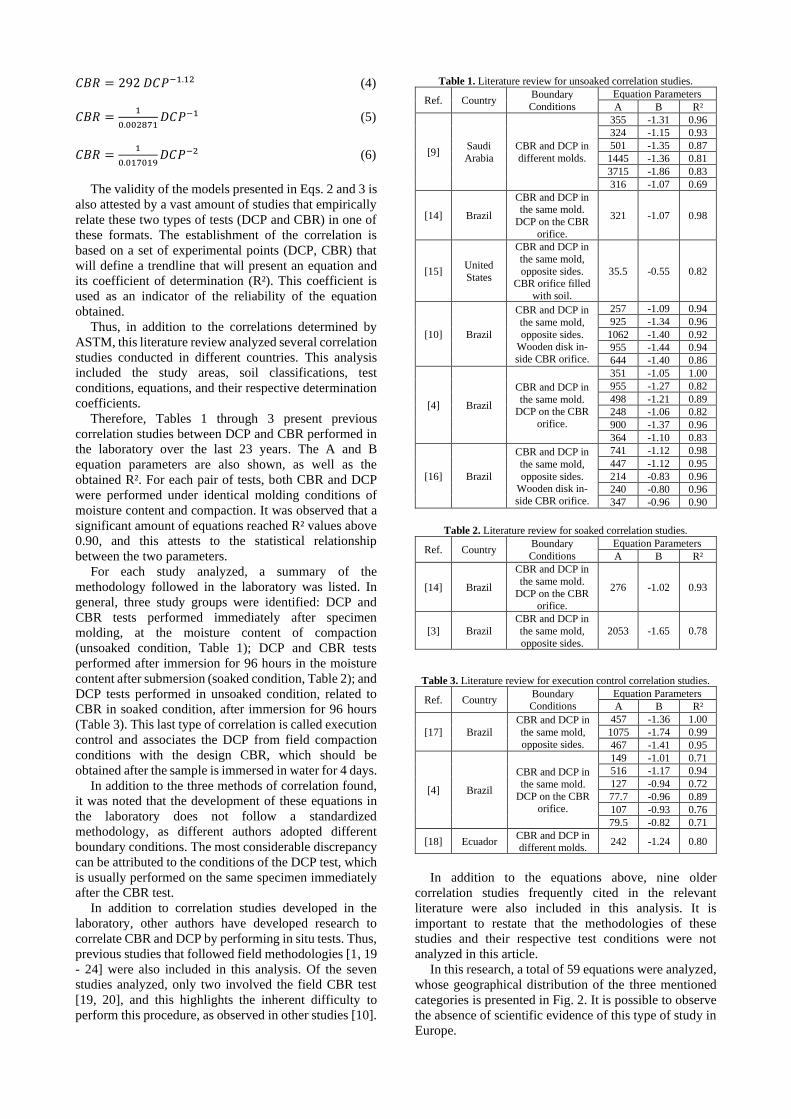
Therefore, Tables 1 through 3 present previous
correlation studies between DCP and CBR performed in
the laboratory over the last 23 years. The A and B
equation parameters are also shown, as well as the
obtained R². For each pair of tests, both CBR and DCP
were performed under identical molding conditions of
moisture content and compaction. It was observed that a
significant amount of equations reached R² values above
0.90, and this attests to the statistical relationship
between the two parameters.
For each study analyzed, a summary of the
methodology followed in the laboratory was listed. In
general, three study groups were identified: DCP and
CBR tests performed immediately after specimen
molding, at the moisture content of compaction
(unsoaked condition, Table 1); DCP and CBR tests
performed after immersion for 96 hours in the moisture
content after submersion (soaked condition, Table 2); and
DCP tests performed in unsoaked condition, related to
CBR in soaked condition, after immersion for 96 hours
(Table 3). This last type of correlation is called execution
control and associates the DCP from field compaction
conditions with the design CBR, which should be
obtained after the sample is immersed in water for 4 days.
In addition to the three methods of correlation found,
it was noted that the development of these equations in
the laboratory does not follow a standardized
methodology, as different authors adopted different
boundary conditions. The most considerable discrepancy
can be attributed to the conditions of the DCP test, which
is usually performed on the same specimen immediately
after the CBR test.
In addition to correlation studies developed in the
laboratory, other authors have developed research to
correlate CBR and DCP by performing in situ tests. Thus,
previous studies that followed field methodologies [1, 19
- 24] were also included in this analysis. Of the seven
studies analyzed, only two involved the field CBR test
[19, 20], and this highlights the inherent difficulty to
perform this procedure, as observed in other studies [10].
Table 1. Literature review for unsoaked correlation studies.
Ref. Country Boundary
Conditions
Equation Parameters
A B R²
[9] Saudi
Arabia
CBR and DCP in
different molds.
355 -1.31 0.96
324 -1.15 0.93
501 -1.35 0.87
1445 -1.36 0.81
3715 -1.86 0.83
316 -1.07 0.69
[14] Brazil
CBR and DCP in the same mold.
DCP on the CBR
orifice.
321 -1.07 0.98
[15] United
States
CBR and DCP in
the same mold,
opposite sides. CBR orifice filled
with soil.
35.5 -0.55 0.82
[10] Brazil
CBR and DCP in
the same mold,
opposite sides. Wooden disk in-
side CBR orifice.
257 -1.09 0.94
925 -1.34 0.96
1062 -1.40 0.92
955 -1.44 0.94
644 -1.40 0.86
[4] Brazil
CBR and DCP in
the same mold. DCP on the CBR
orifice.
351 -1.05 1.00
955 -1.27 0.82
498 -1.21 0.89
248 -1.06 0.82
900 -1.37 0.96
364 -1.10 0.83
[16] Brazil
CBR and DCP in
the same mold,
opposite sides. Wooden disk in-
side CBR orifice.
741 -1.12 0.98
447 -1.12 0.95
214 -0.83 0.96
240 -0.80 0.96
347 -0.96 0.90
Table 2. Literature review for soaked correlation studies.
Ref. Country Boundary
Conditions
Equation Parameters
A B R²
[14] Brazil
CBR and DCP in
the same mold.
DCP on the CBR orifice.
276 -1.02 0.93
[3] Brazil
CBR and DCP in
the same mold,
opposite sides.
2053 -1.65 0.78
Table 3. Literature review for execution control correlation studies.
Ref. Country Boundary Conditions
Equation Parameters
A B R²
[17] Brazil
CBR and DCP in
the same mold,
opposite sides.
457 -1.36 1.00
1075 -1.74 0.99
467 -1.41 0.95
[4] Brazil
CBR and DCP in
the same mold.
DCP on the CBR
orifice.
149 -1.01 0.71
516 -1.17 0.94
127 -0.94 0.72
77.7 -0.96 0.89
107 -0.93 0.76
79.5 -0.82 0.71
[18] Ecuador CBR and DCP in different molds.
242 -1.24 0.80
In addition to the equations above, nine older
correlation studies frequently cited in the relevant
literature were also included in this analysis. It is
important to restate that the methodologies of these
studies and their respective test conditions were not
analyzed in this article.
In this research, a total of 59 equations were analyzed,
whose geographical distribution of the three mentioned
categories is presented in Fig. 2. It is possible to observe
the absence of scientific evidence of this type of study in
Europe.
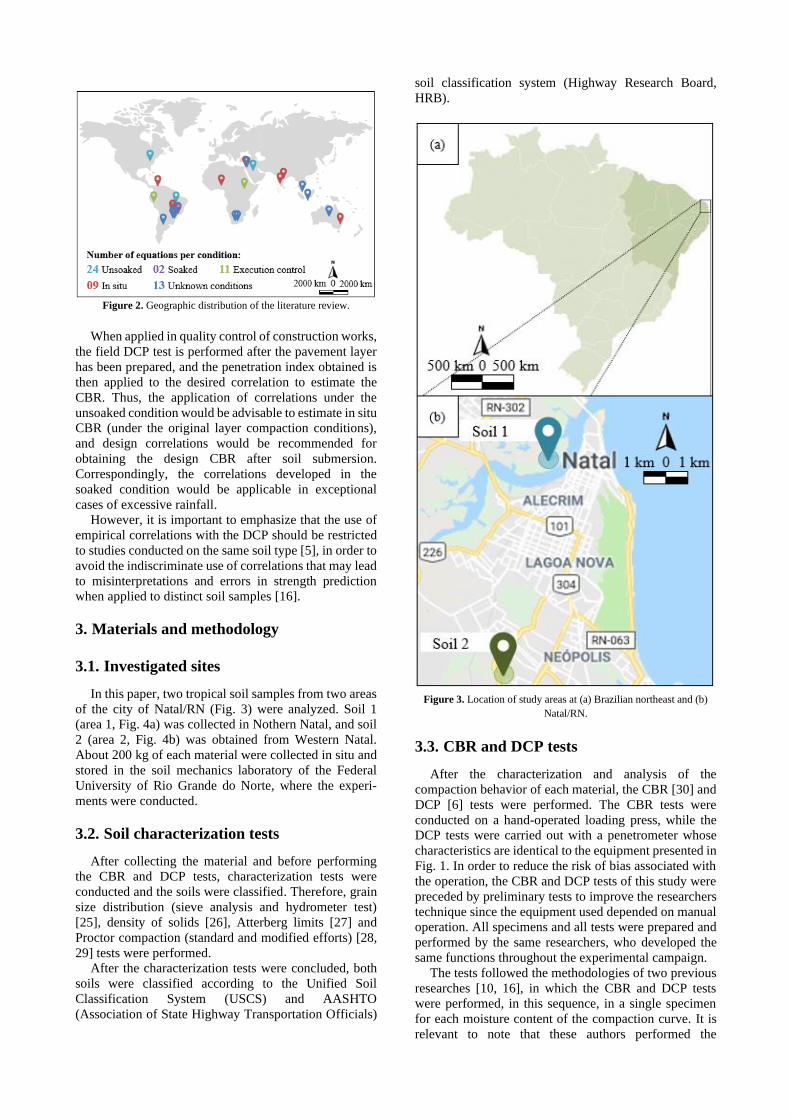
Figure 2. Geographic distribution of the literature review.
When applied in quality control of construction works,
the field DCP test is performed after the pavement layer
has been prepared, and the penetration index obtained is
then applied to the desired correlation to estimate the
CBR. Thus, the application of correlations under the
unsoaked condition would be advisable to estimate in situ
CBR (under the original layer compaction conditions),
and design correlations would be recommended for
obtaining the design CBR after soil submersion.
Correspondingly, the correlations developed in the
soaked condition would be applicable in exceptional
cases of excessive rainfall.
However, it is important to emphasize that the use of
empirical correlations with the DCP should be restricted
to studies conducted on the same soil type [5], in order to
avoid the indiscriminate use of correlations that may lead
to misinterpretations and errors in strength prediction
when applied to distinct soil samples [16].
3. Materials and methodology
3.1. Investigated sites
In this paper, two tropical soil samples from two areas
of the city of Natal/RN (Fig. 3) were analyzed. Soil 1
(area 1, Fig. 4a) was collected in Nothern Natal, and soil
2 (area 2, Fig. 4b) was obtained from Western Natal.
About 200 kg of each material were collected in situ and
stored in the soil mechanics laboratory of the Federal
University of Rio Grande do Norte, where the experi-
ments were conducted.
3.2. Soil characterization tests
After collecting the material and before performing
the CBR and DCP tests, characterization tests were
conducted and the soils were classified. Therefore, grain
size distribution (sieve analysis and hydrometer test)
[25], density of solids [26], Atterberg limits [27] and
Proctor compaction (standard and modified efforts) [28,
29] tests were performed.
After the characterization tests were concluded, both
soils were classified according to the Unified Soil
Classification System (USCS) and AASHTO
(Association of State Highway Transportation Officials)
soil classification system (Highway Research Board,
HRB).
Figure 3. Location of study areas at (a) Brazilian northeast and (b)
Natal/RN.
3.3. CBR and DCP tests
After the characterization and analysis of the
compaction behavior of each material, the CBR [30] and
DCP [6] tests were performed. The CBR tests were
conducted on a hand-operated loading press, while the
DCP tests were carried out with a penetrometer whose
characteristics are identical to the equipment presented in
Fig. 1. In order to reduce the risk of bias associated with
the operation, the CBR and DCP tests of this study were
preceded by preliminary tests to improve the researchers
technique since the equipment used depended on manual
operation. All specimens and all tests were prepared and
performed by the same researchers, who developed the
same functions throughout the experimental campaign.
The tests followed the methodologies of two previous
researches [10, 16], in which the CBR and DCP tests
were performed, in this sequence, in a single specimen
for each moisture content of the compaction curve. It is
relevant to note that these authors performed the

California bearing ratio and dynamic cone penetration
tests only in the unsoaked condition; that is, no specimen
had been immersed in water. Therefore, there is no
previous soaked correlation data following this test
methodology.
Figure 4. Samples of each soil examined.
In each molded specimen, the DCP test was performed
shortly after the CBR test on the opposite face to the CBR
orifice, which was filled with a wooden disc (Fig. 5) [10,
16]. The purpose of this methodology was to avoid
material loss and prevent any impact between the cone
tip and the steel disc at the bottom of the soil sample.
Mold preparation for the DCP test is detailed in Fig. 6.
Figure 5. Wooden discs used to fill the CBR orifice.
Figure 6. DCP test procedure: (a) orifice created by CBR piston; (b)
placement of wooden disk; (c) insertion of steel disc at the bottom of
the sample and invertion of soil specimen; (d) placement of the cone
tip at the center of the mold; and (e) test execution.
In order to obtain all three types of correlation
previously identified (unsoaked, soaked and execution
control), both tests were performed with and without
immersion. This way, for each moisture content of the
compaction curve (optimum moisture content, two points
in the dry branch and two in the wet branch), two samples
were compacted. The first was submerged for 96 hours,
and the second was ruptured shortly after molding. It was
not an objective of this study to evaluate the expansion of
soils in the specimens submitted to submersion.
Although it is usually recommended that the first blow
of the DCP should be neglected [4, 5, 9], an alternative
method was followed [16], in which the zeroth blow was
not disregarded if the weight of the penetrometer was
sufficient to fully penetrate the cone tip into the sample.
This procedure was mainly followed due to the restrictive
specimen height of approximately 100 mm, and the low
penetration resistance shown by the specimens at high
moisture contents.
Additionally, due to the contact with the wooden disc
at the end of each test, all the final blows (depth of
approximately 100 mm) were disregarded.
3.4. Data interpretation
After performing the tests, the analysis performed in
this study consisted of establishing the correlations from
the obtained results. Each test pair (DCP, CBR) corre-
sponded to a point on the graph of interest. The experi-
mental points for each soil in each test condition were
then plotted, and a power trendline was inserted for each
curve. The coefficient of determination (R²) allowed
evaluating the suitability of this methodology to the ana-
lyzed materials. The curves were not extrapolated, and
only experimental results were considered.
4. Results and discussion
4.1. Soil characterization
The grain size distribution curves are a resultant from
the sieve analysis and hydrometer test, shown in Fig. 7.
While soil 1 was about 20% fine-grained (17.86% clay),
soil 2 was approximately 10% fine-grained, with equal
percentages of silt and clay. Both soils presented the sand
fraction as predominant, reaching total percentages of
79.00% and 86.01%, respectively, for each soil.
Figure 7. Grain size distribution curves.
Although soil 1 has a significant fraction of clay
(17.86%), the liquid and plastic limit tests classified the
material as not plastic. The same behavior was observed
in soil 2, which has a lower clay fraction (5.75%).
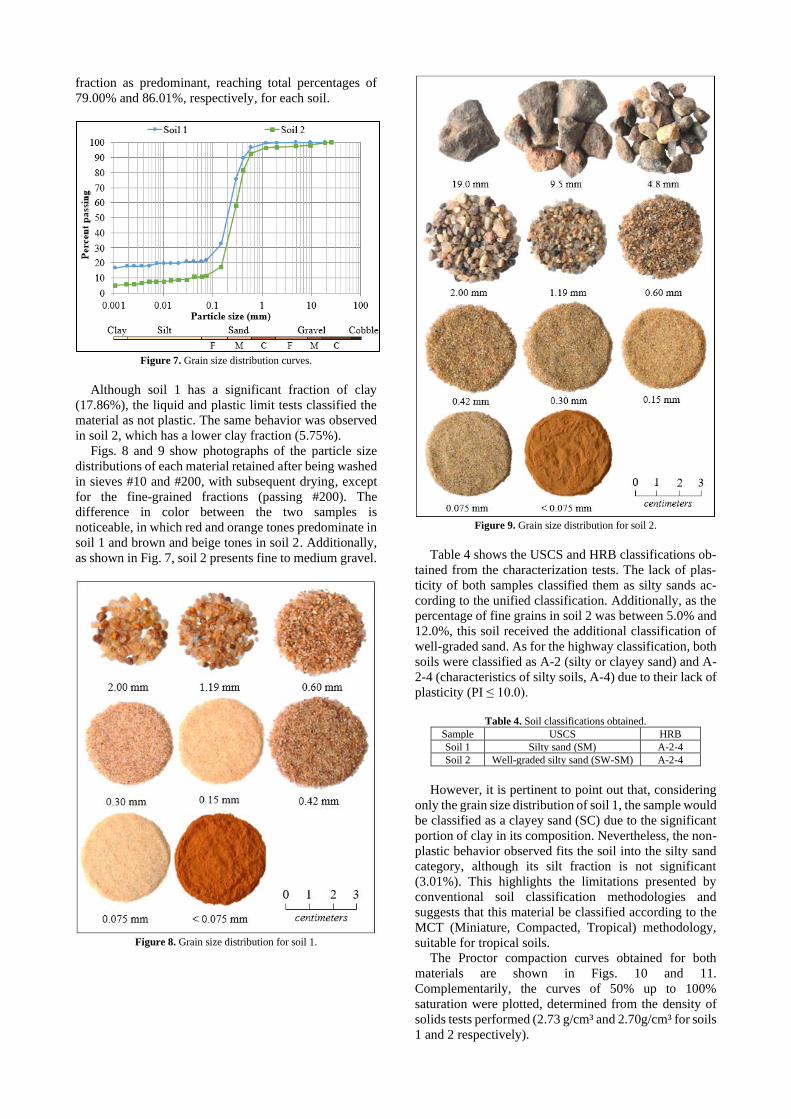
Figs. 8 and 9 show photographs of the particle size
distributions of each material retained after being washed
in sieves #10 and #200, with subsequent drying, except
for the fine-grained fractions (passing #200). The
difference in color between the two samples is
noticeable, in which red and orange tones predominate in
soil 1 and brown and beige tones in soil 2. Additionally,
as shown in Fig. 7, soil 2 presents fine to medium gravel.
Figure 8. Grain size distribution for soil 1.
Figure 9. Grain size distribution for soil 2.
Table 4 shows the USCS and HRB classifications ob-
tained from the characterization tests. The lack of plas-
ticity of both samples classified them as silty sands ac-
cording to the unified classification. Additionally, as the
percentage of fine grains in soil 2 was between 5.0% and
12.0%, this soil received the additional classification of
well-graded sand. As for the highway classification, both
soils were classified as A-2 (silty or clayey sand) and A-
2-4 (characteristics of silty soils, A-4) due to their lack of
plasticity (PI ≤ 10.0).
Table 4. Soil classifications obtained.
Sample USCS HRB
Soil 1 Silty sand (SM) A-2-4
Soil 2 Well-graded silty sand (SW-SM) A-2-4
However, it is pertinent to point out that, considering
only the grain size distribution of soil 1, the sample would
be classified as a clayey sand (SC) due to the significant
portion of clay in its composition. Nevertheless, the non-
plastic behavior observed fits the soil into the silty sand
category, although its silt fraction is not significant
(3.01%). This highlights the limitations presented by
conventional soil classification methodologies and
suggests that this material be classified according to the
MCT (Miniature, Compacted, Tropical) methodology,
suitable for tropical soils.
The Proctor compaction curves obtained for both
materials are shown in Figs. 10 and 11.
Complementarily, the curves of 50% up to 100%
saturation were plotted, determined from the density of
solids tests performed (2.73 g/cm³ and 2.70g/cm³ for soils
1 and 2 respectively).
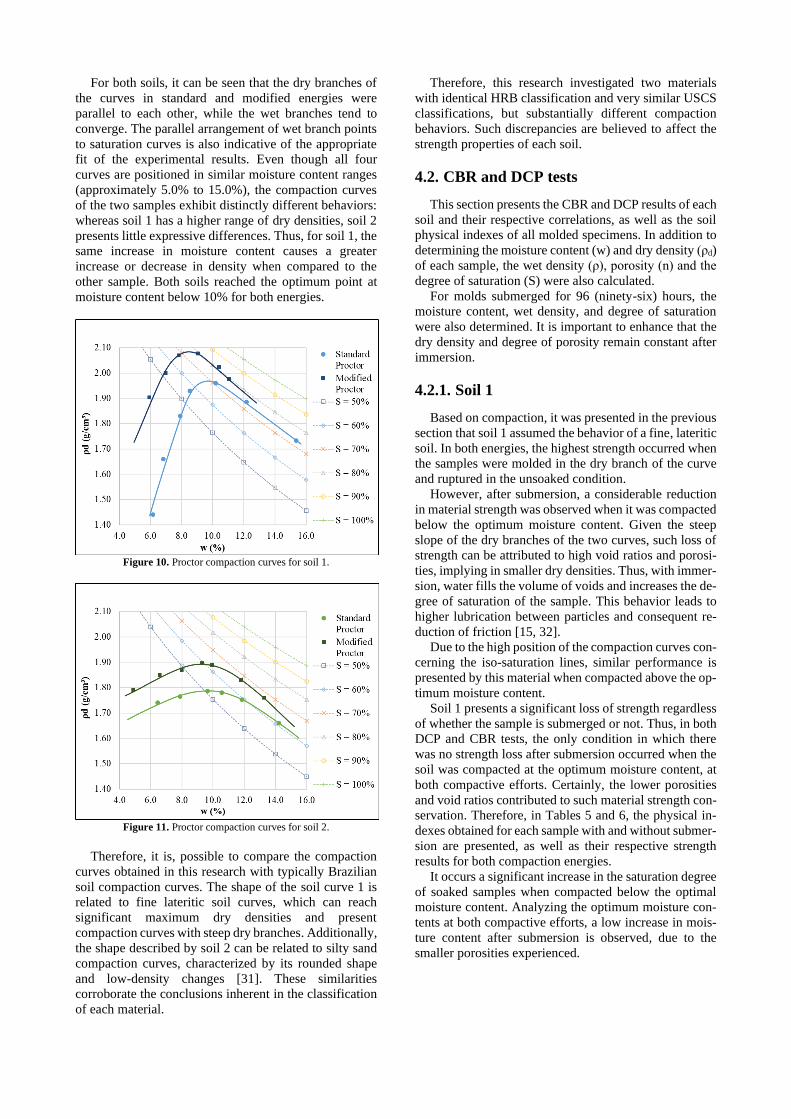
For both soils, it can be seen that the dry branches of
the curves in standard and modified energies were
parallel to each other, while the wet branches tend to
converge. The parallel arrangement of wet branch points
to saturation curves is also indicative of the appropriate
fit of the experimental results. Even though all four
curves are positioned in similar moisture content ranges
(approximately 5.0% to 15.0%), the compaction curves
of the two samples exhibit distinctly different behaviors:
whereas soil 1 has a higher range of dry densities, soil 2
presents little expressive differences. Thus, for soil 1, the
same increase in moisture content causes a greater
increase or decrease in density when compared to the
other sample. Both soils reached the optimum point at
moisture content below 10% for both energies.
Figure 10. Proctor compaction curves for soil 1.
Figure 11. Proctor compaction curves for soil 2.
Therefore, it is, possible to compare the compaction
curves obtained in this research with typically Brazilian
soil compaction curves. The shape of the soil curve 1 is
related to fine lateritic soil curves, which can reach
significant maximum dry densities and present
compaction curves with steep dry branches. Additionally,
the shape described by soil 2 can be related to silty sand
compaction curves, characterized by its rounded shape
and low-density changes [31]. These similarities
corroborate the conclusions inherent in the classification
of each material.
Therefore, this research investigated two materials
with identical HRB classification and very similar USCS
classifications, but substantially different compaction
behaviors. Such discrepancies are believed to affect the
strength properties of each soil.
4.2. CBR and DCP tests
This section presents the CBR and DCP results of each
soil and their respective correlations, as well as the soil
physical indexes of all molded specimens. In addition to
determining the moisture content (w) and dry density (ρd)
of each sample, the wet density (ρ), porosity (n) and the
degree of saturation (S) were also calculated.
For molds submerged for 96 (ninety-six) hours, the
moisture content, wet density, and degree of saturation
were also determined. It is important to enhance that the
dry density and degree of porosity remain constant after
immersion.
4.2.1. Soil 1
Based on compaction, it was presented in the previous
section that soil 1 assumed the behavior of a fine, lateritic
soil. In both energies, the highest strength occurred when
the samples were molded in the dry branch of the curve
and ruptured in the unsoaked condition.
However, after submersion, a considerable reduction
in material strength was observed when it was compacted
below the optimum moisture content. Given the steep
slope of the dry branches of the two curves, such loss of
strength can be attributed to high void ratios and porosi-
ties, implying in smaller dry densities. Thus, with immer-
sion, water fills the volume of voids and increases the de-
gree of saturation of the sample. This behavior leads to
higher lubrication between particles and consequent re-
duction of friction [15, 32].
Due to the high position of the compaction curves con-
cerning the iso-saturation lines, similar performance is
presented by this material when compacted above the op-
timum moisture content.
Soil 1 presents a significant loss of strength regardless
of whether the sample is submerged or not. Thus, in both
DCP and CBR tests, the only condition in which there
was no strength loss after submersion occurred when the
soil was compacted at the optimum moisture content, at
both compactive efforts. Certainly, the lower porosities
and void ratios contributed to such material strength con-
servation. Therefore, in Tables 5 and 6, the physical in-
dexes obtained for each sample with and without submer-
sion are presented, as well as their respective strength
results for both compaction energies.
It occurs a significant increase in the saturation degree
of soaked samples when compacted below the optimal
moisture content. Analyzing the optimum moisture con-
tents at both compactive efforts, a low increase in mois-
ture content after submersion is observed, due to the
smaller porosities experienced.

Table 5. Results for soil 1 (standard Proctor).
Unsoaked tests Soaked tests w
(%
)
ρ (
g/c
m³)
ρd (
g/c
m³)
n (
%)
S (
%)
CB
R (
%)
DC
P (
mm
/blo
w)
w (
%)
ρ (
g/c
m³)
ρd (
g/c
m³)
n (
%)
S (
%)
w9
6h
(%
)
ρ9
6h (
g/c
m³)
S (
%)
CB
R (
%)
DC
P (
mm
/blo
w)
6.7 1.779 1.668 38.8 28.6 17.1 10.3 6.8 1.778 1.664 38.9 29.2 16.1 1.931 68.6 0.4 97.0
9.0 2.066 1.896 30.4 56.0 25.8 15.2 8.5 2.094 1.929 29.2 56.3 10.5 2.132 69.4 26.3 15.2
10.7 2.132 1.926 29.3 70.4 7.5 32.7 11.6 2.163 1.938 28.9 77.8 13.1 2.192 88.0 4.5 46.5
13.0 2.141 1.895 30.4 80.7 2.5 89.0 12.2 2.115 1.885 30.8 74.4 13.2 2.133 80.5 2.8 47.5
15.4 1.999 1.733 36.4 73.1 0.0 * - - - - - - - - * *
* This test was not performed due to the soil not presenting resistance to penetration during unsoaked testing.
Table 6. Results for soil 1 (modified Proctor).
Unsoaked tests Soaked tests
w (
%)
ρ (
g/c
m³)
ρd (
g/c
m³)
n (
%)
S (
%)
CB
R (
%)
DC
P (
mm
/blo
w)
w (
%)
ρ (
g/c
m³)
ρd (
kg/m
³)
n (
%)
S (
%)
w9
6h (
%)
ρ9
6h (
g/c
m³)
S (
%)
CB
R (
%)
DC
P (
mm
/blo
w)
5.9 2.017 1.904 30.1 37.4 74.4 3.4 5.9 2.026 1.913 29.8 37.8 11.8 2.138 75.6 9.0 23.0
7.0 2.139 1.999 26.6 52.7 93.6 5.1 7.4 2.169 2.021 25.8 57.5 9.6 2.214 75.0 41.0 11.5
8.0 2.228 2.063 24.3 68.2 69.3 6.8 8.2 2.228 2.059 24.4 69.1 10.2 2.269 86.1 70.2 8.8
9.1 2.287 2.097 23.1 82.7 37.0 8.7 9.1 2.265 2.077 23.8 79.2 10.6 2.296 92.3 44.1 11.8
10.4 2.226 2.016 26.0 80.7 11.9 20.0 10.1 2.228 2.024 25.7 79.5 11.1 2.248 87.2 10.4 22.3
10.6 2.203 1.992 26.9 78.7 7.6 29.0 11.1 2.195 1.976 27.5 79.5 12.3 2.219 88.1 4.4 43.0
* This test was not performed due to the soil not presenting resistance to penetration during unsoaked testing.
** The DCP cone tip touched the wood disk in the first blow (test dismissed)
The variations in bearing capacity between both ener-
gies before and after submersion demonstrate the signif-
icant loss of strength previously mentioned. It is noted,
however, that the soaked CBR was superior to the un-
soaked CBR in four test pairs, where three of them cor-
respond to small increments of less than 1.0%. This oc-
curred at the optimum moisture contents at both standard
and modified proctor, and this implies that the strength
before and after immersion is the same.
On the other hand, the CBR test at 9.06% moisture
content in the modified effort after submersion showed
an increase of approximately 7.0% in strength. Since the
experimental approach of this research depends on man-
ual operation, such behavioral discrepancy can be at-
tributed to this limiting factor.
A similar before and after immersion comparison was
made for dynamic cone penetration indexes, where
higher penetrations indicate lower strengths. It was ob-
served that all DCP indexes were higher after submer-
sion, except for the tests performed at 13% moisture con-
tent in the standard Proctor. Such loss of strength after
submersion was already expected.
The penetration indexes at the optimum moisture con-
tents before and after immersion also did not present sig-
nificant variations. The DCP index was kept constant in
the standard Proctor and increased only 2.0 mm/blow in
the modified Proctor. This behavior demonstrates that
soil 1 strength does not change when compacted at the
maximum dry density.
4.2.2. Soil 2
As previously presented, soil 2, from the western area
of Natal/RN, was classified as a well-graded silty sand
according to USCS and presented a compaction behavior
compatible with this designation. The material reached
low values of maximum dry density (about 1.80 g/cm³ at
the standard energy, and 1.90 g/cm³ at the modified
energy), and the compaction curves had little variability
with the increase of moisture content.
After performing CBR and DCP tests on the samples
molded at both compaction energies, the expected
behavior was obtained: the soil reached low strengths, as
the maximum CBR reached was only 38.54% (modified
energy), when compacted at the optimum moisture
content.
Tables 7 and 8 show the results obtained for soil 2
tests, including the soil indexes calculated after each
molding and submersion. In addition to low CBR
percentages in both energies, there were no DCP indexes
lower than 29.30 mm/blow. This attests in advance to the
absence of points in the steep branch of the correlation
curve.
Analyzing the results of the physical indexes, it is
observed that after submersion, similar saturation
degrees were reached for each energy, from about 70%
for the standard compaction energy and 80% for the
modified, even though the initial saturations differed
significantly. The same behavior was observed for the
moisture contents after submersion in the standard
compaction energy, where all specimens presented
approximately 13.5% in moisture content.
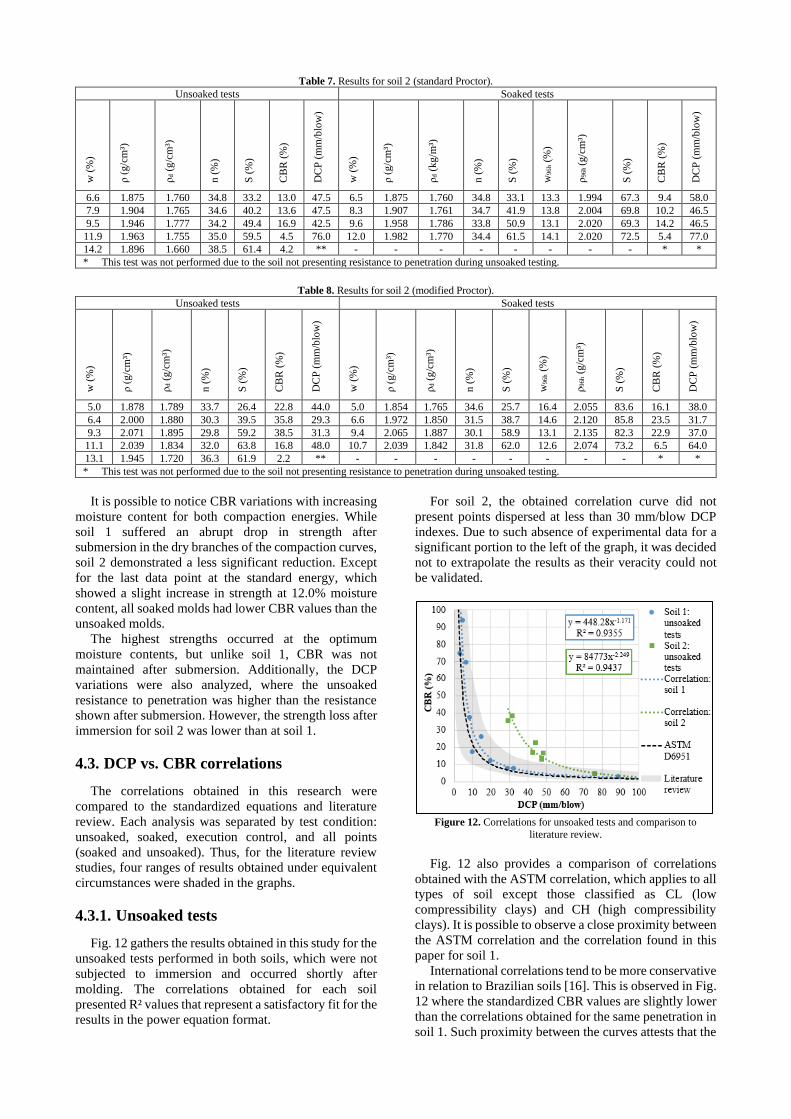
Table 7. Results for soil 2 (standard Proctor).
Unsoaked tests Soaked tests w
(%
)
ρ (
g/c
m³)
ρd (
g/c
m³)
n (
%)
S (
%)
CB
R (
%)
DC
P (
mm
/blo
w)
w (
%)
ρ (
g/c
m³)
ρd (
kg/m
³)
n (
%)
S (
%)
w9
6h (
%)
ρ9
6h
(g/c
m³)
S (
%)
CB
R (
%)
DC
P (
mm
/blo
w)
6.6 1.875 1.760 34.8 33.2 13.0 47.5 6.5 1.875 1.760 34.8 33.1 13.3 1.994 67.3 9.4 58.0
7.9 1.904 1.765 34.6 40.2 13.6 47.5 8.3 1.907 1.761 34.7 41.9 13.8 2.004 69.8 10.2 46.5
9.5 1.946 1.777 34.2 49.4 16.9 42.5 9.6 1.958 1.786 33.8 50.9 13.1 2.020 69.3 14.2 46.5
11.9 1.963 1.755 35.0 59.5 4.5 76.0 12.0 1.982 1.770 34.4 61.5 14.1 2.020 72.5 5.4 77.0
14.2 1.896 1.660 38.5 61.4 4.2 ** - - - - - - - - * *
* This test was not performed due to the soil not presenting resistance to penetration during unsoaked testing.
Table 8. Results for soil 2 (modified Proctor).
Unsoaked tests Soaked tests
w (
%)
ρ (
g/c
m³)
ρd (
g/c
m³)
n (
%)
S (
%)
CB
R (
%)
DC
P (
mm
/blo
w)
w (
%)
ρ (
g/c
m³)
ρd (
g/c
m³)
n (
%)
S (
%)
w9
6h (
%)
ρ9
6h (
g/c
m³)
S (
%)
CB
R (
%)
DC
P (
mm
/blo
w)
5.0 1.878 1.789 33.7 26.4 22.8 44.0 5.0 1.854 1.765 34.6 25.7 16.4 2.055 83.6 16.1 38.0
6.4 2.000 1.880 30.3 39.5 35.8 29.3 6.6 1.972 1.850 31.5 38.7 14.6 2.120 85.8 23.5 31.7
9.3 2.071 1.895 29.8 59.2 38.5 31.3 9.4 2.065 1.887 30.1 58.9 13.1 2.135 82.3 22.9 37.0
11.1 2.039 1.834 32.0 63.8 16.8 48.0 10.7 2.039 1.842 31.8 62.0 12.6 2.074 73.2 6.5 64.0
13.1 1.945 1.720 36.3 61.9 2.2 ** - - - - - - - - * *
* This test was not performed due to the soil not presenting resistance to penetration during unsoaked testing.
It is possible to notice CBR variations with increasing
moisture content for both compaction energies. While
soil 1 suffered an abrupt drop in strength after
submersion in the dry branches of the compaction curves,
soil 2 demonstrated a less significant reduction. Except
for the last data point at the standard energy, which
showed a slight increase in strength at 12.0% moisture
content, all soaked molds had lower CBR values than the
unsoaked molds.
The highest strengths occurred at the optimum
moisture contents, but unlike soil 1, CBR was not
maintained after submersion. Additionally, the DCP
variations were also analyzed, where the unsoaked
resistance to penetration was higher than the resistance
shown after submersion. However, the strength loss after
immersion for soil 2 was lower than at soil 1.
4.3. DCP vs. CBR correlations
The correlations obtained in this research were
compared to the standardized equations and literature
review. Each analysis was separated by test condition:
unsoaked, soaked, execution control, and all points
(soaked and unsoaked). Thus, for the literature review
studies, four ranges of results obtained under equivalent
circumstances were shaded in the graphs.
4.3.1. Unsoaked tests
Fig. 12 gathers the results obtained in this study for the
unsoaked tests performed in both soils, which were not
subjected to immersion and occurred shortly after
molding. The correlations obtained for each soil
presented R² values that represent a satisfactory fit for the
results in the power equation format.
For soil 2, the obtained correlation curve did not
present points dispersed at less than 30 mm/blow DCP
indexes. Due to such absence of experimental data for a
significant portion to the left of the graph, it was decided
not to extrapolate the results as their veracity could not
be validated.
Figure 12. Correlations for unsoaked tests and comparison to
literature review.
Fig. 12 also provides a comparison of correlations
obtained with the ASTM correlation, which applies to all
types of soil except those classified as CL (low
compressibility clays) and CH (high compressibility
clays). It is possible to observe a close proximity between
the ASTM correlation and the correlation found in this
paper for soil 1.
International correlations tend to be more conservative
in relation to Brazilian soils [16]. This is observed in Fig.
12 where the standardized CBR values are slightly lower
than the correlations obtained for the same penetration in
soil 1. Such proximity between the curves attests that the

methodology of this research was followed appropriately
and that correlations developed for soil 1 may be
applicable in the field.
Although the classification of soil 2 (SW-SM) is
applicable for the plotted ASTM correlation, the distance
between the black and green curves indicates that the
standard estimate is not appropriate for this material, as
the predicted CBR values are significantly lower than the
actual results obtained experimentally.
Even though this soil has reached lower maximum
strengths, it is possible to notice that the position of its
curve is superior to soil 1 correlation at all points.
Therefore, for higher penetrations, soil 2 has higher CBR
values. Depending on the highway application, this can
be considered as an advantage considering that soil 1 has
superior CBR values only for DCPs up to 10.0 mm/blow.
This attests observations pointed out by previous studies
coarse-grained soils present higher CBR indexes than
fine-grained soils for a same DCP index [4, 10, 16].
The gray area represents the range of results
previously found in other studies, where it is possible to
observe that the unsoaked correlation for soil 1 was fully
contemplated by this range [4, 9, 10, 14 - 16]. Along with
the proximity to the ASTM correlation, this fit also
highlights the proper reproduction of both CBR and DCP
test procedures [10, 16].
On the other hand, there was a significant disparity
regarding the correlation curves obtained from previous
studies and the experimental points obtained for soil 2 in
this research. At lower strengths, both soils tend to
converge with the obtained trend lines.
4.3.2. Soaked tests
Similarly, the tests performed in the soaked condition
were also plotted (Fig. 13). Due to the significant loss of
strength in soil 1 after submersion, especially when
compacted out of the optimum moisture content, the
displacement of the other points to lower positions in the
curve is noticeable. It is also possible to identify that, for
this soil, an almost perfect adjustment of the
experimental points has occurred.
As in the unsoaked trials, the experimental points for
soil 2 were also started at 30 mm/blow, and both soil
samples presented lower CBR values when compared to
Fig. 12. Even though the range of experimental points
through the horizontal axis was reduced, high R² values
were still obtained.
Among the analyzed studies, only two correlations
were strictly developed under soaked conditions [3, 14],
implying a smaller range of previous results. Even with a
restricted range of previous studies, a similar positioning
is observed for the soaked soil 1 correlation. Meanwhile,
soil 2 demonstrated the same behavioral trend, in which
it deviated from the range of results suggested by the
bibliography.
Since using the soaked correlation requires DCP tests
after atypical conditions of soil immersion, the lack of
scientific evidence for this test condition may be
justified. However, the evaluation of soaked correlations
presents high relevance to analyze the displacement of
the curves after submersion, and thus visualize the soil
strength loss.
Figure 13. Correlations for soaked tests and comparison to literature
review.
The correlation presented for soil 1 in Figure 13,
however, suggests that after 20 mm/blow the soaked
values tend to be higher than the unsoaked values. Such
behavior can be credited to the mathematical adjustment
of experimental points on the trendline. For this reason,
it is recommended to use the correlation developed with
all points presented in item 4.3.3., as it better represents
the material behavior, regardless of whether it is
subjected to drainage deficiencies or not.
4.3.3. Soaked and unsoaked tests
In order to obtain a representative correlation of the
behavior described by both samples, all points with and
without submersion were plotted on a single graph. As
shown in Fig. 14, the R² values of the trendlines were still
higher than 0.90. Such analysis is relevant once the soil
cannot be expected to present unsoaked CBR values
during excessive rainfall and unefficient drainage
conditions.
Figure 14. Correlations for soaked and unsoaked tests and comparison
to literature review.
After assessing both soaked and unsoaked curves, it
was observed that the behavior expectation was reached,
as the unsoaked DCP indexes were lower than the soaked
results. Additionally, and the unsoaked CBR values were
higher than the soaked strength. The same strength
behavior is observed in relation to the two previous
comparisons, where soil 1 is within the range of previous

studies and soil 2 has a significant discrepancy in
strength.
The literature review correlation range presented in
the figure is a combination of the unsoaked (Fig. 12) and
soaked (Fig. 13) ranges, in addition to correlations
developed by [2, 4, 16].
4.3.4. Execution control
According to the previous studies presented in the
literature review, several authors also evaluate so-called
“design” correlations for the estimate of the project CBR
after immersion for 96 (ninety-six) hours, from unsoaked
DCP indexes [4, 17, 18]. The R² values obtained by the
authors ranged from 0.71 [4] to 1.00 [17], which indicates
that there may be a close relationship between these two
parameters when there is no abrupt loss in soil strength
after immersion.
However, due to the potentially collapsible behavior
presented by soil 1, unlike the previous studies, it was not
possible to establish an adequate correlation between the
unsoaked DCP and the soaked CBR for this material.
Such inaccuracy to determine the project CBR can be
concluded from the coefficient of determination
presented in Fig. 15, which shows that the points
obtained do not relate to each other.
Although the execution control correlation for soil 1
presented a corresponding R² value less than 0.20, it can
be observed that the curve still fits the range of published
execution control correlations [4, 17, 18, 34].
Opposed to soil 1, the small strength losses after
immersion experienced by soil 2 allowed the estimate of
an execution control correlation with a desirable fit. The
lower CBR values predicted for soil 2 classify this
correlation as conservative for road design.
Such behavior demonstrated by soil 1 shows that the
comparison of the correlations obtained with previous
studies should not be taken as absolute, as the fit of the
experimental data must be analyzed first. Thus, while the
correlations of soil 2 present satisfactory coefficients of
determination (R²) and deviate from the strength pattern
expected by the literature, the correlation of execution
control in soil 1 presents an insufficient data dependence
that is suggested to be satisfactory by the range set by
previous studies.
Figure 15. Correlations for execution control and comparison to
literature review.
Except for the execution control correlation developed
from soil 1 data (Fig. 15), all correlations determined in
this research demonstrate that there is indeed a strong
relationship between the two evaluated experimental
parameters (CBR and DCP). This attests to the validity
of the dynamic cone penetrometer as an efficient tool to
evaluate soil strength [33].
The close similarity between existing correlations [13]
and the equations developed for soil 1 characterizes that
the ASTM correlation is representative for that material,
although such correspondence did not occur for soil 2.
The inadequacy of assuming a unique correlation
between CBR and DCP for a wide range of soil types and
classifications had already been pointed out by previous
authors[10].
4.3.5. Final results
All correlations obtained in this experimental study, as
well as their respective coefficients of determination
(R²), are presented in Table 9 below.
Table 9. Equation parameters for all correlations developed.
Sample Test condition Equation parameters
A B R²
Soil 1
Unsoaked 448 -1.17 0.94
Soaked 5456 -1.97 0.97
Soaked & unsoaked 1013 -1.46 0.90
Execution control 60.5 -0.70 0.19
Soil 2
Unsoaked 84773 -2.25 0.94
Soaked 10102 -1.74 0.94
Soaked & unsoaked 34662 -2.04 0.91
Execution control 7317 -1.70 0.83
In all comparisons developed, the same behavior was
repeated for both samples, regardless of the test condition
evaluated. While soil 1 presented high data correlation
and fit into the reference ranges, soil 2 also presented
high data correlation but did not fit into the results from
60 equations developed in previous studies. However,
even though soil 2 presented a distinct behavior, the
validity of the equations found can be attested by the high
R² values obtained for each trendline established.
In all cases, soil 2 curves were positioned to the upper
right, suggesting that the sample presents a higher
strength. The position of these curves can be attributed to
two main factors: the substantial geological and climate
discrepancies from previous studies developed at four
distinct continents; and the different methodologies to
perform the DCP test, where small variations for all
points are sufficient to significantly alter a correlation. A
total of five different research methodologies were
identified in this literature review.
Standardization of experimental procedures is of
fundamental importance for the consistent and safe
comparison of results for different soil types. The
simplicity of the DCP test method, applied to the use of
reliable correlations for an efficient CBR estimate,
characterizes the dynamic cone penetrometer as a
promising equipment to paving quality control in Brazil
and worldwide.
The use of appropriate correlations to the study site
and soil minimizes the occurrence of erroneous results
due to possible differences in soil composition and
conditions to which it is subjected.
5. Conclusions
The results obtained in the present study represent an
advance in the definition and standardization of a simple
methodology, which was proved to be efficient and safe
for the estimate of empirical correlations between the
California bearing ratio and the dynamic cone
penetration index.
To do so, empirical correlations were established
between the DCP and CBR indexes of two soils found in
Natal, Rio Grande do Norte, Brazil. All tests were
performed in the laboratory, and high coefficients of
determination (R²) were obtained, which reinforce the
existing association between the two geotechnical
parameters already pointed out by previous authors.
Soil 1 was classified as a silty sand (SM), and soil 2
was similarly classified as a well-graded silty sand (SM-
SW). Due to the lack of plasticity of both soils, the A-2-
4 highway classification was assigned. Although both
soils presented almost identical classifications, it was
found that the overall strength and compaction behaviors
described by both samples were substantially different,
suggesting that conventional geotechnical classifications
are not best suited to tropical soils.
It was observed that, while soil 1 presented the highest
CBR values and lowest DCP indexes, the molded
specimens also experienced the largest loss of strength
with the increase of moisture content. The range of
results for this soil was significant, and varied from
0.43% to 93.63% for the CBR test, and from 3.44
mm/blow to 97.0 mm/blow for the DCP test. Meanwhile,
soil 2 suffered less expressive CBR variations between
4.46% and 38.54%, and 29.3 mm/blow up to 77.0
mm/blow for the DCP index.
The literature review of previous studies served as a
complementary tool to certify the validity of the
equations found. However, due to discrepancies in the
methods used by the previous authors, such validity
could only be verified for soil 1. Therefore, the results
obtained by this experimental research led to the
conclusion that it is of pertinent interest to the
geotechnical community, which is the creation of a
database of related studies, preceded by a methodological
standardization for the development of these equations.
This way, future studies should standardize the
methodology for establishing empirical correlations from
a comparison of the existing methods, and evaluate the
most suitable procedure to perform the tests. Future field
analysis should also include the boundary effect caused
by the cylindrical molds, which certainly provides a
higher lateral confinement in the tested samples. Such
investigation would allow to understand in-depth how the
test and boundary conditions affect the position of the
correlation curves in the graphs, and how these factors
interfere with the interpretation of soil strength.
Acknowledgments
Acknowledgements to the Federal University of Rio
Grande do Norte (UFRN) for providing the infrastructure
required to perform this experimental research.
References
[1] AMADI, A. A. et al. Case study of construction quality control
monitoring and strength evaluation of a lateritic pavement using
the dynamic cone penetrometer. International Journal of Pavement Research and Technology, [s.l.], v. 11, n. 5, p.530-539, set. 2018.
Available at: <https://www.sciencedirect.com/science/arti-
cle/pii/S1996681417300172>. Accessed: 31 jul. 2018. [2] PEREIRA, T. C, Uma contribuição para a determinação de pro-
priedades físicas e mecânicas de materiais granulares compactos,
com recurso a penetrômetro dinâmico ligeiro, (A contribution to the determination of physical and mechanical properties of com-
pact granular materials, using the fast dynamic penetrometer).
MSc – Universidade do Porto, 2010. (in Portuguese) Available at: <https://repositorioa-
berto.up.pt/bitstream/10216/57626/1/000143286.pdf>. Accessed:
31 jul. 2018. (in portuguese) [3] FERNANDES, R. Desenvolvimento de correlação entre os en-
saios DCP e CBR. Estudo de caso: pista de testes, (Development
of correlation between DCP and CBR tests), UFSC-Joinville. Fi-
nal undergraduate project - Universidade Federal de Santa Cata-
rina, 2015. Available at: <https://repositorio.ufsc.br/xmlui/han-
dle/123456789/157141>. Accessed: 21 aug. 2018. (in portuguese) [4] ALVES, A. B. C. Avaliação da capacidade de suporte e controle
tecnológico de execução da camada final de terraplenagem utili-
zando o penetrômetro dinâmico de cone, (Carrying capacity eva-luation and technological control of final layer of earthworks
using the dynamic cone penetrometer), MSc – Universidade Fe-
deral de Santa Catarina, 2002. Available at: <http://reposito-rio.ufsc.br/xmlui/handle/123456789/83257>. Accessed: 31 jul.
2018. (in portuguese)
[5] BENEVIDES, L. D. Avaliação do uso do DCP em areias para con-trole da capacidade de carga em fundações diretas e controle de
compactação de aterros, (Evaluation of DCP usage in sands for
carrying capacity control in shallow foundations and earthwork compaction), MSc – Universidade Federal do Rio Grande do
Norte, 2012. Available at: <https://repositorio.ufrn.br/jspui/bit-
stream/123456789/14836/1/LarissaDB_DISSERT.pdf>. Ac-
cessed: 31 jul. 2018. (in portuguese)
[6] AMERICAN SOCIETY FOR TESTING AND MATERIALS. D6951/D6951M: Standard Test Method for Use of the Dynamic
Cone Penetrometer in Shallow Pavement Applications. West Con-
shohocken, 2018. [7] ALVES FILHO, C. E. S. Correlações para obtenção de parâmetros
geotécnicos de argilas compressíveis com utilização do penetrô-
metro dinâmico leve, (Correlations for the obtainment of geotech-nical parameters of compressible clays utilizing the dynamic cone
penetrometer), MSc – Universidade Federal de Ouro Preto, 2010.
Available at: <http://www.repositorio.ufop.br/han-dle/123456789/3231>. Accessed: 31 jul. 2018. (in portuguese)
[8] RODRIGUES, D. M. P et al. Caracterização da fundação de pavi-
mentos com os resultados do ensaio do penetrômetro dinâmico li-geiro, (Characterization of paving foundations with results from
the fast dynamic penetrometer), In: CONGRESSO LUSO-BRA-
SILEIRO DE GEOTECNIA, 8., 2016, Porto. Anais do 8º Con-gresso Luso-Brasileiro de Geotecnia. Porto, 2016. (in portuguese)
[9] AL-REFEAI, T; AL-SUHAIBANI, A. Prediction of CBR using
dynamic cone penetrometer. Journal of King Saud University-En-gineering Sciences, [s.l.], v. 9, n. 2, p.191-203, 1997. Available at:
<https://www.sciencedirect.com/science/arti-
cle/pii/S1018363918306767>. Accessed: 15 dec. 2018. [10] LIMA, L. C. O ensaio DCP aplicado no controle de qualidade de
compactação de obras viárias executadas com solos lateríticos de
textura fina, (The application of DCP tests in the quality control of road works built on fine-grained lateritic soils), PhD Instituto
Tecnológico de Aeronáutica, 2000. Available
at:<http://bdtd.ibict.br/vufind/Rec-ord/ITA_38ec2635684a0de0edf9e30f0ad46c8f>. Accessed: 24
mar. 2019 (in portuguese)
[11] AMARAL, F. C. F. Previsão da capacidade de suporte de areias médias e finas uniformes em obras viárias com o emprego do en-
saio DCP, (Carrying capacity estimation for medium and fine uni-
form sands in road works employing the DCP), MSc – Instituto Tecnológico de Aeronáutica, 2005. Available
at:<http://bdtd.ibict.br/vufind/Rec-
ord/ITA_c645545ecf49442733d0bf0ca5ecd874>. Accessed: 24 mar. 2019. (in portuguese)
[12] AMPADU, S. I. K; FIADJOE, G. J. y. The influence of water con-
tent on the Dynamic Cone Penetration Index of a lateritic soil sta-
bilized with various percentages of a quarry by-product. Transpor-
tation Geotechnics, [s.l.], v. 5, p.68-85, dez. 2015. Elsevier BV.
http://dx.doi.org/10.1016/j.trgeo.2015.09.007. Available at:<https://www.sciencedirect.com/science/arti-
cle/pii/S2214391215000288>. Accessed: 28 nov. 2018.
[13] WEBSTER, S. L; GRAU, R. H; WILLIAMS, T. P. Description and application of dual mass dynamic cone penetrometer. Wash-
ington: United States Army Corps of Engineers, 1992. 26 p.
[14] OLIVEIRA, L. E. Contribuição à implantação de obras viárias ur-banas de baixo volume de tráfego com o uso de solos transicionais,
(Contribution towards the implantation of low traffic urban road
works using transitional soils), PhD - Instituto Tecnológico de Ae-ronáutica, 1998. Available at:<http://bdtd.ibict.br/vufind/Rec-
ord/ITA_d2fc8f25ed026f3b908636dca8629220/Details>. Ac-
cessed: 24 mar. 2019. (in portuguese) [15] GABR, M. A. et al. DCP criteria for performance evaluation of
pavement layers. Journal of Performance of Constructed Facili-
ties, [s.l.], v. 4, n. 14, p.141-148, nov. 2000. Available at:
<https://ascelibrary.org/doi/abs/10.1061/(ASCE)0887-
3828(2000)14:4(141)?casa_to-
ken=CWRwsG7VN1UAAAAA:BwSCHYFYKOy4z8-sidIDW9EwVZPA6etG5Oe8FJqetEXUbH2PhOVGdsui-
YJBD1HjwMdngv3lRVkSf>. Accessed: 21 aug. 2018.
[16] CARVALHO, R. G. Correlações entre os ensaios DCP e CBR para solos saprolíticos de textura fina, (Correlation between DCP
and CBR for saprolitic fine grained soils), MSc – Instituto Tecno-
lógico de Aeronáutica, 2005. Available at: <http://bdtd.ibict.br/vufind/Rec-
ord/ITA_4a66589440a89b904339613e5b2fbbed/Details>. Ac-
cessed: 20 aug. 2018. (in portuguese) [17] FONTES, L. P. T. L. Contribuição à investigação geotécnica de
vias urbanas não pavimentadas através do emprego do penetrôme-
tro dinâmico de cone, (Contribution towards the investigation of urban unpaved roads through the use of the dynamic cone pene-
trometer), MSc - Universidade Federal de Santa Catarina, 2001.
Available at: <https://repositorio.ufsc.br/han-dle/123456789/81548> Accessed: 31 jul. 2018. (in portuguese)
[18] FRANCISCO, L. C. J; BERNARDO, Z. C. R. Determinación de
la correlación entre los índices DCP in situ y CBR de laboratorio, (Determination of correlation between in situ DCP and laboratory
CBR tests), Final undergraduate project – Universidad de Cuenca,
2017. Available at: <http://dspace.ucuenca.edu.ec/jspui/han-dle/123456789/28567>. Accessed: 21 aug. 2018. (in spanish)
[19] SMITH, R. B; PRATT, D. N. A field study of in situ California
bearing ratio and dynamic cone penetrometer testing for road sub-grade investigations. Australian Road Research, [s.l.], v. 13, n. 4,
p.285-294, dec. 1983.
[20] LIVNEH, M. Validation of correlations between a number of pen-etration tests and in situ California bearing ratio tests. Transporta-
tion Research Record, [s.l.], v. 1219, p.56-67, 1989. Available at: <http://onlinepubs.trb.org/Onlinepubs/trr/1989/1219/1219-
006.pdf>. Accessed: 02 jun. 2019.
[21] GEORGE, V.; RAO, N. C.; SHIVASHANKAR, R. PFWD, DCP and CBR correlations for evaluation of lateritic subgrades. Inter-
national Journal of Pavement Engineering, [s.l.], v. 10, n. 3, p.189-
199, jun. 2009. Informa UK Limited. http://dx.doi.org/10.1080/10298430802342765. Available at:
<https://www.tandfonline.com/doi/abs/10.1080/1029843080234
2765>. Accessed: 02 jun. 2019. [22] KUMAR, R. S.; AJMI, A. S.; VALKATI, B. Comparative Study
of Subgrade Soil Strength Estimation Models Developed Based
on CBR, DCP and FWD Test Results. International Advanced Re-search Journal in Science, Engineering and Technology, [s.l.], v.
2, n. 8, p.92- 102, 20 ago. 2015. Tejass Publisheers.
http://dx.doi.org/10.17148/iarjset.2015.2820. Available at: <https://www.researchgate.net/publication/282454703_Compar-
ative_Study_of_Subgrade_Soil_Strength_Estimation_Mod-
els_Developed_Based_on_CBR_DCP_and_FWD_Test_Re-sults>. Accessed: 02 jun. 2019.
[23] MONTEIRO, F. F. et al. CBR value estimation using dynamic
cone penetrometer - A case study of Brazil's Midwest federal high-way. The Electronic Journal of Geotechnical Engineering, [s.l.],
v. 21, p.4649-4656, 2016. Available at:
<http://www.ejge.com/2016/Ppr2016.0449ma.pdf>. Accessed: 02 jun. 2019.
[24] WILCHES, F. J; DÍAZ, J. J. F; ÁVILA, J. R. H. Correlation be-
tween California Bearing Ratio (CBR) and Dynamic Cone Pene-
trometer (DCP) for soil from Sincelejo city in Colombia. Interna-
tional Journal of Applied Engineering Research, ISSN 0973-4562,
[s.l.], v. 13, n. 4, p.2068-2071, feb. 2018. Available at:<http://www.ripublication.com/ijaer18/ijaerv13n4_37.pdf>.
Accessed: 21 ago. 2018.
[25] AMERICAN SOCIETY FOR TESTING AND MATERIALS. C136/C136M: Standard Test Method for Sieve Analysis of Fine
and Coarse Aggregates. West Conshohocken, 2014.
[26] AMERICAN SOCIETY FOR TESTING AND MATERIALS. D854: Standard Test Method for Specific Gravity of Soil Solids
by Water Pycnometer. West Conshohocken, 2014.
[27] AMERICAN SOCIETY FOR TESTING AND MATERIALS. D4318: Standard Test Method for Liquid Limit, Plastic Limit, and
Plasticity Index of Soils. West Conshohocken, 2017.
[28] AMERICAN SOCIETY FOR TESTING AND MATERIALS. D698: Standard Test Method for Laboratory Compaction Charac-
teristics of Soil Using Standard Effort (12 400 ft-lbf/ft3 (600 kN-
m/m3)). West Conshohocken, 2012.
[29] AMERICAN SOCIETY FOR TESTING AND MATERIALS.
D1557: Standard Test Method for Laboratory Compaction Char-
acteristics of Soil Using Modified Effort (56,000 ft-lbf/ft3 (2,700 kN-m/m3)). West Conshohocken, 2012.
[30] AMERICAN SOCIETY FOR TESTING AND MATERIALS.
D1883: Standard Test Method for California Bearing Ratio (CBR) of Laboratory-Compacted Soils. West Conshohocken, 2016.
[31] HOLTZ, R. D; KOVACS, W. D; SHEAHAN, T. C. An introduc-
tion to geotechnical engineering. 2. ed. Upper Saddle River: Pear-son, 2011. 853 p
[32] BARNES, G. Mecânica dos solos: Princípios e práticas, (Soil me-
chanics: fundamentals and practices). 3. ed. Rio de Janeiro: Else-vier, 2016. 549 p. (in portuguese)
[33] WU, S; SARGAND, S. Use of dynamic cone penetrometer in sub-
grade and base acceptance. 2007. 124f. Ohio Research Institute for Transportation and the Environment. Ohio University. Avail-
able at: <https://ntlrepository.blob.core.win-
dows.net/lib/55000/55800/55820/FHWA-OH-2007-01.PDF>. Accessed: 24 mar. 2019.
[34] DENIS, A. R; GLORIA, A. Investigating the relationship between
CBR obtained from DCP test and laboratory soaked CBR for local subgrade soil. Final undergraduate project - Uganda Christian
University, 2017. Available at: <https://www.aca-
demia.edu/35096056/INVESTIGATING_THE_RELATION-SHIP_BETWEEN_CBR_OB-
TAINED_FROM_DCP_TEST_AND_LABORATORY_SOAKE
D_CBR_FOR_LOCAL_SUBGRADE_SOIL_UGANDA>. Ac-cessed: 02 jun. 2019.