Embed Size (px)
Citation preview
J Sci Food Agric 1996,72,283-290
Correlation of HPLC and AOAC Methods to Assess the All-trans-Lutein Content in Marigold Flowers
U
Francisco Delgado-Vargas and Octavio Paredes-Lopez* Depto de Biotecnologia y Bioquimica, Unidad Irapuato, Centro de Investigacibn y de Estudios Avanzados del IPN, Apdo Postal 629,36500 Irapuato, Gto, Mexico
(Received 27 July 1995; revised version received 31 January 1996; accepted 24 May 1996)
Abstract: A reversed-phase C,, high-performance liquid chromatography (HPLC) method was used to separate the lutein isomers of marigold flowers. The pigments were extracted from marigold meal by an Association of Official Ana- lytical Chemists (AOAC) modified method. The unsaponified extract showed the presence of several lutein ester isomers and after saponification four major lutein isomers were detected. The relationship between all-trans-lutein, assessed by HPLC, and total xanthophylls, assessed by AOAC, was determined. A regression equation, with a high correlation coefficient (r2 = 0.972), which allows for the calculation of all-trans-lutein from total xanthophylls content is proposed.
Key words : HPLC, AOAC, lutein, carotenoids, pigments, marigold.
INTRODUCTION
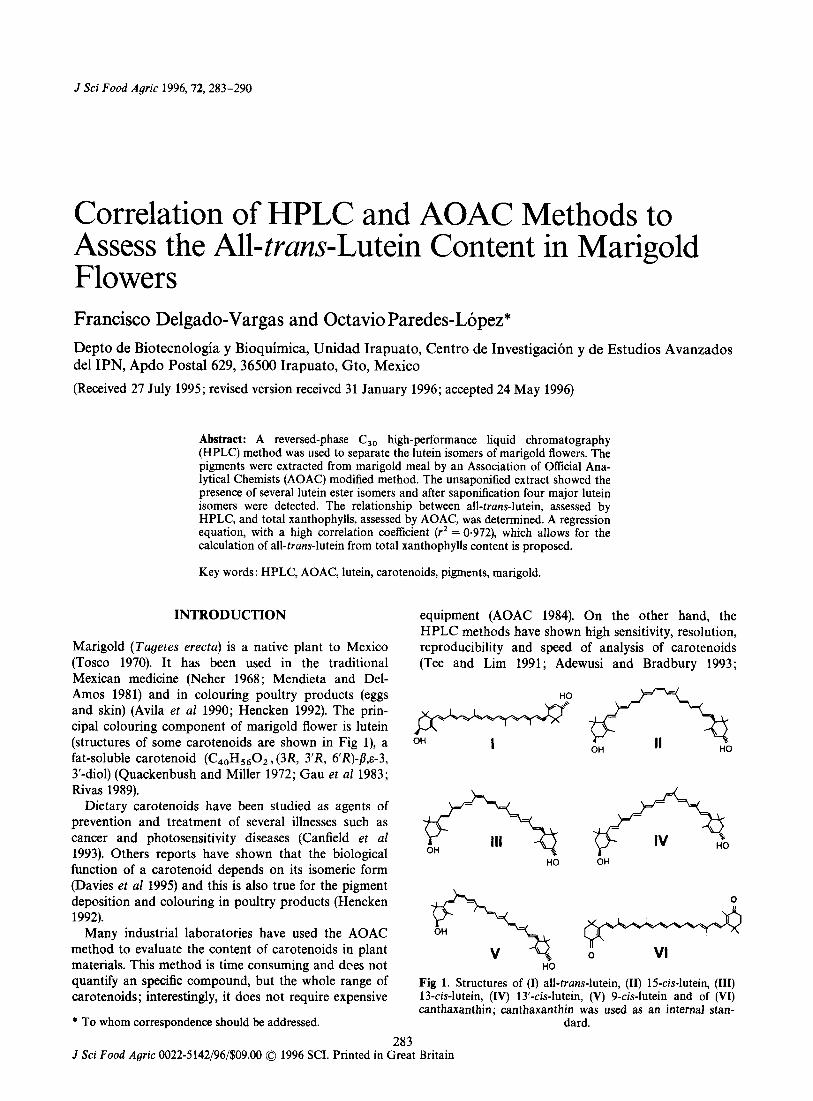
Marigold (Tagetes erecta) is a native plant to Mexico (Tosco 1970). It has been used in the traditional Mexican medicine (Neher 1968; Mendieta and Del- Amos 1981) and in colouring poultry products (eggs and skin) (Avila et a1 1990; Hencken 1992). The prin- cipal colouring component of marigold flower is lutein (structures of some carotenoids are shown in Fig l), a fat-soluble carotenoid (C40H5602, (3R, 3’R, 6R)-/3,&-3, 3’-diol) (Quackenbush and Miller 1972; Gau et al 1983; Rivas 1989).
Dietary carotenoids have been studied as agents of prevention and treatment of several illnesses such as cancer and photosensitivity diseases (Canfield et a1 1993). Others reports have shown that the biological function of a carotenoid depends on its isomeric form (Davies et al 1995) and this is also true for the pigment deposition and colouring in poultry products (Hencken 1992).
Many industrial laboratories have used the AOAC method to evaluate the content of carotenoids in plant materials. This method is time consuming and dces not quantify an specific compound, but the whole range of carotenoids; interestingly, it does not require expensive
* To whom correspondence should be addressed.
equipment (AOAC 1984). On the other hand, the HPLC methods have shown high sensitivity, resolution, reproducibility and speed of analysis of carotenoids (Tee and Lim 1991; Adewusi and Bradbury 1993;
HO
I OH
HO
OH HO
OH
0
II 0 VI
HO
Fig 1. Structures of (I) all-trans-lutein, (11) 15-cis-lutein, (111) 13-cis-lutein, (IV) 13’-cis-lutein, (V) 9-cis-lutein and of (VI) canthaxanthin; canthaxanthin was used as an internal stan-
dard. 283
J Sci Food Agric 0022-5142/96/$09.00 0 1996 SCI. Printed in Great Britain
284 F Delgado-Vargas, 0 Paredes-Lopez
Sander et a1 1994). Additionally, the introduction of the photodiode array detector (PAD) has allowed the iden- tification of carotenoids after the HPLC separation by using spectral characteristics. Moreover, PAD provides the spectrum (it is useful for the determination of cis/ trans isomers), absorbance ratio and criteria for assess- ing the purity of the peaks (Bramley 1992; Schoefs et a1 1995). Most HPLC separations of carotenes and xan- thophylls have been performed using reversed-phase systems (Ruddat and Will 1985; Tee and Lim 1991). Some reversed-phase C1 8 columns have resolved carot- enoid geometric isomers (Saleh and Tan 1991; Chen et al 1994; Schoefs et a1 1995), but to date none of the studies about HPLC separations of marigold pigments has shown the presence of lutein isomers (Gau et a1 1983; Gregory et al 1986; Rivas 1989). In this respect, Gau et a1 (1983) and Gregory et a1 (1986) did not use PAD detector and the on-line analysis of lutein isomers was not possible. The investigation reported by Rivas (1989) focused on the separation of lutein and lutein esters; the author did not report the spectral maxima for the peaks presented in the HPLC chromatogram. Sander et at (1994) took into account the hydrophobic characteristics of carotenoids and introduced a new reversed-phase, the triacontyl polymeric surface C,, . Also, they claimed that this phase is better for carot- enoid separations and isomeric resolution than c18
columns. The aim of this work was to produce a good
resolution of lutein isomers using HPLC with a tri- acontyl polymeric surface-C,, column. Another aim was to establish a regression equation to relate the total xanthophylls, assessed by AOAC, with the all-trans- lutein contents, assessed by HPLC, in marigold flowers.
MATERIALS A N D METHODS
Plant materials
Fresh marigold (Tagetes erecta) flowers were kindly supplied by Industrial Organica, SA, Monterrey, Mexico. The flowers were separated from the recep- tacles and processed fresh or dried; a total of one fresh sample and 32 dried marigold meals, with varying content of carotenoids, were analysed in this study.
Standards
Lutein (75%) and all-trans-canthaxanthin were obtained from Sigma (St Louis, MO, USA).
Canthaxanthin stock-solution
A 0.003 g sample of canthaxanthin was dissolved in 50 ml of methanol (internal standard).
Sample preparation
Careful attention was paid during the extraction and preparation of marigold pigments. All solvents were pure and processing was developed under dim light conditions. In extraction of marigold flower meal the AOAC method was used but without column separa- tion (AOAC 1984). One dried marigold meal and one fresh marigold sample were processed without saponifi- cation. Thus, for these samples the use of heat and pot- assium hydroxide was not necessary. Samples were analysed immediately or wrapped with aluminium foil and stored at - 20°C under nitrogen until use.
Samples for the calibration curve of all-trans-lutein
An stock solution of lutein was prepared by dissolving 0.001 g of lutein in 10 ml of methanol and also dilu- tions to cover the range 2.3-18.7 pg m1-l. We con- sidered for calculations that commercial lutein contained 75% of lutein, as indicated by the commercial distributor; it was verified by HPLC that the principal component was all-trans-lutein. One hundred micro- litres of each dilution was injected to HPLC and the produced data were used to determine a regression equation for the calibration curve.
Samples for HPLC analysis
Five millilitres of marigold pigment extract and 1 ml of canthaxanthin solution were mixed. The solution was passed through a 0-45 pm PTFE filter membrane (Millipore, Bedford, MA, USA), concentrated under a nitrogen stream and dissolved in 2 ml of previously fil- tered methanol. The solvents for the stock solutions were previously filtered.
Photoisomerisation
A saturated solution of all-trans-lutein in methanol was prepared. An aliquot from this solution was analysed immediately by HPLC, and another one was illumi- nated under direct sunlight for 10 min, covered with aluminium foil and stored until analysis.
HPLC analysis
Hewlett-Packard (HP) (Palo Alto, CA, USA) model 1050 equipped with a quaternary pump solvent delivery, degassification system, autosampler, oven and PAD was used. The data were stored and processed by means of an HP-Vectra 486/66 XM and an H P Laserjet

Correlation of HPLC and AOAC methods to assess all-trans-
- 800 -
- -
A
600- S 0 R - 0 A N 400- C E
-
-
-
- - -
200 -
Jutein 285
111111
4 plus printer. The absorption spectra of the pigments were recorded between 260 and 550 nm. The HP- computer with a built-in Chemstation program was used to control all the HP-1050 modules and to evalu- ate all the HPLC parameters. The time and wavelength resolution were 1 s and 2 nm, respectively. One hundred microlitres of pigment samples were injected.
Separations were carried out with a YMC PACK C,, (YMC Inc, Morris Plains, NJ, USA) reversed-phase column (5 pm; 25 cm x 4.6 mm id). A solvent-gradient programme was used to obtain an adequate separation and detection of the pigments. The solvents were degassed prior to use by bubbling helium (1 5 min) through them. Solvent A (methanol) was mixed with increasing proportions of solvent B (isopropyl alcohol) and after that solvent C (hexane) was added. The pro- gramme was as follows: solvent A was delivered iso- cratically from 0 to 6 min, 4 min linear gradient to 5% solvent B, 5 min isocratically with 5% solvent B, 10 rnin linear gradient to 25% solvent B, 5 rnin linear gradient to 50% solvent B, 10 rnin linear gradient to 75% solvent B-25% solvent C and 10 rnin isocratically with the last mixture. The column was re-equilibrated between two samples analysis for a minimum of 17 rnin with solvent A. All runs were performed at 28°C. The flow-rate was 1 ml min-' and the detection was rea- lised simultaneously at 286, 350, 400 and 450 nm. Solvents were purchased from Merck (Darmstadt, Germany).
Peak identification
Peaks on a chromatogram were identified by comparing their retention times and spectra with those of authentic standards (all-trans-canthaxanthin, all-trans-lutein and its photoisomerisation products), and by comparison of the absorbance maxima obtained here with those in the literature (Rivas 1989; Britton 1991; Biacs and Daood 1994). The identification of some cis-isomers of carot- enoids was also based on the appearance of an extra maximum around 330 nm in the absorption spectrum of the individual peaks (Chandler and Schwartz 1987; Goodwin and Britton 1988; Saleh and Tan 1991).
Quantitation of all-trans-lutein
All-trans-lutein was quantitated by using a regression equation obtained from the calibration curve.
Spectrophotometric determination of total xanthophylls
It was done by using the AOAC modified method (AOAC 1984). A Beckman DU 640 UV-vis spectropho- tometer (Beckman Instruments, Berkeley, CA, USA)
was used for the AOAC determinations by reading at 474 nm.
RESULTS AND DISCUSSION
HPLC analysis
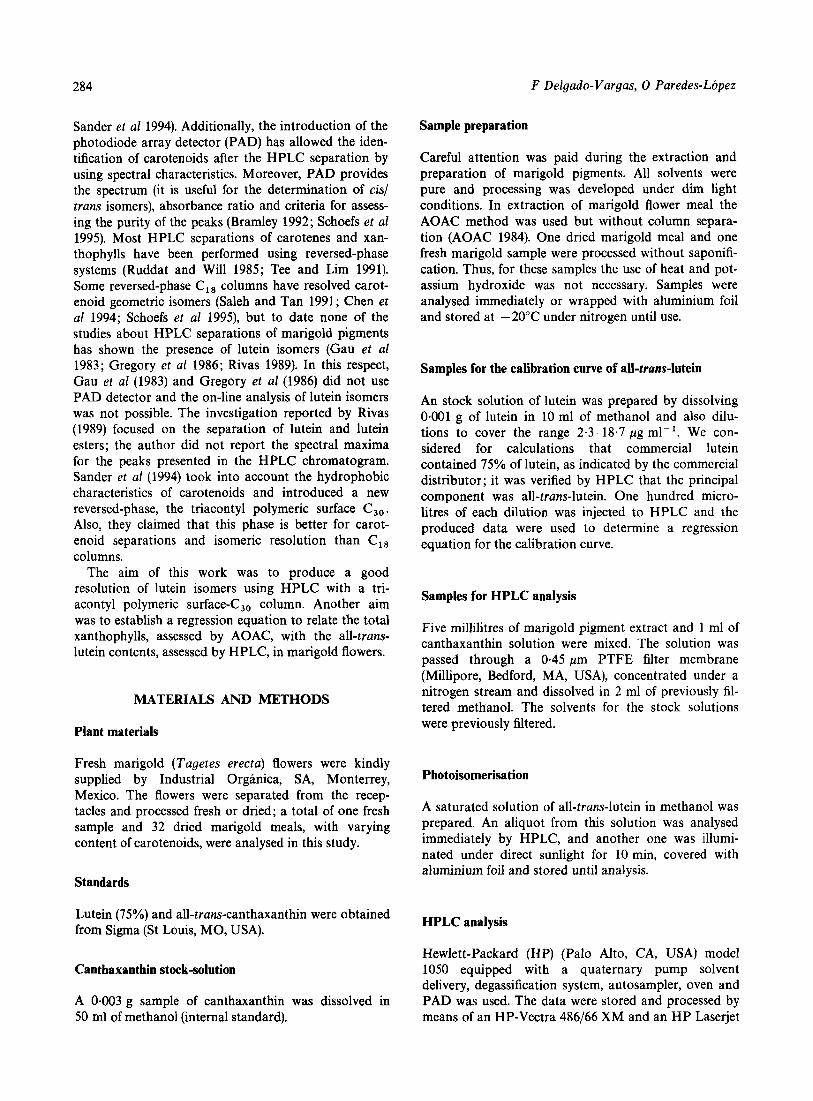
A typical chromatogram of lutein esters from an unsa- ponified extract of dried marigold flower is shown in Fig 2. The peaks were identified as lutein esters in agreement with the spectral characteristics (Table 1) and with previous reports (Gau et a1 1983; Gregory et al 1986; Rivas 1989). The absorbance maxima were similar to the values obtained by Rivas (1989) and Biacs and Daood (1994). Spectral maxima (Table 1) of peaks 1 and 4 (Fig 2) indicate that they correspond to esters of cis- lutein, in that they exhibited a shift toward shorter wavelengths with respect to the bigger peaks, for example 6 and 7, which according to their spectral maxima seem to correspond to esters of different fatty acids with all-trans-lutein. Additionally, peaks 1 and 4 also showed the formation of a cis peak that appeared around 330 nm (Khachik et a1 1986; Chandler and Sch- wartz 1987; Saleh and Tan 1991). These maxima and shifts suggest the presence of 13-cis, 13'-cis and/or 15-cis lutein isomers, because among the most probable
mAul 7 I
o+-
6
5
9
30 40 50 I---+/, I ' ' ' ' ' ' ' ' ' ' n
rnin RETENTION TIME
Fig 2. Reversed-phase HPLC at 450 nm of an unsaponified extract of marigold meal. For absorbance maxima data, see
Table 1.
286 I; Detgado- Vargas, 0 Paredes-Lbpez
TABLE 1 Absorbance maxima in the elution mixture of the peaks presented in Fig 2
Peak Absorbance maxima in the eluent t,, a R, Peak number (nm) (min) purity
1 2 3 4 5 6 7 8 9
10
269, 331,421,443,471 269,421,443,471
271,423 (Sh'), 449, 467 (Sh) 271, 333,423,445,473
269,423,447,475 269,423,447,475 269,423,447,475 271,423,447,475 271,423,447,475 271,423,447,475
38.763 39.707 40.020 40.690 41.260 41.953 42-63 1 43-117 43.721 44.904
2.6 0.8 0.8 1-3 1.3 1-7 1.4 1 -3 1.3 2.3
996.70 993.36 986-60 966-60 999.60 999.90 999.90 995.50 NAd
998.4
a tR., corrected retention time.
' Sh, shoulder. R,, resolution.
NA, not available.
isomers that could be formed (9-, 9-, 13-, 13'- and 154s) only the central ones (13, 13' and/or 154s) have a dipole moment which is big enough as to produce a considerable cis peak, as reported by Zechmeister (1944). Also, it is likely that peaks 2 and/or 3 corre- spond to 9-cis and/or 9 '4s lutein esters because their maxima showed an hypsochromic change with respect to the all-trans-lutein maxima and those peaks did not show the characteristic 330 nm maximum (Table 1) (Khachik et al 1986). Gau et a1 (1983) showed an absorption spectrum of an extract of marigold petals which clearly exhibited the characteristic absorbance maximum of cis-lutein isomers (around 330 nm), but they did not mention it. Rivas (1989) used PAD and no isomers were reported. In view that the chromatogram showed in Fig 2 corresponds to the unsaponified extract of the dried marigold meal, and considering that it was not necessary to heat and that this extraction was carried out in a short time (1 h vs 3 h of the AOAC method), under dim light and avoiding the contact with oxygen, then the probability of the cis-peaks observed being artefacts is considered to be low. Moreover, it would be expected to find cis-isomers in the dried mari- gold meal, which would have been formed during the drying process (60°C during 24 h under vacuum).
On the other hand, when we worked with the unsa- ponified extract of fresh marigold petals, under the same conditions described above for dried marigold meal, its HPLC chromatogram (data not shown) also exhibited the peaks that correspond to cis-lutein isomers, although certainly their intensities were lower than those of the unsaponified extract of dried marigold meal. The area percentage for the cis-lutein peaks in the unsaponified fresh flower extract was c 4%.
Some previous research works have shown the pres- ence of free lutein in unsaponified extracts (Gregory et
al 1986; Rivas 1989) but we have not detected it. The retention times were higher than previously reported studies (Gau et al 1983; Gregory et al 1986). However, when we analysed the HPLC chromatograms at 286 and 350 nm (data not shown), peaks with retention times lower than 10 min were observed and the spectra of these peaks were different from the typical carotenoid spectra. Some of these peaks showed a maximum in the range of 230-250 nm, and others had a maximum between 330 and 350nm; based on this evidence we believe that the peaks correspond to flavonoids and thiophenes, respectively. These compounds have been identified already in plants of the Tagetes genus (DAgostino et a1 1992; Croes et al 1994). The spectrum of a peak eluting at c 3.5 min (detected at 286 and 350 nm) showed a strong absorbance around 280 nm and smaller maxima that could be assigned to carot- enoids; thus, it is possible that this is a protein- carotenoid complex. In brief, these fast-eluting peaks look very interesting but still our information about them is scarce and further investigation is needed.
After saponification the lutein ester peaks disap- peared and free lutein peaks with lower retention times were observed; therefore it was considered inconvenient to diminish the elution time because the peaks detected at 286 and 350 nm could interfere with the free lutein peaks. Interestingly, resolution values for lutein esters have not been shown before. The peak purity (>950) and resolution (not as high as 1.5 (Kirkland 1971)) in our separations (Table 1) were good enough to quanti- tate most of the peaks.
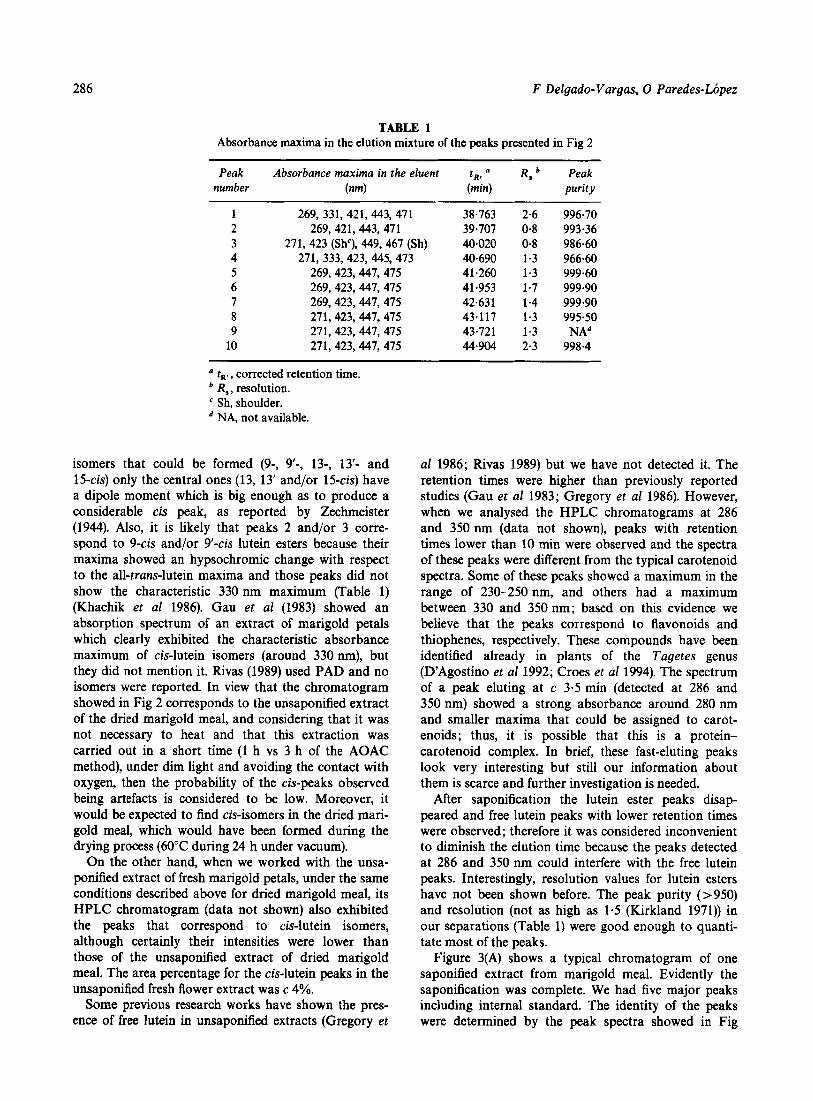
Figure 3(A) shows a typical chromatogram of one saponified extract from marigold meal. Evidently the saponification was complete. We had five major peaks including internal standard. The identity of the peaks were determined by the peak spectra showed in Fig
Correlation of HPLC and AOAC methods to assess all-trans-lutein 287
175;
Norm
70
A 60 0
A N 30 C E 2o
I 0
0
250 300 350 400 450 nm WAVELENGTH
Fig 3. HPLC analysis of saponified pigments from dried marigold meal. (A) Chromatogram of pigments; these were extracted by the AOAC modified method and recorded at 450 nm. (B) Absorbance spectra of: ---, 13'-cis-lutein; 0, 13-cis-lutein; A, all-trans-lutein and -, 9 or 9-cis-lutein in the elution mixture. These spectra correspond to peaks 1, 2, 3
and 4 in Fig 3A, respectively.
3(B). Peaks 1 and 2 were tentatively identified as central isomers of lutein (Khachik et a1 1986); they correspond to 13'-cis-lutein and 13-cis-lutein, respectively, because the first one showed higher Q ratio (ratio of absorbance of the middle main absorption peak to the absorbance of the cis peak) (Goodwin and Britton 1988; Saleh and Tan 1991). Peak 3 was all-trans-lutein based on authen- tic standard absorbance data. Peak 4 was 9 or 9 '4s- lutein because it did not show strong absorbance around 330 nm and had an spectral structure finer than all-trans-lutein (Khachik et al 1986; Saleh and Tan 1991). The identity of all peaks was also confirmed by absorbance data previously reported (Biacs and Daood 1994; Britton 1991) and by the peaks and spectra obtained from photoisomerised lutein (data not shown). Other studies support as well that the principal isomers of plant carotenoids are those reported in this paper (Khachik et a1 1992; O'Neil and Schwartz 1995). Peak 5 was the internal standard canthaxanthin.
The quality of the separation was evaluated by means of resolution and purity values of the peaks (Table 2). The retention factors (k') showed the elution of the free lutein isomers in a reasonable time (k' < 0.15). The standard error of mean (SEM) indicated a good repro- ducibility of the experiment (SEM < 0.004). The resolution and peak purity were higher than 1.5 (Kirkland 1971) and 999, respectively; these data cor- roborated a good separation. Our chromatographic separation of lutein isomers was better than others pre- viously reported (Khachik et al 1992; Chen and Chen 1993; Can0 and De-Ancos 1994; Schoefs et a1 1995) and it was similar to that by Sander et al (1994) for 8- carotene isomers. These results showed that the prin- cipal pigment of marigold flower was lutein, which
TABLE 2 Lutein isomers separated by reversed-phase HPLC"
Peak Pigment k ' b Rs Peak number purity
1 13'-cis-Lutein 0.157 2.0 999.80
2 13-cis-Lutein 0.137 2.0 999.83
3 All-trans-lutein 0-117 4.1 999.91
(0.002)
(0403)
(0.002) 4 9 or 9-cis-lutein 0.087 5.7 N A ~
5 All-trans-canthaxanthin 0.080 3.8 999.8 (0-003)
(internal standard) (0-003)
* See Fig 3. * k', retention factor, mean of four determinations with the standard error of the mean in parentheses.
R,, resolution. NA, not available.

288 F Delgado-Vargas, 0 Paredes-Lbpez
suggested that we could omit the column separation step in the AOAC method (AOAC 1984), avoiding thus a possible degradation; the pigment content could be calculated as total xanthophylls.
AOAC modified method analysis
The results obtained by this method are shown in Table 3.
Regression and correlation analysis
After testing the HPLC method, we proceeded to demonstrate that total xanthophylls calculated by the AOAC method and all-trans-lutein measured by HPLC showed a linear relation. The internal standard tech-
TABLE 3 Total xanthophylls (AOAC method) and all-trans-lutein (HPLC method) values determined for marigold flower meals
and used for the regression analysis"
Sample AOAC HPLC number (ms k s - (ms kl-7
1 2 3 4 5 6 7 8 9
10 11 12 13 14 15 16 17 18 19 20 21 22 23 24 25 26 27 28 29 30 31 32
13429 10 479 13 107 11 812 9509 15 272 9243 19 570 9137 10 536 8707
19015 8892
10618 9230
24 482 13400 11 745 14 480 11 371 9426 14 666 8941
20 750 9125 10 795 9638 19 110 9225 11 190 9310
21 429
14 509 11 369 14 158 14 353 9664 16 856 10 170 21 102 9289 11 187 10 757 22 127 9452 11 186 10 129 27 946 14 200 12 657 14075 12 943 8286 14039 9464
22 696 10 082 11 340 9888
21 589 9850 12406 8886
22 268
" All values were based on the dry weight of marigold flower meal.
nique allowed us to conclude that no losses of lutein occurred in the preparation of the sample for HPLC. The calibration curve equation for all-trans-lutein was as follows :
A = 517.94L - 55.97, r2 = 0.992 (adjusted r2)
where A is the area (mAU s) and L is all-trans-lutein
Table 3 shows the data obtained by both the AOAC modified and the HPLC method for 32 marigold samples. In general, the AOAC values were smaller than HPLC values because the AOAC method estimates the total xanthophylls by reading at 474 nm which is not the absorbance maximum wavelength for all-trans- lutein (around 445 nm). The regression equation allow- ing the calculation of all-trans-lutein content from the total xanthophyll values was as follows:
m1- I).
L = 1.133 x -717.953, r2 = 0.972 (adjusted r2)
where L is mg of all-trans-lutein per kg of marigold meal (dry basis) and X is mg of total xanthophylls per kg of marigold meal (dry basis).
Table 4 shows the regression parameters. The differ- ences between the AOAC modified method and HPLC values were also reflected by the regression line slope (> 1). The intercept standard error of 472.14 was rela- tively high, but this may be expected considering that X = 0 was not in the range of values for the indepen- dent variable used in this experiment (Table 3). The results for the intercept parameter indicate that the intercept was not statistically different from zero, and this was in accordance with our physical problem. The slope standard error (0.0351) was less than 5% of the mean (1.133). For the slope parameter, we rejected the hypothesis that the slope was zero and in consequence the model proposed here was significant.
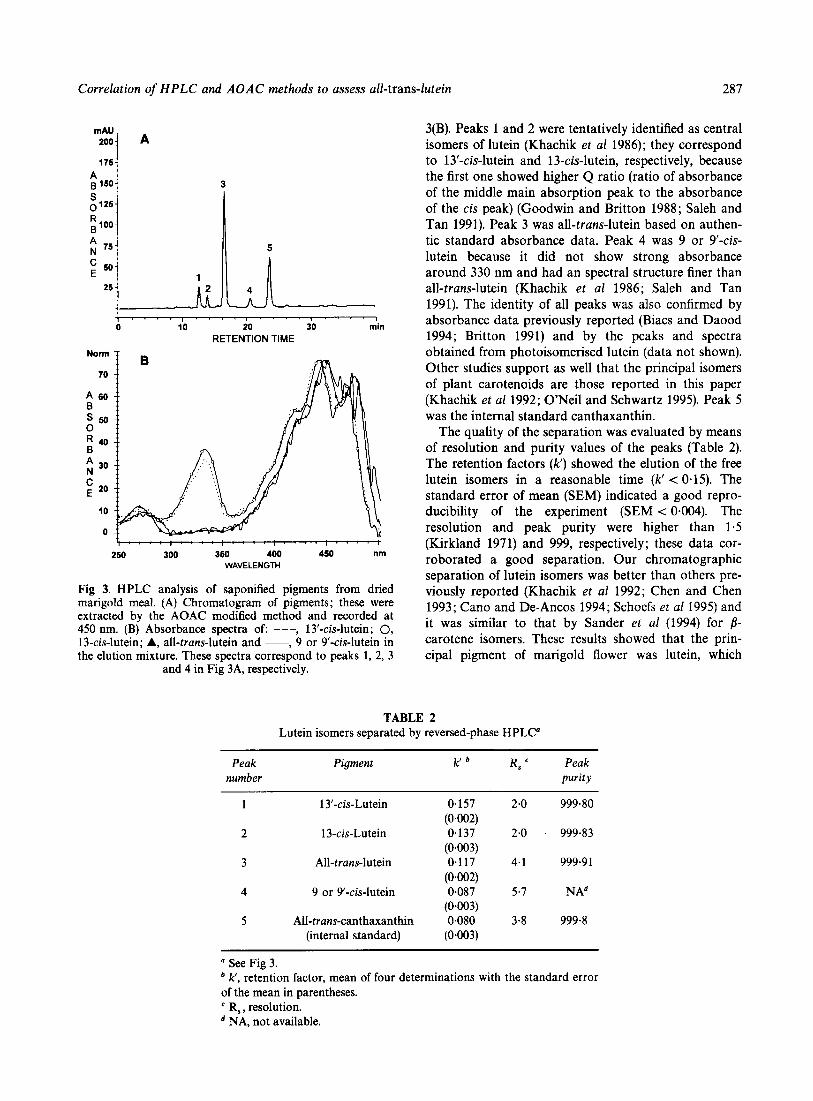
We also carried out a lack of fit test. For these calcu- lations we considered samples of the same origin as rep- licates (samples 1 and 17, 2 and 18, up to 16 and 32 in Table 3), and with this test we found that the model fitted the observed data (P = 0.919). Thus in general, the regression parameters indicated that both variables (X and L) had a good relationship. The linearity was acceptable for these variables and this was confirmed by the correlation coefficient (0.972) and also by the stan- dard error of the regression (855.636). Figure 4 shows that all data points fall within the 95% confidence inter- val in relation to the predicted values (Fig 4A); also, experimental values were around the line of 45" slope (Fig 4B) as expected; the residuals did not show any tendencies and were equally dispersed around the hori- zontal line (residual = 0) (Fig 4C) and finally, the stan- dardised residuals distribution was approximately normal in shape (Fig 4D), which was corroborated with the tests chi square (chi square = 2.859, P = 0.091) and Kolmogorov-Smirnov (P = 0.354), and also it is impor- tant to notice that all the standardised residuals are

Correlation of HPLC and AOAC methods to assess all-trans-lutein 289
TABLE 4 Regression parameters and their statistical analysis to obtain the all-trans- lutein content in marigold flower meals by using the total xanthophylls
value assessed by the AOAC modified methoda
Parameter Mean Standard error T value P value
Intercept -717.953 472.1 14 - 1.521 0.1388 Slope 1.133 0.0351 32.275 O~oooO
a These parameters arised from the analysis of 32 samples of marigold flower meal.
within three standard deviations from the mean. With this information, our conclusion was that all the hypo- teses used to fit the linear model were good, and that it was not necessary to look for another model in agree- ment with the parsimony principle. These results indi- cate that if marigold samples are similarly processed the proportion of all-trans-lutein to other lutein isomers, is constant.
This method detected cis-lutein isomers in unsaponified extracts of marigold flowers, which have not been reported previously, and identified tentatively four major lutein isomers in the saponified extracts. Total xanthophylls (AOAC modified) showed a good corre- lation coefficient with all-trans-lutein content; then, it was possible to determine all-trans-lutein content by using the AOAC modified method.
CONCLUSIONS ACKNOWLEDGEMENTS
The chromatographic method described here gives a separation of lutein isomers with high resolution values.
The authors gratefully acknowledge financial support by Consejo Nacional de Ciencia y Tecnologia-Mexico
I X 1000)
Total xanthophylls (AOAC)(mg kg" d.w.) (x 1000)
2100 : . . . . . . . . . . . . . . . .: . . . . . . . . ; . . . . . . . . . . . . . . . , . . . : . . . . . . . . rn] ; 0 .
. . . . . . . . . . . . . . 0 .
. ' . . . . . . . . , . . . . . . . . . . . . . . . . . . . . . . . . . . . . I
-19oot , , 1 , , , 0 , , I , , 1 , , , ~ , 1 - j a 1 1 14 17 20 23 26
Total xanthophylls (AOAC)(rng kg~' d.w.) (x 1000)
12 16 20 24 28 (X 1000) 8 8
Predicted values for All-trans-lutein(mg kg" d.w.)
I n L ! . : . ' . . ' . ....................................... 1 .'. I.:.' . . I . . ' . ' . . . '
u 1
-2.7 -1.7 -0.7 0.3 1.3 2.3 3.3 Standardized residuals
Fig 4. Validation of the regression analysis. (A) -, Regression line; and ---, limits for 95% confidence interval. (B) Plot of predicted vs observed values. (C) Residuals plot. (D) Standardised residuals histogram.

290 F Delgado-Vargas, 0 Paredes-Lcipez
and Industrial Organica, SA Monterrey, and technical assistance by Mr Angel G Alpuche-Solis, CINVESTAV-Irapuato.
REFERENCES
Adewusi S R A, Bradbury J H 1993 Carotenoids in cassava: Comparison of open-column and HPLC methods of analysis. J Sci Food Agric 62 375-383.
AOAC 1984 Official Methods of Analysis (14th edn). Associ- ation of Official Analytical Chemists, Arlington, VA, USA.
Avila E, Shimada A S, Llamas G 1990 Otros aditivos. In: Anabblicos y Aditivos en la Produccibn Pecuaria. Colegio de Posgraduados, Chapingo, Mexico, pp 239-250.
Biacs P A, Daood H G 1994 High performance liquid chro- mathography with photodiode-array detection of carot- enoids and carotenoid esters in fruits and vegetables. J Plant Physioll43 520-525.
Bramley P M 1992 Analysis of carotenoids by high- performance liquid chromatography and diode-array detec- tion. Phytochem Anal 3 97-104.
Britton G 1991 Carotenoids. In: Methods in Plant Biochem- istry, ed Dei Y. Academic Press, NY, USA, pp 473-518.
Canfield L M, Krinsky N I, James A 0 (Eds) 1993 Carot- enoids in Human Health. Annals of the New York Academy of Sciences, NY, USA.
Can0 M P, De-Ancos B 1994 Carotenoid and carotenoid ester composition in mango fruit as influenced by processing method. J Agric Food Chem 42 2737-2742.
Chandler L A, Schwartz S J 1987 HPLC separation of cis- trans carotene isomers in fresh and processed fruits and vegetables. J Food Sci 52 669-672.
Chen B H, Chen Y Y 1993 Stability of chlorophylls and carot- enoids in sweet potato leaves during microwave cooking. J Agric Food Chem 41 1315-1320.
Chen B H, Chen T M, Chien J T 1994 Kinetic model for studying the isomerization of a- and fl-carotene during heating and illumination. J Agric Food Chem 42 2391-2397.
Croes A F, Jacobs J J M R, Arroo R R J, Wullems G J 1994 Thiophene biosynthesis in Tagetes roots : molecular vs metabolic regulation. Plant Cell Tissue Organ Culture 38
DAgostino M, De-Simone F, Zhou Z J, Pizza C 1992 Flavo- no1 glycosides from Tagetes elliptica. Phytochemistry 31
Davies C M, Bustamante P L, Loach P A 1995 Reconstitution of the bacterial core light-harvesting complexes of Rho- dobacter sphaeroides and Rhodospirillum rubrum with iso- lated a- and 8-polypeptides, bacteriochlorophyll a and carotenoid. J Biol Chem 270 5793-5804.
Gau W, Ploschke H-J, Wunsche C 1983 Mass spectrometric identification of xanthophyll fatty acid esters from marigold flowers (Tagetes erecta) obtained by high-performance liquid chromatography and Craig counter-current distribu- tion. J Chromatogr 262 271-284.
159-165.
4387-4388.
Goodwin T W, Britton G 1988 Distribution and analysis of carotenoids. In: Plant Pigments, ed Goodwin T W. Aca- demic Press, London, UK, pp 62-132.
Gregory G K, Chen T-S, Philip T 1986 Quantitative analysis of lutein esters in marigold flowers (Tagetes erecta) by high performance liquid chromatography. J Food Sci 51 1093- 1094.
Hencken H 1992 Chemical and physiological behavior of feed carotenoids and their effects on pigmentation. Poultry Sci
Khachik F, Beecher G R, Whittaker N F 1986 Separation, identification and quantification of the major carotenoid and chlorophyll constituents in extracts of several green vegetables by liquid chromatography. J Agric Food Chem
Khachik F, Goli M B, Beecher G R, Holden J, Lusby W R, Tenorio M D, Barrera M R 1992 Effect of food preparation on qualitative and quantitative distribution of major carot- enoid constitutents of tomatoes and several green veget- ables. J Agric Food Chem 40 390-398.
Kirkland J J (Ed) 1971 Modern Practice at Liquid Chromatog- raphy. Wiley, NY, USA.
Mendienta R M, Del-Amos S R 1981 Plantas Medicinales del Estado de Yucatun. Instituto Nacional de Investigaciones sobre Recursos Bibticos, CECSA, Yucatan, Mexico, p 330.
Neher R T 1968 The ethnobotany of Tagetes. Econ Bot 22
ONeil C A, Schwartz S J 1995 Photoisomerization of 8- carotene by photosensitization with chlorophyll derivatives as sensitisers. J Agric Food Chem 43 631-635.
Quackenbush F W, Miller S L 1972 Composition and analysis of the carotenoids in marigold petals. J AOAC 55
Rivas J D L 1989 Reversed-phase high-performance liquid chromatographic separation of lutein and lutein fatty acid esters from marigold flower petal powder. J Chromatogr
Ruddat M, Will 0 H 1985 High-performance liquid chroma- tography of carotenoids. In: Methods in Enzymology (Vol 11 l), ed Law J H & Rilling HC. Academic Press, NY, USA,
Saleh M H, Tan B 1991 Separation and identification of cis/ trans carotenoid isomers. J Agric Food Chem 39 1438-1443.
Sander L C, Sharpless K E, Craft N E, Wise S A 1994 Devel- opment of engineered stationary phases for the separation of carotenoid isomers. Anal Chem 66 1667-1674.
Schoefs B, Bertrand M, Lemoine Y 1995 Separation of photo- synthetic pigments and their precursors by reversed-phase high-performance liquid chromatography using a photodiode-array detector. J Chromatogr A 692 239-245.
Tee E S, Lim C L 1991 The analysis of carotenoids and reti- noids: A review. Food Chem 41 147-193.
Tosco U 1970 Diccionario de Bothnica. Instituto Geografico de Agostini, Teide, Barcelona, Spain, p 235.
Zechmeister L 1994 Cis-trans isomerization and stereoche- mistry of carotenoids and diphenylpolyenes. Chem Rev 34
71 711-717.
34 603-616.
3 17-324.
6 1 7-62 1.
464 442-447.
pp 189-200.
267-344.