Embed Size (px)
Citation preview
Correlation of hospital charges and injury patterns using statewide
hospital discharge data
CIREN Annual Meeting
September 3, 2014
Overview
• To estimate the costs of injuries to different body regions
• CIREN’s inclusion criteria identifies a select group of injury patterns
• Interest in looking at cost (charges) of individual injuries for all hospitalized motor vehicle crash victims
Objectives • To provide average hospital costs (charges) by
most common single injury and most common pairs of injuries
• To provide the average cost (charges) at varying AIS severity levels – i.e. Chest AIS 2 vs 3 vs 4 vs 5
• To identify cost contribution per injury/injury level
• To look at incremental costs by injury severity
Background
• ‘The Economic and Societal Impact of Motor Vehicle Crashes, 2010’
• In 2010…
– 32,999 fatalities
– 3.9 million injuries
– 24 million vehicles damaged
Background
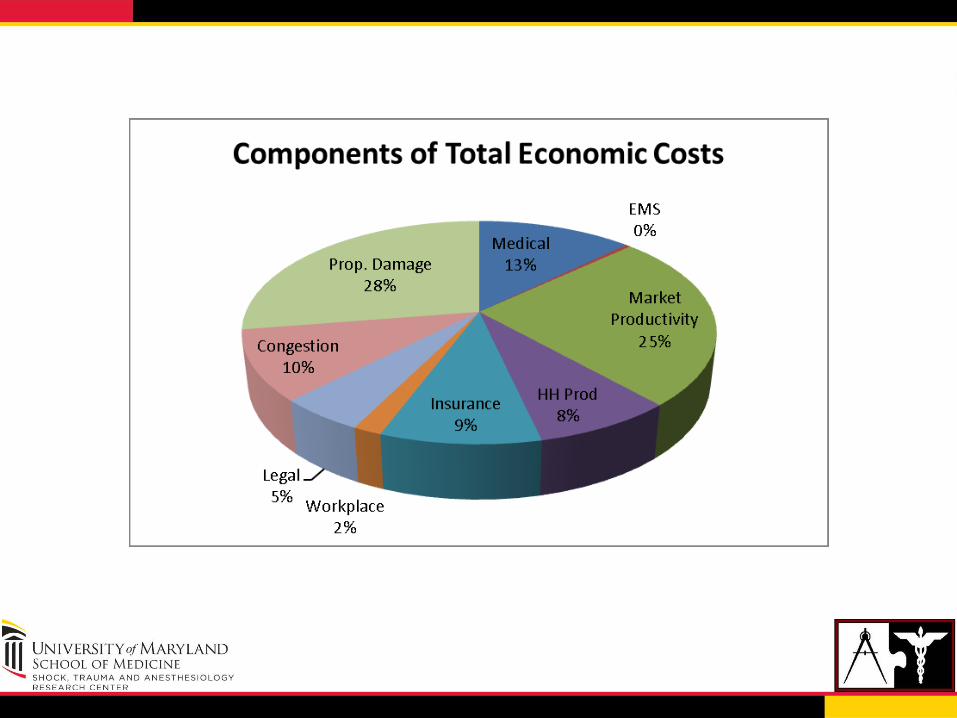
• Economic costs of crashes totaled $277B • Costs include
– Lost productivity ($93B) – Medical costs ($35B) – Legal and court costs – Emergency service costs – Insurance administration costs – Congestion costs ($28B) – Property damage – Workplace losses

Maryland Health Services Cost Review Commission
• Rate regulation established in 1971
• Sets rate for payers, including Medicare and Medicaid, since 1977
• Only state in nation to retain such a system
• 52 non-government entities reporting
• Ambulatory and inpatient care
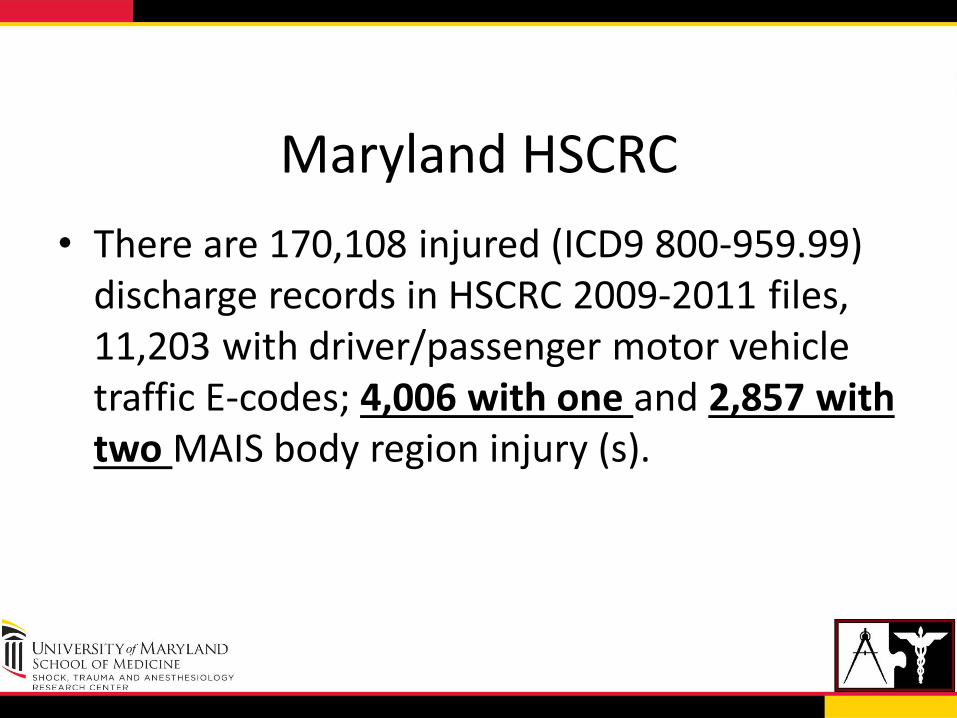
Maryland HSCRC
• There are 170,108 injured (ICD9 800-959.99) discharge records in HSCRC 2009-2011 files, 11,203 with driver/passenger motor vehicle traffic E-codes; 4,006 with one and 2,857 with two MAIS body region injury (s).
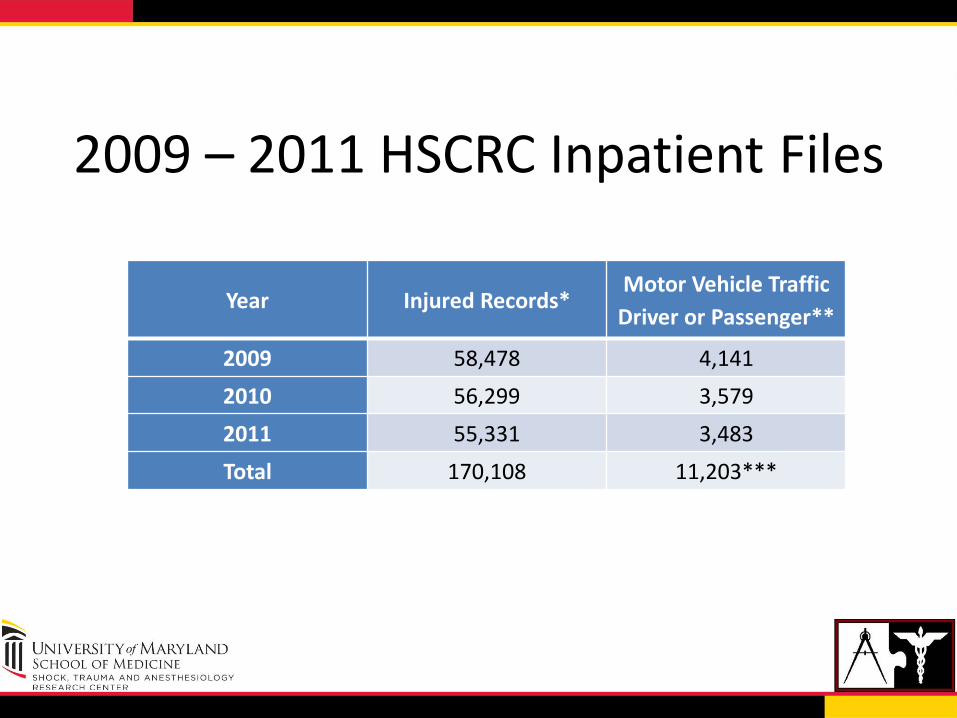
2009 – 2011 HSCRC Inpatient Files
Year Injured Records* Motor Vehicle Traffic
Driver or Passenger**
2009 58,478 4,141
2010 56,299 3,579
2011 55,331 3,483
Total 170,108 11,203***
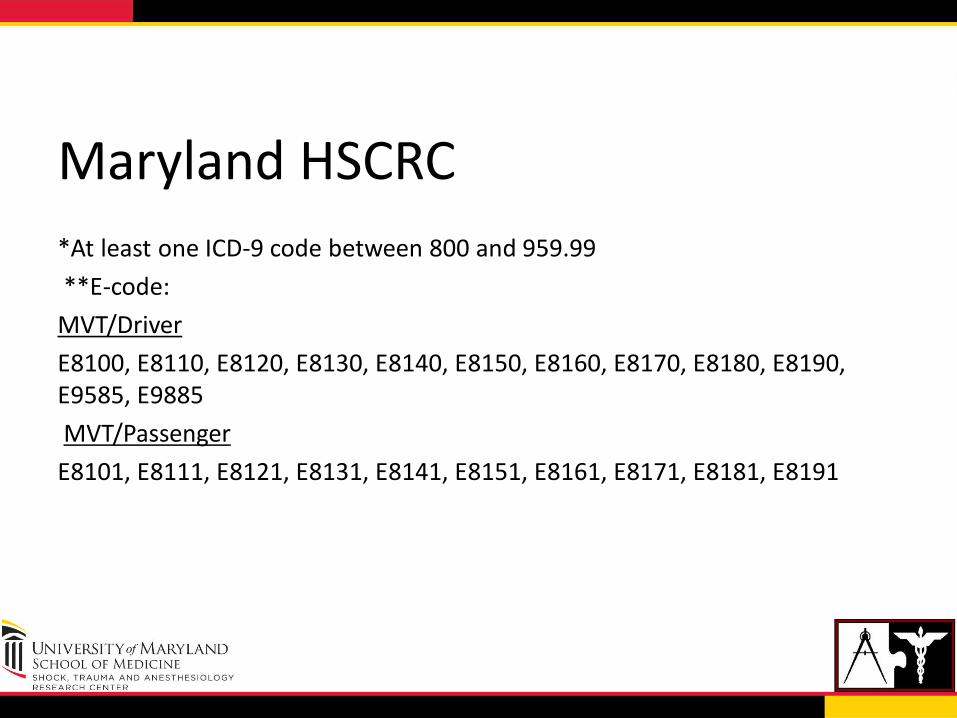
Maryland HSCRC
*At least one ICD-9 code between 800 and 959.99
**E-code:
MVT/Driver
E8100, E8110, E8120, E8130, E8140, E8150, E8160, E8170, E8180, E8190, E9585, E9885
MVT/Passenger
E8101, E8111, E8121, E8131, E8141, E8151, E8161, E8171, E8181, E8191
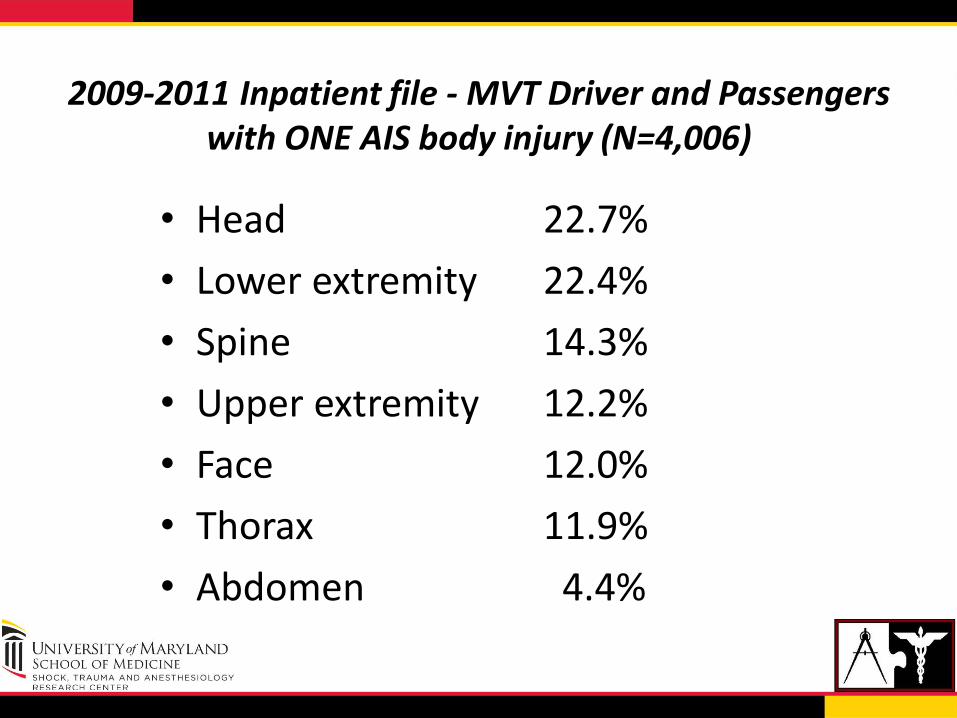
2009-2011 Inpatient file - MVT Driver and Passengers with ONE AIS body injury (N=4,006)
• Head 22.7%
• Lower extremity 22.4%
• Spine 14.3%
• Upper extremity 12.2%
• Face 12.0%
• Thorax 11.9%
• Abdomen 4.4%
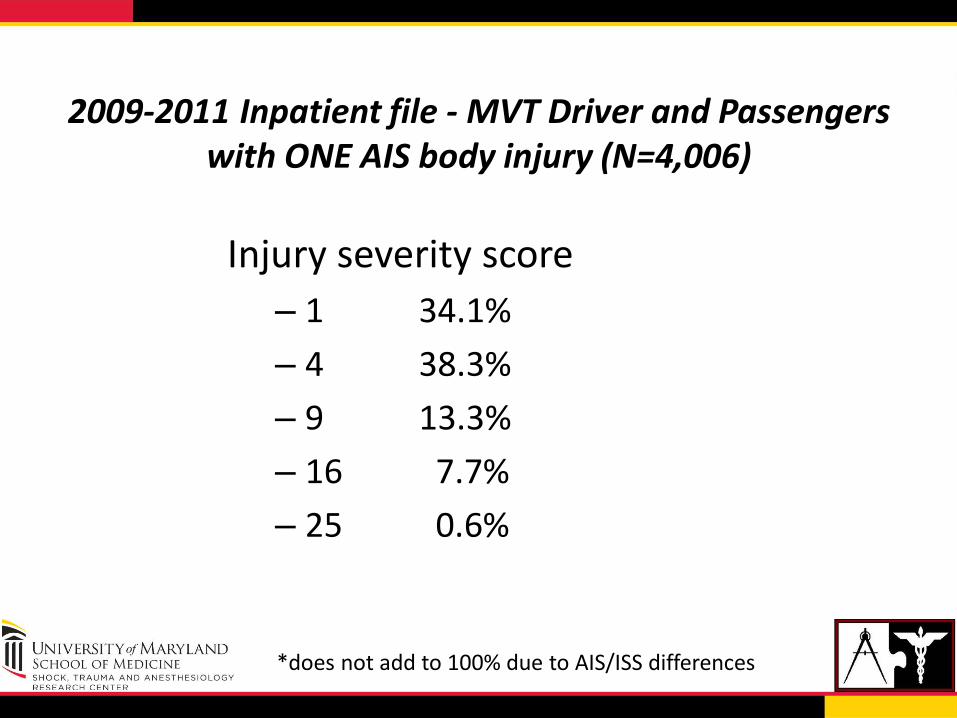
Injury severity score
– 1 34.1%
– 4 38.3%
– 9 13.3%
– 16 7.7%
– 25 0.6%
2009-2011 Inpatient file - MVT Driver and Passengers with ONE AIS body injury (N=4,006)
*does not add to 100% due to AIS/ISS differences
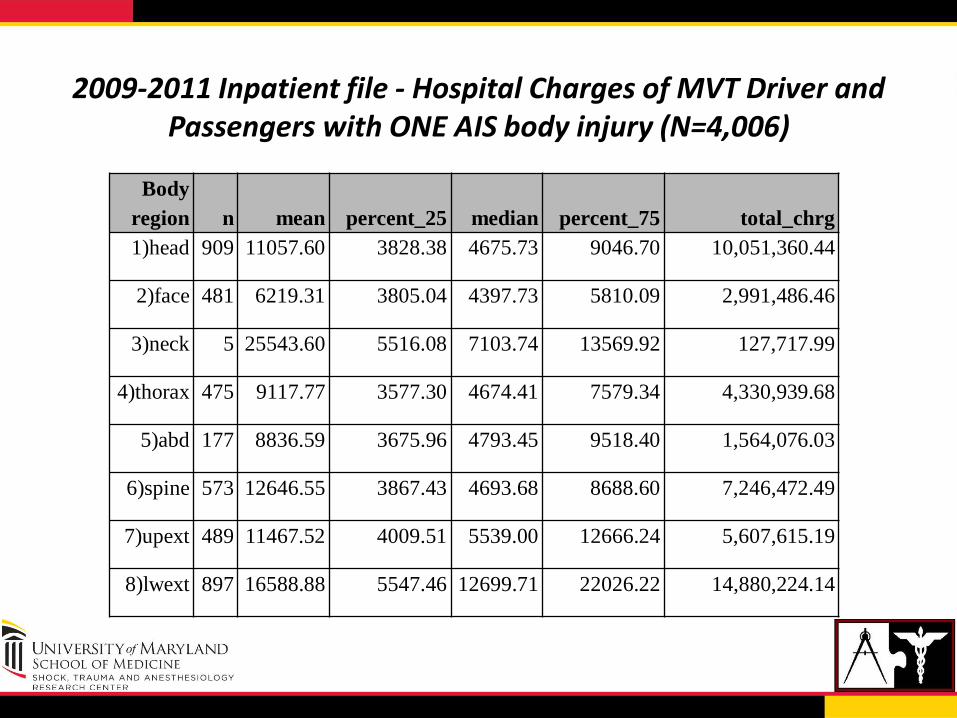
2009-2011 Inpatient file - Hospital Charges of MVT Driver and Passengers with ONE AIS body injury (N=4,006)
Body
region n mean percent_25 median percent_75 total_chrg
1)head 909 11057.60 3828.38 4675.73 9046.70 10,051,360.44
2)face 481 6219.31 3805.04 4397.73 5810.09 2,991,486.46
3)neck 5 25543.60 5516.08 7103.74 13569.92 127,717.99
4)thorax 475 9117.77 3577.30 4674.41 7579.34 4,330,939.68
5)abd 177 8836.59 3675.96 4793.45 9518.40 1,564,076.03
6)spine 573 12646.55 3867.43 4693.68 8688.60 7,246,472.49
7)upext 489 11467.52 4009.51 5539.00 12666.24 5,607,615.19
8)lwext 897 16588.88 5547.46 12699.71 22026.22 14,880,224.14
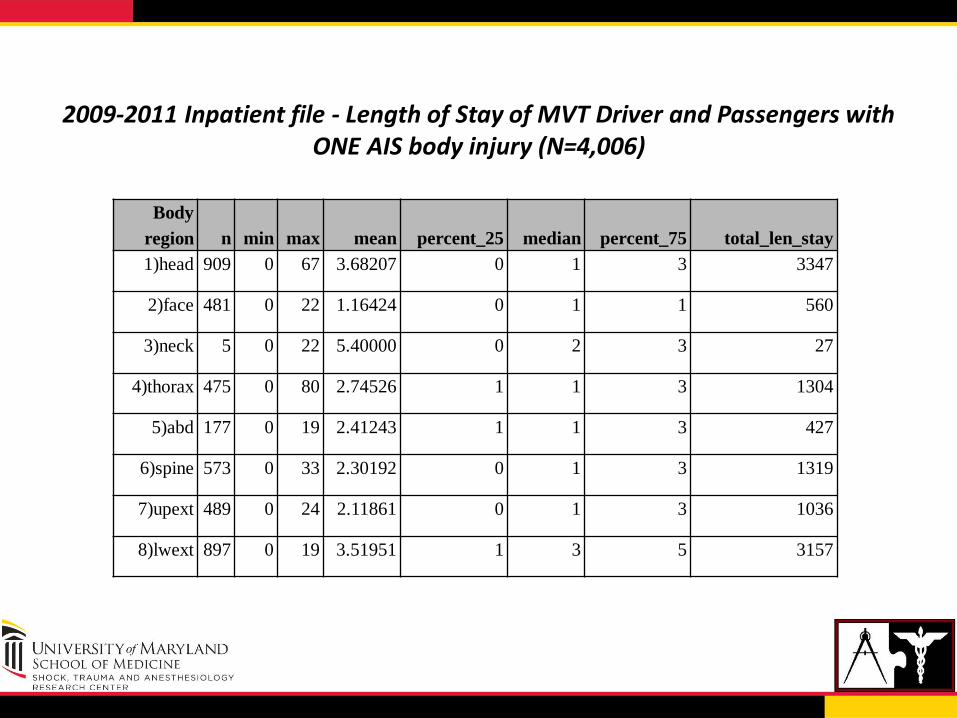
2009-2011 Inpatient file - Length of Stay of MVT Driver and Passengers with ONE AIS body injury (N=4,006)
Body
region n min max mean percent_25 median percent_75 total_len_stay
1)head 909 0 67 3.68207 0 1 3 3347
2)face 481 0 22 1.16424 0 1 1 560
3)neck 5 0 22 5.40000 0 2 3 27
4)thorax 475 0 80 2.74526 1 1 3 1304
5)abd 177 0 19 2.41243 1 1 3 427
6)spine 573 0 33 2.30192 0 1 3 1319
7)upext 489 0 24 2.11861 0 1 3 1036
8)lwext 897 0 19 3.51951 1 3 5 3157
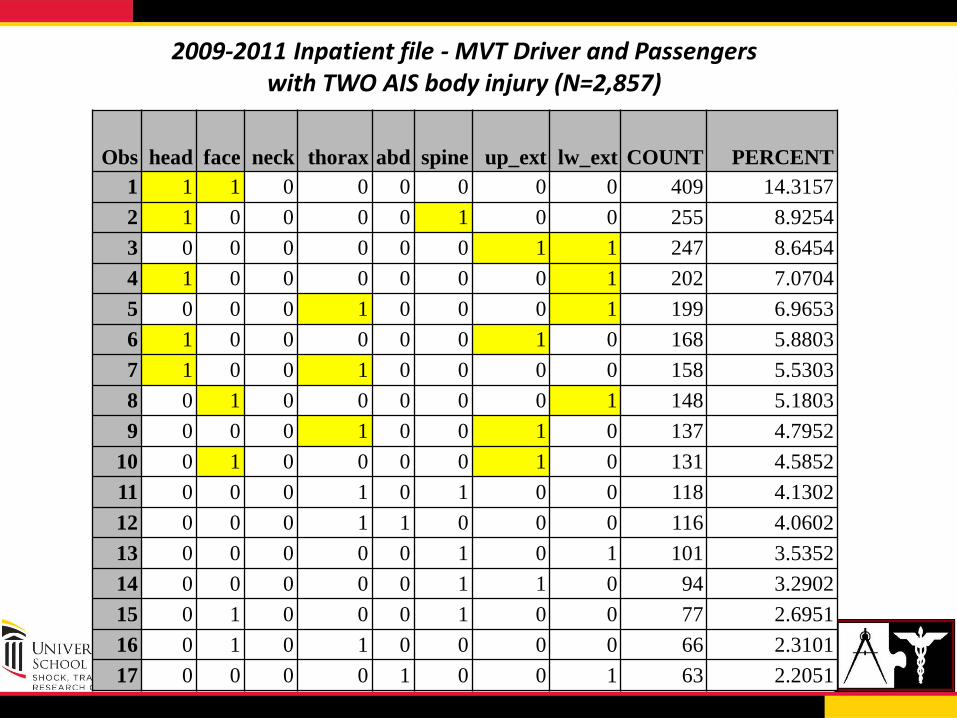
2009-2011 Inpatient file - MVT Driver and Passengers with TWO AIS body injury (N=2,857)
Obs head face neck thorax abd spine up_ext lw_ext COUNT PERCENT
1 1 1 0 0 0 0 0 0 409 14.3157
2 1 0 0 0 0 1 0 0 255 8.9254
3 0 0 0 0 0 0 1 1 247 8.6454
4 1 0 0 0 0 0 0 1 202 7.0704
5 0 0 0 1 0 0 0 1 199 6.9653
6 1 0 0 0 0 0 1 0 168 5.8803
7 1 0 0 1 0 0 0 0 158 5.5303
8 0 1 0 0 0 0 0 1 148 5.1803
9 0 0 0 1 0 0 1 0 137 4.7952
10 0 1 0 0 0 0 1 0 131 4.5852
11 0 0 0 1 0 1 0 0 118 4.1302
12 0 0 0 1 1 0 0 0 116 4.0602
13 0 0 0 0 0 1 0 1 101 3.5352
14 0 0 0 0 0 1 1 0 94 3.2902
15 0 1 0 0 0 1 0 0 77 2.6951
16 0 1 0 1 0 0 0 0 66 2.3101
17 0 0 0 0 1 0 0 1 63 2.2051
Focus on AIS 2+ injuries
• Hospitalized patients
• Majority of costs (charges)
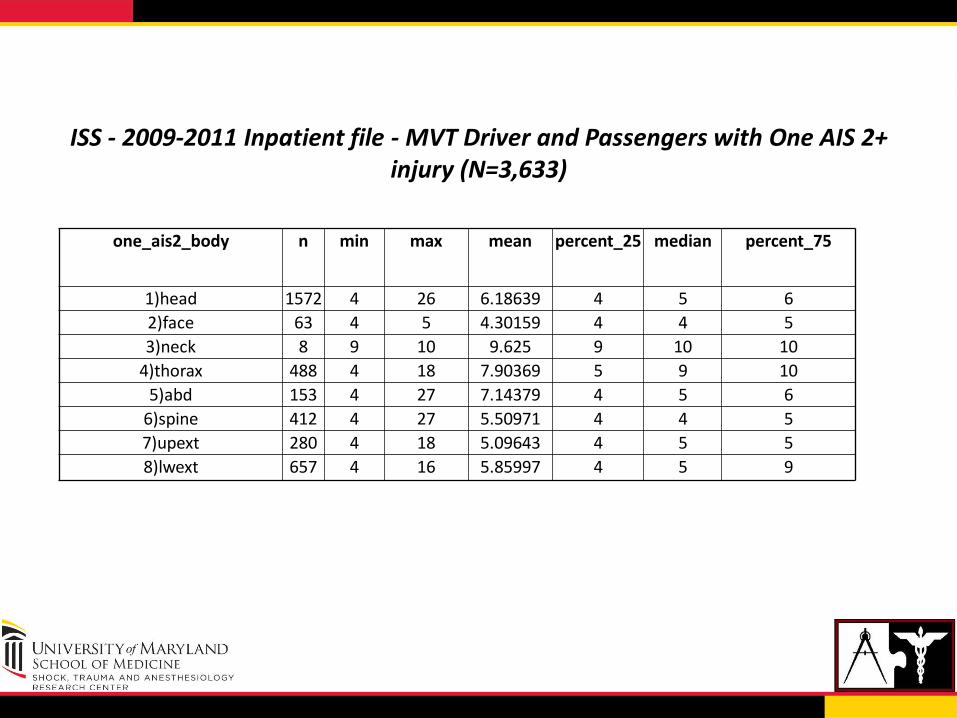
ISS - 2009-2011 Inpatient file - MVT Driver and Passengers with One AIS 2+ injury (N=3,633)
one_ais2_body n min max mean percent_25 median percent_75
1)head 1572 4 26 6.18639 4 5 6
2)face 63 4 5 4.30159 4 4 5
3)neck 8 9 10 9.625 9 10 10
4)thorax 488 4 18 7.90369 5 9 10
5)abd 153 4 27 7.14379 4 5 6
6)spine 412 4 27 5.50971 4 4 5
7)upext 280 4 18 5.09643 4 5 5
8)lwext 657 4 16 5.85997 4 5 9
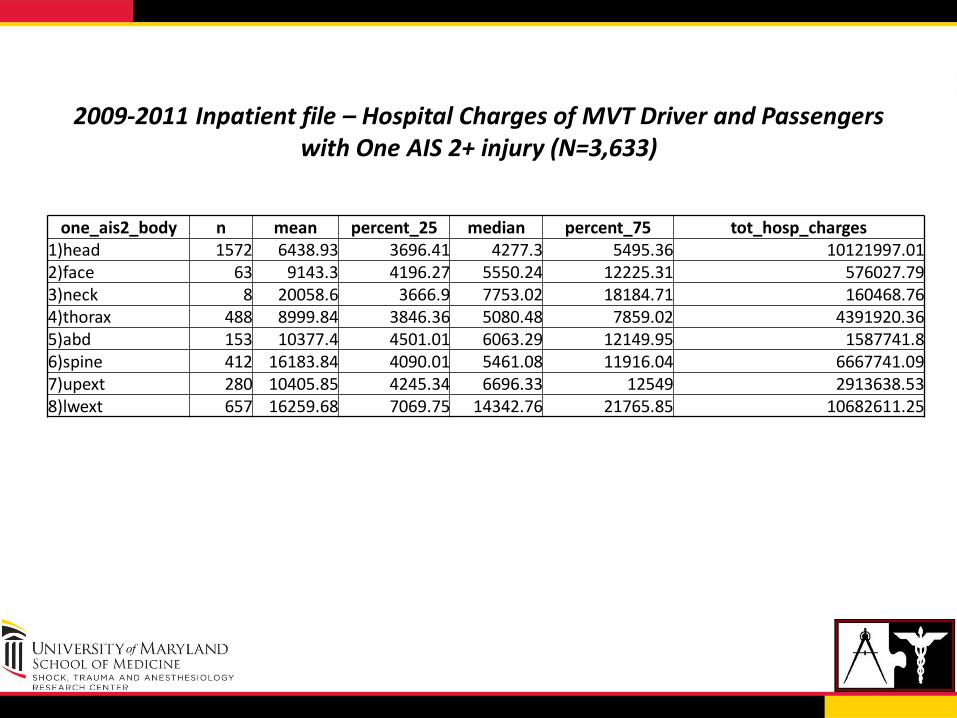
2009-2011 Inpatient file – Hospital Charges of MVT Driver and Passengers with One AIS 2+ injury (N=3,633)
one_ais2_body n mean percent_25 median percent_75 tot_hosp_charges 1)head 1572 6438.93 3696.41 4277.3 5495.36 10121997.01 2)face 63 9143.3 4196.27 5550.24 12225.31 576027.79 3)neck 8 20058.6 3666.9 7753.02 18184.71 160468.76 4)thorax 488 8999.84 3846.36 5080.48 7859.02 4391920.36 5)abd 153 10377.4 4501.01 6063.29 12149.95 1587741.8 6)spine 412 16183.84 4090.01 5461.08 11916.04 6667741.09 7)upext 280 10405.85 4245.34 6696.33 12549 2913638.53 8)lwext 657 16259.68 7069.75 14342.76 21765.85 10682611.25
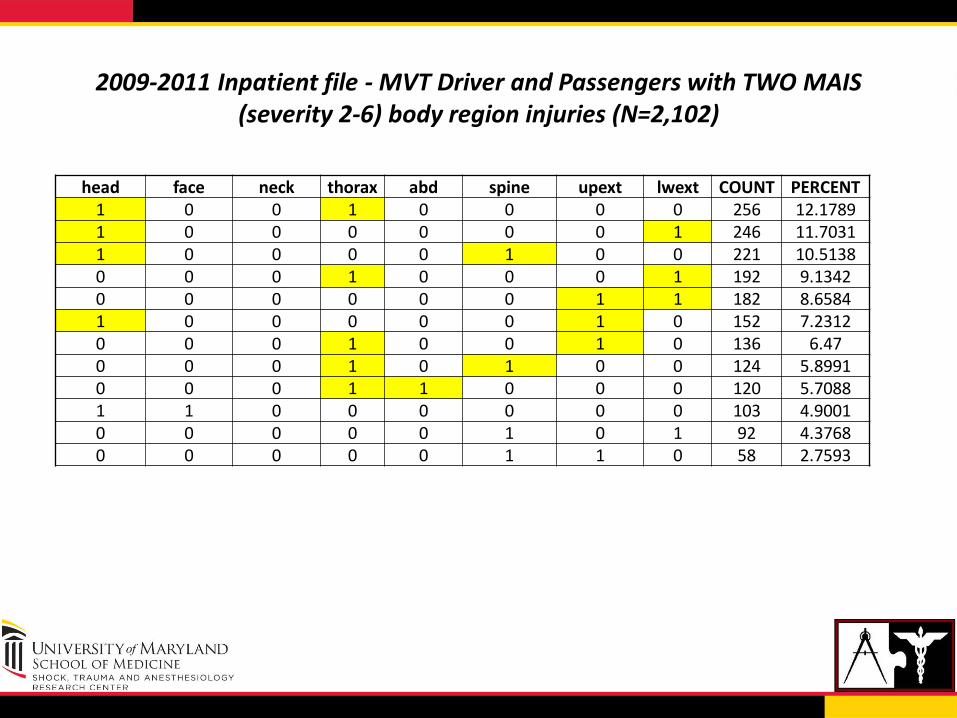
2009-2011 Inpatient file - MVT Driver and Passengers with TWO MAIS (severity 2-6) body region injuries (N=2,102)
head face neck thorax abd spine upext lwext COUNT PERCENT 1 0 0 1 0 0 0 0 256 12.1789 1 0 0 0 0 0 0 1 246 11.7031 1 0 0 0 0 1 0 0 221 10.5138 0 0 0 1 0 0 0 1 192 9.1342 0 0 0 0 0 0 1 1 182 8.6584 1 0 0 0 0 0 1 0 152 7.2312 0 0 0 1 0 0 1 0 136 6.47 0 0 0 1 0 1 0 0 124 5.8991 0 0 0 1 1 0 0 0 120 5.7088 1 1 0 0 0 0 0 0 103 4.9001 0 0 0 0 0 1 0 1 92 4.3768 0 0 0 0 0 1 1 0 58 2.7593
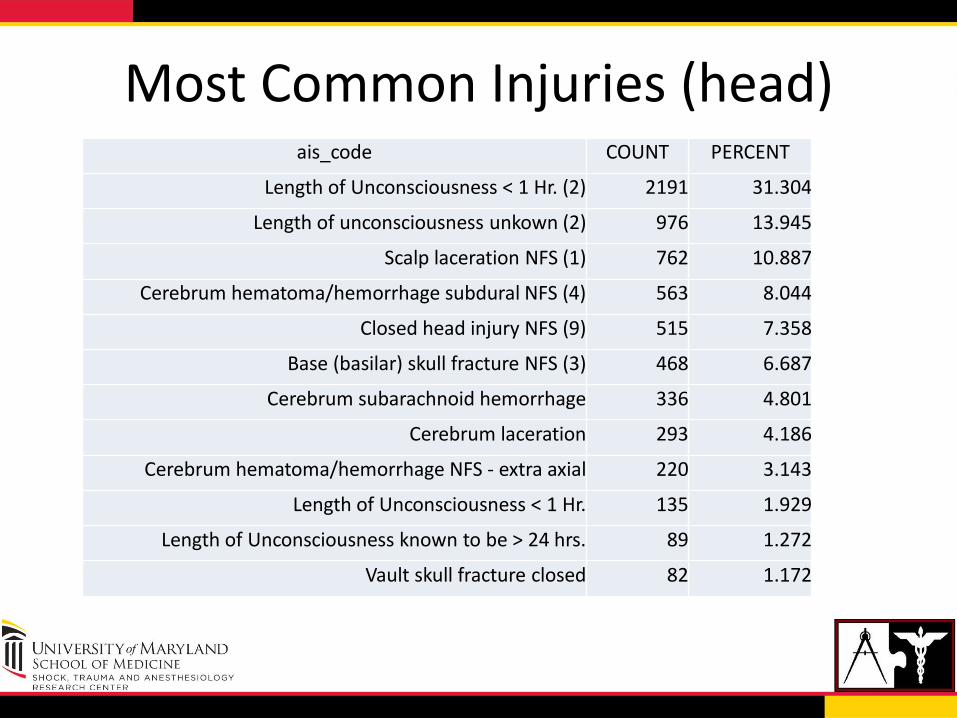
Most Common Injuries (head) ais_code COUNT PERCENT
Length of Unconsciousness < 1 Hr. (2) 2191 31.304
Length of unconsciousness unkown (2) 976 13.945
Scalp laceration NFS (1) 762 10.887
Cerebrum hematoma/hemorrhage subdural NFS (4) 563 8.044
Closed head injury NFS (9) 515 7.358
Base (basilar) skull fracture NFS (3) 468 6.687
Cerebrum subarachnoid hemorrhage 336 4.801
Cerebrum laceration 293 4.186
Cerebrum hematoma/hemorrhage NFS - extra axial 220 3.143
Length of Unconsciousness < 1 Hr. 135 1.929
Length of Unconsciousness known to be > 24 hrs. 89 1.272
Vault skull fracture closed 82 1.172
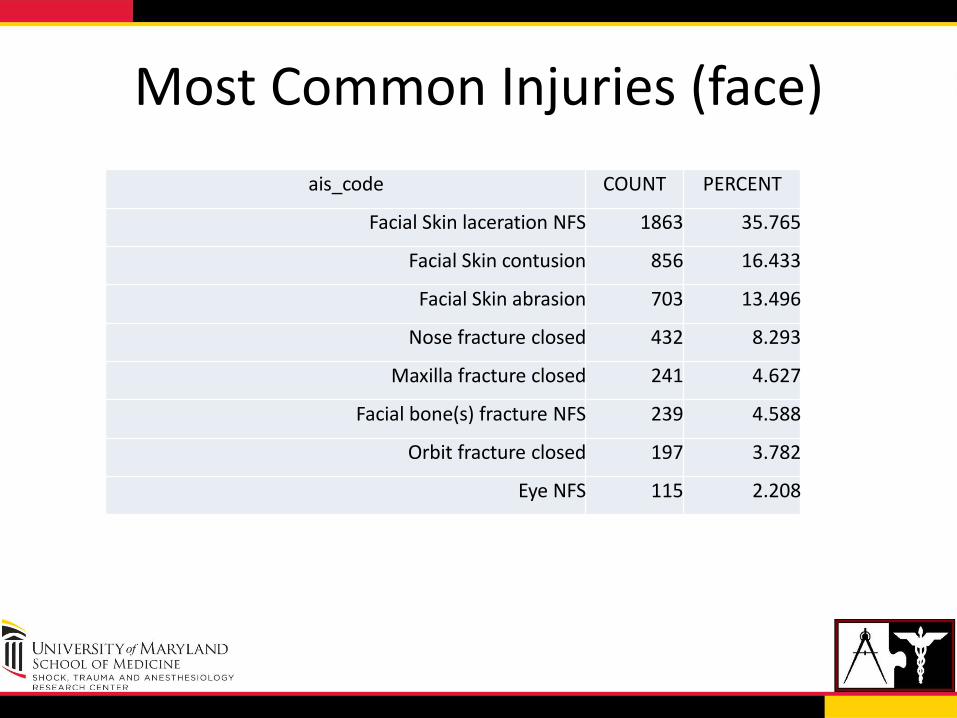
Most Common Injuries (face)
ais_code COUNT PERCENT
Facial Skin laceration NFS 1863 35.765
Facial Skin contusion 856 16.433
Facial Skin abrasion 703 13.496
Nose fracture closed 432 8.293
Maxilla fracture closed 241 4.627
Facial bone(s) fracture NFS 239 4.588
Orbit fracture closed 197 3.782
Eye NFS 115 2.208
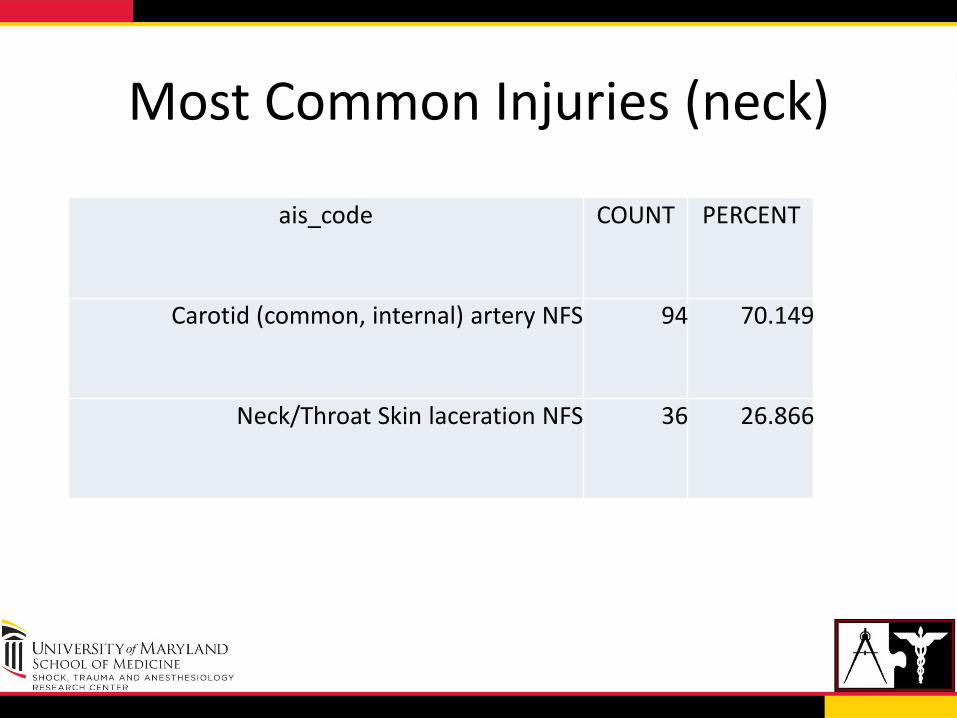
Most Common Injuries (neck)
ais_code COUNT PERCENT
Carotid (common, internal) artery NFS 94 70.149
Neck/Throat Skin laceration NFS 36 26.866
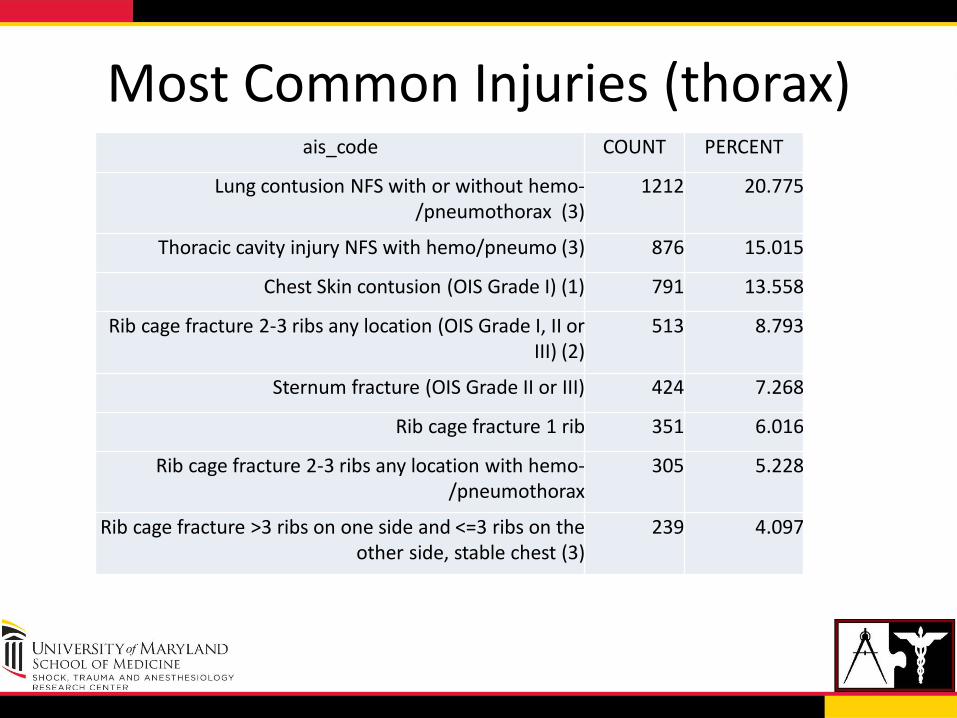
Most Common Injuries (thorax) ais_code COUNT PERCENT
Lung contusion NFS with or without hemo-/pneumothorax (3)
1212 20.775
Thoracic cavity injury NFS with hemo/pneumo (3) 876 15.015
Chest Skin contusion (OIS Grade I) (1) 791 13.558
Rib cage fracture 2-3 ribs any location (OIS Grade I, II or III) (2)
513 8.793
Sternum fracture (OIS Grade II or III) 424 7.268
Rib cage fracture 1 rib 351 6.016
Rib cage fracture 2-3 ribs any location with hemo-/pneumothorax
305 5.228
Rib cage fracture >3 ribs on one side and <=3 ribs on the other side, stable chest (3)
239 4.097
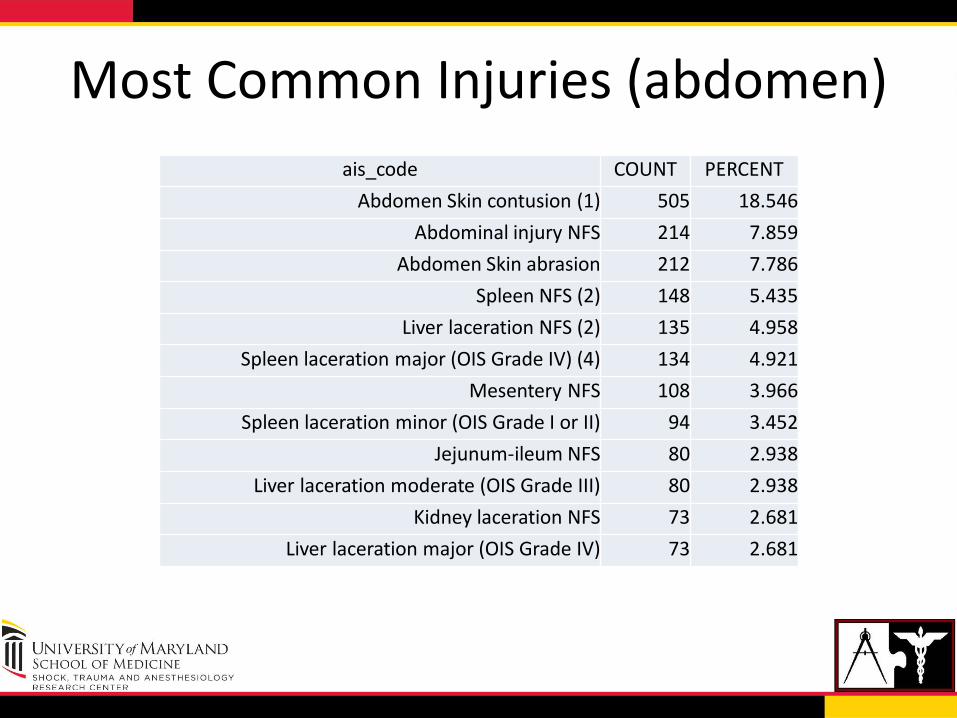
Most Common Injuries (abdomen)
ais_code COUNT PERCENT
Abdomen Skin contusion (1) 505 18.546
Abdominal injury NFS 214 7.859
Abdomen Skin abrasion 212 7.786
Spleen NFS (2) 148 5.435
Liver laceration NFS (2) 135 4.958
Spleen laceration major (OIS Grade IV) (4) 134 4.921
Mesentery NFS 108 3.966
Spleen laceration minor (OIS Grade I or II) 94 3.452
Jejunum-ileum NFS 80 2.938
Liver laceration moderate (OIS Grade III) 80 2.938
Kidney laceration NFS 73 2.681
Liver laceration major (OIS Grade IV) 73 2.681
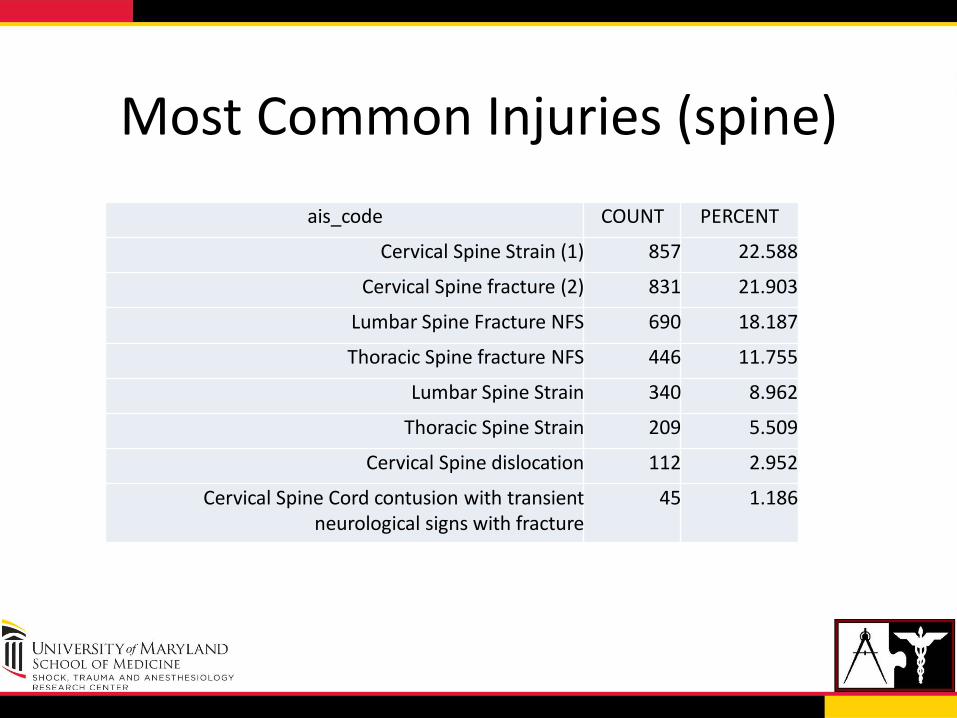
Most Common Injuries (spine)
ais_code COUNT PERCENT
Cervical Spine Strain (1) 857 22.588
Cervical Spine fracture (2) 831 21.903
Lumbar Spine Fracture NFS 690 18.187
Thoracic Spine fracture NFS 446 11.755
Lumbar Spine Strain 340 8.962
Thoracic Spine Strain 209 5.509
Cervical Spine dislocation 112 2.952
Cervical Spine Cord contusion with transient neurological signs with fracture
45 1.186
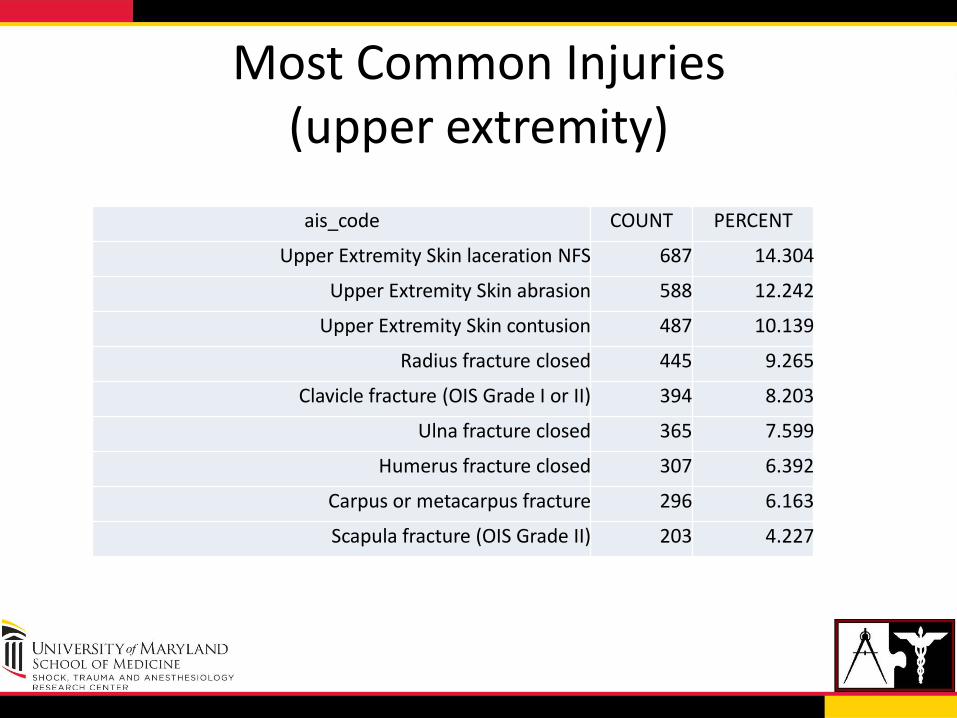
Most Common Injuries (upper extremity)
ais_code COUNT PERCENT
Upper Extremity Skin laceration NFS 687 14.304
Upper Extremity Skin abrasion 588 12.242
Upper Extremity Skin contusion 487 10.139
Radius fracture closed 445 9.265
Clavicle fracture (OIS Grade I or II) 394 8.203
Ulna fracture closed 365 7.599
Humerus fracture closed 307 6.392
Carpus or metacarpus fracture 296 6.163
Scapula fracture (OIS Grade II) 203 4.227
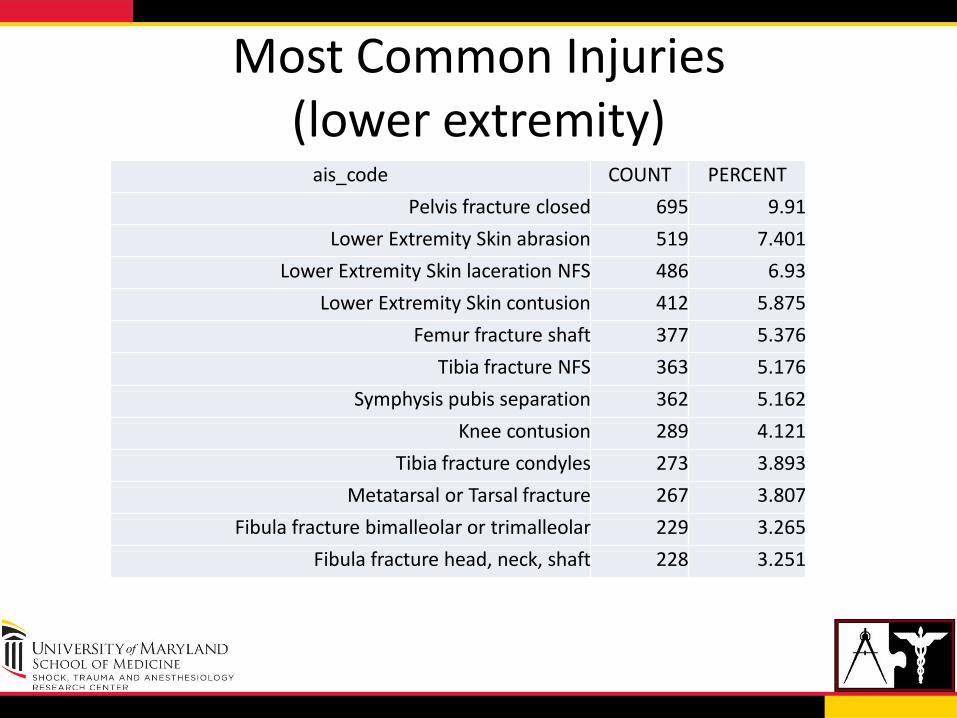
Most Common Injuries (lower extremity)
ais_code COUNT PERCENT
Pelvis fracture closed 695 9.91
Lower Extremity Skin abrasion 519 7.401
Lower Extremity Skin laceration NFS 486 6.93
Lower Extremity Skin contusion 412 5.875
Femur fracture shaft 377 5.376
Tibia fracture NFS 363 5.176
Symphysis pubis separation 362 5.162
Knee contusion 289 4.121
Tibia fracture condyles 273 3.893
Metatarsal or Tarsal fracture 267 3.807
Fibula fracture bimalleolar or trimalleolar 229 3.265
Fibula fracture head, neck, shaft 228 3.251
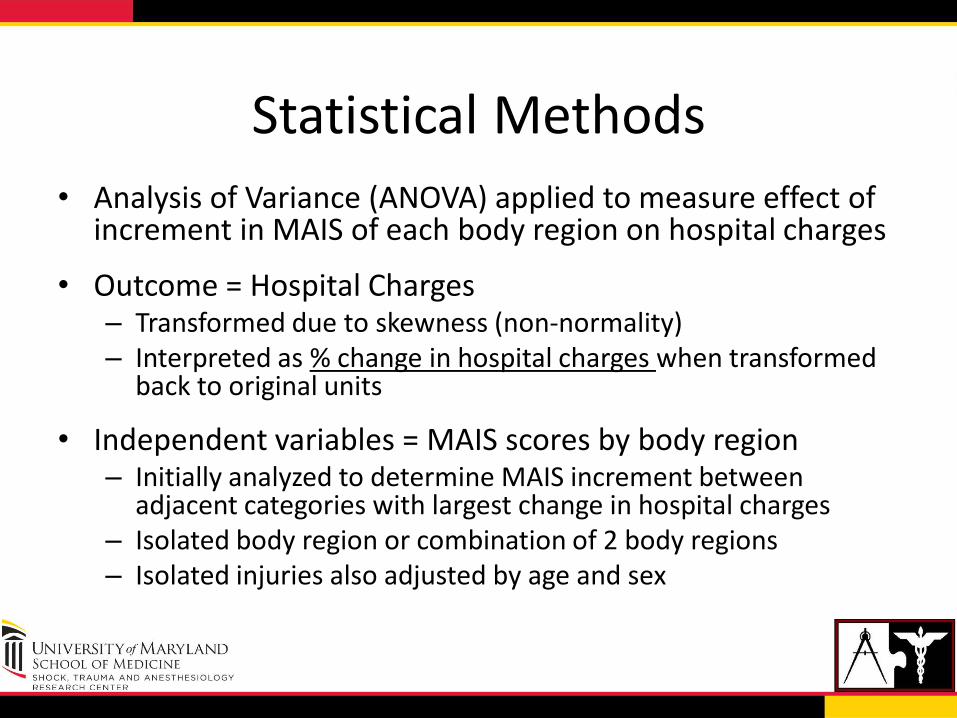
Statistical Methods
• Analysis of Variance (ANOVA) applied to measure effect of increment in MAIS of each body region on hospital charges
• Outcome = Hospital Charges – Transformed due to skewness (non-normality) – Interpreted as % change in hospital charges when transformed
back to original units
• Independent variables = MAIS scores by body region – Initially analyzed to determine MAIS increment between
adjacent categories with largest change in hospital charges – Isolated body region or combination of 2 body regions – Isolated injuries also adjusted by age and sex
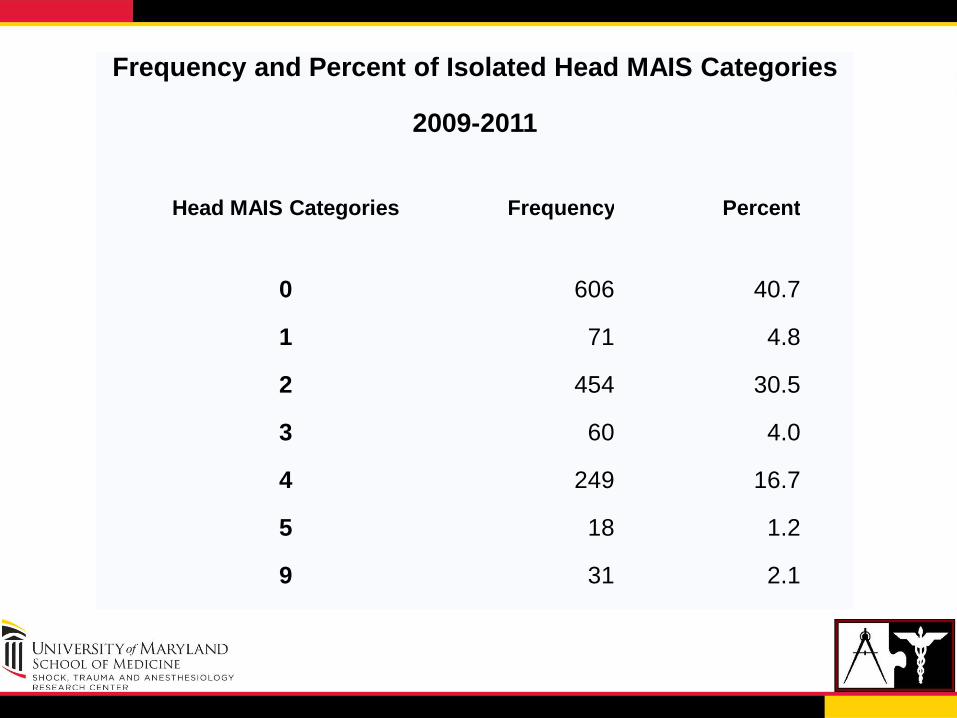
Frequency and Percent of Isolated Head MAIS Categories
2009-2011
Head MAIS Categories Frequency Percent
0 606 40.7
1 71 4.8
2 454 30.5
3 60 4.0
4 249 16.7
5 18 1.2
9 31 2.1
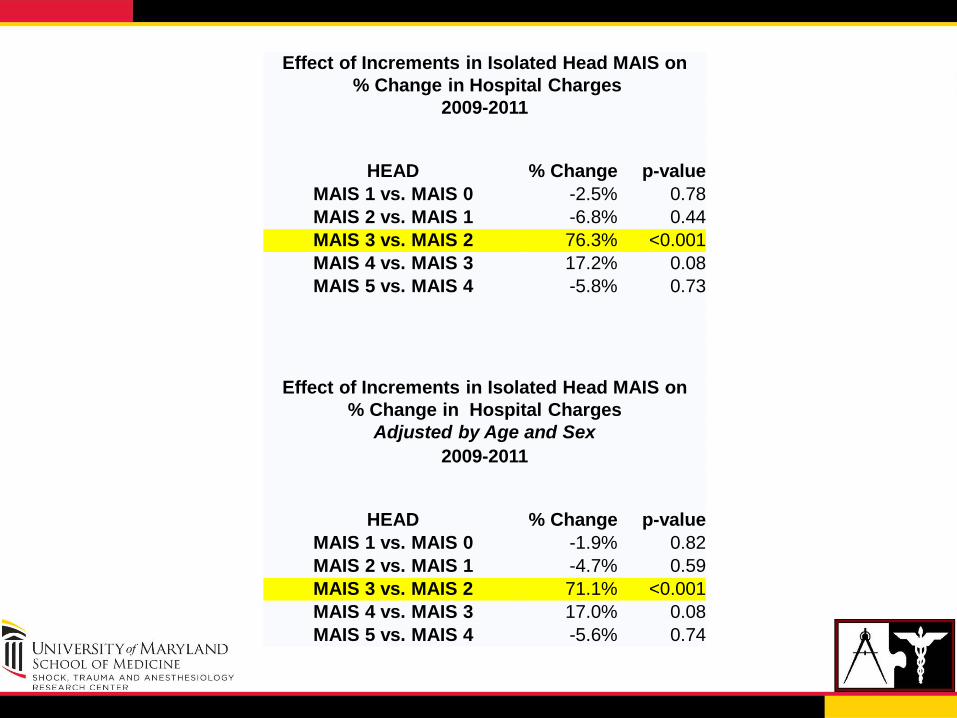
Effect of Increments in Isolated Head MAIS on
% Change in Hospital Charges
2009-2011
HEAD % Change p-value
MAIS 1 vs. MAIS 0 -2.5% 0.78
MAIS 2 vs. MAIS 1 -6.8% 0.44
MAIS 3 vs. MAIS 2 76.3% <0.001
MAIS 4 vs. MAIS 3 17.2% 0.08
MAIS 5 vs. MAIS 4 -5.8% 0.73
Effect of Increments in Isolated Head MAIS on
% Change in Hospital Charges
Adjusted by Age and Sex
2009-2011
HEAD % Change p-value
MAIS 1 vs. MAIS 0 -1.9% 0.82
MAIS 2 vs. MAIS 1 -4.7% 0.59
MAIS 3 vs. MAIS 2 71.1% <0.001
MAIS 4 vs. MAIS 3 17.0% 0.08
MAIS 5 vs. MAIS 4 -5.6% 0.74
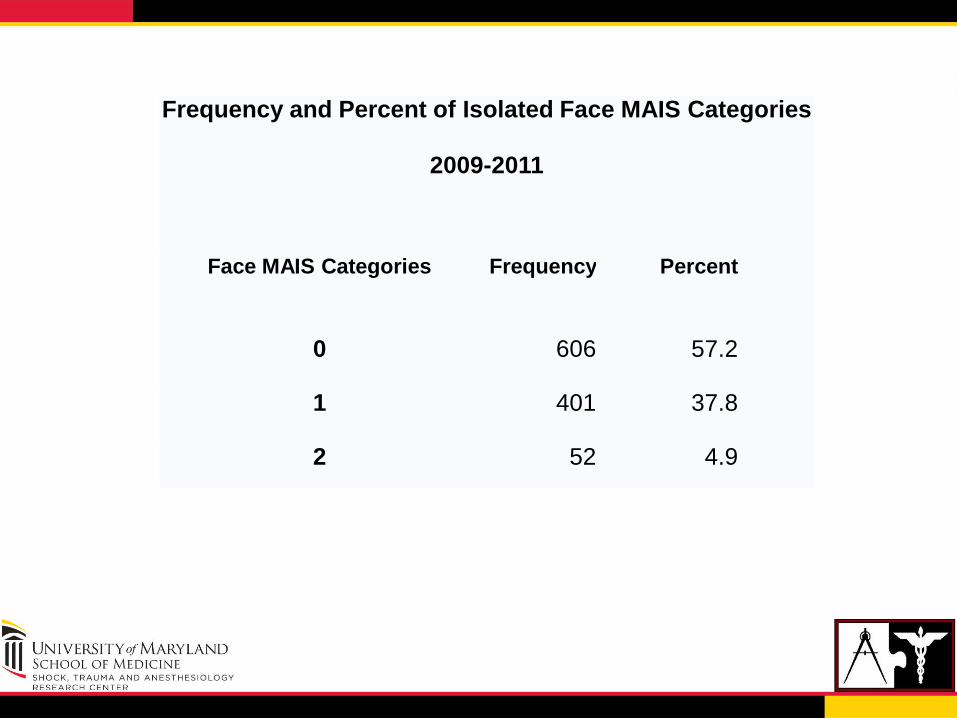
Frequency and Percent of Isolated Face MAIS Categories
2009-2011
Face MAIS Categories Frequency Percent
0 606 57.2
1 401 37.8
2 52 4.9
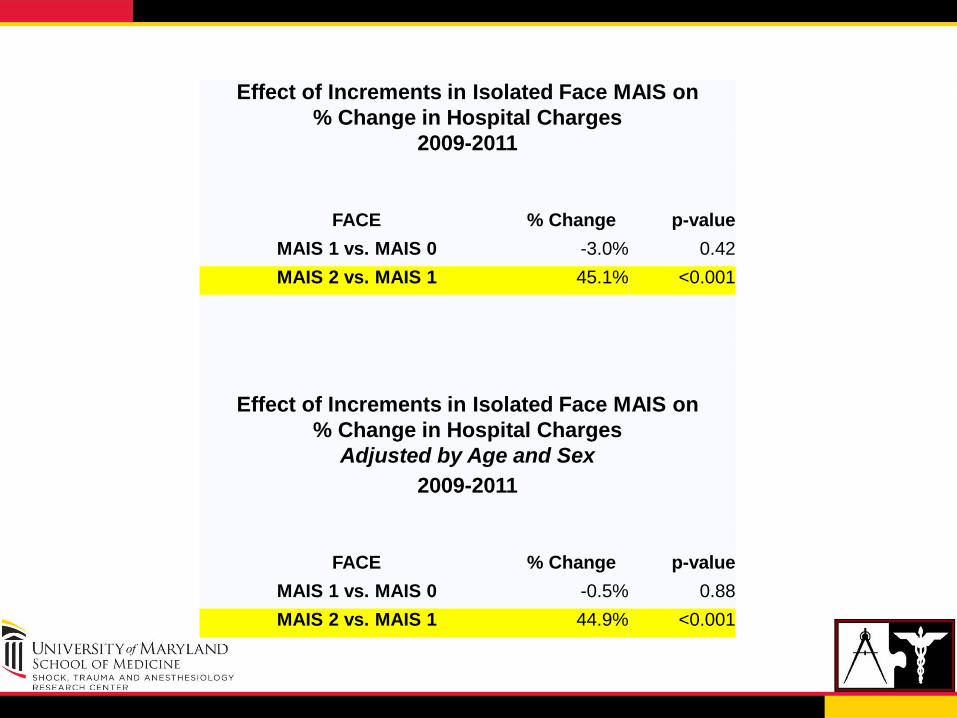
Effect of Increments in Isolated Face MAIS on
% Change in Hospital Charges
2009-2011
FACE % Change p-value
MAIS 1 vs. MAIS 0 -3.0% 0.42
MAIS 2 vs. MAIS 1 45.1% <0.001
Effect of Increments in Isolated Face MAIS on
% Change in Hospital Charges
Adjusted by Age and Sex
2009-2011
FACE % Change p-value
MAIS 1 vs. MAIS 0 -0.5% 0.88
MAIS 2 vs. MAIS 1 44.9% <0.001
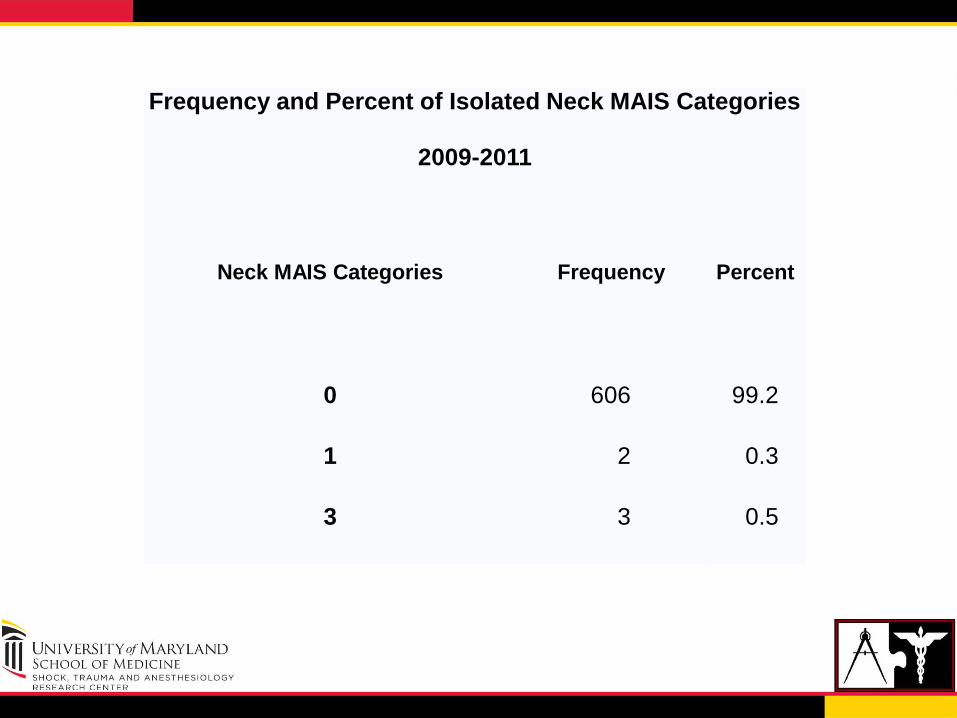
Frequency and Percent of Isolated Neck MAIS Categories
2009-2011
Neck MAIS Categories Frequency Percent
0 606 99.2
1 2 0.3
3 3 0.5
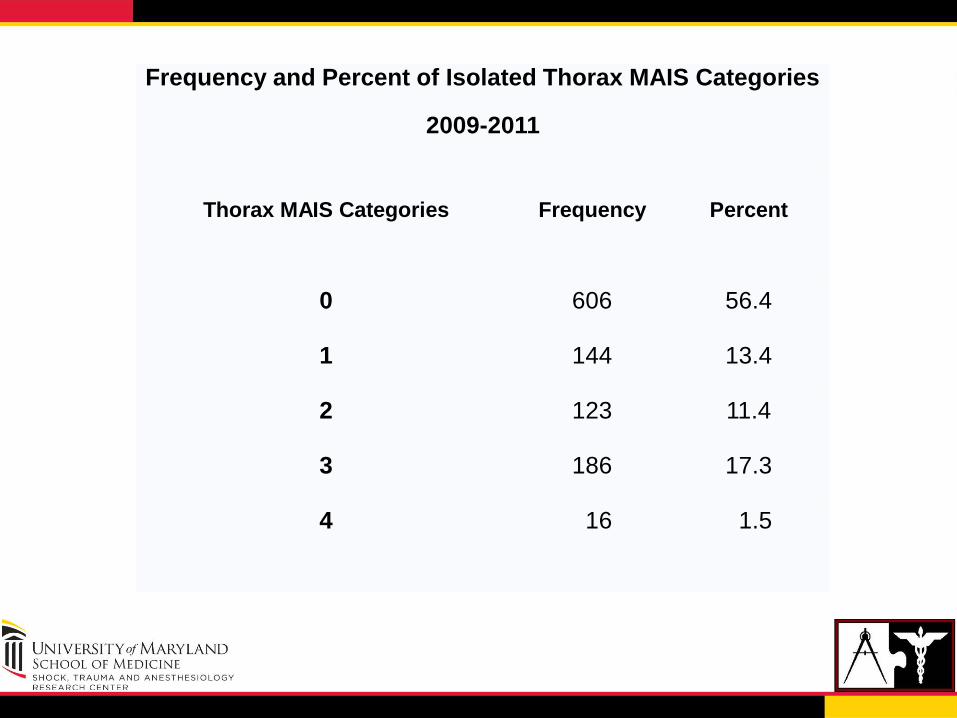
Frequency and Percent of Isolated Thorax MAIS Categories
2009-2011
Thorax MAIS Categories Frequency Percent
0 606 56.4
1 144 13.4
2 123 11.4
3 186 17.3
4 16 1.5
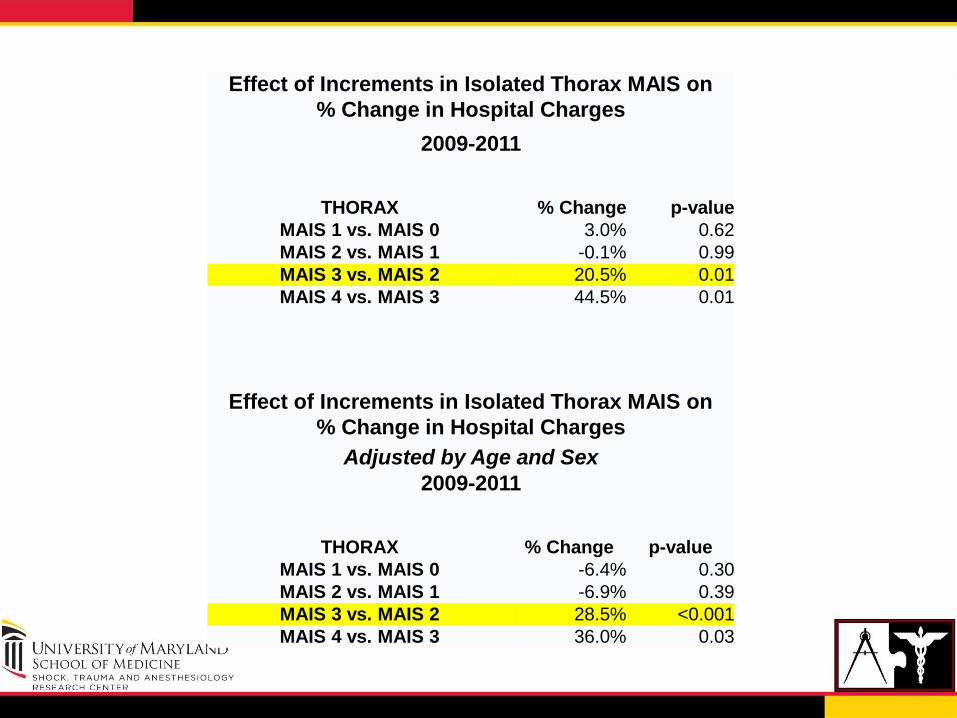
Effect of Increments in Isolated Thorax MAIS on
% Change in Hospital Charges
2009-2011
THORAX % Change p-value
MAIS 1 vs. MAIS 0 3.0% 0.62
MAIS 2 vs. MAIS 1 -0.1% 0.99
MAIS 3 vs. MAIS 2 20.5% 0.01
MAIS 4 vs. MAIS 3 44.5% 0.01
Effect of Increments in Isolated Thorax MAIS on
% Change in Hospital Charges
Adjusted by Age and Sex
2009-2011
THORAX % Change p-value
MAIS 1 vs. MAIS 0 -6.4% 0.30
MAIS 2 vs. MAIS 1 -6.9% 0.39
MAIS 3 vs. MAIS 2 28.5% <0.001
MAIS 4 vs. MAIS 3 36.0% 0.03
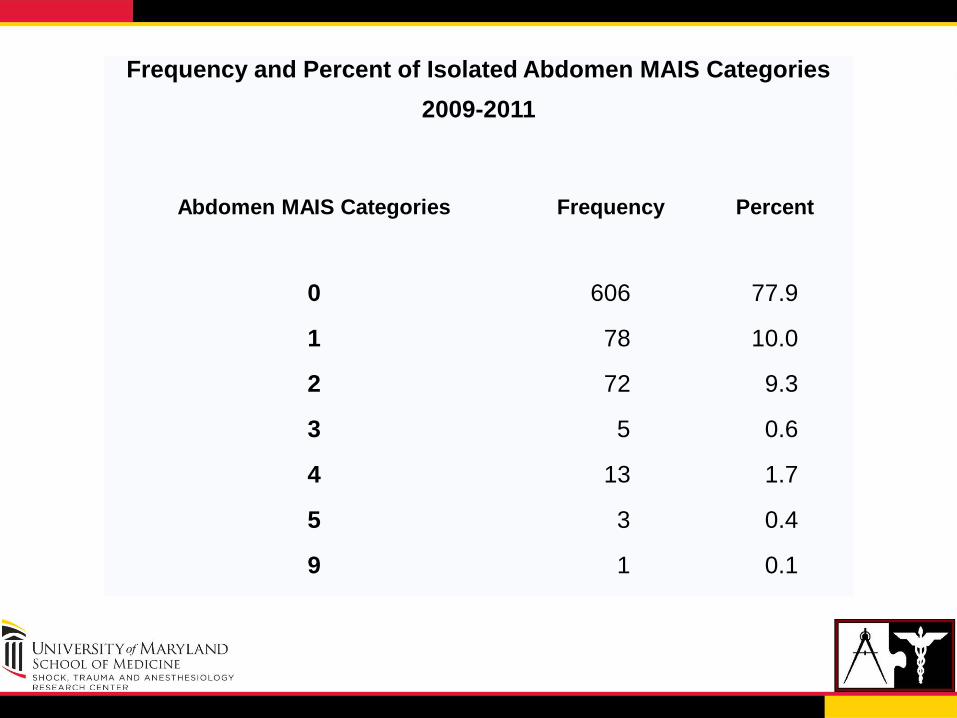
Frequency and Percent of Isolated Abdomen MAIS Categories
2009-2011
Abdomen MAIS Categories Frequency Percent
0 606 77.9
1 78 10.0
2 72 9.3
3 5 0.6
4 13 1.7
5 3 0.4
9 1 0.1
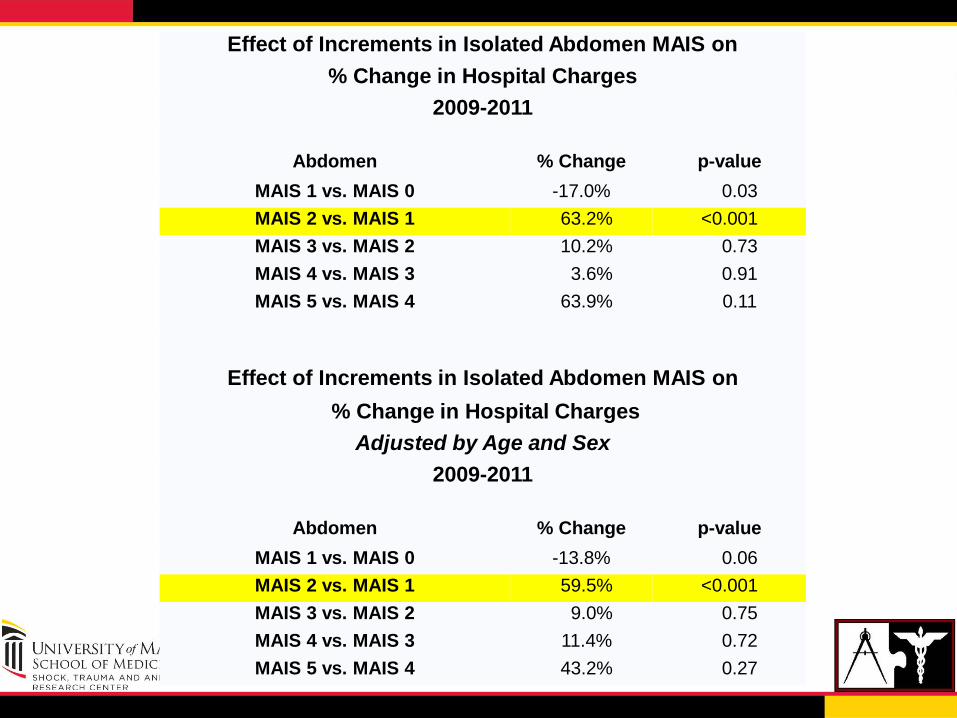
Effect of Increments in Isolated Abdomen MAIS on
% Change in Hospital Charges
2009-2011
Abdomen % Change p-value
MAIS 1 vs. MAIS 0 -17.0% 0.03
MAIS 2 vs. MAIS 1 63.2% <0.001
MAIS 3 vs. MAIS 2 10.2% 0.73
MAIS 4 vs. MAIS 3 3.6% 0.91
MAIS 5 vs. MAIS 4 63.9% 0.11
Effect of Increments in Isolated Abdomen MAIS on
% Change in Hospital Charges
Adjusted by Age and Sex
2009-2011
Abdomen % Change p-value
MAIS 1 vs. MAIS 0 -13.8% 0.06
MAIS 2 vs. MAIS 1 59.5% <0.001
MAIS 3 vs. MAIS 2 9.0% 0.75
MAIS 4 vs. MAIS 3 11.4% 0.72
MAIS 5 vs. MAIS 4 43.2% 0.27
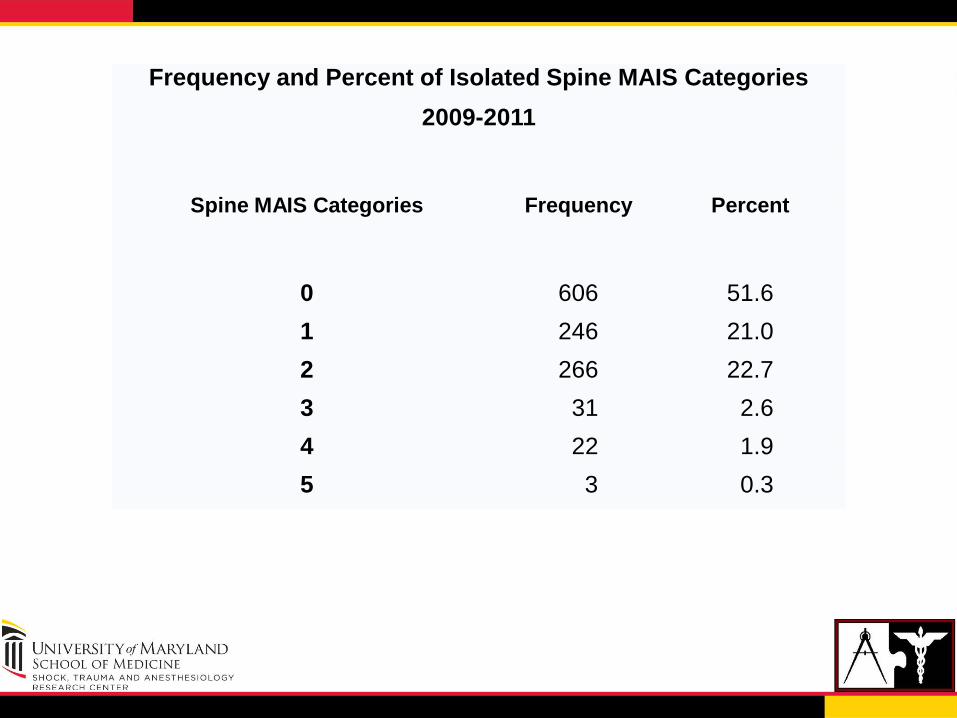
Frequency and Percent of Isolated Spine MAIS Categories
2009-2011
Spine MAIS Categories Frequency Percent
0 606 51.6
1 246 21.0
2 266 22.7
3 31 2.6
4 22 1.9
5 3 0.3
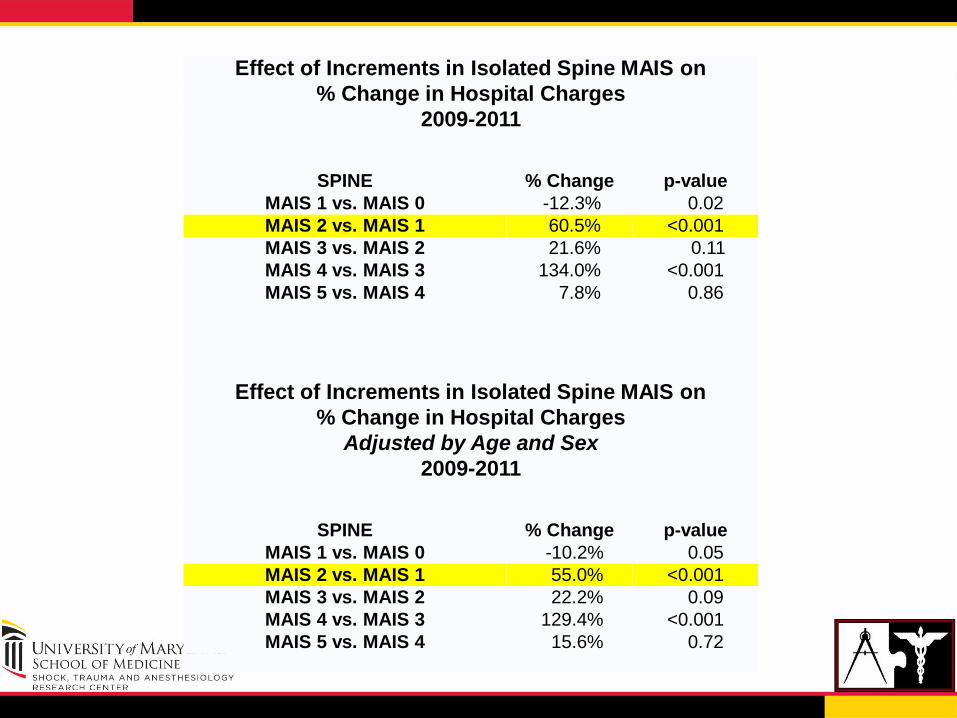
Effect of Increments in Isolated Spine MAIS on
% Change in Hospital Charges
2009-2011
SPINE % Change p-value
MAIS 1 vs. MAIS 0 -12.3% 0.02
MAIS 2 vs. MAIS 1 60.5% <0.001
MAIS 3 vs. MAIS 2 21.6% 0.11
MAIS 4 vs. MAIS 3 134.0% <0.001
MAIS 5 vs. MAIS 4 7.8% 0.86
Effect of Increments in Isolated Spine MAIS on
% Change in Hospital Charges
Adjusted by Age and Sex
2009-2011
SPINE % Change p-value
MAIS 1 vs. MAIS 0 -10.2% 0.05
MAIS 2 vs. MAIS 1 55.0% <0.001
MAIS 3 vs. MAIS 2 22.2% 0.09
MAIS 4 vs. MAIS 3 129.4% <0.001
MAIS 5 vs. MAIS 4 15.6% 0.72
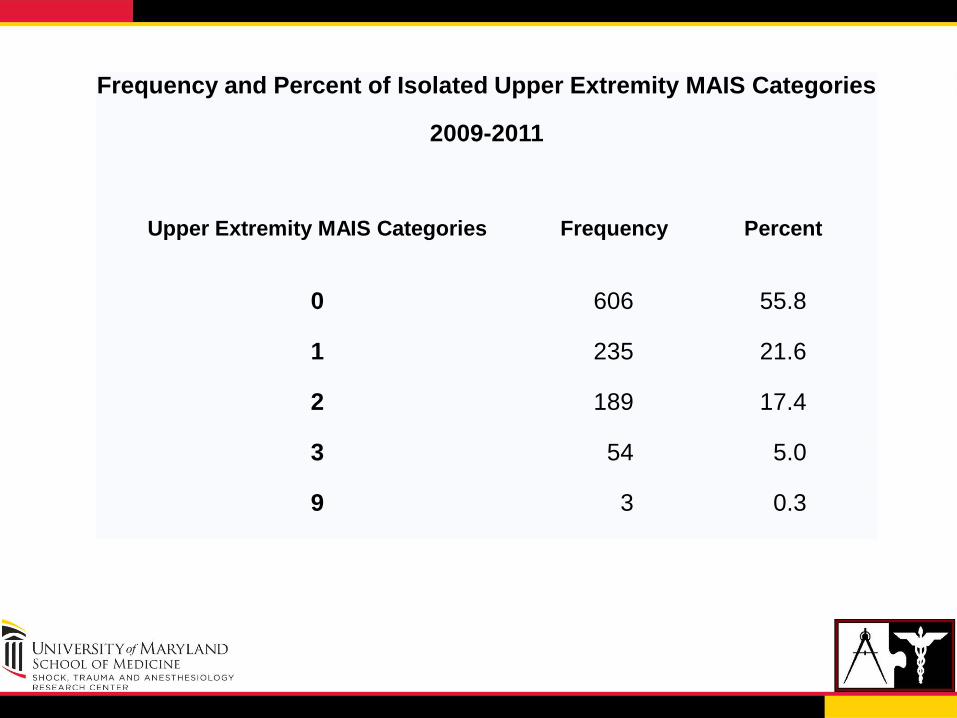
Frequency and Percent of Isolated Upper Extremity MAIS Categories
2009-2011
Upper Extremity MAIS Categories Frequency Percent
0 606 55.8
1 235 21.6
2 189 17.4
3 54 5.0
9 3 0.3
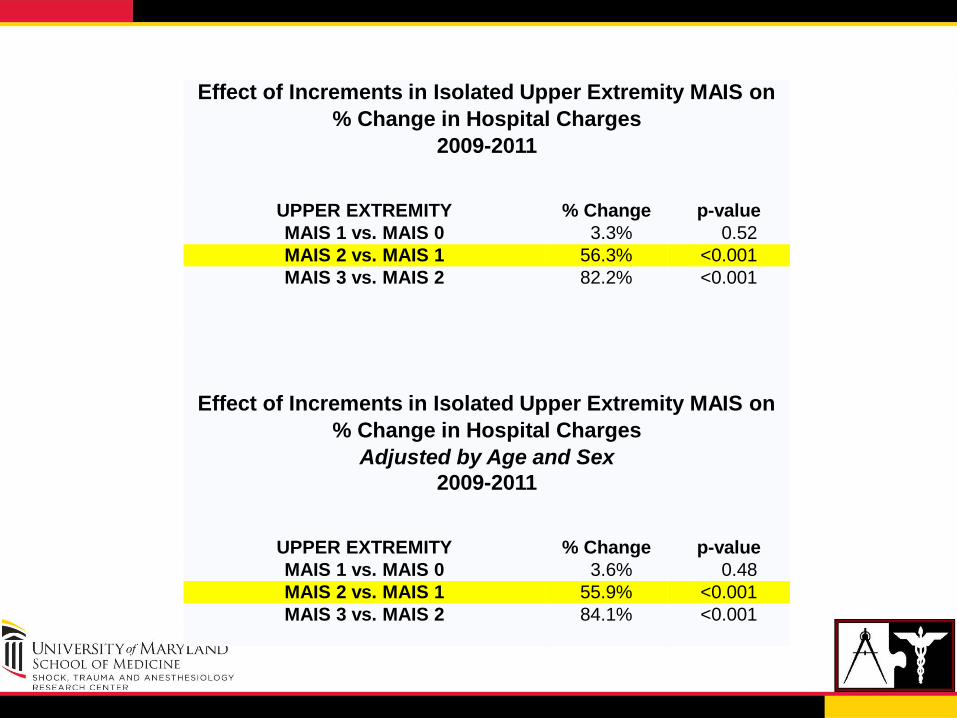
Effect of Increments in Isolated Upper Extremity MAIS on
% Change in Hospital Charges
2009-2011
UPPER EXTREMITY % Change p-value
MAIS 1 vs. MAIS 0 3.3% 0.52
MAIS 2 vs. MAIS 1 56.3% <0.001
MAIS 3 vs. MAIS 2 82.2% <0.001
Effect of Increments in Isolated Upper Extremity MAIS on
% Change in Hospital Charges
Adjusted by Age and Sex
2009-2011
UPPER EXTREMITY % Change p-value
MAIS 1 vs. MAIS 0 3.6% 0.48
MAIS 2 vs. MAIS 1 55.9% <0.001
MAIS 3 vs. MAIS 2 84.1% <0.001
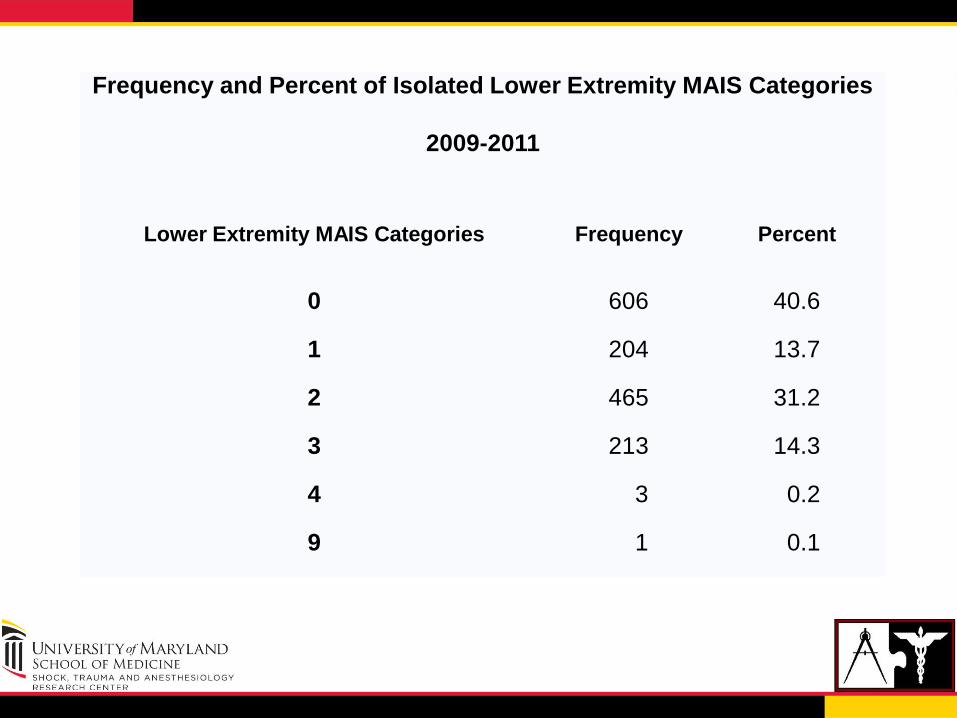
Frequency and Percent of Isolated Lower Extremity MAIS Categories
2009-2011
Lower Extremity MAIS Categories Frequency Percent
0 606 40.6
1 204 13.7
2 465 31.2
3 213 14.3
4 3 0.2
9 1 0.1
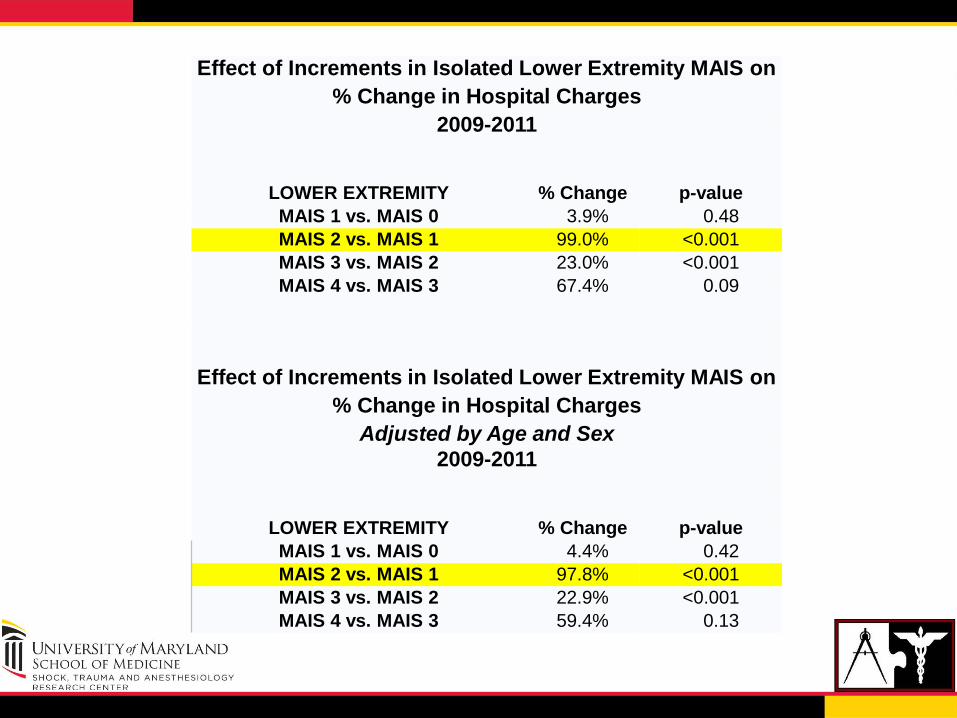
Effect of Increments in Isolated Lower Extremity MAIS on
% Change in Hospital Charges
2009-2011
LOWER EXTREMITY % Change p-value
MAIS 1 vs. MAIS 0 3.9% 0.48
MAIS 2 vs. MAIS 1 99.0% <0.001
MAIS 3 vs. MAIS 2 23.0% <0.001
MAIS 4 vs. MAIS 3 67.4% 0.09
Effect of Increments in Isolated Lower Extremity MAIS on
% Change in Hospital Charges
Adjusted by Age and Sex
2009-2011
LOWER EXTREMITY % Change p-value
MAIS 1 vs. MAIS 0 4.4% 0.42
MAIS 2 vs. MAIS 1 97.8% <0.001
MAIS 3 vs. MAIS 2 22.9% <0.001
MAIS 4 vs. MAIS 3 59.4% 0.13
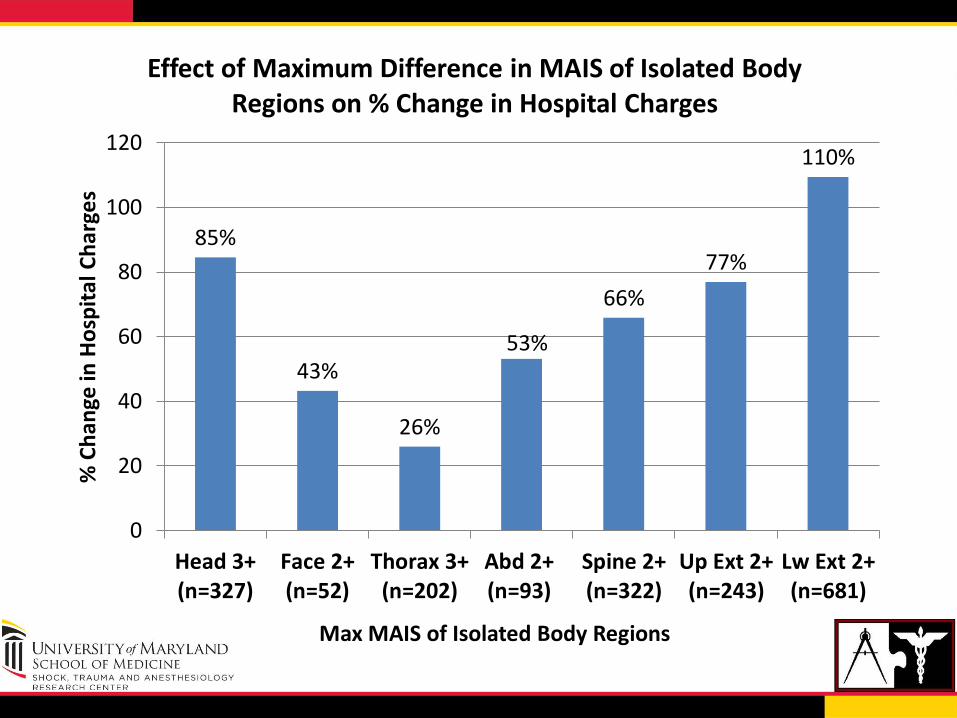
85%
43%
26%
53%
66%
77%
110%
0
20
40
60
80
100
120
Head 3+(n=327)
Face 2+(n=52)
Thorax 3+(n=202)
Abd 2+(n=93)
Spine 2+(n=322)
Up Ext 2+(n=243)
Lw Ext 2+(n=681)
% C
han
ge in
Ho
spit
al C
har
ges
Max MAIS of Isolated Body Regions
Effect of Maximum Difference in MAIS of Isolated Body Regions on % Change in Hospital Charges
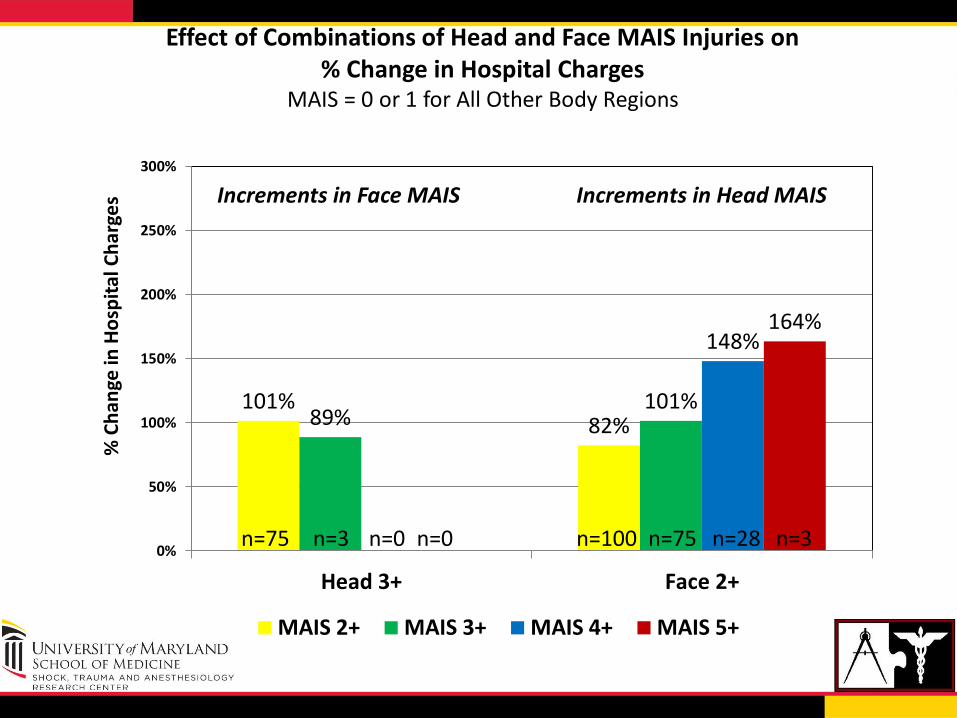
101% 82% 89%
101%
148% 164%
0%
50%
100%
150%
200%
250%
300%
Head 3+ Face 2+
% C
han
ge in
Ho
spit
al C
har
ges
MAIS 2+ MAIS 3+ MAIS 4+ MAIS 5+
Increments in Head MAIS
n=3 n=100 n=75 n=28 n=3 n=0 n=0
Increments in Face MAIS
Effect of Combinations of Head and Face MAIS Injuries on % Change in Hospital Charges
MAIS = 0 or 1 for All Other Body Regions
n=75
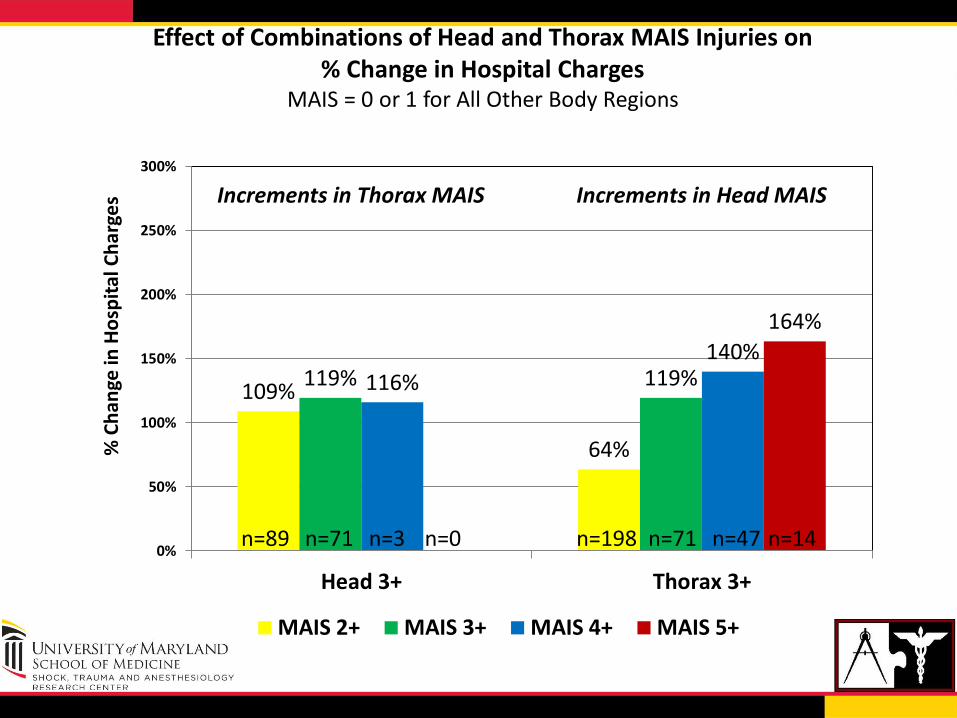
109%
64%
119% 119% 116%
140%
164%
0%
50%
100%
150%
200%
250%
300%
Head 3+ Thorax 3+
% C
han
ge in
Ho
spit
al C
har
ges
MAIS 2+ MAIS 3+ MAIS 4+ MAIS 5+
Increments in Head MAIS
n=71 n=198 n=71 n=47 n=14 n=3 n=0
Increments in Thorax MAIS
Effect of Combinations of Head and Thorax MAIS Injuries on % Change in Hospital Charges
MAIS = 0 or 1 for All Other Body Regions
n=89
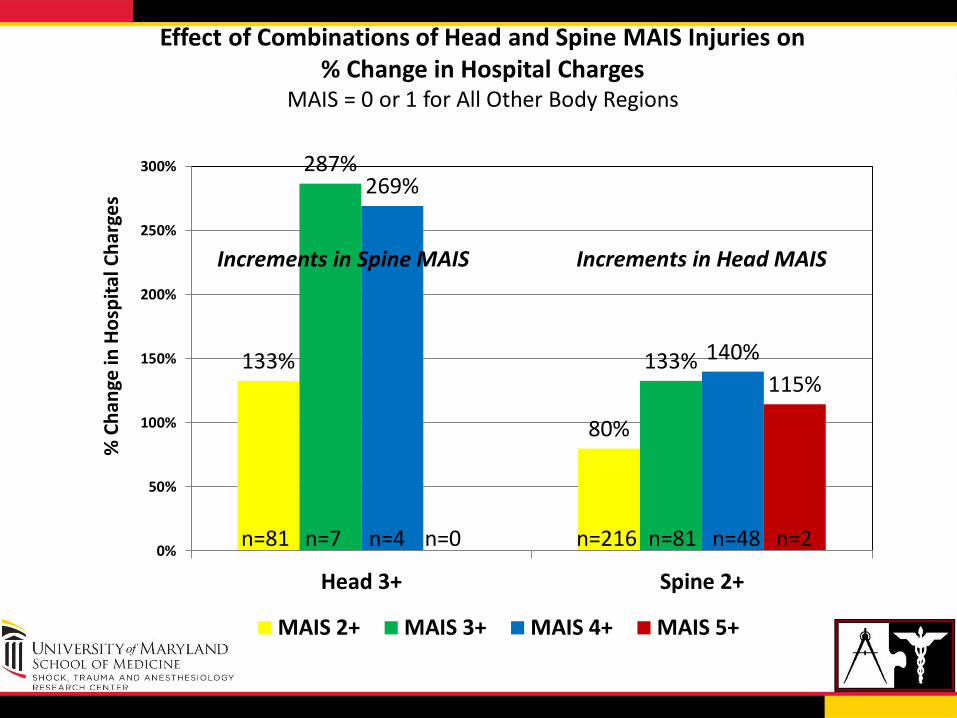
133%
80%
287%
133%
269%
140%
115%
0%
50%
100%
150%
200%
250%
300%
Head 3+ Spine 2+
% C
han
ge in
Ho
spit
al C
har
ges
MAIS 2+ MAIS 3+ MAIS 4+ MAIS 5+
Increments in Head MAIS
n=7 n=216 n=81 n=48 n=2 n=4 n=0
Increments in Spine MAIS
Effect of Combinations of Head and Spine MAIS Injuries on % Change in Hospital Charges
MAIS = 0 or 1 for All Other Body Regions
n=81
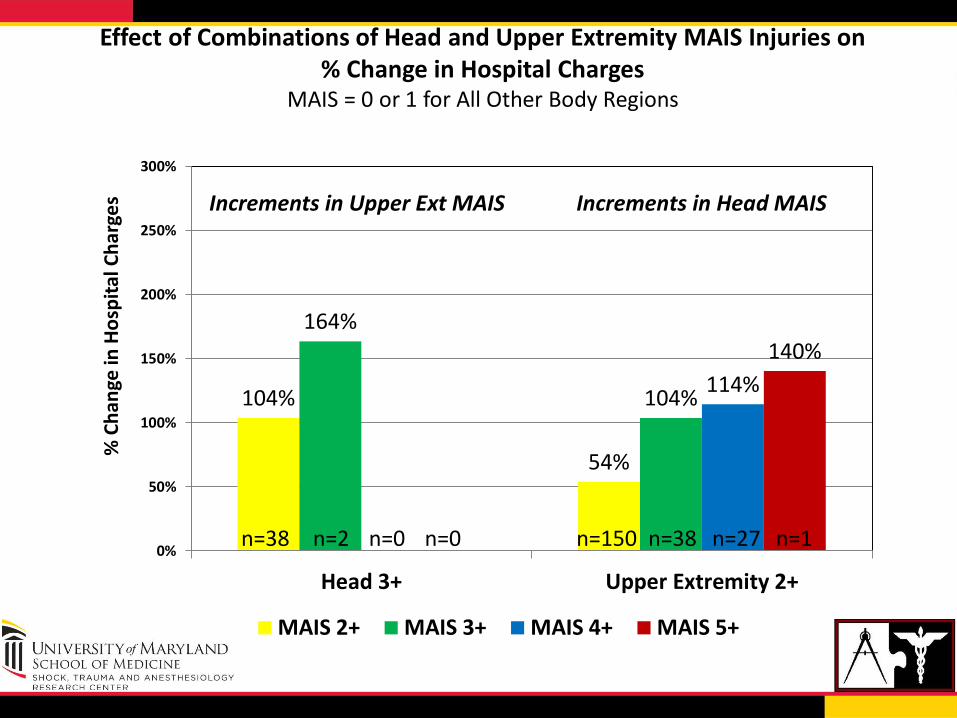
104%
54%
164%
104%
114%
140%
0%
50%
100%
150%
200%
250%
300%
Head 3+ Upper Extremity 2+
% C
han
ge in
Ho
spit
al C
har
ges
MAIS 2+ MAIS 3+ MAIS 4+ MAIS 5+
Increments in Head MAIS
n=2 n=150 n=38 n=27 n=1 n=0 n=0
Increments in Upper Ext MAIS
Effect of Combinations of Head and Upper Extremity MAIS Injuries on % Change in Hospital Charges
MAIS = 0 or 1 for All Other Body Regions
n=38
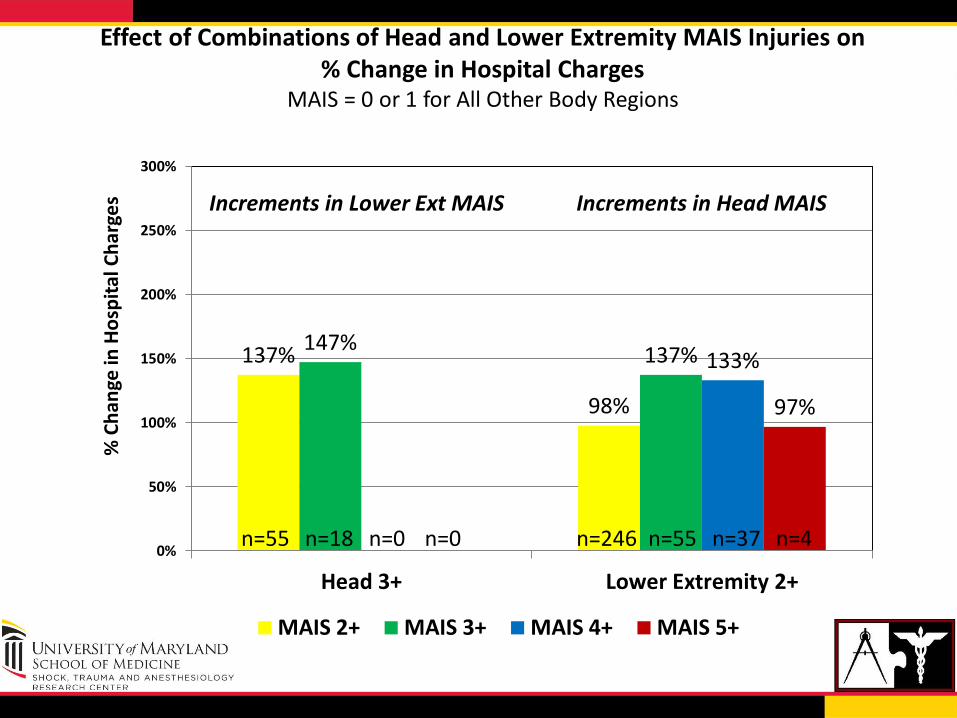
137%
98%
147% 137%
133%
97%
0%
50%
100%
150%
200%
250%
300%
Head 3+ Lower Extremity 2+
% C
han
ge in
Ho
spit
al C
har
ges
MAIS 2+ MAIS 3+ MAIS 4+ MAIS 5+
Increments in Head MAIS
n=18 n=246 n=55 n=37 n=4 n=0 n=0
Increments in Lower Ext MAIS
Effect of Combinations of Head and Lower Extremity MAIS Injuries on % Change in Hospital Charges
MAIS = 0 or 1 for All Other Body Regions
n=55

104% 102% 116%
104% 120%
147% 162%
0%
50%
100%
150%
200%
250%
300%
Thorax 3+ Abdomen 2+
% C
han
ge in
Ho
spit
al C
har
ges
MAIS 2+ MAIS 3+ MAIS 4+ MAIS 5+
Increments in Thorax MAIS
n=33 n=112 n=87 n=13 n=0 n=4 n=24
Increments in Abdomen MAIS
Effect of Combinations of Thorax and Abdomen MAIS Injuries on % Change in Hospital Charges
MAIS = 0 or 1 for All Other Body Regions
n=87
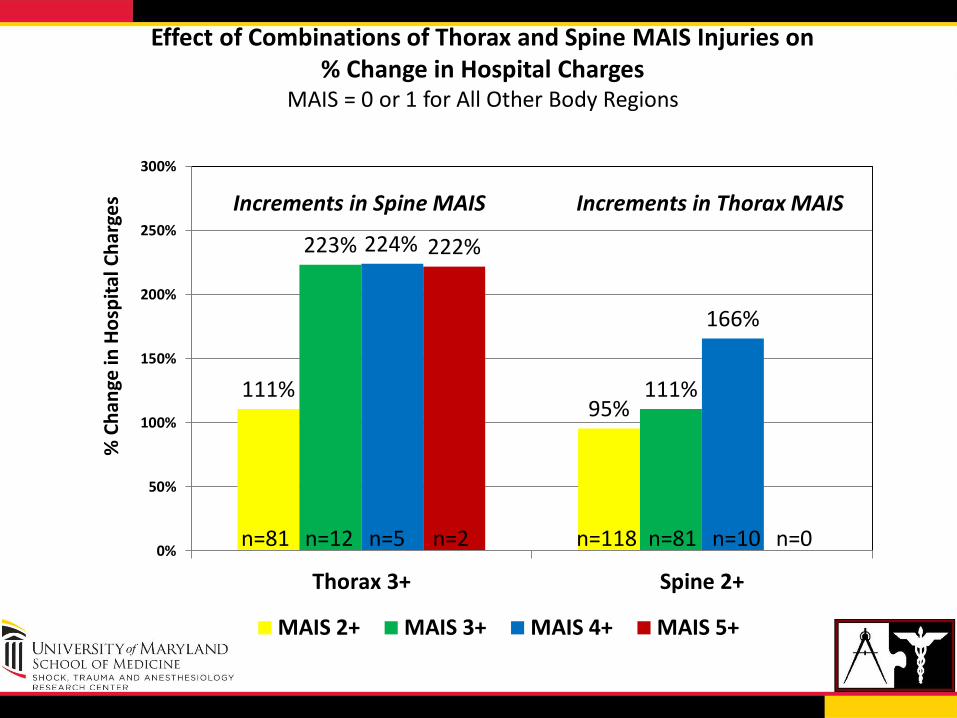
111% 95%
223%
111%
224%
166%
222%
0%
50%
100%
150%
200%
250%
300%
Thorax 3+ Spine 2+
% C
han
ge in
Ho
spit
al C
har
ges
MAIS 2+ MAIS 3+ MAIS 4+ MAIS 5+
Increments in Thorax MAIS
n=12 n=118 n=81 n=10 n=0 n=2 n=5
Increments in Spine MAIS
Effect of Combinations of Thorax and Spine MAIS Injuries on % Change in Hospital Charges
MAIS = 0 or 1 for All Other Body Regions
n=81
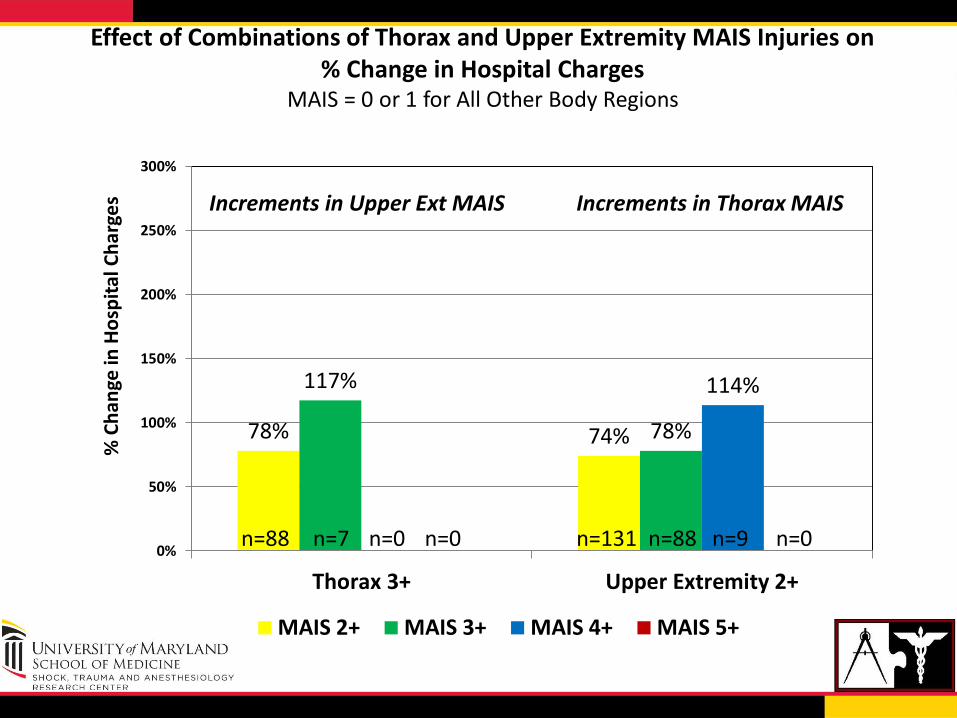
78% 74%
117%
78%
114%
0%
50%
100%
150%
200%
250%
300%
Thorax 3+ Upper Extremity 2+
% C
han
ge in
Ho
spit
al C
har
ges
MAIS 2+ MAIS 3+ MAIS 4+ MAIS 5+
Increments in Thorax MAIS
n=7 n=131 n=88 n=9 n=0 n=0 n=0
Increments in Upper Ext MAIS
Effect of Combinations of Thorax and Upper Extremity MAIS Injuries on % Change in Hospital Charges
MAIS = 0 or 1 for All Other Body Regions
n=88
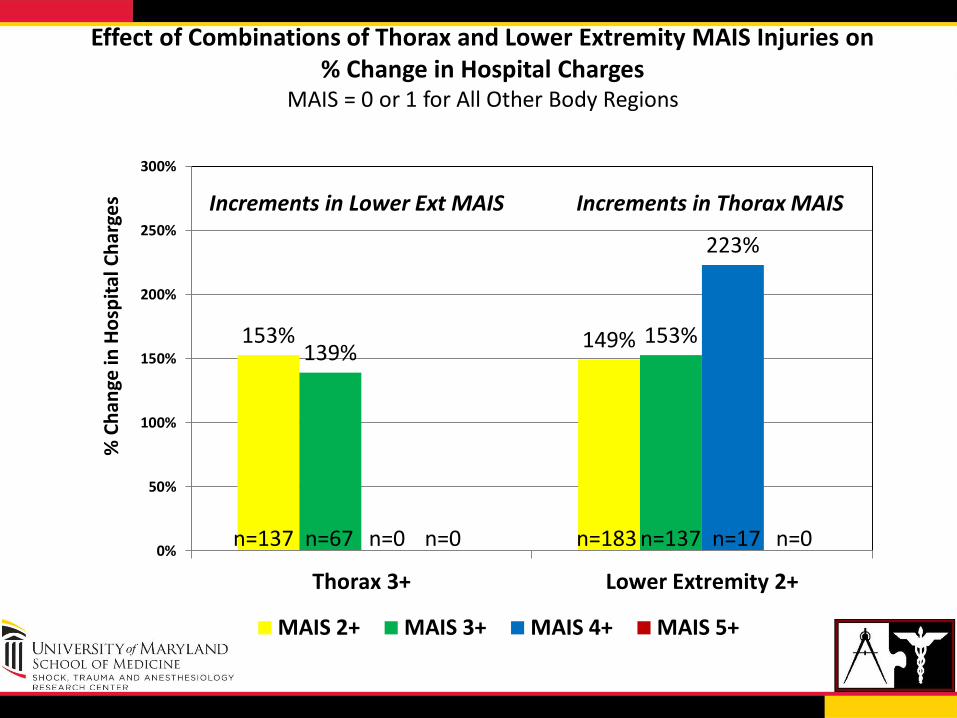
153% 149% 139%
153%
223%
0%
50%
100%
150%
200%
250%
300%
Thorax 3+ Lower Extremity 2+
% C
han
ge in
Ho
spit
al C
har
ges
MAIS 2+ MAIS 3+ MAIS 4+ MAIS 5+
Increments in Thorax MAIS
n=67 n=183 n=137 n=17 n=0 n=0 n=0
Increments in Lower Ext MAIS
Effect of Combinations of Thorax and Lower Extremity MAIS Injuries on % Change in Hospital Charges
MAIS = 0 or 1 for All Other Body Regions
n=137
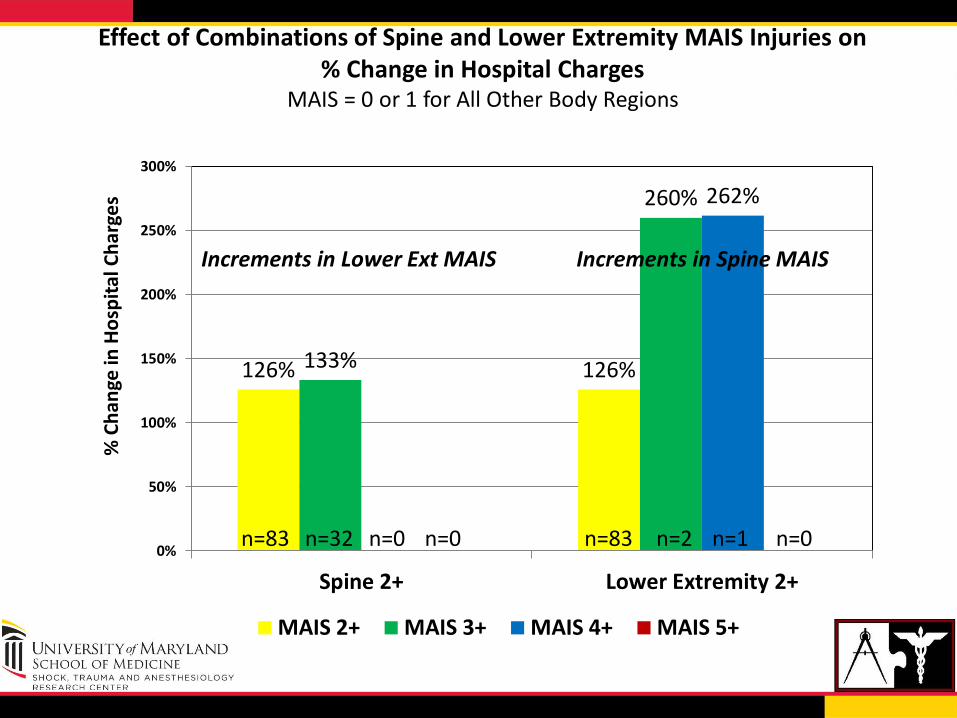
126% 126% 133%
260%
262%
0%
50%
100%
150%
200%
250%
300%
Spine 2+ Lower Extremity 2+
% C
han
ge in
Ho
spit
al C
har
ges
MAIS 2+ MAIS 3+ MAIS 4+ MAIS 5+
Increments in Spine MAIS
n=32 n=83 n=2 n=1 n=0 n=0 n=0
Increments in Lower Ext MAIS
Effect of Combinations of Spine and Lower Extremity MAIS Injuries on % Change in Hospital Charges
MAIS = 0 or 1 for All Other Body Regions
n=83
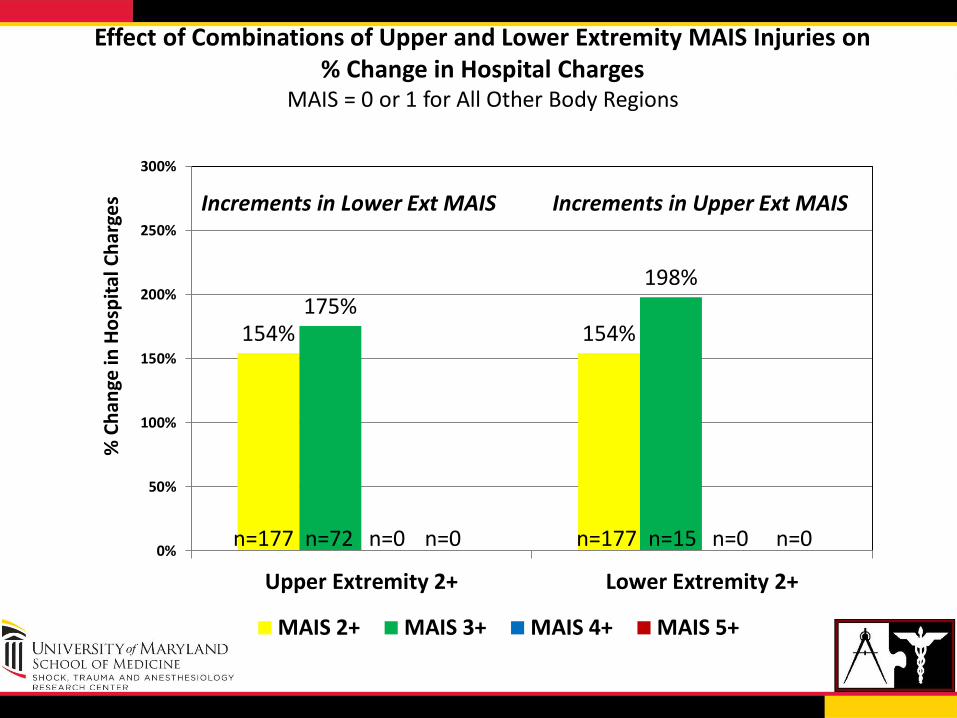
154% 154% 175%
198%
0%
50%
100%
150%
200%
250%
300%
Upper Extremity 2+ Lower Extremity 2+
% C
han
ge in
Ho
spit
al C
har
ges
MAIS 2+ MAIS 3+ MAIS 4+ MAIS 5+
Increments in Upper Ext MAIS
n=72 n=177 n=15 n=0 n=0 n=0 n=0
Increments in Lower Ext MAIS
Effect of Combinations of Upper and Lower Extremity MAIS Injuries on % Change in Hospital Charges
MAIS = 0 or 1 for All Other Body Regions
n=177
Conclusions
• Majority of hospital admissions had moderate to severe injuries in one or two body regions
• Individual body region costs (charges) were highest for lower extremities
• Cost (charges) increase is greatest where injuries progress from medical management to surgical management which is reflected by AIS and varies by body region
Conclusions
• Cost (charge) differences were largely unchanged when accounting age and sex
• Costs (charges) largely doubled when going from one injured body region to two
• Lower extremities are included in three of the top five pairs of injured body regions

Any questions…….. Tim Kerns [email protected] Pat Dischinger [email protected] Joe Kufera [email protected] Shiu Ho [email protected] Cindy Burch [email protected]