Embed Size (px)
Citation preview

Correlation of environmental factorswith asthma and rhinitis symptoms in Tulsa, OKCashel P. Newhouse, BS and Estelle Levetin, PhD
Background: Airborne allergens, pollutants, and climatic changes are known to influence the symptoms of asthma patients.Objective: To correlate airborne fungal spore and pollen concentrations, meteorological data, and airborne pollutants with
asthma and rhinitis symptoms to develop predictive models for asthma severity.Methods: Patients from the Tulsa community participated in this study from September 1 to October 31, 2000, by filling out
daily symptom diaries and measuring morning and evening peak expiratory flow rates. Air samples were collected using avolumetric spore trap. Meteorological variables and maximum and average pollutants were also included in the analysis. Linearregression analyses were performed for all environmental variables and symptom scores. Forward stepwise multiple regressionanalyses were performed to determine sets of variables that could be used to predict the conditions of increased symptom severity.Results: Twenty-four patients participated in this study. The predominant spore types included Cladosporium, ascospores, and
basidiospores. The predominant pollen type was Ambrosia. September was unusually hot and dry in Tulsa, but 161 mm ofprecipitation fell in October, primarily during the last 11 days. Two periods of peak symptoms occurred during the study, the firstduring the peak week of Ambrosia and the second after a 22° C drop in temperature over 6 days. Numerous environmentalvariables showed significant correlations with symptom scores; however, there was no single predictive model for all symptoms.Conclusions: Ambrosia pollen and other environmental variables, including ozone levels, were significantly correlated with
asthma and rhinitis symptoms.Ann Allergy Asthma Immunol. 2004;92:356–366.
INTRODUCTIONAirborne allergens, as well as climatic changes and airbornepollutants, may influence the symptoms of asthma patients.1–6Because the abundance and specific types of spores andpollen differ according to meteorological conditions, theremay be similar correlations between asthma symptoms andweather and symptoms and spores. As a result, it is notalways clear which environmental factors are responsible forthe daily variation in asthma symptom severity. Althoughthere is a general understanding of the meteorological con-ditions required for the predominant airborne fungal sporesand pollen grains to be at peak levels in the atmosphere, theserelationships are complex and have not been definitivelyestablished in the aerobiology literature.Asthma is closely linked to hay fever or rhinitis. A recent
study reported that 95% of patients with allergic asthma havenasal allergies as well.7 There is conflicting evidence, how-ever, about the role that pollen concentrations play in theseverity of asthma symptoms, with some evidence of a cor-relation and some studies finding no association betweenasthma and pollen.8–10 Exposure to the starch granules frompollen grains have been shown to elicit severe bronchialconstriction.11 One study of patients with seasonal asthma andrhinitis concluded that grass pollen immunotherapy reduced
seasonal asthma symptoms and bronchial hyperresponsive-ness.12 Interactions between pollen and ozone have beenshown to lessen the amount of allergen necessary to initiatean asthmatic response.13There is evidence that every major fungal group contains
allergens.14–16 Both indoor and outdoor exposure are impor-tant and may cause asthma, hay fever, and hypersensitivitypneumonitis in sensitive patients. There is a great deal ofoverlapping sensitivity to different types of fungal spores. Ithas been suggested that prolonged exposure to one allergenicspore type creates a base level of susceptibility, which caneasily be increased with the addition of other spore and pollentypes, such as grass pollen, Penicillium, Alternaria, and As-pergillus, resulting in an allergic response and an asthmaattack.17If the relationship among asthma symptoms, meteorologi-
cal conditions, and bioaerosol concentrations could be con-clusively established, this could provide a huge benefit topatients with known outdoor allergies. Knowledge of thisrelationship would allow allergy and asthma patients to takepreventive measures before being exposed to high concentra-tions of particular allergens. This project attempts to correlatevarious asthma symptoms and peak expiratory flow rate(PEFR) readings from local asthma patients with atmosphericfungal spore and pollen concentrations and meteorologicaland air pollution data. The goal of the project was to developan exploratory model that links asthma severity and 1 or morepredictors from the bioaerosol, pollutant, and meteorologicaldata.
Department of Biological Science, The University of Tulsa, Tulsa,Oklahoma.Received for publication October 16, 2002.Accepted for publication in revised form September 25, 2003.
356 ANNALS OF ALLERGY, ASTHMA, & IMMUNOLOGY

METHODSThe study was conducted from September 1, 2000, to October31, 2000, 2 months when both pollen and spore levels aretypically elevated in Tulsa, OK.18,19 The analysis includeddaily averages of weather, pollutants, spores, pollen, andsymptom variables. PEFR readings were analyzed for bothmorning and night.Volunteers were recruited for this project through fliers
sent to area physicians, a newspaper article, and e-mail so-licitation on The University of Tulsa mail server. Proper useof the peak flow meters was demonstrated, and all questionswere addressed at a participant meeting. A patient informa-tion sheet was completed by every participant before datacollection began. This form aided in the analysis of the resultsand in developing an overall characterization of the patientbase by providing medical history and lifestyle information.Each day during the study, the participants recorded a
morning PEFR reading, an evening PEFR reading, medica-tions taken, and other symptoms listed in a symptom diary.Table 1 shows a sample of the symptom diary; in the actualdiary, patients were instructed to check yes for each symptomexperienced during the day. Diaries were for 1 week, andthere was a separate dated column for each day. Symptomdiaries were modeled after ones used by O’Rourke et al20–22from The University of Arizona College of Medicine. Thediaries were validated by these researchers and used inasthma studies of a white, middle-class population in Tucson,AZ. Symptom diaries and all forms were approved by TheUniversity of Tulsa Human Subjects Review Board, and aninformed consent form was signed by each participant.Pollen and fungal spore levels in the Tulsa atmosphere
were monitored using a Burkard volumetric spore trap
(Burkard Manufacturing Co, Ltd, Rickmansworth, UK) lo-cated on the roof of Oliphant Hall at The University of Tulsaas previously described.23 The slides were analyzed at 400�for pollen using the 12-traverse method. Fungal spores werecounted at 1,000� under oil immersion using the longitudinalmethod. The spore and pollen counts were converted intoatmospheric concentrations and expressed as spores or pollengrains per cubic meter of air. The bioaerosol concentrationswere log transformed to normalize the data for statisticalanalyses.Meteorological data were obtained from the National Oce-
anic and Atmospheric Administration weather station inTulsa, located approximately 8.0 km northeast of the sam-pling site. Pollution data, including the daily averages anddaily maximums for ozone, carbon monoxide, particulatematter less than or equal to 2.5 �m, and sulfur dioxide, wereobtained from the Oklahoma Department of EnvironmentalQuality sampling site, located approximately 1.0 km fromThe University of Tulsa.A percentage of positive responses for each symptom for
each day was calculated using the number of positive re-sponses and the total number of patients responding that day.A composite asthma score for each day was calculated byadding the ratio of positive responses for wheezing, chesttightness, shortness of breath, and coughing. This numberwas converted to a decimal with a range of 0.0 to 4.0. A 4.0would have meant that every patient had exhibited everyasthma symptom on a given day. A composite rhinitis symp-tom score was calculated in the same manner using thesymptoms itchy or watery eyes, runny nose, sore throat,cough, and sneezing. This score was out of a possible 5.0.Both simple linear regression and forward stepwise multi-
ple regression analyses (using Statistica 5.0 software, StatSoftInc, Tulsa, OK) were performed for each individual symptomand for the morning and evening peak flow values. Thepatient categories for the multiple regression analyses in-cluded all patients, patients not exposed regularly to tobaccosmoke, men, and women. The predictor variables included allof the meteorological variables and each spore and pollentype that had an average daily value of more than 1 parti-cle/m3 during the 2-month period and the mean and maxi-mum pollutant levels. Analyses were also conducted for eachsymptom to determine whether lag effects were present forthe period up to 5 days before reported symptoms.
RESULTSSummary of Patient GroupAlthough 38 patients completed initial paperwork, only 24patients completed at least a portion of the diaries and thuswere included in the analysis (Table 2). All patients had aphysician diagnosis of asthma; however, skin testing infor-mation was not available to the authors of the current study.On the information forms, the average participant experi-
Table 1. Sample of the Symptom Diary Used in This Study
AM Peak expiratory flow rate (PEFR)PM Peak expiratory flow rate (PEFR)Red, itchy, watery, or burning eyes e YesStuffy or running nose e YesSore throat e YesCough e YesChest cold e YesSneezing e YesWheezing e YesChest tightness e YesShortness of breath e YesDryness of the mouth e YesFever or a feverish feeling e YesDizziness e YesHeadache e YesUnusual fatigue, tiredness, achy feeling e YesOther symptoms e YesMissed work or school e YesConsulted a physician e YesEmergency room visit e Yes*Medications taken
* Please write the medication name and the number of puffs, pills, orteaspoons taken.
VOLUME 92, MARCH, 2004 357

enced asthma-related symptoms approximately 4 days and4 nights each week, although most indicated that thisnumber was extremely variable from week to week. The
number of previous hospital visits was highly variablefrom patient to patient.The composite asthma symptom scores show definite pe-
riods of increased asthma symptoms (Fig 1A). The days withthe highest symptoms were September 18 and October 7,both days having a score of 1.33. The composite rhinitisscores were similar to the asthma symptom scores, althoughthe value of the scores cannot be directly compared (Fig 1B).The peaks were on September 19 and 20, with scores of 1.81and 1.70, respectively, and October 7 and 8, with scores of1.73 and 1.60, respectively. Smaller peaks in both scoreswere seen on October 16 and October 27 to 29.The mean morning PEFR was 375 L/min, the mean
evening PEFR was 368 L/min, and the total average PEFRwas 371 L/min (Fig 2). The evening PEFR averages were lessthan the morning average on 45 days and greater than themorning average PEFR on 16 days during the study. Dayswhen both PEFR values were below 360 L/min includedSeptember 10 and October 3. During the periods of peaksymptom scores, PEFR readings were lower than the mean.The PEFR values on September 18 and 19 averaged approx-imately 365 L/min for the evening PEFR and approximately370 L/min for the morning PEFR. PEFR values for thesecond period of peak symptoms (October 7–9) showed val-
Table 2. Patient Group Characteristics
Characteristics Male Female Total
No. of patients 5 19 24Average age, y 31 38 36Age range, y 9–45 9–64 9–64Average years with asthma 19 17 17Average days per week with
symptoms5 4 4
Average nights per week withsymptoms
4 4 4
Percentage of the time you takeasthma medication
76–100 51–75 51–75
Someone around you smokes, %of patients
20 26 25
Admitted to the hospital due toasthma, % of patients
60 42 46
Received ventilatory supportbecause of asthma, % ofpatients
40 21 25
Average No. of family memberswith asthma or allergies
1 2 2
Physically active, % of patients 100 74 79
Figure 1. Composite asthma and rhinitis symptom scores.The scores were calculated by adding percentages of positiveresponses for all symptoms in the category. Top, Compositeasthma symptom score includes cough, chest tightness, wheez-ing, and shortness of breath. Maximum possible score is 4.0.Bottom, Composite rhinitis symptom score includes itchy/watery eyes, stuffy/runny nose, sore throat, cough, and sneez-ing. Maximum possible score is 5.0. All dates are for 2000.
358 ANNALS OF ALLERGY, ASTHMA, & IMMUNOLOGY

ues between 360 and 370 L/min on October 7 and a value of356 L/min on the morning of October 8, which was one of thelowest average morning PEFRs.Weather SummaryThe conditions during the study period of September 1 toOctober 31, 2000, were much warmer than normal (Table 3).The day with the highest average temperature was the firstday of the study at 33.33° C, and the lowest was on October8 at 5.56° C (Fig 3). There was a large increasing trend fromSeptember 24 until October 3, and then the average temper-ature dropped each day until October 8, at which point thetemperature began to rise again until October 13.The total precipitation was 189 mm (Table 3), with 122
mm (65% of the total) falling during the last 11 days ofOctober (Fig 3). September had 79.74 mm less precipitationthan normal, but October had 70.63 mm more than normal.The month previous to the study had been especially hot anddry, with the maximum temperatures averaging 3.16° Cabove normal and with 78.99 mm less precipitation thannormal.
Concentrations of Bioaerosols and PollutantsThe average daily concentrations of the spore and pollentypes identified in this study are listed in Table 4. Cladospo-rium represented 82.2% of the total atmospheric fungalspores during the study period. The next most abundant wereascospores, basidiospores, smut spores, and Alternaria.The airborne Cladosporium spore levels initially remained
between approximately 2,500 and 12,500 spores/m3 untilOctober 16 (Fig 4, top). Cladosporium concentrations in-creased during the next 4 days, reaching 24,030 spores/m3 onOctober 20. The concentrations decreased until October 24,then peaked at 27,942 spores/m3, the highest concentrationfor the study period. This rise in levels corresponded to theheavy rainfall seen in late October.The ascospore concentrations showed a much different
pattern during the study period (Fig 4, bottom). The highestconcentrations were on September 5 and 12, with concentra-tions of 3,005 and 2,258 spores/m3, respectively. Both ofthese peaks followed relatively small amounts of rain; how-ever, the days leading up to that precipitation were com-
Figure 2. Average peak expiratory flow rates.
Table 3. Meteorological Summary of Study Period
VariableSeptember 2000 October 2000
Average (range) 30-Year average Average (range) 30-Year average
High temperature, °C 31.94 (16.11–42.22) 29.22 25.07 (12.22–33.33) 23.72Low temperature, °C 16.59 (5.56–25.00) 17.22 13.54 (�2.22–20.00) 10.50Mean temperature, °C 24.39 (13.33–33.33) 22.94 19.1 (5.56–27.22) 17.11Average dew point, °C 13.28 (5.00–20.00) 15.72 11.45 (�5.56–18.89) 9.56Relative humidity, % 54.01 (29.50–94.38) 70.00 66.25 (40.88–92.37) 66.00Total precipitation, mm 27.96 (0.00–12.70) 118.87 161.05 (0.00–41.91) 92.96Average pressure, mm Hg 742.97 (736.35–749.30) 744.47 746.88 (736.35–760.48) 745.24Average wind speed, m/s 3.95 (1.03–7.51) 4.02 4.24 (1.56–7.19) 4.29
VOLUME 92, MARCH, 2004 359

pletely dry. The concentrations also began to rise beginningon October 21, corresponding to the beginning of 7 consec-utive days of rainfall. The added rainfall appeared to havehelped the concentrations rise to 1,993 spores/m3 on October27 and 2,152 spores/m3 on October 31.The basidiospore concentrations followed a very steady
pattern for the first 50 days of the study, with concentrationsconsistently below 500 spores/m3 (Fig 4, bottom). During the
final 11 days, the basidiospore concentrations continued on agenerally upward trend, with the highest concentration, 3,699spores/m3, on the last day of the study. This was presumablyin response to the significant increase in rainfall during thesedays. The increase in the various fungal spore levels near theend of the study coincides with a small increase in symptomscores seen during this period.The most common types of pollen identified were Ambro-
sia, Ulmus, Chenopodiaceae/Amaranthaceae, and Poaceae(Table 4). Ambrosia represented 85.8% of the total atmo-spheric pollen during the study period. The Ambrosia con-centrations were the highest in September, especially fromSeptember 11 to 23 (Fig 5). Peak days were September 15,20, and 23, with concentrations of 353, 498, and 369 pollengrains/m3, respectively. After September 23, the concentra-tions dropped below 100 pollen grains/m3, with a slightresurgence from October 2 to 5. After October 5, the Ambro-sia concentration remained extremely low. The next mostabundant pollen was Ulmus, which was 7.1% of the totalpollen. Ten other pollen types (Alnus, Artemesia, Betula,Carya, Celtis, Juniperus, Maclura, Morus, Plantago, andUrtica), with an individual mean concentration below 1.0pollen grains/m3, were excluded from further analysis. Thesetaxa compose the group “other pollen.” Table 4 also showsthe mean concentrations of airborne pollutants examined inthe study.Regression AnalysisSimple linear regression analyses showed that several envi-ronmental factors were significantly related to patient symp-toms. Ambrosia concentrations were significantly correlatedwith composite asthma scores (r � 0.263, P � .05) andrhinitis scores (r � 0.513, P � .001) and several individualsymptoms (Table 5). Pollen from the Chenopodiaceae/Ama-
Figure 3. Precipitation and average temperature during the study period.
Table 4. Average Daily Concentrations of Bioaerosols andPollutants during the Study Period (n � 61)
Average (range)
Fungal spores, particles/m3
Cladosporium 8,151 (1,140–27,942)Alternaria 211 (0–663)Drechslera 37 (0–106)Epicoccum 16 (0–111)Pithomyces 11 (0–74)Curvularia 10 (0–37)Ascospores 675 (21–3,005)Basidiospores 542 (0–3,699)Smut spores 220 (5–790)Other spores 143 (0–339)
Pollen, particles/m3
Ambrosia 107 (1–498)Ulmus 9 (0–167)Chenopodiaceae/Amaranthoceae 5 (0–24)Poaceae 3 (0–13)All other pollen 1 (0–16)
Pollutants, ppmParticulate matter � 2.5 �m 13.07 (0.50–29.90)Carbon monoxide 0.57 (0.30–1.60)Ozone 0.03 (0.01–0.07)Sulfur dioxide 0.01 (0.00–0.02)
360 ANNALS OF ALLERGY, ASTHMA, & IMMUNOLOGY

ranthaceae families also showed significant correlations withcomposite asthma scores (r � 0.256, P � .05), and pollenfrom Ulmus (r � 0.367, P � .01), Chenopodiaceae/Amaran-thaceae (r� 0.458, P� 0.001), and Poaceae (r� 0.326, P�.05) had significant correlations with composite rhinitisscores. Several individual symptoms also showed significantcorrelations with these pollen types (data not shown). Pollen
concentrations significantly influenced morning PEFR read-ings for the following day. Morning PEFRs were negativelycorrelated with pollen concentrations of Ambrosia (r ��0.364, P � .01), Ulmus (r � �0.261, P � .05), Chenopo-diaceae/Amaranthaceae (r � �0.362, P �.01), and Poaceae(r � �0.285, P � .05); however, evening PEFR readingsshowed no significant relationship with pollen concentrationsfor the previous day or the current day. Patient symptomscores showed little relationship to fungal spore concentra-tions. Morning PEFR readings were negatively related toconcentrations of Curvularia (r � �0.27, P � .05) andDrechslera-type conidia (r � �0.34, P � .01).Significant relationships between symptoms and meteoro-
logical conditions also existed (Table 6). Composite asthmasymptom scores showed a significant increase as morninglow temperatures decreased (r � �0.317, P � .05). Dewpoint and relative humidity were negatively related to bothcomposite asthma and rhinitis scores. Precipitation was alsonegatively correlated with these composite scores; however,the relationship with the rhinitis symptoms was not signifi-cant. Similar results were seen with individual symptomscores, with dew point and relative humidity as the most
Figure 4. Average daily concentrations of majorairborne fungal spores. Top, Cladosporium, Alter-naria, and smut spores. Bottom, Ascospores andbasidiospores.
Figure 5. Average daily concentrations of major airborne pollen. Cheno/Am, Chenopodiaceae/Amaranthaceae.
VOLUME 92, MARCH, 2004 361

important variables (data not shown). For the atmosphericpollutants, average and maximum ozone concentrationsseemed to be the most significant factors that influencedsymptom scores. Morning PEFR values were significantlyaffected by average (r � �0.274, P � .05) and maximum(r � �0.289, P � .05) ozone levels on the previous day.Individual symptoms, such as wheezing, headache, and fa-tigue, were also significantly related to the average andmaximum daily ozone levels (data not shown).Because of the complex relationships between symptom
scores and environmental factors, multiple regression analy-sis was used in an attempt to develop predictive models tointegrate these relationships. Multiple regression analyseswere performed for all patients (n � 24), men (n � 4),women (n � 18), and those patients not exposed to tobaccosmoke on a regular basis (n � 19). Each analysis correlatedone symptom for a specific patient category with a combina-
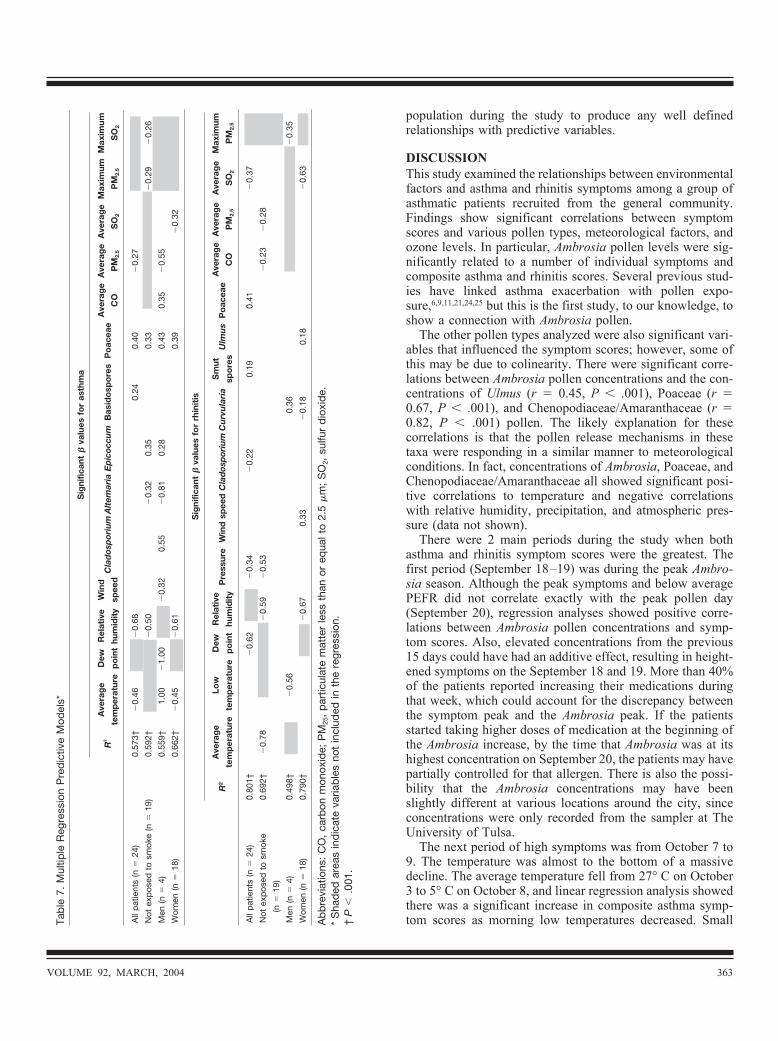
tion of the environmental variables to produce a model ex-plaining a percentage of the variability (R2) for the symptom.The multiple regression analysis produced different predic-tive models for each symptom using combinations of allenvironmental factors: 8 meteorological parameters, 10 sporetypes, 4 pollen types, and 8 pollutant categories. Eight sepa-rate regression models were produced for each symptom foreach patient category, for a total of 32 possible models persymptom, to ensure that the environmental variables did notautocorrelate. For example, relative humidity and dew pointwere not used together, average temperature was not usedwith high and low temperature, and average pollutants werenot used in the same regression with maximum pollutants.Some of the best predictive models are displayed in Tables 7and 8. � values are only displayed for the variables that weresignificant at P � .05. Shaded boxes indicate variables notused for a particular model, whereas blank boxes indicatevariables that were excluded by the model or were not sig-nificant (P � .05) in the regression. Each model includesother nonsignificant variables not listed in the table.The best predictive models for each patient category for the
composite asthma symptom scores each had an R2 of at least0.573, with women having the best R2 at 0.662 (Table 7). Allincluded either dew point or relative humidity as the bestpredictor, and each also included Poaceae, although concen-trations were low throughout the study.The best predictive models for the rhinitis composite
scores for each patient category all had R2 values between0.498 (men) and 0.801 (all patients) (Table 7). Dew point orrelative humidity was the most important factor in 2 of themodels, and average temperature or low temperature was themost important in the other 2.Table 8 includes the best predictive models for morning
and evening PEFR and individual symptoms for the patientgroup not exposed to tobacco smoke. The morning andevening PEFRs were lagged 1 day, so the symptoms werecorrelated with environmental variable from the previousday. These were the only factors where lagging the environ-mental variables increased the value of the R2. Several symp-toms were not in the multiple regression analyses (Table 7),because symptoms occurred too infrequently in the patient
Table 6. Correlation of Symptom Scores with Meteorological Variables
Meteorological variablePearson correlation coefficients
Composite asthma score Composite rhinitis score Morning PEFR
Average daily temperature �0.189 �0.113 �0.300*Low temperature �0.317* �0.247 �0.242Average dew point �0.508† �0.432† �0.184Average relative humidity �0.537† �0.556† 0.194Precipitation �0.324* �0.244 0.263
Abbreviation: PEFR, peak expiratory flow rate.* P � .05.† P � .001.
Table 5. Correlations of Symptom Scores with Airborne AmbrosiaConcentrations
Symptoms Pearson correlation coefficient
Composite asthma score 0.263*Composite rhinitis score 0.513†AM PEFR �0.364‡PM PEFR �0.121Red, itchy, watery eyes 0.593†Stuffy or runny nose 0.568†Sore throat 0.211Cough 0.147Chest cold �0.271*Sneezing 0.272*Wheezing 0.363‡Chest tightness 0.042Shortness of breath 0.255*Dry mouth 0.264*Fever 0.061Dizziness 0.347‡Headache 0.229Fatigue 0.463†
Abbreviation: PEFR, peak expiratory flow rate.* P � .05.† P � .01.‡ P � .001.
362 ANNALS OF ALLERGY, ASTHMA, & IMMUNOLOGY
population during the study to produce any well definedrelationships with predictive variables.
DISCUSSIONThis study examined the relationships between environmentalfactors and asthma and rhinitis symptoms among a group ofasthmatic patients recruited from the general community.Findings show significant correlations between symptomscores and various pollen types, meteorological factors, andozone levels. In particular, Ambrosia pollen levels were sig-nificantly related to a number of individual symptoms andcomposite asthma and rhinitis scores. Several previous stud-ies have linked asthma exacerbation with pollen expo-sure,6,9,11,21,24,25 but this is the first study, to our knowledge, toshow a connection with Ambrosia pollen.The other pollen types analyzed were also significant vari-
ables that influenced the symptom scores; however, some ofthis may be due to colinearity. There were significant corre-lations between Ambrosia pollen concentrations and the con-centrations of Ulmus (r � 0.45, P � .001), Poaceae (r �0.67, P � .001), and Chenopodiaceae/Amaranthaceae (r �0.82, P � .001) pollen. The likely explanation for thesecorrelations is that the pollen release mechanisms in thesetaxa were responding in a similar manner to meteorologicalconditions. In fact, concentrations of Ambrosia, Poaceae, andChenopodiaceae/Amaranthaceae all showed significant posi-tive correlations to temperature and negative correlationswith relative humidity, precipitation, and atmospheric pres-sure (data not shown).There were 2 main periods during the study when both
asthma and rhinitis symptom scores were the greatest. Thefirst period (September 18–19) was during the peak Ambro-sia season. Although the peak symptoms and below averagePEFR did not correlate exactly with the peak pollen day(September 20), regression analyses showed positive corre-lations between Ambrosia pollen concentrations and symp-tom scores. Also, elevated concentrations from the previous15 days could have had an additive effect, resulting in height-ened symptoms on the September 18 and 19. More than 40%of the patients reported increasing their medications duringthat week, which could account for the discrepancy betweenthe symptom peak and the Ambrosia peak. If the patientsstarted taking higher doses of medication at the beginning ofthe Ambrosia increase, by the time that Ambrosia was at itshighest concentration on September 20, the patients may havepartially controlled for that allergen. There is also the possi-bility that the Ambrosia concentrations may have beenslightly different at various locations around the city, sinceconcentrations were only recorded from the sampler at TheUniversity of Tulsa.The next period of high symptoms was from October 7 to
9. The temperature was almost to the bottom of a massivedecline. The average temperature fell from 27° C on October3 to 5° C on October 8, and linear regression analysis showedthere was a significant increase in composite asthma symp-tom scores as morning low temperatures decreased. SmallTa
ble
7.M
ultip
leReg
ress
ion
Pre
dictiv
eM
odels*
Sig
nific
ant
�va
lues
for
asth
ma
R2
Ave
rag
e
tem
per
atur
e
Dew
po
int
Rel
ativ
e
hum
idit
y
Win
d
spee
dC
lad
osp
oriu
mA
ltem
aria
Ep
icoc
cum
Bas
ido
spo
res
Po
acea
eA
vera
ge
CO
Ave
rag
e
PM
2.5
Ave
rag
e
SO
2
Max
imum
PM
2.5
Max
imum
SO
2
Allpat
ient
s(n
�24
)0.
573†
�0.
46�
0.68
0.24
0.40
�0.
27
Not
expos
edto
smok
e(n
�19
)0.
592†
�0.
50�
0.32
0.35
0.33
�0.
29�
0.26
Men
(n�
4)0.
559†
1.00
�1.
00�
0.32
0.55
�0.
810.
280.
430.
35�
0.55
Wom
en(n
�18
)0.
662†
�0.
45�
0.61
0.39
�0.
32
Sig
nific
ant
�va
lues
for
rhin
itis
R2
Ave
rag
e
tem
per
atur
e
Low
tem
per
atur
e
Dew
po
int
Rel
ativ
e
hum
idit
yP
ress
ure
Win
dsp
eed
Cla
dos
por
ium
Cu
rvu
lari
aS
mut
spo
res
Ulm
us
Po
acea
eA
vera
ge
CO
Ave
rag
e
PM
2.5
Ave
rag
e
SO
2
Max
imum
PM
2.5
Allpat
ient
s(n
�24
)0.
801†
�0.
62�
0.34
�0.
220.
190.
41�
0.37
Not
expos
edto
smok
e
(n�
19)
0.69
2†�
0.78
�0.
59�
0.53
�0.
23�
0.28
Men
(n�
4)0.
498†
�0.
560.
36�
0.35
Wom
en(n
�18
)0.
790†
�0.
670.
33�
0.18
0.18
�0.
63
Abbre
viat
ions
:CO,ca
rbon
mon
oxid
e;PM
25,par
ticulat
em
atte
rless
than
oreq
ualt
o2.
5�m
;SO
2,su
lfurdioxide.
*Sha
ded
area
sindicat
eva
riables
notinclud
edin
the
regr
ession
.†
P�
.001
.
VOLUME 92, MARCH, 2004 363

peaks occurred on October 16 and October 27 to 29. Duringthis period, fungal spore levels increased, especially asco-spores and basidiospores. It is possible that these may berelated to the elevated symptoms. Basidiospores were one ofthe significant factors for asthma symptoms for the wholegroup in the multiple regression analysis but not the simplelinear regression. Both Epton et al8 and Dales et al10 haveshown increased asthma severity with rises in basidiosporeconcentrations, and Dales et al10 also documented associa-tions with increased airborne ascospore concentrations.The multiple regressions for symptoms presented herein
included a variety of variables as the top predictors for eachsymptom but no consistent set of triggers. There are manypossible explanations. Some variables may be autocorrelated,since it is well known that ascomycete fruiting bodies needprecipitation and/or high humidity to trigger ascospore re-lease, and Cladosporium and other dry air spores tend to bereleased on warm, dry days with strong winds.14,26 Somevariables may also have been colinear as described earlier.Different variables may also have been significant if theregressions analyzed each month separately. For example,Ambrosia was a significant predictor for rhinitis in models forSeptember (data not shown) but not in the models for bothmonths, even though simple linear regression analysisshowed that Ambrosia pollen levels were significantly relatedto symptom scores for the whole period.The inclusion of Poaceae pollen as a significant variable in
the predictive models for asthma was surprising, becauseaverage daily grass pollen concentrations were low to mod-erate throughout the period based on National Allergy Bureaupollen levels. It is possible that colinearity with ragweedpollen may explain this; however, studies have suggested thatgrass pollen levels as low as 10 to 20 grains/m3 are sufficientto trigger symptoms in sensitive individuals.27,28 Although the2-month mean concentration was below this level, many
daily concentrations were in the moderate range, and hourlyconcentrations were in the high range (�20 grains/m3 basedon National Allergy Bureau) several times. Clearly, morework is needed with patients known to be grass sensitive.Different individuals are allergic to different allergens and
triggers, so it is entirely possible that one subset of patientswas driving the symptom scores on days with high ascosporelevels, for example, whereas others showed greater signs ofrespiratory trouble when the Ambrosia or Poaceae concentra-tions were elevated. This would have resulted in weakerregressions with any particular allergen or environmentalfactor. If skin testing data had been available, patients couldhave been grouped by pollen sensitivity. Also, our volunteerpopulation was not necessarily representative of all asthmaticpatients in the Tulsa area.The inconsistencies in the predictive models for the differ-
ent symptoms also could have been due in part to factors thatwere not even considered. Personal ozone levels were foundto be significant to asthma severity in a study by Delfino etal.2 Several studies have shown that outdoor concentrations ofozone do not explain personal ozone variability29; however,personal exposure data were not available in this study.Individual exposure to tobacco smoke is also a known asthmairritant.13 Neither the daily variation in tobacco smoke expo-sure nor exposure to indoor allergens was considered, whichcould have influenced the severity of asthma symptoms forsome patients.Time-series data have been shown to produce positive
associations between fungal spore levels and asthma symp-tom scores.2 It is likely that some spore and pollen types, andpossibly weather variables, influence asthmatic symptomssooner than others. The lag time may be as much as 24 or 48hours previous to the day in question, or responses may beimmediate. Most likely, the response time encompasses bothreactions to present allergens in the atmosphere and from
Table 8. Multiple Regression Predictive Models for Other Symptoms*
Significant � values for other symptoms§
R2Average
temperature
High
temperature
Low
temperature
Dew
point
Relative
humidityPrecipitation Pressure Wind speed Cladosporium Epicoccum
Morning PEFR¶ 0.552† 0.91 �1.78 0.31 �0.77 �0.49 �0.45
Evening PEFR¶ 0.551‡ 0.86 �0.35 0.16 �0.45
Itchy, watery eyes 0.662† �0.96 �0.75 �0.46
Stuffy, runny nose 0.683† �0.53 �0.33 �0.58
Cough 0.541‡ �1.04 �0.83 �0.70 �0.39
Sneeze 0.468† �0.61
Wheeze 0.356‡ �0.46 0.31
Chest tightness 0.565‡ 0.84 �0.85 0.39
Shortness of breath 0.665‡ �0.32 0.38
Abbreviations: O3, ozone; PEFR, peak expiratory flow rate; PM2.5, particulate matter less than or equal to 2.5 �m; SO2, sulfur dioxide.* Shaded areas indicate variables not included in the regression.† P � .001.‡ P � .01.§ For patients not exposed to tobacco smoke.¶ Models were lagged 1 day.
364 ANNALS OF ALLERGY, ASTHMA, & IMMUNOLOGY

exposures previous to the symptom occurrence. This studyexamined delays for up to 5 days previously for all variablesand 1-day delays for single variables. This did not improvethe outcome of the regressions for any symptom exceptPEFR; however, better R2 values may have resulted fromlagging specific combinations of variables and not others.Clearly, the exploratory models developed in this study needto be validated by further research with a greater number ofpatients with known skin testing results.
CONCLUSIONThis study showed 2 periods of increased asthma and rhinitissymptoms during September and October 2000, one duringthe week of peak Ambrosia pollen and the other after a 22° Ctemperature decrease during 6 days. Composite asthmascores, rhinitis scores, and individual symptoms were signif-icantly correlated to Ambrosia pollen levels and other pollentypes, meteorological conditions, and ozone levels. Multipleregression analyses produced complex models with differentpredictor variables for each symptom.
ACKNOWLEDGMENTSThis project was made possible, in part, by a National ScienceFoundation Experimental Partnership to Stimulate Competi-tive Research grant (project No. EPS9550478), which pro-vided funds to enhance the Oklahoma Mesonet. Funding wasalso provided by a grant from the University of Tulsa Re-search Office and the Tulsa Undergraduate Research Chal-lenge. We thank all of the volunteer participants who madethis project possible. We also thank Janelle Whitt, DO, forher help in patient recruitment and project design, MaryLarsen-Purvis and Dale Johnson, PhD, for their assistance,and Mary Kay O’Rourke, PhD, for providing symptom dia-ries from research at the University of Arizona. Commentsand discussions with Peter K. Van de Water, PhD, andChristine Rogers, PhD, are greatly appreciated as were thecomments of the anonymous reviewers.
REFERENCES1. Shapiro GG. The ABCs of asthma. Discover. 1998;19:S21–S24.2. Delfino RJ, Coate BD, Zeiger RS, et al. Daily asthma severity
in relation to personal ozone exposures and outdoor fungalspores. Am J Respir Crit Care Med. 1996;154:633–641.
3. Delfino RJ, Zeiger RS, Seltzer JM, et al. The effect of outdoorfungal spore concentrations on daily asthma severity. EnvironHealth Perspect. 1997;105:622–635.
4. Richardson MJ. The occurrence of airborne Didymella spores inEdinburgh. Mycol Res. 1996;100:213–216.
5. Celenzia A, Fothergill J, Kupek E, Shaw RJ. Thunderstormassociated asthma: a detailed analysis of environmental factors.BMJ. 1996;312:604–607.
6. Venables KM, Allitt U, Collier CG, et al. Thunderstorm-relatedasthma: the epidemic of 24/25 June 1994. Clin Exp Allergy.1997;27:725–736.
7. Corren J, Busse WW. Connecting hay fever to bronchialasthma. Discover. 1999;20:15–20.
8. Epton MJ, Martin IR, Graham P, et al. Climate and aeroallergenlevels in asthma: a 12 month prospective study. Thorax. 1997;52:528–534.
9. Rosas I, McCartney HA, Payne RW, et al. Analysis of therelationships between environmental factors (aeroallergens, airpollution, and weather) and asthma emergency admissions to ahospital in Mexico City. Allergy. 1998;53:394–401.
10. Dales RE, Cakmak S, Burnett RT, et al. Influence of ambientfungal spores on emergency visits for asthma to a regionalchildren’s hospital. Am J Respir Crit Care Med. 2000;162:2087–2090.
11. Suphioglu C, Singh MB, Taylor P, et al. Mechanism of grass-pollen-induced asthma. Lancet. 1992;339:569–573.
12. Walker SM, Panjo GB, Lima MT, et al. Grass pollen immuno-therapy for seasonal rhinitis and asthma: a randomized, con-trolled trial. J Allergy Clin Immunol. 2001;107:87–93.
13. Newman-Taylor A. Environmental determinants of asthma.Lancet. 1995;345:296–297.
14. Levetin E. Fungi. In: Burge H, editor. Bioaerosols. Boca Raton,FL: CRC Press; 1995:87–120.
15. Horner WE, O’Neil CE, Lehrer SB. Basidiospore aeroallergens.Clin Rev Allergy. 1992;10:191–211.
16. Horner WE, Helbling A, Lehrer SB. Basidiomycete allergens:comparison of three Ganoderma species. Allergy. 1993;48:110–116.
17. Cutten AE, Hasnain SM, Segedin BP, et al. The basidiomyceteGanoderma and asthma: collection, quantitation and immuno-genicity of the spores. NZ Med J. 1988;101:361–363.
18. Levetin E, Van de Water PK. Pollen count forecasting. ImmunolAllergy Clin North Am. 2003;23:423–442.
Table 8. Continued
Significant � values for other symptoms§
DrechsleraSmut
sporesAscospores Ulmus Ambrosia Poaceae
Average
PM2.5
Average
SO2
Maximum
O3
Maximum
PM2.5
Maximum
SO2
�0.54 0.36 �0.69
0.38 0.44 �0.87
0.28 �0.23 �0.48
0.35 �0.24
0.28
�0.30 �0.31
0.25 �0.28
VOLUME 92, MARCH, 2004 365

19. Burch M, Levetin E. Effect of meteorological conditions onspore plumes. Int J Biometeorol. 2002;46:107–117.
20. Holberg CJ, O’Rourke MK, Lebowitz MD. Multivariate anal-ysis of ambient environmental factors and respiratory effects.Int J Epidemiol. 1987;16:399–410.
21. O’Rourke MK, Quackenboss JJ, Lebowitz MD. An epidemio-logical investigating respiratory disease in sensitive individualsto indoor and outdoor pollen exposure in Tucson, AZ. Aerobio-logia. 1989;5:104–110.
22. Lebowitz MD, Quackenboss JJ, Krzyzanowski M, O’RourkeMK, Hayes C. Multipollutant exposures and health responses:epidemiological aspects of particulate matter. Arch EnvironHealth. 1992;47:71–75.
23. Troutt C, Levetin E. Correlation of spring spore concentrationsand meteorological conditions in Tulsa, Oklahoma. Int J Bio-meteorol. 2001;45:64–74.
24. Schappi GF, Taylor PE, Pain MC, et al. Concentrations of majorgrass group 5 allergens in pollen grains and atmosphericparticles: implications for hay fever and allergic asthma suffer-ers sensitized to grass pollen allergens. Clin Exp Allergy. 1999;29:633–641.
25. D’Amato G, Noschese P, Russo M, Gilder J, Liccardi G. Pollenasthma in the deep. J Allergy Clin Immunol. 1999;104:710.
26. Burge H. Some comments on the aerobiology of fungus spores.Grana. 1986;25:143–146.
27. Solomon WR, Mathews KP. Aerobiology and inhalant aller-gens. In: Middleton E, Reed CE, Ellis EF, Adkinson NF, Yung-inger JW. Allergy Principles and Practice. 3rd ed. St. Louis,MO: CV Mosby Co; 1988:312–372.
28. Subiza J. How to interpret pollen counts. Allergol ImmunolClin. 2001;16:59–65.
29. Suh HH, Bahadori T, Vallarino J, Spengler JD. Criteria airpollutants and toxic air pollutants. Environ Health Perspect.2000;108(Suppl):625–633.
Requests for reprints should be addressed to:Estelle Levetin, PhDFaculty of Biological ScienceThe University of Tulsa600 S College AveTulsa, OK 74104E-mail: [email protected]
366 ANNALS OF ALLERGY, ASTHMA, & IMMUNOLOGY