Embed Size (px)
Citation preview
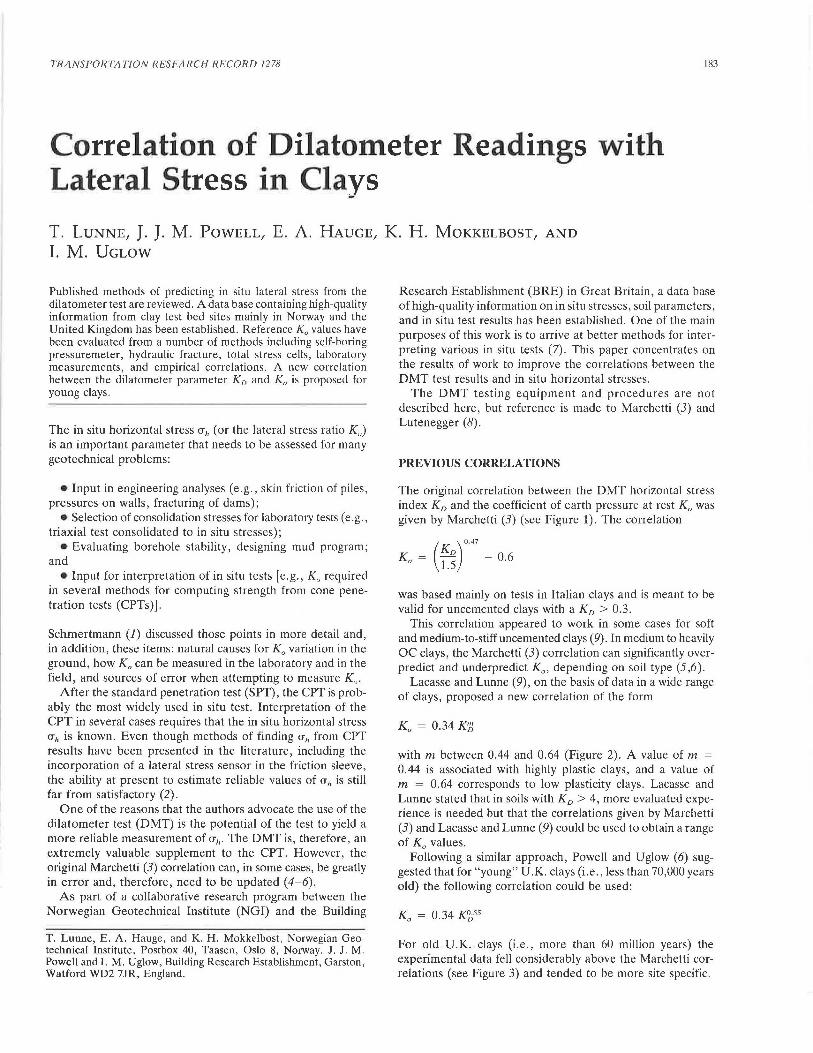
TRANSPORTATION RESEARCH RECORD 1278 183
Correlation of Dilatometer Readings with Lateral Stress in Clays
T. LuNNE, J. J. M. PowELL, E. A. HAUGE, K. H. MoKKELBOST, AND
I. M. UGLOW
Published methods of predicting in situ lateral stress from the dilatometer test are reviewed. A data base containing high-quality information from clay test bed sites mainly in Norway and the United Kingdom has been established. Reference K 0 values have been evaluated from a number of methods including self-boring pressuremeter, hydraulic fracture, total stress cells, laboratory measurements, and empirical correlations. A new correlation between the dilatometer parameter K 0 and K 0 is proposed for young clays.
The in situ horizontal stress uh (or the lateral stress ratio K 0 )
is an important parameter that needs to be assessed for many geotechnical problems:
•Input in engineering analyses (e.g., skin friction of piles, pressures on walls, fracturing of dams);
• Selection of consolidation stresses for laboratory tests (e.g., triaxial test consolidated to in situ stresses);
•Evaluating borehole stability, designing mud program; and
•Input for interpretation of in situ tests [e.g., K 0 required in several methods for computing strength from cone penetration tests (CPTs)].
Schmertmann (1) discussed those points in more detail and, in addition, these items: natural causes for K 0 variation in the ground, how K 0 can be measured in the laboratory and in the field, and sources of error when attempting to measure K
0•
After the standard penetration test (SPT), the CPT is probably the most widely used in situ test. Interpretation of the CPT in several cases requires that the in situ horizontal stress uh is known. Even though methods of finding uh from CPT results have been presented in the literature, including the incorporation of a lateral stress sensor in the friction sleeve, the ability at present to estimate reliable values of uh is still far from satisfactory (2).
One of the reasons that the authors advocate the use of the dilatometer test (DMT) is the potential of the test to yield a more reliable measurement of uh. The DMT is, therefore, an extremely valuable supplement to the CPT. However, the original Marchetti (3) correlation can, in some cases, be greatly in error and, therefore, need to be updated ( 4-6).
As part of a collaborative research program between the Norwegian Geotechnical Institute (NGI) and the Building
T. Lunne, E. A. Hauge, and K. H. Mokkelbost, Norwegian Geotechnical Institute, Postbox 40, Taasen, Oslo 8, Norway. J. J. M. Powell and I. M. Uglow, Building Research Establishment, Garston, Watford WD2 7JR, England.
Research Establishment (BRE) in Great Britain, a data base of high-quality information on in situ stresses, soil parameters, and in situ test results has been established. One of the main purposes of this work is to arrive at better methods for interpreting various in situ tests (7). This paper concentrates on the results of work to improve the correlations between the DMT test results and in situ horizontal stresses.
The DMT testing equipment and procedures are not described here, but reference is made to Marchetti (3) and Lutenegger (8).
PREVIOUS CORRELATIONS
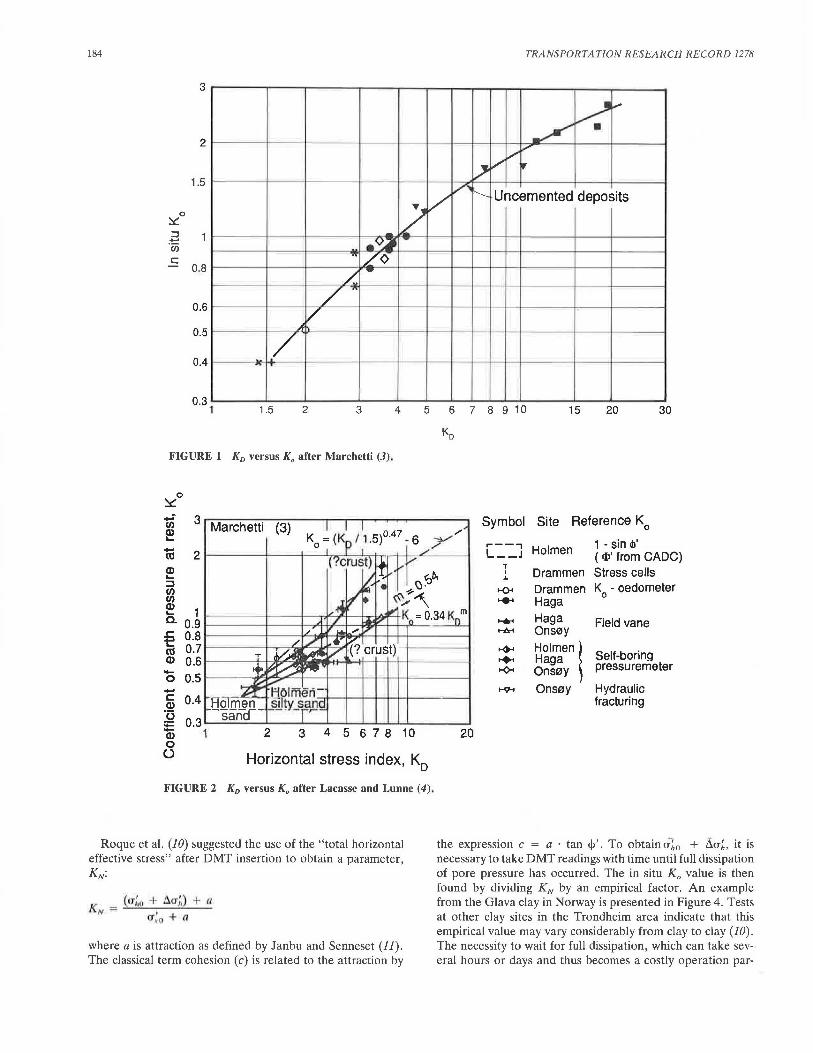
The original correlation between the DMT horizontal stress index KD and the coefficient of earth pressure at rest K 0 was given by Marchetti (3) (see Figure 1). The correlation
( )
0.47
K 0 = ~~ - 0.6
was based mainly on tests in Italian clays and is meant to be valid for uncemented clays with a KD > 0.3.
This correlation appeared to work in some cases for soft and medium-to-stiffuncemented clays (9). In medium to heavily OC clays, the Marchetti (3) correlation can significantly overpredict and underpredict K 0 , depending on soil type (5 ,6).
Lacasse and Lunne (9), on the basis of data in a wide range of clays, proposed a new correlation of the form
K0
= 0.34 K'J)
with m between 0.44 and 0.64 (Figure 2). A value of m 0.44 is associated with highly plastic clays, and a value of m = 0.64 corresponds to low plasticity clays. Lacasse and Lunne stated that in soils with K 0 > 4, more evaluated experience is needed but that the correlations given by Marchetti (3) and Lacasse and Lunne (9) could be used to obtain a range of K
0 values.
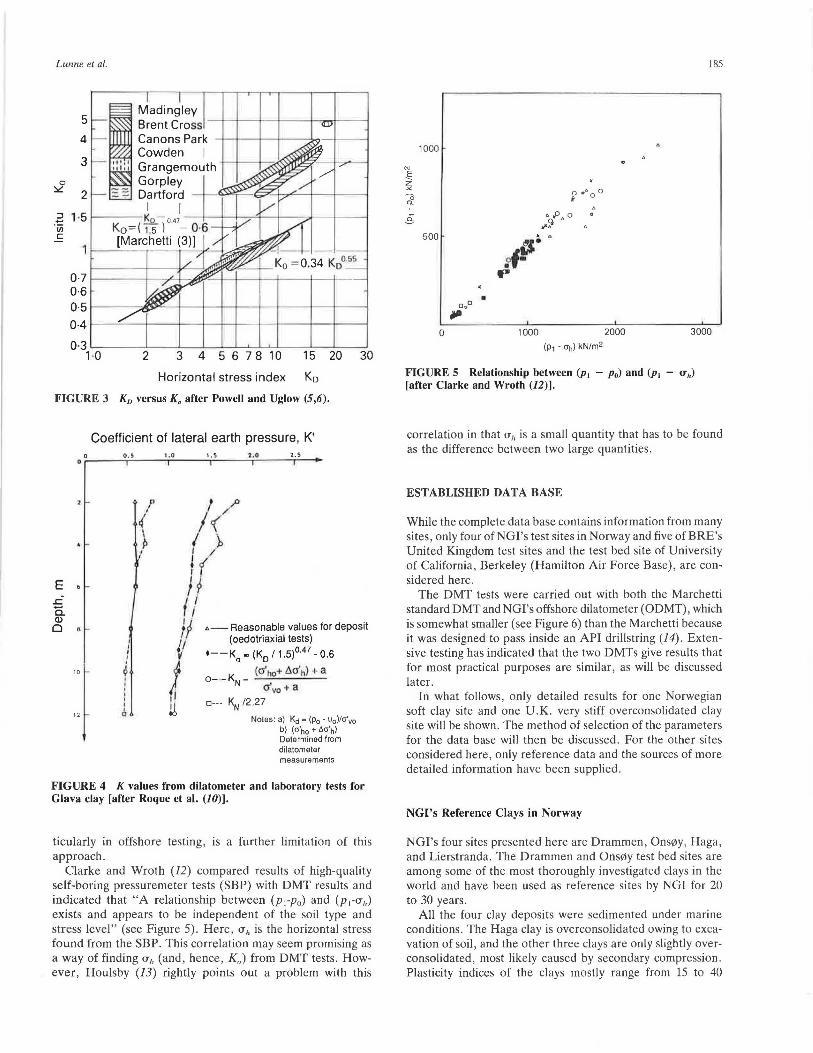
Following a similar approach, Powell and Uglow (6) suggested that for "young" U.K. clays (i.e., less than 70,000 years old) the following correlation could be used:
For old U.K. clays (i.e., more than 60 million years) the experimental data fell considerably above the Marchetti correlations (see Figure 3) and tended to be more site specific.
184 TRANSPORTATION RESEARCH RECORD 1278
3
v. ...-_...,, v
,
/ / "
2
1.5
v ......... ~ "---- Uncemented deposits
/ 0 ::::.::::
-.v~ -:J -"iii
-..- ,,/¢
/ ... c
0.8
/ n
v 0.6
...
/ 0.5
0.4
0.3 1 1.5 2 3 4 5 6 7 8 9 10 15 20 30
FIGURE 1 K 0 versus K 0 after Marchetti (3) ,
'Y.o
..: (/)
~
ta Q) ..... :J (/) (/)
~ 1 a. 0.9 i------t--+-o>t<-+t--t-rl>'l>'I"'-+
Symbol
,---, L __ J
T
' ... t--0< ...... ......
Site Reference K0
Holmen 1 - sin Q>' ( <I>' from CADC)
Drammen Stress cells Drammen K - oedometer Haga
0
Haga Field vane € 0.8 1----t-------+''--1*1f-f7lhff--H~------i as o. 7 i--------1-r--:-7sr-,,...,...--7"I
t--6-< Ons0y
+ Holmen! Q) 0.6 1--------+-Yi~r.~+~++-I----~ Self-boring .... Haga
pressuremeter 0 0.5 t-----,,.~~~t---+-+-+-+-t-+-+------t >-<>< Ons0y
.... ~ 0.4 ·o = Q) 0 (.)
2 3 4567810
Horizontal stress index, K0
FIGURE 2 K0 versus K 0 after Lacasse and Lunne (4).
Roque et al. (10) suggested the use of the "total horizontal effective stress" after DMT insertion to obtain a parameter, KN:
where a is attraction as defined by Janbu and Senneset (11). The classical term cohesion (c) is related to the attraction by
'"9i Ons0y Hydraulic fracturing
20
the expression c = a · tan <!>'. To obtain ci;. 0 + iia~, it is necessary to take DMT readings with time until full dissipation of pore pressure has occurred. The in situ Kn value is then found by dividing KN by an empirical factor. An example from the Glava clay in Norway is presented in Figure 4. Tests at other clay sites in the Trondheim area indicate that this empirical value may vary considerably from clay to clay (10). The necessity to wait for full dissipation, which can take several hours or days and thus becomes a costly operation par-
Lunne el al.
0 ~
Madingley 5 1---~~ Brent Cross -+--+---ir---1----+~....+--~
4 Canons Pa~ Cowden I
3 Grangemouth 1-lt---t-"'"-;'~""u..--.,..
2 Gorpley Dartford
I I .E 1 ·5 t---- Ko - o.•1 ---1---1-t-,-'t---1--~--+----i IJ) Ko=( 1.5) - 0·6 c [Marchetti (3)]
0·7 t--~~-t--,.4-f--11:l?'"--l-+---+--+--l--f----I 0·6 O· 5 f------::~"'------t--+--t--+--+-t---t--t---l
0·4 t--'----t-----t--t---t--t--r---r---;--ir----1
0·3 ~--_... _ ___. _ _.__,_~~~~--'-~'----'
1·0 2 3 4 567810 15 20 30
Horizontal stress index Ko
FIGURE 3 K0 versus K 0 after Powell and Uglow (5,6).
Coefficient of lateral earth pressure, K'
or0 ---·~·~'--,"-0 ---'r·'--~2r'0---2T·'---
E ..c a. Q)
0 4
10
12
I ' ' J
1
l
p
I ~
I
I /J:j
/< ,) l . jf ff {/ I .
ff v ~-Reasonable values for deposit
(oedotriaxial tests)
•--K0
= (K0 / 1.5)0·47 - 0.6
t ~
o- - KN= (G'110+ .o,cr'hl +a a'vo + a
o--- KN /2 .27
Noles: a) Kd a (p0 - Ua)/cr'vo b) (a'ha + 6a'h) Determined from dilatometer measurements
FIGURE 4 K values from dilatometer and laboratory tests for Glava clay [after Roque et al. (JO)].
ticularly in offshore testing, is a further limitation of this approach.
Clarke and Wroth (12) compared results of high-quality self-boring pressuremeter tests (SBP) with DMT results and indicated that "A relationship between (p 1-p0) and (p 1-u1o) exists and appears to be independent of the soil type and stress level" (see Figure 5). Here, uh is the horizontal stress found from the SBP. This correlation may seem promising as a way of finding u" (and, hence, Ko) from DMT tests. However, Houlsby (13) rightly points out a problem with this
185
1000
N
..§ z ""-0 a.
s 500
•
0 1000 2000 3000
FIGURE 5 Relationship between (P1 - p0) and (P1 - <rh) [after Clarke and Wroth (12)].
correlation in that u,, is a small quantity that has to be found as the difference between two large quantities.
ESTABLISHED DATA BASE
While the complete data base contains information from many sites , only four of NG I's test sites in Norway and five of BRE's United Kingdom test sites and the test bed site of University of California, Berkeley (Hamilton Air Force Base), are considered here.
The DMT tests were carried out with both the Marchetti standard DMTand NGI's offshore dilatometer (ODMT), which is somewhat smaller (see Figure 6) than the Marchetti because it was designed to pass inside an API drillstring (14). Extensive testing has indicated that the two DMTs give results that for most practical purposes are similar, as will be discussed later.
In what follows , only detailed results for one Norwegian soft clay site and one U .K. very stiff overconsolidated clay site will be shown. The method of selection of the parameters for the data base will then be discussed. For the other sites considered here, only reference data and the sources of more detailed information have been supplied .
NGI's Reference Clays in Norway
NGI's four sites presented here are Drammen, Ons('Jy, Haga, and Lierstranda. The Drammen and Ons('Jy test bed sites are among some of the most thoroughly investigated clays in the world and have been used as reference sites by NGI for 20 to 30 years.
All the four clay deposits were sedimented under marine conditions. The Haga clay is overconsolidated owing to excavation of soil , and the other three clays are only slightly overconsolidated, most likely caused by secondary compression. Plasticity indices of the clays mostly range from 15 to 40
186
Onshore dilatometer
!!
I I I I I I I I I I I I I \
60
I 94
I 11
Offshore dilatometer
Expandable membrane
Note: Dimensions in mm
"' ... N
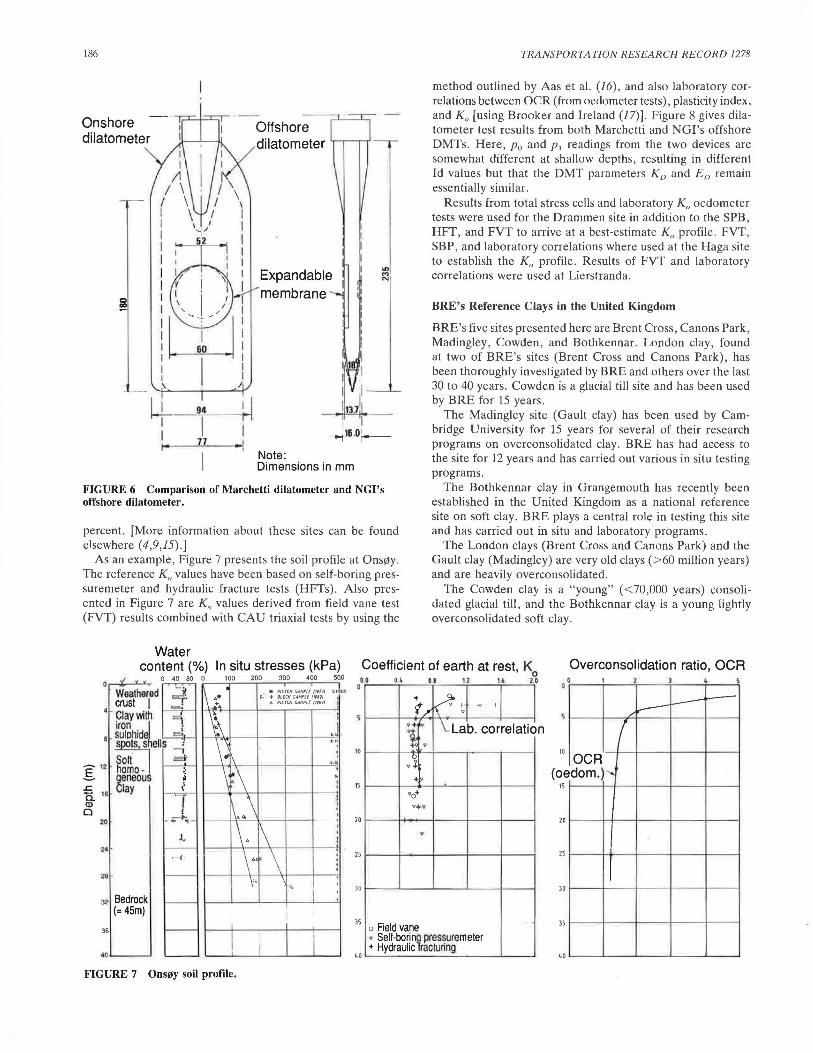
FIGURE 6 Comparison of Marchetti dilatometer and NGl's offshore dilatometer.
percent. (More information about these sites can be found elsewhere ( 4,9,15).]
As an example, Figure 7 presents the soil profile at Ons(Zly . The reference K 0 values have been based on self-boring pressuremeter and hydraulic fracture tests (HFTs). Also presented in Figure 7 are K 0 values derived from field vane test (FVT) results combined with CAU triaxial tests by using the
Water
TRANSPORTATION RESEARCH RECORD 1278
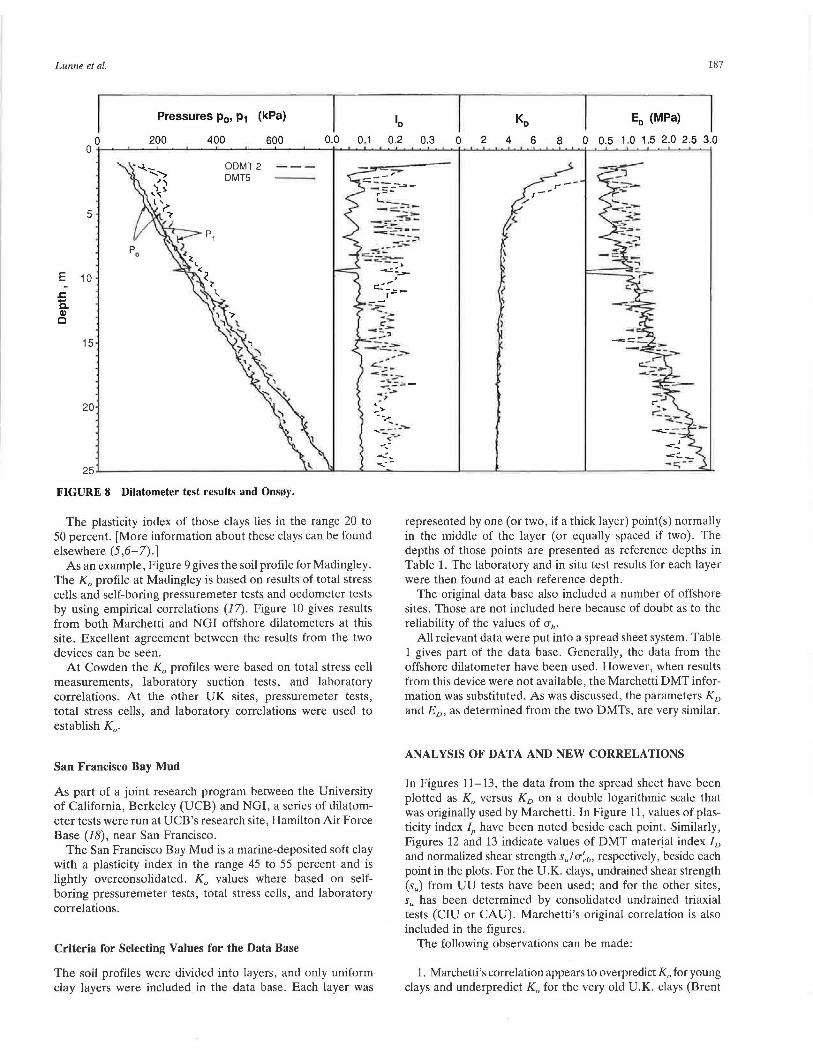
method outlined by Aas et al. (16), and also laboratory correlations between OC:R (from oec1ometer tests), plasticity index, and K0 [using Brooker and Ireland (17)]. Figure 8 gives dilatometer test results from both Marchetti and NGI's offshore DMTs. Here, p0 and p, readings from the two devices are somewhat different at shallow depths, resulting in different Id values but that the DMT parameters K 0 and E 0 remain essentially similar.
Results from total stress cells and laboratory K0
oedometer tests were used for the Drammen site in addition to the SPB, HFT, and FVT to arrive at a best-estimate K 0 profile. FVT, SBP, and laboratory correlations where used at the Haga site to establish the K 0 profile. Results of FVT and laboratory correlations were used at Lierstranda .
BRE's Reference Clays in the United Kingdom
BRE's five sites presented here are Brent Cross, Canons Park, Mac1ingley, Cowden , and Bothkennar. London clay, found at two of BRE's sites (Brent Cross and Canons Park), has been thoroughly investigated by BRE and others over the last 30 to 40 years. Cowden is a glacial till site and has been used by BRE for 15 years.
The Madingley site (Gault clay) has been used by Cambridge University for 15 years for several of their research programs on overconsolidated clay. BRE has had access to the site for 12 years and has carried out various in situ testing programs.
The Bothkennar clay in Grangemouth has recently been established in the United Kingdom as a national reference site on soft clay. BRE plays a central role in testing this site and has carried out in situ and laboratory programs.
The London clays (Brent Cross and Canons Park) and the Gault clay (Madingley) are very old clays (>60 million years) and are heavily overconsolidated.
The Cowden clay is a "young" ( < 70,000 years) consolidated glacial till, and the Bothkennar clay is a young lightly overconsolidated soft clay.
content (%) In situ stresses (kPa) 0 200 300 400 500
Coefficient of earth at rest, K 0
Overconsolidation ratio, OCR
.c:. Ci. ,, Q)
0 20
32 Bedrock (=45m)
36
<OL----'
e PISTON SAHf>lf /ll ?JJ ~111 ! )I Pc + Btofl( SAHPU /IP/Jl/
A PIS rON SAHPI ( mm
l---'~.A.·1----1~----1---1~-:·~ I
' ' \ l-----Jl--.\-11------Jl-----l--1
I
I
FIGURE 7 Onsjjy soil profile.
o.o 0 4 0 ! 1.2 t6 2 0 0
+ f(v ~~ 1...--
/~ i---
:r. \.Lab. correlatio n ! 0
. + .. ~
10
OCR dom.)' •
10
(oe 15 15
•o+
•+• 20 20 . 25 21
JO JO -~ --JS
o Field vane JS
• Self-borin~ pressuremeter + Hydraulic racluring
40 40
Lunne et al. 187
Pressures p0 , P1 (kPa) 10
K0
E0 (MPa)
0 200 400 600 0.0 0.1 0.2 0.3 0 2 4 6 8 0 0.5 1.0 1.5 2.0 2.5 3.0 0 -t-~~~~~~~~~~~~~~~~--+ ........ .__ ........ ...._._._ ............... __. ........ .f-o-......_. .............................................................. -i-~ .......... _,_~.._L......L~...L_ ..........
5
E 10 .r:. a. Q)
c
15
20
ODMT2 DMTS
..... _
.... --25......_~~~~~~~~~~~~~--''-'---->il'----'~__,,~~~~---'~~-"-~~~~~---'~~~~~~-'---' ......
FIGURE 8 Dilatometer test results and Onsi;y.
The plasticity index of those clays lies in the range 20 to 50 percent. (More information about these clays can be found elsewhere (5,6-7).]
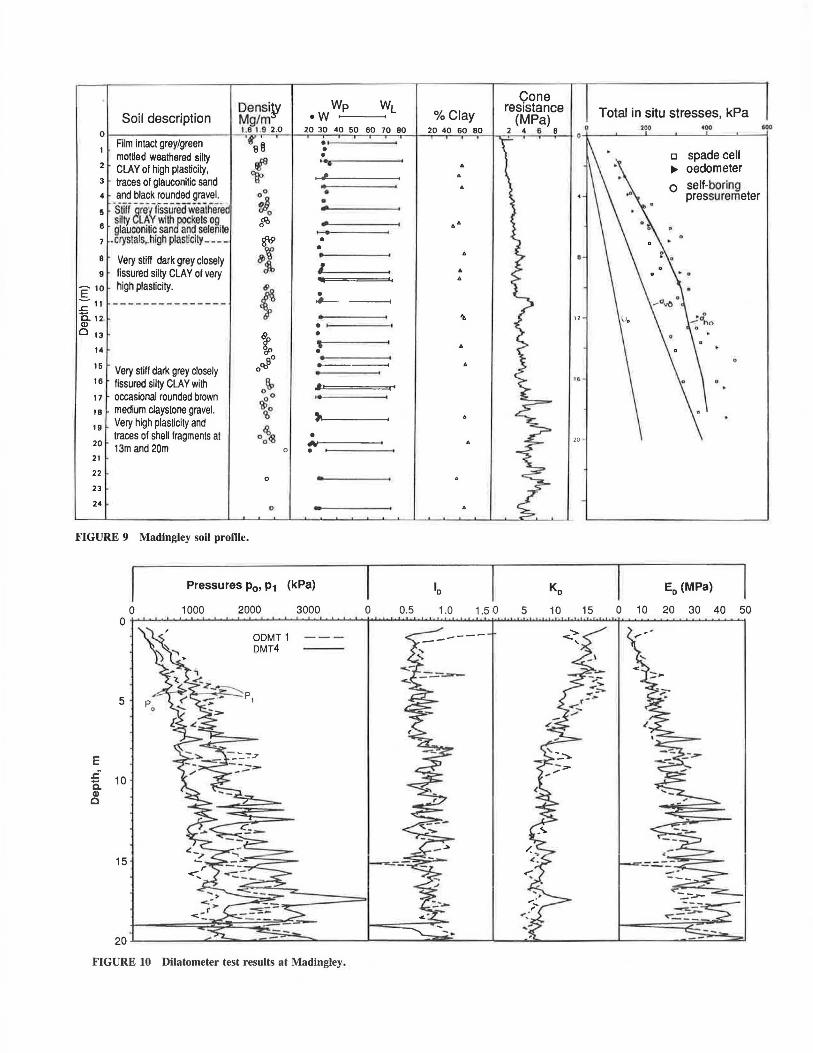
As an example, Figure 9 gives the soil profile for Madingley. The K
0 profile at Madingley is based on results of total stress
cells and self-boring pressuremeter tests and oedometer tests by using empirical correlations (17). Figure 10 gives results from both Marchetti and NGI offshore dilatometers at this site. Excellent agreement between the results from the two devices can be seen.
At Cowden the K 0 profiles were based on total stress cell measurements, laboratory suction tests, and laboratory correlations. At the other UK sites, pressuremeter tests, total stress cells, and laboratory correlations were used to establish K 0 •
San Francisco Bay Mud
As part of a joint research program between the University of California, Berkeley (UCB) and NGI, a series of dilatometer tests were run at UCB's research site, Hamilton Air Force Base (18), near San Francisco.
The San Francisco Bay Mud is a marine-deposited soft clay with a plasticity index in the range 45 to 55 percent and is lightly overconsolidated. K 0 values where based on selfboring pressuremeter tests, total stress cells, and laboratory correlations.
Criteria for Selecting Values for the Data Base
The soil profiles were divided into layers, and only uniform clay layers were included in the data base. Each layer was
represented by one (or two, if a thick layer) point(s) normally in the middle of the layer (or equally spaced if two). The depths of those points are presented as reference depths in Table 1. The laboratory and in situ test results for each layer were then found at each reference depth.
The original data base also included a number of offshore sites. Those are not included here because of doubt as to the reliability of the values of u".
All relevant data were put into a spread sheet system. Table 1 gives part of the data base. Generally, the data from the offshore dilatometer have been used. However, when results from this device were not available, the Marchetti DMT information was substituted. As was discussed, the parameters K 0
and E0 , as determined from the two DMTs, are very similar.
ANALYSIS OF DATA AND NEW CORRELATIONS
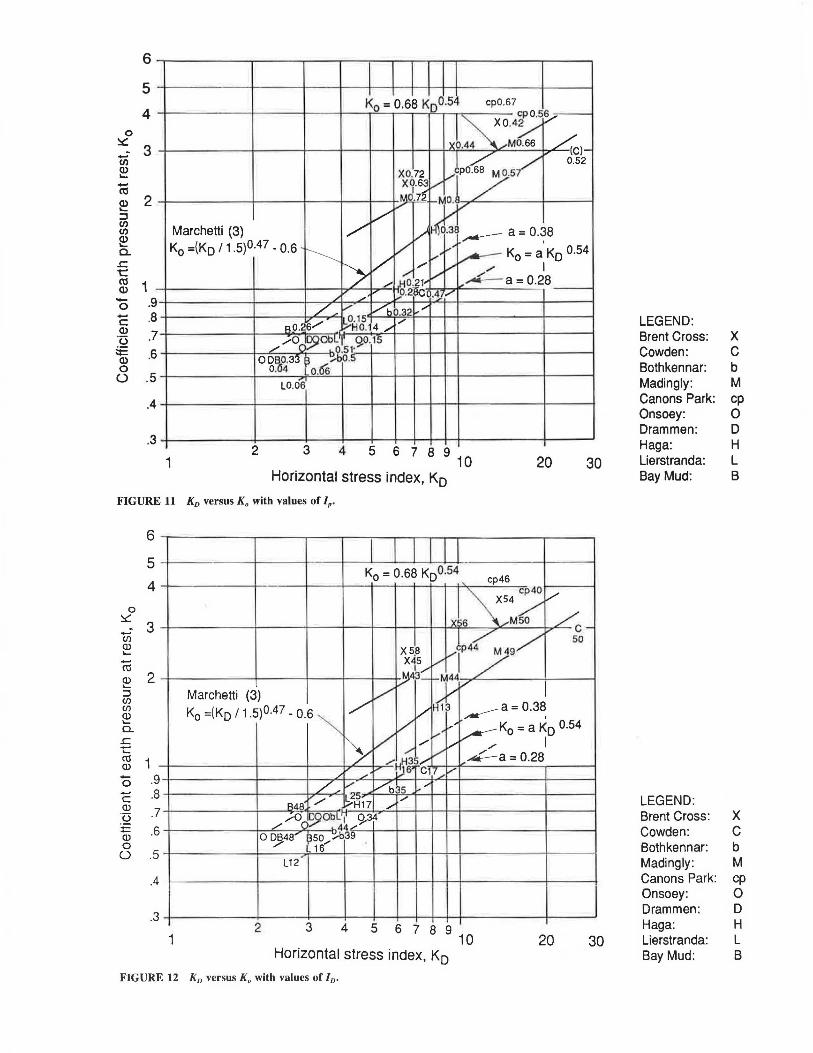
In Figures 11-13, the data from the spread sheet have been plotted as K
0 versus K 0 on a double logarithmic scale that
was originally used by Marchetti. In Figure 11, values of plasticity index IP have been noted beside each point. Similarly, Figures 12 and 13 indicate values of DMT materjal index I 0
and normalized shear strength s) u~0 , respectively, beside each point in the plots. For the U.K. clays, undrained shear strength (sJ from UU tests have been used; and for the other sites, su has been determined by consolidated undrained triaxial tests (CIU or CAU). Marchetti's original correlation is also included in the figures.
The following observations can be made:
1. Marchetti's correlation appears to overpredict K 0 for young clays and underpredict K 0 for the very old U.K. clays (Brent
Wp WL Densi~ Soil description Mg/m •W
1.8 1.9 2.0 20 30 40 50 60 70 80 0 Film intact grey/green • 08 • mottled weathered silty •
2 CLAY of high plasticity, ' 3 traces of glauconitic sand 4 and black rounded gravel. 00 • s -stttf 8r~~1iSsvreif weaWered ~ •
0
6 silty LA with J:kets og ~ glauconlttc san and selenite
.crystals. high plasticity- - - - gl9 • tp'f: •
8 Very stiff dark grey closely 9 fissured silty CLAY of very ~ l
E'10 high plasticity.
~ • :;:; 11 --------------- ~-
i5.. 12 O' Q) • 0 13 t •
14 • 'Cf'
15 80 ..--Very stiff dark grey closely OQj
16 fissured silty CLAY with 0%> I 7 occasional rounded brown 00
18 medium claystone gravel. \o ~
19 Very high plasticity and o~ traces of shell fragments at •
20 13m and 20m #It/ 0 •
21
22 0
23
24 0
FIGURE 9 Madingley soil profile.
Pressures p0 , p1 (kPa)
0 1000 2000 3000 0
ODMT1
E £ a QI
0
DMT4 ---
FIGURE IO Dilatometer test results at Madingley .
0 0.5
Cone
%Clay resistance Total in situ stresses, kPa (MPa)
20 40 60 80 2 4 6 B 200 <00 600
D spade cell 6 ... oedometer
0 self-boring pressuremeter
66
6
6
'I> " 6
••
20 .
lo Ko E0
(MPa)
1.0 1.5 :O 5 10 15 0 10 20 30 40 50
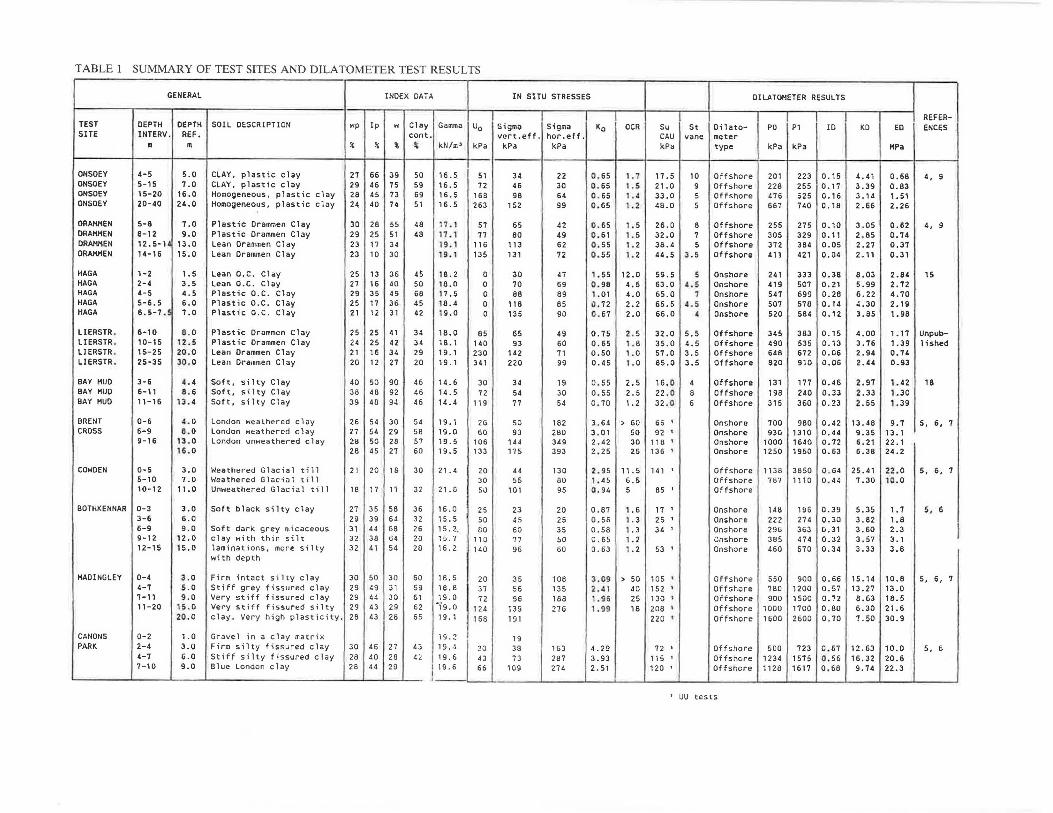
TABLE 1 SUMMARY OF TEST SITES AND DILATOMETER TEST RESULTS
GENERAL INDEX DATA IN SITU STRESSES DILATDHETER RESULTS
REFER-TEST DEPTH DEPTH SOIL DESCRIPTION >ip Ip w Clay Gamma Uo Si gm~ Sigma Ko OCR Su St Dilato- PO Pl ID KO ED ENC ES SITE INTERV . REF. cont. vcrt.eff . hor.eff. CAU vane meter ., m % % % .. kN/111> kPa kPa kPa kPa type kPa kPa MP a .. ONSOEY 4-5 5.0 CLAY, plastic clay 27 66 39 50 16.5 51 34 22 0. 65 1. 7 17.5 10 Offshore 201 223 0 .1 5 4.41 0.68 4, 9 ONSOEY 5-15 7 . 0 CLAY, plastic clay 29 46 75 59 16.5 7Z 46 30 0 . 65 1.5 21.0 9 Offshore 228 255 0.17 3 . 39 0.83 ONSOEY 15-20 16.0 Homogeneous, plastic clay 28 45 73 69 16. 5 168 98 64 0.65 1. 4 33 .o 5 Offshore 476 525 0.16 3 . 14 1.51 ONSOEY 20-40 24.0 Homogeneous, plastic clay 2·4 40 74 51 16.5 263 152 99 0.65 1. 2 40.0 5 Offshore 667 740 0 .18 2.66 2.26
DRAMMEN 5-8 7.0 Plastic Dram~en Clay 30 28 55 48 17.1 57 65 42 0.65 1. 5 26.0 8 Off shore 255 275 0.10 3 . 05 0.62 4, 9 DRAMMEN 8-12 9.0 Plastic Dr<>mmen Clay 29 25 51 48 17 .1 77 80 49 0.61 1.5 32.0 7 Offshore 305 329 0.11 2 . 85 0.74 DRAH/olEN , 2. 5-1 ~ 13.0 Lean Drcmmen Clay 23 17 34 19.1 116 113 62 0 . 55 1.2 38.4 5 Offshore 372 384 0.05 2 .27 0.37 DRAMMEN 14-16 15.0 lean Drammen Clay 23 10 30 19.1 135 131 72 0.55 1. 2 44.5 3.5 Offshore 411 421 0. 04 2. ,, 0.31
HAGA 1-2 1. 5 Lean O.C. Clay 25 13 36 45 18.2 0 ,30 47 1. 55 12.0 59.5 s Onshore 241 333 0.38 8.03 2.84 15 HAGA 2-4 3.5 lean O.C. Clay 27 16 40 50 18,0 0 70 69 0.98 4.5 63.0 4.5 On5hore 419 507 o. 21 5.99 2.72 HAGA 4-5 4 . 5 Plastic O. C. Clay 29 35 49 66 17 . 5 0 88 89 t .01 4 . 0 65.0 7 Onshore 547 699 0.28 6 . 22 4 . 70 HAGA 5-6.5 6.0 Plastic O.C. Clay 25 17 36 45 18. 4 0 118 8S 0 .72 2. 2 65.5 4.5 Onshore 507 570 0. 14 4.30 2.19 HAGA 6.5-7.! 7.0 Plastic O.C. Clay 21 12 j1 42 19.0 0 135 90 0.67 2.0 66.0 4 Onshore 520 564 0.12 3.8S 1.96
LIERSTR. 6-10 8.0 Plastic Drammen Clay 2S 25 41 34 16.0 85 65 49 0.15 2.S 32.0 5.S Offshore 345 383 0. lS 4.00 1.11 Unpub-LIERSTR . 10-15 12.5 Plastic Drammen Clay 24 25 42 34 18.1 140 93 60 0.65 1.8 35.0 4.S Offshore 490 53S 0.13 3. 76 1.39 lished LIERSTR . 15-25 20 . 0 Lean Drammen Clay 21 16 34 29 19.1 230 142 71 0.50 1.0 51.0 3.5 Offshore 648 672 0.06 2.94 0. 14 llERSTR . 25-35 J0.0 Lear1 Dra1nmen Clay 20 12 27 20 19 .1 341 220 99 0.4S 1.0 85.0 3.5 Offshore 820 910 0.06 2 . 44 0_93
BAY HUD 3-6 4 .4 Soft, silty Clay 40 so 90 46 14.6 30 34 19 D.55 2.S 16. 0 4 Offshore 131 177 0.46 2.97 1. 42 18 BAY tlUD 6-11 8 . 6 Soft, silty Clay 38 48 92 46 14.5 72 54 30 0 . 55 2.S 22.0 8 Offshore 198 240 0.33 2.33 1.30 BAY HUD 11-16 13.4 Soft, silty Clay 39 40 94 46 14.4 119 11 54 0.70 1.2 32.0 6 Offshore 315 360 0 .23 2.5S t.39
BRENT 0-6 4 . 0 LoncJon wca\hered clay 26 54 30 54 19 .1 2G so 182 3 .G4 > 60 66 1 Onshore 700 960 0.42 13.46 9. 7 5, 6, 1 CROSS 6-9 8. 0 London weathered clay 27 54 29 58 19.0 60 93 280 3.01 50 92 ' Onshore 930 1310 0.44 9.35 13.1
9-16 13.0 London unweathered clay 28 50 28 57 19.5 106 144 349 2.42 30 116 1 Onshore 1000 1640 0.72 6. 21 22.1 16.0 26 4S 27 60 19.5 133 115 393 2.25 25 136 1 Onshore 1250 1950 0.63 6 . 38 24.2
COWDEN 0-5 3.0 Weathered Glacial till 21 20 18 30 21. 4 20 44 130 2 . 95 11. 5 141 ' Off shore 1138 36SO 0.64 25.41 22.0 5, 6, 7 5-10 1.0 Weathered Glaci~l till 30 5S 60 1. 45 6.5 Offshore 781 1110 0.44 7.30 10 .0 10-12 11.0 Unweathered Glacial till 16 17 17 32 21.6 50 101 95 o. 94 5 BS ' Offshore
BOTtlKENNAR 0-3 3 . 0 Soft black silty clay 27 3S 58 36 16 . 0 25 23 20 0.87 t. 6 17 1 Onshore 148 196 0.39 S. 35 1. 7 5 , 6 3-6 6.0 29 39 64 32 1S.S so 4S 25 0.56 1. 3 2S 1 Onshore 222 274 0 .30 3.62 1.8 6-9 9.0 Soft dark grey ruicaceous 31 44 68 26 15. 2. 80 60 3S 0.58 1. 3 34 ' Onshore 296 363 0.31 3.60 2.3 I 9-12 12.0 clay with thin silt 32 38 64 20 15. 7 110 77 50 0.65 1. 2 Onshore 38S 474 0.32 3 . S7 3.1 12-15 ts.a laminations, mar~ silty 32 41 S4 20 16.2 140 96 60 0.63 \. 2 53 , Onshore 460 570 0.34 3.33 3.8
with depth
HADINGLEY 0-4 3.0 Firm intact silty clay 30 50 30 60 18.5 20 35 108 3.09 > 50 105 • Offshore 5SO 900 0. 66 15.14 10.8 5, 6, 7 4-7 s.o Stiff grey fissured clay 29 49 31 59 16.6 37 56 135 2.41 40 152 1 Offshore 780 1200 0.57 13.27 13.0 7-11 9.0 Very stiff fissured clay 29 44 30 61 19.0 72 96 188 1.96 2S 130 1 Offshore 900 1500 0.72 6.63 16. 5 11-20 lS.O Very stiff fissured silty 29 43 29 62 l9.0 124 139 276 l.99 18 208 , Off shore 1000 1100 0.80 6 . 30 21.6
20.0 clay. Very high plasticity. 28 43 28 65 19.1 168 191 220 I Offshore 1600 2600 0.70 7 . 50 30.9
CANONS 0-2 1.0 Gravel in a clay matrix 19. 2 19 PARK 2-4 3.0 Firm silty fissured clay 30 46 27 43 19 .. \ 20 38 163 4 .2 9 72 1 Off shore 500 723 0.67 12. 63 10.0 5, 6
4-7 6.0 Stiff silty fissured clay 28 40 28 4; 19.6 43 73 287 3 . 93 115 1 Offshore 1234 1575 O.S6 16.32 20.6 7-10 9.0 Blue London clay 28 44 29 19.6 65 109 274 2.51 120 ' Offshore 1126 1617 0 . 66 9. 74 22.3
. " 1 LIU tests
1 .9 .8
.7
.6
.5
.4
.3 2
1 3 4 5 6 7 8 9 10
Horizontal stress index, Ko
FIGURE 11 KD versus K0 with values of Ir
0
6
5
4 K0 = 0.68 K00.54
20 30
cp46
X54/
~ 3 iii Q)
1 .~ cp40 /
X56 ...-M50 / I ,/ ..... io -
V cp44 M49/ ..... -ru ~ 2 ::J Cf) Cf)
~ c.. .c t
m 1 -0 --c Q)
·u E Q)
0 0
. 9
.8
.7
.6
.5
.4
.3
1
xsa x1s ::J// f)43~ Marchetti (3) v X I
/ Ko =(Ko I 1.5)0.47 - 0.6 ~ vv H13 ..------ a= 0.3~
l .. ...-/ ,.,--Ko= a Ko 0.54 v / IY ,..,,.. ,,,, I / v -~a=0.28
"'&r.~ /
v ...- 6 C1 7 _,,,, ..... /_ V" vhis /
R48 ,,,,,- L25 /
;;-H17 /
,,,,ocS90bL 1 <)..34 / L44--
0 0848" \350 :;..b39 / L 16,...
2
,, L12
3 4 56789 10
Horizontal stress index, Ko 20
FIGURE 12 KD versus K0 with values of ID.
30
LEGEND: Brent Cross: X Cowden: C Bothkennar: b Madingly: M Canons Park: cp Onsoey: 0 Drammen: D Haga: H Lierstranda: L Bay Mud: B
LEGEND: Brent Cross: Cowden: Bothkennar: Madingly: Canons Park: Onsoey: Drammen: Haga: Lierstranda: Bay Mud:
x c b M cp 0 D H L B
Lunne et al.
0 ~
Ci) Q) ..... -C'Cl
~ ::J (f) (f)
~ 0. .c t:: C'Cl Q) -0 -c
1
191
.9
.8
.7
-+--------+----+r....._,/,,..-~v Vn0.61 ... ,.... v..,, L04" .,-B0.42Ll.34 ;;:o-H / LEGEND:
Q) ·c::; E Q) 0 0
.6 /0 IDOObl ' 9.o.s2
/ 07 0.38'=-+---lf---+---t--+---+------ -+------t 0 DB0.34 fil0 .47:;.b0.56
....... o.4
Brent Cross: x Cowden: c Bothkennar: b .5 Madingly: M
.4 Canons Park: cp Onsoey: 0
.3 Drammen: D
1 2 3 4 56789
10 20 Haga: H
30 Lierstranda: L Horizontal stress index, Ko Bay Mud: B
FIGURE 13 K0 versus K0 with values of s,,/ u~0 •
Cross, Madingley, and Canons Park). This confirms the finding of Powell and Uglow (6).
2. Young clays fall within a relatively narrow band, which can be expressed as
where a on the average is 0.34, but it varies between 0.38 and 0.28.
3. Referring to Figures 11 and 12 and the band for the "young" clays, there does not appear to be any systematic trend with JP or 10 , and neither is it possible to differentiate between the "old" and the "young" clays on the basis of those two parameters.
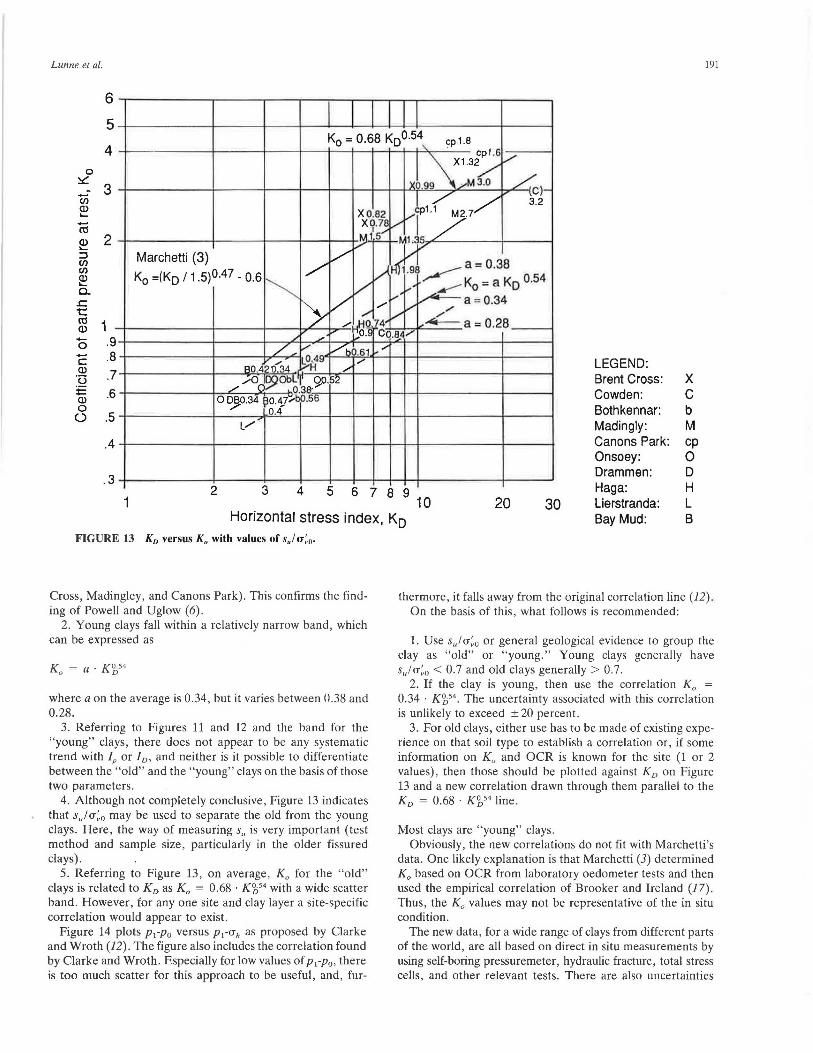
4. Although not completely conclusive, Figure 13 indicates that s) u~0 may be used to separate the old from the young clays. Here, the way of measuring s,, is very important (test method and sample size, particularly in the older fissured clays).
5. Referring to Figure 13, on average, K0 for the "old" clays is related to K 0 as K 0 = 0.68 · K'fj54 with a wide scatter band. However, for any one site and clay layer a site-specific correlation would appear to exist.
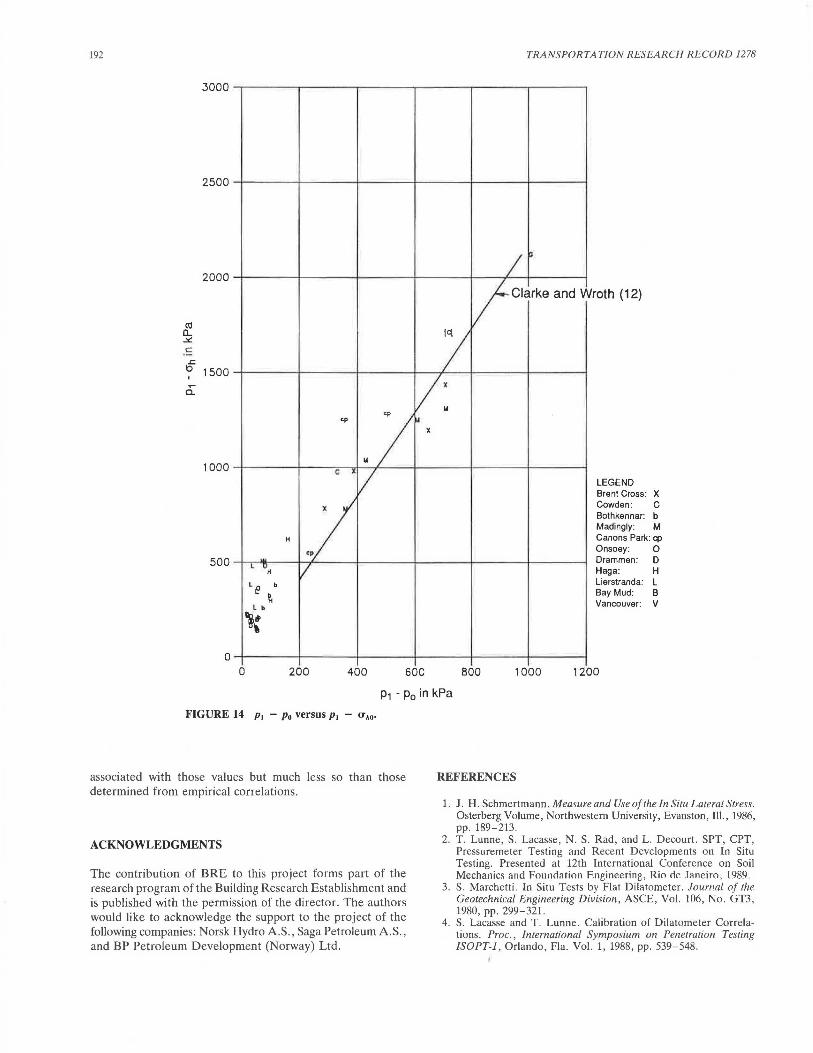
Figure 14 plots p 1-p0 versus pea" as proposed by Clarke and Wroth (12) . The figure also includes the correlation found by Clarke and Wroth. Especially for low values ofp 1-p0 , there is too much scatter for this approach to be useful, and, fur-
thermore, it falls away from the original correlation line (12). On the basis of this, what follows is recommended :
1. Use s.J a~0 or general geological evidence to group the clay as "old" or "young." Young clays generally have s.Ja~0 < 0.7 and old clays generally > 0.7.
2. If the clay is young, then use the correlation K0 = 0.34 · Kcj/4
• The uncertainty associated with this correlation is unlikely to exceed ± 20 percent.
3. For old clays, either use has to be made of existing experience on that soil type to establish a correlation or, if some information on K 0 and OCR is known for the site (1 or 2 values), then those should be plotted against K 0 on Figure 13 and a new correlation drawn through them parallel to the K 0 = 0.68 · K'fj54 line.
Most clays are "young" clays. Obviously, the new correlations do not fit with Marchetti 's
data. One likely explanation is that Marchetti (3) determined K 0 based on OCR from laboratory oedometer tests and then used the empirical correlation of Brooker and Ireland (17). Thus, the K 0 values may not be representative of the in situ condition.
The new data, for a wide range of clays from different parts of the world, are all based on direct in situ measurements by using self-boring pressuremeter, hydraulic fracture, total stress cells, and other relevant tests. There are also uncertainties
192
3000
2500
2000
C1l a.. ~
c: .s:::
I:? 1500
a:
1000
H
~
L QH 500
L e b
~ l b
"!it '
0
I /:
cp
I ~
x
~
c •
I
~I v
TRANSPORTATION RESEARCH RECORD 1278
/ ~
rClarkeand Wroth (12)
LEGEND Brent Cross: X Cowden: C Bothkennar: b Madingly: M Canons Parle q> Onsoey: 0 Drammen: D Haga: H Lierstranda: L Bay Mud: B Vancouver: V
0 200 400 60C BOO 1000 1200
P1 - Po in kPa
FIGURE 14 p, - Po versus p, - 17ho·
associated with those values but much less so than those determined from empirical correlations.
ACKNOWLEDGMENTS
The contribution of BRE to this project forms part of the research program of the Building Research Establishment and is published with the permission of the director. The authors would like to acknowledge the support to the project of the following companies: Norsk Hydro A.S., Saga Petroleum AS. , and BP Petroleum Development (Norway) Ltd.
REFERENCES
1. J. H. Schmertmann. Measure and Use of the In Situ La/era! Stress. Osterberg Volume, Northwestern University, Evanston, Ill., 1986, pp. 189-213.
2. T. Lunne, S. Lacasse, N. S. Rad, and L. Decourt . SPT, CPT, Pressuremeter Testing and Recent Developments on In Situ Testing. Presented at 12th International Conference on Soil Mechanics and Fonncfation F.ngineering, Rio rle faneiro , 1989.
3. S. Marchetti. In Situ Tests by Flat Dilatometer. Journal of the Geotechnical Engineering Division, ASCE, Vol. 106, No. GT3, 1980, pp. 299-321.
4. S. Lacasse and T. Lunne. Calibration of Dilatometer Correlations. Proc., International Symposium on Penetration Testing ISOPT-1, Orlando, Fla. Vol. 1, 1988, pp. 539-548.
Lunne et al.
5. J. J. M. Powell and I. M. Uglow. Marchetti Dilatometer Testing in UK Soils. Proc., International Symposium on Penetration Testing ISOPT-1, Orlando, Fla., Vol. 1, 1988, pp. 555-562.
6. J . J. M. Powell and I. M. Uglow. The Interpretation of the Marchetti Dilatometer Test and UK Clays. Proc., Conference on Penetration Te.sting in the UK, Birmingham, 1988, pp. 269-273.
7. J. J. M. Powell. R. S. T. Quarlcrnrnn, and T. Lunne. Interpretation and use of Piezocones in UK Clays. Proc. , Conference on Penetration Testing in the UK, Birmingham , 1988, pp. 151-156.
8. A. J. Lutenegger. Current Status of the Marchetti Dilatometer Test. Proc., International Symposium on Penetration Testing JSOPT-1, Orlando , Fla ., Vol. 1, 1988, pp . 137-156.
9. S. Lacasse and T. Lunne . Dilatometer Tests in Two Soft Marine Clays. Presented at Conference on Updating Subsurface Sampling of Soils and Rocks and Their In Situ Testing, Santa Barbara, Calif., Jan . 1982.
10. R . Roque, N. Janbu , and K. Senneset. Basic Interpretation Procedures of Flat Dilatometer Tcsls. Proc. , lnternatio11al Symposium on Penetration Testing ISOPT-1 , Orlando, Fla ., Vol. 1, 1988, pp. 577- 588.
11. N. Janbu and K. Senneset. Effective Stress Interpretation of In Situ Static Penetration Tests. Proc. , European Symposium on Penetration Testing ESOPT 1, Stockholm, Vol. 2.2, 1974, pp. 181-193.
12. B. Clarke and P. Wroth . Comparison Between Results From Flat Dilatometer and Self-Boring Pressuremeter Test. Proc., Confer-
193
ence on Penetration Testing in the UK. Birmingham , 1988, pp. 295-298.
13 . G. Houlsby . Discussion of Paper 41. Proc., Conference on Penetration Testing in !he UK, Birmingham, 1988, p. 319.
14. T. Lunne, R. Jonsrud, T. Eidsmoen, and S. Lacasse . The Offshore Dilatometer. Presented at 6th International Symposium on Offshore Engineering: Brasil Offshore '87 , Rio de Janeiro, Aug. 1987.
15. K. Karlsrud and T. Haugen . Axial Static Capacily of Steel Model Piles in Overconsolidated Clay. Proc., ICSMFE 11. San Francisco, Calif., Vol. 3, 1985, pp. 1401-1406.
16. G. Aas, S. Lacasse , T. Lunne, and K. H0eg. Use of In Situ Tests for Foundation Design on Clay. Proc. , ASCE Special Conference, In Situ '86: Use of In Situ Tests in Geotechnical Engineering, Blacksburg, Va., 1986, pp. 1-30.
17. E. W. Brooker and H. 0. Ireland. Earth Pressure at Rest Related to Stress History. Canadian Geotechnica/ Journal, Vol. 2, No. 1, 1965, pp. 1-15.
18. T. Masood, J. K. Mitchell, T. Lunne , and E. A. Hauge. In Situ Testing at Hamilton Air Force Base and Bay Farm Island, California. Department of Civil Engineering, University of California, Berkeley, 1988.
Publication of this paper sponsored by Commitlee on Soil and Rock Properties.