Embed Size (px)
Citation preview
Journal of Dairy Research (2001) 68 251–265. Printed in the United Kingdom 251
Correlation of base consumption with the degree of hydrolysis in
enzymic protein hydrolysis
B FERNANDO CAMACHO*, PEDRO GONZA! LEZ-TELLO,MARI! A-PURIFICACIO! N PA! EZ-DUEN4 AS, EMILIA-MARI! A GUADIX
ANTONIO GUADIX
Departamento de IngenierıUa QuıUmica, Universidad de Granada, Granada 18071,Spain
(Received 4 May 2000 and accepted for publication 31 January 2001)
S. It is fairly easy to control the enzymic hydrolysis of proteins in alkalineconditions by measuring the base consumption required to keep the pH constant inthe reactor. Unfortunately, however, base consumption is not related in any simpleway to the degree of hydrolysis reached at any given moment and to establish thisrelationship it is essential to find out the mean pK of the α-amino groups releasedduring the hydrolytic process. We have shown here that the correct mean pK valuevaries according to the pH of the working conditions and that the relationshipbetween these values may depend upon the kind of protein and protease used. Wehave put forward a method for determining this relationship experimentally by usinga given protein–protease system, consisting of an alkaline titration of the raw proteinand when partially hydrolysed. We have tested the results predicted by ourtheoretical model by applying it to the hydrolysis of whey proteins with a bacterialprotease from Bacillus licheniformis at 50 °C, pH 8±0. This model can easily beapplied to any hydrolytic process involving the appearance of functional groups thatare partially protonizable under the working conditions in question in order to followthe kinetics of the reaction via the consumption of the neutralizing agent required tokeep pH constant.
K : Protein hydrolysis, proteases, pK, degree of hydrolysis, milk protein.
Protein hydrolysates are widely used as food flavours and protein complementsin energy-giving drinks, and also, quite importantly, in the preparation of enteraldiets for children and sick adults. For these latter purposes the hydrolysates aregenerally derived from milk proteins (Chiang et al. 1982; Nakamura et al. 1993). Therequirements demanded in the formulation of these hydrolysates, i.e. that theyshould not have a bitter taste, should be hypoallergenic, should be low in free aminoacids and have a very controlled peptide size (Ney, 1979; Grimble et al. 1986; Otaniet al. 1990), all demand that the reaction process be carefully monitored. To this end,the application of the pH-stat technique allows us to control the hydrolytic processfairly easily (Jacobsen et al. 1957). Nevertheless, the consumption of the agent usedto maintain pH constant is not related in any simple way to the degree of hydrolysis
* For correspondence: fcamacho!ugr.es
252 F. C
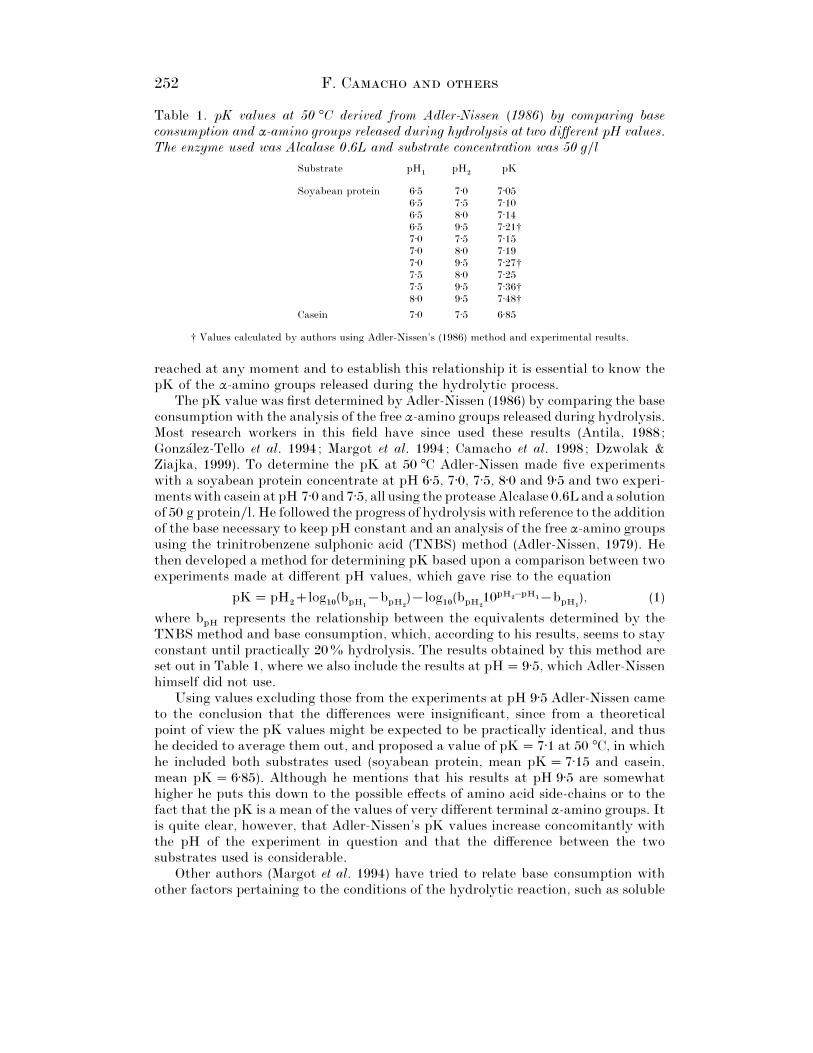
Table 1. pK values at 50 °C derived from Adler-Nissen (1986) by comparing baseconsumption and α-amino groups released during hydrolysis at two different pH values.The enzyme used was Alcalase 0.6L and substrate concentration was 50 g}l
Substrate pH"
pH#
pK
Soyabean protein 6±5 7±0 7±056±5 7±5 7±106±5 8±0 7±146±5 9±5 7±21†7±0 7±5 7±157±0 8±0 7±197±0 9±5 7±27†7±5 8±0 7±257±5 9±5 7±36†8±0 9±5 7±48†
Casein 7±0 7±5 6±85
† Values calculated by authors using Adler-Nissen’s (1986) method and experimental results.
reached at any moment and to establish this relationship it is essential to know thepK of the α-amino groups released during the hydrolytic process.
The pK value was first determined by Adler-Nissen (1986) by comparing the baseconsumption with the analysis of the free α-amino groups released during hydrolysis.Most research workers in this field have since used these results (Antila, 1988;Gonza! lez-Tello et al. 1994; Margot et al. 1994; Camacho et al. 1998; Dzwolak &Ziajka, 1999). To determine the pK at 50 °C Adler-Nissen made five experimentswith a soyabean protein concentrate at pH 6±5, 7±0, 7±5, 8±0 and 9±5 and two experi-ments with casein at pH 7±0 and 7±5, all using the protease Alcalase 0.6L and a solutionof 50 g protein}l. He followed the progress of hydrolysis with reference to the additionof the base necessary to keep pH constant and an analysis of the free α-amino groupsusing the trinitrobenzene sulphonic acid (TNBS) method (Adler-Nissen, 1979). Hethen developed a method for determining pK based upon a comparison between twoexperiments made at different pH values, which gave rise to the equation
pK¯pH#log
"!(b
pH"
®bpH#
)®log"!
(bpH#
10pH#−pH"®bpH"
), (1)
where bpH
represents the relationship between the equivalents determined by theTNBS method and base consumption, which, according to his results, seems to stayconstant until practically 20% hydrolysis. The results obtained by this method areset out in Table 1, where we also include the results at pH¯ 9±5, which Adler-Nissenhimself did not use.
Using values excluding those from the experiments at pH 9±5 Adler-Nissen cameto the conclusion that the differences were insignificant, since from a theoreticalpoint of view the pK values might be expected to be practically identical, and thushe decided to average them out, and proposed a value of pK¯ 7±1 at 50 °C, in whichhe included both substrates used (soyabean protein, mean pK¯ 7±15 and casein,mean pK¯ 6±85). Although he mentions that his results at pH 9±5 are somewhathigher he puts this down to the possible effects of amino acid side-chains or to thefact that the pK is a mean of the values of very different terminal α-amino groups. Itis quite clear, however, that Adler-Nissen’s pK values increase concomitantly withthe pH of the experiment in question and that the difference between the twosubstrates used is considerable.
Other authors (Margot et al. 1994) have tried to relate base consumption withother factors pertaining to the conditions of the hydrolytic reaction, such as soluble
Monitoring of enzymic protein hydrolysis 253
nitrogen, i.e. nitrogen that remains dissolved in an aqueous trichloroacetic acidsolution under normalized conditions.
Our aim in this paper is to show by a theoretical analysis of the process thatthe correct pK value, which must be a mean of the values of the different α-aminogroups released during the hydrolytic process, changes according to the pH of theexperimental conditions. We then propose a practical method to determine therelationship between pK and pH for any given protein–protease system.
Nomenclaturea Slope of the linear relationship between pH and pK, eqn 19 (®)B Base added (mol)bpH
Relationship derived by Adler-Nissen between the equivalentsdetermined by the TNBS method and base consumption (®)
bs
Base consumption in the titration for original protein (mol)bx
Base consumption in the titration for partially hydrolysed protein(mol)
CB
Concentration of base ()CF
Overall concentration of both unprotonated and protonatedgroups ()
Ci
Concentration of particular α-amino group released ()CT
Overall concentration of α-amino groups ()F Unprotonated group, lateral and terminalFH+ Protonated group, lateral and terminalhT
Peptide bonds per gram of protein (mol}g)K Equilibrium constant for the deprotonization of the amide group
(mol)k Coefficient calculated by Adler-Nissen between the α-amino groups
determined by the TNBS method and the degree of hydrolysis (®)Mp Mass of protein (g)pI Ionic product of water (®)P–NH
#Unprotonated terminal amino group
P–NH+
$Protonated terminal amino group
S!
Initial protein concentration (g}l)V
BVolume of base (litres)
V!
Initial volume of solution (litres)WPC Whey protein concentratex Degree of hydrolysis, expressed as a fraction (®)β Value of 1}(110pKo−pHo) at pH in which titration begins (®)γ Activity coefficient (®)µ Centre of the distribution eqn (17)σ Standard deviation eqn (17)
Relationship between pK and pH
When an amide bond is hydrolysed under alkaline conditions, 7!pH! 10:
P–CO–NH–PH#O!P–COOHP–NH
#, (2)
the terminal carboxyl group is completely dissociated
P–COOH!P–COO−H+, (3)
254 F. C
and the protons thus formed are distributed according to the protonizationequilibrium of the α-amino released:
P–NH+
$5P–NH
#H+, (4)
i.e. for each mol of hydrolysed amide bonds there appears one mol of monovalentanions, P–COO−, and one mol of monovalent cations distributed between bothspecies : P–NH+
$and H+. The base added to keep pH constant only neutralizes the
protons, which are then replaced by the cation belonging to the base, and thus themols of the added base are equivalent to the protons generated by the hydrolyticprocess, which are only a fraction of the amide bonds hydrolysed.
The equilibrium of stage (4), which can be taken as being instantaneous,involving as it does the exchange of only one proton, allows us to calculate thefraction of the hydrolysed amide bonds that must be neutralized by the base to keeppH constant, and so to relate base consumption with the degree of hydrolysis reachedat that moment; fulfilling thus
[P–NH#][H+]
[P–NH+
$]
¯K, (5)
where K is the equilibrium constant for the deprotonization of the amide group.If we introduce into eqn (5) the values of
K¯ 10−pK [H+]¯ 10−pH, (6)
we get[P–NH
#]
[P–NH+
$]¯ 10pH−pK, (7)
and the fraction in question will be
[P–NH#]
[P–NH#][P–NH+
$]¯
10pH−pK
110pH−pK, (8)
and thus the relationship between the mols of peptide bonds hydrolysed andthose of the added base will be
S!hTdx¯
110pH−pK
10pH−pKdB¯ (110pK−pH)dB, (9)
where S!
represents g protein}l, hT
the equivalents of peptide bonds per gram ofprotein, x the degree of hydrolysis of the hydrolysate used.
That is to say, to calculate the degree of hydrolysis reached it is essential to knowthe relevant pK value. Nevertheless, eqn (7) must involve an average of the differentα-amino groups released during hydrolysis, which are partially protonizable at thepH in question:
PiNH+
$5P
iNH
#H+. (10)
For equilibrium (10) eqn (7) should be written as
[PiNH
#]
[PiNH+
$]¯ 10pH−pKi, (11)
with which, if we denote the mol}l, either free or protonated, released of Pi–NH
#as C
ithen the terms of
[PiNH
#][P
iNH+
$]¯ [P
iNH+
$](110pH−pKi)¯C
i, (12)
Monitoring of enzymic protein hydrolysis 255
are fulfilled and thus the concentration of the protonated form can be expressed as
[PiNH+
$]¯
Ci
(110pH−pKi). (13)
If we sum eqn (13) for all the groups released
[P–NH+
$]¯3
i
[PiNH+
$]¯3
i
Ci
(110pH−pKi), (14)
given that the concentration of the protonated form of all the α-amino groupsreleased, using the mean pK defined by eqn (7), is
[P–NH+
$]¯
CT
(110pH−pK), (15)
where CT
is the molarity of the hydrolysed amide bonds, a comparison of eqns (14)and (15) shows that the mean value for the pK can be expressed as
pK¯pH®log"!
E
F
1
3i
Ci}C
T
110pH−pKi
®1G
H
, (16)
from which equation we can see that the correct mean pK value may dependupon the pH of the experimental conditions.
Distribution of the pKi
During the enzymic hydrolysis of a protein with a specific enzyme it is fair topresume that this enzyme particularly catalyses the hydrolysis of peptide bondsinvolving one particular amino acid or a group of similar amino acids. Butnevertheless, the pK of the α-amino group thus released will be affected by the natureof the nearest amino acids, which will cause a variation, within a certain range, in thepK
ivalues of the α-amino groups released. If we presume that there is normal
distribution centred at µ with a standard deviation of σ, the fraction of α-aminogroups released with a pK value of between pK and pKdpK will be
1
(2πσ#)"/#exp
E
F
®(pK®µ)#
2σ#
G
H
dpK. (17)
For this continuous distribution the summation in eqn (16) must be transformedinto an integral
3i
Ci}C
T
110pH−pKi
¯&¢
!
expE
F
®(pK®µ)#
2σ#
G
H
(2πσ#)"/#(110pH−pK)dpK, (18)
which can be calculated for any pH value, for any given values of the twoparameters that characterize the distribution: µ and σ ; in accordance with eqn (14)the expression (18) represents the protonated fraction of the α-amino groups releasedduring hydrolysis. Thus, we can determine the mean pK value for each pH byintroducing eqn (18) in eqn (16) and solving the integration by MatLab 5.1 (TheMathworks Inc., Natick, MA 01760, USA). As an example, the results obtained for
256 F. C
7·4
7·3
7·2
7·1
7·0
6·9
6·8
6·7
6·62 4 6 8 10 12 14
pH
pK
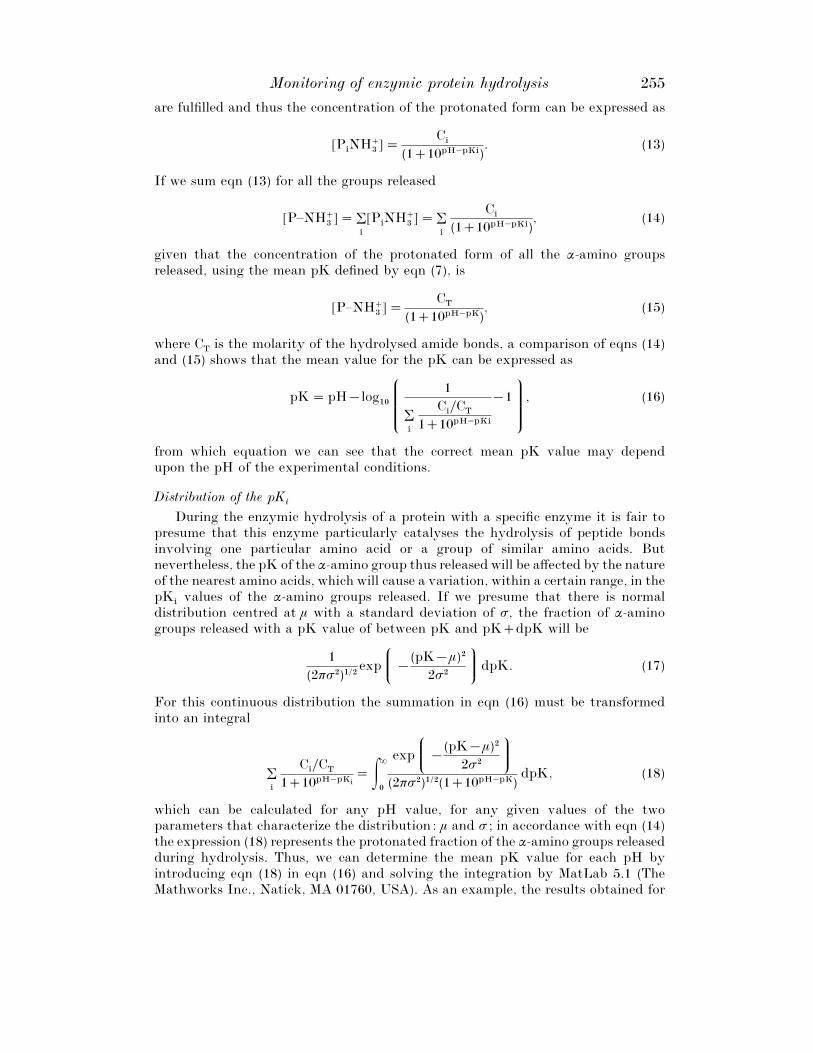
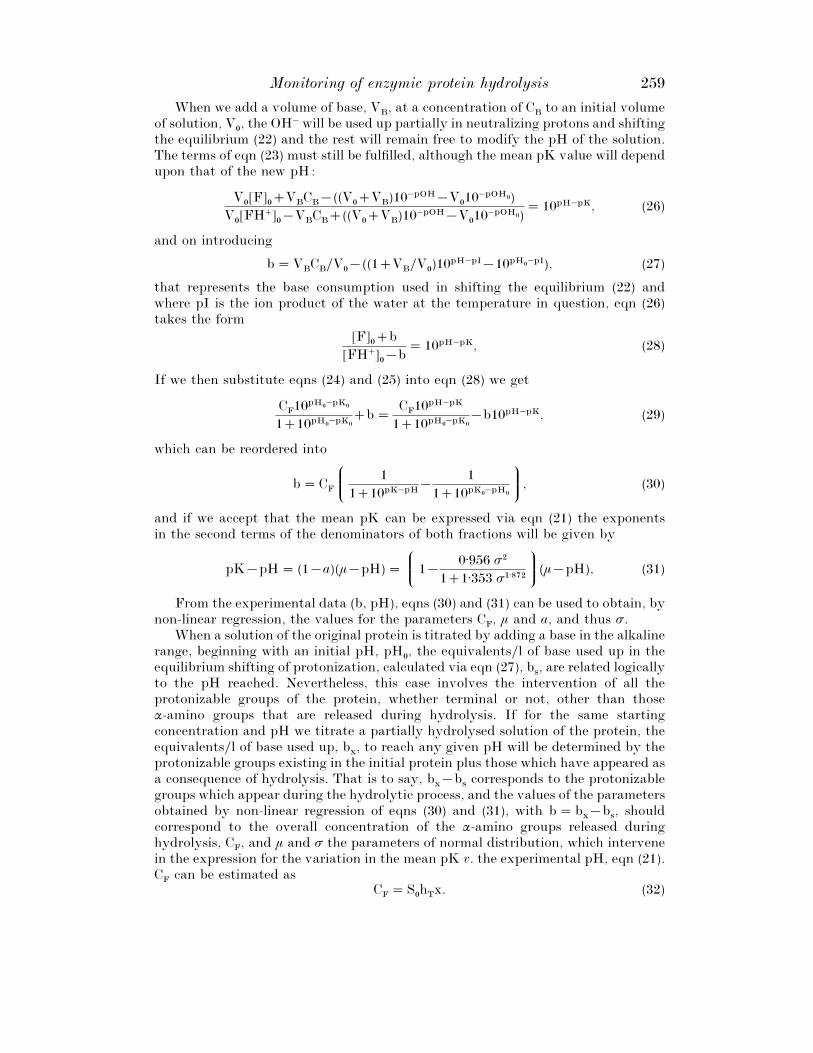
Fig. 1. Variation of mean pK v. pH. Simulation of the proposed method for a normal distributionof the pK
ivalues centred at µ¯ 7±0 with a standard deviation of σ¯ 0±5.
a distribution of µ¯ 7±0 and σ¯ 0±5 are plotted in Fig. 1. If we are interested in thepH range between those which determine a higher protonated fraction at pH 0±95and a lower one at 0±05, by using eqn (17) it is possible to determine this range, thesize of which depends wholly upon the width of the distribution, σ, and is centred inthe middle of the distribution, µ. The values obtained through this calculation are setout in Table 2. Outside this range it may be accepted that all the α-amino groupsreleased are either protonated (low pH values) or deprotonated (high pH values). Asmentioned above, by using eqn (16) we can arrive at the correct mean pK valuewithin this range.
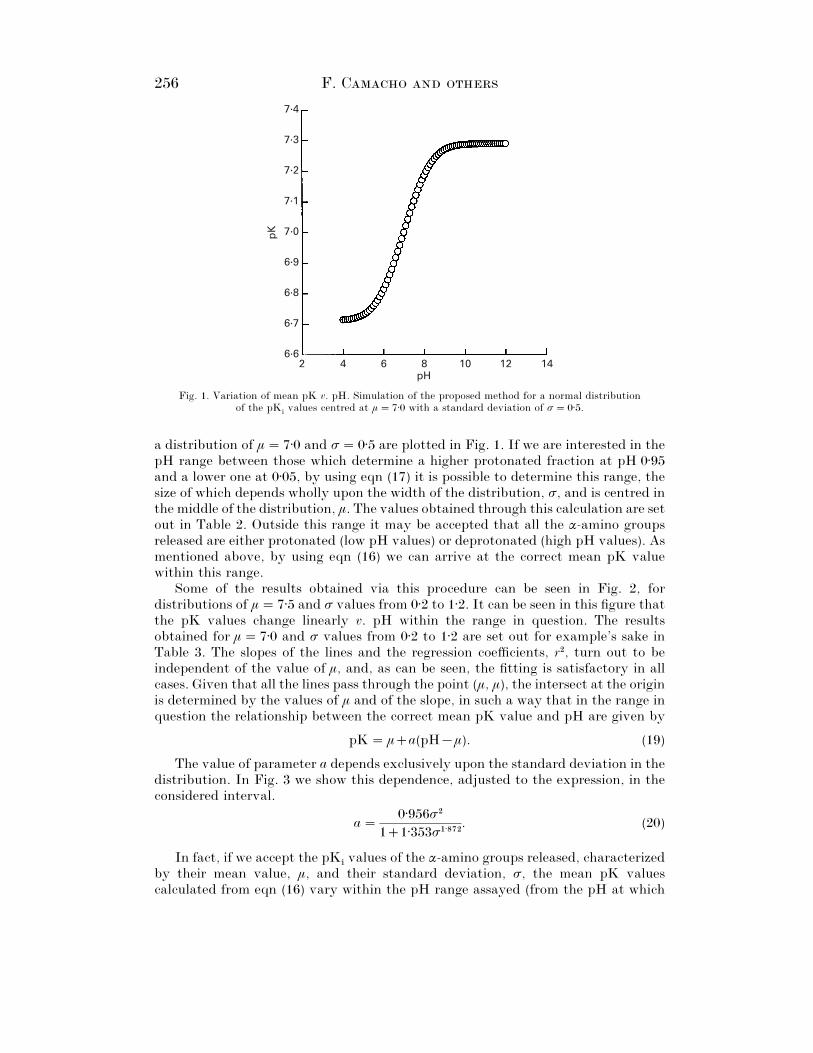
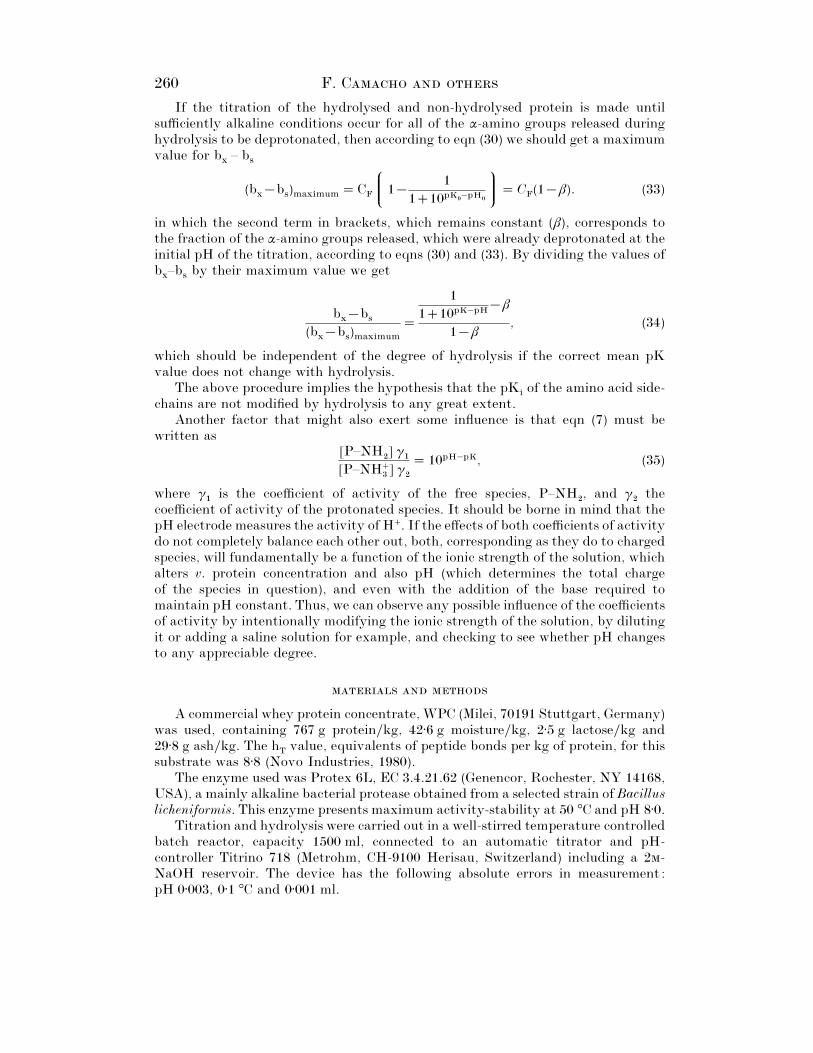
Some of the results obtained via this procedure can be seen in Fig. 2, fordistributions of µ¯ 7±5 and σ values from 0±2 to 1±2. It can be seen in this figure thatthe pK values change linearly v. pH within the range in question. The resultsobtained for µ¯ 7±0 and σ values from 0±2 to 1±2 are set out for example’s sake inTable 3. The slopes of the lines and the regression coefficients, r#, turn out to beindependent of the value of µ, and, as can be seen, the fitting is satisfactory in allcases. Given that all the lines pass through the point (µ, µ), the intersect at the originis determined by the values of µ and of the slope, in such a way that in the range inquestion the relationship between the correct mean pK value and pH are given by
pK¯µa(pH®µ). (19)
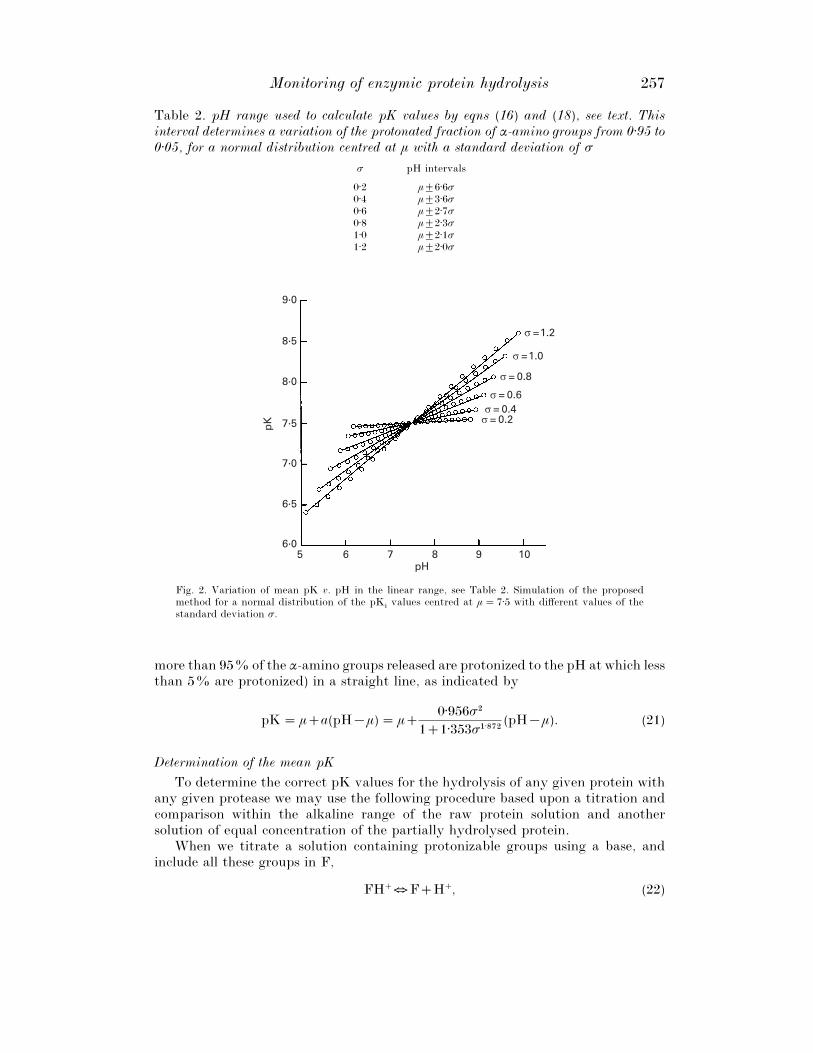
The value of parameter a depends exclusively upon the standard deviation in thedistribution. In Fig. 3 we show this dependence, adjusted to the expression, in theconsidered interval.
a¯0±956σ#
11±353σ"±)(#
. (20)
In fact, if we accept the pKivalues of the α-amino groups released, characterized
by their mean value, µ, and their standard deviation, σ, the mean pK valuescalculated from eqn (16) vary within the pH range assayed (from the pH at which
Monitoring of enzymic protein hydrolysis 257
Table 2. pH range used to calculate pK values by eqns (16) and (18), see text. Thisinterval determines a variation of the protonated fraction of α-amino groups from 0±95 to0±05, for a normal distribution centred at µ with a standard deviation of σ
σ pH intervals
0±2 µ³6±6σ0±4 µ³3±6σ0±6 µ³2±7σ0±8 µ³2±3σ1±0 µ³2±1σ1±2 µ³2±0σ
9·0
8·5
8·0
7·5
7·0
6·5
6·05 6 7 8 9 10
pH
pK r = 0.2
r = 0.4r = 0.6
r = 0.8
r =1.0
r =1.2
Fig. 2. Variation of mean pK v. pH in the linear range, see Table 2. Simulation of the proposedmethod for a normal distribution of the pK
ivalues centred at µ¯ 7±5 with different values of the
standard deviation σ.
more than 95% of the α-amino groups released are protonized to the pH at which lessthan 5% are protonized) in a straight line, as indicated by
pK¯µa(pH®µ)¯µ0±956σ#
11±353σ"±)(#
(pH®µ). (21)
Determination of the mean pK
To determine the correct pK values for the hydrolysis of any given protein withany given protease we may use the following procedure based upon a titration andcomparison within the alkaline range of the raw protein solution and anothersolution of equal concentration of the partially hydrolysed protein.
When we titrate a solution containing protonizable groups using a base, andinclude all these groups in F,
FH+5FH+, (22)
258 F. C
Table 3. Linear regression parameters, at different values of the standard deviation σ fora normal distribution centred at µ¯ 7±0, of pK values v. pH in the linear range (seeTable 2)
σ Slope Intersect r# (µ-intersect)}µ
0±2 0±0357 6±7504 0±9855 0±03570±4 0±1231 6±1387 0±9912 0±12300±6 0±2265 5±4146 0±9952 0±22650±8 0±3235 4±7355 0±9973 0±32351±0 0±4061 4±1571 0±9983 0±40611±2 0±4741 3±6813 0±9989 0±4741
0·5
0·4
0·3
0·2
0·1
0·0
r
a
0·0 0·5 1·0 1·5
Fig. 3. Variation of the slope of the equation pK¯µa (pH ®µ) v. standard deviation σ.
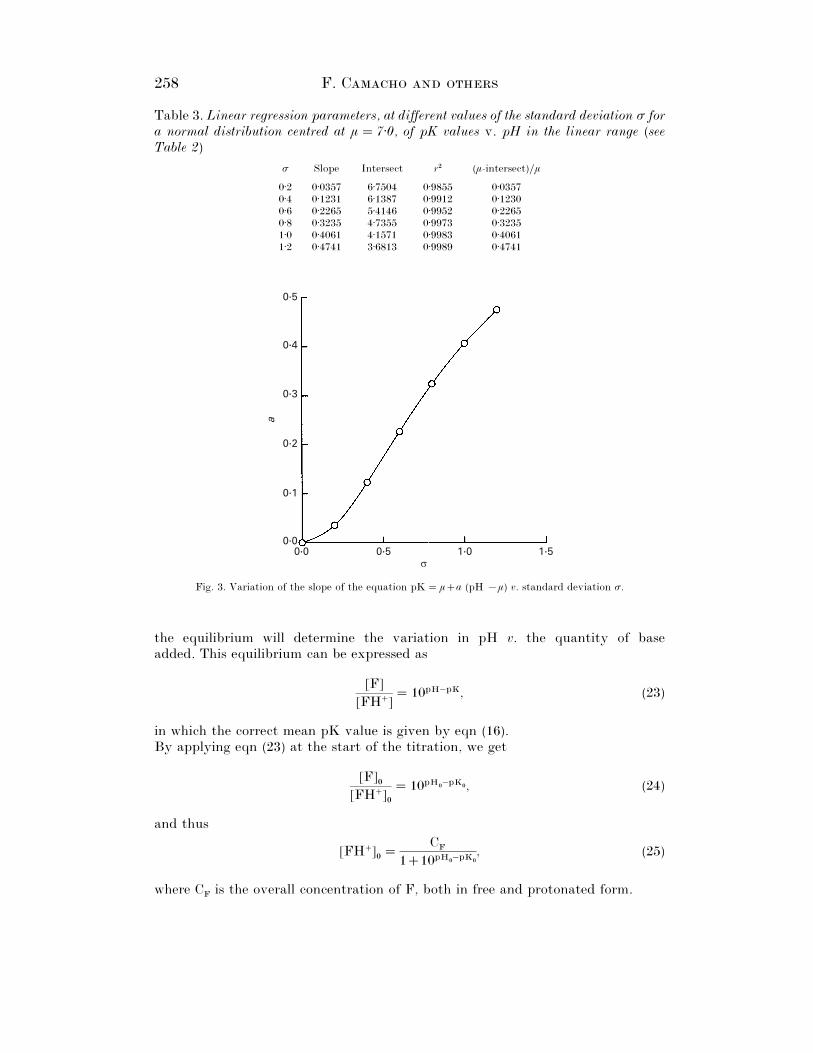
the equilibrium will determine the variation in pH v. the quantity of baseadded. This equilibrium can be expressed as
[F]
[FH+]¯ 10pH−pK, (23)
in which the correct mean pK value is given by eqn (16).By applying eqn (23) at the start of the titration, we get
[F]!
[FH+]!
¯ 10pH!−pK!, (24)
and thus
[FH+]!¯
CF
110pH!−pK!
, (25)
where CF
is the overall concentration of F, both in free and protonated form.
Monitoring of enzymic protein hydrolysis 259
When we add a volume of base, VB, at a concentration of C
Bto an initial volume
of solution, V!, the OH− will be used up partially in neutralizing protons and shifting
the equilibrium (22) and the rest will remain free to modify the pH of the solution.The terms of eqn (23) must still be fulfilled, although the mean pK value will dependupon that of the new pH:
V![F]
!V
BCB®((V
!V
B)10−pOH®V
!10−pOH!)
V![FH+]
!®V
BCB((V
!V
B)10−pOH®V
!10−pOH!)
¯ 10pH−pK, (26)
and on introducing
b¯VBCB}V
!®((1V
B}V
!)10pH−pI®10pH!−pI), (27)
that represents the base consumption used in shifting the equilibrium (22) andwhere pI is the ion product of the water at the temperature in question, eqn (26)takes the form
[F]!b
[FH+]!®b
¯ 10pH−pK, (28)
If we then substitute eqns (24) and (25) into eqn (28) we get
CF10pH!−pK!
110pH!−pK!
b¯CF10pH−pK
110pH!−pK!
®b10pH−pK, (29)
which can be reordered into
b¯CF
E
F
1
110pK−pH®
1
110pK!−pH!
G
H
, (30)
and if we accept that the mean pK can be expressed via eqn (21) the exponentsin the second terms of the denominators of both fractions will be given by
pK®pH¯ (1®a)(µ®pH)¯E
F
1®0±956 σ#
11±353 σ"±)(#
G
H
(µ®pH), (31)
From the experimental data (b, pH), eqns (30) and (31) can be used to obtain, bynon-linear regression, the values for the parameters C
F, µ and a, and thus σ.
When a solution of the original protein is titrated by adding a base in the alkalinerange, beginning with an initial pH, pH
!, the equivalents}l of base used up in the
equilibrium shifting of protonization, calculated via eqn (27), bs, are related logically
to the pH reached. Nevertheless, this case involves the intervention of all theprotonizable groups of the protein, whether terminal or not, other than thoseα-amino groups that are released during hydrolysis. If for the same startingconcentration and pH we titrate a partially hydrolysed solution of the protein, theequivalents}l of base used up, b
x, to reach any given pH will be determined by the
protonizable groups existing in the initial protein plus those which have appeared asa consequence of hydrolysis. That is to say, b
x®b
scorresponds to the protonizable
groups which appear during the hydrolytic process, and the values of the parametersobtained by non-linear regression of eqns (30) and (31), with b¯b
x®b
s, should
correspond to the overall concentration of the α-amino groups released duringhydrolysis, C
F, and µ and σ the parameters of normal distribution, which intervene
in the expression for the variation in the mean pK v. the experimental pH, eqn (21).CF
can be estimated asCF¯S
!hTx. (32)
260 F. C
If the titration of the hydrolysed and non-hydrolysed protein is made untilsufficiently alkaline conditions occur for all of the α-amino groups released duringhydrolysis to be deprotonated, then according to eqn (30) we should get a maximumvalue for b
x– b
s
(bx®b
s)maximum
¯CF
E
F
1®1
110pK!−pH!
G
H
¯CF(1®β). (33)
in which the second term in brackets, which remains constant (β), corresponds tothe fraction of the α-amino groups released, which were already deprotonated at theinitial pH of the titration, according to eqns (30) and (33). By dividing the values ofbx–b
sby their maximum value we get
bx®b
s
(bx®b
s)maximum
¯
1
110pK−pH®β
1®β, (34)
which should be independent of the degree of hydrolysis if the correct mean pKvalue does not change with hydrolysis.
The above procedure implies the hypothesis that the pKiof the amino acid side-
chains are not modified by hydrolysis to any great extent.Another factor that might also exert some influence is that eqn (7) must be
written as[P–NH
#] γ
"
[P–NH+
$] γ
#
¯ 10pH−pK, (35)
where γ"
is the coefficient of activity of the free species, P–NH#, and γ
#the
coefficient of activity of the protonated species. It should be borne in mind that thepH electrode measures the activity of H+. If the effects of both coefficients of activitydo not completely balance each other out, both, corresponding as they do to chargedspecies, will fundamentally be a function of the ionic strength of the solution, whichalters v. protein concentration and also pH (which determines the total chargeof the species in question), and even with the addition of the base required tomaintain pH constant. Thus, we can observe any possible influence of the coefficientsof activity by intentionally modifying the ionic strength of the solution, by dilutingit or adding a saline solution for example, and checking to see whether pH changesto any appreciable degree.
A commercial whey protein concentrate, WPC (Milei, 70191 Stuttgart, Germany)was used, containing 767 g protein}kg, 42±6 g moisture}kg, 2±5 g lactose}kg and29±8 g ash}kg. The h
Tvalue, equivalents of peptide bonds per kg of protein, for this
substrate was 8±8 (Novo Industries, 1980).The enzyme used was Protex 6L, EC 3.4.21.62 (Genencor, Rochester, NY 14168,
USA), a mainly alkaline bacterial protease obtained from a selected strain of Bacilluslicheniformis. This enzyme presents maximum activity-stability at 50 °C and pH 8±0.
Titration and hydrolysis were carried out in a well-stirred temperature controlledbatch reactor, capacity 1500 ml, connected to an automatic titrator and pH-controller Titrino 718 (Metrohm, CH-9100 Herisau, Switzerland) including a 2-NaOH reservoir. The device has the following absolute errors in measurement:pH 0±003, 0±1 °C and 0±001 ml.
Monitoring of enzymic protein hydrolysis 261
Solutions of 10 g WPC}l were prepared by reconstituting WPC powder with Milli-Q water preheated at the experimental temperature of 50 °C and mixing with astirrer until completely dissolved. The initial pH of the raw protein solution (6±05)was adjusted to 8±0, the protease was added (enzyme:substrate ratio¯ 0±005,reaction time ! 20 min) and the hydrolysis process was monitored by the pH-stattechnique. The equation derived by Adler-Nissen (1986), x¯ (B (110pK−pH))}(M
p
hT), was used with a pK value of 7±1 to calculate the base consumption corresponding
to an established degree of hydrolysis.When the calculated mols of base (x¯ 0±0, B¯ 0±00 mmol; x¯ 0±1, B¯ 11±68
mmol; x¯ 0±2, B¯ 23±36 mmol) had been consumed and thus the desired extent ofthe hydrolysis was reached, pH was rapidly decreased by HCl 35%. Then titrationfrom pH 6±5 to 10±0 was carried out (titration time ! 5 min) recording both agenttitration volume and pH. All experiments were duplicated. We used eqn (27) todetermine the equivalents of titrant agent. The value for pI at 50 °C is 13±275.
To determine of influence of the activity coefficients in eqn (35) two differentseries of experiments were made. In the first series, ionic strength was modified bydiluting a solution of 150 g protein}l to 100 g}l and to 50 g}l. In the second series,ionic strength was modified by adding consecutively 0±75, 6±75 and 67±5 ml 2 -KClto 1±5 litres of 50 g protein}l solution. In each case, changes in pH were studied.
SigmaPlot 4.0 (SPSS Inc., Chicago, IL 60606, USA) and MatLab 5.1 (TheMathworks Inc., Natick, MA 01760, USA) software packages were used for dataanalysis.
No changes in pH where observed when modifying ionic strength by dilution oraddition of KCl solution. This result shows that, in practice, the activity coefficientsin eqn (35) cancel each other.
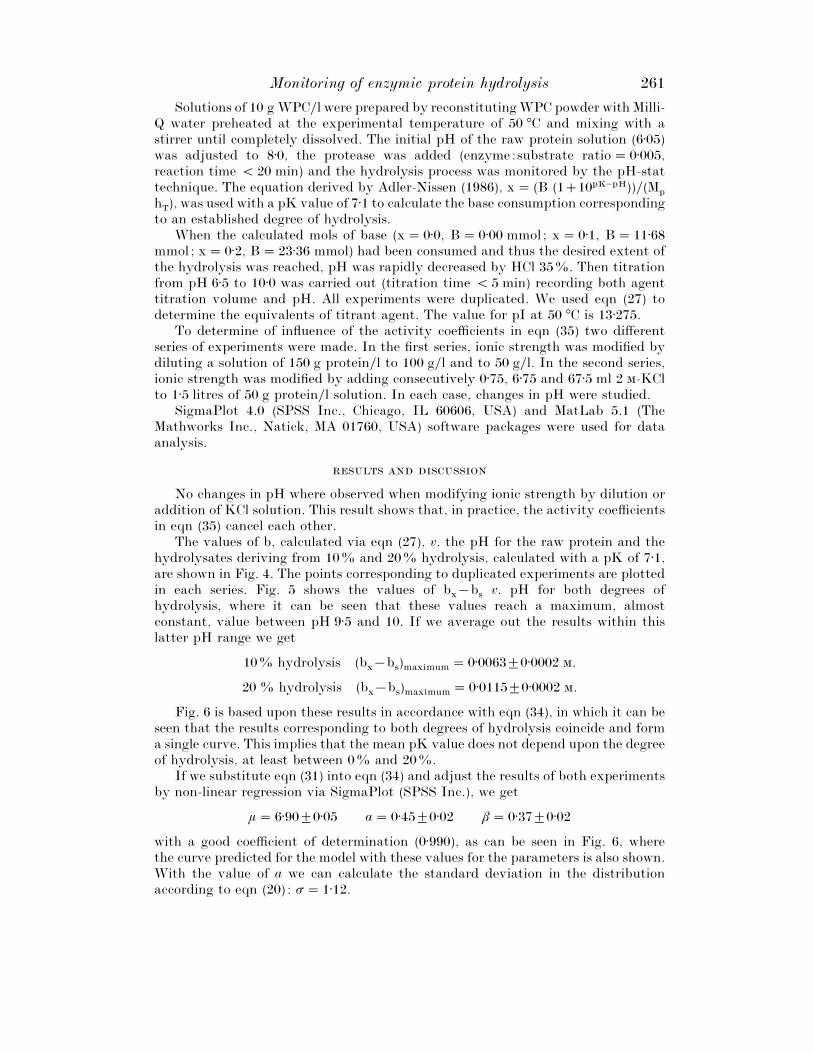
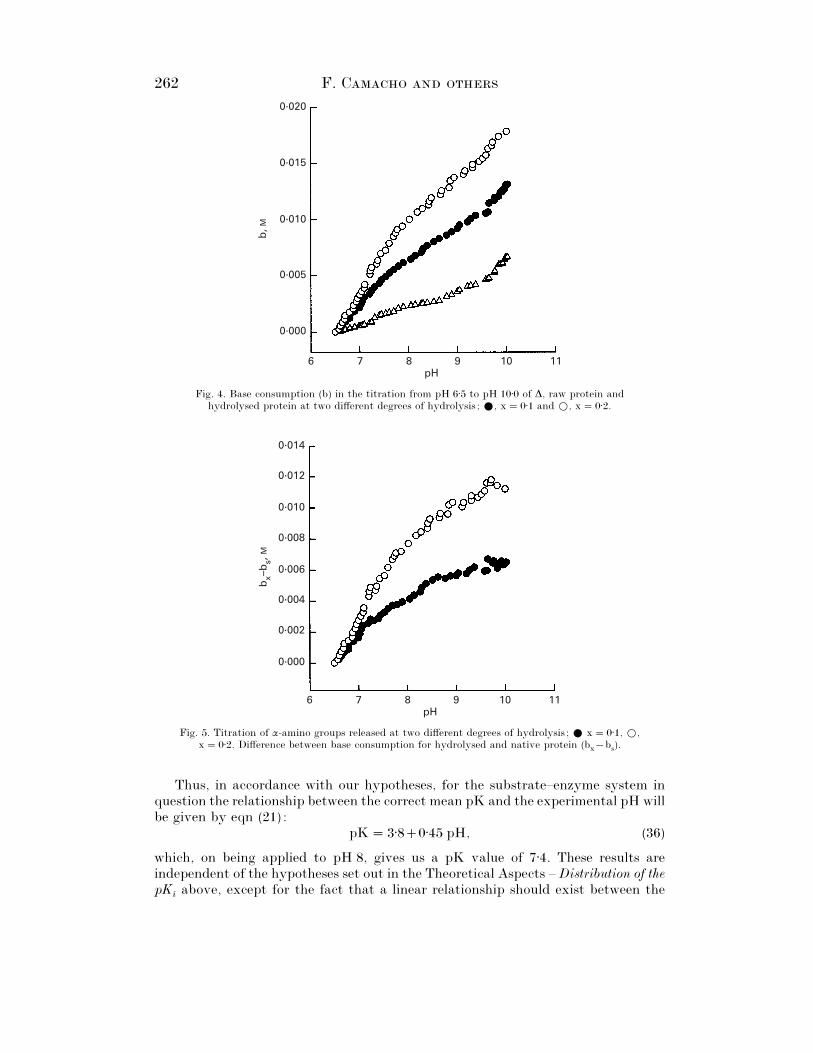
The values of b, calculated via eqn (27), v. the pH for the raw protein and thehydrolysates deriving from 10% and 20% hydrolysis, calculated with a pK of 7±1,are shown in Fig. 4. The points corresponding to duplicated experiments are plottedin each series. Fig. 5 shows the values of b
x®b
sv. pH for both degrees of
hydrolysis, where it can be seen that these values reach a maximum, almostconstant, value between pH 9±5 and 10. If we average out the results within thislatter pH range we get
10% hydrolysis (bx®b
s)maximum
¯ 0±0063³0±0002 .
20 % hydrolysis (bx®b
s)maximum
¯ 0±0115³0±0002 .
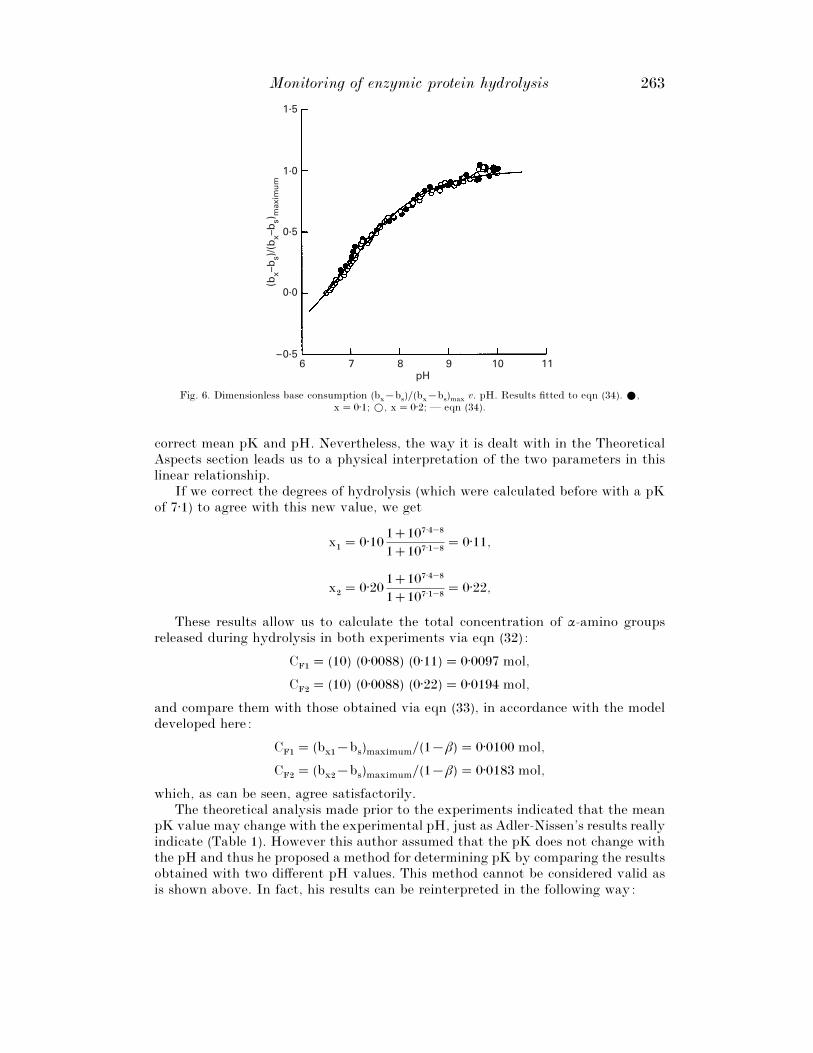
Fig. 6 is based upon these results in accordance with eqn (34), in which it can beseen that the results corresponding to both degrees of hydrolysis coincide and forma single curve. This implies that the mean pK value does not depend upon the degreeof hydrolysis, at least between 0% and 20%.
If we substitute eqn (31) into eqn (34) and adjust the results of both experimentsby non-linear regression via SigmaPlot (SPSS Inc.), we get
µ¯ 6±90³0±05 a¯ 0±45³0±02 β¯ 0±37³0±02
with a good coefficient of determination (0±990), as can be seen in Fig. 6, wherethe curve predicted for the model with these values for the parameters is also shown.With the value of a we can calculate the standard deviation in the distributionaccording to eqn (20) : σ¯ 1±12.
262 F. C
0·020
0·015
0·010
0·005
0·000
b, M
6 7 98 10 11pH
Fig. 4. Base consumption (b) in the titration from pH 6±5 to pH 10±0 of ∆, raw protein andhydrolysed protein at two different degrees of hydrolysis ; E, x¯ 0±1 and D, x¯ 0±2.
0·014
0·010
0·008
0·004
0·000
bx–
bs,
M
6 7 98 10 11pH
0·012
0·006
0·002
Fig. 5. Titration of α-amino groups released at two different degrees of hydrolysis ; E x¯ 0±1, D,x¯ 0±2. Difference between base consumption for hydrolysed and native protein (b
x®b
s).
Thus, in accordance with our hypotheses, for the substrate–enzyme system inquestion the relationship between the correct mean pK and the experimental pH willbe given by eqn (21) :
pK¯ 3±80±45 pH, (36)
which, on being applied to pH 8, gives us a pK value of 7±4. These results areindependent of the hypotheses set out in the Theoretical Aspects – Distribution of thepK
iabove, except for the fact that a linear relationship should exist between the
Monitoring of enzymic protein hydrolysis 263
1·5
1·0
–0·5
(bx–
bs)
/(b
x–b
s)m
axim
um
6 7 98 10 11pH
0·5
0·0
Fig. 6. Dimensionless base consumption (bx®b
s)}(b
x®b
s)max
v. pH. Results fitted to eqn (34). E,x¯ 0±1; D, x¯ 0±2; — eqn (34).
correct mean pK and pH. Nevertheless, the way it is dealt with in the TheoreticalAspects section leads us to a physical interpretation of the two parameters in thislinear relationship.
If we correct the degrees of hydrolysis (which were calculated before with a pKof 7±1) to agree with this new value, we get
x"¯ 0±10
110(±%−)
110(±"−)
¯ 0±11,
x#¯ 0±20
110(±%−)
110(±"−)
¯ 0±22,
These results allow us to calculate the total concentration of α-amino groupsreleased during hydrolysis in both experiments via eqn (32) :
CF"
¯ (10) (0±0088) (0±11)¯ 0±0097 mol,
CF#
¯ (10) (0±0088) (0±22)¯ 0±0194 mol,
and compare them with those obtained via eqn (33), in accordance with the modeldeveloped here:
CF"
¯ (bx"
®bs)maximum
}(1®β)¯ 0±0100 mol,
CF#
¯ (bx#
®bs)maximum
}(1®β)¯ 0±0183 mol,
which, as can be seen, agree satisfactorily.The theoretical analysis made prior to the experiments indicated that the mean
pK value may change with the experimental pH, just as Adler-Nissen’s results reallyindicate (Table 1). However this author assumed that the pK does not change withthe pH and thus he proposed a method for determining pK by comparing the resultsobtained with two different pH values. This method cannot be considered valid asis shown above. In fact, his results can be reinterpreted in the following way:
264 F. C
Table 4. pK values at 50 °C calculated by using Adler-Nissen’s (1986) results. Theenzyme used was Alcalase 0.6L and substrate concentration was 50 g}l
Substrate pH bpH
pK
Soyabean isolate 6±5 5±93 7±217±0 2±767 7±277±5 1±663 7±358±0 1±254 7±479±5 0±971 —
Casein 7±0 2±732 7±217±5 1±956 7±45
Using the coefficients, k, calculated by Adler-Nissen (1986) between the α-aminogroups determined by the TNBS method and the degree of hydrolysis, we can arriveat the pK values for each pH via
bpH
¯k(110pK−pH), (37)
i.e.
pK¯pHlog"!
E
F
bpH
k®1
G
H
, (38)
where k¯ 0±970 for the soyabean protein concentrate and 1±039 for casein. The valuesthus obtained are set out in Table 4, except for those at pH 9±5 because at this pHthe value of b
pHwas 0±971, i.e. practically the same as k, and thus all the α-amino
groups are practically free. That is to say that in this case base consumption givesthe degree of hydrolysis directly, thus confirming Adler-Nissen’s value for k.
From these results by linear regression we get the equations:
soyabean protein isolate
casein
pK¯ 6±080±17 pH,
pK¯ 3±850±48 pH,
which are similar to our eqn (36), especially in the second case, which is also a milkprotein.
According to our results, it has been proved that the correct pK of the α-aminogroups released in the enzymic hydrolysis of a protein, which let us correlate thebase consumption with the degree of hydrolysis, is a function of pH if we accept thatthe pK depends on the nature of the terminal amino acid and the nearest aminoacids. If the distribution of the corresponding pK
iis presumed to be normal, centred
at µ with a standard deviation of σ, the relationship between the mean pK and pHwas linear from the pH at which more than 95% of the α-amino groups released wereprotonized to the pH at which less than 5% were protonized. The determination ofthis relationship for a given protein–protease system can be carried out by comparingthe results of the titration of the original protein and the protein partiallyhydrolysed, as shown above in the hydrolysis of whey protein with Protex at 50 °Cand pH¯ 8±0. The model developed in this work can easily be applied to anyhydrolytic process involving the appearance of functional groups that are partiallyprotonizable under the working conditions in order to follow the kinetics of thereaction via the consumption of the neutralizing agent required to keep pH constant.
This research work was supported by grants, PTR-94-0164 and QUI98-0910,from the Comisio! n Interministerial de Ciencia y Tecnologı!a (CICYT). Enzymes,contributed by Genencor International, are gratefully acknowledged.
Monitoring of enzymic protein hydrolysis 265
A-N, J. 1979 Determination of the degree of hydrolysis of food protein hydrolysates bytrinitrobenzenesulphonic acid. Journal of Agricultural and Food Chemistry 6 1256–1262
A-N, J. 1986 Enzymatic Hydrolysis of Food Proteins. London and New York: Elsevier AppliedScience Publishers
A, P. 1988 In vitro digestion of bovine milk proteins by trypsin hydrolysis and pH-stat analysis. In: MilkProteins. Nutritional, Clinical, Functional and Technological Aspects, pp 197–218 (Eds. C. A. Barth &E. Schlimme). New York: Steinkopff Verlag, Darmstadt & Springer-Verlag
C, F., G! -T, P. & G, E. M. 1998 Influence of enzymes, pH and temperature on thekinetics of whey protein hydrolysis. Food Science and Technology International 4 79–84
C, J. P, M-A B. L. & S M. M. 1982 Method for the preparation of a proteinhydrolyzate from whey protein. European Patent Aplication A1 0 065 663
D, W. & Z, S. 1999 Enzymatic hydrolysis of milk proteins under alkaline and acidic conditions.Journal of Food Science 64 393–395
G! -T, P., C, F., J, E., P! , M. P. & G, E. M. 1994 Enzymatic hydrolysisof whey proteins: I. Kinetic models. Biotechnology & Bioengineering 44 523–528
G, G. K., K, P. P., H, B. E., K, M. V. & S, D. B. A. 1986 Effect of peptidechain length on amino acid and nitrogen absorption from two lactalbumin hydrolysates in the normal humanjejunum. Clinical Science 71 65–69
J, C. F., L! , J., L$ -L, K. & O, M. 1957 The pH-stat and its use inbiochemistry. Methods of Biochemical Analysis 4 171–210
M, A., F, E. & R, A. 1994 Continuous monitoring of enzymatic whey protein hydrolysis.Correlation of base consumption with soluble nitrogen content. Process Biochemistry 29 257–262
N, T., S, H. & S, Y. 1993 Production of low antigenic whey protein hydrolysates byenzymatic hydrolysis and denaturation with high pressure. Milchwissenschaft 48 (3) 141–144
N, K. H. 1979 Bitterness of peptides: amino acid composition and chain length. ACS Symposium Series115 149–173
Novo Industries 1980 Use of food grade Alcalase2 or Neutrase2 for controlled enzymatic hydrolysis ofproteins. Bagsvaerd. Denmark
O, H., D, X. Y. & H, A. 1990 Preparation of low-inmunogenic peptide fragments from milkcasein. Milchwissenschaft 45 (4) 217–220