Embed Size (px)
Citation preview
CORRELATION BETWEEN BARRIERS TO ADHERENCE AND TREATMENT SATISFACTION OF HYDROXYUREA IN INDIVIDUALS WITH SICKLE CELL
DISEASE
by
Anusha Vaidyanathan
B.Sc Advanced Zoology and Biotechnology, Madras University, India 2012
Submitted to the Graduate Faculty of
the Department of Human Genetics
Graduate School of Public Health in partial fulfillment
of the requirements for the degree of
Master of Science
University of Pittsburgh
2015

ii
UNIVERSITY OF PITTSBURGH
Graduate School of Public Health
This thesis was presented
by
Anusha Vaidyanathan
It was defended on
August 11th 2015
and approved by
Thesis Director: Lakshmanan Krishnamurti, M.D., Ph.D.
Director of BMT Program and Professor of Pediatrics Department of Pediatrics, Emory University School of Medicine
Committee Members: Dr. Gregory Kato, M.D.
Professor of Medicine, Department of Pediatrics, School of Medicine, University of Pittsburgh
John Shaffer, Ph.D. Assistant Professor, Human Genetics, Graduate School of Public Health, University of Pittsburgh
Robin Grubs, M.S., Ph.D.
Assistant Professor, Human Genetics, Graduate School of Public Heath, University of Pittsburgh
Jeremy Martinson, PhD. Assistant Professor, Infectious Diseases and Microbiology, Graduate School of Public Health,
University of Pittsburgh

iii
Copyright © by Anusha Vaidyanathan
2015

iv
ABSTRACT
Sickle cell Disease (SCD) is an autosomal recessive disorder that affects 50,000 to 100,000
people in the United States. This disorder is characterized by pain episodes, acute chest
syndrome, splenic sequestration, infection, stroke, aplastic crisis, and priapism. Hydroxyurea
(HU) is a drug that is clinically effective in reducing pain episodes, hospitalizations, and total
health care costs. However, studies show that HU continues to be underutilized in individuals
with SCD. There is evidence to suggest poor adherence to HU among people in this population
and studies have identified a number of barriers at the patient, caregiver, provider and system
wide levels. Issues with adherence strongly impacts Health Related Quality of Life (HRQOL) of
individuals with SCD, making it a public health concern. While there are reports available in the
literature on the qualitative analyses of barriers experienced by this population, there have been
no known studies that have examined patient reported treatment satisfaction. Our hypothesis is
that barriers to adherence of HU and treatment satisfaction play a significant role in medication
adherence.
The objective is three-fold:
1. To determine the barriers to adherence of hydroxyurea for individuals with SCD
2. To determine the treatment satisfaction of hydroxyurea in individuals with SCD
3. To determine any correlation between the treatment satisfaction and the barriers to HU
CORRELATION BETWEEN BARRIERS TO ADHERENCE AND TREATMENT SATISFACTION OF HYDROXYUREA IN INDIVIDUALS WITH SICKLE CELL
DISEASE
Anusha Vaidyanathan, M.S.
University of Pittsburgh, 2015
Lakshmanan Krishnamurti, M.D., PhD.

v
The participants in this study include individuals who have been on HU for at least 6
months. Pediatric, caregiver and adult participants were recruited from the University of
Pittsburgh Medical Center and Children’s Healthcare of Atlanta. Only adult participants were
recruited from Children’s National Medical Center, Washington DC. The information was
collected using two surveys administered to all individuals. The TSQM-9 (Treatment
Satisfaction Questionnaire for Medication) was used to evaluate Hydroxyurea treatment
satisfaction in patients. The Adherence Starts with Knowledge (ASK-12) survey along with the
additional barriers survey were used to evaluate the barriers to adherence of Hydroxyurea. All
surveys were modified for caregiver responses in the pediatric settings. The surveys were
administered over a period of one year.
The results of this study revealed low levels of barriers and moderately high levels of
treatment satisfaction. The survey results indicate that two specific questions present in the
additional barriers surveys may be examined in greater detail. Weak linear correlation was
observed between several categories of barrier surveys and the subsets of the treatment
satisfactions survey.

vi
TABLE OF CONTENTS
ACKNOWLEDGEMENTS ....................................................................................................... XI
1.0 INTRODUCTION ........................................................................................................ 1
2.0 BACKGROUND AND SIGNIFICANCE .................................................................. 3
2.1 SICKLE CELL DISEASE .................................................................................. 3
2.2 IMPACT ON INDIVIDUAL AND SOCIETY .................................................. 4
2.2.1 Clinical presentation........................................................................................ 4
2.2.2 Health Related Quality of Life (HRQOL) ..................................................... 5
2.2.3 Public health implications ............................................................................... 6
2.3 GENETICS AND INHERITANCE ................................................................... 7
2.3.1 Molecular genetics and pathophysiology ....................................................... 7
2.4 PREVENTION AND MANAGEMENT ............................................................ 8
2.4.1 Prevention......................................................................................................... 8
2.4.2 Management and treatment ........................................................................... 8
2.5 HYDROXYUREA ............................................................................................... 9
2.5.1 History .............................................................................................................. 9
2.5.2 Drug action and drug use .............................................................................. 10
2.5.3 Drug Efficacy ................................................................................................. 10
2.5.4 Drug effectiveness .......................................................................................... 10
vii
2.5.5 Cost effective .................................................................................................. 11
2.5.6 Short and long term effects ........................................................................... 11
2.6 CONCERNS WITH NON ADHRENCE ......................................................... 12
2.6.1 Effect of poor adherence ............................................................................... 13
2.7 BARRIERS TO ADHERENCE ....................................................................... 13
3.0 SPECIFIC AIMS ........................................................................................................ 14
4.0 STUDY DESIGN AND METHODS ......................................................................... 15
4.1 PROJECT DEVELOPMENT .......................................................................... 15
4.2 PARTICIPANT POPULATION ...................................................................... 16
4.2.1 Description of study population ................................................................... 16
4.2.2 Patient recruitment ........................................................................................ 16
4.3 SURVEYS ........................................................................................................... 17
4.3.1 Adherence Starts with Knowledge (ASK-12) Survey ................................. 17
4.3.2 Additional barriers survey ............................................................................ 18
4.3.3 Treatment Satisfaction of Medication Adherence (TSQM-9) ................... 19
4.3.4 Survey types ................................................................................................... 19
4.4 DATA COLLECTION AND ANALYSIS ....................................................... 20
4.4.1 Data handling and storage ............................................................................ 20
4.4.2 Data cleaning and scoring ............................................................................. 20
4.4.3 Analytical methods for specific aim 1 .......................................................... 21
4.4.4 Analytical methods for specific aim 2 .......................................................... 23
4.4.5 Analytical methods for specific aim 3 .......................................................... 24
5.0 RESULTS ................................................................................................................... 25

viii
5.1 DEMOGRAPHICS ............................................................................................ 25
5.2 BARRIERS TO ADHERENCE ....................................................................... 27
5.2.1 Distribution of ASK-12 and additional barriers survey responses ........... 27
5.2.2 Regression analysis ........................................................................................ 34
5.2.3 Descriptive statistics ...................................................................................... 38
5.3 TREATMENT SATISFACTION..................................................................... 41
5.3.1 Distribution of TSQM-9 survey responses .................................................. 41
5.3.2 Regression analysis ........................................................................................ 44
5.3.3 Descriptive statistics ...................................................................................... 45
5.4 CORRELATION BETWEEN BARRIERS AND TREATMENT
SATISFACTION ................................................................................................................ 46
5.4.2 Correlation ..................................................................................................... 47
5.4.3 Exploring statistical interaction effects ....................................................... 48
6.0 DISCUSSION ............................................................................................................. 53
6.1 LIMITATIONS .................................................................................................. 56
6.2 FUTURE STUDIES ........................................................................................... 57
7.0 CONCLUSION ........................................................................................................... 58
APPENDIX A: IRB APPROVAL AND RELAVANT DOCUMENTS ................................. 59
APPENDIX B: SURVEYS ......................................................................................................... 64
APPENDIX C: DATA CODING ............................................................................................... 69
BIBLIOGRAPHY ....................................................................................................................... 75

ix
LIST OF TABLES
Table 1. Categorical Classification of the ASK-12 survey ........................................................... 21
Table 2. Categorical Classification of Additional Barriers Survey .............................................. 22
Table 3. Categorical Classification of TSQM-9 Survey ............................................................... 24
Table 4. Enrollment Data and Demographics ............................................................................... 25
Table 5. Number of responses - Additional barriers survey ......................................................... 34
Table 6. Results of Simple Regression for ASK-12 Survey and Participant type ........................ 35
Table 7. Results of Regression for Additional Barriers Survey and Participant Type ................. 37
Table 8. Descriptive statistics of ASK-12 Survey ........................................................................ 38
Table 9. Descriptive statistics of Additional Barriers Survey....................................................... 39
Table 10. Results of Regression for TSQM-9 Survey and Participant Sites ................................ 44
Table 11. Descriptive statistics for TSQM-9 survey subsets ........................................................ 45
Table 12. Correlation Analyses ..................................................................................................... 47

x
LIST OF FIGURES
Figure 1. Bar chart - ASK-12 Inconvenience ............................................................................... 27
Figure 2. Bar chart - ASK-12 treatment beliefs ............................................................................ 28
Figure 3. Bar chart - ASK-12 behavior ......................................................................................... 29
Figure 4. Additional barriers survey side effects subscale responses ........................................... 30
Figure 5. Additional barriers survey difficulty subscale responses .............................................. 31
Figure 6. Additional barriers survey follow up subscale response ............................................... 32
Figure 7. Additional Barriers Survey transportation subscale response ....................................... 32
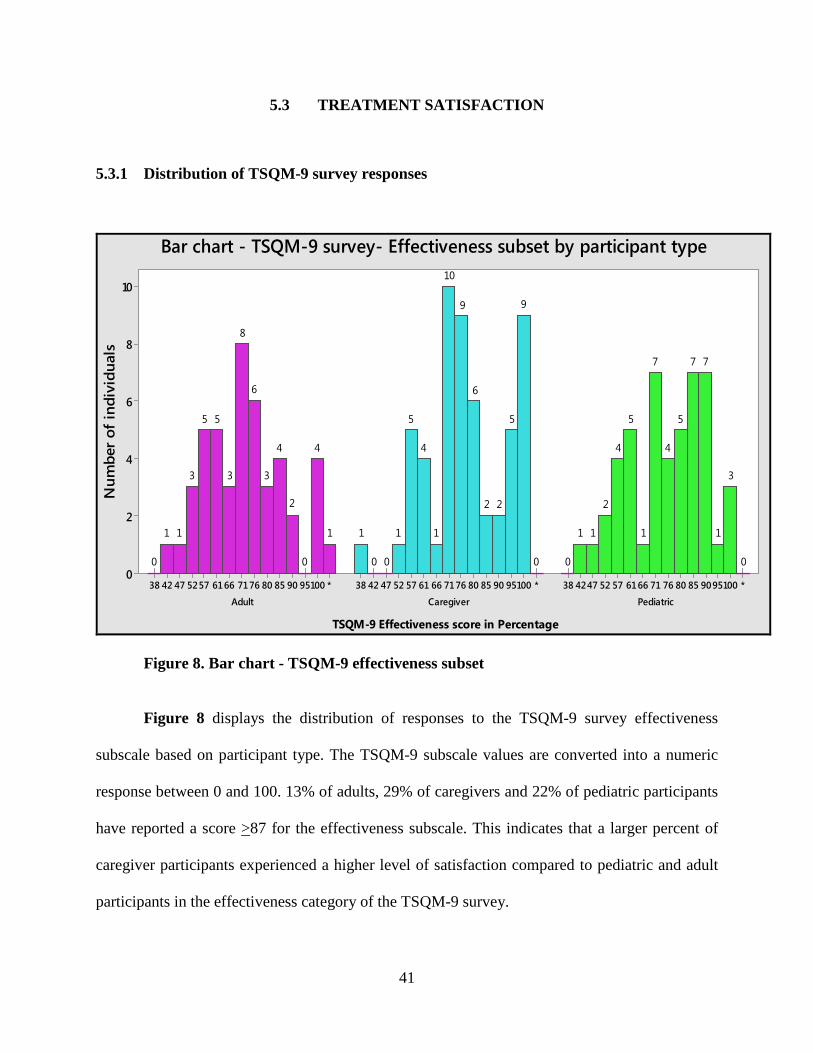
Figure 8. Bar chart - TSQM-9 effectiveness subset ...................................................................... 41
Figure 9. Bar chart - TSQM-9 Convenience subset ...................................................................... 42
Figure 10. Bar chart - TSQM-9 Global satisfaction ..................................................................... 43
Figure 11. Scatterplot Additional barriers follow up VS TSQM-9 .............................................. 50
Figure 12. Scatterplot - ASK-12 vs TSQM-9 ............................................................................... 51
Figure 13 Scatterplot – Additional Barriers survey vs TSQM-9 .................................................. 52
xi
ACKNOWLEDGEMENTS
This project would not have been possible without the assistance of numerous people. First and
foremost would be team at the Sickle Cell Clinic of the Children’s Hospital of Pittsburgh. I
sincerely thank Dr. Krishnamurti for the wonderful opportunity to work and learn from some
amazing people. Thank you to Dr. Robin Grubs for your encouragement and your support
through the hard times over the last two years. Your dedication and professionalism remain the
foremost values I strive towards in my own life. Thank you to Elizabeth Gettig, my mentor,
coach and good friend - you are one of the most radical thinkers I’ve met and your direction and
teachings will forever shape the kind of genetic counselor I hope to become.
Over the course of my graduate studies I have learnt so much about team work and the
value of research through the Sickle Cell Team at the Children’s Hospital of Pittsburgh of
UPMC. Brad, Dr. Cohen, Miss Patty and Vicki, thank you so much for your friendship and
guidance through my graduate program. A special thanks to Angela Martino who has not only
taught me a great deal about how to conduct research but has always been a reliable resource,
accommodating supervisor and one of the most considerate people I have worked with.
I was blessed with amazing classmates who supported and taught me a great deal during
these two years. Graduate school was one of the most challenging experiences and facing those
challenges with you all by my side made it a little less daunting. A special thanks to all my

xii
friends, both in and out of graduate school, who have witnessed and supported me though this
life changing experience.
I would like to thank my parents for their support and their belief in my dreams and
goals. Without their constant encouragement and tireless work, I would not be here today. I am
forever grateful for the life they have gifted me with and the values they have instilled in me.
Finally, I would like to thank my brother for his constant and eclectic influence on my life. Adi-
You have always taken care of me and fiercely believed in my abilities even when I questioned
them myself. Thank you for your endless support and help.

1
1.0 INTRODUCTION
Sickle cell disease (SCD) is an inherited blood disorder that affects 50,000 to 100,000 people in
the United States and over 250 million people worldwide. It is a chronic disabling disorder that
can decreases one’s life expectancy by 25-30 years.1 This disorder is clinically characterized by
vaso-occlusive episodes and hemolysis. Individuals with SCD are often hospitalized for acute
complications such as painful episodes, acute chest syndrome, splenic sequestration, infection,
stroke, aplastic crisis and priapism. 2 Treatment and management of complications related to
SCD involves home remediation or treatment in the Emergency Department (ED). This
condition has a negative impact on the quality of life for children, adolescents and adults who are
affected. 2; 3
In the United States, it is mandatory that all newborns be screened for
hemoglobinopathies (including SCD) in order to start prophylactic treatment and anticipatory
guidance. Hydroxyurea (HU) was approved in 1996 for treatment of symptoms in individuals
with sickle cell anemia.1; 4 HU is a myelo-suppresive agent that raises the levels of fetal
hemoglobin in the bloodstream. This effectively decreases the rate of vaso-occlusive and acute
chest syndrome episodes by 50%. 5 Clinical studies show that individuals regularly using HU
over a period of time show reduced mortality, lower hospitalizations, and lower medical costs
among people with SCD.6; 7 HU is currently administered as an oral daily drug. 4
2
Although HU has been established as an important therapeutic agent, there is evidence to
support that it is underutilized in individuals with SCD. Adherence to HU has been determined to
be a very important concern for individuals being treated. Physician reports claim that two thirds
of their patient population has concerns with adherence.8 In two large clinical studies involving
pediatric patients, 10% to 20% of participants stopped taking HU because of non-adherence.
Non-adherence is also expected to be higher outside of a clinical trial. 9
Barriers to adherence of HU have been identified at the patient, provider and system level
and are described in the National Institutes of Health (NIH) Consensus Development
Conference. At the patient level, barriers that have previously been outlined include lack of
access, lack of knowledge, fear of side effects, concerns for male infertility, cost of medication,
patient compliance with blood tests and taking medication.10 Other barriers that have been
determined include frequent monitoring, unavailability in pharmacies and time taken for benefits
to become apparent. 1; 9 There is limited research that has assessed patient perceived treatment
satisfaction to HU as a medication.
This project recognizes the need to identify patient reported barriers to the use of
hydroxyurea and understand patient reported treatment satisfaction of HU. It aims to determine
hydroxyurea specific barriers for sickle cell disease, as well as patient perceived treatment
satisfaction for this drug and to check for any correlation between HU specific barriers and
patient reported treatment satisfaction. One hundred and forty nine individuals from three
different locations participated in this study by completing qualitative surveys for treatment
satisfaction and barriers to Hydroxyurea adherence. The surveys were administered over a period
of one year.

3
2.0 BACKGROUND AND SIGNIFICANCE
2.1 SICKLE CELL DISEASE
Every year, around 2000 babies are born in the United States with sickle cell disease (SCD).
SCD is both a chronic and a lifelong condition and has often been associated with a decreased
lifespan. 1 This condition is most common in individuals of African, South or Central American,
Caribbean, Mediterranean, Indian and Saudi Arabian ancestry. 1
SCD is a genetic blood disorder of hemoglobin that damages and deforms the red blood
cells (RBCs) or erythrocytes. In individuals with SCD, the red blood cells become deoxygenated,
dehydrated, and crescent shaped. The sickle shaped RBCs sometimes break down and causes
anemia. These cells tend to form aggregates or stick to the walls of the blood vessels. This blocks
the blood flow in limbs or organs that causes the painful episodes characteristic of this condition.
These episodes can cause damage to the eyes, brain, heart, lungs, kidney, liver, bones, and
spleen. 1; 5; 11

4
2.2 IMPACT ON INDIVIDUAL AND SOCIETY
2.2.1 Clinical presentation
Clinical manifestations vary with the genotype of SCD. Signs and symptoms of this condition
can manifest in individuals by 5-6 months of age and continue throughout their life. Fetuses and
new born children produce a high level of fetal hemoglobin (different from adult hemoglobin)
and it helps them to be relatively free of the manifestations of SCD. 12 SCD can show variable
presentation ranging from asymptomatic individuals to episodic pain events referred to as
“crisis” events. Persistent pain is a complex phenomenon of SCD.11 This condition can impact a
variety of organ systems and cause multiple different disease-related complications. 2
Individuals with SCD are frequently seen in Emergency Departments and hospitals for their pain
episodes.
Symptoms associated with Sickle cell disease:
Pain is seen in the form of vaso-occlusive episodes and can be observed in individuals as
young as 6 months of age. 2; 12 Vasocclusion is an unpredictable ischemic event that occurs when
the sickled RBCs block blood vessels. They can be frequent, severe and last from a few hours to
weeks. 11; 13
Some of the complications associated with SCD include Acute Chest Syndrome (ACS),
aplastic crisis, acute vaso-occlusive pain, priapism in males, stroke, leg ulcers, splenic
sequestration, susceptibility to serious infections, transfusion related iron overload, retinopathy,
avuncular necrosis of the hip and shoulders, hemolytic anemia, chronic damage to the lungs,
bones and kidneys.1; 3; 9; 14; 15
5
Organ damage often results in other long term disease related outcomes such as delayed
puberty and decreased lung function.11 Infections and lung disease are the leading causes of
death in people with SCD. 1
Sickle cell crisis can be caused by dehydration, exposure to cold, infection and
environments with low oxygen tension. Pain episodes can be acute, chronic or both and are
unpredictable and recurrent. 11
2.2.2 Health Related Quality of Life (HRQOL)
The World Health Organization (WHO) defines health as being not only the absence of disease
and infirmity but also the presence of physical, mental and social well-being. Health related
quality of life (HRQOL) refers to the “physical, psychological and social domains of heath seen
in areas influenced by a person’s experiences, beliefs, expectations and perceptions”. If a person
has a life closer to the standard of normalcy, he/she is said to have better HRQOL. 2 A
comparison of HRQOL in children with SCD and matched controls showed significantly lower
overall HRQOL reported by both the children with SCD and their parents. 2
The relationship between sickle cell complications leading to decreased health related
quality of life has been well documented in both adults and youth with SCD. Sickle cell related
pain events are common manifestations of this condition and are recurrent, acute and
unpredictable. Studies show that more effective management of persistent pain can lead to
improved quality of life in adults with SCD. 2 Fuggle and colleagues demonstrated that sickle
cell pain events are associated with decrements in social and recreational functioning as well as
school attendance for youths with SCD. 16 It is essential to understand the association of pain
with HRQOL to improve pain management and other health related outcomes.16 The
6
hospitalizations and school absences could be expected to have a negative impact in the HRQOL
for children and adolescents with SCD. 2
2.2.3 Public health implications
The HRQOL impairments for youth with SCD are associated with personal and healthcare costs
in pediatric populations.16 Adults living with Sickle cell disease have high rates of
unemployment. Studies propose that the unemployment may be caused by irregular school
attendance that could prevent children from acquiring adequate job skills. Studies display weak
evidence to support direct links between pain severity, SCD symptoms and unemployment. 17
SCD poses to be an enormous financial burden for individuals, families and even third-
party payers. Studies suggest interventions designed to control pain episodes could help avoid
hospitalizations and may help reduce personal and economic burden of the disease. 5 Pain
accounts for around 80% of all hospitalizations for children with SCD. Research shows that pain
is also often managed at home and therefore goes unreported.
The public health issues and policies associated with SCD vary widely by country
according to the population frequency of the relevant genes and the availability of healthcare in
those locations.12

7
2.3 GENETICS AND INHERITANCE
2.3.1 Molecular genetics and pathophysiology
Sickle cell disease was the first genetic disease for which a specific molecular defect in a gene
was identified. It is one of the genetic conditions screened for by the newborn screening program
in the United States. 1
Sickle hemoglobin is produced when the sickle mutation is present in the beta globin
coding gene. This gene is present on chromosome number 11. It is estimated that close to 2
million individuals in the United States has one sickle hemoglobin gene and one normal
hemoglobin gene. They are said to have sickle cell trait.
Sickle cell disease occurs when an individual inherits the gene for sickle hemoglobin
from both parents. Individuals who inherit one sickle hemoglobin gene and one abnormal
hemoglobin gene from the other parent also have sickle cell disease and are said to be
“compound heterozygotes”. There are several genotypes that can cause sickle cell disease,
namely, SS, Sβ0, SC, SD, Sβ+ SOarab1
SCD is used as a broad term to define a group of autosomal recessive disorders. 12 This
condition is characterized by the production of abnormal hemoglobin by the inherited sickle
hemoglobin gene. The genotype of an individual is often seen to have a direct correlation with
the severity of disease. 12

8
2.4 PREVENTION AND MANAGEMENT
2.4.1 Prevention
Preventive approach to genetic conditions involve primary, secondary and tertiary measures.
Primary preventive strategies involve taking measures to prevent the disease from occurring.
They include carrier screening and genetic counseling to encourage informed decision making.
Secondary prevention measures involve early detection and preclinical interventions such as
newborn screening followed by prophylactic treatment of young children. These measures also
include education of parents.
Tertiary prevention measures are developed to minimize the effects of the disease. They
include hydroxyurea therapy, prophylactic transfusions to prevent stroke recurrence, daily folic
acid supplementation to prevent megaloblastic anemia, outpatient administration of analgesics
and hydration for pain control. Efforts to cure sickle cell disease using bone marrow
transplantation or gene therapy are currently being investigated.12
2.4.2 Management and treatment
Treatment of pain episodes involve symptomatic care.10 The current non-specific treatments
involve penicillin prophylaxis, hydroxyurea, pain medications, blood transfusions and
vaccines.11 Management of complications related to sickle cell disease may require
hospitalization or treatment at home, in an ambulatory setting or in the ED. Standard treatments
for acute pain crisis include painkilling medications, hydration and oxygen. 1

9
2.5 HYDROXYUREA
2.5.1 History
Hydroxyurea (HU) was initially synthesized in Germany in the year 1869. Around 50 years ago,
it was used as an anticancer drug to treat myelo-proliferative syndromes, some types of
leukemia, melanoma and ovarian cancer. It was also previously used to treat psoriasis.
The first trial conducted to observe the effects on HU in individuals with SCD was in
1984. Studies revealed increased production of the fetal hemoglobin-containing erythrocytes and
diminished number of sickled erythrocytes in circulation for individuals on this medication. A
HU case-control research study in the 1990s ended early because it clearly showed reduced
number and severity of pain episodes in individuals on HU compared to those on the placebo.
In 1995, a randomized controlled trial for adults with SCD called the Multicenter Study
of Hydroxyurea in Sickle Cell Anemia (MSH trial) found HU significantly reduced the number
of painful events, ACS and transfusions. A nine year follow up to this study showed that HU was
associated with reduction in mortality, minimum side effects, and was safe.10 In 1998, the United
States Food and Drug Administration approved HU for prevention of pain crisis in adults with
SCD. 1
HU is a myelo-suppressive agent. This drug helps increase the level of fetal hemoglobin
present in the blood stream which in turn causes a general increase in the amount of hemoglobin
in the blood stream that decreases the rate of pain crisis events by 50% in adults. 5

10
2.5.2 Drug action and drug use
It often takes 3 to 6 months of treatment for the patient to have a clinical response to HU therapy.
In 2002, NIH published recommendations for HU in children and adults which stated that HU
therapy should be initialized in individuals with “frequent pain episodes”. Preventive methods
for pain are limited and HU is the only drug shown to decrease the frequency of SCD associated
pain events. 10
2.5.3 Drug Efficacy
Drug efficacy can be defined as the therapeutic effect of HU in a controlled setting like a clinical
trial. Response to HU therapy has been seen to vary by haplotype or genotype. HU is the only
drug available for individuals with SCD that can modify disease process. The evidence for this is
strongly observed in adults but is limited in children due to the nature of clinical trials in this
population.1
2.5.4 Drug effectiveness
Drug effectiveness is the therapeutic effect of an intervention as seen or observed in patients in
their usual care setting. Data suggests that specific treatments such as hydroxyurea or stem cell
therapy (SCT) may improve HRQOL in children and adolescents. Ballas and colleagues (2010)
used information collected in the multicenter study of HU in sickle cell anemia to report that HU
improves some aspects of Quality of Life (QOL) in adult patients who have moderate to severe
sickle cell anemia.2
11
Many studies indicate strong evidence to support HU’s role in reducing frequency of
hospitalization in children with SCD and moderate evidence to show its role in decreasing the
frequency of pain events. 5
An issue faced when determining effectiveness is that precise estimates of the number of
people with sickle cell disease in the United States and the number of people receiving HU
treatment is lacking. Another concern that plays a role in determining effectiveness of HU is the
adherence to medication. Although data on the effectiveness of HU treatment in individuals with
SCD is limited, it appears to be highly effective but underutilized. 1
2.5.5 Cost effective
The results from a multicenter study of HU in individuals with SCD shows that adult patients
treated with HU had a 44% decrease in hospitalizations compared to those taking placebo. This
translated into cost savings for individuals in HU and suggests that HU therapy is cost effective.5
2.5.6 Short and long term effects
Leukopenia, thrombocytopenia and anemia are frequent and expected short term effects of HU
therapy that usually resolve within 1 to 2 weeks. They can be anticipated and prevented by
discontinuing HU treatment. Skin rash and pneumonitis are infrequently observed short term
effects of HU therapy. Nausea is infrequently observed with this treatment and there is no
evidence to suggest that this side effect is related to HU. Temporarily decreased sperm count or
sperm abnormalities have been observed in this population but have not been sufficiently
evaluated.
12
Side effects that have been infrequently associated with HU use include skin and nail
darkening. There is insufficient or low evidence to support the association of increased risk for
superficial skin cancer and permanently decreased sperm count with this treatment.
HU when taken during pregnancy can increase risk for miscarriage, birth defects,
restricted fetal growth or postnatal development. There is limited research available about this
and the NIH Consensus statement observes that sexually active couple should avoid pregnancy if
they are on HU.
2.6 CONCERNS WITH NON ADHRENCE
Although Hydroxyurea has been established as an important therapeutic option, research shows
that HU is underutilized in patients with SCD.
Patel et al. (2010) determined that in a cohort of children with SCD on HU, patients were
only partially adherent to HU based on their medication refill records and therefore did not
receive the full benefits of the medication. 4 Another research study reported 4% non-adherence
in 17 patients who were started on HU. In two large clinical trials, it was observed that 10% to
20% of children stopped taking HU due to non-adherence.
Some issues about the use of HU include concerns about overall safety and effectiveness
of drug. Researchers have found that 70% of patients who were candidates for HU were either
not prescribed the medication or were not taking the medication. 5

13
2.6.1 Effect of poor adherence
Pharmacotherapy can have a range of benefits including symptom reduction, preservation of
physical function and improving quality of life. However the effectiveness of any medication
depends on the patient’s adherence to the treatment regimen. Poor adherence can limit the
benefits of treatment, leading to decreased efficacy, greater adverse effects potential, disease
relapse, increased medical expenditure and decreased quality of life. 18
Poor adherence can contribute to substantial worsening of disease and increased
healthcare costs. Due to this, it is essential to identify specific patients who are at increased risk
for non-adherence. 4
2.7 BARRIERS TO ADHERENCE
Barriers to HU treatment can arise at 4 levels – patient, provider, caregiver and system. The NIH
consensus states that there have been no interventions performed to address such barriers. 1 The
most common provider reported barrier is compliance. A survey of pediatric hematologists
identified that medication compliance, laboratory monitoring compliance and contraception
compliance as major barriers from the physician. 8 Providers reported that the most common
reasons for patient’s refusal of HU included fear of cancer and other side effects, not wanting to
take medication, not wanting lab monitoring and patient’s perception that the drug would not
work. 10
14
3.0 SPECIFIC AIMS
This study has three specific aims:
1. To determine patient reported barriers to adherence of hydroxyurea for individuals with
Sickle Cell Disease
2. To determine the patient reported treatment satisfaction of hydroxyurea therapy in Sickle
Cell Disease
3. To determine any correlation between patient-reported barriers to Hydroxyurea and
satisfaction with medication
15
4.0 STUDY DESIGN AND METHODS
4.1 PROJECT DEVELOPMENT
This project was conducted in collaboration with the “Patient Centered Comprehensive
Medication Adherence Management System to Improve Effectiveness of Disease Modifying
Therapy with Hydroxyurea in Patients with Sickle Cell Disease” Study (also called Mobile DOT
study). The Mobile DOT Study was funded by the Patient Centered Outcome Research Institute
(PCORI) and is a two year research study that aims to improve adherence to Hydroxyurea in the
Sickle Cell population using individualized structured interventions. This study was approved by
the University of Pittsburgh IRB and began recruiting participants in February 2014. It is being
conducted in three different sites – University of Pittsburgh Medical Center Hospitals, Children’s
Healthcare of Atlanta and Children’s National Medical Center. The Mobile DOT study was
reviewed and approved by the Institutional Review Boards of all three Universities (Please refer
Appendix A for IRB approval).
This project was designed as a sub-study to analyze the patient reported barriers to
adherence and treatment satisfaction of hydroxyurea. The surveys used in this project were
administered as part of the baseline questionnaires in all three participating sites.

16
4.2 PARTICIPANT POPULATION
4.2.1 Description of study population
The participants for this study were recruited from pediatric and adult sickle cell patients who
received care from the sickle cell programs at the University of Pittsburgh Medical Center
Hospitals, Children’s National Medical Center and Children’s Healthcare of Atlanta. The
participant population consists of male and female patients who were evaluated at one of the
above clinics to determine eligibility as compared to the inclusion/ exclusion criteria. Patients
with SCD were eligible if they have Hemoglobin SS, SC, SßD, Sß0, Sß0-Arab or Sß+ disease, were
greater than two years of age, had been prescribed Hydroxyurea for greater than six months and
were willing and able to participate in the intervention for the Mobile DOT study. Unwillingness
to participate in the intervention for the Mobile DOT study was a criterion for exclusion from
this study.
4.2.2 Patient recruitment
The multidisciplinary care team at the sickle cell clinics assisted in identifying individuals
currently on Hydroxyurea for at least six months as prospective subjects for the study. The
prospective adult participants and the parent/legal guardian of the pediatric participants were
mailed a notification of the study. They were also approached directly at clinical appointments
about the study by either the investigators or research staff. Prospective participants and their
parent/legal guardian as applicable received an explanation of the study, were offer the
opportunity to enroll in the study.

17
A member of the research team provided an introduction/ review of the research study,
including potential risks and benefits, protocol procedures and research team expectations.
Patients and/or parent/legal guardian were encouraged to ask questions. All prospective
participants were informed about the voluntary nature of the study and that they can withdraw
from the study at any time. Consent was obtained from participants 18 years or older, and from a
parent/legal guardian for participants under 18 years of age. Assent was obtained from all minors
whenever possible. A copy of the signed consent was offered to all participants, as well as
parent/ legal guardian as applicable.
4.3 SURVEYS
Patients who consented to be a part of the study received the following surveys during a
scheduled clinical visit.
4.3.1 Adherence Starts with Knowledge (ASK-12) Survey
The ASK-12 Survey can be used to measure adherence behavior and barriers to treatment
adherence. It is a survey designed to measure and determine the barriers to adherence of a
particular medication. The ASK-12 survey is a validated patient-reported measure of barriers to
medication adherence and adherence-related behavior. It is a generic instrument applicable to
patients regardless of their medical conditions.19 It has also been described as a condensed tool
that offers quick identification of patient specific barriers. The ASK-12 survey was developed by
GlaxoSmithKline in July 2008 and was reported to demonstrate “adequate reliability and

18
validity”.18 Previous studies have determined that ASK-12 is a reliable and valid questionnaire
for assessing patient perceptions of potential barriers to medication adherence and adherence
related behavior. The questions in this survey are designed to address 3 domains or subscales,
namely, inconvenience/forgetfulness (3 items), health beliefs (4 items) and behavior (5 items).
(See Appendix B for survey questions). The ASK-12 Survey contains twelve questions and each
question is scored on a Likert scale ranging from 1 to 5 for each question. The total scores can
range from 12 to 60 with a higher score representing greater barriers to adherence.18
4.3.2 Additional barriers survey
The additional barriers survey was designed to address the barriers specific to hydroxyurea in the
SCD population. This survey was created by the research team at the Children’s Hospital of
Pittsburgh of UPMC in February 2014 to better understand and characterize the hydroxyurea
specific barriers previously reported in this patient population. The ASK-12 survey is a validated
tool to look at adherence barriers to any medication while the additional barriers survey was
designed to address barriers that are not present in the former survey. This survey contains ten
questions that focus on issues specific to hydroxyurea that were determined after reviewing the
literature. (See Appendix B for survey questions). This survey tool was created as part of the
Mobile DOT study and has not been used before and is not a validated tool.
The survey questions are unique to different aspects influenced by Hydroxyurea
consumption and are analyzed individually. Answers to each question were scored from 1 to 5
based on a 5-point Likert scale similar to the ASK-12 Survey (“Strongly agree”, “Agree”,
“Neutral”, “Disagree” and “Strongly Disagree”).
19
4.3.3 Treatment Satisfaction of Medication Adherence (TSQM-9)
The TSQM survey was designed to evaluate and compare patients’ satisfaction with a given
medication.20 Previous studies with this survey use it to compare medication adherence and
treatment satisfaction. In this study, we use the TSQM-9 to measure the participant’s satisfaction
with hydroxyurea. This questionnaire was created by Quintiles in 2004 and modified to the
current version in 2009. Several versions of the TSQM surveys have been validated and the
TSQM-9 was reported as a validated measure in the article “Validation of an abbreviated
Treatment Satisfaction Questionnaire for Medication (TSQM-9) among patients on
antihypertensive medication” in April 2009. The survey is described as “a reliable and valid
measure to assess treatment satisfaction in naturalistic study designs”.20 It has been reported that
patient satisfaction with their medication is shown to affect treatment-related behavior such as
likelihood to continue using medication, use medication correctly and adherence to medication
regimens.21 The questions in the TSQM survey are designed to address 3 domains or subscales –
Effectiveness (3 items), Convenience (3 items) and Global Satisfaction (3 items). (See Appendix
B for survey questions). Each question is scored on a scale of 1 to 5 or on a scale of 1 to 7 using
a Likert scale system. The questions are grouped into domains and each domain is scored on a
scale of 0 to 100 with higher score indicating higher satisfaction.15
4.3.4 Survey types
Each of the above surveys were designed to be administered to adults and pediatric participants.
The survey was adapted to be eligible to be administered to caregivers of pediatric participants.

20
4.4 DATA COLLECTION AND ANALYSIS
4.4.1 Data handling and storage
The surveys were administered as paper questionnaires to the participants during their regular
clinical visits at each of the three sites. The completed surveys were uploaded onto a secure
online server by a member of the research team. This server was developed and maintained by
Data Warehouse Consultants.
The survey data was extracted from the online secure database on May 15th 2015 as an
excel file. The data was exported to Minitab® 16 statistical software for analyses.
4.4.2 Data cleaning and scoring
The responses to all surveys were coded using the data coding function in the Minitab® 16
software. The ASK-12 and TSQM-9 surveys were coded as described in the literature.15; 18; 20; 22;
23 The additional barriers survey were created mirroring the style of the ASK-12 survey. Thus
data coding and analysis of this survey was performed similar to the ASK-12 data.
The responses to the ASK-12 survey and additional barriers survey were coded on a
Likert scale from 1 to 5 with a higher score indicating higher barriers (Appendix B). Raw scores
were used for questions numbered 1 to 3 and 8 to 12. Reverse scores were used for questions
numbered 4 to 7 in the ASK-12 Survey. Raw scores were used for questions numbered 13 to 16
and 18 to 22 in the additional barriers survey. The reverse score was used for question number 17
in the additional barriers survey.
21
The responses to the TSQM-9 survey were coded on a Likert scale with a higher score
indicating higher satisfaction with hydroxyurea. Questions numbered 1 to 6 and question number
9 were coded on a scale of 1-7. Questions numbered 7 and 8 were coded on a scale of 1 to 5.
Raw scores were used for all TSQM-9 survey responses.
Surveys completed by two participants from Children’s Healthcare of Atlanta and one
participant from Children’s National Medical Center were disregarded as each participant
attempted only one of the above two surveys.
4.4.3 Analytical methods for specific aim 1
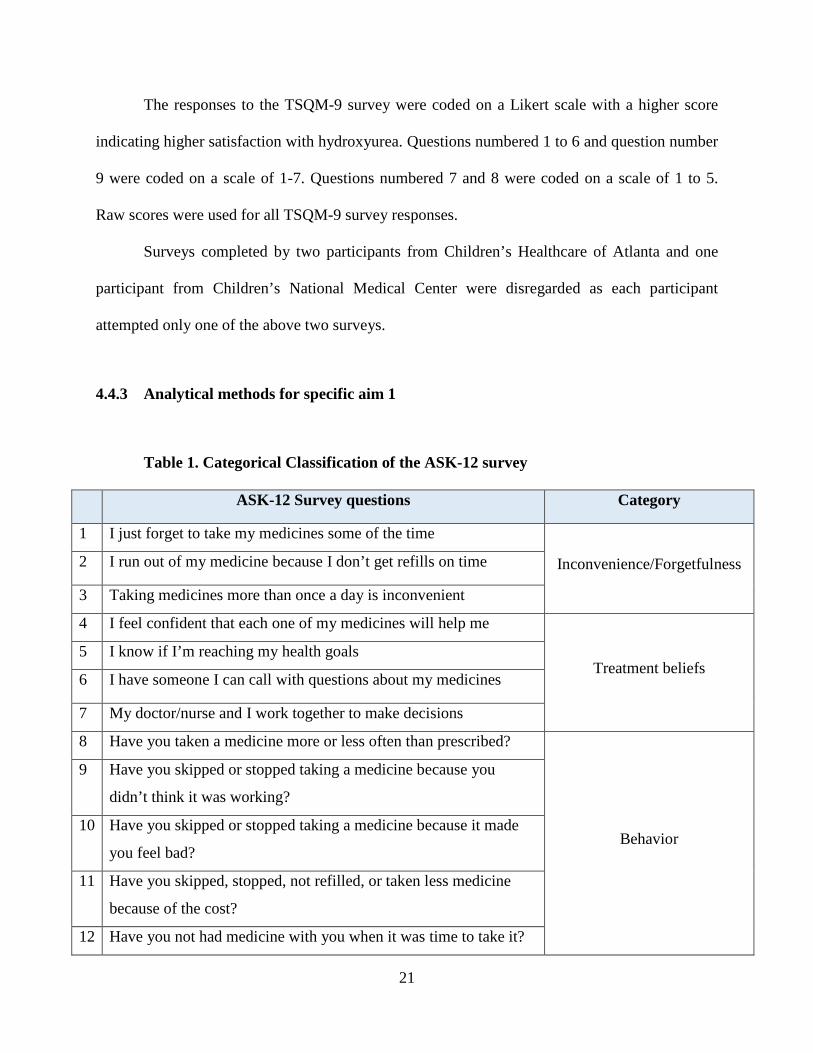
Table 1. Categorical Classification of the ASK-12 survey
ASK-12 Survey questions Category
1 I just forget to take my medicines some of the time
Inconvenience/Forgetfulness 2 I run out of my medicine because I don’t get refills on time
3 Taking medicines more than once a day is inconvenient
4 I feel confident that each one of my medicines will help me
Treatment beliefs 5 I know if I’m reaching my health goals
6 I have someone I can call with questions about my medicines
7 My doctor/nurse and I work together to make decisions
8 Have you taken a medicine more or less often than prescribed?
Behavior
9 Have you skipped or stopped taking a medicine because you
didn’t think it was working?
10 Have you skipped or stopped taking a medicine because it made
you feel bad?
11 Have you skipped, stopped, not refilled, or taken less medicine
because of the cost?
12 Have you not had medicine with you when it was time to take it?

22
The ASK-12 survey and additional barriers survey were analyzed separately. The ASK-
12 survey questions were divided into 3 main categories – inconvenience/forgetfulness, health
beliefs and behavior based on instructions from validated literature.18; 23 Table 1 displays the
categorical classification of the ASK-12 questionnaire.
The additional barriers survey were divided into 4 categories – side effects, difficulty,
transportation and follow up. Table 2 displays the categorical classification of additional barriers
questionnaire.
Table 2. Categorical Classification of Additional Barriers Survey
Additional Barriers Survey Questions Category
1 I do not like taking Hydroxyurea because I have to get monthly blood draws
Side effects
2 It is hard for me to get to monthly clinical visits because of my schedule
Difficulty
3 It is hard for me to get refills of Hydroxyurea from the pharmacy on time
Difficulty
4 I am afraid Hydroxyurea will cause me to gain weight or lose my hair
Side effects
5 There is a someone who keeps track of my Hydroxyurea schedule
Follow up
6 It is difficult to take hydroxyurea at a regular time because of my work or school schedule
Difficulty
7 It is difficult to get time off from work or school to attend doctor’s appointments
Difficulty
8 I cannot arrange transportation to go to clinic visits Transportation
9 I do not like to take Hydroxyurea because I am worried about how it will affect my fertility
Side effects
10 I do not like to take Hydroxyurea because I am worried about how it will affect me in the long term.
Side effects
Graphical representation of ASK-12 survey subsets and individual additional barriers
questions was performed to visually represent the survey responses. Interpretation of graphical
23
data was performed whenever possible. Multiple regression analyses was performed with site of
survey administration and participant type as predictors. This was used to check for significant
differences in all subsets of ASK-12 and additional barriers survey based on location of survey
administration or type of survey participant (Adult, caregiver or pediatric participant). The above
analyses was performed with a critical level of significance of P<0.05 for each survey. General
descriptive statistics such as mean, standard deviation and median were determined for each
survey subset.
4.4.4 Analytical methods for specific aim 2
The TSQM-9 survey questions were divided into 3 main subsets – effectiveness, convenience
and global satisfaction based on instructions from previous literature.15; 20; 22 Table 3 displays the
categorical classification of TSQM-9 questionnaire.
Graphical representation of TSQM-9 survey responses was constructed for each survey
subset to visually represent survey responses. Multiple regression analyses was performed with
site of survey administration and participant type as predictors. The above analyses was
performed to check for significant differences in the subsets of TSQM-9 survey based on the
location of survey administration and the type of participant (adult, caregiver or pediatric)
responding to the surveys. Analyses were performed with a critical level of significance of
P<0.05. General descriptive statistics such as the mean, standard deviation and median was
determined for each survey subset.
24
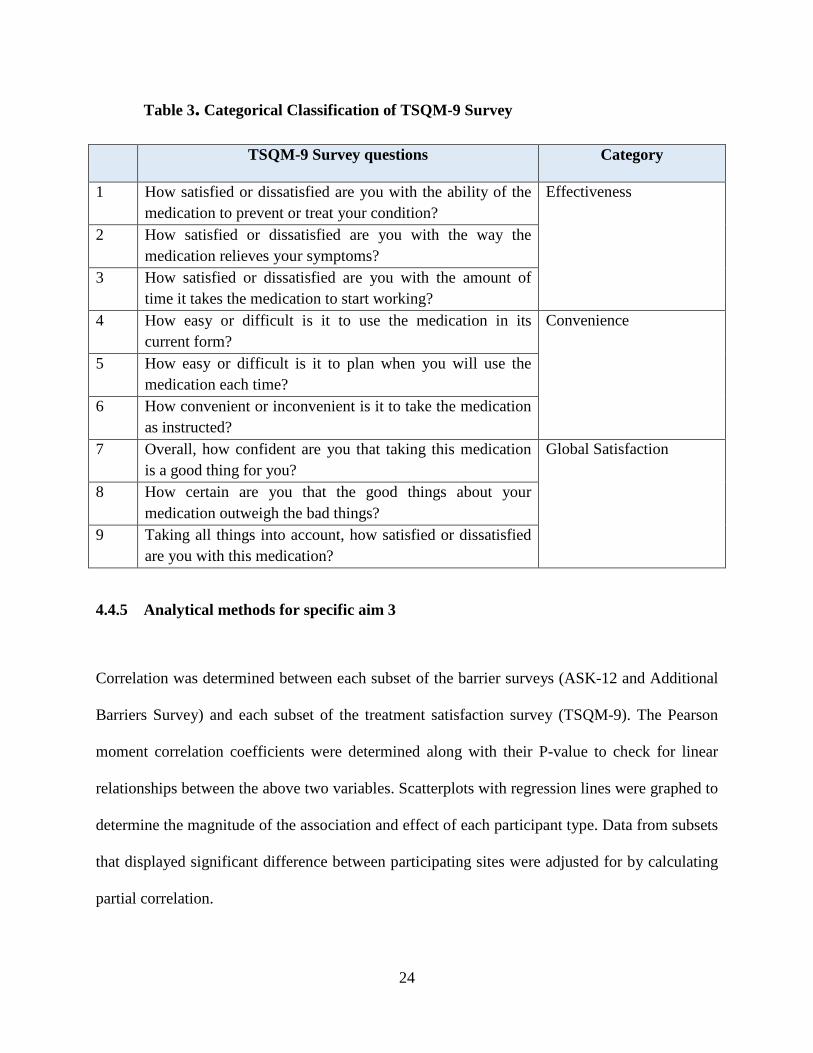
Table 3. Categorical Classification of TSQM-9 Survey
TSQM-9 Survey questions Category
1 How satisfied or dissatisfied are you with the ability of the medication to prevent or treat your condition?
Effectiveness
2 How satisfied or dissatisfied are you with the way the medication relieves your symptoms?
3 How satisfied or dissatisfied are you with the amount of time it takes the medication to start working?
4 How easy or difficult is it to use the medication in its current form?
Convenience
5 How easy or difficult is it to plan when you will use the medication each time?
6 How convenient or inconvenient is it to take the medication as instructed?
7 Overall, how confident are you that taking this medication is a good thing for you?
Global Satisfaction
8 How certain are you that the good things about your medication outweigh the bad things?
9 Taking all things into account, how satisfied or dissatisfied are you with this medication?
4.4.5 Analytical methods for specific aim 3
Correlation was determined between each subset of the barrier surveys (ASK-12 and Additional
Barriers Survey) and each subset of the treatment satisfaction survey (TSQM-9). The Pearson
moment correlation coefficients were determined along with their P-value to check for linear
relationships between the above two variables. Scatterplots with regression lines were graphed to
determine the magnitude of the association and effect of each participant type. Data from subsets
that displayed significant difference between participating sites were adjusted for by calculating
partial correlation.

25
5.0 RESULTS
5.1 DEMOGRAPHICS
A total of 152 participants took part in this study. Three participants did not attempt both surveys
and were removed from the analysis. Responses from the remaining 149 participants were used
in the analyses and interpretation of survey data. The Children’s National Medical Center in
Washington obtained surveys only from adults and did not have any pediatric or caregiver
participants. The University of Pittsburgh Medical Centers and the Children’s HealthCare of
Atlanta had all three types of participants.
Table 4. Enrollment Data and Demographics
Site Name Site Number
Number of Adult
Participants
Number of Pediatric
Participants
Number of Caregiver
Participants
Site Total N (%)
University of Pittsburgh Medical
Centers
1 21 12 15 48 (32.2 %)
Children’s Healthcare of Atlanta
4 6 36 40 82(55.0 %)
Children’s National Medical Center, Washington DC
3 19 - - 19 (12.7 %)
TOTAL N (%)
46 (30.8 %) 48 (32.2 %) 55 (36.9 %) 149
26
Table 4 displays the classification of participants based on location of survey
administration and type of participant. Out of the 149 total participants, 48 (32.21%) completed
the surveys at the University of Pittsburgh Medical Centers and 82 (55.03%) took the survey at
Children’s Healthcare of Atlanta. Of all participating individuals, 48 (32.87%) were minors (<17
years of age) at the time of survey administration. 55 participants (36.91%) were caregiver
participants of minors with SCD. The caregiver participant data and pediatric participant data
were not paired in this study.

27
5.2 BARRIERS TO ADHERENCE
5.2.1 Distribution of ASK-12 and additional barriers survey responses
ParticipantTypeASK12Inconvenience
PediatricCaregiverAdult*15131211109876543*15131211109876543*15131211109876543
14
12
10
8
6
4
2
0
Num
ber o
f ind
ivid
uals
111
3
5
6
7
4
10
3
0
2
5
2
00
2
4
1
3
4
3
14
4
5
13
0
1
0
3
66
5
10
6
4
3
0
2
Bar chart - ASK-12 Inconvenience by participant type
ASK-12 Inconvenience subscale value
Figure 1. Bar chart - ASK-12 Inconvenience
Figure 1 displays the number of individuals who responded to each value of the ASK-12
inconvenience subset. An ASK-12 subset value >12 represents a high barrier score. 11
individuals scored >12 for this subscale which indicates that around 7% of the study population
considered issues related to inconvenience a barrier to consumption of hydroxyurea. Out of the
11 individuals, there are 2 are caregiver responses, 4 adult responses and 5 pediatric responses.
28
ParticipantType
ASK12TreatmentBeliefs
PediatricCaregiverAdult
*16151413121110987654*16151413121110987654*16151413121110987654
25
20
15
10
5
0
Nu
mb
er o
f in
div
idu
als
21111
2
0
3
7766
1
10
00011
21
34
3
55
7
23
0001
0011
9
11
78
3
5
Bar chart - ASK-12 treatment beliefs by participant type
ASK-12 treatment beliefs subscale value
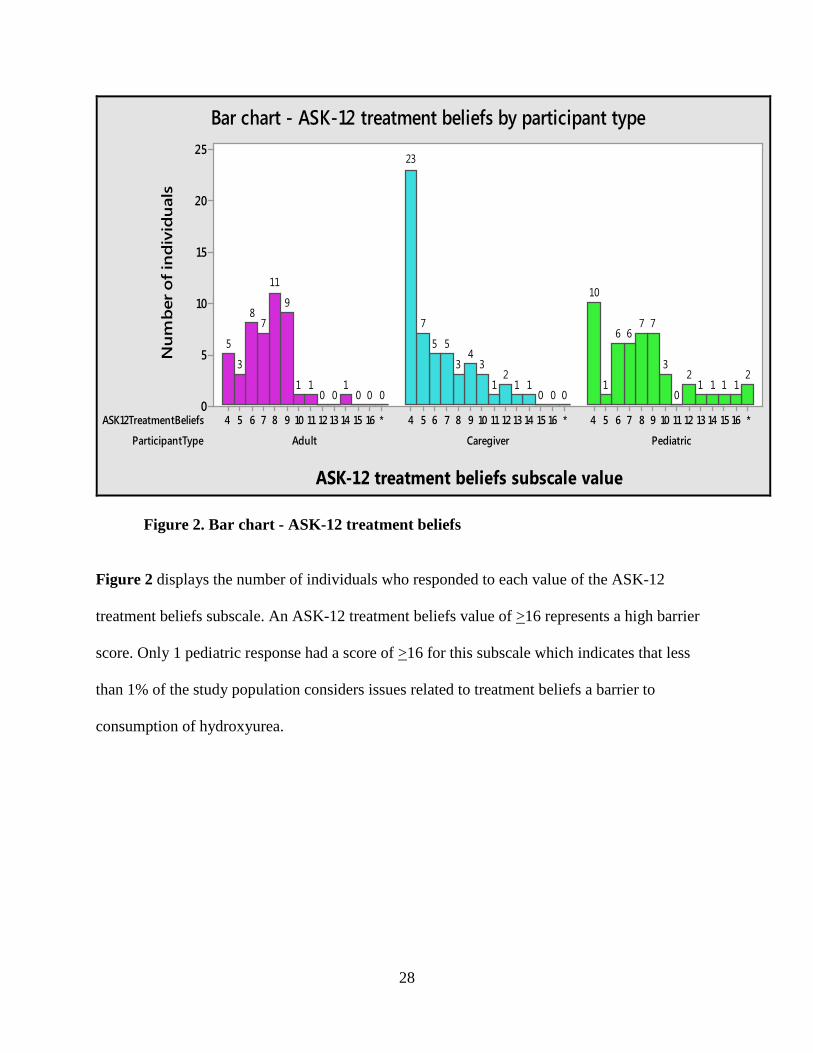
Figure 2. Bar chart - ASK-12 treatment beliefs
Figure 2 displays the number of individuals who responded to each value of the ASK-12
treatment beliefs subscale. An ASK-12 treatment beliefs value of >16 represents a high barrier
score. Only 1 pediatric response had a score of >16 for this subscale which indicates that less
than 1% of the study population considers issues related to treatment beliefs a barrier to
consumption of hydroxyurea.

29
ParticipantTypeASK12Behavior
PediatricCaregiverAdult*2521201615141312111098765*2521201615141312111098765*2521201615141312111098765
30
25
20
15
10
5
0
Num
ber
of in
divi
dual
s
0011
0
223
0
33
8
5
0
4
16
1100000
112
1
45
4
7
28
00001
0
2
4
66555
2
4
6
Bar chart - ASK-12 behavior
ASK-12 behavior subscale value
Figure 3. Bar chart - ASK-12 behavior
Figure 3 displays the number of individuals who responded to each value of the ASK-12
behavior subscale. An ASK-12 behavior subscale value of >20 represents a high barrier score. 3
individuals scored >20 for this subscale which indicates that around 2% of the study population
considers issues related to behavior to be a barrier to consumption of Hydroxyurea. Out of the 3
individuals 1 is a caregiver response and 2 are pediatric responses.
The number of individuals experiencing barriers to adherence of HU appears to be low in
this population.

30
ParticipantType PNoLikeHydroxyBloodDra
PediatricCaregiverAdult*54321*54321*54321
40
30
20
10
0
Num
ber o
f ind
ivid
uals
0
445
13
22
1102
15
36
002
3
2021
Additional barriers side effects subscale - Monthly blood draw
Response scale ParticipantType
rHydroxyWeightHairPediatricCaregiverAdult
*54321*54321*54321
30
25
20
15
10
5
0
Num
ber o
f ind
ivid
uals
12
1
6
11
27
10
78
14
25
0
33
6
12
22
Additional barriers side effects subscale - gain weight and lose hair
Response scale
ParticipantType TakeHydroxyFertilit
PediatricCaregiverAdult*54321*54321*54321
25
20
15
10
5
0
Num
ber o
f ind
ividu
als
111
5
15
25
10
3
6
2223
10
3
7
21
14
Additional barriers side effects subscale - effect on fertility
Response scale ParticipantType
eHydroxyLongAffePediatricCaregiverAdult
*54321*54321*54321
25
20
15
10
5
0
Num
ber o
f ind
ividu
als
0
22
7
12
25
1
32
10
16
23
0
23
9
1616
Additional barriers side effects subscale - Long term effects
Response scale Figure 4. Additional barriers survey side effects subscale responses

31
ParticipantType oTakeHydroxySchedule
PediatricCaregiverAdult*54321*54321*54321
30
25
20
15
10
5
0
Num
ber o
f ind
iv idu
als
01
66
14
21
11
6
3
17
27
00
9
7
14
16
Additional barriers difficulty subscale - HU intake hard due to schedule
Response scale ParticipantType
NoApptTimeOffPediatricCaregiverAdult
*54321*54321*54321
20
15
10
5
0
Num
ber o
f ind
ivid
uals
00
3
6
1920
21
4
9
18
21
00
67
18
15
Additional barriers difficulty subscale - Time off to attend appointments
Response scale
ParticipantType oHydroxyHardToRefill
PediatricCaregiverAdult*54321*54321*54321
35
30
25
20
15
10
5
0
Num
ber o
f ind
ividu
als
02
3
8
14
21
10
3
0
20
31
000
6
18
22
Additional barriers difficulty subscale - Hard to get refills
Response scale icipantType
itDueSchedPediatricCaregiverAdult
*54321*54321*54321
25
20
15
10
5
0
Num
ber o
f ind
ivid
uals
00
4
1111
22
112
7
19
25
01
5
9
17
14
Additional barriers difficulty subscale - Monthly visits
Response scale Figure 5. Additional barriers survey difficulty subscale responses
32
ParticipantType tHelpHydroxySchedul
PediatricCaregiverAdult*54321*54321*54321
25
20
15
10
5
0
Num
ber o
f ind
ivid
uals
0
6
4
6
10
22
2
9
6
4
21
13
0
12
10
7
98
Additional barriers follow up subscale - Someone keeps track of HU
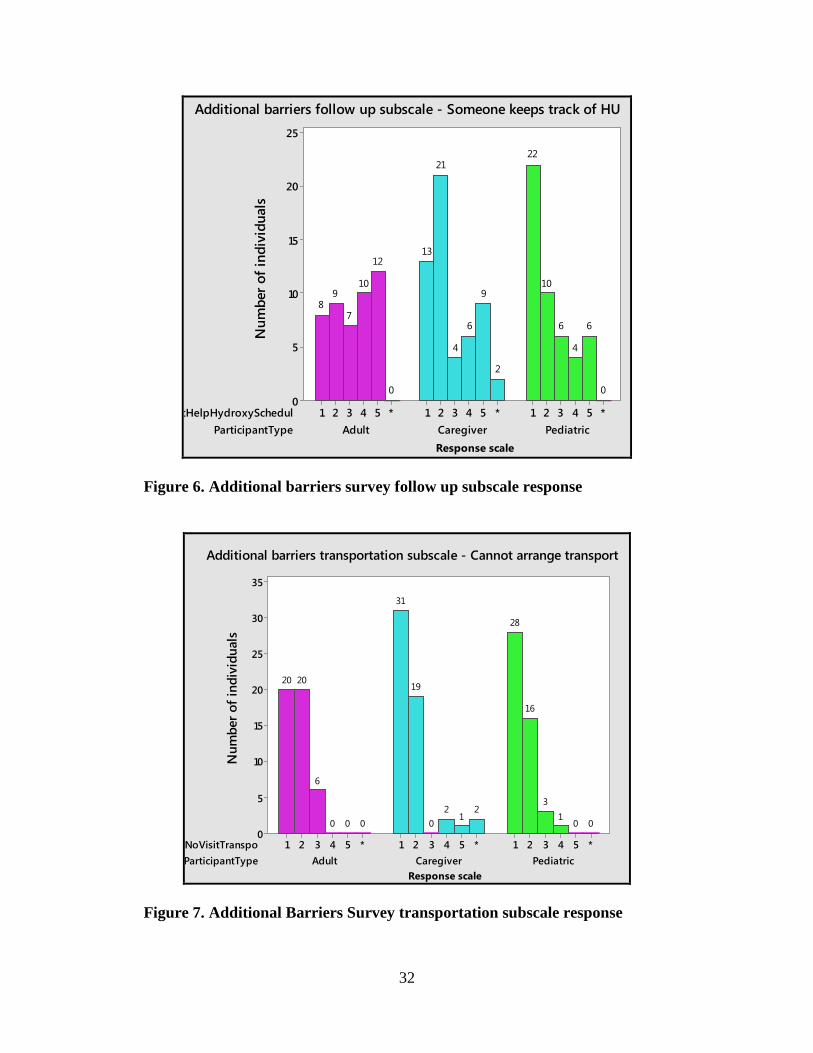
Response scale Figure 6. Additional barriers survey follow up subscale response
ParticipantType PNoVisitTranspo
PediatricCaregiverAdult*54321*54321*54321
35
30
25
20
15
10
5
0
Num
ber o
f ind
ivid
uals
001
3
16
28
21
20
19
31
000
6
2020
Additional barriers transportation subscale - Cannot arrange transport
Response scale Figure 7. Additional Barriers Survey transportation subscale response

33
Figures 4, 5, 6 and 7 are graphical representations of responses to the additional barriers survey
questions in this study population. Table 5 shows the number of individuals who scored >4 for
each question. The observation of above data shows that an increased number of individuals
have reported higher level of barriers for questions of this survey compared to the ASK-12
survey.
Table 5 indicates two questions in the additional barriers survey show a larger number of
individuals reporting increased level of barriers. The statement “There is a someone who keeps
track of my hydroxyurea schedule” was reported as a high level of barrier by 47 individuals
(33%). This finding is difficult to interpret in adults with SCD due to the phrasing of question,
which may have confused adult participants. However, in the pediatric and caregiver
populations, it is possible that this question is still applicable because most pediatric patients
have a caregiver to assist them with medication management and refills. Therefore, this may
represent a true barrier in these two groups.
“It is difficult to take HU at a regular time because of my work or school schedule” is
another question that 23 individuals (15%) reported as a high level of barrier. This could indicate
that scheduling a specific time for HU intake may be a challenge for individuals. “I cannot
arrange transportation to go to clinic visits” yielded a much lower number of individuals
reporting this as a high level barrier compared to previous literature. 24; 25

34
Table 5. Number of responses - Additional barriers survey
Additional Barriers Survey Questions N
1 I do not like taking Hydroxyurea because I have to get
monthly blood draws
11
2 It is hard for me to get to monthly clinical visits because of
my schedule
13
3 It is hard for me to get refills of Hydroxyurea from the
pharmacy on time
8
4 I am afraid Hydroxyurea will cause me to gain weight or
lose my hair
16
5 There is a someone who keeps track of my Hydroxyurea
schedule
47
6 It is difficult to take hydroxyurea at a regular time because
of my work or school schedule
23
7 It is difficult to get time off from work or school to attend
doctor’s appointments
14
8 I cannot arrange transportation to go to clinic visits 4
9 I do not like to take Hydroxyurea because I am worried
about how it will affect my fertility
8
10 I do not like to take Hydroxyurea because I am worried
about how it will affect me in the long term.
14
5.2.2 Regression analysis
A multiple regression analysis was performed to investigate the relationship between the survey
responses and its association with two predictors – site of survey administration and participant

35
type. The model compared survey responses to each predictor independent of the other predictor.
The least squares estimation fit regression model was used to perform a multiple regression
analysis with each survey subset as the continuous response variable and survey site and
participant type as categorical predictor variables. Significance is determined by establishing
P<0.05 for entire survey which would translate into P<0.013 for each survey subset to counteract
multiple comparisons using Bonferroni correction.
In the tables describing the results of the regression analyses, Coef refers to the beta
coefficient of the analysis (change in the response variable caused by a unit change in the
predictor variable), SEcoeff refers to the standard error of this coefficient and the T value refers
to the test statistic.
The P-value for estimated coefficients between all three sites is greater than the
established α level of 0.013 for the ASK-12 survey subsets and the additional barriers survey
subsets. We observed no significant difference between the survey responses based on the
location of survey administration for any subset of ASK-12 and additional barriers surveys.
Table 6. Results of Simple Regression for ASK-12 Survey and Participant type
ASK-12 Inconvenience Term Coef SEcoef T value P-value Adult and Caregiver -2.349 0.690 -0.3.41 0.001* Pediatric and Caregiver 2.129 0.538 3.96 0.000* Adult and Pediatric -0.220 0.708 -0.31 0.756
ASK-12 Treatment Beliefs Term Coef SEcoef T value P-value Adult and Caregiver -0.920 0.673 -0.37 0.174 Pediatric and Caregiver 1.415 0.524 2.7 0.008* Adult and Pediatric 0.495 0.698 0.71 0.4791
ASK-12 Behavior Term Coef SEcoef T value P-value Adult and Caregiver -2.122 0.878 -2.42 0.017 Pediatric and Caregiver 1.884 0.674 2.79 0.006* Adult and Pediatric -0.238 0.896 -0.27 0.790
36
Table 6 displays the results of regression analyses between each subset of the ASK-12
survey and type of participant attempting the survey. The P-values for estimated coefficients
between adult and pediatric participants are greater than the established α level of 0.013 for all
three categories. This implies there is no significant relationship between adult and pediatric
participant’s response to all three ASK-12 categories.
The P-value for the coefficients between the pediatric and caregiver participants are
consistently less than 0.013 for each subset. We conclude from this information that there is a
difference between the ASK-12 survey responses by the caregivers and the pediatric participants
to all three survey categories. This finding could indicate that caregivers’ understanding of
barriers experienced by the pediatric population could be different. This finding could also be a
representation of a difference in barriers expressed by adolescents who independently consume
medication and their caregivers’ understanding of these barriers.
When examining the relationship between adults and caregivers based on survey
response, we see that the P-value of the coefficient in the inconvenience subset is 0.001. This
result suggests a difference in response between adults and caregivers in the inconvenience
category of the ASK-12 survey. No significant relationship was seen between adults and
caregivers in the treatment beliefs and behavior categories of the ASK-12 survey.
To summarize, there appears to be an association between the participant type and certain
subsets of the ASK-12 survey.

37
Table 7. Results of Regression for Additional Barriers Survey and Participant Type
HU Side Effects Term Coef SEcoef T value P-value Adult and Caregiver -0.123 0.783 -0.16 0.876 Pediatric and Caregiver 0.081 0.613 0.13 0.894 Adult and Pediatric -0.041 0.806 -0.05 0.959
HU Difficulty Term Coef SEcoef T value P-value Adult and Caregiver -1.302 0.709 -1.84 0.069 Pediatric and Caregiver 0.599 0.551 1.09 0.279 Adult and Pediatric -0.703 0.727 -0.97 0.335
HU Transportation Term Coef SEcoef T value P-value Adult and Caregiver -0.279 0.195 -1.43 0.154 Pediatric and Caregiver -0.027 0.151 -0.18 0.858 Adult and Pediatric -0.306 0.200 -1.53 0.128
HU Follow Up Term Coef SEcoef T value P-value Adult and Caregiver -0.942 0.367 -2.57 0.011** Pediatric and Caregiver -0.355 0.285 -1.25 0.215 Adult and Pediatric -1.297 0.376 -3.45 0.001**
Table 7 describes the result of the regression analysis between the additional barriers
survey subsets and the type of participant who attempted the survey. The P-value for estimated
coefficients were all greater than the established α level of 0.013 for three subsets - HU Side
effects, HU difficulty and HU transportation. The above three categories of the Additional
Barriers Survey show no significant relationship with participant type.
The P-value of the coefficient between adult and caregiver responses in the HU follow up
subset showed significance at 0.011 indicating presence of a difference in response between
adults and caregivers to this category of the survey. Additionally, the relationship between
participant type and, pediatric and adult responses showed significance with a P-value of 0.001.
This indicates the presence of a difference between adult and pediatric responses to the follow up
subset of the Additional barriers survey.
38
5.2.3 Descriptive statistics
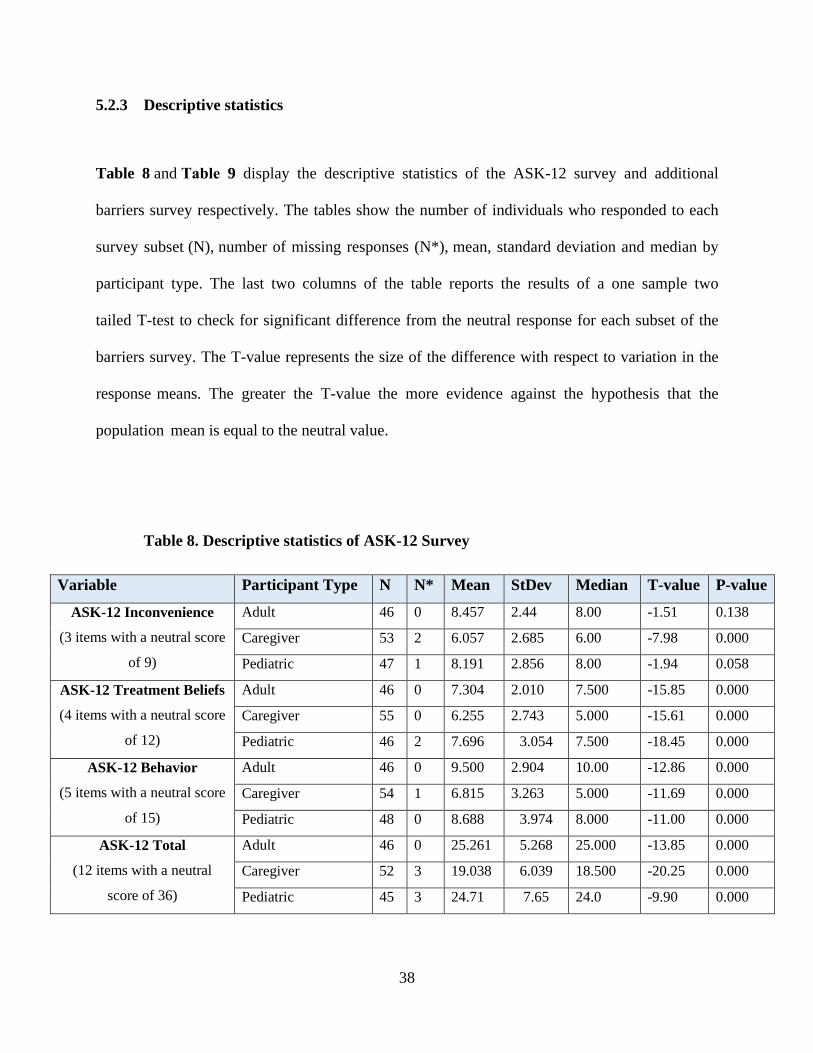
Table 8 and Table 9 display the descriptive statistics of the ASK-12 survey and additional
barriers survey respectively. The tables show the number of individuals who responded to each
survey subset (N), number of missing responses (N*), mean, standard deviation and median by
participant type. The last two columns of the table reports the results of a one sample two
tailed T-test to check for significant difference from the neutral response for each subset of the
barriers survey. The T-value represents the size of the difference with respect to variation in the
response means. The greater the T-value the more evidence against the hypothesis that the
population mean is equal to the neutral value.
Table 8. Descriptive statistics of ASK-12 Survey
Variable Participant Type N N* Mean StDev Median T-value P-value
ASK-12 Inconvenience
(3 items with a neutral score
of 9)
Adult 46 0 8.457 2.44 8.00 -1.51 0.138
Caregiver 53 2 6.057 2.685 6.00 -7.98 0.000
Pediatric 47 1 8.191 2.856 8.00 -1.94 0.058
ASK-12 Treatment Beliefs
(4 items with a neutral score
of 12)
Adult 46 0 7.304 2.010 7.500 -15.85 0.000
Caregiver 55 0 6.255 2.743 5.000 -15.61 0.000
Pediatric 46 2 7.696 3.054 7.500 -18.45 0.000
ASK-12 Behavior
(5 items with a neutral score
of 15)
Adult 46 0 9.500 2.904 10.00 -12.86 0.000
Caregiver 54 1 6.815 3.263 5.000 -11.69 0.000
Pediatric 48 0 8.688 3.974 8.000 -11.00 0.000
ASK-12 Total
(12 items with a neutral
score of 36)
Adult 46 0 25.261 5.268 25.000 -13.85 0.000
Caregiver 52 3 19.038 6.039 18.500 -20.25 0.000
Pediatric 45 3 24.71 7.65 24.0 -9.90 0.000
39
In Table 8, the mean and median of the caregiver response to all three categories of the
ASK-12 survey is lower in comparison to that of adult and pediatric participants. This could
indicate lower barriers with respect to all categories indicated by the caregiver participants. The
inconvenience subset shows that the responses of the adult and pediatric participants are not
significantly different from neutral response but the caregiver response is significantly different
from the neutral value.
The negative T value indicates that the mean of the subscales are lower than the neutral
value. It can be observed from the T-value of each subset that the treatment beliefs subscale has
the most significant difference from the neutral response followed by the behavior subset and
lastly by the inconvenience subscale.
The total ASK-12 responses can be scored from 12 to 60 for all participants. The ASK-
12 total response for adults, caregivers and pediatric participants are 25.261, 19.038 and 24.71
which indicates a low threshold of barriers.
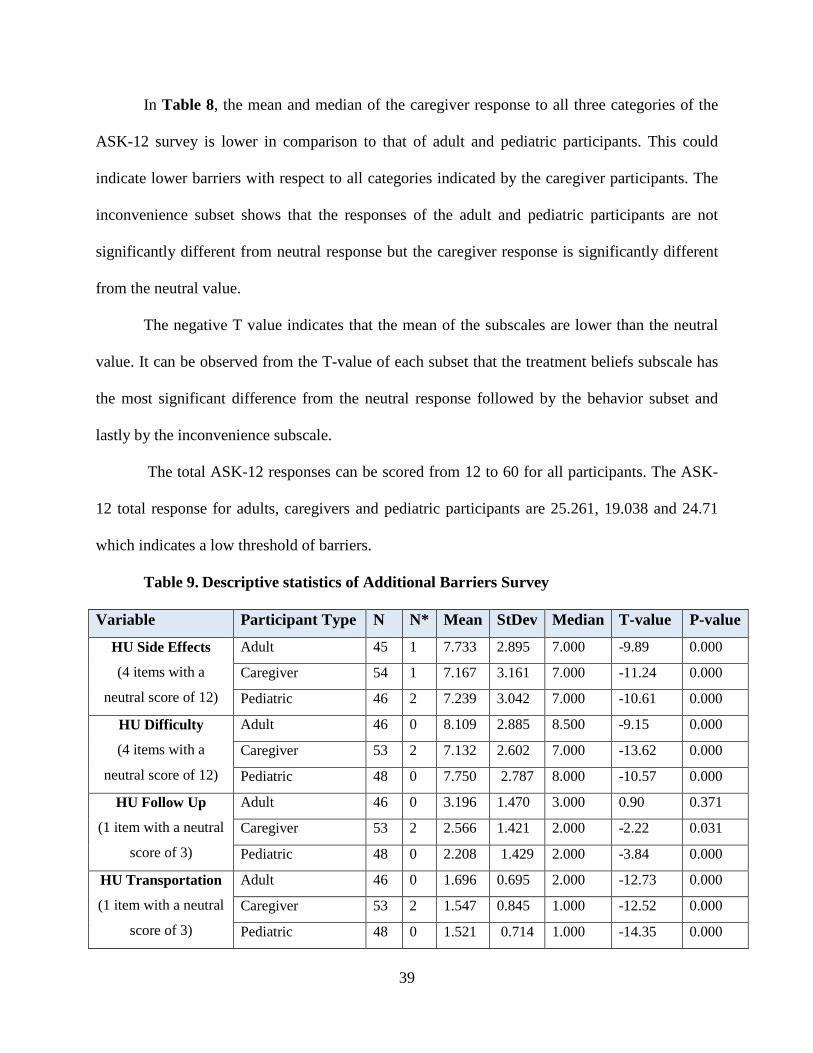
Table 9. Descriptive statistics of Additional Barriers Survey
Variable Participant Type N N* Mean StDev Median T-value P-value
HU Side Effects
(4 items with a
neutral score of 12)
Adult 45 1 7.733 2.895 7.000 -9.89 0.000
Caregiver 54 1 7.167 3.161 7.000 -11.24 0.000
Pediatric 46 2 7.239 3.042 7.000 -10.61 0.000
HU Difficulty
(4 items with a
neutral score of 12)
Adult 46 0 8.109 2.885 8.500 -9.15 0.000
Caregiver 53 2 7.132 2.602 7.000 -13.62 0.000
Pediatric 48 0 7.750 2.787 8.000 -10.57 0.000
HU Follow Up
(1 item with a neutral
score of 3)
Adult 46 0 3.196 1.470 3.000 0.90 0.371
Caregiver 53 2 2.566 1.421 2.000 -2.22 0.031
Pediatric 48 0 2.208 1.429 2.000 -3.84 0.000
HU Transportation
(1 item with a neutral
score of 3)
Adult 46 0 1.696 0.695 2.000 -12.73 0.000
Caregiver 53 2 1.547 0.845 1.000 -12.52 0.000
Pediatric 48 0 1.521 0.714 1.000 -14.35 0.000

40
Table 9 shows the mean and median values for the different types of participants in all
subsets of the additional barriers survey. The value of the T-tests shows significant difference
from the neutral value for three of the four survey subsets. Transportation subset showed the
most significant difference from the neutral value while the side effects and difficulty subscales
appeared to have similar significant differences from the neutral value. The adult and the
caregiver responses appear to have no significant difference from the neutral value for the follow
up category indicating that the responses by the adult and caregivers were not significantly
different from a neutral response.
The negative T-value indicates that the mean of the subscales are lower than the neutral
values. The pediatric participant subset showed presence of a significant difference but the T
value is much lower than the other subsets indicating lesser deviation of the mean from the
neutral response.
41
5.3 TREATMENT SATISFACTION
5.3.1 Distribution of TSQM-9 survey responses
PediatricCaregiverAdult
*10095908580767166615752474238*10095908580767166615752474238*10095908580767166615752474238
10
8
6
4
2
0
Num
ber
of in
divi
dual
s
0
3
1
77
5
4
7
1
5
4
2
11
00
9
5
22
6
9
10
1
4
5
1
00
11
4
0
2
4
3
6
8
3
55
3
11
0
Bar chart - TSQM-9 survey- Effectiveness subset by participant type
TSQM-9 Effectiveness score in Percentage
Figure 8. Bar chart - TSQM-9 effectiveness subset
Figure 8 displays the distribution of responses to the TSQM-9 survey effectiveness
subscale based on participant type. The TSQM-9 subscale values are converted into a numeric
response between 0 and 100. 13% of adults, 29% of caregivers and 22% of pediatric participants
have reported a score >87 for the effectiveness subscale. This indicates that a larger percent of
caregiver participants experienced a higher level of satisfaction compared to pediatric and adult
participants in the effectiveness category of the TSQM-9 survey.

42
PediatricCaregiverAdult
*10095908580767166615752474238*10095908580767166615752474238*10095908580767166615752474238
14
12
10
8
6
4
2
0
Num
ber o
f ind
ivid
uals
2
7
33
12
33
8
22
11
0
1
00
13
5
3
7
6
3
8
5
0
3
00
2
0
1
8
3
2
4
6
1
6
5
3
1
3
111
Bar chart - TSQM-9 Convenience subset by participant type
TSQM-9 Convenience score in percentage Figure 9. Bar chart - TSQM-9 Convenience subset
Figure 9 shows the distribution of the adult, pediatric and caregiver responses to the
TSQM-9 convenience subset. 28% of adults, 38% of caregivers and 27% of pediatric participants
report a score >87 for this subset. This subset also displays a larger percentage of caregiver
participants experiencing higher levels of satisfaction when compared to pediatric and adult
participants.
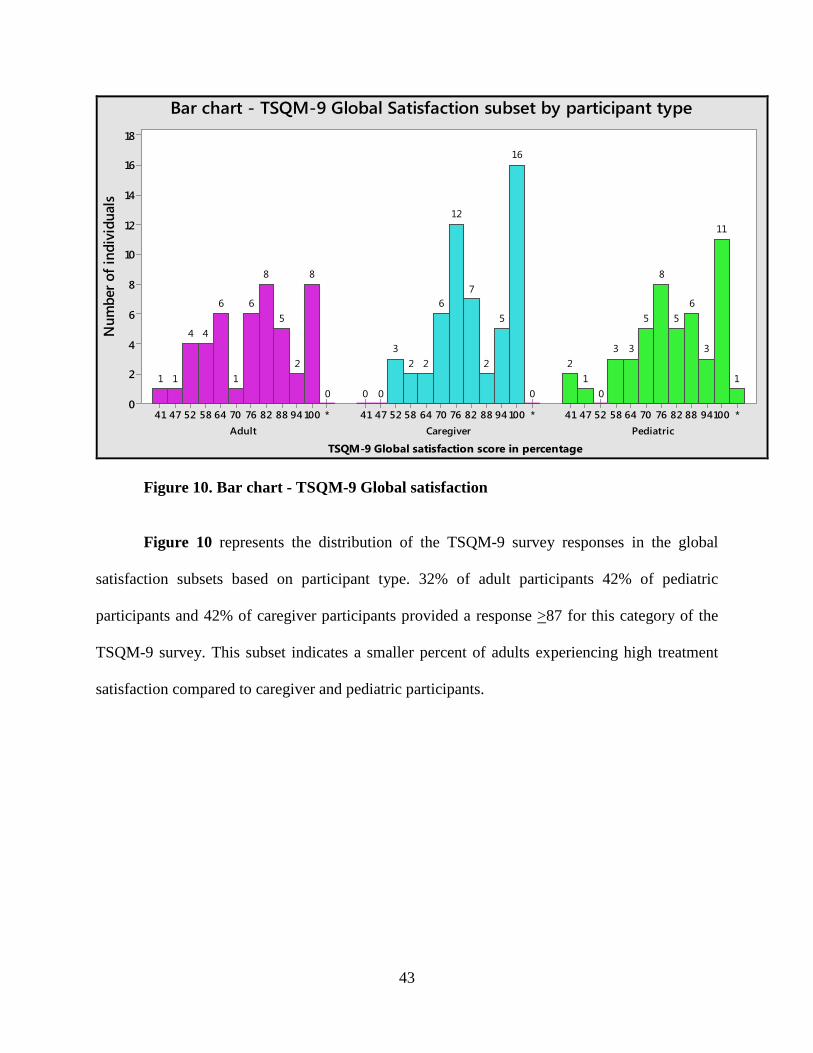
43
PediatricCaregiverAdult*10094888276706458524741*10094888276706458524741*10094888276706458524741
18
16
14
12
10
8
6
4
2
0
Num
ber o
f ind
ivid
uals
1
11
3
65
8
5
33
01
2
0
16
5
2
7
12
6
223
000
8
2
5
8
6
1
6
44
11
Bar chart - TSQM-9 Global Satisfaction subset by participant type
TSQM-9 Global satisfaction score in percentage Figure 10. Bar chart - TSQM-9 Global satisfaction
Figure 10 represents the distribution of the TSQM-9 survey responses in the global
satisfaction subsets based on participant type. 32% of adult participants 42% of pediatric
participants and 42% of caregiver participants provided a response >87 for this category of the
TSQM-9 survey. This subset indicates a smaller percent of adults experiencing high treatment
satisfaction compared to caregiver and pediatric participants.

44
5.3.2 Regression analysis
A multiple regression analysis was performed to investigate the relationship between the TSQM-
9 survey responses and its association with two predictors – Site of survey administration and
participant type.
The results of regression analysis for the subsets of the TSQM-9 survey with participant
type shows no significant difference for any of the three subsets. P-values for estimated
coefficients of all types of participants were greater than the established α level of 0.013. This
implies that all the TSQM-9 survey subsets show no significant relationship with adult, caregiver
or pediatric participants.
Table 10. Results of Regression for TSQM-9 Survey and Participant Sites
TSQM-9 Effectiveness Term Coef SEcoef T value P-value Site 1 and 3 -0.0840 0.0445 -1.89 0.061 Site 1 and 4 0.0107 0.0295 0.36 0.717 Site 3 and 4 0.0947 0.0496 1.91 0.058
TSQM-9 Convenience Term Coef SEcoef T value P-value Site 1 and 3 -0.0751 0.0474 -1.58 0.116 Site 1 and 4 0.0033 0.0315 0.11 0.916 Site 3 and 4 0.0784 0.0529 -1.48 0.141
TSQM-9 Global Satisfaction Term Coef SEcoef T value P-value Site 1 and 3 -0.1270 0.0461 -2.75 0.007** Site 1 and 4 0.0304 0.0311 0.98 0.330 Site 3 and 4 0.1573 0.0516 3.05 0.003**
Table 10 shows the results of regression analysis for the subsets of the TSQM-9 survey
with participant site. P-value for estimated coefficients of all participant sites are greater than the
established α level of 0.013 for the effectiveness and convenience subsets of this survey. This
implies that the two subsets show no significant relationship with participant site.

45
The P-value of the coefficient between site 1 and 3 for the responses of the global
satisfaction shows significance at P=0.007 indicating the presence of a significant difference in
response between Site 1 and Site 3 for this part of the survey. Also, the P-value of Site 3 and 4
show a significant relationship at 0.003. Thus there is a significant difference in responses
between site 3 and 4 as well. The significant difference between site responses could be
explained by the type of participants in each of the sites. Site 3 enrolled only adult participants
while sites 1 and 4 enrolled pediatric, adult and caregiver participants.
5.3.3 Descriptive statistics
Table 11. Descriptive statistics for TSQM-9 survey subsets
Table 11 show the number of individuals who responded to each survey subset (N), number of
missing responses (N*), mean, standard deviation and median by participant type. The last two
columns of the table reports the results of a one sample two tailed T-test to check for significant
difference from the central value for each subset of the TSQM-9.
Variable Participant Type N N* Mean StDev Median T-value P-value
TSQM-9 Effectiveness
(3 items with a central value
of 57.14)
Adult 45 1 70.26 13.96 71.43 6.30 0.000
Caregiver 55 0 78.26 15.14 76.19 10.35 0.000
Pediatric 48 0 77.38 14.45 76.19 9.70 0.000
TSQM-9 Convenience
(3 items with a central value
of 57.14)
Adult 45 1 77.04 16.13 80.95 8.28 0.000
Caregiver 55 0 82.25 15.21 85.71 12.24 0.000
Pediatric 46 2 81.16 15.06 83.33 10.82 0.000
TSQM-9 Global Satisfaction
(3 items with a central value
of 58.82)
Adult 46 0 75.96 16.02 76.47 7.97 0.000
Caregiver 55 0 83.10 14.46 82.35 13.31 0.000
Pediatric 47 1 81.60 16.53 82.35 10.14 0.000
46
The T-test shows all T-values to be positive with significant difference from the central
value. The positive nature of the T-values implies the sample means for all subsets are greater
than the central value. Thus all participants show significantly high treatment satisfaction for all
categories.
The mean for the effectiveness subset of the treatment satisfaction survey is lower for the
adults at 70.26 compared to the caregiver and pediatric means of 78.26 and 77.38. Similarly the
mean for adult participants is lower than the means of the caregiver and pediatric participants for
Convenience and Global Satisfaction subsets. This indicates that adults may experience a lower
level of treatment satisfaction to hydroxyurea compared to the pediatric participants. This is
supported by the lower T-value of adult survey participants compared to the pediatric and
caregiver participant types.
The similar means for all three subsets in pediatric and caregiver category of the surveys
indicate that caregivers may have an accurate understanding of the treatment satisfaction of the
minor under their care.
5.4 CORRELATION BETWEEN BARRIERS AND TREATMENT SATISFACTION
The third aim of this study is to determine the presence of correlation between the subsets of
barriers and the subsets of the treatment satisfaction survey. Correlation between data is obtained
by determining the Pearson Correlation Coefficient. Partial correlation analyses were performed
to adjust specific categories for predictor variables:
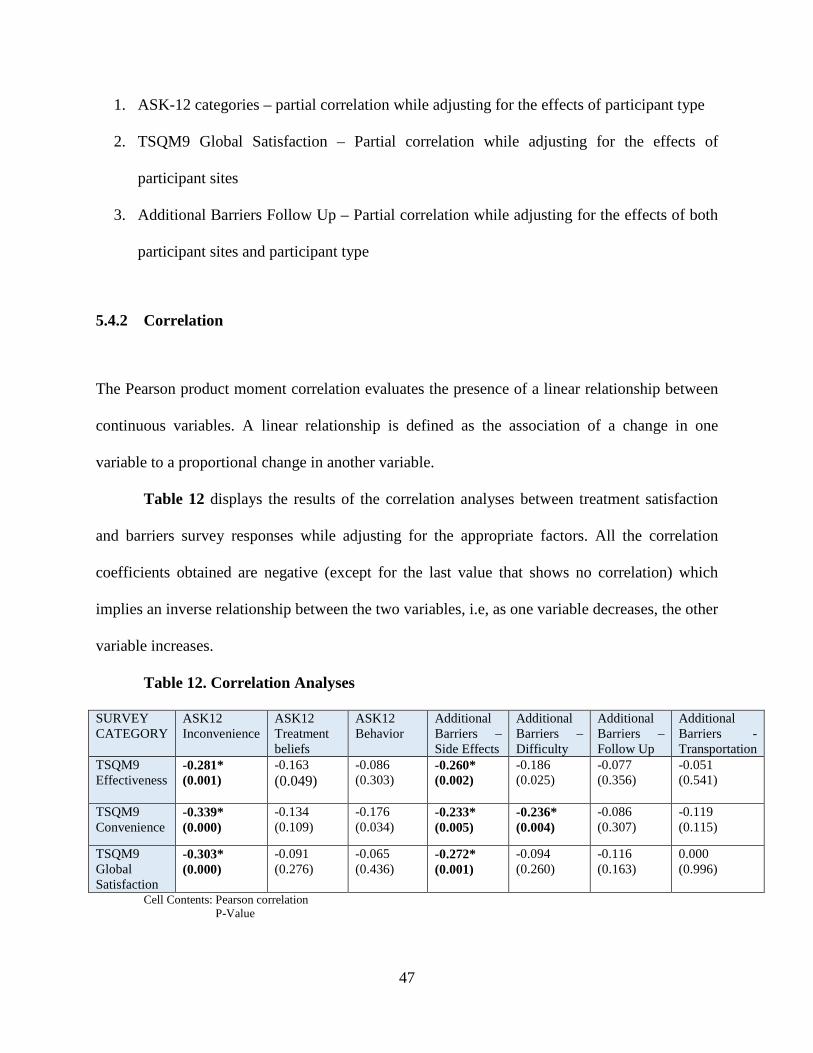
47
1. ASK-12 categories – partial correlation while adjusting for the effects of participant type
2. TSQM9 Global Satisfaction – Partial correlation while adjusting for the effects of
participant sites
3. Additional Barriers Follow Up – Partial correlation while adjusting for the effects of both
participant sites and participant type
5.4.2 Correlation
The Pearson product moment correlation evaluates the presence of a linear relationship between
continuous variables. A linear relationship is defined as the association of a change in one
variable to a proportional change in another variable.
Table 12 displays the results of the correlation analyses between treatment satisfaction
and barriers survey responses while adjusting for the appropriate factors. All the correlation
coefficients obtained are negative (except for the last value that shows no correlation) which
implies an inverse relationship between the two variables, i.e, as one variable decreases, the other
variable increases.
Table 12. Correlation Analyses
SURVEY CATEGORY
ASK12 Inconvenience
ASK12 Treatment beliefs
ASK12 Behavior
Additional Barriers – Side Effects
Additional Barriers – Difficulty
Additional Barriers – Follow Up
Additional Barriers - Transportation
TSQM9 Effectiveness
-0.281* (0.001)
-0.163 (0.049)
-0.086 (0.303)
-0.260* (0.002)
-0.186 (0.025)
-0.077 (0.356)
-0.051 (0.541)
TSQM9 Convenience
-0.339* (0.000)
-0.134 (0.109)
-0.176 (0.034)
-0.233* (0.005)
-0.236* (0.004)
-0.086 (0.307)
-0.119 (0.115)
TSQM9 Global Satisfaction
-0.303* (0.000)
-0.091 (0.276)
-0.065 (0.436)
-0.272* (0.001)
-0.094 (0.260)
-0.116 (0.163)
0.000 (0.996)
Cell Contents: Pearson correlation P-Value
48
There is a weak linear relationship observed between all categories of the TSQM-9
survey and the ASK-12 inconvenience subset. The strongest linear relationship observed is
between the TSQM-9 convenience and ASK-12 inconvenience subset. This indicates that as the
barriers in the inconvenience subset decrease, the treatment satisfaction in the convenience
subscale increases. There is another weak linear relationship observed between all subsets of the
TSQM-9 survey and the side effects subset of the additional barriers survey. This implies that as
the side effects are reduced the treatment satisfaction for hydroxyurea increases. The last weak
linear relationship observed is between the convenience subset of TSQM-9 survey and the
difficulty subset of the Additional barriers survey. This could imply that as the barriers in the
difficult subset are reduced, it improves the convenience of medication use.
5.4.3 Exploring statistical interaction effects
Scatterplots are statistical tools used to display the association between two variables by plotting
the values on a graph. The regression line in scatterplots illustrates the relationship between the
two groups and is graphical representation of the regression equation. A scatterplot with
regression and groups is used to display the association of two variables and plot regression lines
based on a specified categorical group. This type of scatterplot was used to examine the potential
relationship between the barriers subsets and the treatment satisfaction subsets by participant
type. A scatterplot was created between each barriers subset and each treatment satisfaction
subset. The plots were grouped based on participant type to check for any difference between the
association of the two variables for adults, caregivers and pediatric participants.
Ideally, we expect all regression lines for each graph to have similar slopes and therefore
indicating equal contribution to the correlation between the two subsets. This analysis was

49
performed check if a particular participant type influenced the correlation more than the other
two participant types.
Figure 11, Figure 12 and Figure 13 display the scatterplots between the barriers
subsets and treatment satisfaction subsets grouped by participant type. Most of the
scatterplots display regression lines with similar slopes indicating equal contributions by each
participant type to the correlation between the two subsets. However a few graphs show a
difference in slope between participant types which could indicate that one particular group is
driving the correlation with limited contribution from the other two groups. In the scatterplot
between the ASK-12 treatment beliefs barriers subset and global satisfaction subset of TSQM-9,
the regression lines of both the pediatric and adult participants are almost parallel to the X axis
while the caregiver regression line shows a negative slope. This indicates that any correlation
seen between these two subsets is driven by the responses of the caregiver participants. The
same pattern is observed in the scatterplot between the additional barriers difficulty subtype
and convenience subset of TSQM-9, indicating that any correlation observed between the
two subsets is driven by the caregiver participant responses. While there was no
significant correlation observed for the former scatterplot, the latter showed presence of
weak linear correlation. Further analyses is required to provide more concrete interpretation on
this finding which is outside the scope of this project.
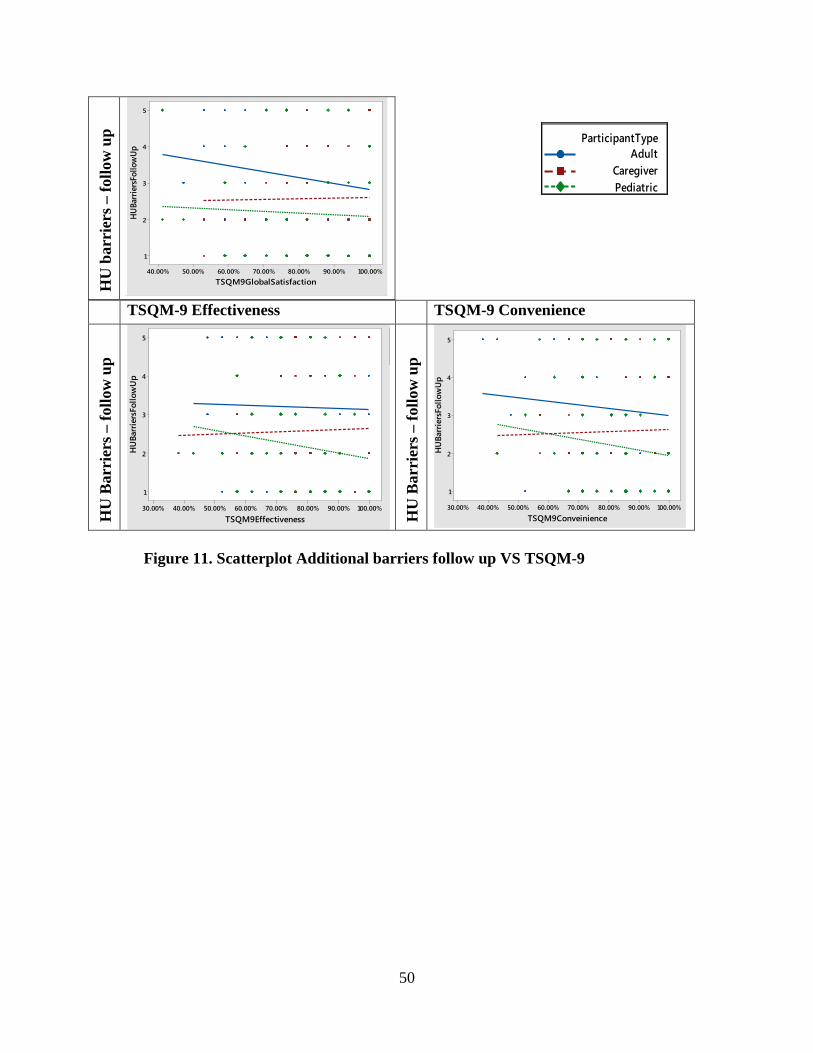
50
TSQM-9 Effectiveness TSQM-9 Convenience
HU
Bar
rier
s – fo
llow
up
100.00%90.00%80.00%70.00%60.00%50.00%40.00%30.00%
5
4
3
2
1
TSQM9Effectiveness
HU
Barr
iers
Follo
wU
p
HU
Bar
rier
s – fo
llow
up
100.00%90.00%80.00%70.00%60.00%50.00%40.00%30.00%
5
4
3
2
1
TSQM9Conveinience
HU
Barr
iers
Follo
wU
p
Figure 11. Scatterplot Additional barriers follow up VS TSQM-9
HU
bar
rier
s – fo
llow
up
100.00%90.00%80.00%70.00%60.00%50.00%40.00%
5
4
3
2
1
TSQM9GlobalSatisfaction
HU
Barr
iers
Follo
wU
p
Adult
CaregiverPediatric
ParticipantType
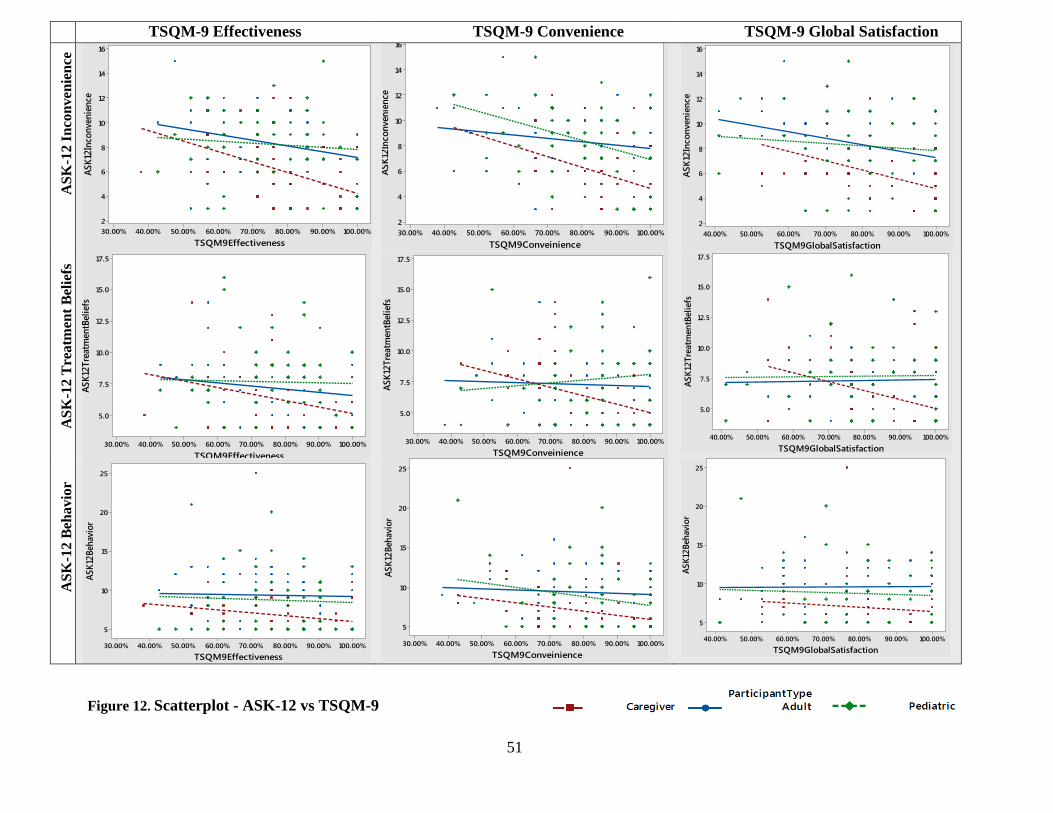
51
TSQM-9 Effectiveness TSQM-9 Convenience TSQM-9 Global Satisfaction
ASK
-12
Inco
nven
ienc
e
100.00%90.00%80.00%70.00%60.00%50.00%40.00%30.00%
16
14
12
10
8
6
4
2
TSQM9Effectiveness
ASK1
2Inc
onve
nien
ce
100.00%90.00%80.00%70.00%60.00%50.00%40.00%30.00%
16
14
12
10
8
6
4
2
TSQM9Conveinience
ASK1
2Inc
onve
nien
ce
100.00%90.00%80.00%70.00%60.00%50.00%40.00%
16
14
12
10
8
6
4
2
TSQM9GlobalSatisfaction
ASK1
2Inc
onve
n ien
ce
ASK
-12
Tre
atm
ent B
elie
fs
100.00%90.00%80.00%70.00%60.00%50.00%40.00%30.00%
17.5
15.0
12.5
10.0
7.5
5.0
TSQM9Effectiveness
ASK1
2Tre
atm
entB
elie
fs
100.00%90.00%80.00%70.00%60.00%50.00%40.00%30.00%
17.5
15.0
12.5
10.0
7.5
5.0
TSQM9Conveinience
ASK1
2Tre
atm
entB
eli e
fs
100.00%90.00%80.00%70.00%60.00%50.00%40.00%
17.5
15.0
12.5
10.0
7.5
5.0
TSQM9GlobalSatisfaction
ASK1
2Tre
atm
entB
e lie
fs
ASK
-12
Beha
vior
100.00%90.00%80.00%70.00%60.00%50.00%40.00%30.00%
25
20
15
10
5
TSQM9Effectiveness
ASK1
2Beh
avio
r
100.00%90.00%80.00%70.00%60.00%50.00%40.00%30.00%
25
20
15
10
5
TSQM9Conveinience
ASK1
2Beh
avio
r
100.00%90.00%80.00%70.00%60.00%50.00%40.00%
25
20
15
10
5
TSQM9GlobalSatisfaction
ASK1
2Beh
avio
r
Figure 12. Scatterplot - ASK-12 vs TSQM-9

52
TSQM-9 Effectiveness TSQM-9 Convenience TSQM-9 Global Satisfaction
HU
Bar
rier
s – S
ide
Effe
cts
100.00%90.00%80.00%70.00%60.00%50.00%40.00%30.00%
17.5
15.0
12.5
10.0
7.5
5.0
TSQM9Effectiveness
HU
Barr
iers
Side
Effe
cts
100.00%90.00%80.00%70.00%60.00%50.00%40.00%30.00%
17.5
15.0
12.5
10.0
7.5
5.0
TSQM9Conveinience
HUBa
rrier
sSid
eEffe
cts
100.00%90.00%80.00%70.00%60.00%50.00%40.00%
17.5
15.0
12.5
10.0
7.5
5.0
TSQM9GlobalSatisfaction
HU
Barr
iers
Side
Effe
cts
HU
bar
rier
s – D
iffic
ulty
100.00%90.00%80.00%70.00%60.00%50.00%40.00%30.00%
15.0
12.5
10.0
7.5
5.0
TSQM9Effectiveness
HU
Barr
iers
Diff
icul
ty
100.00%90.00%80.00%70.00%60.00%50.00%40.00%30.00%
15.0
12.5
10.0
7.5
5.0
TSQM9Conveinience
HUBa
rrier
sDiff
icul
ty
100.00%90.00%80.00%70.00%60.00%50.00%40.00%
15.0
12.5
10.0
7.5
5.0
TSQM9GlobalSatisfaction
HU
Barr
iers
Diff
icul
ty
HU
barr
iers
–tra
nspo
rtat
ion
100.00%90.00%80.00%70.00%60.00%50.00%40.00%30.00%
5
4
3
2
1
TSQM9Effectiveness
HU
Barr
iers
Tran
spor
tatio
n
100.00%90.00%80.00%70.00%60.00%50.00%40.00%30.00%
5
4
3
2
1
TSQM9Conveinience
HUBa
rrier
sTra
nspo
rtatio
n
100.00%90.00%80.00%70.00%60.00%50.00%40.00%
5
4
3
2
1
TSQM9GlobalSatisfaction
HU
Barr
iers
Tran
spor
tatio
n
Figure 13. Scatterplot – Additional Barriers survey vs TSQM-9

53
6.0 DISCUSSION
Sickle cell disease (SCD) is a genetic disorder that is characterized by pain episodes, acute chest
syndrome, splenic sequestration, infection, stroke, aplastic crisis, and priapism. While there are
reports available in the literature on the barriers experienced by this population1; 24; 26, there is
little research that has examined patient reported treatment satisfaction. This study examined
patient reported barriers to adherence of hydroxyurea and patient reported treatment satisfaction.
It also investigated the possible association between barriers and satisfaction.
The first aim of this study was to determine the barriers to adherence of hydroxyurea in
individuals with SCD (self-reported and/or parent proxy for minors). Due to an increased number
of caregiver participants (55) compared to pediatric participants (48), unpaired testing was
performed for all participant types. However, a large proportion of the data contains paired
responses between the caregiver and pediatric participants. The significant difference in
responses of the caregiver and pediatric participants in all three subsets of the ASK-12 survey
indicates the possibility of a difference in perception of barriers experienced by the pediatric
individuals by caregiver and pediatric participant groups. Interestingly, lower barrier means were
found for caregiver participants for all three subsets of the ASK-12 survey when compared to
pediatric and adult participants. Lack of agreement between pediatric and caregiver participants
has been previously observed in literature with respect to other medication.27 It may be important
to consider that caregivers report lower level of barriers because they do not experience the
54
disease themselves. A study comparing caregiver reported barriers for caregivers who are
affected with SCD to caregivers who do not have the disease would help determine if caregiver
bias is a possible cause for this difference. Overall, the number of individuals experiencing
barriers to adherence of hydroxyurea appears to be low in this population. There is no previous
literature outlining quantitative analysis of patient reported barriers to adherence of hydroxyurea
thus limiting the interpretation of this data. 9
The additional barriers survey follow up subset showed several significant results. The
significant difference between the adult responses when compared to both pediatric and
caregiver responses may indicate a difference in perception of medication follow up. This subset
is limited in its interpretation for adults due to the phrasing of the question which may be
confusing for adults (Please refer Table 2 for categorical classification of survey). However, a
high number of caregivers and pediatric participants have also reported this to be a barrier to
adherence encouraging further research to determine the nature of this barrier. Categorical
examination of the ASK-12 survey revealed lower levels of barriers than what has previously
been reported in studies.9 This difference could be due to population bias as we only included
individuals already on hydroxyurea from tertiary care centers. The responses could also be
influenced by reporting bias of caregivers and adults who may wish to provide more socially
acceptable answers.9 15% of individuals reported one question from the difficulty subset - “It is
difficult to take hydroxyurea at a regular time because of my work or school schedule” – to be a
barrier. This indicates that scheduling a specific time for hydroxyurea intake may be a challenge
for individuals. Less than 2% of individuals have expressed transportation to be a barrier to
adherence of hydroxyurea. This result is different from the previous qualitative studies that have
55
often described transportation to be a barrier to use of hydroxyurea24; 25. This could indicate the
presence of patient reporting bias in this population or a population selection bias.
The second aim of the study was to examine treatment satisfaction with the use of
hydroxyurea. Analysis revealed that responses to the global satisfaction category of TSQM-9
survey were influenced by the location of the study participants. This could indicate that
satisfaction may have a geographical influence with individuals from site 3 having a consistently
different satisfaction compared to the other two sites. The presence of only adult participants at
site 3 compared to the three different participant types at the other two sites may also have
played a role in generating this difference. The mean for all three categories of the treatment
satisfaction survey is a lower for the adults compared to the caregiver and pediatric means
indicating that adults may experience a lower level of treatment satisfaction compared to the
other participant types. However, available literature, though limited, show no such relationship
existing in previous studies of medication treatment satisfaction.28 The similar means for all three
categories in pediatric and caregiver category of the surveys indicate that caregivers may have an
accurate understanding of the treatment satisfaction of the minor under their care.
The third aim of the study was to examine any correlation that may exist between the data
from the ASK-12 and additional barriers survey and the treatment satisfaction observed from the
TSQM-9 survey. All the correlation coefficients obtained were negative implying an inverse
association between the two variables. The absence of a strong correlation between any of the
barriers subsets and the treatment satisfaction subset indicates that no single barrier has a strong
effect on treatment satisfaction. A weak linear relationship was observed between all categories
of the TSQM-9 survey and the ASK-12 Inconvenience subset as well as the side effects subset of
the additional barriers survey. This implies that as the side effects and inconvenience barriers are

56
reduced the treatment satisfaction for hydroxyurea increases. This leads to avenues of potential
research that could address fear of side effects to improve treatment satisfaction to hydroxyurea.
Another weak linear relationship was observed between the convenience subscale of TSQM-9
survey and the difficulty subset of the additional barriers survey. This could indicate that as the
barriers in the difficult subset are reduced, it improves the convenience of medication use.
However, the scatterplot of the above two subsets show that the correlation is largely driven by
the caregiver participant population.
6.1 LIMITATIONS
The patient population used in this study was selected based on their use of hydroxyurea.
Therefore, the study sample does not capture the barriers and thoughts of individuals who have
not been offered this drug, who have declined this drug or who have been on the medication for
less than 6 months. Subjective measures of adherence like the ASK-12 survey as well as the
TSQM-9 are subject to potential inaccuracy because they depend on the participant’s memory
and willingness to report poor adherence or low treatment satisfaction.
This study has only examined a linear relationship between the two survey variables.
However other relationships are possible between these variables. Since the Pearson correlation
coefficient is very sensitive to extreme values, a single outlier can change the value of the
correlation coefficient.

57
6.2 FUTURE STUDIES
This study provides a novel quantitative analysis of barriers to adherence of hydroxyurea and
treatment satisfaction to this medication. As part of an ongoing study, this data will help analyze
the barriers expressed by the same population after implementing an intervention for a period of
time. Exploring specific barriers and their relationship to treatment satisfaction will provide
valuable information for clinicians and future studies. Educational interventions that address
individuals’ fear of side effects and difficulty with scheduling medication could potentially
improve medication adherence.
A paired analysis of caregiver and pediatric responses could provide more information on
their perceptions of barriers to medication. This study also brings into question the degree of a
caregiver’s understanding of barriers faced by children with SCD. Another potential avenue for
future research would include qualitative and quantitative analysis of caregivers with this
disorder to explore the ways in which their perceptions may differ from caregivers without SCD.
58
7.0 CONCLUSION
This is the first study that examines patient reported barriers to hydroxyurea and patient reported
treatment satisfaction in adults and pediatric individuals with SCD as well as caregivers of
pediatric individuals with SCD. It offers insight to patients’ understanding of barriers and their
level of satisfaction with medication adherence. The survey results suggest that two specific
questions present in the additional barriers surveys may be examined in greater detail to
understand the role of barriers. Overall, it appears that this study population has low concerns for
barriers and a moderate to high level of treatment satisfaction. The study also provides
information on correlation between the barriers and treatment satisfaction survey. A weak
correlation was found between several subsets of barriers survey and treatment satisfaction
subsets. Further research could define how interventions to these barriers influence the outcomes
of adherence to hydroxyurea.
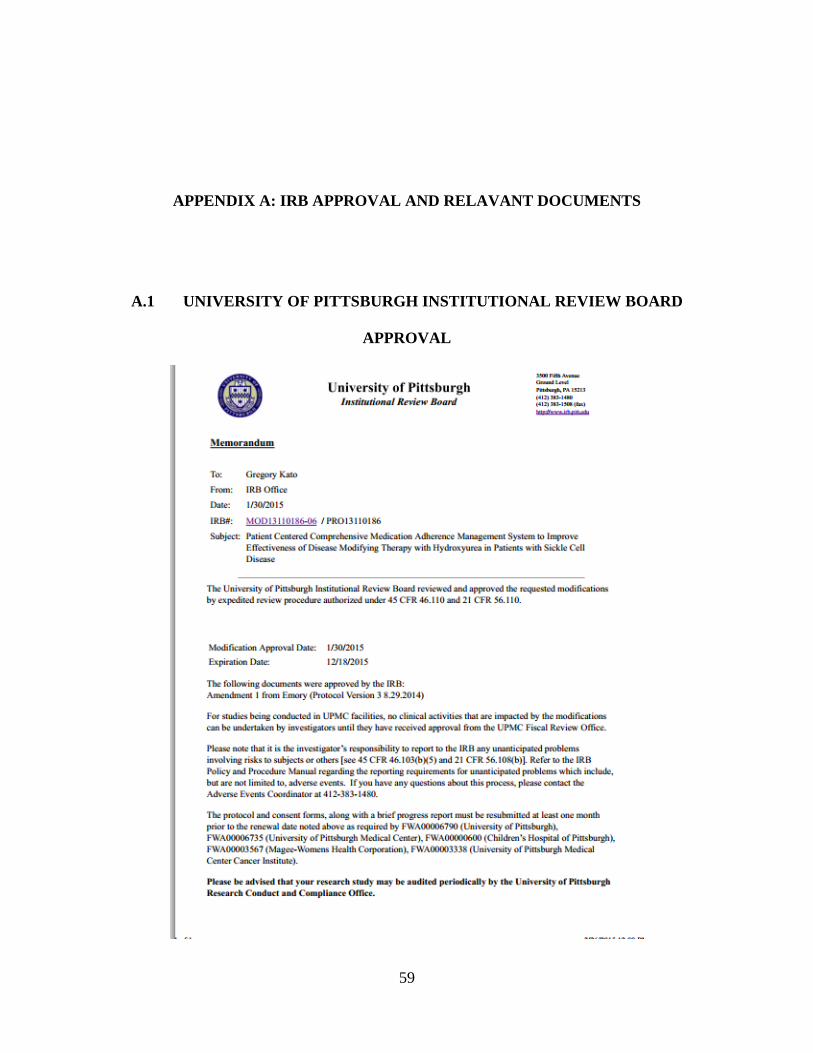
59
APPENDIX A: IRB APPROVAL AND RELAVANT DOCUMENTS
A.1 UNIVERSITY OF PITTSBURGH INSTITUTIONAL REVIEW BOARD
APPROVAL

60
A.2 PERMISSION TO USE ASK-12 SURVEY
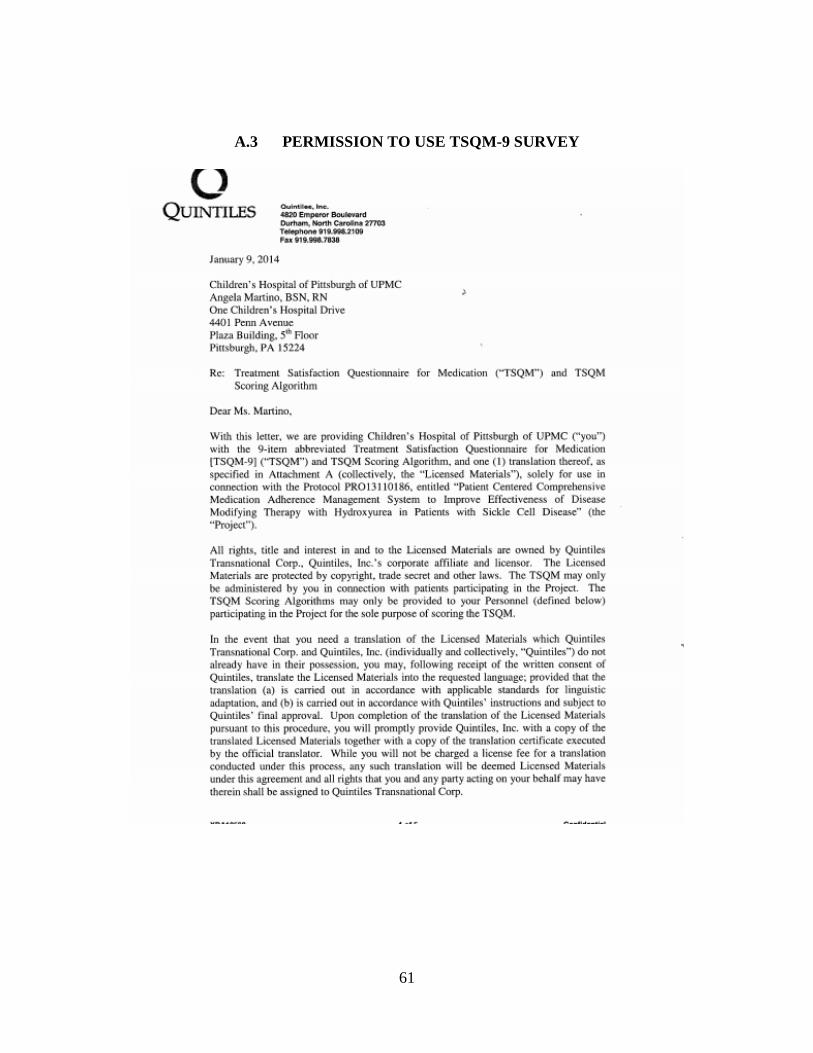
61
A.3 PERMISSION TO USE TSQM-9 SURVEY
62

63
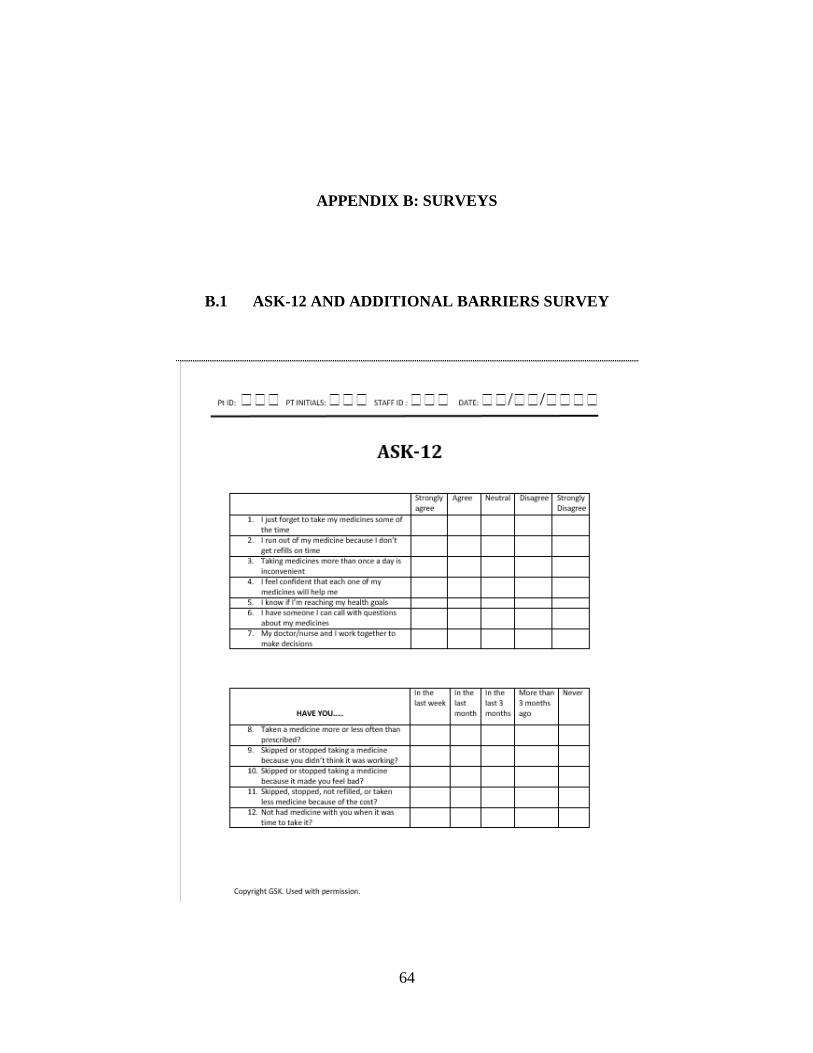
64
APPENDIX B: SURVEYS
B.1 ASK-12 AND ADDITIONAL BARRIERS SURVEY

65

66
B.2 TSQM-9 SURVEY
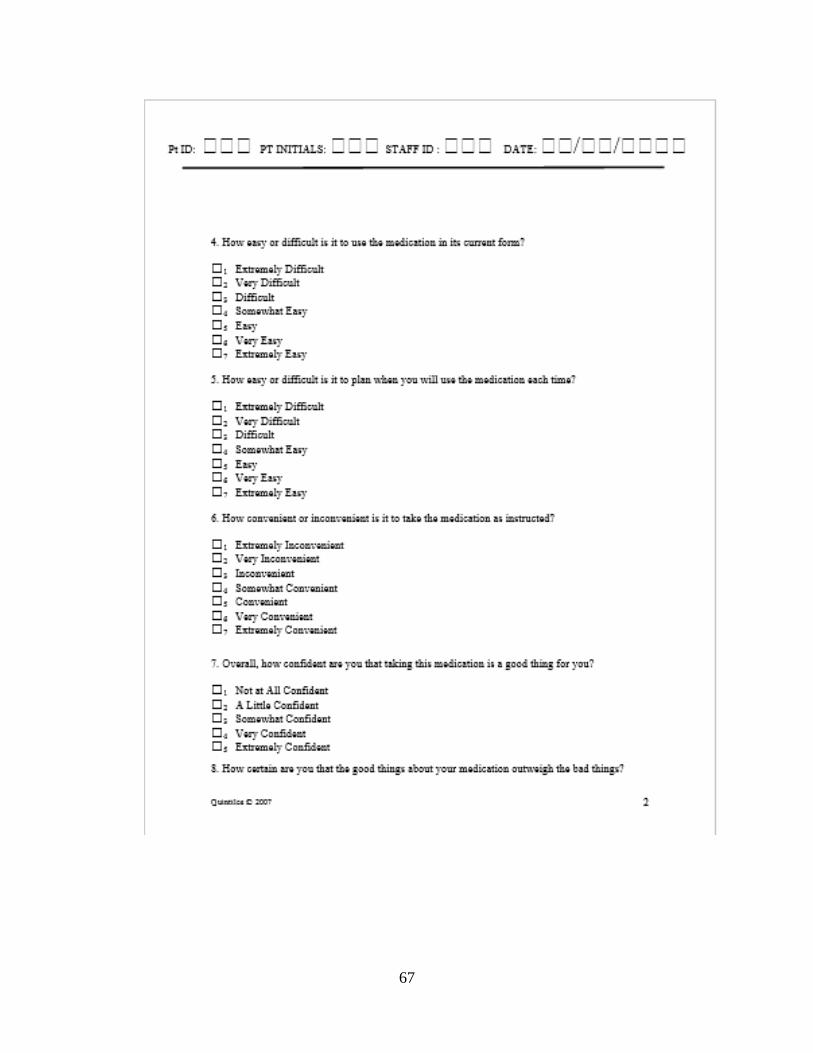
67
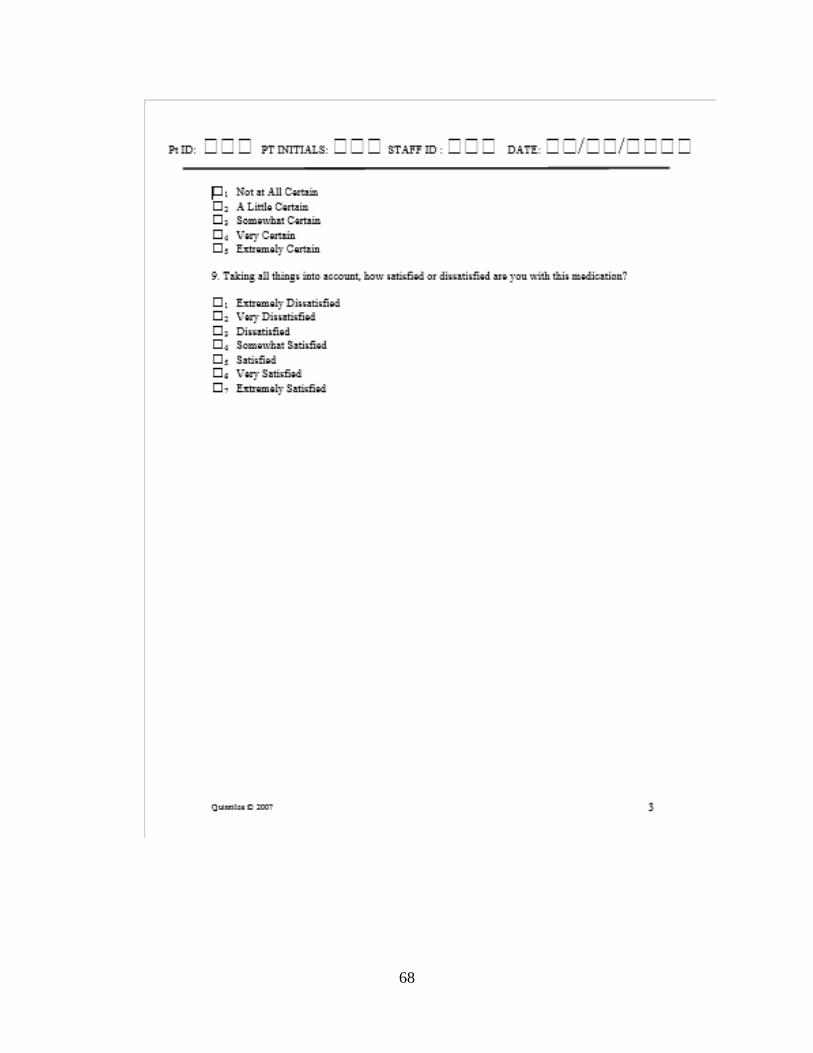
68
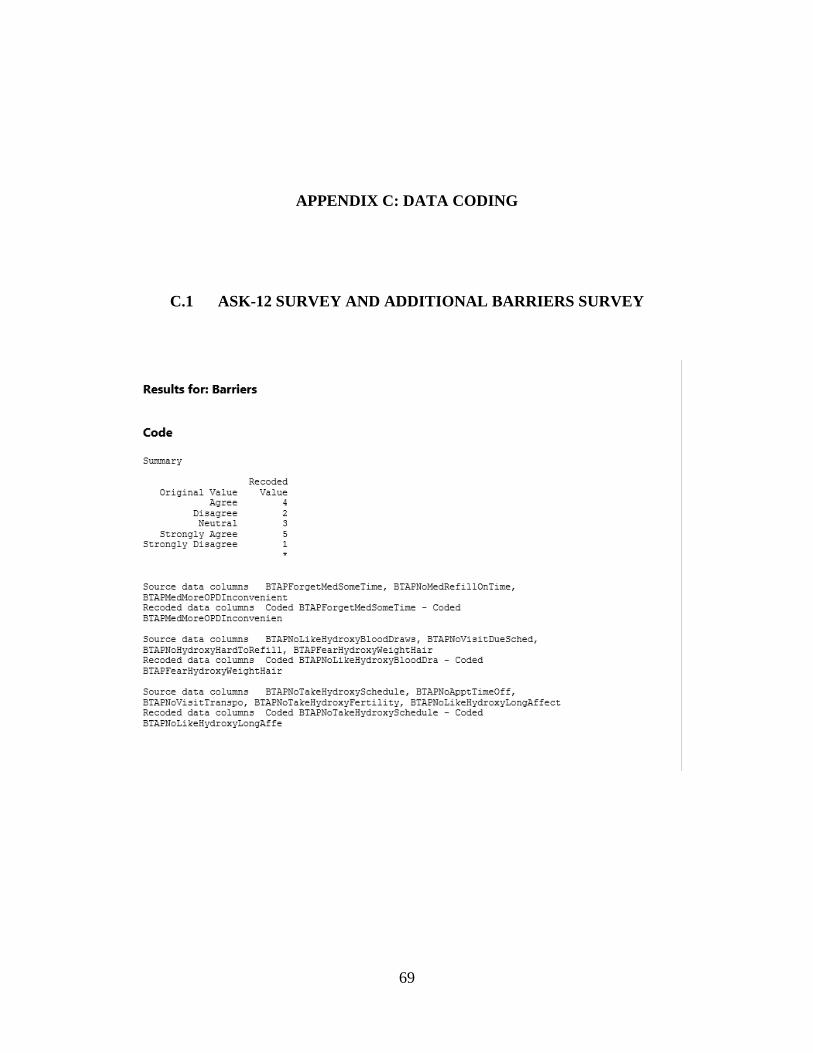
69
APPENDIX C: DATA CODING
C.1 ASK-12 SURVEY AND ADDITIONAL BARRIERS SURVEY
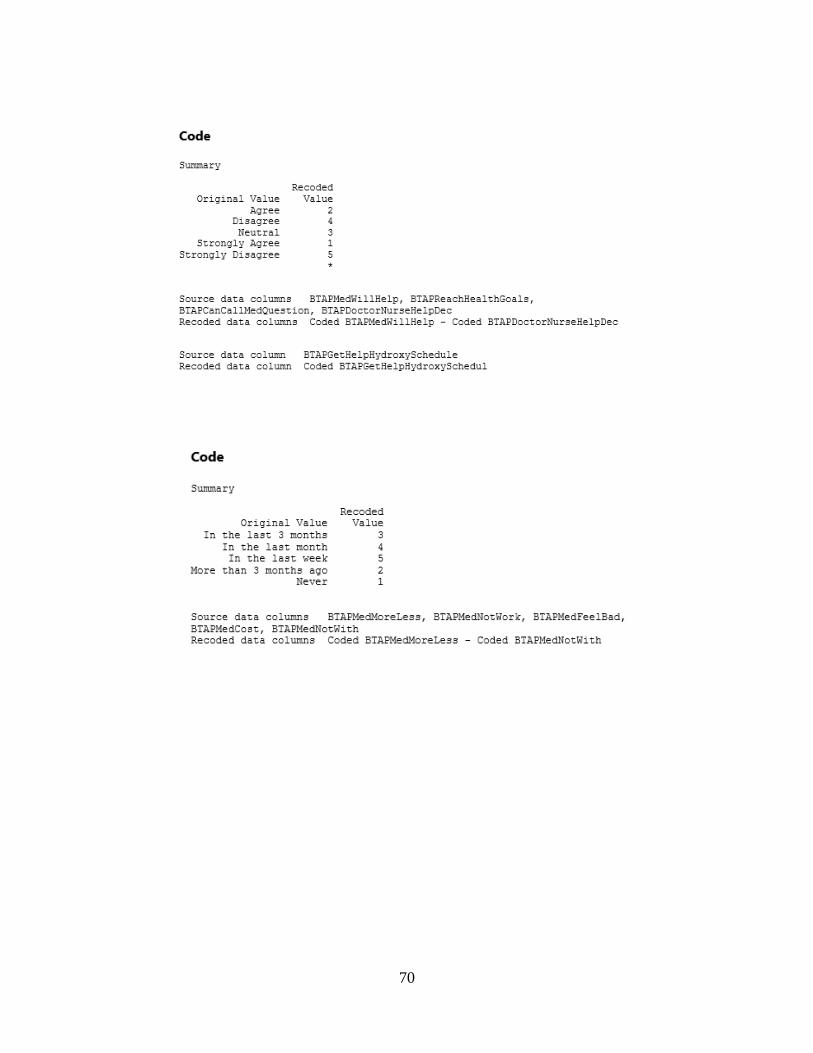
70

71
C.2 TSQM-9 SURVEY

72
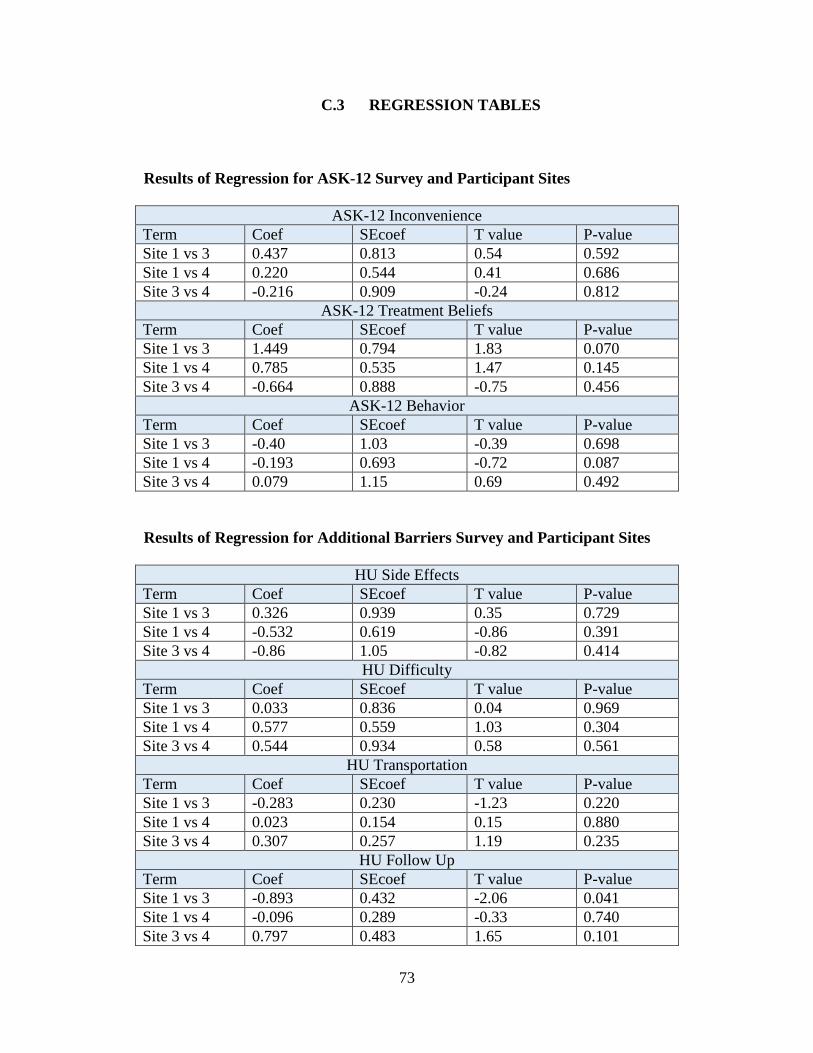
73
C.3 REGRESSION TABLES
Results of Regression for ASK-12 Survey and Participant Sites
ASK-12 Inconvenience Term Coef SEcoef T value P-value Site 1 vs 3 0.437 0.813 0.54 0.592 Site 1 vs 4 0.220 0.544 0.41 0.686 Site 3 vs 4 -0.216 0.909 -0.24 0.812
ASK-12 Treatment Beliefs Term Coef SEcoef T value P-value Site 1 vs 3 1.449 0.794 1.83 0.070 Site 1 vs 4 0.785 0.535 1.47 0.145 Site 3 vs 4 -0.664 0.888 -0.75 0.456
ASK-12 Behavior Term Coef SEcoef T value P-value Site 1 vs 3 -0.40 1.03 -0.39 0.698 Site 1 vs 4 -0.193 0.693 -0.72 0.087 Site 3 vs 4 0.079 1.15 0.69 0.492
Results of Regression for Additional Barriers Survey and Participant Sites
HU Side Effects Term Coef SEcoef T value P-value Site 1 vs 3 0.326 0.939 0.35 0.729 Site 1 vs 4 -0.532 0.619 -0.86 0.391 Site 3 vs 4 -0.86 1.05 -0.82 0.414
HU Difficulty Term Coef SEcoef T value P-value Site 1 vs 3 0.033 0.836 0.04 0.969 Site 1 vs 4 0.577 0.559 1.03 0.304 Site 3 vs 4 0.544 0.934 0.58 0.561
HU Transportation Term Coef SEcoef T value P-value Site 1 vs 3 -0.283 0.230 -1.23 0.220 Site 1 vs 4 0.023 0.154 0.15 0.880 Site 3 vs 4 0.307 0.257 1.19 0.235
HU Follow Up Term Coef SEcoef T value P-value Site 1 vs 3 -0.893 0.432 -2.06 0.041 Site 1 vs 4 -0.096 0.289 -0.33 0.740 Site 3 vs 4 0.797 0.483 1.65 0.101
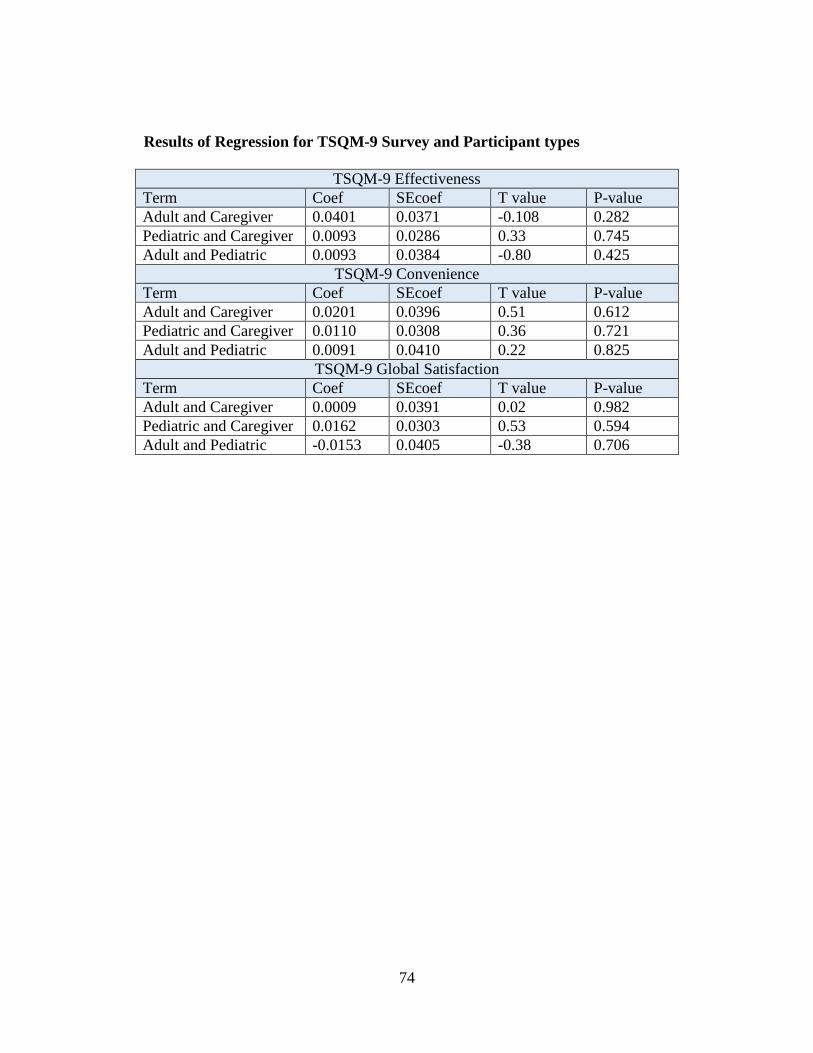
74
Results of Regression for TSQM-9 Survey and Participant types
TSQM-9 Effectiveness Term Coef SEcoef T value P-value Adult and Caregiver 0.0401 0.0371 -0.108 0.282 Pediatric and Caregiver 0.0093 0.0286 0.33 0.745 Adult and Pediatric 0.0093 0.0384 -0.80 0.425
TSQM-9 Convenience Term Coef SEcoef T value P-value Adult and Caregiver 0.0201 0.0396 0.51 0.612 Pediatric and Caregiver 0.0110 0.0308 0.36 0.721 Adult and Pediatric 0.0091 0.0410 0.22 0.825
TSQM-9 Global Satisfaction Term Coef SEcoef T value P-value Adult and Caregiver 0.0009 0.0391 0.02 0.982 Pediatric and Caregiver 0.0162 0.0303 0.53 0.594 Adult and Pediatric -0.0153 0.0405 -0.38 0.706

75
BIBLIOGRAPHY
1. Health, N.I.o. (2008). NIH State-of-the-Science Conference statement for Hydroxyurea Treatment for Sickle Cell Diease. NIH Consensus and State-of-the-science statements 25.
2. al, J.C.D.e. (2010). Health-related quality of life in children and adolescents with sickle cell disease. Journal of pediatric health care : official publication of National Association of Pediatric Nurse Associates & Practitioners 25, 208-215.
3. Dampier, C., LeBeau, P., Rhee, S., Lieff, S., Kesler, K., Ballas, S., Rogers, Z., and Wang, W. (2011). Health-related quality of life in adults with sickle cell disease (SCD): A report from the comprehensive sickle cell centers clinical trial consortium. American Journal of Hematology 86, 203-205.
4. Patel, N.G., Lindsey, T., Strunk, R.C., and DeBaun, M.R. (2010). Prevalence of daily medication adherence among children with sickle cell disease: A 1‐year retrospective cohort analysis. Pediatric Blood & Cancer 55, 554-556.
5. Stallworth, J.R., Jerrell, J.M., and Tripathi, A. (2010). Cost‐effectiveness of hydroxyurea in reducing the frequency of pain episodes and hospitalization in pediatric sickle cell disease. American Journal of Hematology 85, 795-797.
6. Lanzkron, S.e.a. (2010). Examining the effectiveness of hydroxyurea in people with sickle cell disease. Journal of health care for the poor and underserved 21, 277-286.
7. Steinberg, M.H., Barton, F., Castro, O., Pegelow, C.H., Ballas, S.K., Kutlar, A., Orringer, E., Bellevue, R., Olivierie, N., Eckman, J., et al. (2003). Effect of Hydroxyurea on Mortality and Morbidity in Adult Sickle Cell Anemia Risks and Benefits Up to 9 Years of Treatment. JAMA 289, 1645-1651.
8. Candrilli, S.D., H.O'Brien, S., E.Ware, R., Nahata, M.C., E.Seiber, E., and Balkrishnan, R. (2011). Hydroxyurea adherence and associated outcomes among Medicaid enrollees with sickle cell disease. American Journal of Hematology 86, 273-277.
9. Thornburg, C.D., Calatroni, A., Telen, M., and Kemper, A.R. (2010). Adherence to hydroxyurea therapy in children with sickle cell anemia. The Journal of pediatrics 156, 415-419.
10. Brandow, A.M., Jirovec, D.L., and Panepinto, J.A. (2010). Hydroxyurea in children with sickle cell disease: Practice patterns and barriers to utilization. American Journal of Hematology 85, 611-613.
11. Creary, M., Williamson, D., and Kulkarni, R. (2007). Sickle Cell Disease: Current Activities, Publich Health Implications, and Future Directions. Journal of Women's Health 16, 575-582.
12. Olney, R.S. (1999). Preventing Morbidity and Mortality from Sickle Cell Disease. Am J Prev Med 16, 116-121.
76
13. Palermo, T.M., Riley, C.A., and Mitchell, B.A. (2008). Daily Functioning and Quality of Life in Children with Sickle Cell Disease Pain: Relationship With Family and Neighborhood Socioeconomic Distress. The Journal of pain 9, 833-840.
14. AM, B., and al, e. (2010). Hydroxyurea in children with sickle cell disease: Practice patterns and barriers to utilization. American Journal of Hematology 85, 611-613.
15. M, B., K, P., MJ, A., M, D., and DE, M. (2009). Validation of an abbreviated Treatment Satisfaction Questionnaire for Medication (TSQM-9) among patients on antihypertensive medications. Health and Quality of Life Outcomes 7, 36.
16. Barakat, L.P., Patterson, C.A., Daniel, L.C., and Dampier, C. (2008). Quality of life among adolescents with sickle cell disease: mediation of pain by internalizing symptoms and parenting stress. Health Qual Life Outcomes 6, 60.
17. Bediako, S.M. (2010). Predictors of Employment Status among African Americans with Sickle Cell Disease. Journal of health care for the poor and underserved 21, 1124-1137.
18. LS, M., J, P., KS, C., EP, S., KG, M., and RQ, W. (2009). Derivation and validation of the ASK-12 adherence barrier survey. The Annals of pharmacotherapy 43, 1621-1630.
19. Hahn, S.R., Park, J., Skinner, E.P., Yu-Isenberg, K.S., Weaver, M.B., Crawford, B., and Flowers, P.W. (2008). Development of the AS-20 Adherence Barrier Survey. Current Medical Research Opinion 24, 2127-2138.
20. Atkinson, M.J., Sinha, A., and Hass, S.L. (2004). Validation of a general measure of treatment satisfaction, the Treatment Satisfaction Questionnaire for Medication (TSQM), using a national panel study of …. Health and Quality of ….
21. Zyoud, S.e.H., Al-Jabi, S.W., Sweileh, W.M., and Morisky, D.E. (2013). Relationship of treatment satisfaction to medication adherence: findings from a cross-sectional survey among hypertensive patients in Palestine. Health and Quality of Life Outcomes 11.
22. MJ, A., R, K., and Cappelleri JC, e.a. (2005). Hierarchical construct validity of the treatment satisfaction questionnaire for medication (TSQM version II) among outpatient pharmacy consumers. Value Health Suppl 1, S9-S24.
23. Hahn SR, P.J., Skinner EP, et al. (2008). Development of ASK-20 adherence barrier survey. . Curr Med Res Opin 24, 2127-2138.
24. Crosby, L.E., Modi, A.C., Lemanek, K.L., Guilfoyle, S.M., Kalinyak, K.A., and Mitchell, M.J. (2009). Perceived Barriers to Clinic Appointments for Adolescents with Sickle Cell Disease. J Pediatr Hematol Oncol 31, 571-576.
25. Bollinger, L.M., Nire, K.G., Rhodes, M.M., Chisolm, D.J., and O'Brien, S.H. (2011). Caregivers' Perspective on Barriers to Transcranial Doppler Screening in Children With Sickle-Cell Disease. Pediatr Blood Cancer 56, 99-102.
26. al, M.H.S.e. (2010). The risks and benefits of long‐term use of hydroxyurea in sickle cell anemia: A 17.5 year follow‐up. American Journal of Hematology 85, 403-408.
27. Ashley L. Buchanan, M., Grace Montepiedra, P., Patricia A. Sirois, P., Betsy Kammerer, P., Patricia A. Garvie, P., Deborah S. Storm, P., and Sharon L. Nichols, P. (2012). Barriers to Medication Adherence in HIV-Infected Children and Youth Based on Self-and Caregiver Report. Pediatrics 129, e1244-e1251.
28. Richard R. Rubin, P.D., and Mark Peyrot, P.D. (2012). Health-Related Quality of Life and Treatment Satisfaction in the Sensor-Augmented Pump Therapy for A1C Reduction 3 (STAR 3) Trial. Diabetes technology and theraputics 14, 143-151.