Embed Size (px)
Citation preview
Correlation analysis between HPC blade chord and compressor efficiency for the CFM56-3
Julio Antonio Rubio Ridaura Instituto Superior Técnico
E-mail: [email protected]
Abstract- Gas turbines performance prediction has gathered a great investment in recent years. Engine manufacturers must be deeply involved in mathematical modelling, but users may also have a significant interest in the use of computational models for investigation of in-service problems. The present work, was developed in this framework, as a curricular internship at TAP Maintenance & Engineering (TAP ME). TAP ME is interested in analysing the performance of the CFM56-3 turbofan, which is the one that TAP ME customers bring the most to its facilities. In order to simulate the turbofan performance, it will be used a software called GasTurb, which makes it easy to evaluate the thermodynamic cycle of the most common gas turbine architectures, for both Design and Off-design behaviours. To build the CFM56-3 model data from engines tested on TAP test bed facilities will be used. The final simulation objective is to obtain the compressors and turbines characteristics, also known as engine component maps, which are kept secret by the engine manufacturer for competitive reasons. The engine model will help to detect abnormal behaviour. Therefore it will be a strong help for TAP engineering team, saving time and resources in the workshop during pre-shop visits tests. The CFM56-3 computational model can be useful for a large number of secondary studies, as for example the influence of the HPC blade chords in the global engine performance. The present thesis marks the starting point for future engine performance prediction at TAP ME. Key words- turbofan, computational model, performance prediction, component maps, engine performance, GasTurb.
I. INTRODUCTION
Continuous improvement in global aviation safety is fundamental to ensuring air transport continues to play a major role in driving sustainable economic and social development around the world. For an industry that directly and indirectly supports the employment of 56.6 million people, contributes with over US$2000000 million to global gross domestic product, and carries over 2500 million passengers and US$5300000 million worth of cargo annually according to the study Global Aviation Safety Plan performed by International Civil Aviation Organization [ICAO, 2014], safety must be aviation’s first and overriding priority. With air traffic projected to double in the next 15 years, current and emerging safety risks must be addressed proactively to ensure that this significant capacity expansion is carefully managed and supported through strategic regulatory and technological developments. It is therefore imperative that aircraft manufacturers, engine manufacturers and their customers remain focused on establishing,
updating and addressing their safety and environment priorities as they continue to encourage expansion of their air transport sectors. The mid-term objective of this thesis is the implementation of a performance prediction system in TAP Portugal
Maintenance, Repair and Overhaul (MRO) facility that will become integrated to the aircraft engine maintenance of the future. Sustainable growth of the international aviation system will require the introduction of advanced safety capabilities that increase capacity while maintaining or enhancing operational safety margins and manage existing and emerging risks. The mid-term objective is intended to support an operational environment characterized by increased automation and the integration of advanced capabilities on the ground and in the air. Maintenance, Repair and Overhaul (MRO) facilities
For a complex system, maintenance actions are necessary to maintain the system in a safe and functional condition, so that it can fulfil the operational role that it was designed for. Sustainment of commercial aircraft gas turbine engines in the form of Maintenance, Repair and Overhaul (MRO) is a primary activity in the lifecycle of a modern commercial aircraft system [Goh, 2003]. There are three main reasons for an engine to make a workshop intervention in an MRO facility: (1) to solve any problem during operation, such as a bird strike that damages the components and, therefore, needs to be repaired; (2), planned replacement for end life of certain components (number of cycles); (3), engine performance loss. Engines present some problems due to the normal aircraft operation that MRO companies are aware of, as for example, erosion and deposition. The objective is to minimize these problems for longer engine life. TAP Maintenance & Engineering (TAP ME) is an MRO solution provider for Airbus, Boeing and Embraer fleets, focused on TAP and on its customers. The knowledge management resulting from the support experience of TAP Portugal airline fleet enables their customers to benefit from all the advantages of a complete set of integrated services ranging from airframe, engines and components, to the engineering and material support.
The contracts of TAP ME with their customers are established taking into account the level of repair time and performance. The aim of pass-off performance tests in the test bed of an engine maintenance shop is to convince the customer that the engine is fit for flight. The test analysis procedure follows a set of rules which are defined by the engine manufacturer.
The most representative measured parameters to evaluate the engine performance are the Exhaust Gas Temperature (EGT) and the vibrations level, which are used as indicators of the performance achieved with work done in a Shop Visit. Particularly, EGT is a pointer used for controlling the engine integrity and the performance deterioration. For instance, EGT increases when the engine component efficiency diminishes, consequently the fuel flow should increase to produce the same amount of thrust (see Lacaille et al. [2013]). This thesis work is focused on the turbofan CFM56-3 due to the fact that this is the engine which presents the highest activity in TAP ME facilities. CFM56-3
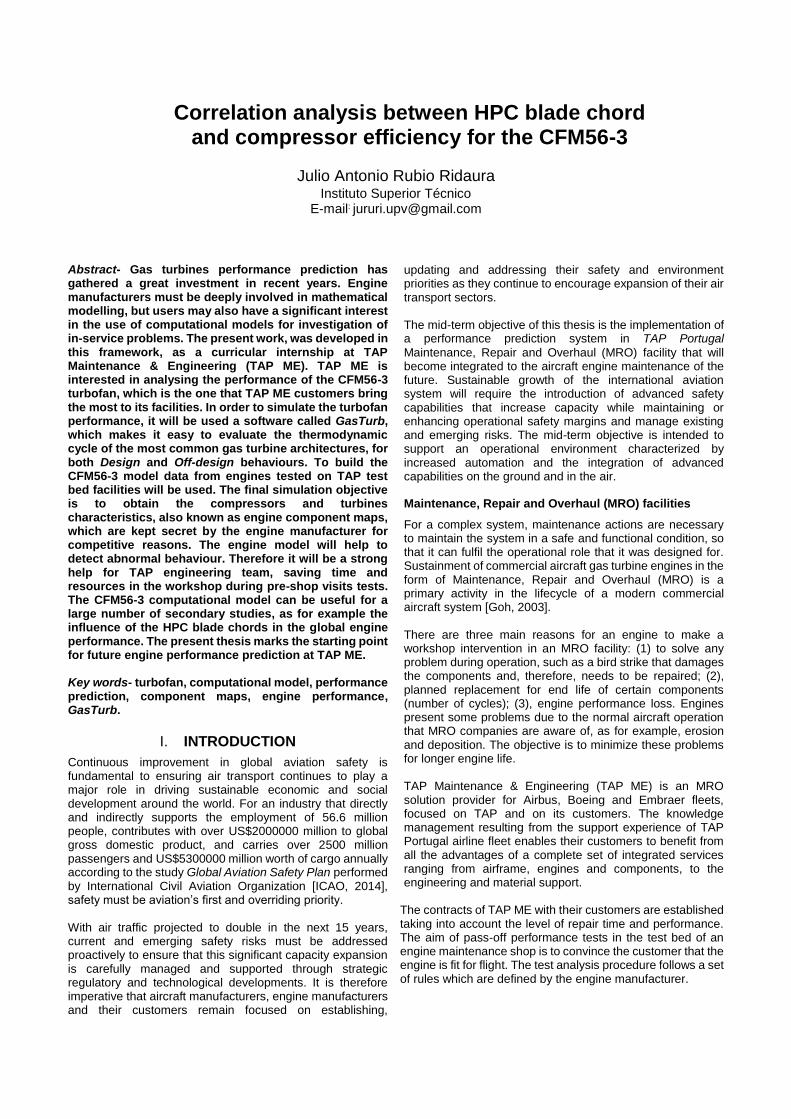
Detailed information about the engine can be found in the reference [CFM, 1992]. CFM56-3 is a turbofan, designed in the second half of the 70s and certified in January 1984, Figure 1.
Fig. 1: CFM56-3 configuration [onderzoeksraad.nl]
The High Pressure Turbine (HPT) is composed with a single stage. It extracts energy from the combustion process to move the High Pressure Compressor (HPC), which consists of 9 stages. The power package formed by the HPC and HPT is known as high pressure rotor, which rotates at the spool speed N2. The combustion chamber is annular, being fed by 20 fuel injectors. The fuel is mixed with the air from the HPC 9th stage, and the combustion provides energy to the air that will flow through the turbine stages. On the other hand, the Low Pressure Turbine (LPT), composed by 4 stages, drives the Fan and the Low Pressure Compressor (LPC or booster), which consists of 3 stages. This mechanical set forms the low pressure rotor, which rotates at N1 speed. The air flow rate through the engine is controlled by 12 Variable Bleed Valves (VBV) located circumferentially in the fan structure and between the booster and the HPC. Its objective is to optimize the engine transient regimes. Also, 4 Variable Stator Vanes (VSV) may also be located on the first four HPC static stages. Of these four stages of variable stators, the first one is referred to as Inlet Guide Vanes (IGVs). These 4 variable stators are followed by 5 fixed stators, the latter being defined as Outlet Guide Vanes (OGVs). These are located at the entrance of the combustion chamber and have the purpose of guiding the air coming out of HPC axially.
Engine performance simulation
According to the work of Reed et al. [2003], since 1994 maintenance problems have contributed to 42 percent of fatal airline accidents. Naturally, given its importance and impact on safety, availability and cost of aircraft and engines systems, it follows that the industry still has to seek for the best methods to conduct MRO operations. It has been estimated that two thirds of the system lifecycle cost is attributed to operations and sustainment. Furthermore, about forty percent of typical air carries maintenance costs are due to engine MRO [Goh, 2003]. Current MRO decision support tools focus largely on engine fault diagnosis systems, prognosis and condition monitoring [Goh, 2003]. This thesis presents a framework for decision support tools for engine sustainment and how it can be implemented in future TAP ME operations: engine performance prediction programmes. The engine model simulation objectives remain the same as the ones that were defined for turbojets from the 60’s [Sayeed, 1990]: ‘to derive statements about the properties of the system which may be read across the real situation’ (Barnes, 1970), ‘to improve engineer’s understanding of the influences on the whole system characteristics of individual system components’ (Gould, 1970) and ‘to save money’ (Westbrook, 1970). This kind of tools derives gas turbine behaviour from a mathematical model of the thermodynamic processes involved, so, the missing variables could be predicted, foreseeing as well the engine behaviour when a specific component is deteriorated. This information would entail to discern in more detail if a particular engine element is not working as expected. This tool will provide a strong help to the engineering team, saving time and resources in the office. Early efforts to predict aircraft engines performance have been done by a few organizations, the most notable being NASA, Royal Aircraft Establishment and aero-engine industries, among others. They develop programs such as DYNGEN, SMOTE, GENENG and DIGISIM to name a few. The only problem was that all of them relied on compressor and turbine performance maps, which are dimensionless performance representations of the engine components (see [NASA, 1972]).
Component maps are experimentally obtained by engine manufacturers during the development programme of a new aircraft engine. For this purpose, they collect a lot of information on large-scale experimental tests, known as rig tests. Nonetheless, for reasons of competitiveness, this information is beyond the scope of the general public and the engine customers. On the rare occasions when it is published, it is normally several years after the successful completion of the development programme [Saravanamutto, 1992b].
The power requirement of the rig test makes it impossible for TAP ME to reproduce it, despite the high technological level of its installations. The secrecy employed by engine manufacturers is a problem for the development of the airlines skills. The lack of knowledge of some important parameters makes it difficult to understand if the engine is working properly. There may be a situation where the measured variables have an unacceptable value, but it is not possible to know in advance in what precise point the engine is going to fail.
According to [Pachidis, 2006],’ the state of the art of the simulation software of the aeronautical engines is to obtain the component maps experimentally, with empirical adjustments for the Off-Design conditions, which could include variable geometry, gamma corrections and clearances’. A commercial engine performance modelling software called GasTurb would be suitable for these purposes. GasTurb GasTurb makes it easy to evaluate the thermodynamic cycle of the most common gas turbine architectures, both for engine design and off-design. It was developed by Joachim Kurzke, a gas turbine performance specialist who has worked for more than 30 years in the field of gas turbine simulation and development, both at the university and in industry [Kurzke, 2011]. GasTurb can provide high-quality predictions for the whole engine performance when it is near to the design point. However, there is some scepticism because these types of software are considered inaccurate by being dimension zero (0D), which means that they do not contain information of axial, tangential and radial gradients.
The solution to the lack of precision would be, for instance, the use of 3D programmes known as CFD (Computational Fluid Dynamics). However, the complexity, the level of detail and the required computational power for the construction of a system of three-dimensional simulation make this alternative impractical. In addition, the use of complex methodologies to simulate the engine behaviour is not within TAP ME expectations. In the work developed by Wemming [2010], GasTurb method for computer simulation of gas turbine aero engines was validated for the On-Design behaviour, by applying it to five
different jet engines of different size, different type and different age. GasTurb has the compromise between sophistication and a negligible required computational power. It has integrated all the thermodynamic laws, as well as the interaction between the different engine components. Finally, the software has defined several tools which help to understand the engine behaviour.
The following step is the creation of a thermodynamic Off-Design model to simulate the engine response in different
operating conditions, which leads to component maps. Martinjako [2014] developed a model of the marine gas turbine LM2500+ (General Electric) using GasTurb in order to evaluate and predict the engine performance at off-design conditions. The GasTurb predictions were compared to experimental results from engine manufacturer successfully, demonstrating the GasTurb capabilities.
II. THERMODYNAMIC MODELLING OF THE
CFM56-3 USING GASTURB
Full performance simulations are created by the developers of any new gas turbine based on a vast amount of test data gathered during engine development. The details of these simulations are generally kept secret and only those parameters that are used for control purposes are accessible to engine customers and outsiders. Many companies, as for example TAP ME, want to implement engine performance prediction and life monitoring to understand in detail the engine behavior.
The amount of data available and their suitability for creating a cycle simulation is very different depending on the source: marketing brochures, official engine specifications, measurements made by the gas turbine user, excerpts of an engine design table, among others. Data from the CFM56-3 Correlation Test Report prepared by Comperat et al. [CFM, 1991] is used as explained hereafter.
CFM56-3 Correlation Test Report
To develop the simulation it is needed an engine that could represent the CFM56-3 behaviour and with the most instrumentation data possible. The standard performance tests in an engine maintenance shop are often limited to only two operating points: maximum continuous (MC) and take-off (TO). If the calibrated operating range of the model was based only on these two operating points it would be very limiting because they are close to each other in the compressor and turbine maps. A better basis for calibrating a performance model is the test cell calibration report. It contains consistent data for the full operating range from idle to take-off. As a result, it will be used the CFM56-3 Correlation Test Report data [CFM, 1991] to develop an engine reference model using GasTurb. The correlation engine is an engine of known and repeatable performance, equipped with extra instrumentation, designated to be used for test cell correlation because all test facilities affect the testing environment and influence the data obtained during testing. Correlation tests are procedures that compare data from the OEM (Original Equipment Manufacturer) test facility and the MRO test facility with the same engine. Correlations are performed with an OEM-provided procedure to obtain data points at predetermined power levels. One of the main advantages to use data from the Correlation Test Report to develop the model is the large number of different operating points, in this case 44 N1R readings between 3000 rpm and 4855 rpm. This fact allows to obtain a model suited for the entire operating range.
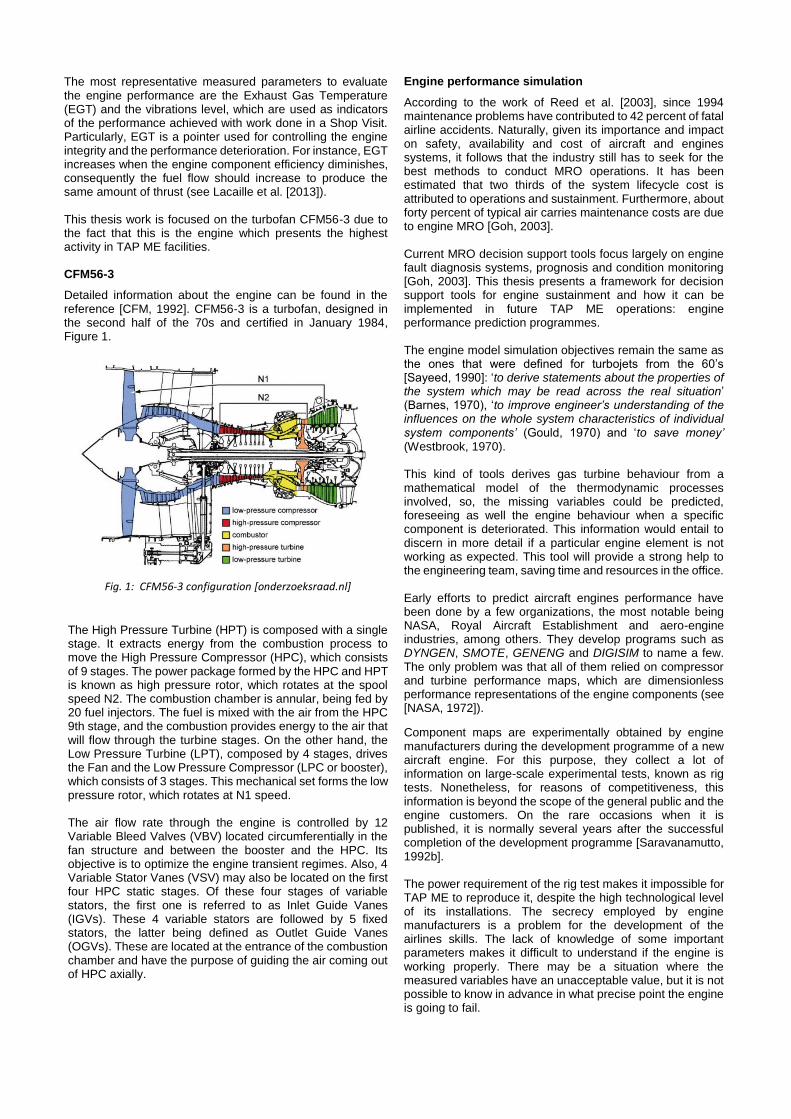
The purpose of the correction test procedure is to calculate the Facility Modifiers, which are correction factors applied to the measured data in the test bed in order to compare results with the acceptance checks from the engine manufacturer, Figure 2.
Fig. 2: Correlation Test Procedure
The last correlation of the engines CFM56-3 was made in 1991. It was performed with the CFM56-3C version, but the results are extrapolated to all CFM56-3 versions. The correlation data offers some advantages, as for example, many instrumentation measures, A18 and A8 measurements and sensors calibration procedures done before correlation test, as well as guaranteed stable performance of the engine.
The engine used in the Correlation Test Report is the best option to develop the thermodynamic simulation in GasTurb. This engine is used exclusively for this kind of test, and consequently it is not as degraded as the engines employed to power aircraft. Actually, it presents a minimal level of degradation. Thus, the model parameters would represent the optimal value for each one, including component efficiencies. By this way, it is viable to discern differences between engines tested and an optimal engine from simulation.
On-Design conditions
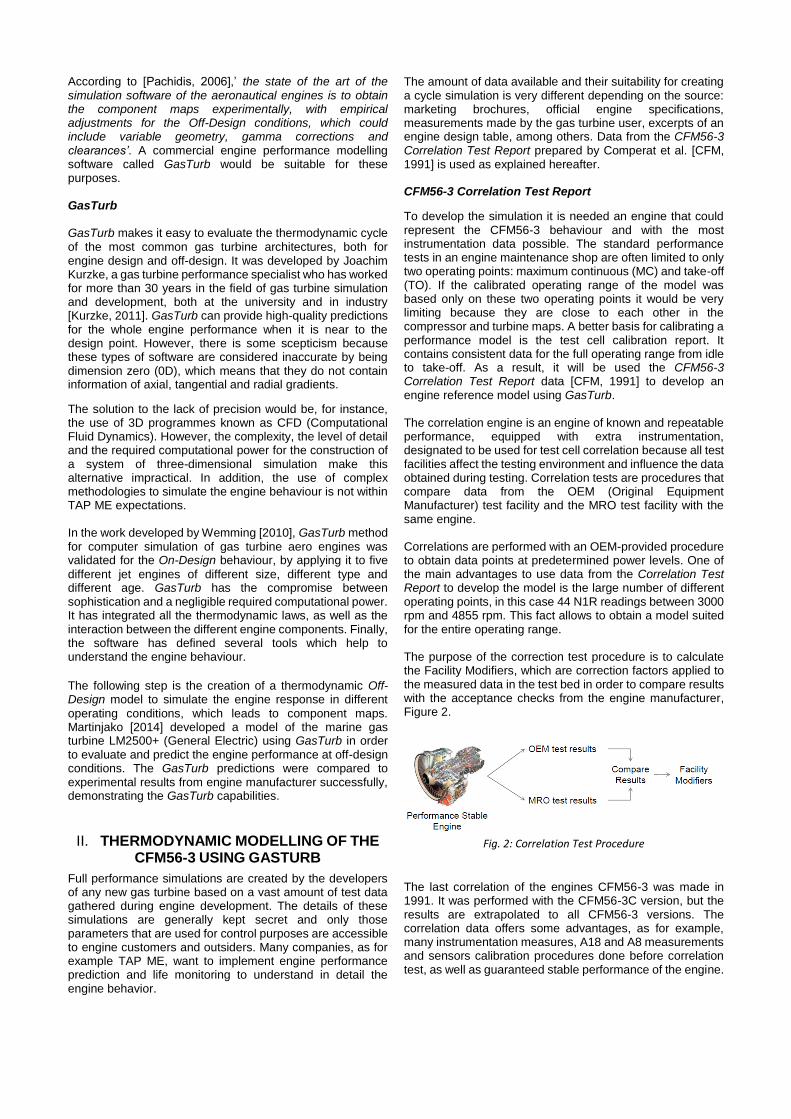
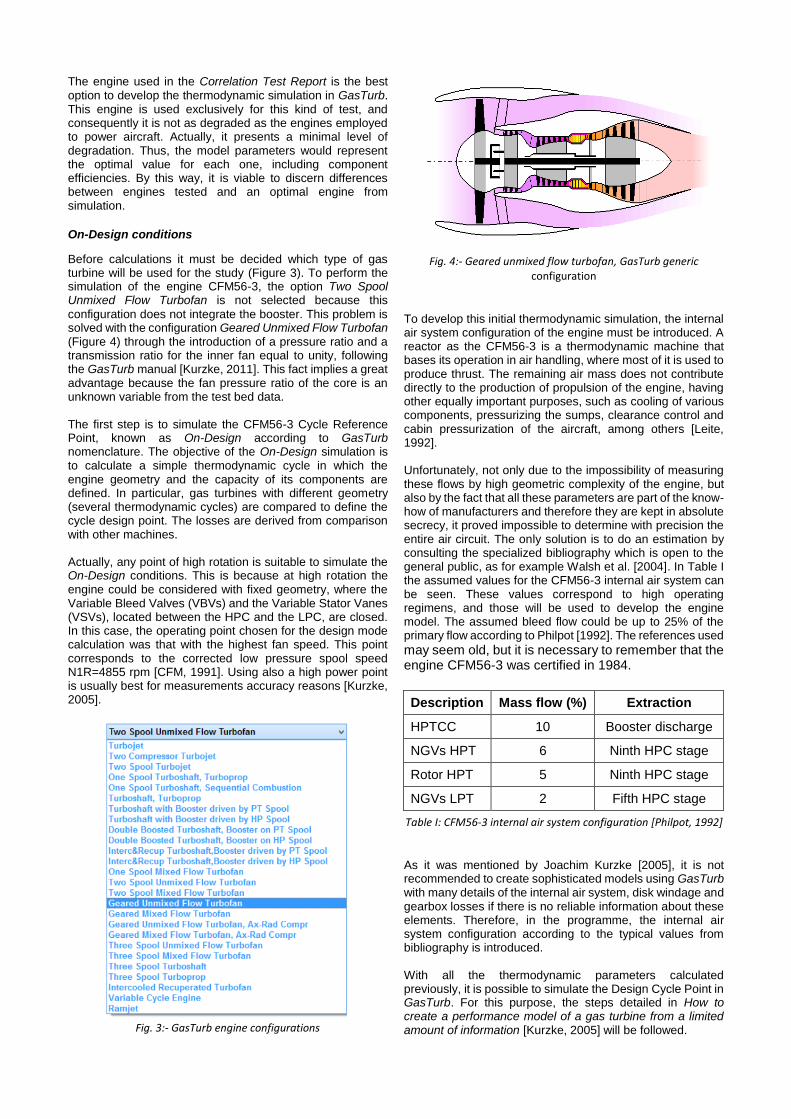
Before calculations it must be decided which type of gas turbine will be used for the study (Figure 3). To perform the simulation of the engine CFM56-3, the option Two Spool Unmixed Flow Turbofan is not selected because this
configuration does not integrate the booster. This problem is solved with the configuration Geared Unmixed Flow Turbofan (Figure 4) through the introduction of a pressure ratio and a transmission ratio for the inner fan equal to unity, following the GasTurb manual [Kurzke, 2011]. This fact implies a great advantage because the fan pressure ratio of the core is an unknown variable from the test bed data. The first step is to simulate the CFM56-3 Cycle Reference Point, known as On-Design according to GasTurb nomenclature. The objective of the On-Design simulation is to calculate a simple thermodynamic cycle in which the engine geometry and the capacity of its components are defined. In particular, gas turbines with different geometry (several thermodynamic cycles) are compared to define the cycle design point. The losses are derived from comparison with other machines. Actually, any point of high rotation is suitable to simulate the On-Design conditions. This is because at high rotation the engine could be considered with fixed geometry, where the Variable Bleed Valves (VBVs) and the Variable Stator Vanes (VSVs), located between the HPC and the LPC, are closed. In this case, the operating point chosen for the design mode calculation was that with the highest fan speed. This point corresponds to the corrected low pressure spool speed N1R=4855 rpm [CFM, 1991]. Using also a high power point is usually best for measurements accuracy reasons [Kurzke, 2005].
Fig. 3:- GasTurb engine configurations
Fig. 4:- Geared unmixed flow turbofan, GasTurb generic configuration
To develop this initial thermodynamic simulation, the internal air system configuration of the engine must be introduced. A reactor as the CFM56-3 is a thermodynamic machine that bases its operation in air handling, where most of it is used to produce thrust. The remaining air mass does not contribute directly to the production of propulsion of the engine, having other equally important purposes, such as cooling of various components, pressurizing the sumps, clearance control and cabin pressurization of the aircraft, among others [Leite, 1992]. Unfortunately, not only due to the impossibility of measuring these flows by high geometric complexity of the engine, but also by the fact that all these parameters are part of the know-how of manufacturers and therefore they are kept in absolute secrecy, it proved impossible to determine with precision the entire air circuit. The only solution is to do an estimation by consulting the specialized bibliography which is open to the general public, as for example Walsh et al. [2004]. In Table I the assumed values for the CFM56-3 internal air system can be seen. These values correspond to high operating regimens, and those will be used to develop the engine model. The assumed bleed flow could be up to 25% of the primary flow according to Philpot [1992]. The references used may seem old, but it is necessary to remember that the engine CFM56-3 was certified in 1984.
Table I: CFM56-3 internal air system configuration [Philpot, 1992]
As it was mentioned by Joachim Kurzke [2005], it is not recommended to create sophisticated models using GasTurb with many details of the internal air system, disk windage and gearbox losses if there is no reliable information about these elements. Therefore, in the programme, the internal air system configuration according to the typical values from bibliography is introduced. With all the thermodynamic parameters calculated previously, it is possible to simulate the Design Cycle Point in GasTurb. For this purpose, the steps detailed in How to create a performance model of a gas turbine from a limited amount of information [Kurzke, 2005] will be followed.
Description Mass flow (%) Extraction
HPTCC 10 Booster discharge
NGVs HPT 6 Ninth HPC stage
Rotor HPT 5 Ninth HPC stage
NGVs LPT 2 Fifth HPC stage
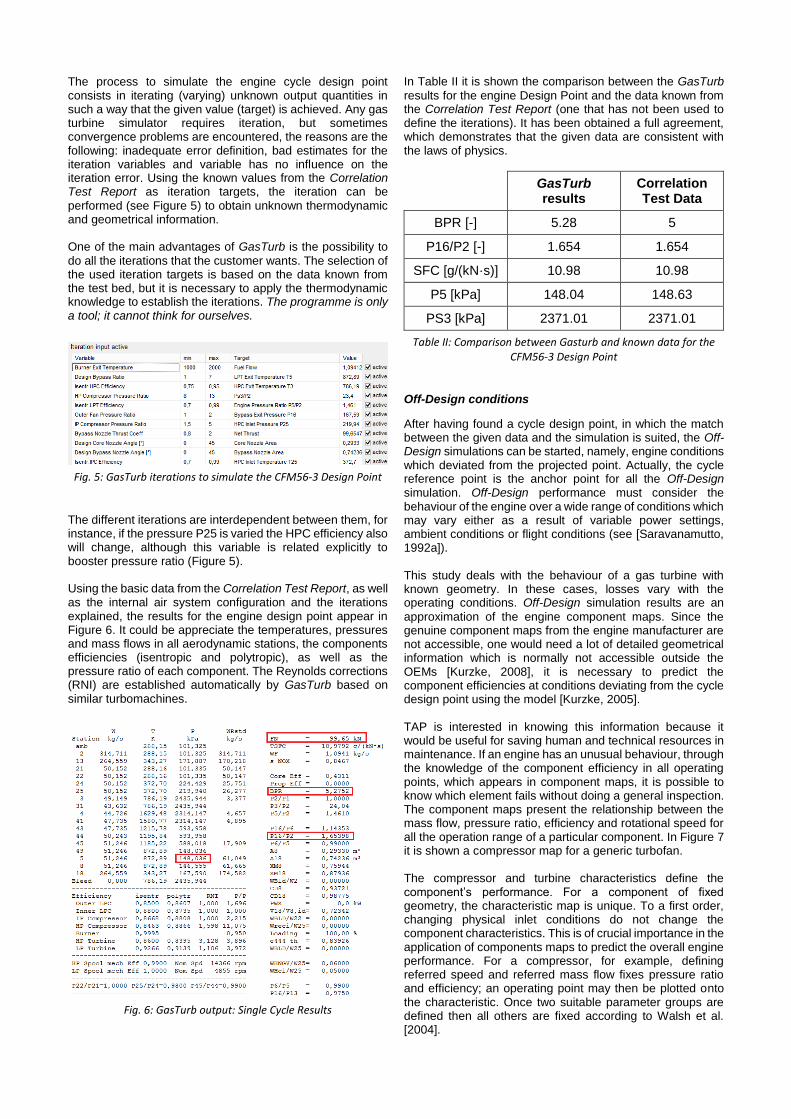
The process to simulate the engine cycle design point consists in iterating (varying) unknown output quantities in such a way that the given value (target) is achieved. Any gas turbine simulator requires iteration, but sometimes convergence problems are encountered, the reasons are the following: inadequate error definition, bad estimates for the iteration variables and variable has no influence on the iteration error. Using the known values from the Correlation Test Report as iteration targets, the iteration can be
performed (see Figure 5) to obtain unknown thermodynamic and geometrical information. One of the main advantages of GasTurb is the possibility to
do all the iterations that the customer wants. The selection of the used iteration targets is based on the data known from the test bed, but it is necessary to apply the thermodynamic knowledge to establish the iterations. The programme is only a tool; it cannot think for ourselves.
Fig. 5: GasTurb iterations to simulate the CFM56-3 Design Point
The different iterations are interdependent between them, for instance, if the pressure P25 is varied the HPC efficiency also will change, although this variable is related explicitly to booster pressure ratio (Figure 5). Using the basic data from the Correlation Test Report, as well as the internal air system configuration and the iterations explained, the results for the engine design point appear in Figure 6. It could be appreciate the temperatures, pressures and mass flows in all aerodynamic stations, the components efficiencies (isentropic and polytropic), as well as the pressure ratio of each component. The Reynolds corrections (RNI) are established automatically by GasTurb based on similar turbomachines.
Fig. 6: GasTurb output: Single Cycle Results
In Table II it is shown the comparison between the GasTurb
results for the engine Design Point and the data known from the Correlation Test Report (one that has not been used to define the iterations). It has been obtained a full agreement, which demonstrates that the given data are consistent with the laws of physics.
GasTurb results
Correlation Test Data
BPR [-] 5.28 5
P16/P2 [-] 1.654 1.654
SFC [g/(kN·s)] 10.98 10.98
P5 [kPa] 148.04 148.63
PS3 [kPa] 2371.01 2371.01
Table II: Comparison between Gasturb and known data for the CFM56-3 Design Point
Off-Design conditions
After having found a cycle design point, in which the match between the given data and the simulation is suited, the Off-Design simulations can be started, namely, engine conditions which deviated from the projected point. Actually, the cycle reference point is the anchor point for all the Off-Design simulation. Off-Design performance must consider the behaviour of the engine over a wide range of conditions which may vary either as a result of variable power settings, ambient conditions or flight conditions (see [Saravanamutto, 1992a]). This study deals with the behaviour of a gas turbine with known geometry. In these cases, losses vary with the operating conditions. Off-Design simulation results are an
approximation of the engine component maps. Since the genuine component maps from the engine manufacturer are not accessible, one would need a lot of detailed geometrical information which is normally not accessible outside the OEMs [Kurzke, 2008], it is necessary to predict the component efficiencies at conditions deviating from the cycle design point using the model [Kurzke, 2005]. TAP is interested in knowing this information because it would be useful for saving human and technical resources in maintenance. If an engine has an unusual behaviour, through the knowledge of the component efficiency in all operating points, which appears in component maps, it is possible to know which element fails without doing a general inspection. The component maps present the relationship between the mass flow, pressure ratio, efficiency and rotational speed for all the operation range of a particular component. In Figure 7 it is shown a compressor map for a generic turbofan. The compressor and turbine characteristics define the component’s performance. For a component of fixed geometry, the characteristic map is unique. To a first order, changing physical inlet conditions do not change the component characteristics. This is of crucial importance in the application of components maps to predict the overall engine performance. For a compressor, for example, defining referred speed and referred mass flow fixes pressure ratio and efficiency; an operating point may then be plotted onto the characteristic. Once two suitable parameter groups are defined then all others are fixed according to Walsh et al. [2004].
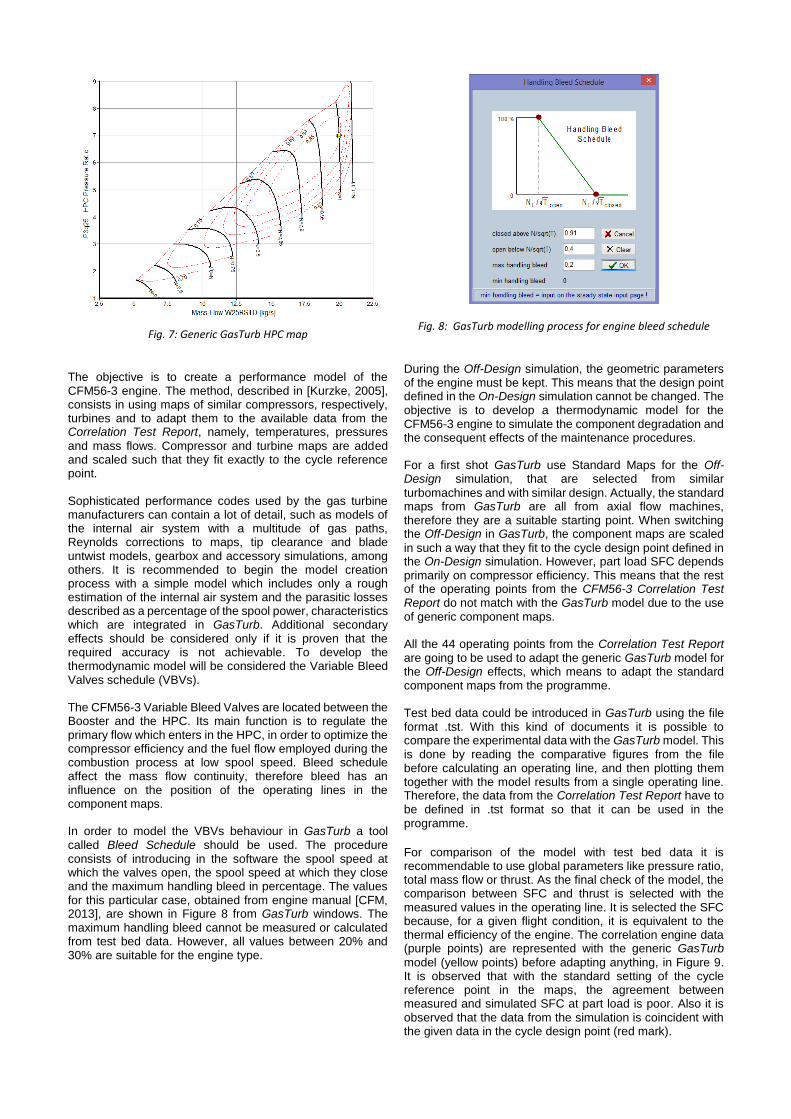
Fig. 7: Generic GasTurb HPC map
The objective is to create a performance model of the CFM56-3 engine. The method, described in [Kurzke, 2005], consists in using maps of similar compressors, respectively, turbines and to adapt them to the available data from the Correlation Test Report, namely, temperatures, pressures
and mass flows. Compressor and turbine maps are added and scaled such that they fit exactly to the cycle reference point. Sophisticated performance codes used by the gas turbine manufacturers can contain a lot of detail, such as models of the internal air system with a multitude of gas paths, Reynolds corrections to maps, tip clearance and blade untwist models, gearbox and accessory simulations, among others. It is recommended to begin the model creation process with a simple model which includes only a rough estimation of the internal air system and the parasitic losses described as a percentage of the spool power, characteristics which are integrated in GasTurb. Additional secondary effects should be considered only if it is proven that the required accuracy is not achievable. To develop the thermodynamic model will be considered the Variable Bleed Valves schedule (VBVs). The CFM56-3 Variable Bleed Valves are located between the Booster and the HPC. Its main function is to regulate the primary flow which enters in the HPC, in order to optimize the compressor efficiency and the fuel flow employed during the combustion process at low spool speed. Bleed schedule affect the mass flow continuity, therefore bleed has an influence on the position of the operating lines in the component maps. In order to model the VBVs behaviour in GasTurb a tool called Bleed Schedule should be used. The procedure consists of introducing in the software the spool speed at which the valves open, the spool speed at which they close and the maximum handling bleed in percentage. The values for this particular case, obtained from engine manual [CFM, 2013], are shown in Figure 8 from GasTurb windows. The maximum handling bleed cannot be measured or calculated from test bed data. However, all values between 20% and 30% are suitable for the engine type.
Fig. 8: GasTurb modelling process for engine bleed schedule
During the Off-Design simulation, the geometric parameters of the engine must be kept. This means that the design point defined in the On-Design simulation cannot be changed. The objective is to develop a thermodynamic model for the CFM56-3 engine to simulate the component degradation and the consequent effects of the maintenance procedures. For a first shot GasTurb use Standard Maps for the Off-Design simulation, that are selected from similar
turbomachines and with similar design. Actually, the standard maps from GasTurb are all from axial flow machines, therefore they are a suitable starting point. When switching the Off-Design in GasTurb, the component maps are scaled
in such a way that they fit to the cycle design point defined in the On-Design simulation. However, part load SFC depends primarily on compressor efficiency. This means that the rest of the operating points from the CFM56-3 Correlation Test Report do not match with the GasTurb model due to the use of generic component maps. All the 44 operating points from the Correlation Test Report are going to be used to adapt the generic GasTurb model for the Off-Design effects, which means to adapt the standard component maps from the programme. Test bed data could be introduced in GasTurb using the file format .tst. With this kind of documents it is possible to compare the experimental data with the GasTurb model. This is done by reading the comparative figures from the file before calculating an operating line, and then plotting them together with the model results from a single operating line. Therefore, the data from the Correlation Test Report have to be defined in .tst format so that it can be used in the programme.
For comparison of the model with test bed data it is recommendable to use global parameters like pressure ratio, total mass flow or thrust. As the final check of the model, the comparison between SFC and thrust is selected with the measured values in the operating line. It is selected the SFC because, for a given flight condition, it is equivalent to the thermal efficiency of the engine. The correlation engine data (purple points) are represented with the generic GasTurb
model (yellow points) before adapting anything, in Figure 9. It is observed that with the standard setting of the cycle reference point in the maps, the agreement between measured and simulated SFC at part load is poor. Also it is observed that the data from the simulation is coincident with the given data in the cycle design point (red mark).
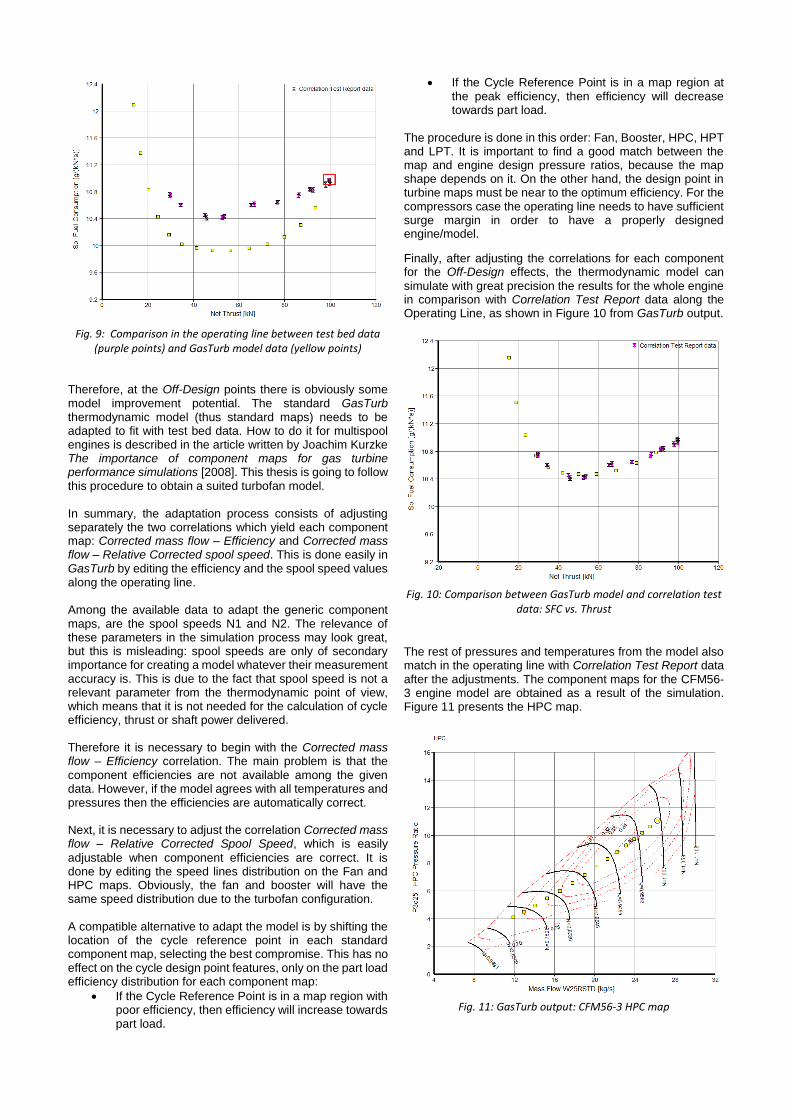
Fig. 9: Comparison in the operating line between test bed data (purple points) and GasTurb model data (yellow points)
Therefore, at the Off-Design points there is obviously some model improvement potential. The standard GasTurb thermodynamic model (thus standard maps) needs to be adapted to fit with test bed data. How to do it for multispool engines is described in the article written by Joachim Kurzke The importance of component maps for gas turbine performance simulations [2008]. This thesis is going to follow this procedure to obtain a suited turbofan model. In summary, the adaptation process consists of adjusting separately the two correlations which yield each component map: Corrected mass flow – Efficiency and Corrected mass flow – Relative Corrected spool speed. This is done easily in GasTurb by editing the efficiency and the spool speed values along the operating line. Among the available data to adapt the generic component maps, are the spool speeds N1 and N2. The relevance of these parameters in the simulation process may look great, but this is misleading: spool speeds are only of secondary importance for creating a model whatever their measurement accuracy is. This is due to the fact that spool speed is not a relevant parameter from the thermodynamic point of view, which means that it is not needed for the calculation of cycle efficiency, thrust or shaft power delivered. Therefore it is necessary to begin with the Corrected mass flow – Efficiency correlation. The main problem is that the component efficiencies are not available among the given data. However, if the model agrees with all temperatures and pressures then the efficiencies are automatically correct. Next, it is necessary to adjust the correlation Corrected mass flow – Relative Corrected Spool Speed, which is easily
adjustable when component efficiencies are correct. It is done by editing the speed lines distribution on the Fan and HPC maps. Obviously, the fan and booster will have the same speed distribution due to the turbofan configuration. A compatible alternative to adapt the model is by shifting the location of the cycle reference point in each standard component map, selecting the best compromise. This has no effect on the cycle design point features, only on the part load efficiency distribution for each component map:
If the Cycle Reference Point is in a map region with poor efficiency, then efficiency will increase towards part load.
If the Cycle Reference Point is in a map region at the peak efficiency, then efficiency will decrease towards part load.
The procedure is done in this order: Fan, Booster, HPC, HPT and LPT. It is important to find a good match between the map and engine design pressure ratios, because the map shape depends on it. On the other hand, the design point in turbine maps must be near to the optimum efficiency. For the compressors case the operating line needs to have sufficient surge margin in order to have a properly designed engine/model.
Finally, after adjusting the correlations for each component for the Off-Design effects, the thermodynamic model can
simulate with great precision the results for the whole engine in comparison with Correlation Test Report data along the Operating Line, as shown in Figure 10 from GasTurb output.
Fig. 10: Comparison between GasTurb model and correlation test data: SFC vs. Thrust
The rest of pressures and temperatures from the model also match in the operating line with Correlation Test Report data after the adjustments. The component maps for the CFM56-3 engine model are obtained as a result of the simulation. Figure 11 presents the HPC map.
Fig. 11: GasTurb output: CFM56-3 HPC map
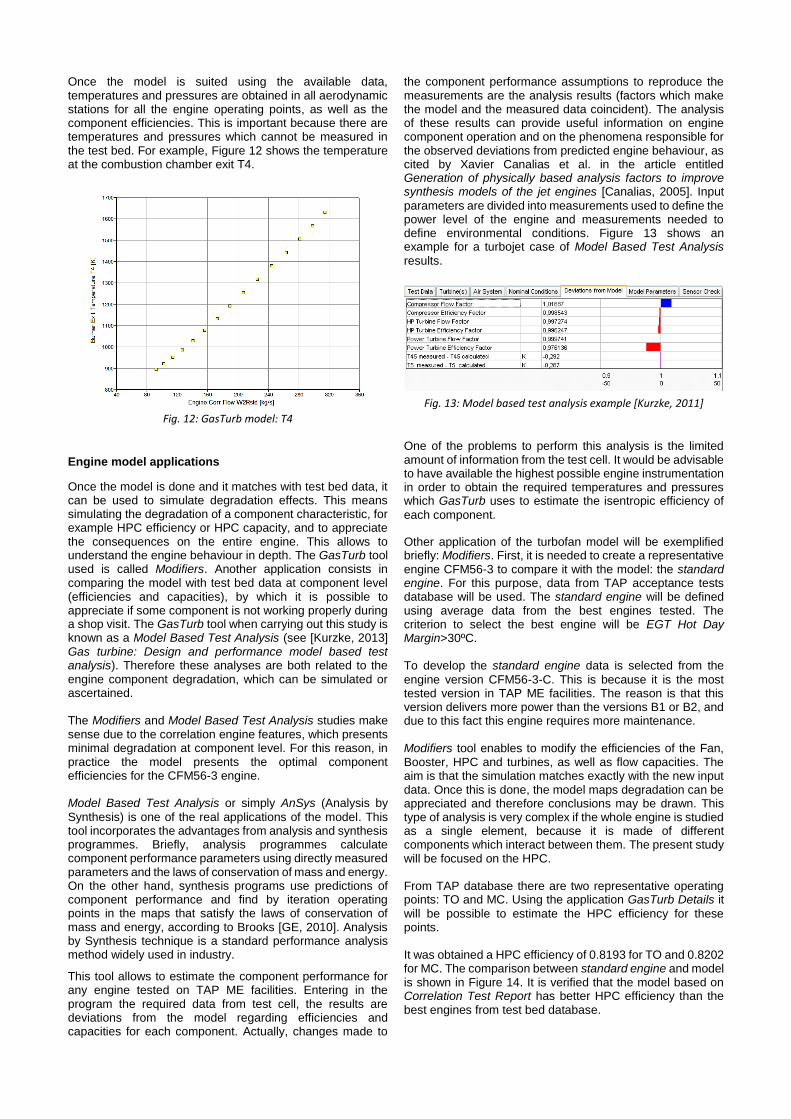
Once the model is suited using the available data, temperatures and pressures are obtained in all aerodynamic stations for all the engine operating points, as well as the component efficiencies. This is important because there are temperatures and pressures which cannot be measured in the test bed. For example, Figure 12 shows the temperature at the combustion chamber exit T4.
Fig. 12: GasTurb model: T4
Engine model applications
Once the model is done and it matches with test bed data, it can be used to simulate degradation effects. This means simulating the degradation of a component characteristic, for example HPC efficiency or HPC capacity, and to appreciate the consequences on the entire engine. This allows to understand the engine behaviour in depth. The GasTurb tool used is called Modifiers. Another application consists in comparing the model with test bed data at component level (efficiencies and capacities), by which it is possible to appreciate if some component is not working properly during a shop visit. The GasTurb tool when carrying out this study is known as a Model Based Test Analysis (see [Kurzke, 2013] Gas turbine: Design and performance model based test analysis). Therefore these analyses are both related to the engine component degradation, which can be simulated or ascertained. The Modifiers and Model Based Test Analysis studies make sense due to the correlation engine features, which presents minimal degradation at component level. For this reason, in practice the model presents the optimal component efficiencies for the CFM56-3 engine. Model Based Test Analysis or simply AnSys (Analysis by
Synthesis) is one of the real applications of the model. This tool incorporates the advantages from analysis and synthesis programmes. Briefly, analysis programmes calculate component performance parameters using directly measured parameters and the laws of conservation of mass and energy. On the other hand, synthesis programs use predictions of component performance and find by iteration operating points in the maps that satisfy the laws of conservation of mass and energy, according to Brooks [GE, 2010]. Analysis by Synthesis technique is a standard performance analysis method widely used in industry.
This tool allows to estimate the component performance for any engine tested on TAP ME facilities. Entering in the program the required data from test cell, the results are deviations from the model regarding efficiencies and capacities for each component. Actually, changes made to
the component performance assumptions to reproduce the measurements are the analysis results (factors which make the model and the measured data coincident). The analysis of these results can provide useful information on engine component operation and on the phenomena responsible for the observed deviations from predicted engine behaviour, as cited by Xavier Canalias et al. in the article entitled Generation of physically based analysis factors to improve synthesis models of the jet engines [Canalias, 2005]. Input
parameters are divided into measurements used to define the power level of the engine and measurements needed to define environmental conditions. Figure 13 shows an example for a turbojet case of Model Based Test Analysis
results.
Fig. 13: Model based test analysis example [Kurzke, 2011]
One of the problems to perform this analysis is the limited amount of information from the test cell. It would be advisable to have available the highest possible engine instrumentation in order to obtain the required temperatures and pressures which GasTurb uses to estimate the isentropic efficiency of
each component.
Other application of the turbofan model will be exemplified briefly: Modifiers. First, it is needed to create a representative engine CFM56-3 to compare it with the model: the standard engine. For this purpose, data from TAP acceptance tests database will be used. The standard engine will be defined using average data from the best engines tested. The criterion to select the best engine will be EGT Hot Day Margin>30ºC. To develop the standard engine data is selected from the
engine version CFM56-3-C. This is because it is the most tested version in TAP ME facilities. The reason is that this version delivers more power than the versions B1 or B2, and due to this fact this engine requires more maintenance. Modifiers tool enables to modify the efficiencies of the Fan, Booster, HPC and turbines, as well as flow capacities. The aim is that the simulation matches exactly with the new input data. Once this is done, the model maps degradation can be appreciated and therefore conclusions may be drawn. This type of analysis is very complex if the whole engine is studied as a single element, because it is made of different components which interact between them. The present study will be focused on the HPC. From TAP database there are two representative operating points: TO and MC. Using the application GasTurb Details it
will be possible to estimate the HPC efficiency for these points. It was obtained a HPC efficiency of 0.8193 for TO and 0.8202 for MC. The comparison between standard engine and model is shown in Figure 14. It is verified that the model based on Correlation Test Report has better HPC efficiency than the best engines from test bed database.
The model will be degraded to appreciate what happens. Due to the fact that a single element is analysed, HPC, the HPC Efficiency or the HPC capacity among Modifiers options could be modified, Figure 15. Degradation in the HPC capacity means that, for the same spool speed, the pressure ratio and the mass flow through the compressor decrease, which is mainly due to the Tip Clearance.
Fig. 14: Comparison of HPC isentropic efficiency between model and test bed data
Fig. 15: GasTurb ‘Modifiers’ option to degrade the engine model
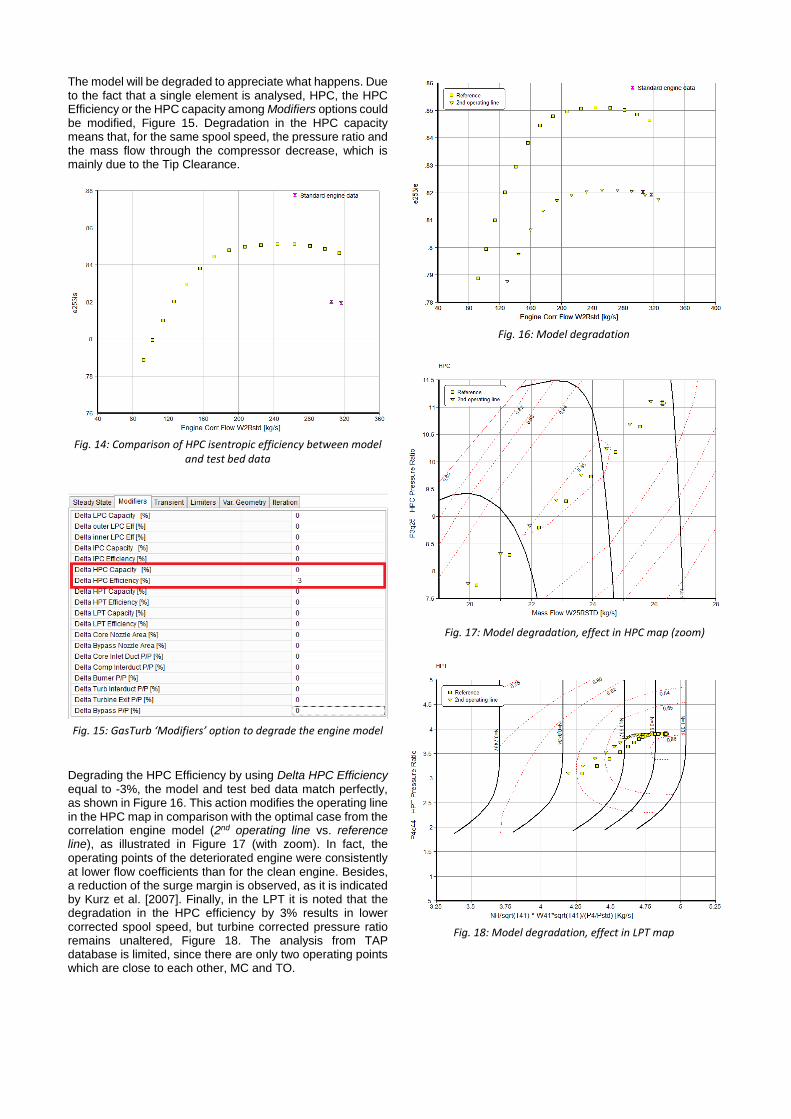
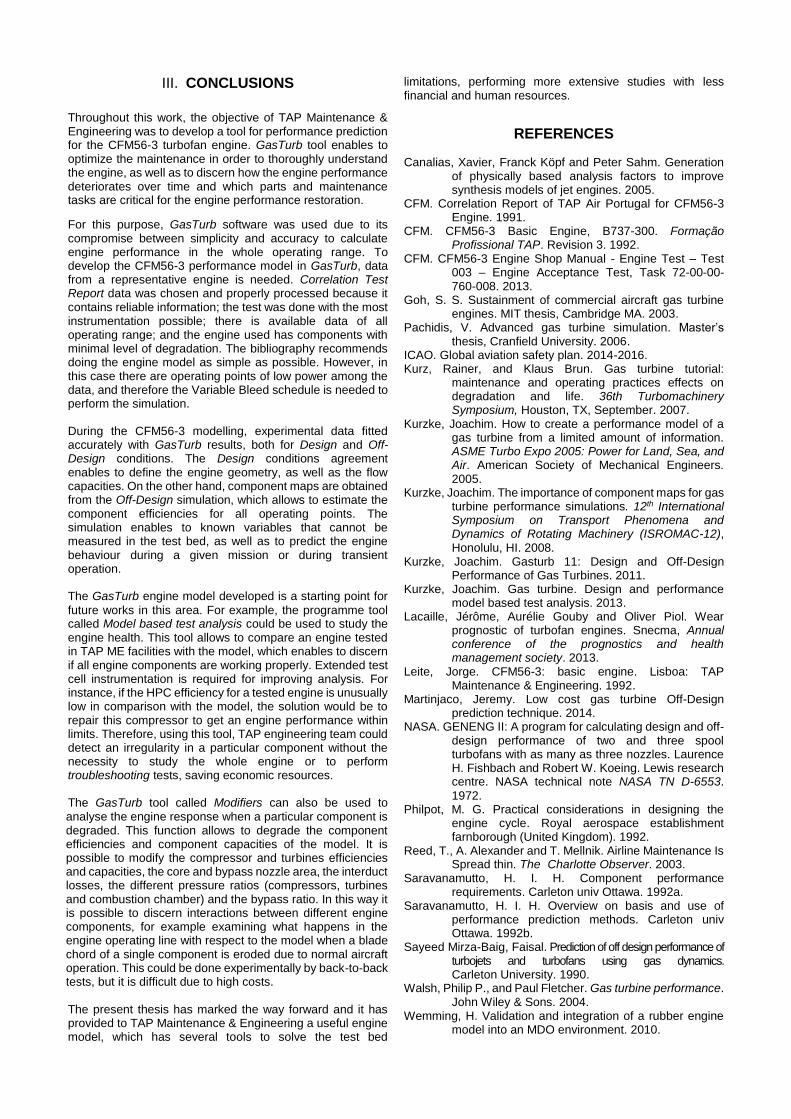
Degrading the HPC Efficiency by using Delta HPC Efficiency equal to -3%, the model and test bed data match perfectly, as shown in Figure 16. This action modifies the operating line in the HPC map in comparison with the optimal case from the correlation engine model (2nd operating line vs. reference line), as illustrated in Figure 17 (with zoom). In fact, the operating points of the deteriorated engine were consistently at lower flow coefficients than for the clean engine. Besides, a reduction of the surge margin is observed, as it is indicated by Kurz et al. [2007]. Finally, in the LPT it is noted that the degradation in the HPC efficiency by 3% results in lower corrected spool speed, but turbine corrected pressure ratio remains unaltered, Figure 18. The analysis from TAP database is limited, since there are only two operating points which are close to each other, MC and TO.
Fig. 16: Model degradation
Fig. 17: Model degradation, effect in HPC map (zoom)
Fig. 18: Model degradation, effect in LPT map
III. CONCLUSIONS
Throughout this work, the objective of TAP Maintenance & Engineering was to develop a tool for performance prediction for the CFM56-3 turbofan engine. GasTurb tool enables to optimize the maintenance in order to thoroughly understand the engine, as well as to discern how the engine performance deteriorates over time and which parts and maintenance tasks are critical for the engine performance restoration.
For this purpose, GasTurb software was used due to its compromise between simplicity and accuracy to calculate engine performance in the whole operating range. To develop the CFM56-3 performance model in GasTurb, data from a representative engine is needed. Correlation Test Report data was chosen and properly processed because it contains reliable information; the test was done with the most instrumentation possible; there is available data of all operating range; and the engine used has components with minimal level of degradation. The bibliography recommends doing the engine model as simple as possible. However, in this case there are operating points of low power among the data, and therefore the Variable Bleed schedule is needed to perform the simulation. During the CFM56-3 modelling, experimental data fitted accurately with GasTurb results, both for Design and Off-Design conditions. The Design conditions agreement enables to define the engine geometry, as well as the flow capacities. On the other hand, component maps are obtained from the Off-Design simulation, which allows to estimate the component efficiencies for all operating points. The simulation enables to known variables that cannot be measured in the test bed, as well as to predict the engine behaviour during a given mission or during transient operation. The GasTurb engine model developed is a starting point for
future works in this area. For example, the programme tool called Model based test analysis could be used to study the engine health. This tool allows to compare an engine tested in TAP ME facilities with the model, which enables to discern if all engine components are working properly. Extended test cell instrumentation is required for improving analysis. For instance, if the HPC efficiency for a tested engine is unusually low in comparison with the model, the solution would be to repair this compressor to get an engine performance within limits. Therefore, using this tool, TAP engineering team could detect an irregularity in a particular component without the necessity to study the whole engine or to perform troubleshooting tests, saving economic resources. The GasTurb tool called Modifiers can also be used to analyse the engine response when a particular component is degraded. This function allows to degrade the component efficiencies and component capacities of the model. It is possible to modify the compressor and turbines efficiencies and capacities, the core and bypass nozzle area, the interduct losses, the different pressure ratios (compressors, turbines and combustion chamber) and the bypass ratio. In this way it is possible to discern interactions between different engine components, for example examining what happens in the engine operating line with respect to the model when a blade chord of a single component is eroded due to normal aircraft operation. This could be done experimentally by back-to-back tests, but it is difficult due to high costs. The present thesis has marked the way forward and it has provided to TAP Maintenance & Engineering a useful engine model, which has several tools to solve the test bed
limitations, performing more extensive studies with less financial and human resources.
REFERENCES
Canalias, Xavier, Franck Köpf and Peter Sahm. Generation of physically based analysis factors to improve synthesis models of jet engines. 2005. CFM. Correlation Report of TAP Air Portugal for CFM56-3 Engine. 1991. CFM. CFM56-3 Basic Engine, B737-300. Formação Profissional TAP. Revision 3. 1992. CFM. CFM56-3 Engine Shop Manual - Engine Test – Test 003 – Engine Acceptance Test, Task 72-00-00- 760-008. 2013. Goh, S. S. Sustainment of commercial aircraft gas turbine engines. MIT thesis, Cambridge MA. 2003. Pachidis, V. Advanced gas turbine simulation. Master’s thesis, Cranfield University. 2006. ICAO. Global aviation safety plan. 2014-2016. Kurz, Rainer, and Klaus Brun. Gas turbine tutorial: maintenance and operating practices effects on degradation and life. 36th Turbomachinery Symposium, Houston, TX, September. 2007. Kurzke, Joachim. How to create a performance model of a gas turbine from a limited amount of information. ASME Turbo Expo 2005: Power for Land, Sea, and Air. American Society of Mechanical Engineers. 2005. Kurzke, Joachim. The importance of component maps for gas turbine performance simulations. 12th International Symposium on Transport Phenomena and Dynamics of Rotating Machinery (ISROMAC-12), Honolulu, HI. 2008. Kurzke, Joachim. Gasturb 11: Design and Off-Design Performance of Gas Turbines. 2011. Kurzke, Joachim. Gas turbine. Design and performance model based test analysis. 2013. Lacaille, Jérôme, Aurélie Gouby and Oliver Piol. Wear prognostic of turbofan engines. Snecma, Annual conference of the prognostics and health management society. 2013. Leite, Jorge. CFM56-3: basic engine. Lisboa: TAP Maintenance & Engineering. 1992. Martinjaco, Jeremy. Low cost gas turbine Off-Design prediction technique. 2014. NASA. GENENG II: A program for calculating design and off- design performance of two and three spool turbofans with as many as three nozzles. Laurence H. Fishbach and Robert W. Koeing. Lewis research centre. NASA technical note NASA TN D-6553.
1972. Philpot, M. G. Practical considerations in designing the engine cycle. Royal aerospace establishment farnborough (United Kingdom). 1992. Reed, T., A. Alexander and T. Mellnik. Airline Maintenance Is Spread thin. The Charlotte Observer. 2003. Saravanamutto, H. I. H. Component performance requirements. Carleton univ Ottawa. 1992a. Saravanamutto, H. I. H. Overview on basis and use of performance prediction methods. Carleton univ Ottawa. 1992b. Sayeed Mirza-Baig, Faisal. Prediction of off design performance of turbojets and turbofans using gas dynamics. Carleton University. 1990. Walsh, Philip P., and Paul Fletcher. Gas turbine performance. John Wiley & Sons. 2004. Wemming, H. Validation and integration of a rubber engine model into an MDO environment. 2010.