Embed Size (px)
Citation preview

Correlation
1. Correlation - degree to which variables are associated or covary. (Changes in the value of one tends to be associated with changes in the other.)
2. No cause and effect like true experiment .
3. One variable (X) is associated with changes in another variable (Y).

Correlation
Correlation coefficient details
1. strength 2. direction 3. relationship between
the two variables.

Correlation

Magnitude of r indicates the strength positive or negative.
R is a linear relationship.Curvilinear Shapes.

.00 to .25 (+- ) little or no
relationship .25 to .50 fair degree of
relationship .50 to .75 moderate to fair
relationship .75 to 1.00 excellent relationship

1. Correlation matrix intercorrelations
2. Significance of correlation coefficients
3. Null hypothesis4. Significance

Correlations matrix intercorrelations

1. Significance of correlation coefficients 2. Null hypothesis
3. There is a significant level but be careful greater sample size gives a greater chance of achieving significance.


Regression
When a researcher wants to establish the relationship as a basis for prediction regression analysis is used.
Regression
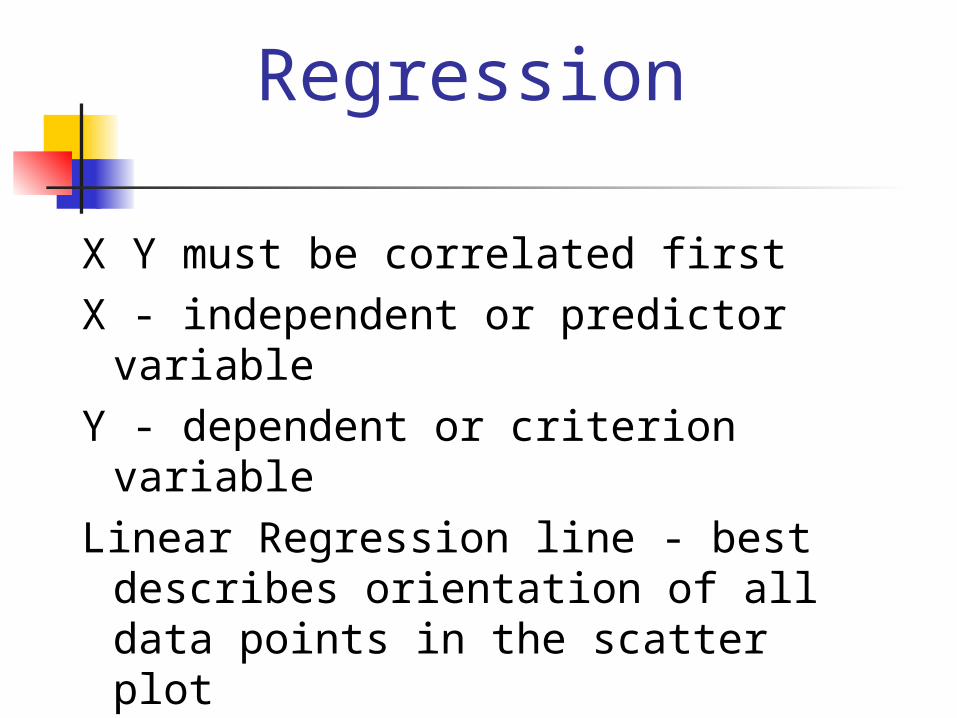
X Y must be correlated firstX - independent or predictor
variable Y - dependent or criterion
variableLinear Regression line - best
describes orientation of all data points in the scatter plot

Regression
Y = a + bXY - intercept when X = 0, a = regression constant b = slope of line

Regression

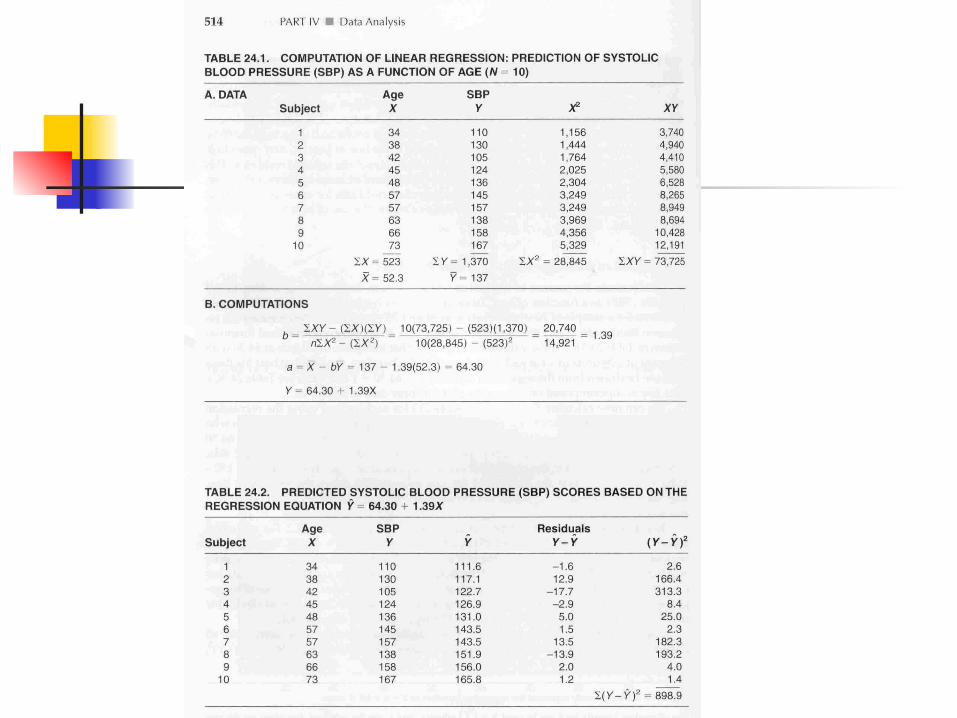

Coefficient of the Determination r2
The square of the correlation coefficient is the indicative of the total variance in Y score that can be predicted from X score.
r = .87 r2 = .76 that means 76%of the variance in SBP can be accounted
for by knowing the variance in age.

Coefficient of the Determination r2
r2 = coefficient of determination explained variance
1 - r2 = coefficient of non determinant unexplained variance
Standard errors of the estimate